Attached files
| file | filename |
|---|---|
| 8-K - FORM 8-K - SEACOAST BANKING CORP OF FLORIDA | v474682_8k.htm |
Exhibit 99.1
Contact: (email) Chuck.Shaffer@SeacoastBank.com (phone) 772.221.7003 (web) www.SeacoastBanking.com Investor Presentation Q2 - 2017

This presentation contains “forward - looking statements” within the meaning of Section 27 A of the Securities Act of 1933 and Section 21 E of the Securities Exchange Act of 1934 , including, without limitation, statements about future financial and operating results, ability to realized deferred tax assets, cost savings, enhanced revenues, economic and seasonal conditions in our markets, and improvements to reported earnings that may be realized from cost controls and for integration of banks that we have acquired, as well as statements with respect to Seacoast’s objectives, expectations and intentions and other statements that are not historical facts . Actual results may differ from those set forth in the forward - looking statements . Forward - looking statements include statements with respect to our beliefs, plans, objectives, goals, expectations, anticipations, estimates and intentions, and involve known and unknown risks, uncertainties and other factors, which may be beyond our control, and which may cause the actual results, performance or achievements of Seacoast to be materially different from future results, performance or achievements expressed or implied by such forward - looking statements . You should not expect us to update any forward - looking statements . You can identify these forward - looking statements through our use of words such as “may,” “will,” “anticipate,” “assume,” “should,” “support”, “indicate,” “would,” “believe,” “contemplate,” “expect,” “estimate,” “continue,” “further”, “point to,” “project,” “could,” “intend” or other similar words and expressions of the future . These forward - looking statements may not be realized due to a variety of factors, including, without limitation : the effects of future economic and market conditions, including seasonality ; governmental monetary and fiscal policies, as well as legislative, tax and regulatory changes ; changes in accounting policies, rules and practices ; the risks of changes in interest rates on the level and composition of deposits, loan demand, liquidity and the values of loan collateral, securities, and interest sensitive assets and liabilities ; interest rate risks, sensitivities and the shape of the yield curve ; the effects of competition from other commercial banks, thrifts, mortgage banking firms, consumer finance companies, credit unions, securities brokerage firms, insurance companies, money market and other mutual funds and other financial institutions operating in our market areas and elsewhere, including institutions operating regionally, nationally and internationally, together with such competitors offering banking products and services by mail, telephone, computer and the Internet ; and the failure of assumptions underlying the establishment of reserves for possible loan losses . The risks of mergers and acquisitions, include, without limitation : unexpected transaction costs, including the costs of integrating operations ; the risks that the businesses will not be integrated successfully or that such integration may be more difficult, time - consuming or costly than expected ; the potential failure to fully or timely realize expected revenues and revenue synergies, including as the result of revenues following the merger being lower than expected ; the risk of deposit and customer attrition ; any changes in deposit mix ; unexpected operating and other costs, which may differ or change from expectations ; the risks of customer and employee loss and business disruption, including, without limitation, as the result of difficulties in maintaining relationships with employees ; increased competitive pressures and solicitations of customers by competitors ; as well as the difficulties and risks inherent with entering new markets . All written or oral forward - looking statements attributable to us are expressly qualified in their entirety by this cautionary notice, including, without limitation, those risks and uncertainties described in our annual report on Form 10 - K for the year ended December 31 , 2016 under “Special Cautionary Notice Regarding Forward - Looking Statements” and “Risk Factors”, and otherwise in our SEC reports and filings . Such reports are available upon request from the Company, or from the Securities and Exchange Commission, including through the SEC’s Internet website at http : //www . sec . gov . Cautionary Notice Regarding Forward - Looking Statements 2

Agenda 3 ABOUT SEACOAST BANK 1 COMPANY PERFORMANCE 2 SEACOAST’S DIFFERENTIATED STRATEGY 3 OUTLOOK 4
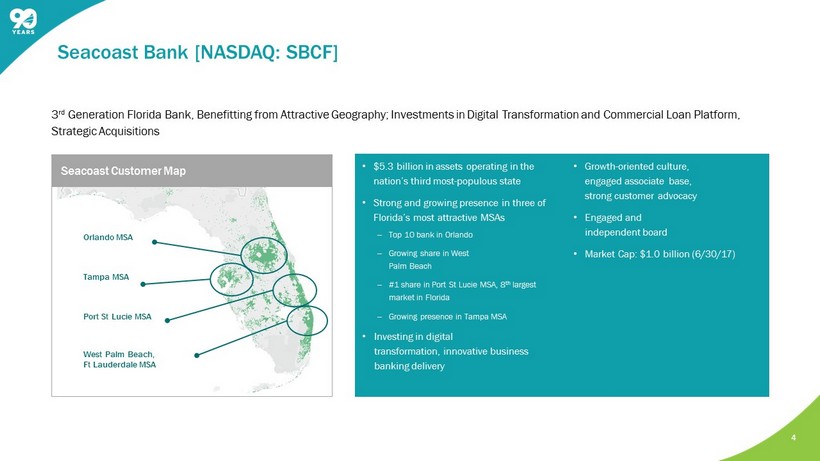
• $5.3 billion in assets operating in the nation’s third most - populous state • Strong and growing presence in three of Florida’s most attractive MSAs ‒ Top 10 bank in Orlando ‒ Growing share in West Palm Beach ‒ #1 share in Port St Lucie MSA, 8 th largest market in Florida ‒ Growing presence in Tampa MSA • Investing in digital transformation, innovative business banking delivery • Growth - oriented culture, engaged associate base, strong customer advocacy • Engaged and independent board • Market Cap: $1.0 billion ( 6 /30/17) 3 rd Generation Florida Bank, Benefitting from Attractive Geography; Investments in Digital Transformation and Commercial Loan Pla tf orm, Strategic Acquisitions Seacoast Bank [NASDAQ: SBCF] Orlando MSA West Palm Beach, Ft Lauderdale MSA Port St Lucie MSA Tampa MSA Seacoast Customer Map 4
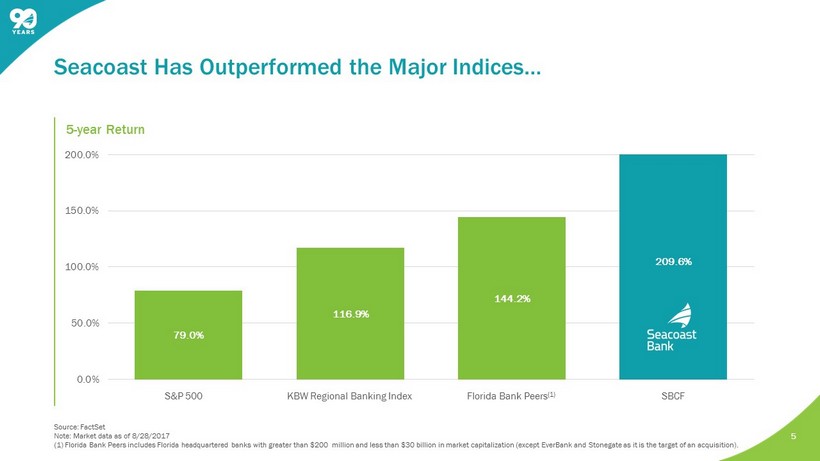
Florida Bank Peers (1) 5 Seacoast Has Outperformed the Major Indices… S&P 500 SBC F KBW Regional Banking Index Source: FactSet Note: Market data as of 8/28/2017 (1) Florida Bank Peers includes Florida headquartered banks with greater than $200 m illion and less than $30 billion in market capitalization (except EverBank and Stonegate as it is the target of an acquisition). 5 - year Return 79.0% 116.9% 144.2% 209.6% 0.0% 50.0% 100.0% 150.0% 200.0%
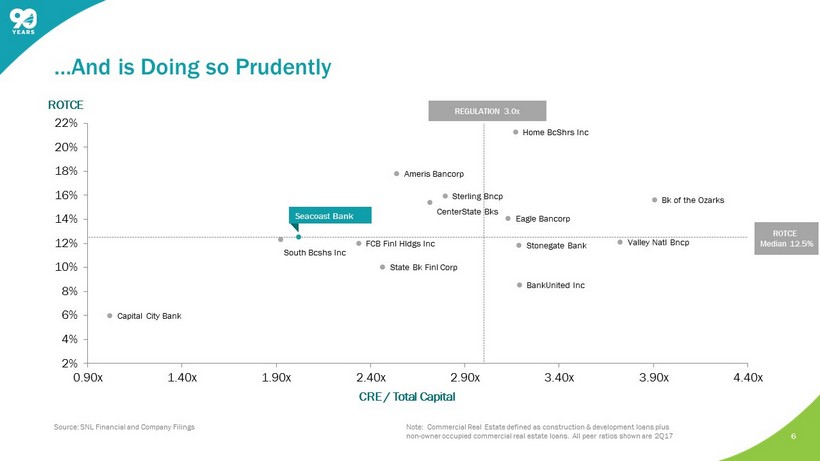
6 …And is Doing so Prudently Source: SNL Financial and Company Filings Note: Commercial Real Estate defined as construction & development loans plus non - owner occupied commercial real estate loans. All peer ratios shown are 2Q17 Seacoast Bank REGULATION 3.0x ROTCE Median 12.5% FCB Finl Hldgs Inc CenterState Bks Stonegate Bank State Bk Finl Corp BankUnited Inc Capital City Bank Home BcShrs Inc South Bcshs Inc Sterling Bncp Ameris Bancorp Eagle Bancorp Valley Natl Bncp Bk of the Ozarks 2% 4% 6% 8% 10% 12% 14% 16% 18% 20% 22% 0.90x 1.40x 1.90x 2.40x 2.90x 3.40x 3.90x 4.40x CRE / Total Capital ROTCE

Agenda 7 ABOUT SEACOAST BANK 1 COMPANY PERFORMANCE 2 SEACOAST’S DIFFERENTIATED STRATEGY 3 OUTLOOK 4
2Q’17 Highlights 1 Our second quarter results highlight our continued success in balancing organic growth with select acquisitions that accelerate our position in key markets. Our performance also underlines our commitment to delivering on our Vision 2020 objectives • Net revenue increased 25% year - over - year to $54.6 million, net income up 44% to $7.7 million during the same period, adjusted net income 1 up 38% to $12.7 million. • On a GAAP basis, we ended the quarter at 0.66% ROTA, 7.25% ROTCE, and 73.90% efficiency ratio. On an adjusted basis, second quarter results were 1.02% adjusted ROTA 1 , 11.22% adjusted ROTCE 1 , and 61.20% adjusted efficiency ratio 1 . • Strengthened our position in the attractive Tampa MSA through the completed acquisition of GulfShore Bank and announced agreement to purchase NorthStar Banking Corporation. • Announced an agreement to acquire Palm Beach Community Bank, broadening our presence in South Florida, the state’s largest MSA. • Reached another significant milestone, surpassing 100,000 households during the quarter. • Consumer and small business loans originated in digital channels or by our customer support center, i.e. out of branch, grew 25% over first quarter 2017 and by 9% year - over - year. • Mobile penetration increased to 32% of eligible primary consumer checking customers from 28% in June of last year. 1 Non - GAAP measure, see “Appendix A” Effective in the first quarter of 2017, adjusted net income and adjusted noninterest expense exclude the effect of amortizati on of acquisition - related intangibles. Prior periods have been revised to conform with the current period presentation. 8

Notable Items Affecting Q2 Results As we continue to scale and invest in achieving our Vision 2020 objectives, certain items, many of which were introduced last quarter, aggregated to $8.2 million in noninterest expense in the second quarter. • GulfShore and other merger and acquisition - related charges totaled $5.1 million 1 , including $3.0 million of compensation - related expense. • Expenses associated with the four previously announced branch closures, and one additional closure in the second quarter, totaled $1.9 million 1 . • During the first quarter 2017, the Company onboarded a commercial lending team focused on specialized equipment lending for lower middle market companies. The second quarter noninterest expense reflects the full $571,000 impact of this addition. • Recorded incentive expenses totaling $247,000 for one - time signing bonuses associated with investments in technology and audit talent as we staff our organization for growth. • Recognized $200,000 related to opening a second customer support center in Orlando, expanding our ability to support growth and our customers’ ever - increasing utilization of our 24/7 service model. • Net loss on other real estate owned and repossessed assets increased $ 507,000 compared to the prior quarter, with a $ 346,000 net gain in the first quarter, and losses of $161,000 in the quarter. 1 Excluded from the calculation of Adjusted Noninterest Expense, a Non - GAAP measure. See “Explanation of Certain Unaudited Non - GA AP Financial Measures.” 9

10 $34,801 $37,735 $37,628 $38,377 $44,320 3.63% 3.69% 3.56% 3.63% 3.84% $10,000 $15,000 $20,000 $25,000 $30,000 $35,000 $40,000 $45,000 Q2-16 Q3-16 Q4-16 Q1-17 Q2-17 Net Interest Income and Net Interest Margin* ($ in thousands) • Net interest income * totaled $44.3 million, up $5.9 million or 15% from the prior quarter and $ 9.5 million or 27% from the prior year quarter. • Net interest margin increased to 3.84% compared to 3.63% for both prior quarter and prior year quarter. The current quarter benefited from accretion on early payoffs of securities and acquired loans totaling 13bps. *Calculated on a fully taxable equivalent basis using amortized cost. Net Interest Income and Margin
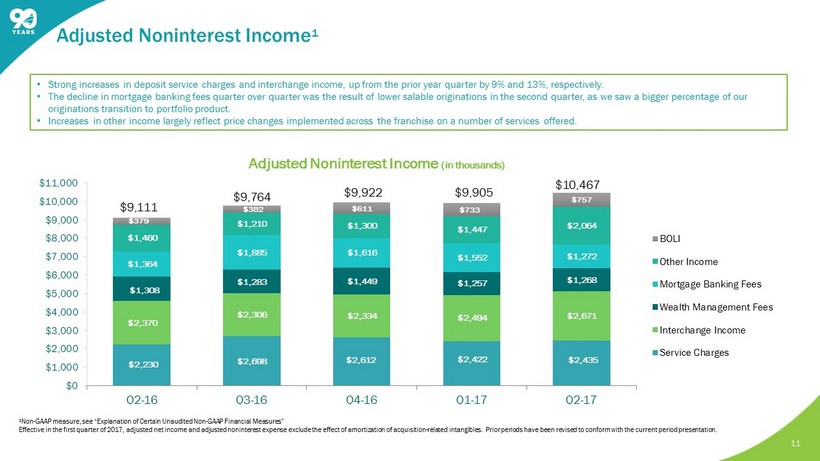
11 $2,230 $2,698 $2,612 $2,422 $2,435 $2,370 $2,306 $2,334 $2,494 $2,671 $1,308 $1,283 $1,449 $1,257 $1,268 $1,364 $1,885 $1,616 $1,552 $1,272 $1,460 $1,210 $1,300 $1,447 $2,064 $ 382 $611 $733 $757 $0 $1,000 $2,000 $3,000 $4,000 $5,000 $6,000 $7,000 $8,000 $9,000 $10,000 $11,000 Q2-16 Q3-16 Q4-16 Q1-17 Q2-17 BOLI Other Income Mortgage Banking Fees Wealth Management Fees Interchange Income Service Charges Adjusted Noninterest Income (in thousands) $9,111 • Strong increases in deposit service charges and interchange income, up from the prior year quarter by 9% and 13%, respectively . • The decline in mortgage banking fees quarter over quarter was the result of lower salable originations in the second quarter, as we saw a bigger percentage of our originations transition to portfolio product. • Increases in other income largely reflect price changes implemented across the franchise on a number of services offered. $9,764 $9,922 $9,905 $10,467 $ 379 Adjusted Noninterest Income 1 1 Non - GAAP measure, see “Explanation of Certain Unaudited Non - GAAP Financial Measures” Effective in the first quarter of 2017, adjusted net income and adjusted noninterest expense exclude the effect of amortizati on of acquisition - related intangibles. Prior periods have been revised to conform with the current period presentation.

12 $15,245 $15,828 $14,799 $16,389 $18,225 $2,698 $3,223 $3,030 $3,267 $3,108 $4,184 $4,418 $4,463 $4,625 $4,750 $6,278 $6,645 $6,562 $6,641 $7,746 $0 $5,000 $10,000 $15,000 $20,000 $25,000 $30,000 $35,000 $40,000 Q2-16 Q3-16 Q4-16 Q1-17 Q2-17 Other Occupancy / Telephone Data Processing Cost Salaries and Benefits Adjusted Noninterest Expense (in thousands) $33,829 $28,405 $30,114 $28,854 $30,922 • As a percentage of average tangible assets , adjusted noninterest expense in the second quarter of 2017 was 2.73% compared to 2.71% for the prior quarter and 2.76% for the second quarter of 2016. • The increase quarter over quarter is related to the addition of ongoing headcount and expenses associated with our new Tampa mar ket operations totaling $1.1 million, a $507 thousand impact of recording a net gain of $346 thousand on other real estate owned and repossessed assets in th e prior quarter, and subsequently a loss of $161 thousand in the second quarter, the full impact of a commercial lending team acquired in the first quarter tot ali ng $571 thousand during the second quarter, and other investments made in talent and professional services to scale the organization. 1 Non - GAAP measure, see “Explanation of Certain Unaudited Non - GAAP Financial Measures” Effective in the first quarter of 2017, adjusted net income and adjusted noninterest expense exclude the effect of amortizati on of acquisition - related intangibles. Prior periods have been revised to conform with the current period presentation. Adjusted Noninterest Expense 1

13 89.40% 82.80% 104.50% 68.30% 68.60% 76.30% 72.6% 81.7% 78.0% 68.6% 62.4% 71.1% 73.9% 40% 50% 60% 70% 80% 90% 100% 110% GAAP - Efficiency 82.0% 79.6% 74.8% 67.5% 67.5% 68.2% 69.1% 69.6% 64.8% 63.1% 60.8% 64.7% 61.2% 40% 50% 60% 70% 80% 90% 100% 110% Adjusted - Efficiency 1 1 Non - GAAP measure, see “Explanation of Certain Unaudited Non - GAAP Financial Measures” Effective in the first quarter of 2017, adjusted net income and adjusted noninterest expense exclude the effect of amortizati on of acquisition - related intangibles. Prior periods have been revised to conform with the current period presentation. Looking forward, we expect the adjusted efficiency ratio to continue to improve, and we may exit the year in the high 50s Efficiency Ratio

14 Total Loans Outstanding (in millions) • Loans grew $714 million or 27% from year - ago levels. Adjusting for acquisitions, loans grew $463 million or 18%. Quarter over quarter, loans grew organically 4%, or $105 million. • Pipelines remain strong, with the commercial pipeline at $146 million, residential at $72 million, and consumer/small business at $50 million. $2,616 $2,769 $2,879 $2,974 $3,330 4.64% 4.67% 4.49% 4.43% 4.69% 4.26% 4.39% 4.16% 4.10% 4.33% $0 $500 $1,000 $1,500 $2,000 $2,500 $3,000 $3,500 Q2-16 Q3-16 Q4-16 Q1-17 Q2-17 Loans Reported Yield Yield Excluding Purchased Non-Impaired and Purchased Credit Impaired Loan Growth Momentum Continues, Supported by a Strong Florida Economy and Prudent Guardrails (Yields presented above do not reflect FTE adjustments)

15 • Total deposits increased 14% from the second quarter of 2016; Transaction accounts represent 56% of total deposits, and have increased 17% year over year. • Cost of deposits remains very attractive at 0.17 %. $1,923 $1,945 $2,022 $2,096 $2,243 $1,192 $1,200 $1,149 $1,185 $1,238 $386 $365 $352 $398 $494 $0 $500 $1,000 $1,500 $2,000 $2,500 $3,000 $3,500 $4,000 $4,500 Q2-16 Q3-16 Q4-16 Q1-17 Q2-17 Transaction Accounts Savings and Money Market Time Deposits Deposit Balances (in millions) $3,975 $3,501 $3,510 $ 3,523 56% $ 3,679 The Deposit Franchise Continues to Perform Well and Serves as a Source of Earnings Strength

16 Net Charge - offs Nonperforming Loans ALLL $20,725 $22,684 $23,400 $24,562 $26,000 0.99% 0.98% 0.96% 0.95% 0.95% 2Q 16 3Q 16 4Q 16 1Q 17 2Q 17 ALLL ALLL Ratio - Non Acquired $662 $550 $1,000 $1,304 $1,401 2Q 16 3Q 16 4Q 16 1Q 17 2Q 17 Provision Loan Loss Provision $(339) $(1,409) $283 $142 $(37) - 0.05% - 0.21% 0.04% 0.02% 0.00% 2Q 16 3Q 16 4Q 16 1Q 17 2Q 17 NCO NCO / Loans $10,919 $10,561 $11,023 $10,557 $10,541 $4,360 $7,876 $7,048 $6,428 $6,632 0.58% 0.66% 0.62% 0.57% 0.52% 0.00% 0.50% 1.00% 1.50% 2.00% $0 $5,000 $10,000 $15,000 $20,000 2Q 16 3Q 16 4Q 16 1Q 17 2Q 17 NPL - nonacquired NPL - acquired Total NPL Ratio Credit Quality ($ in thousands)

Capital Position 17 Tangible Book Value / Book Value Per Share $9.08 $9.35 $9.37 $10.41 $10.55 $11.20 $11.45 $11.45 $12.34 $13.29 2Q 16 3Q 16 4Q 16 1Q 17 2Q 17 Tangible Book Value Per Share Book Value Per Share 10.6% 12.6% 13.1% 10.7% 11.2% 2Q 16 3Q 16 4Q 16 1Q 17 2Q 17 Adjusted Return on Tangible Common Equity 1 13.5% 13.4% 13.3% 14.9% 14.5% 12.8% 12.6% 12.6% 14.2% 13.8% 2Q 16 3Q 16 4Q 16 1Q 17 2Q 17 Total Risk Based Capital Tier 1 Ratio Total Risk Based and Tier 1 Capital Tangible Common Equity / Tangible Assets 8.0% 8.0% 7.7% 9.0% 8.9% 2Q 16 3Q 16 4Q 16 1Q 17 2Q 17 1 Non - GAAP measure, see “Explanation of Certain Unaudited Non - GAAP Financial Measures” Effective in the first quarter of 2017, adjusted net income and adjusted noninterest expense exclude the effect of amortizati on of acquisition - related intangibles. Prior periods have been revised to conform with the current period presentation.

Agenda 18 ABOUT SEACOAST BANK 1 COMPANY PERFORMANCE 2 SEACOAST’S DIFFERENTIATED STRATEGY 3 OUTLOOK 4

19 Experienced Board & Management Team Comprehensive Customer Servicing Model Track Record of Value - Creating Acquisitions Expanding Analytical & Digital Capabilities Well - Positioned to Benefit From Florida Market Focused on Controls Seacoast’s Differentiated Strategy

DISTRIBUTION NETWORK 20 Meeting Customer Needs Profitably Through an Evolving Distribution Network Strategic Execution Framework BRANCH COMMERCIAL BANKING OFFICE MOBILE ONLINE ATMs CALL CENTER CUSTOMER’S OFFICE Talent, Technology and Analytics ACQUIRE CUSTOMERS DEEPEN RELATIONSHIPS BROADEN SERVICES Who We Serve Needs We Meet How We Grow COMMERCIAL SMALL BUSINESS CONSUMERS BORROW GROW PROTECT MANAGE SPEND

$0.0 $0.5 $1.0 $1.5 $2.0 $2.5 $3.0 $3.5 Jan-14 Apr-14 Jul-14 Oct-14 Jan-15 Apr-15 Jul-15 Oct-15 Jan-16 Apr-16 Jul-16 Oct-16 Jan-17 Apr-17 $0.0 $0.5 $1.0 $1.5 $2.0 $2.5 $3.0 $3.5 $4.0 $4.5 Jan-14 Apr-14 Jul-14 Oct-14 Jan-15 Apr-15 Jul-15 Oct-15 Jan-16 Apr-16 Jul-16 Oct-16 Jan-17 Apr-17 $50 $60 $70 $80 $90 $100 $110 Jan-14 Apr-14 Jul-14 Oct-14 Jan-15 Apr-15 Jul-15 Oct-15 Jan-16 Apr-16 Jul-16 Oct-16 Jan-17 Apr-17 21 Investor Presentation Organic Household Growth Up 11.5%, 49.7% Including M&A Billions Organic Deposit Growth Up 22%, 108% Including M&A Organic Loan Growth Up 60%, 146% Including M&A Thousands Balanced Growth Strategy Delivering Results Since January 2014… Billions Total Including Acquisitions Total Excluding Acquisitions Seacoast Is Growing Its Customer Base Both Organically And Via Strategic Acquisitions Jun - 17 Organic HH Growth of 11.5% Since Jan ‘14 Jun - 17 Jun - 17 Organic Deposit Growth of 22% Since Jan ‘14 Organic Loan Growth of 60% Since Jan ‘14

Seacoast’s Focus On Business Banking Is Driving Significant Growth In Business Loans Outstanding • Focused on businesses with revenues $5mm+ in specific industry verticals • Five offices in key metro areas of Florida (three in South Florida, two in Orlando) • Comprehensive relationship approach: business, treasury, lending, wealth 22 Investor Presentation • Focused on businesses with revenues less than $5mm in specific industry verticals • Utilizes the retail network, with Calling Officers assigned to specific regions 225% Loan Growth S ince YE 2013 $632 $1,048 $1,302 $1,816 $2,056 $- $500 $1,000 $1,500 $2,000 $2,500 Dec-13 Dec-14 Dec-15 Dec-16 Jun-17 Commercial/SBS M illions

Unlike Other Community Banks, Seacoast Uses its Vast Data Set to Recognize and Meet Customer Needs Automated Offers Inbound Call Outbound Call In Branch Email ATMs Online Banking Direct Mail Mobile Banking 23 Unique Approach to Serving Our Customers ( Patent Pending ) Behavioral Data FIVE CUSTOMER NEEDS PAY FOR THINGS FINANCE THINGS GROW THEIR MONEY MANAGE THEIR MONEY PROTECT THEIR MONEY Source: Ignite Corp. and Roger Goldman

24 Meeting Customer Needs Vastly Expands Sales Opportunity Deepening Relationships CONSUMER and SMALL BUSINESS LOANS Deepening Relationships DEPOSIT ACCOUNTS Deepening Relationships DEBIT CARDS (Units Sold) 0 500 1,000 1,500 2,000 2,500 3,000 3,500 4,000 2013 2014 2015 2016 2017 Original Sales Rate New Sales Rate 168%

25 Meeting Customer Needs Vastly Expands Sales Opportunity Deepening Relationships CONSUMER and SMALL BUSINESS LOANS Deepening Relationships DEPOSIT ACCOUNTS Deepening Relationships DEBIT CARDS (Units Sold) - 3,000 6,000 9,000 12,000 15,000 18,000 21,000 24,000 2013 2014 2015 2016 2017 Original Sales Rate New Sales Rate 53%
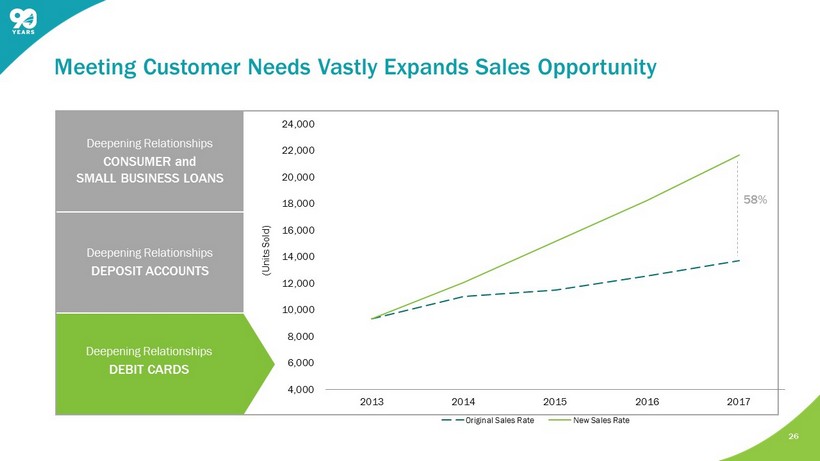
26 Meeting Customer Needs Vastly Expands Sales Opportunity Deepening Relationships CONSUMER and SMALL BUSINESS LOANS Deepening Relationships DEPOSIT ACCOUNTS Deepening Relationships DEBIT CARDS (Units Sold) 4,000 6,000 8,000 10,000 12,000 14,000 16,000 18,000 20,000 22,000 24,000 2013 2014 2015 2016 2017 Original Sales Rate New Sales Rate 58%

Seacoast’s Mobile Adoption Outpaces Both Community Banks and Bigger Banks 27 Investor Presentation 37% 39% 42% 44% 46% 48% 50% 51% 50% 51% 52% 54% 56% 57% 59% 60% 57% 59% 61% 67% 68% 66% 69% 72% 0% 10% 20% 30% 40% 50% 60% 70% 80% Q1 2015 Q2 2015 Q3 2015 Q4 2015 Q1 2016 Q2 2016 Q3 2016 Q4 2016 Median $5B >$15B Seacoast Mobile Adoption Mobile % of Internet U sers – Seacoast vs Peers Based on Asset Tier Source: FIS Research – Seacoast vs FIS Banks By Asset Size – Consumer Mobile Banking 27

28 Half of all routine branch transactions have been shifted to lower cost channels like ATMs and Mobile. This gives Seacoast flexibility as it evolves its distribution network. Multi - Channel Servicing is a Key Component of Our Evolution … And Seacoast is Aggressively Moving Routine Transactions to ATMs and Digital Channels. Annual Expense Savings Impact of Over $4.5mm 81% 19% 0% 20% 40% 60% 80% 100% Basic deposits and withdrawals 81% of All Teller Transactions are Simple Deposits and/or Withdrawals… 50,000 80,000 110,000 140,000 170,000 200,000 230,000 Jan-14 Apr-14 Jul-14 Oct-14 Jan-15 Apr-15 Jul-15 Oct-15 Jan-16 Apr-16 Jul-16 Oct-16 Jan-17 Apr-17 Jul-17 Oct-17 Teller Non-Teller 180k As of Dec. 31, 2016

As a Result, Seacoast is Growing While Rationalizing Branches Seacoast continues to create shareholder value via operating leverage in its branch network. As of 2Q 2017, Deposits Increased 100% While Branches Increased Only 30% since YE 2012 29 $1,759 $1,806 $2,417 $2,844 $3,523 $3,975 $49 $53 $56 $66 $75 $88 $40 $45 $50 $55 $60 $65 $70 $75 $80 $85 $90 $0 $500 $1,000 $1,500 $2,000 $2,500 $3,000 $3,500 $4,000 2012 2013 2014 2015 2016 2017 Q2 Total Deposits (mm) Deposits Per Branch (mm)

30 Experienced Board & Management Team Comprehensive Customer Servicing Model Track Record of Value - Creating Acquisitions Expanding Analytical & Digital Capabilities Well - Positioned to Benefit From Florida Market Focused on Controls Seacoast’s Differentiated Strategy

$0 $500 $1,000 $1,500 $2,000 $2,500 $3,000 $3,500 Dec, 2012 Dec, 2013 Dec, 2014 Dec, 2015 Dec, 2016 Jun, 2017 Credit Card Construction Factoring Consumer Marine Other C&I OOCRE Income CRE Residential 31 Strong Growth Has Been Intentionally Balanced and Not Dependent on CRE Loans Loans Outstanding $ Millions June 30, 2017 Mix 39% Residential & Consumer 30% Commercial Real Estate 31% Commercial & OOCRE

32 We Have a Number of Advantages Related to Our Approach to Credit Risk Management 1 Strong, skilled, independent underwriting teams that confirm solid, multiple repayment sources 2 Well - defined portfolio limits and elevated credit portfolio management/monitoring 3 Digestible loan sizes and no syndications 4 CRE concentrations below 220% 5 CRE products substantially income producing types 6 Lead position in all organic loans 7 Risk Ratings generated by objective calculation 8 Centrally reporting construction loan control and Special Asset Department 9 Credit Culture is documented and reinforced throughout organization

33 Experienced Board & Management Team Comprehensive Customer Servicing Model Track Record of Value - Creating Acquisitions Expanding Analytical & Digital Capabilities Well - Positioned to Benefit From Florida Market Focused on Controls Seacoast’s Differentiated Strategy

34 Acquisition Strategy Expands Customer Franchise GulfShore Bank: April 2017 BMO Harris Bank Orlando Operations June 2016 Floridian Financial Group March 2016 Grand Bank July 2015 BankFIRST October 2014 2014 2015 2016 2017 20% a verage IRR 4th largest Florida bank, up from 6th in 2014 #1 Florida headquartered bank in Orlando MSA NorthStar Bank: E xpected Close: 4 th Qtr 2017 Palm Beach Community Bank: Expected Close: 4 th Qtr 2017

3.9% 21.8% 0% 15% 30% 45% 2013 2016 18.5% 40.3% 0% 15% 30% 45% 2013 2016 6.3% 33.9% 0% 15% 30% 45% 2013 2016 In under two years, Seacoast has become a top - 10 bank in the Orlando market with a 19% IRR for our three acquisitions 35 We Have Proven Our Ability to Grow Acquired Banks by Attracting Households and Deepening Relationships Across All Lines of Business Seacoast Playbook: Penetrating the Orlando Market Orlando Households as % of company total Orlando Loans as % of company total Orlando Deposits as % of company total

36 In 2013, We Served 7,500 Customers Across Central Florida Customer Presence in Central Florida 2013 2013

37 In 2016, We Served Over 43,000 Customers Across Central Florida - More Than 5X Growth Customer Presence in Central Florida 2013 2016
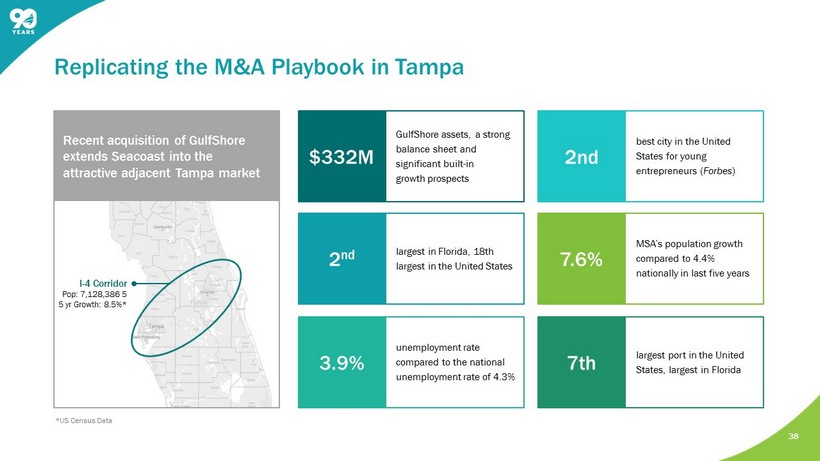
I - 4 Corridor Pop: 7,128,386 5 5 yr Growth : 8.5%* 38 Replicating the M&A Playbook in Tampa Recent acquisition of GulfShore extends Seacoast into the attractive adjacent Tampa market GulfShore assets, a strong balance sheet and significant built - in growth prospects largest in Florida, 18th largest in the United States unemployment rate compared to the national unemployment rate of 4.3% best city in the United States for young entrepreneurs ( Forbes ) MSA’s population growth compared to 4.4% nationally in last five years largest port in the United States, largest in Florida $332M 2 nd 3.9% 2nd 7.6% 7th *US Census Data

39 Experienced Board & Management Team Comprehensive Customer Servicing Model Track Record of Value - Creating Acquisitions Expanding Analytical & Digital Capabilities Well - Positioned to Benefit From Florida Market Focused on Controls Seacoast’s Differentiated Strategy

Southwest Florida Pop: 1,570,228 Pop Growth: 9.6% Treasure Coast/ Palm Beach Co. Pop: 1,956,515 Growth: 7.3% I - 4 Corridor Pop: 7,128,386 Growth: 8.5% *US Census Data Among the top 10 fastest growing states Surpassed New York to become the third largest state in 2014 Florida’s economy accelerating at a faster pace than the nation for next four years and becoming a $1 trillion economy in 2018 Florida is projected to be the 16th largest economy in the world in 2019 based on World Bank rankings Diversified economy - growth in education, health services, leisure & hospitality, trade, transportation, utilities, construction and manufacturing Florida Population Growth, 2015 – 2020* 40 The Florida Market Source: Sarasota Herald Tribune
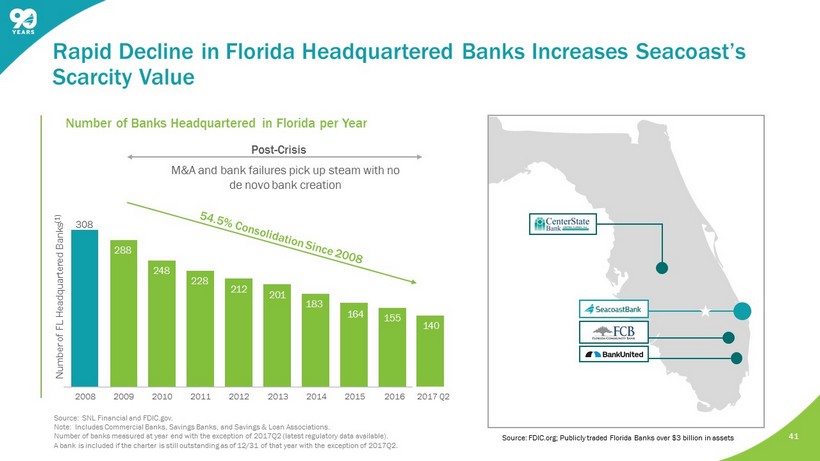
41 Number of Banks Headquartered in Florida per Year Rapid Decline in Florida Headquartered Banks Increases Seacoast’s Scarcity Value Post - Crisis M&A and bank failures pick up steam with no de novo bank creation Source: SNL Financial and FDIC.gov. Note: Includes Commercial Banks, Savings Banks, and Savings & Loan Associations. Number of banks measured at year end with the exception of 2017Q2 (latest regulatory data available). A bank is included if the charter is still outstanding as of 12/31 of that year with the exception of 2017Q2. Source: FDIC.org; Publicly traded Florida Banks over $3 billion in assets Number of FL Headquartered Banks (1) 308 2008 2009 2010 2011 2012 2013 2014 2015 2016 288 248 228 212 201 183 164 155 2017 Q2 140
42 Experienced Board & Management Team Comprehensive Customer Servicing Model Track Record of Value - Creating Acquisitions Expanding Analytical & Digital Capabilities Well - Positioned to Benefit From Florida Market Focused on Controls Seacoast’s Differentiated Strategy

43 Because of Our Strength In Data And Analytics, We Can Examine: We Know Our Customers’ Profitability and Manage Them Accordingly Customer Potential Low High Current Value High Retain & Engage Retain & Grow Low Manage & Lower Cost to Serve Grow! With this, We Can See the Characteristics and Behaviors of Our Customers…and Plan/Act Accordingly (Illustrative) % of Customers % of Total Lifetime Value Total 100.0% 100.0% 1. Ultra High Value 10% 60% 2. High Value 50% 30% 3. Low Value / High Potential 30% 10% 4. Low Value / Low Potential 10% 0% Source: Seacoast Proprietary Data

Median 75th Percentile 44 Opportunity Sizing Engine ( Patent Pending ) Consumer Lifetime Value Small Business Lifetime Value 3x Median 75th Percentile 5x Median 75th Percentile 3x Commercial Lifetime Value Source: Seacoast Proprietary Data Understanding the Path to Value Creation at a Customer Level
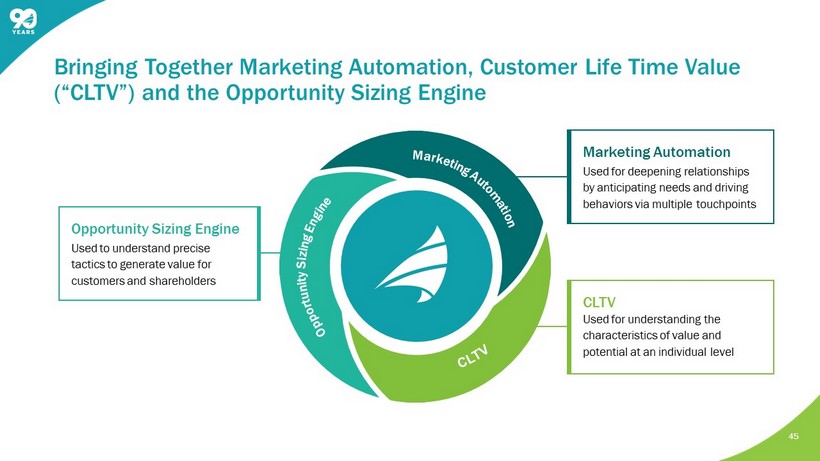
Opportunity Sizing Engine Used to understand precise tactics to generate value for customers and shareholders 45 Bringing Together Marketing Automation, Customer Life Time Value (“CLTV”) and the Opportunity Sizing Engine CLTV Used for understanding the characteristics of value and potential at an individual level Marketing Automation Used for deepening relationships by anticipating needs and driving behaviors via multiple touchpoints

46 Experienced Board & Management Team Comprehensive Customer Servicing Model Track Record of Value - Creating Acquisitions Expanding Analytical & Digital Capabilities Well - Positioned to Benefit From Florida Market Focused on Controls Seacoast’s Differentiated Strategy

47 Revitalized Board Aligned with Our Balanced Growth Strategy ADDITIONS Herb Lurie 2016 Jacqueline Bradley May 2015 Maryann Goebel Feb. 2014 Roger Goldman Feb. 2012 Julie Daum October 2013 Dennis Arczynski July 2013 Timothy Huval 2016 2012 2013 2014 2015 2016 2016 Al Monserrat Feb 201 7

48 We Have Methodically Added Strong Talent in Key Areas Dennis S. Hudson III Chairman & CEO Charles M. Shaffer CFO & Head of Strategy Charles K. Cross Jr. Executive Vice President & Commercial Banking Executive Julie Kleffel Executive Vice President & Community Banking Executive Joe Forlenza Chief Audit Officer Mike Sonego Executive Vice President, Residential Lending & Wealth David Houdeshell Executive Vice President & Chief Risk Officer Jeff Lee Executive Vice President & Chief Marketing Officer Dan Chappell Executive Vice President & CHRO Jeffery Bray Executive Vice President, Service & Operations

Agenda 49 ABOUT SEACOAST BANK 1 COMPANY PERFORMANCE 2 SEACOAST’S DIFFERENTIATED STRATEGY 3 OUTLOOK 4
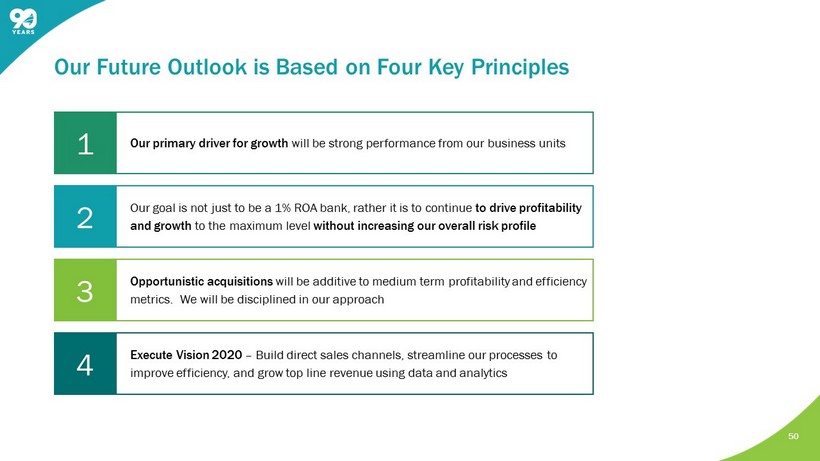
50 Our Future Outlook is Based on Four Key Principles 1 Our primary driver for growth will be strong performance from our business units 2 Our goal is not just to be a 1 % ROA bank, rather it is to continue to drive profitability and growth to the maximum level without increasing our overall risk profile 3 Opportunistic acquisitions will be additive to medium term profitability and efficiency metrics. We will be disciplined in our approach 4 Execute Vision 2020 – Build direct sales channels, streamline our processes to improve efficiency, and grow top line revenue using data and analytics
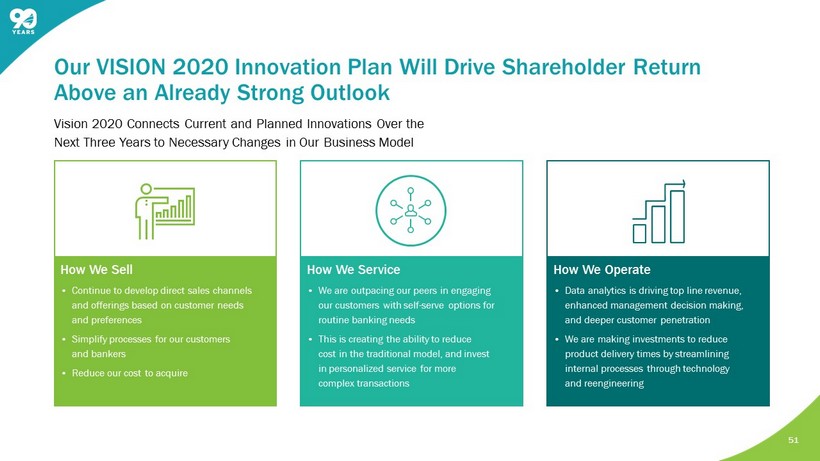
How We Sell • Continue to develop direct sales channels and offerings based on customer needs and preferences • Simplify processes for our customers and bankers • Reduce our cost to acquire How We Service • We are outpacing our peers in engaging our customers with self - serve options for routine banking needs • This is creating the ability to reduce cost in the traditional model, and invest in personalized service for more complex transactions How We Operate • Data analytics is driving top line revenue, enhanced management decision making, and deeper customer penetration • We are making investments to reduce product delivery times by streamlining internal processes through technology and reengineering Vision 2020 Connects Current and Planned Innovations Over the Next Three Years to Necessary Changes in Our Business Model 51 Our VISION 2020 Innovation Plan Will Drive Shareholder Return Above an Already Strong Outlook

52 Medium Term Expectation Medium Term Expectation Return on Assets 1.20% - 1.30% Return on Tangible Common Equity 14% - 16% Efficiency Ratio Low 50s • Bank valuations are closely correlated with return on tangible common equity and we are focused on driving returns to shareholders • Our momentum, combined with the Vision 2020 plan and our strong capital position, positions us to drive meaningful growth in return on tangible common equity in the coming years Vision 2020 Potential Return on Assets 1.30%+ Return on Tangible Common Equity 16%+ Efficiency Ratio Below 50
Charles M. Shaffer Executive Vice President Chief Financial Officer (772) 221 - 7003 Chuck.Shaffer@seacoastbank.com INVESTOR RELATIONS www.SeacoastBanking.com NASDAQ: SBCF Contact Details: Seacoast Banking Corporation of Florida 53

54

55 This presentation contains financial information determined by methods other than Generally Accepted Accounting Principles (“GAAP”) . The financial highlights provide reconciliations between GAAP net income and adjusted net income, GAAP income and adjusted pretax, preprovision income . Management uses these non - GAAP financial measures in its analysis of the Company’s performance and believes these presentations provide useful supplemental information, and a clearer understanding of the Company’s performance . The Company believes the non - GAAP measures enhance investors’ understanding of the Company’s business and performance and if not provided would be requested by the investor community . These measures are also useful in understanding performance trends and facilitate comparisons with the performance of other financial institutions . The limitations associated with operating measures are the risk that persons might disagree as to the appropriateness of items comprising these measures and that different companies might calculate these measures differently . The Company provides reconciliations between GAAP and these non - GAAP measures . These disclosures should not be considered an alternative to GAAP . Explanation of Certain Unaudited Non - GAAP Financial Measures Appendix A

( Q2 16 – Q2 17) 56 GAAP to Non - GAAP Reconciliation (Dollars in thousands except per share data) Second Quarter: 2017 First Quarter: 2017 Fourth Quarter: 2016 Third Quarter: 2016Second Quarter: 2016 Net income (loss) $7,676 $7,926 $10,771 $9,133 $5,332 Boli Income 0 0 0 0 0 Security Gains -21 0 -7 -225 -47 Total Adjustments to Revenue -21 0 -7 -225 -47 Merger related charges 5,081 533 561 1,699 2,446 Amortization of intangibles 839 719 719 728 593 Branch reductions and other expense initiatives 1,876 2,572 163 894 1,587 Early redemption cost for FHLB advances 0 0 0 0 1777 Total Adjustments to Noninterest Expense 7,796 3,824 1,443 3,321 6,403 Effective tax rate on adjustments -2,786 -1,480 -404 -1,168 -2,532 Adjusted Net Income $12,665 $10,270 $11,803 $11,061 $9,156 Earnings per diluted share, as reported 0.18 0.20 0.28 0.24 0.14 Adjusted earnings per diluted share 0.29 0.26 0.31 0.29 0.24 Average shares outstanding (000) 43,556 39,499 38,252 38,170 38,142 Net Revenue $54,644 $48,070 $47,354 $47,437 $43,651 Total Adjustments to Revenue -21 0 -7 -225 -47 Adjusted Net Revenue 54,623 48,070 47,347 47,212 43,604 Noninterest Expense 41,625 34,746 30,297 33,435 34,808 Total Adjustments to Noninterest Expense 7,796 3,824 1,443 3,321 6,403 Adjusted Noninterest Expense 33,829 30,922 28,854 30,114 28,405 Foreclosed property expense and net (gain)/loss on sale 297 -293 -78 124 -41 Net Adjusted Noninterest Expense 33,532 31,215 28,932 29,990 28,446

57 GAAP to Non - GAAP Reconciliation ( Q2 16 – Q2 17) (Dollars in thousands) Second Quarter: 2017 First Quarter: 2017 Fourth Quarter: 2016 Third Quarter: 2016Second Quarter: 2016 Adjusted Revenue 54,623 48,070 47,347 47,212 43,604 Impact of FTE adjustment 164 211 204 287 308 Adjusted Revenue on a fully taxable equivalent basis 54,787 48,281 47,551 47,499 43,912 Adjusted Efficiency Ratio 61.2% 64.7% 60.8% 63.1% 64.8% Average Assets $5,082,002 $4,699,745 $4,572,188 $4,420,438 $4,206,800 Less average goodwill and intangible assets -114,563 -78,878 -79,620 -80,068 -69,449 Average Tangible Assets 4,967,439 4,620,867 4,492,568 4,340,370 4,137,351 Return on Average Assets (ROA) 0.61% 0.68% 0.94% 0.82% 0.51% Impact of removing average intangible assets and related amortization 0.05% 0.06% 0.06% 0.06% 0.05% Return on Tangible Average Assets (ROTA) 0.66% 0.74% 1.00% 0.88% 0.56% Impact of other adjustments for Adjusted Net Income 0.36% 0.16% 0.05% 0.13% 0.33% Adjusted Return on Average Tangible Assets 1.02% 0.90% 1.05% 1.01% 0.89% Average Shareholders' Equity $567,448 $466,847 $437,077 $430,410 $416,748 Less average goodwill and intangible assets -114,563 -78,878 -79,620 -80,068 -69,449 Average Tangible Equity 452,885 387,969 357,457 350,342 347,299 Return on Average Shareholders' Equity 5.4% 6.9% 9.8% 8.4% 5.1% Impact of removing average intangible assets and related amortization 1.9% 1.9% 2.7% 2.5% 1.5% Return on Average Tangible Common Equity (ROTCE) 7.3% 8.8% 12.5% 10.9% 6.6% Impact of other adjustments for Adjusted Net Income 3.9% 1.9% 0.6% 1.7% 4.0% Adjusted Return on Average Tangible Common Equity 11.2% 10.7% 13.1% 12.6% 10.6%

This communication does not constitute an offer to sell or the solicitation of an offer to buy any securities or a solicitati on of any vote or approval, nor shall there be any sale of securities in any jurisdiction in which such offer, solicitation or sale wou ld be unlawful prior to registration or qualification under the securities laws of such jurisdiction. Seacoast Banking Corporation of Florida ("Seacoast") has filed with the Securities and Exchange Commission (the "SEC") separate registration statements on Form S - 4 containing a proxy statement of Palm Beach Community Bank ("PBCB") and a prospectus of Seacoast, and a proxy statement for NorthStar Bank (“ NorthStar ”) and a prospectus for Seacoast. Seacoast will file other documents with respect to the proposed mergers. A definitive proxy statement/prospectus will be mailed to shareholders of PBCB and NorthStar . Investors and security holders of Seacoast, PBCB and NorthStar are urged to read the entire proxy statements/prospectus and other documents that will be filed with the SEC carefully and in their entirety when they become available because they will contain important information. Investors and security holders will be able to obtain free copies of the registration statement and the proxy statement/prospectus (when available) and other documents filed with the SEC by Seacoast through the website maintained by the SEC at http://www.sec.gov . Copies of the documents filed with the SEC by Seacoast will be available free of charge on Seacoast's internet website or by contacting Seacoast. Seacoast, PBCB, NorthStar and their respective directors and executive officers and other members of management and employees may be considered participants in the solicitation of proxies in connection with the proposed transaction. Informat ion about the directors and executive officers of Seacoast is set forth in its proxy statement for its 2017 annual meeting of shareholders, which was filed with the SEC on April 6, 2017 and its Current Reports on Form 8 - K. Other information regarding the participants in the proxy solicitation and a description of their direct and indirect interests, by security holdings or othe rwi se, will be contained in the proxy statement/prospectus and other relevant materials to be filed with the SEC when they become available. 58 Important Information For Investors And Shareholders 58