Attached files
| file | filename |
|---|---|
| 8-K - CURRENT REPORT - B&G Foods, Inc. | a17-21365_18k.htm |
Forward-Looking Statements These materials and the oral statements made from time to time by executive officers of B&G Foods may contain “forward-looking” statements within the meaning of Section 21E of the Securities Exchange Act of 1934, as amended, and the Private Securities Litigation Reform Act of 1995, known as the PSLRA. Statements in this presentation that are not statements of historical or current fact constitute “forward-looking statements.” The forward-looking statements contained in this presentation include, without limitation, statements related to future plans, strategies and operations, net sales, adjusted EBITDA, adjusted diluted earnings per share, B&G Foods’ overall expectations for fiscal 2017 and beyond, the planned acquisition of Back to Nature Foods Company and the timing thereof, the expected impact of the planned acquisition, including without limitation, the expected impact on B&G Foods’ net sales and adjusted EBITDA, and the expected tax benefits of the acquisition. Such forward-looking statements involve known and unknown risks, uncertainties and other unknown factors that could cause the actual results of B&G Foods to be materially different from the historical results or from any future results expressed or implied by such forward-looking statements. In addition to statements that explicitly describe such risks and uncertainties readers are urged to consider statements labeled with the terms “believes,” “belief,” “expects,” “projects,” “intends,” “anticipates” or “plans” to be uncertain and forward-looking. Factors that may affect actual results include, without limitation: our substantial leverage; the effects of rising costs for our raw materials, packaging and ingredients; crude oil prices and their impact on distribution, packaging and energy costs; our ability to successfully implement sales price increases and cost saving measures to offset any cost increases; intense competition, changes in consumer preferences, demand for our products and local economic and market conditions; our continued ability to promote brand equity successfully, to anticipate and respond to new consumer trends, to develop new products and markets, to broaden brand portfolios in order to compete effectively with lower priced products and in markets that are consolidating at the retail and manufacturing levels and to improve productivity; the risks associated with the expansion of our business; our possible inability to identify new acquisitions or to integrate recent or future acquisitions or our failure to realize anticipated revenue enhancements, cost savings or other synergies; our ability to access the credit markets and our borrowing costs and credit ratings, which may be influenced by credit markets generally and the credit ratings of our competitors; unanticipated expenses, including, without limitation, litigation or legal settlement expenses; the effects of currency movements of the Canadian dollar and the Mexican peso as compared to the U.S. dollar; future impairments of our goodwill and intangible assets; our sustainability initiatives and changes to environmental laws and regulations; our ability to successfully implement our new enterprise resource planning system; risks related to cybersecurity; and other factors that affect the food industry generally. The forward-looking statements contained herein are also subject generally to other risks and uncertainties that are described from time to time in B&G Foods’ filings with the Securities and Exchange Commission, including under Item 1A, “Risk Factors” in the Company’s Annual Report on Form 10-K for fiscal 2016 filed on March 1, 2017 and in B&G Foods’ subsequent reports on Forms 10-Q and 8-K. Investors are cautioned not to place undue reliance on any such forward-looking statements, which speak only as of the date they are made. B&G Foods undertakes no obligation to publicly update or revise any forward-looking statement, whether as a result of new information, future events or otherwise. 2
About Non-GAAP Financial Measures This presentation includes “non-GAAP (Generally Accepted Accounting Principles) financial measures.” “Adjusted diluted earnings per share” (which we define as reported diluted earnings per share adjusted for certain items that affect comparability), “base business net sales” (which we define as net sales without the impact of acquisitions until the acquisitions are included in both comparable periods and without the impact of discontinued brands), “EBITDA” (which we define as net income before net interest expense, income taxes, depreciation and amortization and loss on extinguishment of debt), “adjusted EBITDA” (which we define as EBITDA, further adjusted for cash and non-cash acquisition-related expenses, gains and losses (which may include third party fees and expenses, integration, restructuring and consolidation expenses, amortization of acquired inventory fair value step-up, and gains and losses on sale of assets), intangible asset impairment charges and related asset write-offs; loss on product recalls, including customer refunds, selling, general and administrative expenses and the impact on cost of sales; and distribution restructuring expenses), “excess cash” (which we define as adjusted EBITDA less cash interest expenses, cash taxes/withholding and capital expenditures plus share based compensation expense) and “free cash flow” (which we define as adjusted EBITDA less capital expenditures) are non-GAAP financial measures. A non-GAAP financial measure is a numerical measure of financial performance that excludes or includes amounts so as to be different than the most directly comparable measure calculated and presented in accordance with GAAP in B&G Foods’ consolidated balance sheets and related consolidated statements of operations, changes in stockholders’ equity and comprehensive income and cash flows. Non-GAAP financial measures should not be considered in isolation or as a substitute for the most directly comparable GAAP measures. The Company's non-GAAP financial measures may be different from non-GAAP financial measures used by other companies. 3
About Non-GAAP Financial Measures (cont’d) B&G Foods provides earnings guidance only on a non-GAAP basis and does not provide a reconciliation of the Company’s forward-looking adjusted EBITDA and adjusted diluted earnings per share guidance to the most directly comparable GAAP financial measures because of the inherent difficulty in forecasting and quantifying certain amounts that are necessary for such reconciliations, including adjustments that could be made for deferred taxes; loss on extinguishment of debt; acquisition-related expenses, gains and losses; intangible asset impairment charges and related asset write-offs; loss on product recalls; restructuring expenses; and other charges reflected in our reconciliation of historic non-GAAP financial measures, the amounts of which, based on past experience, could be material. Additional information regarding these non-GAAP financial measures, including reconciliations of non-GAAP financial measures to the most directly comparable GAAP measures, is included elsewhere herein and in B&G Foods’ Current Reports on Form 8-K filed with the SEC on February 23, 2017, May 4, 2017 and August 3, 2017; Quarterly Reports on Form 10-Q for the quarter ended April 1, 2017 filed with the SEC on May 9, 2017 and for the quarter ended July 1, 2017 filed with the SEC on August 7, 2017, and Annual Report on Form 10-K for fiscal 2016 filed with the SEC on March 1, 2017. Copies of these filings may be viewed at B&G Foods’ website at www.bgfoods.com under “Investors – SEC Filings.” 4
Presenters Bob Cantwell President and Chief Executive Officer Bruce Wacha Executive Vice President, Corporate Strategy and Business Development Sarah Jarolem Director, Corporate Strategy and Business Development 5
Robert Cantwell President & CEO
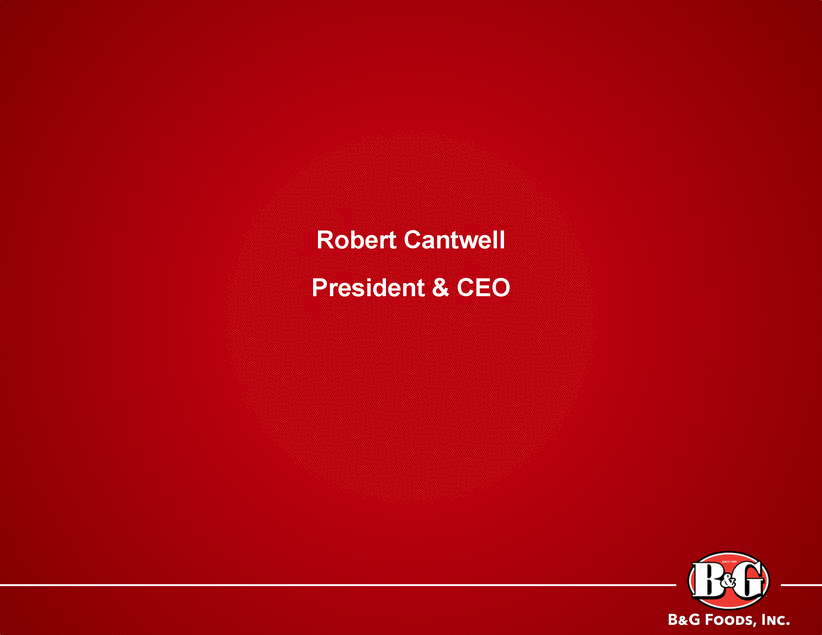
B&G Foods By The Numbers Corporate Snapshot Financial Performance ($ in millions) $1.735 billion 2017E Pro Forma Net Sales(1) $377 million 2017E Pro Forma Adjusted EBITDA(1) $4.0 billion Enterprise Value(2) Headquartered in Parsippany, NJ ~2,500 employees 10 manufacturing facilities with extensive third party co-packers and global sourcing 2010 2011 2012 2013 2014 2015 2016 2017E PF Net Sales Adjusted EBITDA 1) Represents the midpoint of our previously stated Fiscal 2017 guidance for net sales of $1.64 to $1.67 billion and adjusted EBITDA of $352.5 to $367.5 million plus the full year pro forma impact of the pending Back to Nature acquisition, which is expected to generate on an annualized basis approximately $80 million in net sales and $17 million in adjusted EBITDA following the completion of a six-month integration period. We define enterprise value as our market capitalization (based upon our August 31, 2017 share price of $30.50) plus our net debt (i.e., long-term debt less cash on hand) pro forma for additional long-tern debt expected to be incurred for the pending acquisition of Back to Nature. 7 2) 2010 – 2016 Net Sales CAGR = +18.1% 2010 – 2016 Adjusted EBITDA CAGR = +17.9% $377 $322 $1,735 $1,391 $218 $194 $966 $184 $848 $169 $725 $131 $120 $634 $544 $513
Key Investment Highlights We successfully acquire and operate established food brands and make them relevant for today’s consumer Maximize growth of high potential brands/manage other brands for flat to moderate growth Conduct accretive M&A to grow shareholder value Maintain industry leading adjusted EBITDA margins as compared to reporting company peers our public Win with high quality products, first in class customer service and differentiated innovation Manage brands for working capital and free cash flow efficiency Enduring commitment to deleveraging Enduring commitment to returning a meaningful portion of excess cash our shareholders to 8
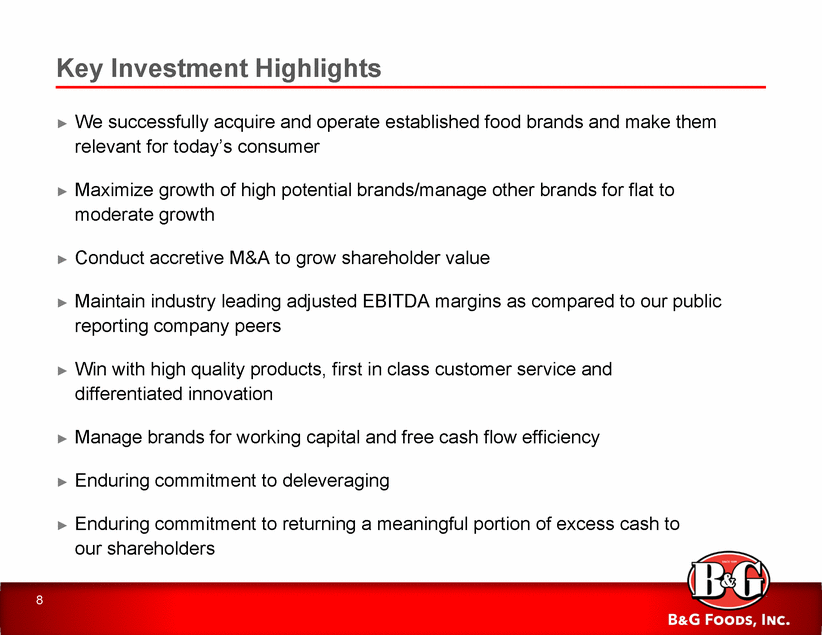
The B&G Foods Family of Brands And now(1)… DECEMBER 9 1)Acquisition pending. Remains subject to regulatory approval and customary closing conditions.
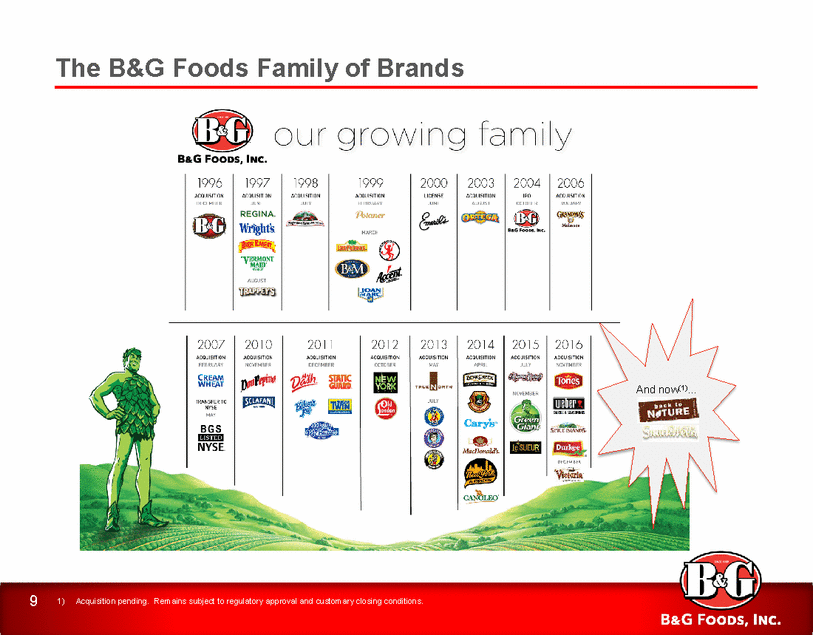
B&G Foods’ Balanced Portfolio Annual Net Sales By Brand 2017E Pro Forma Net Sales By Category(1) Frozen 21.0% Snacks 12.2% Dry Grocery 66.8% $1.735 Billion 2017E Pro Forma Net Sales(1) 1)Represents the midpoint of our previously stated fiscal 2017 guidance for net sales of $1.64 to $1.67 billion plus the full year pro forma impact of the pending Back to Nature acquisition, which is expected to generate on an annualized basis approximately $80 million in net sales following the completion of a six-month integration period. 10 $500 million + $100 million + $50 million - $100 million < $50 million
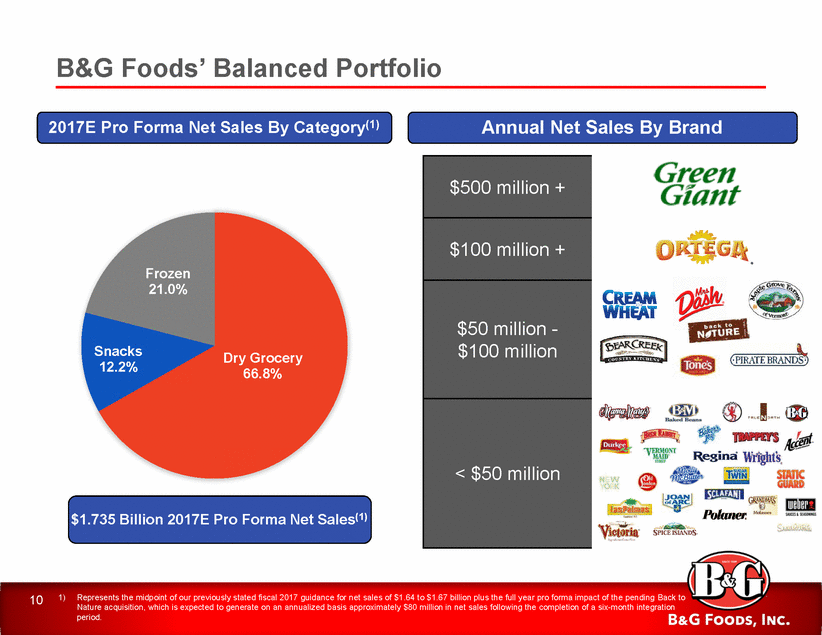
B&G Foods has Fundamentally Shifted its Portfolio Through the Use of Disciplined, Accretive M&A B&G Foods has transformed its portfolio through accretive acquisitions, which have substantially increased our net sales, adjusted EBITDA and organizational scale, while also shifting our portfolio to be more on-trend with consumers (by providing better-for-you frozen vegetables, spices & seasonings, premium pasta sauces and upon completion of the Back to Nature acquisition, cookies, crackers, granola and other items) Over the long term, B&G Foods expects to achieve net sales growth on our base business of approximately 0% to 2%, with such growth to be supplemented by disciplined, opportunistic and accretive M&A $3,000 ($ in millions) $2,500 $2,000 $1,500 $1,000 $500 $-1996 2014 $194.1mm 2017E PF(1) $377.0mm The Future? Adjusted EBITDA 1)Represents the midpoint of our previously stated fiscal 2017 guidance for net sales of $1.64 to $1.67 billion and adjusted EBITDA of $352.5 to $367.5 million plus the pro forma impact of the pending Back to Nature acquisition, which is expected to generate on an annualized basis approximately $80 million in net sales and $17 million in adjusted EBITDA following the completion of a six-month integration period. 11 Net Sales(1) $848 $1,735 $82
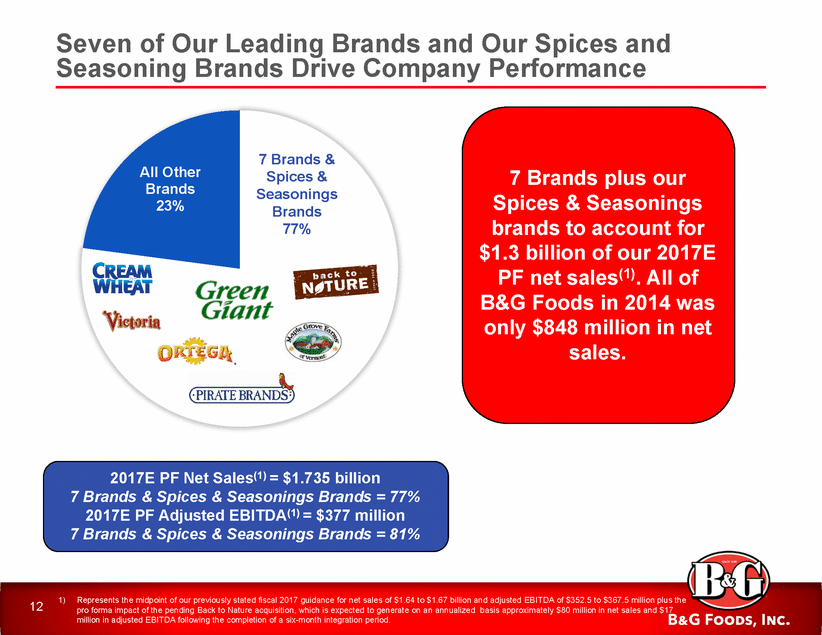
Seven of Our Leading Brands and Our Spices and Seasoning Brands Drive Company Performance 7 Brands & Spices & Seasonings Brands 77% All Other Brands 23% 7 Brands plus our Spices & Seasonings brands to account for $1.3 billion of our 2017E PF net sales(1). All of B&G only Foods in 2014 was $848 million sales. in net 2017E PF Net Sales(1) = $1.735 billion 7 Brands & Spices & Seasonings Brands = 77% 2017E PF Adjusted EBITDA(1) = $377 million 7 Brands & Spices & Seasonings Brands = 81% 1)Represents the midpoint of our previously stated fiscal 2017 guidance for net sales of $1.64 to $1.67 billion and adjusted EBITDA of $352.5 to $367.5 million plus the pro forma impact of the pending Back to Nature acquisition, which is expected to generate on an annualized basis approximately $80 million in net sales and $17 million in adjusted EBITDA following the completion of a six-month integration period. 12
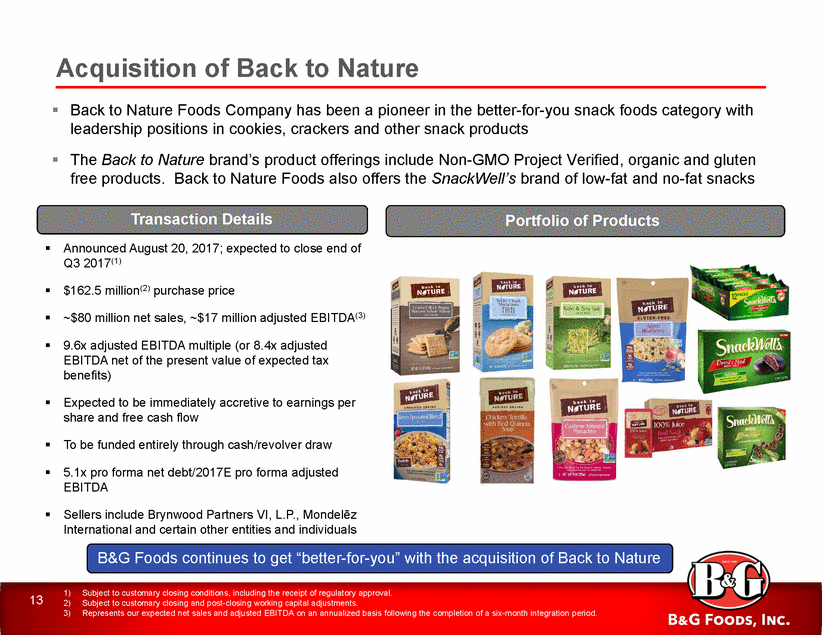
Acquisition of Back to Nature Back to Nature Foods Company has been a pioneer in the better-for-you snack foods category with leadership positions in cookies, crackers and other snack products The Back to Nature brand’s product offerings include Non-GMO Project Verified, organic and gluten free products. Back to Nature Foods also offers the SnackWell’s brand of low-fat and no-fat snacks Transaction Details Announced August 20, 2017; expected to close end of Q3 2017(1) Portfolio of Products $162.5 million(2) purchase price ~$80 million net sales, ~$17 million adjusted EBITDA(3) 9.6x adjusted EBITDA multiple (or 8.4x adjusted EBITDA net of the present value of expected tax benefits) Expected to be immediately accretive to earnings per share and free cash flow To be funded entirely through cash/revolver draw 5.1x pro forma net debt/2017E pro forma adjusted EBITDA Sellers include Brynwood Partners VI, L.P., Mondelez International and certain other entities and individuals B&G Foods continues to get “better-for-you” with the acquisition of Back to Nature 1) 2) 3) Subject to customary closing conditions, including the receipt of regulatory approval. Subject to customary closing and post-closing working capital adjustments.. Represents our expected net sales and adjusted EBITDA on an annualized basis following the completion of a six-month integration period. 13
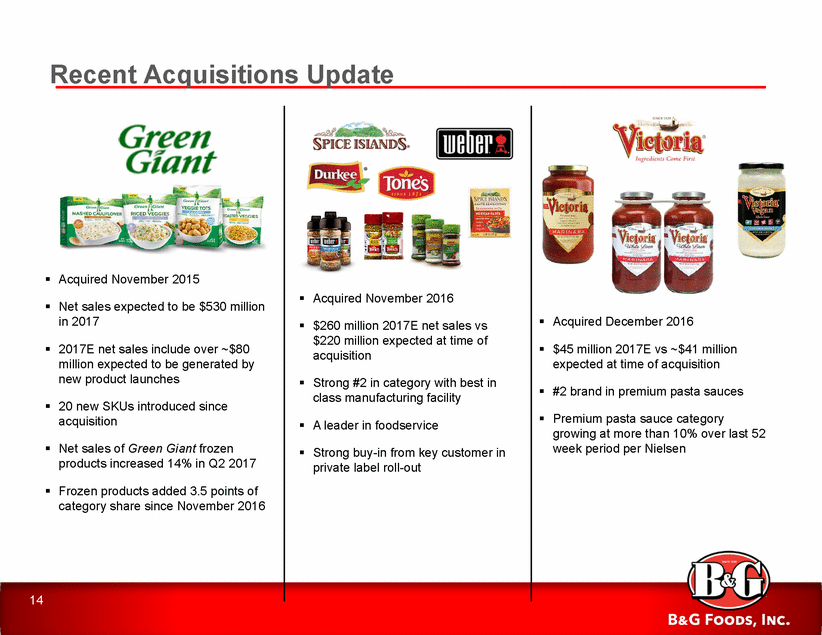
Recent Acquisitions Update Acquired November 2015 Acquired November 2016 Net sales expected to be $530 million in 2017 Acquired December 2016 $260 million 2017E net sales vs $220 million expected at time of acquisition 2017E net sales include over ~$80 million expected to be generated by new product launches $45 million 2017E vs ~$41 million expected at time of acquisition Strong #2 in category with best in class manufacturing facility #2 brand in premium pasta sauces 20 new SKUs introduced since acquisition Premium pasta sauce category growing at more than 10% over last 52 week period per Nielsen A leader in foodservice Net sales of Green Giant frozen products increased 14% in Q2 2017 Strong buy-in from key customer in private label roll-out Frozen products added 3.5 points of category share since November 2016 14
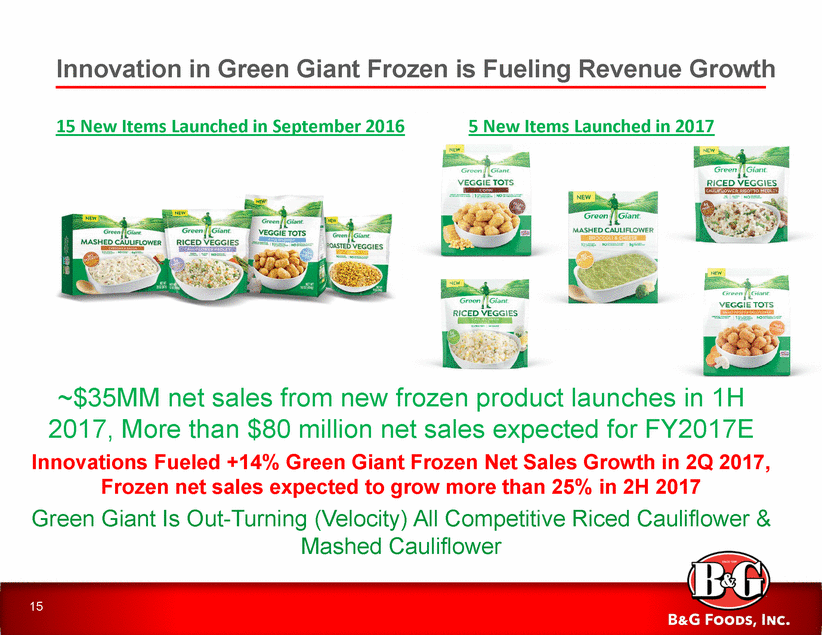
Innovation in Green Giant Frozen is Fueling Revenue Growth 15 New Items Launched in September 2016 5 New Items Launched in 2017 ~$35MM net sales from new frozen product launches in 1H 2017, More than $80 million net sales expected for FY2017E Innovations Fueled +14% Green Giant Frozen Net Sales Growth in 2Q 2017, Frozen net sales expected to grow more than 25% in 2H 2017 Green Giant Is Out-Turning (Velocity) All Competitive Riced Cauliflower & Mashed Cauliflower 15
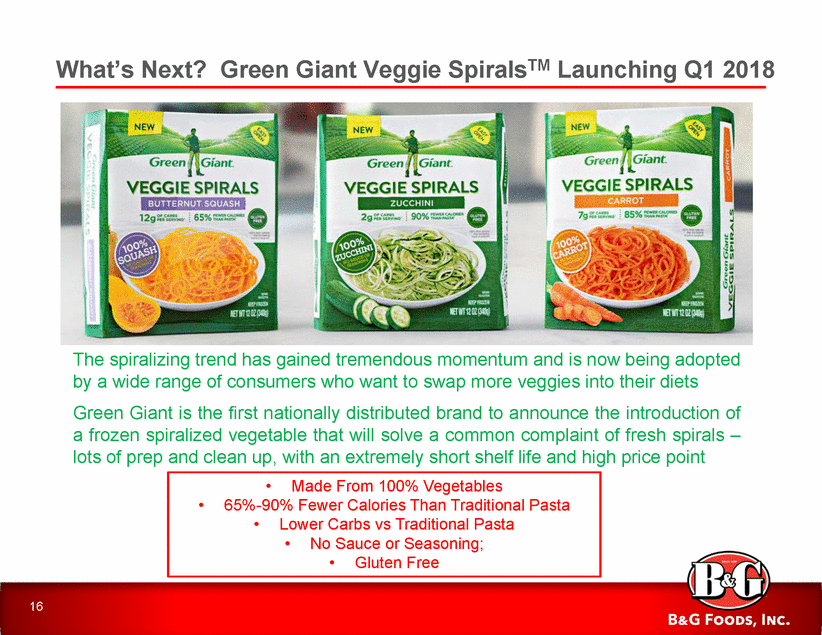
SpiralsTM What’s Next? Green Giant Veggie Launching Q1 2018 The spiralizing trend has gained tremendous momentum and is now being adopted by a wide range of consumers who want to swap more veggies into their diets Green Giant is the first nationally distributed brand to announce the introduction of a frozen spiralized vegetable that will solve a common complaint of fresh spirals – lots of prep and clean up, with an extremely short shelf life and high price point 16 •Made From 100% Vegetables •65%-90% Fewer Calories Than Traditional Pasta •Lower Carbs vs Traditional Pasta •No Sauce or Seasoning; •Gluten Free
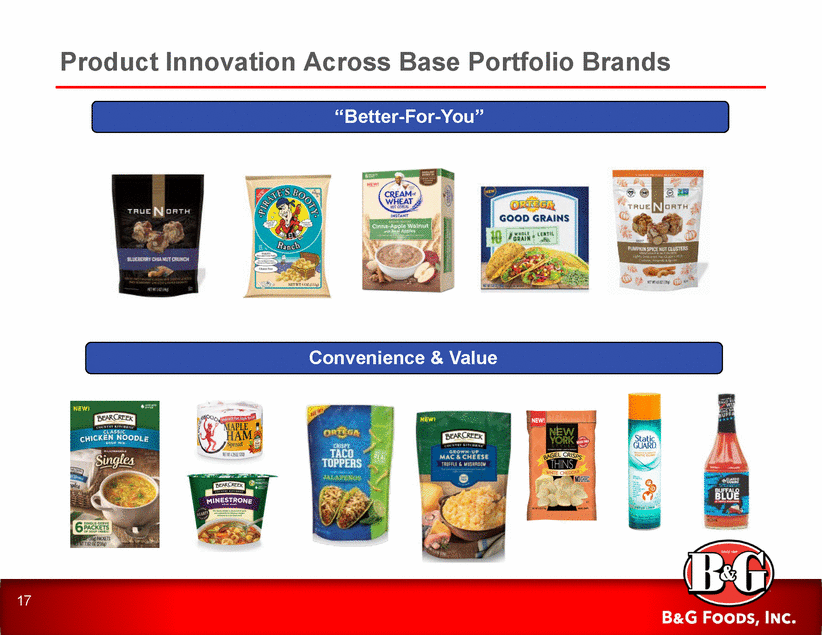
Product Innovation Across Base Portfolio Brands “Better-For-You” Convenience & Value 17
Bruce Wacha EVP Corporate Strategy & Business Development
Bruce Wacha, Executive Vice President Corporate Strategy and Business Development Professional Experience Current Role and Responsibilities EVP, Corporate Strategy and Business Development • Corporate Strategy CFO, Executive Director of Board of Directors • Business Development • Mergers & Acquisitions Investment Banking • Capital Markets Education • Investor Relations 19
The B&G Foods Approach to M&A Focused Acquisition Policy Commitment to A Winning Strategy Branded food products with defensible market positions Focus on acquiring brands at accretive multiples EPS accretive year 1 Generate accretive cash flow after financing costs of at least 50% of adjusted EBITDA acquired Approximately 60% FCF deployed to dividends Approximately 40% FCF typically deployed for deleveraging Committed to enhance growth through accretive acquisitions Targeting leverage between ~4.5x and ~5.5x on net debt/adjusted EBITDA over long-term Acquisition strategy has allowed for increased dividends over time Committed to maintaining our dividend policy Continue to reinvest in acquired brands Last four acquisitions have been “on-trend” (Green Giant, Spices & Seasonings, Victoria and Back to Nature Foods(1)) See continued benefit in center of store opportunities Acquire “like” products to facilitate sales, distribution and G&A synergies B&G Foods is committed to following the disciplined acquisition strategy that has served it well for more than 20 years 20
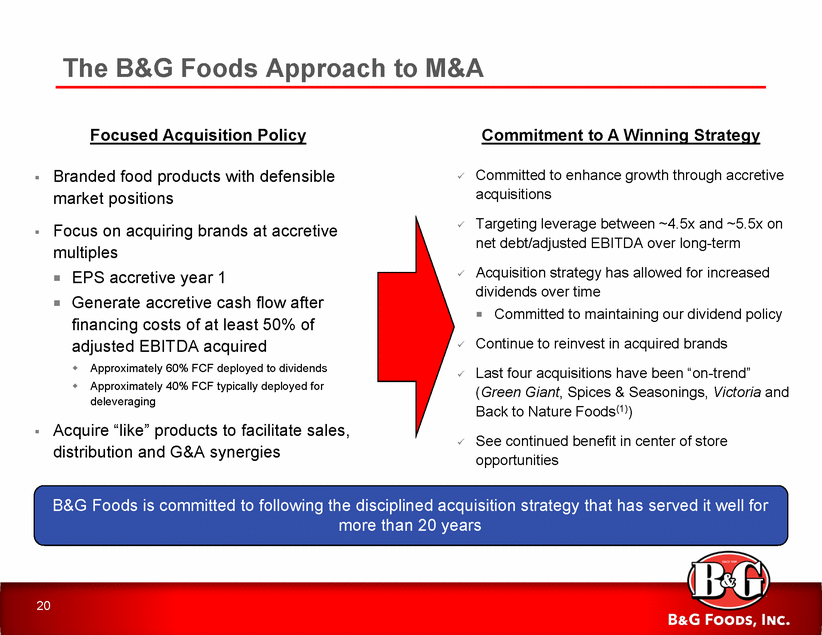
Strong Excess Cash Generation Adjusted EBITDA % Margin $360 23.1% (+) Share-Based Compensation Expense 5 (-) Cash Interest Expense (81) (-) Cash Taxes (23) (-) Capital Expenditures (60) Excess Cash before Dividends as a % of Adjusted EBITDA 55.9% (-) Cash Dividends (124) Dividends as a % of Excess Cash before Dividends 61.6% 1) Based on the midpoint of our previously stated fiscal 2017 guidance for adjusted EBITDA of $352.5 to $367.5 million without taking into account the expected impact of the pending Back to Nature acquisition. 21 Excess Cash After Dividends $77 Excess Cash before Dividends $201 Adjusted EBITDA (before share-based compensation) $365 Significant Excess Cash After Dividends Available to B&G Foods ($ in millions) Projected 2017(1)
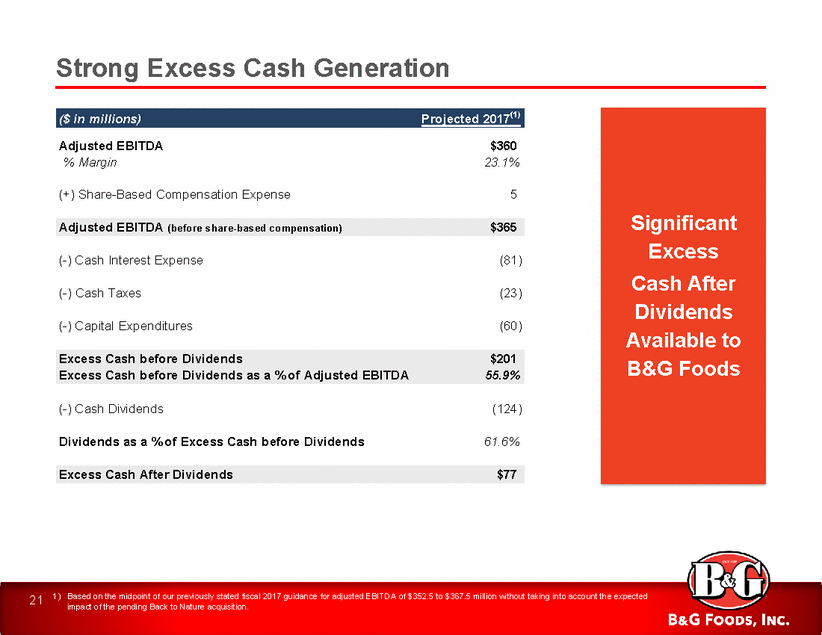
Approximately $120 million of Investments During 1H 2017 One Time and Planned ($ in millions) $118 $5 $11 $19 $19 $64 Increase in CapEx spending tied to Green Giant manufacturing optimization Increase in inventory for spices & seasonings to “normalized” levels Increase in CapEx for implementation of a new enterprise resource planning (ERP) system Total impact to cash flows in 1H 2017 of the one-time and planned investments Increase in inventory for Green Giant to “normalized” levels Increase in inventory for Green Giant during factory optimization 22
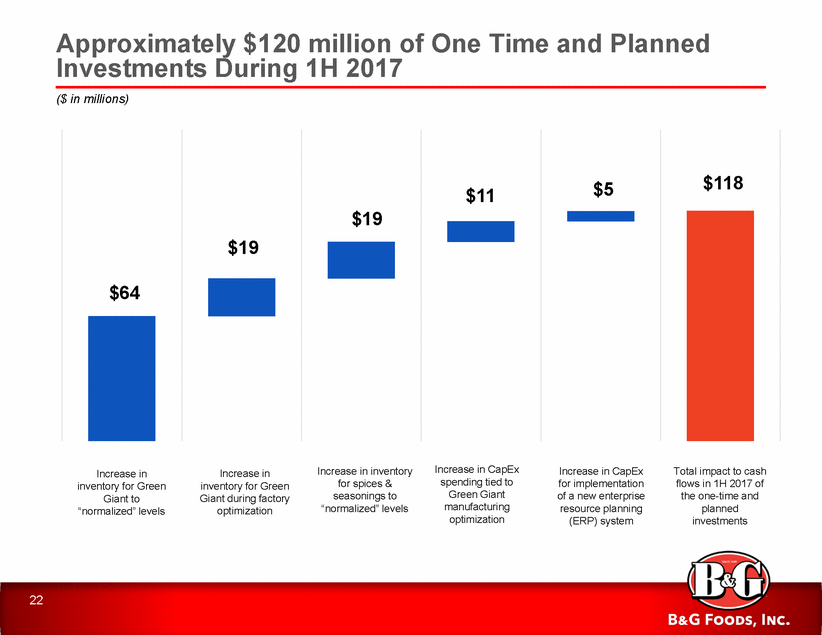
1H FY2017 Performance Results Net sales increased by $126.6 million benefitting from the acquisitions of the spices & seasonings brands and Victoria Fine Foods Base business net sales were negatively impacted primarily by the timing of certain promotional spending, a reduction in certain private label sales and distribution losses to certain customers of unprofitable canned vegetable sales. These declines were offset in part by strong sales performance by Green Giant frozen products net of slotting and coupons SG&A expenses were impacted by ~$10 million in acquisition related expenses (not included for the purpose of calculating adjusted EBITDA or adjusted diluted EPS) ($ in millions) ($ in millions) $1,000 $200 $800 $150 $600 $100 $400 $50 $200 $0 $0 1H 2015 1H 2016 1H 2017 1H 2015 1H 2016 1H 2017 23 $174.5 $170.2 $97.3 $786.0 $659.4 $410.8 Adjusted EBITDA Net Sales
B&G Foods Building Momentum in Tracked Channel Data Latest Nielsen ($ in millions) Brand % Change $ Sales Latest 13 Weeks Brand % Change $ Sales Latest 4 Weeks (1.6)% (0.7)% (6.5)% (5.5)% (1.4)% 0.1% (0.2)% 1.4% 24 1)For the 13 weeks and 4 weeks ended July 29, 2017, Total US x AOC. incl. Private Label20.8%23.4% (5.6)%2.1% 4.3%3.9% (2.2)%(0.3)% 16.3%17.6% Frozen
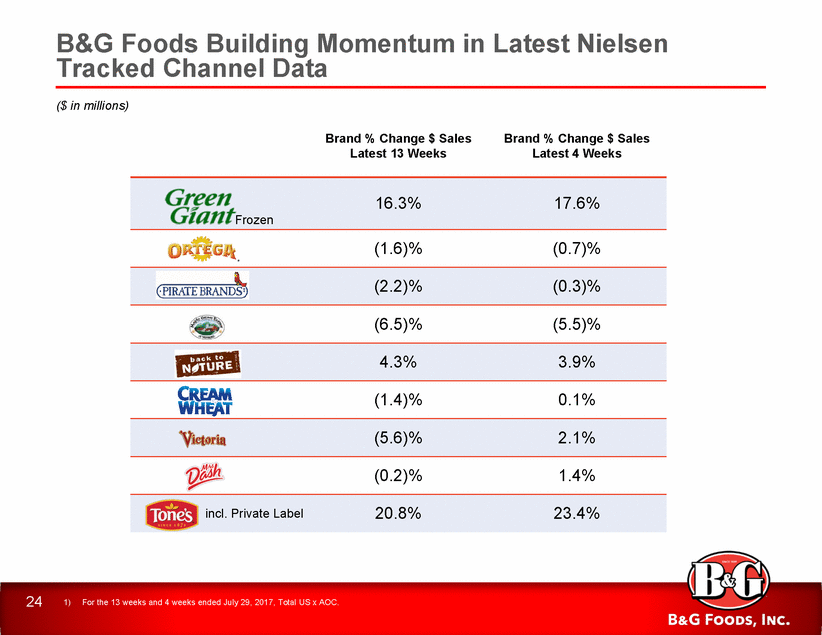
B&G Foods has Generated Mid to High Teens Annual Growth Since 2010 B&G Foods has benefited from consistent management focused on profitable sales growth, accretive M&A, implementing cost savings initiatives and improving productivity As a result, net sales, adjusted EBITDA and adjusted diluted EPS have grown at CAGRs of 18.1%, 17.9 and 14.9%, respectively, since 2010 ($ in millions) ($ in millions) $1,735.0 $1,800 $450 $1,391.3 $1,200 $725.0 $225 $633.8 $543.9 $513.3 $131.1 $600 $119.7 $-$0 2010 2011 2012 2013 2014 2015 20162017E PF 2010 2011 2012 2013 2014 2015 2016 2017E PF $2.50 $2.00 $1.50 $1.00 $0.50 $0.00 2010 2011 2012 2013 2014 2015 2016 2017E 1) Based on the midpoint of our previously stated fiscal 2017 guidance for net sales of $1.64 to $1.67 billion and adjusted EBITDA of $352.5 to $367.5 million plus the full year pro forma impact of the pending Back to Nature acquisition, which is expected to generate on an annualized basis approximately $80 million in net sales and $17 million in adjusted EBITDA following the completion of a six-month integration period. Based on the midpoint of previously stated fiscal 2017 guidance for adjusted diluted EPS of $2.03 to $2.17, without taking into account the expected impact of the pending Back to Nature acquisition. 25 2) $2.07$2.10 $1.35$1.43$1.44$1.53 $1.09 $0.90 Adjusted Diluted EPS(2) $377.0 $322.0 $217.8 $169.0$184.0 $194.1 $966.4 $848.0 Net Sales(1) Adjusted EBITDA(1)
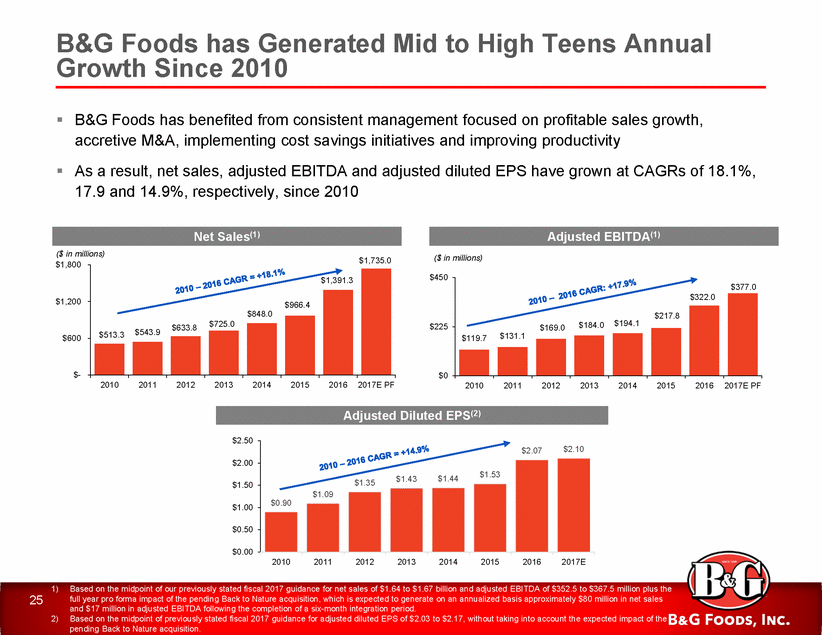
B&G Foods’ Industry Leading Adjusted EBITDA Margins B&G Foods has generated +20% adjusted EBITDA margins over the past decade, consistently among the highest in the mid cap packaged food industry B&G Foods also benefits from a consistently high free cash flow model, which allows it to effectively deploy its capital Peer Average = 16.1% 25% 21.7%(2) 21.5% 18.3% 15% 10.7% 5% Average excludes B&G Foods; Source: FactSet 1)Adjusted EBITDA margin is defined as adjusted EBITDA as a percentage of net sales. 2)2017E Adjusted EBITDA margin based on the midpoint of our previously stated fiscal 2017 guidance for net sales of $1.64 to $1.67 billion and adjusted EBITDA of $352.5 to $367.5 million, without taking into account the expected impact of the pending Back to Nature acquisition. 26 19.4%19.1% 15.4%15.1% 13.7% 11.4% LTM Adjusted EBITDA Margin(1)
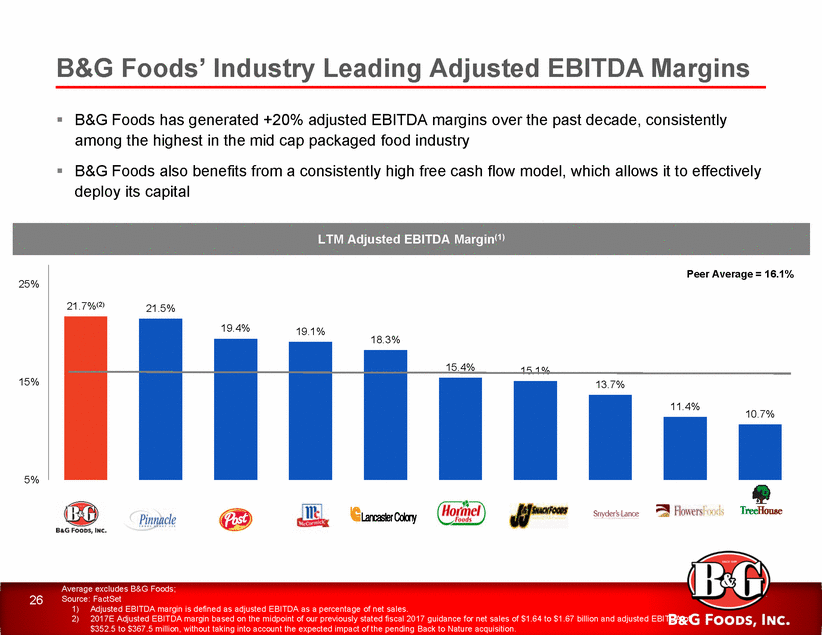
B&G Foods’ Industry Leading Dividend Yield B&G Foods returns cash to shareholders in the form of dividends and has consistently had one of the highest dividend yields in the packaged foods industry B&G Foods is committed to maintaining its current dividend policy 7% Peer Average = 2.07% 6% 5.72% 5% 4% 3% 2.23% 2.21% 2.20% 2% 1% 0% 27 Average excludes B&G Foods; Source: FactSet 2.52%2.51% 1.77% 1.04% Annual Dividend Yield – 10 Year Average
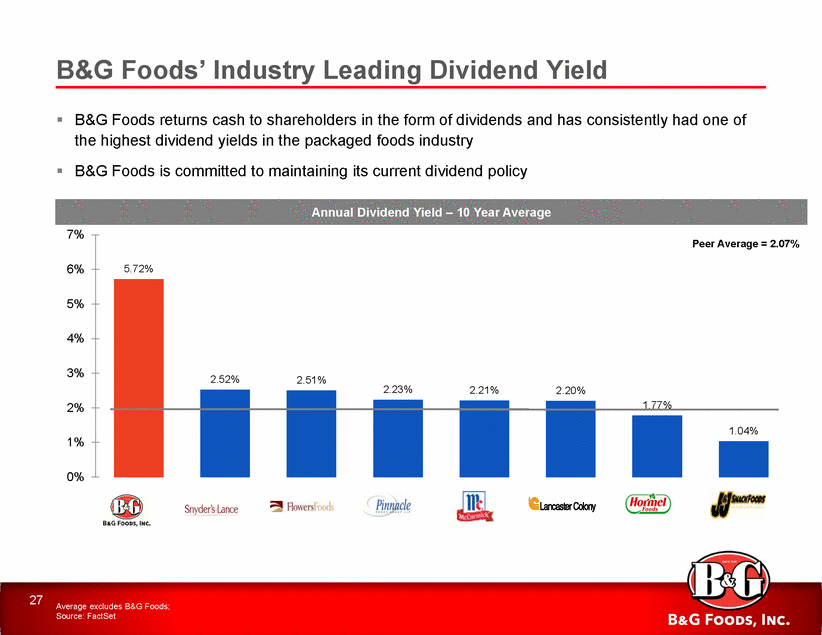
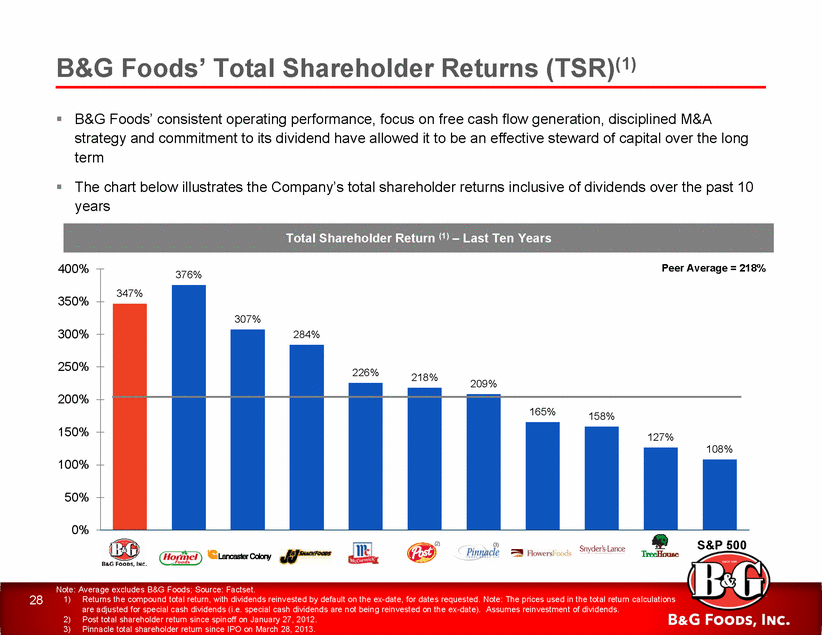
B&G Foods’ Total Shareholder Returns (TSR)(1) B&G Foods’ consistent operating performance, focus on free cash flow generation, disciplined M&A strategy and commitment to its dividend have allowed it to be an effective steward of capital over the long term The chart below illustrates the Company’s total shareholder returns inclusive of dividends over the past 10 years 400% Peer Average = 218% 376% 350% 300% 250% 209% 200% 150% 100% 50% 0% S&P 500 (2) (3) Note: Average excludes B&G Foods; Source: Factset. 28 1) Returns the compound total return, with dividends reinvested by default on the ex-date, for dates requested. Note: The prices used in the total return calculations are adjusted for special cash dividends (i.e. special cash dividends are not being reinvested on the ex-date). Assumes reinvestment of dividends. Post total shareholder return since spinoff on January 27, 2012. Pinnacle total shareholder return since IPO on March 28, 2013. 2) 3) 347% 307% 284% 226%218% 165%158% 127% 108% Total Shareholder Return (1) – Last Ten Years
Appendix
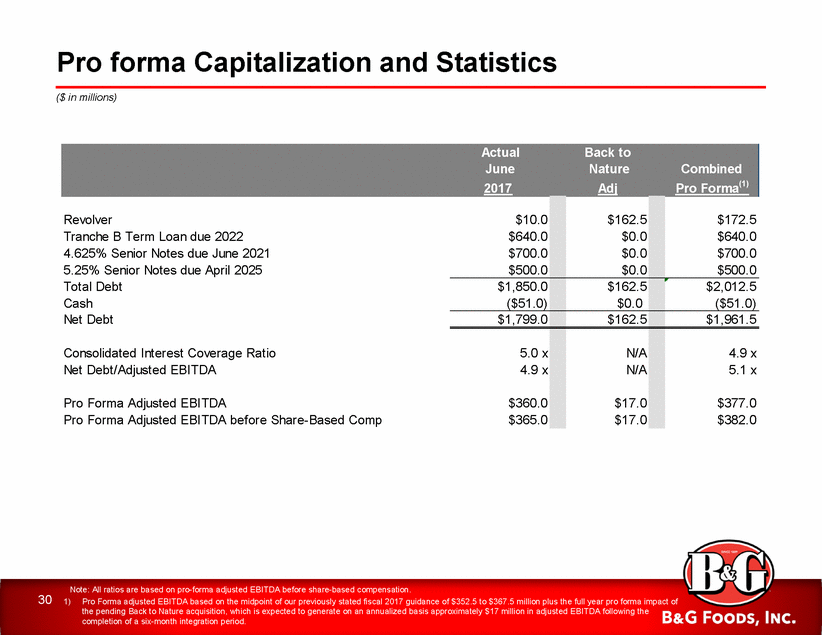
Pro forma Capitalization and Statistics ($ in millions) Note: All ratios are based on pro-forma adjusted EBITDA before share-based compensation. 301)Pro Forma adjusted EBITDA based on the midpoint of our previously stated fiscal 2017 guidance of $352.5 to $367.5 million plus the full year pro forma impact of the pending Back to Nature acquisition, which is expected to generate on an annualized basis approximately $17 million in adjusted EBITDA following the completion of a six-month integration period. Actual Back to June Nature Combined 2017 Ad j Pro Forma(1) Revolver Tranche B Term Loan due 2022 4.625% Senior Notes due June 2021 5.25% Senior Notes due April 2025 Total Debt Cash Net Debt Consolidated Interest Coverage Ratio Net Debt/Adjusted EBITDA Pro Forma Adjusted EBITDA Pro Forma Adjusted EBITDA before Share-Based Comp $10.0 $640.0 $700.0 $500.0 $162.5 $0.0 $0.0 $0.0 $172.5 $640.0 $700.0 $500.0 $1,850.0 ($51.0) $162.5 $0.0 $2,012.5 ($51.0) $1,799.0 $162.5 $1,961.5 5.0 x 4.9 x $360.0 $365.0 N/A N/A $17.0 $17.0 4.9 x 5.1 x $377.0 $382.0
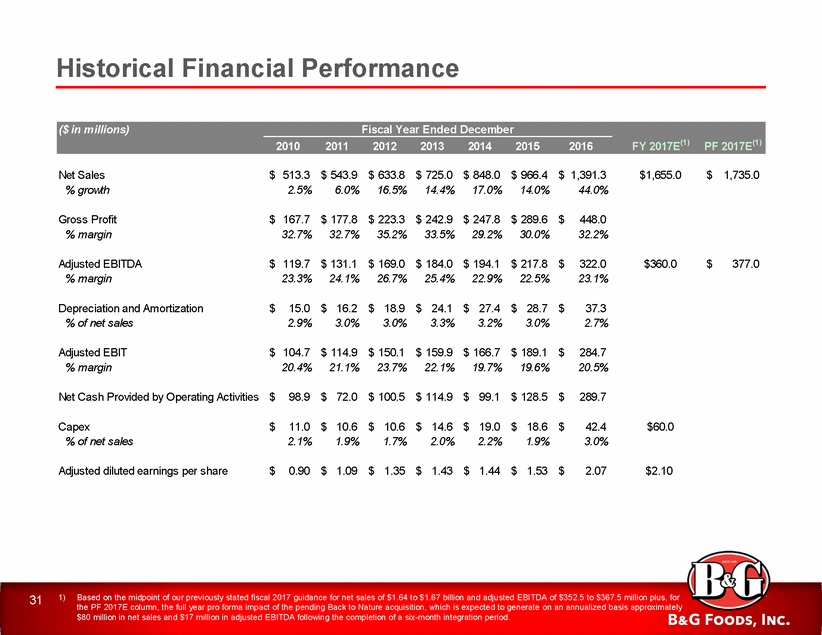
Historical Financial Performance Net Sales % growth $ 513.3 2.5% $ 543.9 6.0% $ 633.8 16.5% $ 725.0 14.4% $ 848.0 17.0% $ 966.4 14.0% $ 1,391.3 44.0% $1,655.0 $ 1,735.0 Gross Profit % margin $ 167.7 32.7% $ 177.8 32.7% $ 223.3 35.2% $ 242.9 33.5% $ 247.8 29.2% $ 289.6 30.0% $ 448.0 32.2% Adjusted EBITDA % margin $ 119.7 23.3% $ 131.1 24.1% $ 169.0 26.7% $ 184.0 25.4% $ 194.1 22.9% $ 217.8 22.5% $ 322.0 23.1% $360.0 $ 377.0 Depreciation and Amortization % of net sales $ 15.0 2.9% $ 16.2 3.0% $ 18.9 3.0% $ 24.1 3.3% $ 27.4 3.2% $ 28.7 3.0% $ 37.3 2.7% Adjusted EBIT % margin $ 104.7 20.4% $ 114.9 21.1% $ 150.1 23.7% $ 159.9 22.1% $ 166.7 19.7% $ 189.1 19.6% $ 284.7 20.5% Net Cash Provided by Operating Activities $ 98.9 $ 72.0 $ 100.5 $ 114.9 $ 99.1 $ 128.5 $ 289.7 Capex % of net sales $ 11.0 2.1% $ 10.6 1.9% $ 10.6 1.7% $ 14.6 2.0% $ 19.0 2.2% $ 18.6 1.9% $ 42.4 3.0% $60.0 Adjusted diluted earnings per share $ 0.90 $ 1.09 $ 1.35 $ 1.43 $ 1.44 $ 1.53 $ 2.07 $2.10 1)Based on the midpoint of our previously stated fiscal 2017 guidance for net sales of $1.64 to $1.67 billion and adjusted EBITDA of $352.5 to $367.5 million plus, for the PF 2017E column, the full year pro forma impact of the pending Back to Nature acquisition, which is expected to generate on an annualized basis approximately $80 million in net sales and $17 million in adjusted EBITDA following the completion of a six-month integration period. 31 ($ in millions) Fiscal Year Ended December 2010 2011 2012 2013 2014 2015 2016 FY 2017E(1) PF 2017E(1)
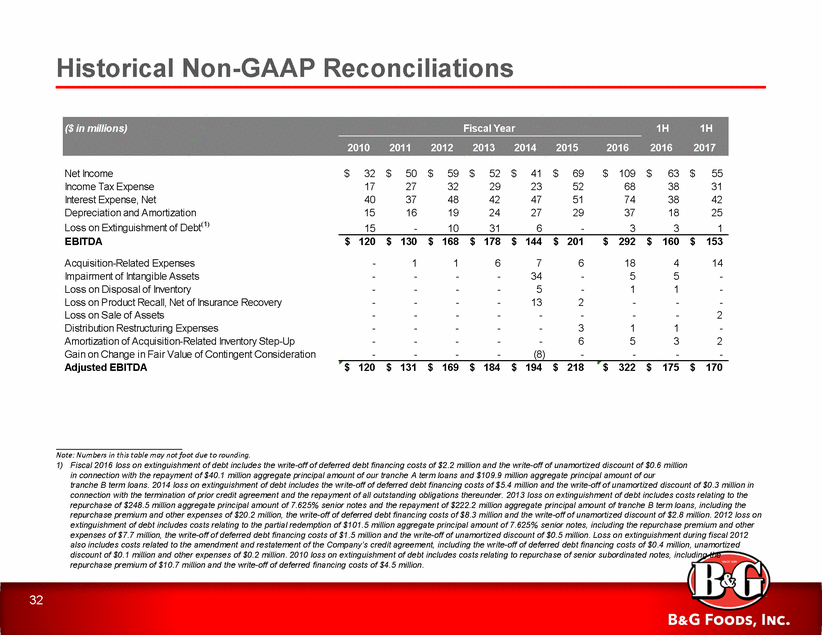
Historical Non-GAAP Reconciliations Net Income Income Tax Expense Interest Expense, Net Depreciation and Amortization Loss on Extinguishment of Debt(1) EBITDA $ 32 17 40 15 15 $ 50 27 37 16 - $ 59 32 48 19 10 $ 52 29 42 24 31 $ 41 23 47 27 6 $ 69 52 51 29 - $ 109 68 74 37 3 $ 63 38 38 18 3 $ 55 31 42 25 1 $ 120 $ 130 $ 168 $ 178 $ 144 $ 201 $ 292 $ 160 $ 153 Acquisition-Related Expenses Impairment of Intangible Assets Loss on Disposal of Inventory Loss on Product Recall, Net of Insurance Recovery Loss on Sale of Assets Distribution Restructuring Expenses Amortization of Acquisition-Related Inventory Step-Up Gain on Change in Fair Value of Contingent Consideration Adjusted EBITDA - - - - - - - - 1 - - - - - - - 1 - - - - - - - 6 - - - - - - - 7 34 5 13 - - - (8) 6 - - 2 - 3 6 - 18 5 1 - - 1 5 - 4 5 1 - - 1 3 - 14 - - - 2 - 2 - $ 120 $ 131 $ 169 $ 184 $ 194 $ 218 $ 322 $ 175 $ 170 Note: Numbers in this table may not foot due to rounding. 1) Fiscal 2016 loss on extinguishment of debt includes the write-off of deferred debt financing costs of $2.2 million and the write-off of unamortized discount of $0.6 million in connection with the repayment of $40.1 million aggregate principal amount of our tranche A term loans and $109.9 million aggregate principal amount of our tranche B term loans. 2014 loss on extinguishment of debt includes the write-off of deferred debt financing costs of $5.4 million and the write-off of unamortized discount of $0.3 million in connection with the termination of prior credit agreement and the repayment of all outstanding obligations thereunder. 2013 loss on extinguishment of debt includes costs relating to the repurchase of $248.5 million aggregate principal amount of 7.625% senior notes and the repayment of $222.2 million aggregate principal amount of tranche B term loans, including the repurchase premium and other expenses of $20.2 million, the write-off of deferred debt financing costs of $8.3 million and the write-off of unamortized discount of $2.8 million. 2012 loss on extinguishment of debt includes costs relating to the partial redemption of $101.5 million aggregate principal amount of 7.625% senior notes, including the repurchase premium and other expenses of $7.7 million, the write-off of deferred debt financing costs of $1.5 million and the write-off of unamortized discount of $0.5 million. Loss on extinguishment during fiscal 2012 also includes costs related to the amendment and restatement of the Company’s credit agreement, including the write-off of deferred debt financing costs of $0.4 million, unamortized discount of $0.1 million and other expenses of $0.2 million. 2010 loss on extinguishment of debt includes costs relating to repurchase of senior subordinated notes, including the repurchase premium of $10.7 million and the write-off of deferred financing costs of $4.5 million. 32 ($ in millions) Fiscal Year 1H 1H 2010 2011 2012 2013 2014 2015 2016 2016 2017
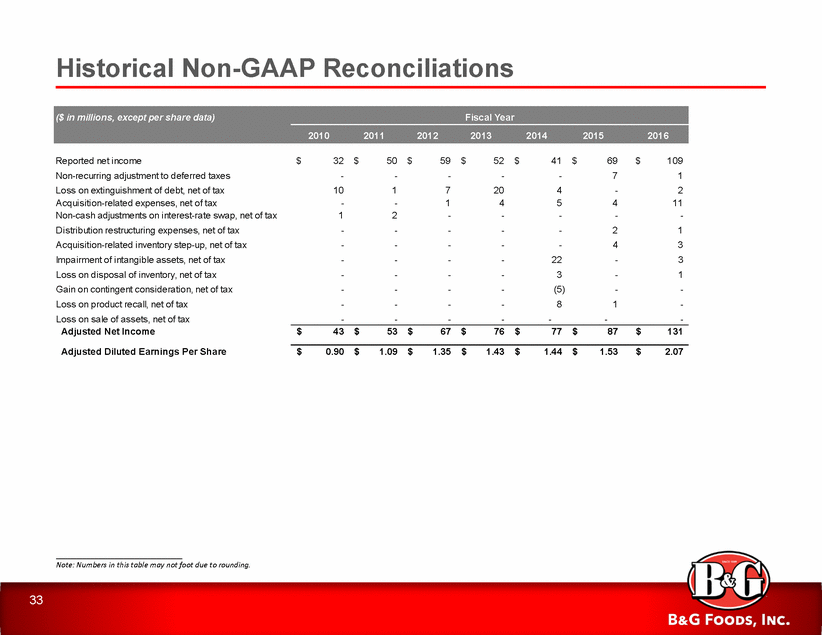
Historical Non-GAAP Reconciliations Reported net income Non-recurring adjustment to deferred taxes Loss on extinguishment of debt, net of tax Acquisition-related expenses, net of tax Non-cash adjustments on interest-rate swap, net of tax Distribution restructuring expenses, net of tax Acquisition-related inventory step-up, net of tax Impairment of intangible assets, net of tax Loss on disposal of inventory, net of tax Gain on contingent consideration, net of tax Loss on product recall, net of tax Loss on sale of assets, net of tax Adjusted Net Income $ 32 - 10 - 1 - - - - - - - $ 50 - 1 - 2 - - - - - - - $ 59 - 7 1 - - - - - - - - $ 52 - 20 4 - - - - - - - - $ 41 - 4 5 - - - 22 3 (5) 8 - $ 69 7 - 4 - 2 4 - - - 1 - $ 109 1 2 11 - 1 3 3 1 - - - $ 43 $ 53 $ 67 $ 76 $ 77 $ 87 $ 131 Adjusted Diluted Earnings Per Share $ 0.90 $ 1.09 $ 1.35 $ 1.43 $ 1.44 $ 1.53 $ 2.07 Note: Numbers in this table may not foot due to rounding. 33 ($ in millions, except per share data) Fiscal Year 2010 2011 2012 2013 2014 2015 2016
Barclays Global Consumer Staples Conference 9.6.2017 | InterContinental Boston
