Attached files
| file | filename |
|---|---|
| EX-21.1 - EX-21.1 SUBSIDIARIES OF THE COMPANY - B&G Foods, Inc. | a2202308zex-21_1.htm |
| EX-23.1 - EX-23.1 CONSENT OF KPMG LLP - B&G Foods, Inc. | a2202308zex-23_1.htm |
| EX-31.1 - EX-31.1 SECTION 302 CEO CERTIFICATION - B&G Foods, Inc. | a2202308zex-31_1.htm |
| EX-31.2 - EX-31.2 SECTION 302 CFO CERTIFICATION - B&G Foods, Inc. | a2202308zex-31_2.htm |
| EX-12.1 - EX-12.1-COMPUTATION OF RATIO EARNINGS - B&G Foods, Inc. | a2202308zex-12_1.htm |
| EX-10.12 - EX-10.12 EMPLOYMENT AGREEMENT OF WILLIAM H. WRIGHT - B&G Foods, Inc. | a2202308zex-10_12.htm |
| EX-32.1 - EX-32.1 SECTION 906 CEO/CFO CERTIFICATION - B&G Foods, Inc. | a2202308zex-32_1.htm |
As filed with the Securities and Exchange Commission on March 1, 2011
UNITED STATES
SECURITIES AND EXCHANGE COMMISSION
Washington, D.C. 20549
FORM 10-K
| (Mark one) | ||
ý |
Annual Report Pursuant to Section 13 or 15(d) of the Securities Exchange Act of 1934 |
|
For the fiscal year ended January 1, 2011 |
||
or |
||
o |
Transition Report Pursuant to Section 13 or 15(d) of the Securities Exchange Act of 1934 |
|
For the transition period from to . |
||
Commission file number 001-32316
B&G FOODS, INC.
(Exact name of Registrant as specified in its charter)
| Delaware (State or other jurisdiction of incorporation or organization) |
13-3918742 (I.R.S. Employer Identification No.) |
|
Four Gatehall Drive, Suite 110, Parsippany, New Jersey (Address of principal executive offices) |
07054 (Zip Code) |
Registrant's telephone number, including area code: (973) 401-6500
Securities registered pursuant to Section 12(b) of the Act:
| Title of each class | Name of exchange on which registered | |
| Common Stock, par value $0.01 per share | New York Stock Exchange |
Securities registered pursuant to Section 12(g) of the Act: None
Indicate by check mark if the registrant is a well-known seasoned issuer, as defined in Rule 405 of the Securities Act. Yes o No ý
Indicate by check mark if the registrant is not required to file reports pursuant to Section 13 or Section 15(d) of the Act. Yes o No ý
Indicate by check mark whether the registrant: (1) has filed all reports required to be filed by Section 13 or 15(d) of the Securities Exchange Act of 1934 during the preceding 12 months (or for such shorter period that the registrant was required to file such reports) and (2) has been subject to such filing requirements for the past 90 days. Yes ý No o
Indicate by check mark whether the registrant has submitted electronically and posted on its corporate Web site, if any, every Interactive Data File required to be submitted and posted pursuant to Rule 405 of Regulation S-T during the preceding 12 months (or for such shorter period that the registrant was required to submit and post such files). Yes o No o
Indicate by check mark if disclosure of delinquent filers pursuant to Item 405 of Regulation S-K is not contained herein, and will not be contained, to the best of the registrant's knowledge, in definitive proxy or information statements incorporated by reference in Part III of this Form 10-K or any amendment to this Form 10-K. o
Indicate by check mark whether the registrant is a large accelerated filer, an accelerated filer, a non-accelerated filer or a smaller reporting company. See the definitions of "large accelerated filer," "accelerated filer," and "smaller reporting company" in Rule 12b-2 of the Exchange Act. (Check one):
| Large accelerated filer o | Accelerated filer ý | Non-accelerated filer o (Do not check if a smaller reporting company) |
Smaller reporting company o |
Indicate by check mark whether the registrant is a shell company (as defined in Rule 12b-2 of the Act). Yes o No ý
The aggregate market value of the registrant's outstanding shares of common stock held by non-affiliates of the registrant (assuming for these purposes, but without conceding, that all executive officers and directors are affiliates of the registrant) as of July 2, 2010, the last business day of the registrant's most recently completed second fiscal quarter, was $490,741,778 (based on the $10.46 per share closing price of the registrant's common stock on that date as reported on the New York Stock Exchange).
As of February 28, 2011, the registrant had 47,900,237 shares of common stock outstanding.
DOCUMENTS INCORPORATED BY REFERENCE
Selected designated portions of the registrant's definitive proxy statement to be filed on or before May 2, 2011 in connection with the registrant's 2011 annual meeting of stockholders are incorporated by reference into Part III of this annual report.
B&G FOODS, INC.
ANNUAL REPORT ON FORM 10-K
FOR THE FISCAL YEAR ENDED JANUARY 1, 2011
TABLE OF CONTENTS
Overview
The terms "B&G Foods," "our," "we" and "us," as used in this report, refer to B&G Foods, Inc. and its wholly owned subsidiaries, except where it is clear that the term refers only to the parent company. Throughout this report, we refer to our fiscal years ended December 30, 2006, December 29, 2007, January 3, 2009, January 2, 2010 and January 1, 2011 as "fiscal 2006," "fiscal 2007," "fiscal 2008," "fiscal 2009,"and "fiscal 2010" respectively.
B&G Foods manufactures, sells and distributes a diverse portfolio of branded, high quality, shelf-stable food products, many of which have leading regional or national market shares. In general, we position our branded products to appeal to the consumer desiring a high quality and reasonably priced product. We complement our branded product retail sales with institutional and food service sales and limited private label sales.
History
B&G Foods, including our subsidiaries and predecessors, has been in business for over 120 years. We were incorporated in Delaware on November 25, 1996 under the name B Companies Holdings Corp. On August 11, 1997, we changed our name to B&G Foods Holdings Corp. On October 14, 2004, B&G Foods, Inc., then our wholly owned subsidiary, was merged with and into us and we were renamed B&G Foods, Inc.
The table below includes some of the significant events in our recent history:
Date
|
Significant Event | |
|---|---|---|
| December 1996 | Acquisition of the Bloch & Guggenheimer and Burns and Ricker® brands from Specialty Foods Corp. | |
June 1997 |
Acquisition of the Regina, Wright's, Brer Rabbit and Vermont Maid brands from Nabisco, Inc. |
|
August 1997 |
Acquisition of the Trappey's brand from E. Mcllhenny's Son Corporation. |
|
July 1998 |
Acquisition of the Maple Grove Farms of Vermont brand from certain individuals. |
|
February 1999 |
Acquisition of the Polaner and related brands from International Home Foods, Inc. and M. Polaner, Inc. |
|
March 1999 |
Acquisition of the Underwood, B&M, Ac'cent, Sa-són Ac'cent, Las Palmas and Joan of Arc brands from The Pillsbury Company and related entities. |
|
June 2000 |
Entry into an agreement with Emeril's Food of Love Productions, LLC (EFLP) pursuant to which we and EFLP agreed to create a signature line of consumer packaged foods products which are marketed under the label Emeril's. |
|
January 2001 |
Sale of the Burns & Ricker® brand to Nonni's Food Company, Inc. |
|
August 2003 |
Acquisition of the Ortega brand from Nestlé Prepared Foods Company. |
|
October 2004 |
Completion of our initial public offering of Enhanced Income Securities (EISs). |
|
December 2005 |
Acquisition of the Ortega food service dispensing pouch and dipping cup cheese sauce businesses from Nestlé USA, Inc. |
|
January 2006 |
Acquisition of the Grandma's molasses brand from Mott's LLP, a Cadbury Schweppes Americas Beverages company. |
|
February 2007 |
Acquisition of the Cream of Wheat and Cream of Rice brands from Kraft Foods Global, Inc. |
|
May 2007 |
Completion of our initial public offering of our common stock as a separately traded security. |
|
November 2010 |
Acquisition of the Don Pepino and Sclafani brands from Violet Packing LLC, referred to as the "Don Pepino acquisition" in the remainder of this document. |
1
Products and Markets
The following is a brief description of our brands and product lines:
The Ortega brand has been in existence since 1897 and its products span the shelf-stable Mexican food segment including taco shells, tortillas, seasonings, dinner kits, taco sauces, peppers, refried beans, salsas and related food products. We continue to expand our product offerings, with new products such as the Ortega whole grain corn taco shells and Ortega reduced sodium taco seasoning.
The Maple Grove Farms of Vermont brand, which originated in 1915, is one of the leading brands of pure maple syrup sold in the United States. Other products under the Maple Grove Farms of Vermont label include a line of gourmet salad dressings, sugar free syrups, marinades, fruit syrups, confections, pancake mixes and organic products.
The Cream of Wheat brand was introduced in 1893 and is among the leading brands and one of the most trusted and widely recognized brands of hot cereals sold in the United States. Cream of Wheat is available in original 10-minute, 21/2 minute and one-minute versions, and also in instant packets of original and other flavors, including Cinnamon Swirl and Maple Brown Sugar. We also offer Cream of Rice, a rice-based hot cereal. Since acquiring Cream of Wheat in 2007, we have introduced a whole grain version of original Cream of Wheat, which provides consumers with a good source of fiber. In 2009, we introduced a "Healthy Grain" version of instant Cream of Wheat, which provides consumers with an excellent source of fiber and a good source of protein. Most recently during 2010, pursuant to a licensing agreement, we introduced Cream of Wheat Cinnabon®.
The Polaner brand was introduced in 1880 and is comprised of a broad array of fruit-based spreads as well as jarred wet spices such as chopped garlic and oregano. Polaner All Fruit is a leading national brand of fruit-juice sweetened fruit spread. The spreads are available in more than a dozen flavors. Polaner Sugar Free preserves are the second leading brand of sugar free preserves nationally. Beginning in 2009, we reformulated Polaner All Fruit and Polaner Sugar Free to include 3 grams of fiber per tablespoon.
The Bloch & Guggenheimer (B&G) brand originated in 1889, and its pickle, pepper/pimentos and relish products are a leading brand in the New York metropolitan area. This line consists of shelf-stable pickles, peppers, relishes, olives and other related specialty items.
The Las Palmas brand originated in 1922 and primarily includes authentic Mexican enchilada sauce, chili sauce and various pepper products.
The B&M brand was introduced in 1927 and is the original brand of brick-oven baked beans and remains one of the very few authentic baked beans. The B&M line includes a variety of baked beans and brown bread. The B&M brand currently has a leading market share in the New England region.
The Underwood brand's "Underwood Devil" logo, which was registered in 1870, is believed to be the oldest registered trademark still in use for a prepackaged food product in the United States. Underwood meat spreads, which were introduced in the late 1860s, include deviled ham, white-meat chicken, white-meat turkey, roast beef and liverwurst.
The Ac'cent brand was introduced in 1947 as an all-natural flavor enhancer for meat preparation and is generally used on beef, poultry, fish and vegetables. We believe that Ac'cent is positioned as a unique flavor enhancer that provides food with the "umami" flavor sensation.
The Emeril's brand was introduced in 2000 under a licensing agreement with celebrity chef Emeril Lagasse. We offer a line of pasta sauces, seasonings, cooking stocks, mustards, salsas, pepper sauces and cooking sprays under the Emeril's brand name.
The Trappey's brand, which was introduced in 1898, has a Louisiana heritage. Trappey's products fall into two major categories—high quality peppers and hot sauces, including Trappey's Red Devil.
2
The Don Pepino and Sclafani brands originated in 1955 and 1900, respectively, and primarily include pizza and spaghetti sauces, whole and crushed tomatoes and tomato puree.
The Grandma's brand of molasses, which was introduced in 1890, is the leading brand of premium-quality molasses sold in the United States. Grandma's molasses products are offered in two distinct styles: Grandma's Original Molasses and Grandma's Robust Molasses.
The Joan of Arc brand, which originated in 1895, includes a full range of canned beans including kidney, chili and other varieties of beans.
The Regina brand, which has been in existence since 1949, includes vinegars and cooking wines. Regina products are most commonly used in the preparation of salad dressings as well as in a variety of recipe applications, including sauces, marinades and soups.
The Wright's brand was introduced in 1895 and is an all-natural seasoning that reproduces the flavor and aroma of pit smoking in meats, chicken and fish. Wright's is offered in two flavors: Hickory and Mesquite.
The Brer Rabbit brand has been in existence since 1907 and currently offers mild and full-flavored molasses products and a blackstrap molasses product. Mild molasses is designed for table use and full-flavored molasses is typically used in baking, barbeque sauces and as a breakfast syrup.
The Sa-són brand was introduced in 1947 as a flavor enhancer used primarily for Puerto Rican and Hispanic food preparation. The product is generally used on beef, poultry, fish and vegetables. The brand's flavor enhancer is offered in four flavors: Original, Coriander and Achiote, Garlic and Onion, and Tomato. We also offer reduced sodium versions of Sa-són.
The Vermont Maid brand has been in existence since 1919 and we offer maple-flavored syrup under the brand name. Vermont Maid syrup is available in regular, sugar-free and sugar-free butter varieties.
Processed Food Industry
The processed food industry is one of the United States' largest industries. It is characterized by relatively stable sales growth, based largely on price and population increases. As costs have increased in recent years, price has gained significance as a factor in sales growth. As large food companies with a presence in a variety of branded product categories seek tighter focus within their businesses, they have shed brands or an entire presence in non-core categories. They have also sold smaller brands to increase focus on the larger brands within their portfolios.
In the past decade, the retail side of the food industry has seen a still on-going shift of sales to alternate food outlets such as supercenters, warehouse clubs, dollar stores and drug stores. This shift has caused consolidation of traditional grocery chains into larger entities, often spanning the country under varying banner names. Consolidation has increased the importance of having a leading number one or two brand within a category, be that position national or regional. A broad sales and distribution infrastructure has also become critical for food companies, allowing them to reach all outlets selling food to consumers and expanding their growth opportunities.
Sales, Marketing and Distribution.
Overview. We sell, market and distribute our products through a multiple-channel sales, marketing and distribution system to all major U.S. food channels, including sales and shipments to supermarkets, mass merchants, warehouse clubs, wholesalers, food service distributors and direct accounts, specialty food distributors, military commissaries and non-food outlets such as drug store chains and dollar stores.
3
We believe our established infrastructure in these channels allows us to distribute our products and any additional products from acquisitions cost-effectively. We sell our products primarily through broker sales networks to supermarket chains, food service outlets, mass merchants, warehouse clubs, non-food outlets and specialty food distributors. The broker sales network handles the sale of our products at the customer level.
Sales. Our sales organization is aligned by distribution channels and consists of regional sales managers, key account managers and sales persons. Regional sales managers sell our products nationwide through national and regional food brokers, with separate organizations focusing on food service, grocery chain accounts and special markets. Our sales managers coordinate our broker sales efforts, make key account calls with buyers or distributors and supervise broker retail coverage of the products at the store level.
Our sales strategy is centered on individual brands. We allocate promotional spending for each of our brands and our regional sales managers coordinate promotions with customers. Additionally, our marketing department works in conjunction with the sales department to coordinate special account activities and marketing support, such as couponing, public relations and media advertising.
We have a national sales force that is capable of supporting our current business as well as potential new acquisitions. Historically, our sales force has typically been able to integrate newly acquired brands within 30 days of the acquisition date.
Marketing. Our marketing organization is aligned by brand and is responsible for the strategic planning for each of our brands. We focus on deploying promotional dollars where the spending will have the greatest impact on sales. Marketing and trade spending support, on a national basis, typically consists of advertising trade promotions, coupons and cross-promotions with supporting products. Radio and internet advertising supplement this activity.
Distribution. We distribute our products through a multiple-channel system that covers every class of customer nationwide. We believe our distribution system has sufficient capacity to accommodate incremental product volume in a cost-effective manner. See Item 2, "Properties" for a listing of our distribution centers and warehouses.
Customers
Our top ten customers accounted for approximately 50.6% of our net sales and 53.2% of our end of the year receivables for fiscal 2010. Other than Wal-Mart, which accounted for 16.2% of our fiscal 2010 net sales, no single customer accounted for 10.0% or more of our fiscal 2010 net sales. Other than Wal-Mart, which accounted for 15.0% of our receivables as of the end of fiscal 2010, no single customer accounted for more than 10.0% of our receivables as of the end of fiscal 2010. During each of the last three fiscal years our net sales to foreign countries represented less than 1.0% of our total net sales. Our foreign sales are primarily to customers in Canada.
Seasonality
Sales of a number of our products tend to be seasonal and may be influenced by holidays, changes in seasons or other annual events. In the aggregate, however, sales of our products are not heavily weighted to any particular quarter due to the offsetting nature of demands for our diversified product portfolio. Sales during the fourth quarter are generally higher than those of the preceding three quarters.
We purchase most of the produce used to make our shelf-stable pickles, relishes, peppers, tomatoes and other related specialty items during the months of July through October, and we
4
purchase substantially all of our maple syrup requirements during the months of April through August. Consequently, our liquidity needs are greatest during these periods.
Competition
We face competition in each of our product lines. Numerous brands and products compete for shelf space and sales, with competition based primarily on product quality, convenience, price, trade promotion, consumer promotion, brand recognition and loyalty, customer service, advertising and other activities and the ability to identify and satisfy emerging consumer preferences. We compete with numerous companies of varying sizes, including divisions or subsidiaries of larger companies. Many of these competitors have multiple product lines, substantially greater financial and other resources and may have lower fixed costs and/or be substantially less leveraged than we are. Our ability to grow our business could be impacted by the relative effectiveness of, and competitive response to, our product initiatives, product innovation, advertising and promotional activities. In addition, from time to time, we experience margin pressure in certain markets as a result of competitors' pricing practices.
Ortega products compete primarily with the Old El Paso® and Taco Bell® brands. Cream of Wheat products compete primarily with the Quaker® hot cereal brand. Our most significant competitors for our pickle and pepper products are Vlasic® and Mt. Olive® branded products. Smucker's® is the main competitor for our fruit spread products marketed under the Polaner label. Our Maple Grove Farms of Vermont pure maple syrup competes directly with the SpringTree® brand in the pure maple syrup category. Our B&M and Joan of Arc products compete primarily with Bush's® brand products. Our Vermont Maid syrup products have a number of competitors in the general pancake syrup market, including Aunt Jemima®, Mrs. Butterworth's® and Log Cabin®.
In addition, our products compete not only against other brands in their respective product categories, but also against products in similar or related product categories. For example, our shelf-stable pickles compete not only with other brands of shelf-stable pickles, but also with products found in the refrigerated sections of grocery stores, and all our brands compete against private label products to varying degrees.
Raw Materials
We purchase raw materials, including agricultural products, meat, poultry, ingredients and packaging materials, from growers, commodity processors, other food companies and packaging suppliers located in U.S. and foreign locations. Our principal raw materials include maple syrup, wheat, beans, tomatoes, fruits, peppers, cucumbers, meat, poultry, sugar and corn sweeteners. We purchase our agricultural raw materials in bulk or pursuant to short-term supply contracts. We purchase most of our agricultural products between April 1 and October 31. We also use packaging materials, particularly glass jars, cans and plastic containers. The profitability of our business relies in substantial part on the prices we and our co-packers pay for these raw materials, which can fluctuate due to a number of factors, including changes in crop size, national, state and local government sponsored agricultural programs, export demand, currency exchange rates, natural disasters, weather conditions during the growing and harvesting seasons, general growing conditions, the effect of insects, plant diseases and fungi, and glass, metal and plastic prices.
Fluctuations in commodity prices can lead to retail price volatility and intensive price competition, and can influence consumer and trade buying patterns. The cost of raw materials can increase from time to time significantly and unexpectedly. We attempt to manage cost inflation risks by locking in prices through short-term supply contracts and advance commodities purchase agreements and by implementing cost saving measures. We also attempt to offset rising input costs by raising sales prices to our customers. However, increases in the prices we charge our customers may lag behind rising input costs. Competitive pressures also may limit our ability to quickly raise prices in response to rising costs.
5
To the extent we are unable to avoid or offset the impact of cost increases by locking in our costs, implementing cost saving measures or increasing prices to our customers, our operating results could be materially adversely affected. In addition, should input costs begin to decline, customers may look for price reductions in situations where we have locked into purchases at higher costs.
For a discussion of recent trends and uncertainties associated with our raw materials, see "Management's Discussion and Analysis of Financial Condition and Results of Operations—General—Fluctuations in Commodity Prices and Production and Distribution Costs."
Production
Manufacturing. We operate six manufacturing facilities for our products. See Item 2, "Properties" for a listing of our manufacturing facilities.
Co-Packing Arrangements. In addition to our own manufacturing facilities, we source a significant portion of our products under "co-packing" agreements, a common industry practice in which manufacturing is outsourced to other companies. We regularly evaluate our co-packing arrangements to ensure the most cost-effective manufacturing of our products and to utilize company-owned manufacturing facilities most effectively. Third parties located in U.S. and foreign locations produce Regina and Joan of Arc brand products and certain B&G, Cream of Wheat, Emeril's, Las Palmas and Ortega brand products under co-packing agreements or purchase orders. Each of our co-packers produces products for other companies as well. We believe that there are alternative sources of co-packing production readily available for the majority of our products, although we may experience short-term disturbances in our operations if we are required to change our co-packing arrangements.
Trademarks and Licensing Agreements
As of February 14, 2011 we own 115 trademarks that are registered in the United States, 44 trademarks that are registered with certain U.S. states and Puerto Rico, and 339 trademarks that are registered in foreign countries. In addition, we have 8 trademark applications pending in the United States and foreign countries. Examples of our trademarks and registered trademarks include Ac'cent, B&G, B&G Sandwich Toppers, B&M, Brer Rabbit, Cozy Cottage, Cream of Rice, Cream of Wheat, Don Pepino, Grandma's, Joan of Arc, Las Palmas, Maple Grove Farms of Vermont, Ortega, Polaner, Regina, Sa-són, Sclafani, Trappey's, Underwood, Vermont Maid and Wright's. We consider our trademarks, in the aggregate, to be of special significance to our business. We are not aware of any circumstances that would negatively impact our trademarks. Our credit facility is secured by substantially all of our assets (other than our real property), including our rights to our intellectual property.
In June 2000 we entered into a license agreement with Emeril's Food of Love Productions, L.L.C. (EFLP). This license agreement grants us an exclusive license to use the intellectual property owned by the licensor relating to Mr. Lagasse, including the name "Emeril Lagasse" and pictures, photographs and other personality material, in connection with the manufacturing, marketing and distribution of dry seasoning, liquid seasoning, condiments, sauces, dressings and certain other products through retail channels in the United States, the Caribbean and Canada. We also have the right of first negotiation with respect to other shelf-stable grocery products. Under the license agreement, the licensor owns all of the recipes that it provides to us and all of our Emeril's brand products and related marketing materials are subject to the prior approval of the licensor, which approval may not be unreasonably withheld. In addition, we are prohibited from entering into similar arrangements with other chefs or celebrities in connection with any of the products covered by the agreement with the licensor.
The license agreement has been extended through May 2011 and is subject to extension and renewal at our option for additional one-year periods if we meet specified annual net sales results. We expect that we will meet the specified annual net sales results required in order to renew the agreement through May 2012. Under the license agreement, we are, among other things, obligated to
6
introduce and market new products in each year of the license agreement and to pay the licensor royalties based on annual net sales of our Emeril's brand products. The license agreement may be terminated by the licensor if we are in breach or default of any of our material obligations thereunder. We have also agreed to indemnify the licensor with respect to claims under the license agreement, including claims relating to any alleged unauthorized use of any mark, personality or recipe by us in connection with the products in the Emeril's line of products.
In February 2008, Martha Stewart Living Omnimedia, Inc. (MSLO) announced that it was acquiring certain assets related to the business of Emeril Lagasse. In connection with the closing of that transaction and with our consent, EFLP assigned its rights under the license agreement to a subsidiary of MSLO.
Employees and Labor Relations
As of January 1, 2011, our workforce consisted of 749 employees. Of that total, 594 employees were engaged in manufacturing, 41 were engaged in marketing and sales, 89 were engaged in warehouse and distribution and 25 were engaged in administration. Approximately 354 of our 749 employees, as of January 1, 2011, were covered by collective bargaining agreements. Approximately 53 of our employees at our Roseland, New Jersey facility were covered by a collective bargaining agreement with the International Brotherhood of Teamsters, Chauffeurs, Warehousemen & Helpers of America (Local No. 863), scheduled to expire on March 31, 2014. Approximately 128 of our employees at our Portland, Maine facility were covered by a collective bargaining agreement with the Bakery, Confectionery, Tobacco Workers and Grain Millers International Union (AFL-CIO, Local No. 334), scheduled to expire on April 28, 2012. Approximately 173 of our employees at our Stoughton, Wisconsin facility were covered by a collective bargaining agreement with the Drivers, Salesmen, Warehousemen, Milk Processors, Cannery, Dairy Employees and Helpers Union (Local No. 695), scheduled to expire on March 31, 2011. While we believe that our relations with our union employees are in general good, we cannot assure you that we will be able to negotiate a new collective bargaining agreement for Stoughton on terms satisfactory to us, or at all, and without production interruptions, including labor stoppages. If prior to the expiration of the Stoughton collective bargaining agreement or prior to the expiration of any of our other existing collective bargaining agreements we are unable to reach new agreements without union action or any such new agreements are not on terms satisfactory to us, our business, consolidated financial condition, results of operations or liquidity could be materially and adversely affected. At this time, however, management does not expect that the outcome of the Stoughton negotiations will have a material adverse impact on our business, financial condition or results of operations.
Government Regulation
As a manufacturer and marketer of food products, our operations are subject to extensive regulation by the United States Food and Drug Administration (FDA), the United States Department of Agriculture (USDA), the United States Department of Labor and other federal, state and local authorities regarding the processing, packaging, storage, distribution and labeling of our products and the health and safety of our employees. Our processing facilities and products are subject to periodic inspection by federal, state and local authorities. In addition, our meat processing operation in Portland, Maine is subject to daily inspection by the USDA.
We are subject to the Food, Drug and Cosmetic Act and the regulations promulgated thereunder by the FDA. This comprehensive regulatory program governs, among other things, the manufacturing, composition and ingredients, labeling, packaging and safety of food. For example, the FDA regulates manufacturing practices for foods through its current "good manufacturing practices" regulations and specifies the recipes for certain foods. In addition, the Nutrition Labeling and Education Act of 1990
7
prescribes the format and content of certain information required to appear on the labels of food products.
We are also subject to the U.S. Bio-Terrorism Act of 2002 which imposes on us import and export regulations. Under the Bio-Terrorism Act, among other things, we are required to provide specific information about the food products we ship into the United States and to register our manufacturing, warehouse and distribution facilities with the FDA.
We believe that we are currently in substantial compliance with all material governmental laws and regulations and maintain all material permits and licenses relating to our operations. Nevertheless, there can be no assurance that we are in full compliance with all such laws and regulations or that we will be able to comply with any future laws and regulations in a cost-effective manner. Failure by us to comply with applicable laws and regulations could subject us to civil remedies, including fines, injunctions, recalls or seizures, as well as potential criminal sanctions, all of which could have a material adverse effect on our business, consolidated financial condition, results of operations or liquidity.
Environmental Matters
We are subject to environmental laws and regulations in the normal course of business. We have not made any material expenditures during the last three fiscal years in order to comply with environmental laws or regulations. Based on our experience to date, we believe that the future cost of compliance with existing environmental laws and regulations (and liability for known environmental conditions) will not have a material adverse effect on our business, consolidated financial condition, results of operations or liquidity. However, we cannot predict what environmental laws or regulations will be enacted in the future or how existing or future laws or regulations will be enforced, administered or interpreted, nor can we predict the amount of future expenditures that may be required in order to comply with such environmental laws or regulations or to respond to such environmental claims.
Available Information
Under the Securities Exchange Act of 1934, as amended, we are required to file with or furnish to the SEC annual, quarterly and current reports, proxy and information statements and other information. You may read and copy any document we file with the SEC at the SEC's Public Reference Room at 100 F Street, NE, Washington, D.C. 20549. Please call the SEC at 1-800-SEC-0330 for further information about the public reference room. The SEC maintains an internet site at http://www.sec.gov that contains reports, proxy and information statements, and other information regarding issuers that file electronically with the SEC. We file electronically with the SEC.
We make available, free of charge, through the investor relations section of our web site, our reports on Forms 10-K, 10-Q and 8-K, and amendments to those reports, filed with or furnished to the SEC as soon as reasonably practicable after they are filed with the SEC. The address for the investor relations section of our web site is http://ir.bgfoods.com.
The full text of the charters for each of the audit, compensation and nominating and governance committees of our board of directors as well as our Code of Business Conduct and Ethics is available at the investor relations section of our web site, http://ir.bgfoods.com. Our Code of Business Conduct and Ethics applies to all of our employees, officers and directors, including our chief executive officer and our chief financial officer and principal accounting officer. We intend to disclose any amendment to, or waiver from, a provision of the Code of Business Conduct and Ethics that applies to our chief executive officer or chief financial officer and principal accounting officer in the investor relations section of our web site.
8
The information contained on our web site is not part of, and is not incorporated in, this or any other report we file with or furnish to the SEC.
Any investment in our company will be subject to risks inherent to our business. Before making an investment decision, investors should carefully consider the risks described below together with all of the other information included in this report. The risks and uncertainties described below are not the only ones facing our company. Additional risks and uncertainties that we are not aware of or focused on or that we currently deem immaterial may also impair our business operations. This report is qualified in its entirety by these risk factors.
Any of the following risks could materially and adversely affect our business, consolidated financial condition, results of operations or liquidity. In that case, holders of our securities may lose all or part of their investment.
Risks Specific to Our Company
The packaged food industry is highly competitive.
The packaged food industry is highly competitive. Numerous brands and products, including private label products, compete for shelf space and sales, with competition based primarily on product quality, convenience, price, trade promotion, brand recognition and loyalty, customer service, effective consumer advertising and promotional activities and the ability to identify and satisfy emerging consumer preferences. We compete with a significant number of companies of varying sizes, including divisions or subsidiaries of larger companies. Many of these competitors have multiple product lines, substantially greater financial and other resources available to them and may have lower fixed costs and/or are substantially less leveraged than our company. If we are unable to continue to compete successfully with these companies or if competitive pressures or other factors cause our products to lose market share or result in significant price erosion, our business, consolidated financial condition, results of operations or liquidity could be materially and adversely affected.
We may be unable to maintain our profitability in the face of a consolidating retail environment.
Our largest customer, Wal-Mart, accounted for 16.2% of our fiscal 2010 net sales, and our ten largest customers together accounted for approximately 50.6% of our fiscal 2010 net sales. As the retail grocery trade continues to consolidate and our retail customers grow larger and become more sophisticated, our retail customers may demand lower pricing and increased promotional programs. Further, these customers are reducing their inventories and increasing their emphasis on products that hold either the number one or number two market position and private label products. If we fail to use our sales and marketing expertise to maintain our category leadership positions to respond to these trends, or if we lower our prices or increase promotional support of our products and are unable to increase the volume of our products sold, our profitability and financial condition may be adversely affected.
We are vulnerable to decreases in the supply and increases in the price of raw materials, fuel, labor, distribution and other costs, and we may not be able to offset increasing costs by increasing prices to our customers.
We purchase raw materials, including agricultural products, meat, poultry, ingredients and packaging materials, from growers, commodity processors, other food companies and packaging suppliers located in U.S. and foreign locations. Raw materials and other input costs, such as fuel, are subject to fluctuations in price attributable to a number of factors, including changes in crop size, federal and state agricultural programs, export demand, currency exchange rates, energy and fuel costs,
9
weather conditions during the growing and harvesting seasons, insects, plant diseases and fungi, and glass, metal and plastic prices. Fluctuations in commodity prices can lead to retail price volatility and intensive price competition, and can influence consumer and trade buying patterns. The cost of raw materials, fuel, labor and other costs related to our operations can increase from time to time significantly and unexpectedly. We attempt to manage cost inflation risks by locking in prices through short-term supply contracts and advance commodities purchase agreements and by implementing cost saving measures. We also attempt to offset rising input costs by raising sales prices to our customers. However, increases in the prices we charge our customers may lag behind rising input costs. Competitive pressures also may limit our ability to quickly raise prices in response to rising costs. To the extent we are unable to avoid or offset the impact of present and future cost increases by locking in our costs, implementing cost saving measures or increasing prices to our customers, our operating results could be materially adversely affected. In addition, should input costs begin to decline, customers may look for price reductions in situations where we have locked into purchases at higher costs.
We may be unable to offset any reduction in net sales in our mature food product categories through an increase in trade spending for these categories or an increase in net sales in other categories.
Most of our food product categories are mature and certain categories have experienced declining consumption rates from time to time. If consumption rates and sales in our mature food product categories decline, our revenue and operating income may be adversely affected, and we may not be able to offset this decrease in business with increased trade spending or an increase in sales or profitability of other products and product categories.
We may have difficulties integrating future acquisitions or identifying new acquisitions.
Part of our strategy has been to grow through acquisition. However, we may be unable to identify and consummate additional acquisitions or may be unable to successfully integrate and manage the product lines or businesses that we may acquire in the future. In addition, we may be unable to achieve a substantial portion of any anticipated cost savings from future acquisitions or other anticipated benefits in the timeframe we anticipate, or at all. In addition, any acquired product lines or businesses may require a greater amount of trade, promotional and capital spending than we anticipate. Historically, we have grown net sales for some but not all of the brands we have acquired. Acquisitions involve numerous risks, including difficulties in the assimilation of the operations, technologies, services and products of the acquired companies, personnel turnover and the diversion of management's attention from other business concerns. Any inability by us to integrate and manage any product lines or businesses we acquire in the future in a timely and efficient manner, any inability to achieve a substantial portion of any anticipated cost savings or other anticipated benefits from these acquisitions in the time frame we anticipate or any unanticipated required increases in trade, promotional or capital spending could adversely affect our business, consolidated financial condition, results of operations or liquidity. Moreover, future acquisitions by us could result in our incurring substantial additional indebtedness, being exposed to contingent liabilities or incurring the impairment of goodwill and other intangible assets, all of which could adversely affect our financial condition, results of operations and liquidity.
We have substantial indebtedness, which could restrict our ability to pay dividends and impact our financing options and liquidity position.
At February 28, 2011, we had total long-term indebtedness of $480.0 million, including $130.0 million principal amount of senior secured indebtedness and $350.0 million of senior unsecured indebtedness. Our ability to pay dividends is subject to contractual restrictions contained in the instruments governing our indebtedness. Although our credit facility and the first supplemental
10
indenture relating to our senior notes (which we refer to as the senior notes indenture) contain covenants that restrict our ability to incur debt, as long as we meet these covenants we will be able to incur additional indebtedness. The degree to which we are leveraged on a consolidated basis could have important consequences to the holders of our securities, including:
- •
- our ability in the future to obtain additional financing for working capital, capital expenditures or acquisitions may be
limited;
- •
- we may not be able to refinance our indebtedness on terms acceptable to us or at all;
- •
- a significant portion of our cash flow is likely to be dedicated to the payment of interest on our indebtedness, thereby
reducing funds available for future operations, capital expenditures, acquisitions and/or dividends on our common stock; and
- •
- we may be more vulnerable to economic downturns and be limited in our ability to withstand competitive pressures.
We are subject to restrictive debt covenants and other requirements related to our debt that limit our business flexibility by imposing operating and financial restrictions on our operations.
The agreements governing our indebtedness impose significant operating and financial restrictions on us. These restrictions prohibit or limit, among other things:
- •
- the incurrence of additional indebtedness and the issuance of certain preferred stock or redeemable capital stock;
- •
- the payment of dividends on, and purchase or redemption of, capital stock;
- •
- a number of restricted payments, including investments;
- •
- specified sales of assets;
- •
- specified transactions with affiliates;
- •
- the creation of certain types of liens;
- •
- consolidations, mergers and transfers of all or substantially all of our assets; and
- •
- entry into certain sale and leaseback transactions.
Our credit facility requires us to maintain specified financial ratios and satisfy financial condition tests, including, without limitation, the following: a maximum leverage ratio, a minimum interest coverage ratio and a maximum senior leverage ratio.
Our ability to comply with the ratios or tests may be affected by events beyond our control, including prevailing economic, financial and industry conditions. A breach of any of these covenants, or failure to meet or maintain ratios or tests could result in a default under our credit facility and/or our senior notes indenture. Certain events of default under our credit facility and our senior notes indenture would prohibit us from paying dividends on our common stock. In addition, upon the occurrence of an event of default under our credit facility or our senior notes indenture, the lenders could elect to declare all amounts outstanding under the credit facility and the senior notes, together with accrued interest, to be immediately due and payable. If we were unable to repay those amounts, the credit facility lenders could proceed against the security granted to them to secure that indebtedness. If the lenders accelerate the payment of the indebtedness, our assets may not be sufficient to repay in full this indebtedness and our other indebtedness.
11
To service our indebtedness, we require a significant amount of cash. Our ability to generate cash depends on many factors beyond our control.
Our ability to make interest payments on and to refinance our indebtedness, and to fund planned capital expenditures and potential acquisitions depends on our ability to generate cash flow from operations in the future. This ability, to a certain extent, is subject to general economic, financial, competitive, legislative, regulatory and other factors that are beyond our control.
A significant portion of our cash flow from operations is dedicated to servicing our debt requirements. In addition, in accordance with our current dividend policy we intend to continue distributing a significant portion of any remaining cash flow to our stockholders as dividends.
Our ability to continue to expand our business is, to a certain extent, dependent upon our ability to borrow funds under our credit facility and to obtain other third-party financing, including through the issuance and sale of additional debt or equity securities.
Financial market conditions may impede our access to, or increase the cost of, financing for acquisitions.
Any future financial market disruptions or tightening of the credit markets, may make it more difficult for us to obtain financing for acquisitions or increase the cost of obtaining financing. In addition, our borrowing costs can be affected by short and long-term debt ratings assigned by independent rating agencies that are based, in significant part, on our performance as measured by credit metrics such as interest coverage and leverage ratios. A decrease in these ratings could increase our cost of borrowing or make it more difficult for us to obtain financing.
Future disruptions in the credit markets or other factors, could impair our ability to refinance our debt upon terms acceptable to us or at all.
Our $25.0 million revolving credit facility and our $130.0 million of term loan borrowings mature in February 2013, and our $350.0 million of senior notes mature in January 2018. Our ability to raise debt or equity capital in the public or private markets in order to effect a refinancing of our debt at or prior to maturity could be impaired by various factors, including factors beyond our control. For example, in recent years U.S. credit markets experienced significant dislocations and liquidity disruptions that caused the spreads on prospective debt financings to widen considerably. These circumstances materially impacted liquidity in the debt markets, making financing terms for borrowers less attractive, and in certain cases resulted in the unavailability of certain types of debt financing. Any future uncertainty in the credit markets could negatively impact our ability to access additional debt financing or to refinance existing indebtedness on favorable terms, or at all. In addition, any future uncertainty in other financial markets in the U.S. could make it more difficult or costly for us to raise capital through the issuance of common stock or other equity securities. Any of these risks could impair our ability to fund our operations or limit our ability to expand our business or increase our interest expense, which could have a material adverse effect on our financial results.
If we are unable to refinance our indebtedness at or prior to maturity on commercially reasonable terms or at all, we would be forced to seek other alternatives, including:
- •
- sales of assets;
- •
- sales of equity; and
- •
- negotiations with our lenders or noteholders to restructure the applicable debt.
If we are forced to pursue any of the above options, our business and/or the value of an investment in our securities could be adversely affected.
12
We rely on co-packers for a significant portion of our manufacturing needs, and the inability to enter into additional or future co-packing agreements may result in our failure to meet customer demand.
We rely upon co-packers for a significant portion of our manufacturing needs. The success of our business depends, in part, on maintaining a strong sourcing and manufacturing platform. We believe that there are a limited number of competent, high-quality co-packers in the industry, and if we were required to obtain additional or alternative co-packing agreements or arrangements in the future, we can provide no assurance that we would be able to do so on satisfactory terms or in a timely manner. Our inability to enter into satisfactory co-packing agreements could limit our ability to implement our business plan or meet customer demand.
We rely on the performance of major retailers, wholesalers, specialty distributors and mass merchants for the success of our business, and should they perform poorly or give higher priority to other brands or products, our business could be adversely affected.
We sell our products principally to retail outlets and wholesale distributors including, traditional supermarkets, mass merchants, warehouse clubs, wholesalers, food service distributors and direct accounts, specialty food distributors, military commissaries and non-food outlets such as drug store chains and dollar stores. The replacement by or poor performance of our major wholesalers, retailers or chains or our inability to collect accounts receivable from our customers could materially and adversely affect our results of operations and financial condition. In addition, our customers offer branded and private label products that compete directly with our products for retail shelf space and consumer purchases. Accordingly, there is a risk that our customers may give higher priority to their own products or to the products of our competitors. In the future, our customers may not continue to purchase our products or provide our products with adequate levels of promotional support.
We may be unable to anticipate changes in consumer preferences, which may result in decreased demand for our products.
Our success depends in part on our ability to anticipate and offer products that appeal to the changing tastes, dietary habits and product packaging preferences of consumers in the market categories in which we compete. If we are not able to anticipate, identify or develop and market products that respond to these changes in consumer preferences, demand for our products may decline and our operating results may be adversely affected. In addition, we may incur significant costs related to developing and marketing new products or expanding our existing product lines in reaction to what we perceive to be increased consumer preference or demand. Such development or marketing may not result in the volume of sales or profitability anticipated.
Severe weather conditions and natural disasters can affect crop supplies and reduce our operating results.
Severe weather conditions and natural disasters, such as floods, droughts, frosts, earthquakes or pestilence, may affect the supply of the raw materials that we use for our products. Our maple syrup products, for instance, are particularly susceptible to severe freezing conditions in Québec, Canada and Vermont during the season in which maple syrup is produced. Competing manufacturers can be affected differently by weather conditions and natural disasters depending on the location of their supplies. If our supplies of raw materials are reduced, we may not be able to find supplemental supply sources on favorable terms or at all, which could adversely affect our business and operating results.
13
We are subject to environmental laws and regulations relating to hazardous materials, substances and waste used in or resulting from our operations. Liabilities or claims with respect to environmental matters could have a significant negative impact on our business.
As with other companies engaged in similar businesses, the nature of our operations expose us to the risk of liabilities and claims with respect to environmental matters, including those relating to the disposal and release of hazardous substances. Furthermore, our operations are governed by laws and regulations relating to workplace safety and worker health which, among other things, regulate employee exposure to hazardous chemicals in the workplace. Any material costs incurred in connection with such liabilities or claims could have a material adverse effect on our business, consolidated financial condition, results of operations or liquidity. Any environmental or health and safety legislation or regulations enacted in the future, or any changes in how existing or future laws or regulations will be enforced, administered or interpreted may lead to an increase in compliance costs or expose us to additional risk of liabilities and claims, which could have a material adverse effect on our business, consolidated financial condition, results of operations or liquidity.
Our operations are subject to numerous laws and governmental regulations, exposing us to potential claims and compliance costs that could adversely affect our business.
Our operations are subject to extensive regulation by the U.S. Food and Drug Administration (FDA), the U.S. Department of Agriculture (USDA) and other national, state and local authorities. For example, we are subject to the Food, Drug and Cosmetic Act and regulations promulgated thereunder by the FDA. Any changes in these laws and regulations could increase the cost of developing and distributing our products and otherwise increase the cost of conducting our business, which would adversely affect our financial condition and results of operations. In addition, failure by us to comply with applicable laws and regulations, including future laws and regulations, could subject us to civil remedies, including fines, injunctions, recalls or seizures, as well as potential criminal sanctions, which could have a material adverse effect on our business, consolidated financial condition, results of operations or liquidity. See Item 1, "Business—Government Regulation."
Failure by third-party co-packers or suppliers of raw materials to comply with food safety, environmental or other regulations may disrupt our supply of certain products and adversely affect our business.
We rely on co-packers to produce certain of our products and on other suppliers to supply raw materials. Such co-packers and other suppliers, whether in the United States or outside the United States, are subject to a number of regulations, including food safety and environmental regulations. Failure by any of our co-packers or other suppliers to comply with regulations, or allegations of compliance failure, may disrupt their operations. Disruption of the operations of a co-packer or other suppliers could disrupt our supply of product or raw materials, which could have an adverse effect on our business, consolidated financial condition, results of operations or liquidity. Additionally, actions we may take to mitigate the impact of any such disruption or potential disruption, including increasing inventory in anticipation of a potential production or supply interruption, may adversely affect our business, consolidated financial condition, results of operations or liquidity.
We may be subject to significant liability should the consumption of any of our products cause injury, illness or death.
The sale of food products for human consumption involves the risk of injury to consumers. Such injuries may result from mislabeling, tampering by unauthorized third parties or product contamination or spoilage, including the presence of foreign objects, substances, chemicals, other agents or residues introduced during the growing, manufacturing, storage, handling or transportation phases of production. Under certain circumstances, we may be required to recall products, leading to a material adverse effect on our business. Even if a situation does not necessitate a recall, product liability claims might be
14
asserted against us. We have from time to time been involved in product liability lawsuits, none of which have been material to our business. While we are subject to governmental inspection and regulations and believe our facilities comply in all material respects with all applicable laws and regulations, if the consumption of any of our products causes, or is alleged to have caused, a health-related illness in the future we may become subject to claims or lawsuits relating to such matters. Even if a product liability claim is unsuccessful or is not fully pursued, the negative publicity surrounding any assertion that our products caused injury, illness or death could adversely affect our reputation with existing and potential customers and our corporate and brand image. Moreover, claims or liabilities of this sort might not be covered by our insurance or by any rights of indemnity or contribution that we may have against others. We maintain product liability insurance in an amount that we believe to be adequate. However, we cannot be sure that we will not incur claims or liabilities for which we are not insured or that exceed the amount of our insurance coverage. Additionally, we do not maintain product recall insurance. A product liability judgment against us or a product recall could have a material adverse effect on our business, consolidated financial condition, results of operations or liquidity.
Consumer concern regarding the safety and quality of food products or health concerns could adversely affect sales of certain of our products.
If consumers in our principal markets lose confidence in the safety and quality of our food products even without a product liability claim or a product recall, our business could be adversely affected. Consumers have been increasingly focused on food safety and health and wellness with respect to the food products they buy. We have been and will continue to be impacted by publicity concerning the health implications of food products generally, which could negatively influence consumer perception and acceptance of our products and marketing programs. Developments in any of these areas could cause our results to differ materially from results that have been or may be projected.
Risk associated with foreign suppliers and co-packers, including changes in import/export duties, wage rates, political or economic climates, or exchange rates, may adversely affect our operations.
Our relationships with foreign suppliers and co-packers subject us to the risks of doing business outside the United States. The countries from which we source our products may be subject to political and economic instability, and may periodically enact new or revise existing laws, taxes, duties, quotas, tariffs, currency controls or other restrictions to which we are subject. Our products are subject to import duties and other restrictions, and the U.S. government may periodically impose new or revise existing duties, quotas, tariffs or other restrictions to which we are subject. In addition, changes in respective wage rates among the countries from which we and our competitors source product could substantially impact our competitive position. Changes in exchange rates, import/export duties or relative international wage rates applicable to us or our competitors could adversely impact our business, financial condition and results of operations. These changes may impact us in a different manner than our competitors.
A weakening of the U.S. dollar in relation to the Canadian dollar would significantly increase our future costs relating to the production of maple syrup products.
We purchase the majority of our maple syrup requirements from suppliers in Québec, Canada. A weakening of the U.S. dollar in relation to the Canadian dollar would significantly increase our future costs relating to the production of our maple syrup products to the extent we have not purchased Canadian dollars or otherwise entered into a currency hedging arrangement in advance of any such weakening of the U.S. dollar.
15
Litigation regarding our trademarks and any other proprietary rights and intellectual property infringement claims may have a significant negative impact on our business.
We maintain an extensive trademark portfolio that we consider to be of significant importance to our business. If the actions we take to establish and protect our trademarks and other proprietary rights are not adequate to prevent imitation of our products by others or to prevent others from seeking to block sales of our products as an alleged violation of their trademarks and proprietary rights, it may be necessary for us to initiate or enter into litigation in the future to enforce our trademark rights or to defend ourselves against claimed infringement of the rights of others. Any legal proceedings could result in an adverse determination that could have a material adverse effect on our business, consolidated financial condition, results of operations or liquidity.
We face risks associated with our defined benefit pension plans.
We hold investments in equity and debt securities in our defined benefit pension plans. A deterioration in the value of plan assets resulting from the general financial downturn or otherwise, could cause an increase in the amount of contributions we are required to make to the plans. For example, during fiscal 2008, our primary defined benefit pension plans moved from an overfunded to underfunded status driven by decreased plan asset values resulting from the global financial turndown. An obligation to make contributions to pension plans could reduce the cash available for working capital and other corporate uses, and may have a material adverse effect on our business, consolidated financial position, results of operations or liquidity.
Our financial well-being could be jeopardized by unforeseen changes in our employees' collective bargaining agreements, shifts in union policy or labor disruptions in the food industry.
As of January 1, 2011, approximately 354 of our 749 employees were covered by collective bargaining agreements. A prolonged work stoppage or strike at any of our facilities with union employees or a significant work disruption from other labor disputes in the food or related industries could have a material adverse effect on our business, consolidated financial condition, results of operations or liquidity. We are currently in negotiations for a new collective bargaining agreement to replace the existing collective bargaining agreement for our Stoughton, Wisconsin facility that is scheduled to expire on March 31, 2011. However, we cannot assure you that we will be able to negotiate a new Stoughton collective bargaining agreement on terms satisfactory to us, or at all, and without production interruptions, including labor stoppages. If prior to the expiration of the Stoughton collective bargaining agreement or prior to the expiration of any of our other existing collective bargaining agreements we are unable to reach new agreements without union action or any such new agreements are not on terms satisfactory to us, our business, consolidated financial condition, results of operations or liquidity could be materially and adversely affected.
If we are unable to retain our key management personnel, our growth and future success may be impaired and our results of operations could suffer as a result.
Our success depends to a significant degree upon the continued contributions of senior management, certain of whom would be difficult to replace. As a result, departure by members of our senior management could have a material adverse effect on our business and results of operations. In addition, we do not maintain key-man life insurance on any of our executive officers.
We are a holding company and we rely on dividends, interest and other payments, advances and transfers of funds from our subsidiaries to meet our obligations.
We are a holding company, with all of our assets held by our direct and indirect subsidiaries, and we rely on dividends and other payments or distributions from our subsidiaries to meet our debt service
16
obligations and to enable us to pay dividends. The ability of our subsidiaries to pay dividends or make other payments or distributions to us depends on their respective operating results and may be restricted by, among other things, the laws of their jurisdiction of organization (which may limit the amount of funds available for the payment of dividends), agreements of those subsidiaries, our credit facility, our senior notes indenture and the covenants of any future outstanding indebtedness we or our subsidiaries incur.
Future changes that increase cash taxes payable by us could significantly decrease our future cash flow available to make interest and dividend payments with respect to our securities.
We are able to amortize goodwill and certain intangible assets within the meaning of Section 197 of the Internal Revenue Code of 1986. We expect to be able to amortize for tax purposes approximately $245.9 million between 2011 and 2025. The expected annual deductions are approximately $31.4 million for 2011, approximately $29.7 million for fiscal 2012, approximately $28.2 million for fiscal 2013, approximately $23.5 million for fiscal 2014, approximately $22.3 million per year for fiscal 2015 through 2017, approximately $19.7 million for fiscal 2018, approximately $15.3 million per year for fiscal 2019 and 2020, approximately $13.3 million for fiscal 2021, approximately $2.3 million for fiscal 2022 and approximately $0.1 million for fiscal 2023 through 2025. If there is a change in U.S. federal tax policy that reduces any of these available deductions or results in an increase in our corporate tax rate, our cash taxes payable may increase, which could significantly reduce our future cash and impact our ability to make interest and dividend payments.
A change in the assumptions used to value our goodwill or our indefinite-lived intangible assets could negatively affect our consolidated results of operations and net worth.
Our total assets include substantial goodwill and indefinite-lived intangible assets (trademarks). These assets are tested for impairment at least annually and whenever events or circumstances occur indicating that goodwill or indefinite-lived intangibles might be impaired. The annual goodwill impairment test involves a two-step process. The first step of the impairment test involves comparing the fair value of our company with our company's carrying value, including goodwill. If the carrying value of our company exceeds our fair value, we perform the second step of the impairment test to determine the amount of the impairment loss. The second step of the goodwill impairment test involves comparing the implied fair value of goodwill with the carrying value of that goodwill and recognizing a loss for the difference. Calculating our fair value for purposes of the second step of the impairment test requires significant estimates and assumptions by management. We estimate our fair value by applying third party market value indicators to our EBITDA. We test indefinite-lived intangible assets for impairment by comparing their carrying value to their fair value that is determined using a cash flow method and recognize a loss to the extent the carrying value is greater. We completed our annual impairment tests for fiscal 2010, 2009 and 2008 with no adjustments to the carrying values of goodwill and indefinite-lived intangibles. However, materially different, assumptions regarding the future performance of our businesses could result in significant impairment losses. In addition, any significant decline in our market capitalization, even if due to macroeconomic factors, could put pressure on the carrying value of our goodwill. A determination that all or a portion of our goodwill or indefinite-lived intangible assets are impaired, although a non-cash charge to operations, could have a material adverse effect on our business, consolidated financial condition and results of operations.
Any future financial market disruptions or tightening of the credit markets could expose us to additional credit risks from customers and supply risks from suppliers and co-packers.
Any future financial market disruptions or tightening of the credit markets could result in some of our customers experiencing a significant decline in profits and/or reduced liquidity. A significant adverse change in the financial and/or credit position of a customer could require us to assume greater
17
credit risk relating to that customer and could limit our ability to collect receivables. A significant adverse change in the financial and/or credit position of a supplier or co-packer could result in an interruption of supply. This could have a material adverse effect on our business, consolidated financial condition, results of operations and liquidity.
Risks Relating to our Securities
Holders of our common stock may not receive the level of dividends provided for in our dividend policy or any dividends at all.
Dividend payments are not mandatory or guaranteed and holders of our common stock do not have any legal right to receive, or require us to pay, dividends. Our board of directors may, in its sole discretion, decrease the level of dividends provided for in our dividend policy or entirely discontinue the payment of dividends. Future dividends with respect to shares of our capital stock, if any, depend on, among other things, our results of operations, cash requirements, financial condition, contractual restrictions (including restrictions in our credit facility and senior notes indenture), business opportunities, provisions of applicable law (including certain provisions of the Delaware General Corporation Law) and other factors that our board of directors may deem relevant.
If our cash flows from operating activities were to fall below our minimum expectations (or if our assumptions as to capital expenditures or interest expense were too low or our assumptions as to the sufficiency of our credit facility to finance our working capital needs were to prove incorrect), we may need either to reduce or eliminate dividends or, to the extent permitted under our credit facility and senior notes indenture, fund a portion of our dividends with borrowings or from other sources. If we were to use working capital or permanent borrowings to fund dividends, we would have less cash and/or borrowing capacity available for future dividends and other purposes, which could negatively impact our financial condition, results of operations, liquidity and ability to maintain or expand our business.
Our dividend policy may negatively impact our ability to finance capital expenditures, operations or acquisition opportunities.
Under our dividend policy, a substantial portion of our cash generated by our business in excess of operating needs, interest and principal payments on indebtedness, and capital expenditures sufficient to maintain our properties and assets is in general distributed as regular quarterly cash dividends to the holders of our common stock. As a result, we may not retain a sufficient amount of cash to finance growth opportunities or unanticipated capital expenditure needs or to fund our operations in the event of a significant business downturn. We may have to forego growth opportunities or capital expenditures that would otherwise be necessary or desirable if we do not find alternative sources of financing. If we do not have sufficient cash for these purposes, our financial condition and our business will suffer.
Our certificate of incorporation authorizes us to issue without stockholder approval preferred stock that may be senior to our common stock in certain respects.
Our certificate of incorporation authorizes the issuance of preferred stock without stockholder approval and, in the case of preferred stock, upon such terms as the board of directors may determine. The rights of the holders of shares of our common stock will be subject to, and may be adversely affected by, the rights of holders of any class or series of preferred stock that may be issued in the future, including any preferential rights that we may grant to the holders of preferred stock. The terms of any preferred stock we issue may place restrictions on the payment of dividends to the holders of our common stock. If we issue preferred stock that is senior to our common stock in right of dividend payment, and our cash flows from operating activities or surplus are insufficient to support dividend
18
payments to the holders of preferred stock, on the one hand, and to the holders common stock, on the other hand, we may be forced to reduce or eliminate dividends to the holders of our common stock.
Future sales or the possibility of future sales of a substantial number of shares of our common stock or other securities convertible or exchangeable into common stock may depress the price of our common stock.
We may issue shares of our common stock or other securities convertible or exchangeable into common stock from time to time in future financings or as consideration for future acquisitions and investments. In the event any such future financing, acquisition or investment is significant, the number of shares of our common stock or other securities convertible or exchangeable into common stock that we may issue may in turn be significant. In addition, we may grant registration rights covering shares of our common stock or other securities convertible or exchangeable into common stock, as applicable, issued in connection with any such future financing, acquisitions and investments.
We currently have an effective shelf registration statement on Form S-3 registering the sale of up to approximately $600.0 million of securities, which we may use in the future to issue common stock or other debt or equity securities convertible or exchangeable into shares of common stock.
Future sales or the availability for sale of a substantial number of shares of our common stock or other securities convertible or exchangeable into common stock, whether issued and sold pursuant to the shelf registration statement or otherwise would dilute our earnings per share and the voting power of each share of common stock outstanding prior to such sale or distribution, could adversely affect the prevailing market price of our securities and could impair our ability to raise capital through future sales of our securities.
Our certificate of incorporation and bylaws and several other factors could limit another party's ability to acquire us and deprive our investors of the opportunity to obtain a takeover premium for their securities.
Our certificate of incorporation and bylaws contain certain provisions that may make it difficult for another company to acquire us and for holders of our securities to receive any related takeover premium for their securities. For example, our certificate of incorporation authorizes the issuance of preferred stock without stockholder approval and upon such terms as the board of directors may determine. The rights of the holders of shares of our common stock will be subject to, and may be adversely affected by, the rights of holders of any class or series of preferred stock that may be issued in the future.
19
Item 1B. Unresolved Staff Comments.
None.
Our corporate headquarters are located at Four Gatehall Drive, Suite 110, Parsippany, NJ 07054. Our manufacturing plants are generally located near major customer markets and raw materials. Of our six manufacturing facilities, five are owned and one is leased. Management believes that our manufacturing plants have sufficient capacity to accommodate our planned growth. As of January 1, 2011, we owned or leased the offices, manufacturing and warehouse facilities and distribution centers described in the table below:
Facility Location
|
Owned/ Leased | Description | ||
|---|---|---|---|---|
Hurlock, Maryland |
Owned | Manufacturing/Warehouse | ||
Portland, Maine |
Owned | Manufacturing/Warehouse | ||
Stoughton, Wisconsin |
Owned | Manufacturing/Warehouse | ||
St. Johnsbury, Vermont |
Owned | Manufacturing/Warehouse | ||
Williamstown, New Jersey |
Owned | Manufacturing/Warehouse | ||
St. Evariste, Québec |
Owned | Storage Facility | ||
Sharptown, Maryland |
Owned | Storage Facility | ||
Parsippany, New Jersey |
Leased | Corporate Headquarters | ||
Roseland, New Jersey |
Leased | Manufacturing/Warehouse | ||
Antioch, Tennessee |
Leased | Distribution Center | ||
Houston, Texas |
Leased | Distribution Center | ||
Easton, Pennsylvania |
Leased | Distribution Center | ||
Bentonville, Arkansas |
Leased | Sales Office |
The information set forth under the heading "Legal Proceedings" in Note 12 of Notes to Consolidated Financial Statements in Part II, Item 8 of this Annual Report on Form 10-K is incorporated herein by reference.
20
Item 5. Market for Registrant's Common Equity, Related Stockholder Matters and Issuer Purchases of Equity Securities.
Market Information
Shares of our common stock are traded on the New York Stock Exchange under the symbol "BGS" and have been so traded since May 23, 2007. The following table sets forth the high and low sales prices of shares of our common stock for each of the quarterly periods indicated.
| |
High | Low | ||||||
|---|---|---|---|---|---|---|---|---|
Fiscal 2009 |
||||||||
First Quarter |
$ | 5.62 | $ | 3.51 | ||||
Second Quarter |
$ | 8.60 | $ | 4.89 | ||||
Third Quarter |
$ | 10.23 | $ | 7.38 | ||||
Fourth Quarter |
$ | 9.77 | $ | 7.56 | ||||
Fiscal 2010 |
||||||||
First Quarter |
$ | 10.60 | $ | 8.56 | ||||
Second Quarter |
$ | 11.59 | $ | 5.00 | ||||
Third Quarter |
$ | 11.57 | $ | 10.25 | ||||
Fourth Quarter |
$ | 13.87 | $ | 10.67 | ||||
Holders
According to the records of our transfer agent, we had 76 holders of record of our common stock as of February 28, 2011, including Cede & Co. as nominee for The Depository Trust Company (DTC). Cede & Co. as nominee for DTC holds shares of our common stock on behalf of participants in the DTC system, which in turn hold the shares of common stock on behalf of beneficial owners.
Performance Graph
Set forth below is a line graph comparing the change in the cumulative total shareholder return on our company's separately traded shares of common stock with the cumulative total return of the Russell MicroCap Index, the Russell 2000 Index and the S&P Packaged Foods & Meats Index for the period from May 23, 2007 (the first day of trading of our separately traded shares of common stock on the New York Stock Exchange) to January 1, 2011, assuming the investment of $100 on May 23, 2007 and the reinvestment of dividends. The separately traded common stock price performance shown on the graph only reflects the change in our company's separately traded common stock price relative to the noted indices and is not necessarily indicative of future price performance.
21
Comparison of 43 Month Cumulative Total Return*
Among B&G Foods, Inc. Common Stock, the Russell MicroCap Index,
the Russell 2000 Index and the S&P Packaged Foods & Meats Index
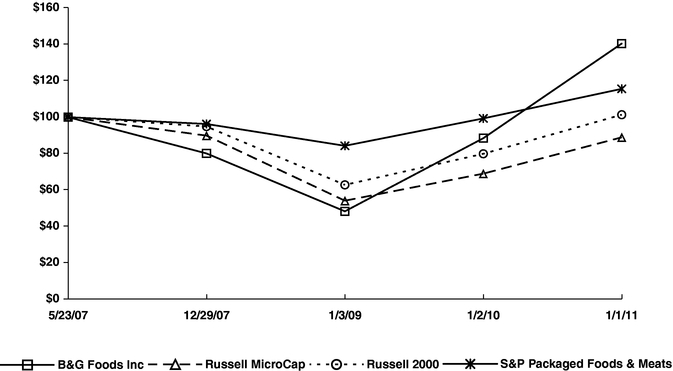
| |
5/23/2007* | 12/29/2007 | 1/3/2009 | 1/2/2010 | 1/1/2011 | |||||||||||
|---|---|---|---|---|---|---|---|---|---|---|---|---|---|---|---|---|
B&G Foods, Inc. Common Stock (BGS) |
$ | 100.00 | 80.06 | $ | 48.28 | 88.43 | 140.40 | |||||||||
Russell MicroCap Index |
100.00 | 89.85 | 54.11 | 68.97 | 88.90 | |||||||||||
Russell 2000 Index |
100.00 | 94.85 | 62.80 | 79.87 | 101.32 | |||||||||||
S&P Packaged Foods & Meats Index |
100.00 | 96.24 | 84.25 | 99.29 | 115.53 | |||||||||||
- *
- $100 invested on May 23, 2007 in B&G Foods' common stock or April 30, 2007 in index, including reinvestment of dividends. Indexes calculated on month-end basis. Copyright© 2011 S&P, a division of The McGraw-Hill Companies Inc. All rights reserved.
Dividend Policy
General
Our dividend policy reflects a basic judgment that our stockholders would be better served if we distributed a substantial portion of our cash available to pay dividends to them instead of retaining it in our business. Under this policy, a substantial portion of the cash generated by our company in excess of operating needs, interest and principal payments on indebtedness, capital expenditures sufficient to maintain our properties and other assets is in general distributed as regular quarterly cash dividends (up to the intended dividend rate as determined by our board of directors) to the holders of our common stock and not retained by us. From the date of our initial public offering of EISs in October 2004 through the dividend payment we made on October 30, 2008, the dividend rate for our common stock was $0.848 per share per annum. Beginning with the dividend payment paid on January 30, 2009 through the dividend payment paid on January 31, 2011, the dividend rate was $0.680 per share per annum. Beginning with the dividend previously declared and payable on May 2, 2011, our board of directors has increased the dividend rate to $0.840 per share per annum.
22
For fiscal 2010 and fiscal 2009, we had cash flows from operating activities of $98.9 million and $62.9 million, respectively, and distributed $32.3 million and $26.4 million as dividends, respectively. Our board of directors declared quarterly dividends of $0.170 per share of common stock during each of the quarters of fiscal 2010 and fiscal 2009.
Under U.S. federal income tax law, distributions to holders of our common stock are taxable to the extent they are paid out of current or accumulated earnings and profits. Generally, the portion of the distribution treated as a return of capital should reduce the tax basis in the shares of common stock up to a holder's adjusted basis in the common stock, with any excess treated as capital gains. Qualifying dividend income and the return of capital, if any, will be allocated on a pro-forma basis to all distributions for each fiscal year. Based on U.S. federal income tax laws, B&G Foods has determined that for fiscal 2010 and fiscal 2009, 46.4% and 72.7%, respectively, of distributions paid on common stock will be treated as a return of capital and 53.6% and 27.3%, respectively, will be treated as a taxable dividend paid from earnings and profits.
As a result of our dividend policy, we may not retain a sufficient amount of cash to finance growth opportunities or unanticipated capital expenditure needs or to fund our operations in the event of a significant business downturn. We may have to forego growth opportunities or capital expenditures that would otherwise be necessary or desirable if we do not find alternative sources of financing. If we do not have sufficient cash for these purposes, our financial condition and our business will suffer.
Our dividend policy is based upon our current assessment of our business and the environment in which we operate, and that assessment could change based on competitive or other developments (which could, for example, increase our need for capital expenditures or working capital), new acquisition opportunities or other factors. Our board of directors is free to depart from or change our dividend policy at any time and could do so, for example, if it was to determine that we have insufficient cash to take advantage of growth opportunities.
Restrictions on Dividend Payments
Our ability to pay future dividends, if any, with respect to shares of our capital stock will depend on, among other things, our results of operations, cash requirements, financial condition, contractual restrictions, provisions of applicable law and other factors that our board of directors may deem relevant. Under Delaware law, our board of directors may declare dividends only to the extent of our "surplus" (which is defined as total assets at fair market value minus total liabilities, minus statutory capital), or if there is no surplus, out of our net profits for the then current and/or immediately preceding fiscal years. Our board of directors will periodically and from time to time assess the appropriateness of the then current dividend policy before actually declaring any dividends.
In general, our senior notes indenture restricts our ability to declare and pay dividends on our common stock as follows:
- •
- we may use up to 100% of our excess cash (as defined below) for the period (taken as one accounting period) from and
including the fiscal quarter beginning January 3, 2010 to the end of our most recently ended fiscal quarter for which internal financial statements are available at the time of such payment
plus certain incremental funds described in the indenture for the payment of dividends so long as the fixed charge coverage ratio for the four most recent fiscal quarters for which internal financial
statements are available is not less than 1.6 to 1.0; and
- •
- we may not pay any dividends on any dividend payment date if a default or event of default under our indenture has occurred or is continuing.
Excess cash is defined in our senior notes indenture and under the terms of our credit facility. Excess cash is calculated as "consolidated cash flow," as defined in the indenture and under the terms of our credit facility (which, in each case, allows for the add-back of restructuring charges and which is
23
equivalent to the term adjusted EBITDA), minus the sum of cash tax expense, cash interest expense, certain capital expenditures, excess tax benefit from issuance of LTIA shares, certain repayment of indebtedness and the cash portion of the restructuring charges. Excess cash is not a substitute for operating income or net income, as determined in accordance with generally accepted accounting principles (GAAP). Excess cash is not a complete net cash flow measure because excess cash is a measure of liquidity that does not include reductions for cash payments for an entity's obligation to fund changes in its working capital, acquisitions, if any, and repay its debt and pay its dividends. Rather, excess cash is one potential indicator of our ability to fund these cash requirements in compliance with our debt agreements. Excess cash is also not a complete measure of our profitability because it does not include costs and expenses for depreciation and amortization and non-cash restructuring charges. We believe that the most directly comparable GAAP measure to excess cash is net cash provided by operating activities. We believe excess cash is indicative of our ability to declare and pay dividends on our common stock in compliance with the restricted payment covenants under our senior notes indenture and the terms of our credit facility.
Excess cash does not represent the amount we intend to distribute as dividends for any quarterly period but rather is, in general, a restriction on the maximum level of dividend payments that we are permitted to declare and pay under the terms of our senior notes indenture and under and our credit facility.
In addition, the terms of our credit facility also restrict our ability to declare and pay dividends on our common stock. In accordance with the terms of our credit facility, we are not permitted to declare or pay dividends unless we are permitted to do so under our senior notes indenture. In addition, our credit facility does not permit us to pay dividends unless we maintain:
- •
- a "consolidated interest coverage ratio" (defined as the ratio of our adjusted EBITDA for any period of four consecutive
fiscal quarters to our consolidated interest expense for such period payable in cash) of not less than 1.35 to 1.0;
- •
- a "consolidated senior leverage ratio" (defined as the ratio of our consolidated senior debt, as of the last day of any
period of four consecutive fiscal quarters to our adjusted EBITDA for such period) of not more than 5.00 to 1.0; and
- •
- a "consolidated total leverage ratio" (defined as the ratio of our consolidated total debt of the last day of any period of four consecutive fiscal quarters to our adjusted EBITDA for such period) of not more than 7.00 to 1.0.
Furthermore, while interest on our senior notes is fixed those notes will need to be refinanced on or prior to maturity in 2018, and thereafter our interest expense could be higher and the terms of any new financing may restrict us from paying the level of current intended dividends or any dividends at all. Interest on indebtedness under our credit facility is based upon a floating interest rate. As a result, our interest expense under our credit facility will increase if interest rates in the general economy rise. Also, to the extent we finance capital expenditures, working capital or other cash needs with indebtedness under our credit facility or otherwise, we will incur additional cash interest expense and debt service obligations that could reduce our cash available to pay dividends.
Subject to the limitations described elsewhere in this report, we have the ability to issue additional common stock, other equity securities or preferred stock for such consideration and on such terms and conditions as are established by our board of directors in its sole discretion and without the approval of the holders of our common stock. It is possible that we will fund acquisitions, if any, through the issuance of additional common stock, preferred stock or other equity securities. Holders of any additional common stock or other equity securities issued by us may be entitled to share equally with the holders of common stock in dividend distributions. The certificate of designation of any preferred stock issued by us may provide that the holders of preferred stock are senior to the holders of our
24
common stock with respect to the payment of dividends. If we were to issue additional common stock, preferred stock or other equity securities, it would be necessary for us to generate additional cash available to pay dividends in order for us to distribute dividends at the same rate per share as distributed prior to any such additional issuance.
Dividends Not Mandatory or Guaranteed. We cannot assure you that we will continue to pay dividends at the historical levels set forth above or at all. Dividend payments are not mandatory or guaranteed, and holders of our common stock do not have any legal right to receive, or require us to pay, dividends. Our board of directors may, in its sole discretion, amend or repeal our dividend policy at any time. Furthermore, our board of directors may decrease the level of dividends below the intended dividend rate set forth above, or discontinue entirely the payment of dividends.
Recent Sales of Unregistered Securities
We did not issue any unregistered securities in fiscal 2010.
Issuer Purchases of Equity Securities
We did not repurchase any shares of our common stock during the fourth quarter of fiscal 2010.
Item 6. Selected Financial Data.
The following selected historical consolidated financial data should be read in conjunction with Item 7, "Management's Discussion and Analysis of Financial Condition and Results of Operations" and our audited consolidated financial statements and related notes to those statements included in this report. The selected historical consolidated financial data as of and for the years ended January 1, 2011 (fiscal 2010), January 2, 2010 (fiscal 2009), January 3, 2009 (fiscal 2008), December 29, 2007 (fiscal 2007) and December 30, 2006 (fiscal 2006) have been derived from our audited consolidated financial statements. Fiscal 2008 contained 53 weeks and the fiscal years 2010, 2009, 2007 and 2006 each contained 52 weeks. Certain prior year amounts have been reclassified to conform to the current year's presentation.
25
| |
Fiscal 2010 | Fiscal 2009 | Fiscal 2008 | Fiscal 2007 | Fiscal 2006 | |||||||||||||
|---|---|---|---|---|---|---|---|---|---|---|---|---|---|---|---|---|---|---|
| |
(In thousands, except per share data and ratios) |
|||||||||||||||||
Consolidated Statement of Operations Data(1): |
||||||||||||||||||
Net sales |
$ | 513,337 | $ | 501,016 | $ | 486,896 | $ | 471,336 | $ | 411,306 | ||||||||
Cost of goods sold(2) |
345,668 | 352,283 | 352,967 | 323,316 | 297,053 | |||||||||||||
Gross profit |
167,669 | 148,733 | 133,929 | 148,020 | 114,253 | |||||||||||||
Sales, marketing and warehousing expenses |
44,723 | 43,084 | 44,888 | 51,684 | 45,343 | |||||||||||||
General and administrative expenses(3) |
11,772 | 10,882 | 8,707 | 9,682 | 7,688 | |||||||||||||
Gain on sale of property, plant and equipment(4) |
— | — | — | — | (525 | ) | ||||||||||||
Amortization expense(5) |
6,457 | 6,450 | 6,450 | 5,501 | 731 | |||||||||||||
Operating income |
104,717 | 88,317 | 73,884 | 81,153 | 61,016 | |||||||||||||
Interest expense, net(6) |
40,342 | 49,432 | 58,067 | 50,919 | 43,481 | |||||||||||||
Loss on extinguishment of debt(7) |
15,224 | 10,220 | — | 1,769 | — | |||||||||||||
Income before income tax expense |
49,151 | 28,665 | 15,817 | 28,465 | 17,535 | |||||||||||||
Income tax expense |
16,772 | 11,224 | 6,084 | 10,640 | 5,962 | |||||||||||||
Net income |
$ | 32,379 | $ | 17,441 | $ | 9,733 | $ | 17,825 | $ | 11,573 | ||||||||
Earnings per share data: |
||||||||||||||||||
Weighted average basic common shares outstanding:(8) |
47,584 | 39,325 | 36,715 | |||||||||||||||
Class A |
29,911 | 20,000 | ||||||||||||||||
Class B |
3,093 | 7,556 | ||||||||||||||||
Weighted average diluted common shares outstanding(8) |
48,284 | 39,358 | 36,715 | |||||||||||||||
Class A |
29,911 | 20,000 | ||||||||||||||||
Class B |
3,093 | 7,556 | ||||||||||||||||
Basic distributed earnings per common share:(8) |
$ | 0.68 | $ | 0.72 | $ | 0.81 | ||||||||||||
Class A |
$ | 0.92 | $ | 0.85 | ||||||||||||||
Class B |
— | — | ||||||||||||||||
Diluted distributed earnings per common share:(8) |
$ | 0.67 | $ | 0.72 | $ | 0.81 | ||||||||||||
Class A |
$ | 0.92 | $ | 0.85 | ||||||||||||||
Class B |
— | — | ||||||||||||||||
Basic earnings per common share:(8) |
$ | 0.68 | $ | 0.44 | $ | 0.27 | ||||||||||||
Class A |
$ | 0.62 | $ | 0.65 | ||||||||||||||
Class B |
$ | (0.30 | ) | $ | (0.20 | ) | ||||||||||||
Diluted earnings per common share:(8) |
$ | 0.67 | $ | 0.44 | $ | 0.27 | ||||||||||||
Class A |
$ | 0.62 | $ | 0.65 | ||||||||||||||
Class B |
$ | (0.30 | ) | $ | (0.20 | ) | ||||||||||||
Other Financial Data: |
||||||||||||||||||
Net cash provided by operating activities |
$ | 98,877 | $ | 62,854 | $ | 40,496 | $ | 34,049 | $ | 32,771 | ||||||||
Capital expenditures |
(10,965 | ) | (10,704 | ) | (10,631 | ) | (14,230 | ) | (7,306 | ) | ||||||||
Payments for acquisition of businesses |
(14,602 | ) | — | — | (200,526 | ) | (30,102 | ) | ||||||||||
Net proceeds from sale of property, plant and equipment |
— | — | — | — | 1,275 | |||||||||||||
Net cash (used in) provided by financing activities |
(14,534 | ) | (44,877 | ) | (33,747 | ) | 187,693 | 7,621 | ||||||||||
EBITDA(9) |
$ | 119,740 | $ | 103,012 | $ | 89,436 | $ | 94,451 | $ | 69,000 | ||||||||
Ratio of earnings to fixed charges(10) |
2.2x | 1.5x | 1.3x | 1.5x | 1.4x | |||||||||||||
Senior debt / EBITDA(11) |
4.0x | 3.6x | 4.1x | 3.9x | 3.8x | |||||||||||||
Total debt / EBITDA |
4.0x | 4.3x | 6.0x | 5.7x | 6.2x | |||||||||||||
EBITDA / cash interest expense(12) |
3.3x | 2.2x | 1.8x | 2.0x | 1.7x | |||||||||||||
Consolidated Balance Sheet Data (at end of period)(1): |
||||||||||||||||||
Cash and cash equivalents |
$ | 98,738 | $ | 39,930 | $ | 32,559 | $ | 36,606 | $ | 29,626 | ||||||||
Total assets |
871,723 | 816,894 | 825,090 | 847,590 | 616,205 | |||||||||||||
Total debt |
477,748 | 439,541 | 535,800 | 535,800 | 430,800 | |||||||||||||
Total stockholders' equity |
$ | 230,585 | $ | 225,608 | $ | 144,648 | $ | 174,635 | $ | 75,487 | ||||||||
- (1)
- We
completed the Cream of Wheat acquisition from Kraft effective February 25, 2007. The Cream of Wheat acquisition has been accounted for using the
purchase method of accounting and, accordingly, the assets acquired, liabilities assumed and
results of operations of the acquired business is included in our consolidated financial statements from the date of acquisition.
- (2)
- Included
in cost of goods sold for fiscal 2010 is a gain of $1.3 million relating to a legal settlement. See note 12 to our consolidated
financial statements included elsewhere in this report.
- (3)
- General and administrative expenses for fiscal 2008 include $0.7 million of severance and termination charges we incurred relating to a workforce reduction. General and administrative expenses for fiscal 2007 include an accrual of $1.9 million
26
relating to special bonus awards paid in fiscal 2008 relating to the successful completion of the Cream of Wheat acquisition and our common stock offering in fiscal 2007, partially offset by an insurance reimbursement of $0.8 million.
- (4)
- The
gain on sale of property, plant and equipment of $0.5 million relates to the sale of our New Iberia, Louisiana, manufacturing facility in July
2006.
- (5)
- Amortization
expense includes the amortization of customer relationship and other intangible assets acquired in the Don Pepino, Cream
of Wheat and Grandma's molasses acquisitions.
- (6)
- Fiscal
2010 net interest expense includes a charge of $0.4 million relating to the unrealized loss on an interest rate swap, and a charge of
$1.7 million for the reclassification of the amount recorded in accumulated other comprehensive loss related to the swap. Fiscal 2009 net interest expense includes a $1.5 million benefit
relating to the unrealized gain on the interest rate swap, more than offset by a $1.7 million charge for the reclassification of the amount recorded in accumulated other comprehensive loss
related to the swap. Fiscal 2008 net interest expense includes a $5.6 million charge relating to the unrealized loss on the interest rate swap subsequent to our determination that the swap was
no longer an effective hedge for accounting purposes and a $0.5 million charge for the reclassification of the amount recorded in accumulated other comprehensive loss related to the swap.
- (7)
- Fiscal
2010 loss on extinguishment of debt includes costs relating to our repurchase of senior subordinated notes, including the repurchase premium of
$10.7 million and the write-off of deferred financing costs of $4.5 million. Fiscal 2009 loss on extinguishment of debt includes costs relating to our repurchase of senior
subordinated notes, including the repurchase premium of $5.8 million and the write-off of deferred debt financing costs of $4.4 million. In fiscal 2007 we
wrote-off $1.8 million of deferred debt financing costs in connection with our May 2007 prepayment of $100.0 million of term loan borrowings.
- (8)
- Prior
to May 29, 2007, we had two classes of common stock issued and outstanding, designated as Class A common stock and Class B common
stock. For periods in which we had shares of both Class A and Class B common stock issued and outstanding, we present earnings per share using the two-class method. Net
income is allocated between the two classes of common stock based upon the two-class method. The two-class method is an earnings allocation formula that determines earnings per
share for each class of common stock according to dividends declared and participation rights in undistributed earnings or losses.
- (9)
- EBITDA
is a non-GAAP financial measure used by management to measure operating performance. A non-GAAP financial measure is defined
as a numerical measure of our financial performance that excludes or includes amounts so as to be different than the most directly comparable measure calculated and presented in accordance with GAAP
in our consolidated balance sheets and related consolidated statements of operations, changes in stockholders' equity and comprehensive income, and cash flows. EBITDA is defined as net income before
net interest expense, income taxes, depreciation and amortization and loss on extinguishment of debt (see (B) below). Management believes that it is useful to eliminate net interest expense,
income taxes, depreciation and amortization and loss on extinguishment of debt because it allows management to focus on what it deems to be a more reliable indicator of ongoing operating performance
and our ability to generate cash flow from operations. We use EBITDA in our business operations, among other things, to evaluate our operating performance, develop budgets and measure our performance
against those budgets, determine employee bonuses and evaluate our cash flows in terms of cash needs. We also present EBITDA because we believe it is a useful indicator of our historical debt capacity
and ability to service debt and because covenants in our credit facility and our senior notes indenture contain ratios based on this measure. As a result, internal management reports used during
monthly operating reviews feature the EBITDA metric. However, management uses this metric in conjunction with traditional GAAP operating performance and liquidity measures as part of its overall
assessment of company performance and liquidity and therefore does not place undue reliance on this measure as its only measure of operating performance and liquidity.
EBITDA is not a recognized term under GAAP and does not purport to be an alternative to operating income or net income as an indicator of operating performance or any other GAAP measure. EBITDA is not a complete net cash flow measure because EBITDA is a measure of liquidity that does not include reductions for cash payments for an entity's obligation to service its debt, fund its working capital, capital expenditures and acquisitions and pay its income taxes and dividends. Rather, EBITDA is a potential indicator of an entity's ability to fund these cash requirements. EBITDA is not a complete measure of an entity's profitability because it does not include costs and expenses for depreciation and amortization, interest and related expenses, loss on extinguishment of debt and income taxes. Because not all companies use identical calculations, this presentation of EBITDA may not be comparable to other similarly titled measures of other companies. However, EBITDA can still be useful in evaluating our performance against our peer companies because management believes this measure provides users with valuable insight into key components of GAAP amounts.
27
A reconciliation of EBITDA to net income and to net cash provided by operating activities for fiscal 2010, 2009, 2008, 2007 and 2006 along with the components of EBITDA follows:
| |
Fiscal 2010 | Fiscal 2009 | Fiscal 2008 | Fiscal 2007 | Fiscal 2006 | ||||||||||||
|---|---|---|---|---|---|---|---|---|---|---|---|---|---|---|---|---|---|
| |
(In thousands) |
||||||||||||||||
Net income |
$ | 32,379 | $ | 17,441 | $ | 9,733 | $ | 17,825 | $ | 11,573 | |||||||
Income tax expense |
16,772 | 11,224 | 6,084 | 10,640 | 5,962 | ||||||||||||
Interest expense, net(A) |
40,342 | 49,432 | 58,067 | 50,919 | 43,481 | ||||||||||||
Depreciation and amortization |
15,023 | 14,695 | 15,552 | 13,298 | 7,984 | ||||||||||||
Loss on extinguishment of debt(B) |
15,224 | 10,220 | — | 1,769 | — | ||||||||||||
EBITDA |
119,740 | 103,012 | 89,436 | 94,451 | 69,000 | ||||||||||||
Income tax expense |
(16,772 | ) | (11,224 | ) | (6,084 | ) | (10,640 | ) | (5,962 | ) | |||||||
Interest expense, net(A) |
(40,342 | ) | (49,432 | ) | (58,067 | ) | (50,919 | ) | (43,481 | ) | |||||||
Deferred income taxes |
9,452 | 9,445 | 7,250 | 9,323 | 6,165 | ||||||||||||
Amortization of deferred financing costs and bond discount |
2,016 | 2,759 | 3,169 | 3,190 | 2,830 | ||||||||||||
Unrealized loss (gain) on interest rate swap(A) |
436 | (1,541 | ) | 5,569 | — | — | |||||||||||
Reclassification to net interest expense for interest rate swap(A) |
1,693 | 1,693 | 494 | — | — | ||||||||||||
Share-based compensation expense |
3,747 | 4,599 | 1,032 | — | — | ||||||||||||
Excess tax benefits from share-based compensation |
(326 | ) | — | — | — | — | |||||||||||
Gain on sale of property, plant and equipment(C) |
— | — | — | — | (525 | ) | |||||||||||
Changes in assets and liabilities, net of effects of business combination |
19,233 | 3,543 | (2,303 | ) | (11,356 | ) | 4,744 | ||||||||||
Net cash provided by operating activities |
$ | 98,877 | $ | 62,854 | $ | 40,496 | $ | 34,049 | $ | 32,771 | |||||||
- (A)
- Fiscal
2010 net interest expense includes a charge of $0.4 million relating to the unrealized loss on an interest rate swap, and a charge of
$1.7 million for the reclassification of the amount recorded in accumulated other comprehensive loss related to the swap. Net interest expense in fiscal 2009 includes $1.5 million
relating to the unrealized gain on the interest rate swap, more than offset by a $1.7 million charge for the reclassification of the amount recorded in accumulated other comprehensive loss
related to the swap. Net interest expense in fiscal 2008 includes $5.6 million relating to the unrealized loss on the interest rate swap subsequent to our determination that the swap was no
longer an effective hedge for accounting purposes and a $0.5 million charge for the reclassification of the amount recorded in accumulated other comprehensive loss related to the swap.
- (B)
- Fiscal
2010 loss on extinguishment of debt includes costs relating to our repurchase of senior subordinated notes, including the repurchase premium of
$10.7 million and the write-off of deferred financing costs of $4.5 million. Fiscal 2009 loss on extinguishment of debt includes costs relating to our repurchase of senior
subordinated notes, including the repurchase premium of $5.8 million and the write-off of deferred debt financing costs of $4.4 million. In fiscal 2007 we
wrote-off $1.8 million of deferred debt financing costs in connection with our May 2007 prepayment of $100.0 million of term loan borrowings.
- (C)
- The gain on sale of property, plant and equipment of $0.5 million relates to the sale of our New Iberia, Louisiana, manufacturing facility in July 2006.
- (10)
- We have calculated the ratio of earnings to fixed charges by dividing earnings by fixed charges. For the purpose of this computation, earnings consist of income before income taxes plus fixed charges. Fixed charges consist of the sum of interest on indebtedness, amortized expenses related to indebtedness, reclassification to net interest expense of a portion of the amount recorded in accumulated other comprehensive loss related to an interest rate swap and an interest component of lease rental expense. Fixed charges excluded the unrealized loss (gain) on the interest rate swap.
28
- (11)
- As of the end of each fiscal year presented, senior debt is defined as the face amount all of our outstanding debt excluding our then outstanding senior subordinated notes.
| |
Fiscal 2010 | Fiscal 2009 | Fiscal 2008 | Fiscal 2007 | Fiscal 2006 | |||||||||||||
|---|---|---|---|---|---|---|---|---|---|---|---|---|---|---|---|---|---|---|
| |
(In thousands, except ratios) |
|||||||||||||||||
Senior secured credit facility: |
||||||||||||||||||
Revolving credit facility |
$ | — | $ | — | $ | — | $ | — | $ | — | ||||||||
Term loan |
130,000 | 130,000 | 130,000 | 130,000 | 25,000 | |||||||||||||
8% senior notes due 2011 |
— | 240,000 | 240,000 | 240,000 | 240,000 | |||||||||||||
7.625% senior notes due 2018 |
350,000 | — | — | — | — | |||||||||||||
Senior debt |
$ | 480,000 | $ | 370,000 | $ | 370,000 | $ | 370,000 | $ | 265,000 | ||||||||
EBITDA |
$ | 119,740 | $ | 103,012 | $ | 89,436 | $ | 94,451 | $ | 69,000 | ||||||||
Senior debt / EBITDA |
4.0x | 3.6x | 4.1x | 3.9x | 3.8x | |||||||||||||
- (12)
- Cash interest expense, calculated below, is equal to net interest expense less amortization of deferred financing and bond discount, unrealized loss on an interest rate swap, reclassification to net interest expense of a portion of the amount recorded in accumulated other comprehensive loss related to an interest rate swap.
| |
Fiscal 2010 | Fiscal 2009 | Fiscal 2008 | Fiscal 2007 | Fiscal 2006 | |||||||||||||
|---|---|---|---|---|---|---|---|---|---|---|---|---|---|---|---|---|---|---|
| |
(In thousands, except ratios) |
|||||||||||||||||
Interest expense, net |
$ | 40,342 | $ | 49,432 | $ | 58,067 | $ | 50,919 | $ | 43,481 | ||||||||
Amortization of deferred financing and bond discount |
(2,016 | ) | (2,759 | ) | (3,169 | ) | (3,190 | ) | (2,830 | ) | ||||||||
Unrealized (loss) gain on interest rate swap |
(436 | ) | 1,541 | (5,569 | ) | — | — | |||||||||||
Reclassification to interest expense, net |
(1,693 | ) | (1,693 | ) | (494 | ) | — | — | ||||||||||
Cash interest expense |
$ | 36,197 | $ | 46,521 | $ | 48,835 | $ | 47,729 | $ | 40,651 | ||||||||
EBITDA |
$ | 119,740 | $ | 103,012 | $ | 89,436 | $ | 94,451 | $ | 69,000 | ||||||||
EBITDA / cash interest expense |
3.3x | 2.2x | 1.8x | 2.0x | 1.7x | |||||||||||||
29
Item 7. Management's Discussion and Analysis of Financial Condition and Results of Operation.
The following Management's Discussion and Analysis of Financial Condition and Results of Operations contains forward-looking statements that involve risks and uncertainties. Our actual results could differ materially from those anticipated in these forward-looking statements as a result of certain factors, including those set forth under Item 1A, "Risk Factors" and under the heading "Forward-Looking Statements" below and elsewhere in this report. The following discussion should be read in conjunction with the consolidated financial statements and related notes included elsewhere in this report.
General
We manufacture, sell and distribute a diverse portfolio of branded, high quality, shelf-stable food products, many of which have leading regional or national market shares. In general, we position our branded products to appeal to the consumer desiring a high quality and reasonably priced product. We complement our branded product retail sales with institutional and food service sales and limited private label sales.
Our goal is to continue to increase sales, profitability and cash flows by enhancing our existing portfolio of branded shelf stable products and by capitalizing on our competitive strengths. We intend to implement our growth strategy through the following initiatives: expanding our brand portfolio with disciplined acquisitions of complementary branded businesses, continuing to develop new products and delivering them to market quickly, leveraging our multiple channel sales and distribution system and continuing to focus on higher growth customers and distribution channels.
We are subject to a number of challenges that may adversely affect our businesses. These challenges, which are discussed above under Item 1A, "Risk Factors" and below under the heading "Forward-Looking Statements" include:
Fluctuations in Commodity Prices and Production and Distribution Costs: We purchase raw materials, including agricultural products, meat, poultry, ingredients and packaging materials, from growers, commodity processors, other food companies and packaging suppliers located in U.S. and foreign locations. Raw materials and other input costs, such as fuel, are subject to fluctuations in price attributable to a number of factors. Fluctuations in commodity prices can lead to retail price volatility and intensive price competition, and can influence consumer and trade buying patterns. The cost of raw materials, fuel, labor, distribution and other costs related to our operations can increase from time to time significantly and unexpectedly.
For example, we purchase maple syrup primarily from Québec, Canada and Vermont. In 2008, maple syrup production in Canada, which represents the great majority of global production, was significantly below industry needs due to growing global demand and one of the worst crop yields in nearly 40 years. As a result, the price we paid for maple syrup increased significantly and we were faced with a shortfall in supply as compared to our needs, which had a negative impact on our sales volume of maple syrup products during fiscal 2008 that continued through the first two quarters of 2009. The 2010 maple syrup crop yield was more consistent with historic levels.
During fiscal 2011, we expect significant cost increases for raw materials, transportation and energy. We attempt to manage cost inflation risks by locking in prices through short-term supply contracts and advance commodities purchase agreements and by implementing cost saving measures. We also attempt to offset rising input costs by raising sales prices to our customers. However, increases in the prices we charge our customers may lag behind rising input costs. Competitive pressures also may limit our ability to quickly raise prices in response to rising costs. During 2009 and 2010, our sales price increases and our cost saving measures more than offset our cost increases. To the extent we are unable to avoid or offset the impact of 2011 and future cost increases by locking in our costs,
30
implementing cost saving measures or increasing prices to our customers, our operating results could be materially adversely affected. In addition, should input costs begin to decline, customers may look for price reductions in situations where we have locked into purchases at higher costs.
Consolidation in the Retail Trade and Consequent Inventory Reductions: As the retail grocery trade continues to consolidate and our retail customers grow larger and become more sophisticated, our retail customers may demand lower pricing and increased promotional programs. These customers are also reducing their inventories and increasing their emphasis on private label products.
Changing Customer Preferences: Consumers in the market categories in which we compete frequently change their taste preferences, dietary habits and product packaging preferences.
Consumer Concern Regarding Food Safety, Quality and Health: The food industry is subject to consumer concerns regarding the safety and quality of certain food products. If consumers in our principal markets lose confidence in the safety and quality of our food products even as a result of a product liability claim or a product recall by a food industry competitor, our business could be adversely affected.
Fluctuations in Currency Exchange Rates: We purchase the majority of our maple syrup requirements from suppliers located in Québec, Canada. Any weakening of the U.S. dollar against the Canadian dollar, could significantly increase our costs relating to the production of our maple syrup products to the extent we have not purchased Canadian dollars in advance of any such weakening of the U.S. dollar.
To confront these challenges, we continue to take steps to build the value of our brands, to improve our existing portfolio of products with new product and marketing initiatives, to reduce costs through improved productivity, to address consumer concerns about food safety, quality and health and to favorably manage currency fluctuations.
Critical Accounting Policies; Use of Estimates
The preparation of financial statements in accordance with accounting principles generally accepted in the United States requires our management to make a number of estimates and assumptions relating to the reporting of assets and liabilities and the disclosure of contingent assets and liabilities at the date of the consolidated financial statements and the reported amounts of revenues and expenses during the reporting period. Some of the more significant estimates and assumptions made by management involve trade and consumer promotion expenses; allowances for excess, obsolete and unsaleable inventories; pension benefits; purchase accounting allocations; the recoverability of goodwill, trademarks, other intangible assets, property, plant and equipment, and deferred tax assets; and the accounting for share-based compensation expense. Actual results could differ from these estimates and assumptions.
Our significant accounting policies are described more fully in note 2 to our consolidated financial statements included elsewhere in this report. We believe the following critical accounting policies involve the most significant judgments and estimates used in the preparation of our consolidated financial statements.
Trade and Consumer Promotion Expenses
We offer various sales incentive programs to customers and consumers, such as price discounts, in-store display incentives, slotting fees and coupons. The recognition of expense for these programs involves the use of judgment related to performance and redemption estimates. Estimates are made based on historical experience and other factors. Actual expenses may differ if the level of redemption rates and performance vary from our estimates.
31
Inventories
Inventories are stated at the lower of cost or market. Cost is determined using the first in, first out and average cost methods. Inventories have been reduced by an allowance for excess, obsolete and unsaleable inventories. The allowance is an estimate based on our management's review of inventories on hand compared to estimated future usage and sales.
Long-Lived Assets
Long-lived assets, such as property, plant and equipment, and intangibles with estimated useful lives are depreciated or amortized over their respective estimated useful lives to their estimated residual values, and reviewed for impairment whenever events or changes in circumstances indicate that the carrying amount of an asset may not be recoverable. Recoverability of assets to be held and used is measured by a comparison of the carrying amount of an asset to estimated undiscounted future cash flows expected to be generated by the asset. If the carrying amount of an asset exceeds its estimated undiscounted future cash flows, an impairment charge is recognized by the amount by which the carrying amount of the asset exceeds the fair value of the asset. Recoverability of assets held for sale is measured by a comparison of the carrying amount of an asset or asset group to their fair value less estimated costs to sell. Estimating future cash flows and calculating fair value of assets requires significant estimates and assumptions by management.
Goodwill and Other Intangible Assets
Goodwill and indefinite-lived intangible assets (trademarks) are tested for impairment at least annually and whenever events or circumstances occur indicating that goodwill or indefinite-lived intangibles might be impaired.
We perform the annual impairment tests as of the last day of each fiscal year. The annual goodwill impairment test involves a two-step process. The first step of the impairment test involves comparing the fair value of our company with our company's carrying value, including goodwill. If the carrying value of our company exceeds our fair value, we perform the second step of the impairment test to determine the amount of the impairment loss. The second step of the goodwill impairment test involves comparing the implied fair value of goodwill with the carrying value of that goodwill and recognizing a loss for the difference. Calculating our fair value for purposes of the second step of the impairment test requires significant estimates and assumptions by management. We estimate our fair value by applying third party market value indicators to our EBITDA. We test indefinite-lived intangible assets for impairment by comparing their carrying value to their fair value.
We completed our annual impairment tests for fiscal 2010, 2009 and 2008 with no adjustments to the carrying values of goodwill and indefinite-lived intangibles. However, materially different, assumptions regarding the future performance of our business could result in significant impairment losses. In addition, any significant decline in our market capitalization, even if due to macroeconomic factors, could put pressure on the carrying value of our goodwill. A determination that all or a portion of our goodwill or indefinite-lived intangible assets are impaired, although a non-cash charge to operations, could have a material adverse effect on our business, consolidated financial condition and results of operations.
Income Tax Expense Estimates and Policies
As part of the income tax provision process of preparing our consolidated financial statements, we are required to estimate our income taxes. This process involves estimating our current tax expenses together with assessing temporary differences resulting from differing treatment of items for tax and accounting purposes. These differences result in deferred tax assets and liabilities. We then assess the likelihood that our deferred tax assets will be recovered from future taxable income and to the extent
32
we believe the recovery is not likely, we establish a valuation allowance. Further, to the extent that we establish a valuation allowance or increase this allowance in a financial accounting period, we include such charge in our tax provision, or reduce our tax benefits in our consolidated statements of operations. We use our judgment to determine our provision or benefit for income taxes, deferred tax assets and liabilities and any valuation allowance recorded against our deferred tax assets.
There are various factors that may cause these tax assumptions to change in the near term, and we may have to record a valuation allowance against our deferred tax assets. We cannot predict whether future U.S. federal and state income tax laws and regulations might be passed that could have a material effect on our results of operations. We assess the impact of significant changes to the U.S. federal and state income tax laws and regulations on a regular basis and update the assumptions and estimates used to prepare our consolidated financial statements when new regulations and legislation are enacted. We recognize the benefit of an uncertain tax position that we have taken or expect to take on the income tax returns we file if it is more likely than not that such tax position will be sustained based upon its technical merits.
Earnings Per Share
Basic earnings per share is calculated by dividing net income by the weighted average number of shares of common stock outstanding. Diluted earnings per share is calculated by dividing net income by the weighted average number of shares of common stock outstanding plus all additional shares of common stock that would have been outstanding if potentially dilutive shares of common stock related to performance shares that may be earned under long-term incentive awards had been issued as of the beginning of the period using the treasury stock method.
Pension Expense
We have defined benefit pension plans covering substantially all of our employees. Our funding policy is to contribute annually not less than the amount recommended by our actuaries. The funded status of our pension plans is dependent upon many factors, including returns on invested assets and the level of certain market interest rates. We review pension assumptions regularly and we may from time to time make voluntary contributions to our pension plans, which exceed the amounts required by statute. During fiscal 2010, we made total pension contributions to our pension plans of $4.1 million compared with $3.6 million in fiscal 2009. Changes in interest rates and the market value of the securities held by the plans could materially change, positively or negatively, the underfunded status of the plans and affect the level of pension expense and required contributions in fiscal 2011 and beyond.
Our discount rate assumption for the three defined benefit plans changed from 6.00% at January 2, 2010 to 5.50% at January 1, 2011. While we do not presently anticipate a change in our fiscal 2011 assumptions, as a sensitivity measure, a 0.25% decline or increase in our discount rate would increase or decrease our pension expense by approximately $0.2 million. Similarly, a 0.25% decrease or increase in the expected return on pension plan assets would increase or decrease our pension expense by approximately $0.1 million. During the first quarter of fiscal 2011, we have made $1.6 million in defined benefit pension plan contributions and expect to make $1.5 million of additional voluntary contributions during the remainder of the year.
Acquisition Accounting
Our consolidated financial statements and results of operations include an acquired business's operations after the completion of the acquisition. We account for acquired businesses using the purchase method of accounting, which requires that the assets acquired and liabilities assumed be recorded at the date of acquisition at their respective fair values. Any excess of the purchase price over
33
the estimated fair values of the net assets acquired is recorded as goodwill. Transaction costs are expensed as incurred.
The judgments made in determining the estimated fair value assigned to each class of assets acquired and liabilities assumed, as well as asset lives, can materially impact our results of operations. Accordingly, for significant items, we typically obtain assistance from third party valuation specialists. Determining the useful life of an intangible asset also requires judgment as different types of intangible assets will have different useful lives and certain assets may even be considered to have indefinite useful lives. All of these judgments and estimates can materially impact our results of operations.
Results of Operations
The following table sets forth the percentages of net sales represented by selected items reflected in our consolidated statements of operations. The comparisons of financial results are not necessarily indicative of future results:
| |
Fiscal 2010 | Fiscal 2009 | Fiscal 2008 | ||||||||
|---|---|---|---|---|---|---|---|---|---|---|---|
Statement of Operations: |
|||||||||||
Net sales |
100.0 | % | 100.0 | % | 100.0 | % | |||||
Cost of goods sold |
67.3 | % | 70.3 | % | 72.5 | % | |||||
Gross profit |
32.7 | % | 29.7 | % | 27.5 | % | |||||
Sales, marketing and warehousing expenses |
8.7 | % | 8.6 | % | 9.2 | % | |||||
General and administrative expenses |
2.3 | % | 2.2 | % | 1.8 | % | |||||
Amortization expense |
1.3 | % | 1.3 | % | 1.3 | % | |||||
Operating income |
20.4 | % | 17.6 | % | 15.2 | % | |||||
Interest expense, net |
7.9 | % | 9.9 | % | 11.9 | % | |||||
Loss on extinguishment of debt |
3.0 | % | 2.0 | % | — | ||||||
Income before income tax expense |
9.5 | % | 5.7 | % | 3.2 | % | |||||
Income tax expense |
3.2 | % | 2.2 | % | 1.2 | % | |||||
Net income |
6.3 | % | 3.5 | % | 2.0 | % | |||||
As used in this section the terms listed below have the following meanings:
Net Sales. Our net sales represents gross sales of products shipped to customers plus amounts charged customers for shipping and handling, less cash discounts, coupon redemptions, slotting fees and trade promotional spending.
Gross Profit. Our gross profit is equal to our net sales less cost of goods sold. The primary components of our cost of goods sold are cost of internally manufactured products, purchases of finished goods from co-packers plus freight costs to our distribution centers and to our customers. For fiscal 2008, cost of goods sold includes a small portion of the severance and termination charges we incurred in connection with a workforce reduction implemented in October 2008.
Sales, Marketing and Warehousing Expenses. Our sales, marketing and warehousing expenses include costs for marketing personnel, consumer advertising programs, internal sales forces, brokerage costs and warehouse facilities.
General and Administrative Expenses. Our general and administrative expenses include administrative employee compensation and benefit costs, as well as information technology infrastructure and communication costs, office rent and supplies, professional services and other general corporate expenses. For fiscal 2008, general and administrative expenses include severance and termination charges related to a workforce reduction implemented in October 2008.
34
Amortization Expense. Amortization expense includes the amortization expense associated with customer relationship and other intangibles.
Net Interest Expense. Net interest expense includes interest relating to our outstanding indebtedness, amortization of bond discount and amortization of deferred debt financing costs, net of interest income and subsequent to our determination in September 2008 that our interest rate swap was no longer an effective hedge for accounting purposes, unrealized gains or losses on the interest rate swap and the reclassification of amounts recorded in accumulated other comprehensive loss related to the swap.
Loss on Extinguishment of Debt. Loss on extinguishment of debt includes costs relating to the retirement of indebtedness, including any repurchase premium and write-off of deferred debt financing costs.
Fiscal 2010 Compared to Fiscal 2009
Net Sales. Net sales increased $12.3 million or 2.5% to $513.3 million for fiscal 2010 from $501.0 million for fiscal 2009. The increase was attributable to unit volume and sales price increases of $7.5 million and $5.6 million, respectively, partially offset by an increase in coupon expenses of $0.8 million.
Net sales of our Don Pepino and Sclafani brands, which we acquired in late November 2010, contributed $1.6 million to the overall unit volume increase. Net sales of our Ortega, Cream of Wheat, Maple Grove Farms of Vermont, Las Palmas, Polaner, Grandma's, Underwood and Ac'cent products increased by $6.9 million, $3.0 million, $2.6 million, $1.4 million, $1.0 million, $0.6 million, $0.6 million and $0.6 million or 5.8%, 4.9%, 4.0%, 4.6%, 2.8%, 4.8%, 2.9% and 3.1%, respectively. These increases were offset by a reduction in net sales of B&G, B&M and Joan of Arc products of $2.6 million, $2.5 million and $0.8 million or 7.0%, 9.8% and 6.2%, respectively. In the aggregate, net sales for all other brands decreased $0.1 million or 0.2%.
Gross Profit. Gross profit increased $19.0 million or 12.7% to $167.7 million in fiscal 2010 from $148.7 million in fiscal 2009. Gross profit expressed as a percentage of net sales increased 3.0 percentage points to 32.7% in fiscal 2010 from 29.7% in fiscal 2009. Of the 3.0 percentage point increase, 0.7 percentage points was attributable to increased sales prices net of increased coupon expenses; 0.3 percentage points was attributable to a gain on a legal settlement; and 2.0 percentage points was primarily attributable to decreases in commodity and ingredient costs and a sales mix shift to higher margin products, slightly offset by an increase in packaging costs.
Sales, Marketing and Warehousing Expenses. Sales, marketing and warehousing expenses increased $1.6 million or 3.8% to $44.7 million for fiscal 2010 from $43.1 million for fiscal 2009. This increase is primarily due to increases in consumer marketing and trade spending of $3.0 million, offset by decreases in warehousing costs resulting from warehouse consolidations of $1.2 million and brokerage of $0.2 million. Expressed as a percentage of net sales, our sales, marketing and warehousing expenses increased 0.1 percentage points to 8.7% in fiscal 2010 from 8.6% in fiscal 2009.
General and Administrative Expenses. General and administrative expenses increased $0.9 million or 8.2% to $11.8 million in fiscal 2010 from $10.9 million in fiscal 2009. The increase in general and administrative expenses primarily resulted from an increase in compensation expense of $0.4 million and other expenses of $0.5 million.
Amortization Expense. Amortization expense remained consistent at $6.5 million in fiscal 2010 as compared to fiscal 2009.
Operating Income. As a result of the foregoing, operating income increased $16.4 million or 18.6% to $104.7 million in fiscal 2010 from $88.3 million in fiscal 2009. Operating income expressed as a percentage of net sales increased to 20.4% in fiscal 2010 from 17.6% in fiscal 2009.
35
Net Interest Expense. Net interest expense decreased $9.1 million to $40.3 million in fiscal 2010 from $49.4 million in fiscal 2009. The decrease in net interest expense in fiscal 2010 was primarily attributable to a decrease of 1.5 percentage points in the effective interest rate on our long-term debt to 8.0% in fiscal 2010 from 9.5% in fiscal 2009 and a reduction in the average principal amount of our long-term debt outstanding during fiscal 2010 as compared to fiscal 2009. The decrease in the effective interest rate and the reduction in the average principal amount of our long-term debt outstanding is the result of the refinancing of our 8% senior notes and 12% senior subordinated notes with the proceeds of the issuance of our 7.625% senior notes in fiscal 2010 and our public offering of common stock completed in the third quarter of 2009. See "—Liquidity and Capital Resources—Debt" below. The decrease was partially offset by an increase in interest expense of $2.1 million relating to an interest rate swap.
Loss on Extinguishment of Debt. Loss on extinguishment of debt increased $5.0 million to $15.2 million in fiscal 2010 from $10.2 million in fiscal 2009. Loss on extinguishment of debt for fiscal 2010 includes costs relating to our repurchase and redemption of $69.5 million aggregate principal amount of senior subordinated notes and $240.0 million aggregate principal amount of senior notes, including $10.7 million for the payment of a repurchase premium and a non-cash charge of $4.5 million for the write-off of unamortized deferred debt financing costs associated with the notes repurchased. Loss on extinguishment of debt during for fiscal 2009 consisted of $10.2 million of costs relating to our repurchase and redemption of $96.3 million aggregate principal amount of senior subordinated notes during the third and fourth quarters of fiscal 2009, including $5.8 million for the payment of a repurchase premium and a non-cash charge of $4.4 million for the write-off of unamortized deferred debt financing costs associated with the notes repurchased.
Income Tax Expense. Income tax expense increased $5.6 million to $16.8 million in fiscal 2010 from $11.2 million in fiscal 2009. Our effective tax rate for fiscal 2010 was 34.1% as compared with 39.2% for fiscal 2009. The decrease in our 2010 effective tax rate was primarily attributable to a reduction in our blended statutory state tax rate to 2.4% versus 2.9% in 2009. This reduction in the blended state rate also reduced our deferred tax liabilities by $1.1 million, or a 2.1 percentage point reduction in our effective tax rate. We also received an additional 0.9 percentage point benefit for an increase in our allowed manufacturing credit and other permanent tax differences. In addition, in fiscal 2009, we experienced an increase in our effective tax rate (that was not experienced in fiscal 2010) from the utilization of New Jersey net operating loss carryforwards that carry a higher effective tax rate than other deferred tax assets.
Fiscal 2009 Compared to Fiscal 2008
Our fiscal 2009 included fifty-two weeks of operating results compared with fifty-three weeks in fiscal 2008.
Net Sales. Net sales increased $14.1 million or 2.9% to $501.0 million for fiscal 2009 from $486.9 million for fiscal 2008. The increase was attributable to sales price increases of $27.2 million partially offset by a decrease in unit volume of $13.1 million.
Net sales of our lines of Ortega, Las Palmas, B&M, Ac'cent, Joan of Arc and Grandma's products increased by $15.5 million, $3.2 million, $2.0 million, $1.6 million, $1.3 million and $1.2 million or 14.9%, 12.0%, 8.5%, 9.3%, 10.9% and 10.6%, respectively. These increases were offset by a reduction in net sales of B&G, Polaner, Cream of Wheat, private label pickles and peppers, Vermont Maid, Maple Grove Farms of Vermont and Emeril's products of $3.5 million, $2.1 million, $1.9 million, $1.4 million, $1.0 million, $0.6 million and $0.4 million or 10.2%, 5.3%, 3.0%, 18.5%, 34.1%, 0.9% and 2.4%, respectively. In the aggregate, net sales for all other brands increased $0.2 million or 0.2%.
Gross Profit. Gross profit increased $14.8 million or 11.1% to $148.7 million in fiscal 2009 from $133.9 million in fiscal 2008. Gross profit expressed as a percentage of net sales increased
36
2.2 percentage points to 29.7% in fiscal 2009 from 27.5% in fiscal 2008. The increase in gross profit expressed as a percentage of net sales was primarily attributable to increased sales prices of $27.2 million and reduced wheat and maple syrup costs partially offset by increased costs for beans and packaging and an increase in our accrual for performance-based compensation of $2.3 million.
Sales, Marketing and Warehousing Expenses. Sales, marketing and warehousing expenses decreased $1.8 million or 4.0% to $43.1 million for fiscal 2009 from $44.9 million for fiscal 2008. This decrease is primarily due to a decrease in consumer marketing of $1.5 million, trade spending of $1.6 million, general selling expenses of $0.4 million and brokerage expenses of $0.3 million, offset by an increase in warehousing expenses of $0.5 million and an increase in our accrual for performance based compensation of $1.5 million. Expressed as a percentage of net sales, our sales, marketing and warehousing expenses decreased 0.6 percentage points to 8.6% in fiscal 2009 from 9.2% in fiscal 2008.
General and Administrative Expenses. General and administrative expenses increased $2.2 million or 25.0% to $10.9 million in fiscal 2009 from $8.7 million in fiscal 2008. This increase was primarily the result of an increase in our accrual for performance based compensation of $3.3 million, partially offset by a decrease in severance and termination expenses of $0.7 million and professional fees of $0.4 million.
Amortization Expense. Amortization expense remained consistent at $6.5 million in fiscal 2009 as compared to fiscal 2008.
Operating Income. As a result of the foregoing, operating income increased $14.4 million or 19.5% to $88.3 million in fiscal 2009 from $73.9 million in fiscal 2008. Operating income expressed as a percentage of net sales increased to 17.6% in fiscal 2009 from 15.2% in fiscal 2008.
Net Interest Expense. Net interest expense decreased $8.7 million to $49.4 million in fiscal 2009 from $58.1 million in fiscal 2008. Net interest expense in fiscal 2009 includes a $1.5 million benefit relating to an unrealized gain on an interest rate swap, more than offset by a $1.7 million charge for the reclassification of the amount recorded in accumulated other comprehensive loss related to the swap. Net interest expense in fiscal 2008 includes a $5.6 million charge relating to the unrealized loss on an interest rate swap and a $0.5 million charge for the reclassification of the amount recorded in accumulated other comprehensive loss related to the swap. The remaining decrease in net interest expense was primarily attributable to our repurchase and redemption of $96.3 million aggregate principal amount of our senior subordinated notes during the third and fourth quarters of fiscal 2009. See "—Liquidity and Capital Resources—Debt" below.
Loss on Extinguishment of Debt. Loss on extinguishment of debt for fiscal 2009 includes $10.2 million of costs relating to our repurchase and redemption of $96.3 million aggregate principal amount of senior subordinated notes during the third and fourth quarters of fiscal 2009, including $5.8 million for the payment of a repurchase premium and a non-cash charge of $4.4 million for the write-off of unamortized deferred debt financing costs associated with the notes repurchased. During fiscal 2008, we did not extinguish any debt.
Income Tax Expense. Income tax expense increased $5.1 million to $11.2 million in fiscal 2009 from $6.1 million in fiscal 2008. Our effective tax rate for fiscal 2009 was 39.2% as compared with 38.5% for fiscal 2008. The increase in our effective tax rate for fiscal 2009 is primarily attributable to the utilization of New Jersey net operating loss carry forwards that carried a higher effective tax rate than other deferred tax assets.
Liquidity and Capital Resources
Our primary liquidity requirements include debt service, capital expenditures and working capital needs. See also, "Dividend Policy" and"Commitments and Contractual Obligations" below. We fund our liquidity requirements, as well as our dividend payments and financing for acquisitions, primarily
37
through cash generated from operations and to the extent necessary, through borrowings under our credit facility.
Cash Flows
Net Cash Provided by Operating Activities. Net cash provided by operating activities increased $36.0 million to $98.9 million in fiscal 2010 from $62.9 million in fiscal 2009. Net cash provided by operating activities for fiscal 2008 was $40.5 million. The increase in cash provided by operating activities in fiscal 2010 as compared to fiscal 2009 and fiscal 2008 was primarily due to an increase in net sales, improved profitability and working capital improvements, including a significant reduction in inventory.
Net Cash Used in Investing Activities. Net cash used in investing activities was $25.6 million in fiscal 2010 as compared to $10.7 million for fiscal 2009 and $10.6 million for fiscal 2008. During fiscal 2010, our net cash used in investing activities included $14.6 million for the Don Pepino acquisition and $11.0 million of capital expenditures. During fiscal 2009 and 2008, our net cash used in investing activities consisted entirely of capital expenditures. Our capital expenditures typically include expenditures for building improvements, purchases of manufacturing and computer equipment and capitalized interest. We expect to make capital expenditures of up to $11.0 million in fiscal 2011.
Net Cash Used in Financing Activities. Net cash used in financing activities was $14.5 million, $44.9 million and $33.7 million during fiscal 2010, fiscal 2009 and fiscal 2008, respectively. For fiscal 2010, net cash used in financing activities includes $320.3 million in payments for the repurchase and redemption of $69.5 million principal amount of our 12% senior subordinated notes and $240.0 million principal amount of our 8% senior notes, $32.3 million of dividend payments, $8.2 million of deferred financing costs and $1.5 million of payments of tax withholding on behalf of employees for net share settlement of share-based compensation. Net cash used in financing activities were reduced by net proceeds of $347.4 million from the issuance of our 7.625% senior notes and $0.3 million of excess tax benefits from share-based compensation. For fiscal 2009, net cash used in financing activities includes $102.0 million dollars for the repurchase and redemption of $96.3 million principal amount of senior subordinated notes, $2.3 million for common stock repurchases, $26.4 million for dividend payments and $0.7 million of deferred financing costs, partially offset by net proceeds of $86.6 million from our public offering of common stock. The $4.8 million reduction in dividend payments in fiscal 2009 as compared to fiscal 2008 was due primarily to a reduction in our dividend rate per annum from $0.848 per share in fiscal 2008 to $0.680 per share in fiscal 2009. In fiscal 2008, net cash used in financing activities consisted of $31.2 million for dividend payments and $2.5 million for common stock repurchases.
Cash Income Tax Payments. Based on a number of factors, including our trademark, goodwill and other intangible assets amortization for tax purposes from our prior acquisitions, we realized a significant reduction in cash taxes in fiscal 2010, 2009 and 2008 as compared to our tax expense for financial reporting purposes. While we expect our cash taxes to continue to increase in fiscal 2011 as compared to the prior three years, we believe that we will realize a benefit to our cash taxes payable from amortization of our trademarks, goodwill and other intangible assets for the taxable years 2011 through 2025. If there is a change in U.S. federal tax policy that reduces any of these available deductions or results in an increase in our corporate tax rate, our cash taxes payable may increase further, which could significantly reduce our future cash and impact our ability to make interest and dividend payments.
Dividend Policy
Our dividend policy reflects a basic judgment that our stockholders would be better served if we distributed a substantial portion of our cash available to pay dividends to them instead of retaining it in our business. Under this policy, a substantial portion of the cash generated by our company in excess of
38
operating needs, interest and principal payments on indebtedness, capital expenditures sufficient to maintain our properties and other assets is in general distributed as regular quarterly cash dividends (up to the intended dividend rate as determined by our board of directors) to the holders of our common stock and not retained by us. From the date of our initial public offering in October 2004 through the dividend payment we made on October 30, 2008, the dividend rate for our common stock was $0.848 per share per annum. Beginning with the dividend payment paid on January 30, 2009 through the dividend payment paid on January 31, 2011, the dividend rate was $0.680 per share per annum. Beginning with the dividend previously declared and payable on May 2, 2011, our board of directors has increased the dividend rate to $0.840 per share per annum.
Dividend payments, however, are not mandatory or guaranteed and holders of our common stock do not have any legal right to receive, or require us to pay, dividends. Furthermore, our board of directors may, in its sole discretion, amend or repeal this dividend policy. Our board of directors may decrease the level of dividends below the intended dividend rate or discontinue entirely the payment of dividends. Future dividends with respect to shares of our common stock depend on, among other things, our results of operations, cash requirements, financial condition, contractual restrictions, business opportunities, acquisition opportunities, the condition of the debt and equity financing markets, provisions of applicable law and other factors that our board of directors may deem relevant. Our board of directors is free to depart from or change our dividend policy at any time and could do so, for example, if it was to determine that we have insufficient cash to take advantage of growth opportunities. In addition, over time, our EBITDA and capital expenditure, working capital and other cash needs will be subject to uncertainties, which could impact the level of dividends, if any, we pay in the future. Our senior notes indenture and the terms of our credit facility contain significant restrictions on our ability to make dividend payments. In addition, certain provisions of the Delaware General Corporation Law may limit our ability to pay dividends. See Part II, Item 5 of this report for a more detailed discussion of our dividend policy.
As a result of our dividend policy, we may not retain a sufficient amount of cash to finance growth opportunities or unanticipated capital expenditure needs or to fund our operations in the event of a significant business downturn. We may have to forego growth opportunities or capital expenditures that would otherwise be necessary or desirable if we do not find alternative sources of financing. If we do not have sufficient cash for these purposes, our financial condition and our business will suffer.
For fiscal 2010 and 2009, we had cash flows provided by operating activities of $98.9 million and $62.9 million, respectively, and distributed $32.3 million and $26.4 million, respectively, as dividends. At our current intended dividend rate of $0.840 per share per annum, we expect our aggregate dividend payments in fiscal 2011 to be approximately $38.3 million. If our cash flows from operating activities for future periods were to fall below our minimum expectations (or if our assumptions as to capital expenditures or interest expense were too low or our assumptions as to the sufficiency of our revolving credit facility to finance our working capital needs were to prove incorrect), we would need either to further reduce or eliminate dividends or, to the extent permitted under our senior notes indenture and the terms of our credit facility, fund a portion of our dividends with borrowings or from other sources. If we were to use working capital or permanent borrowings to fund dividends, we would have less cash and/or borrowing capacity available for future dividends and other purposes, which could negatively impact our financial position, our results of operations, our liquidity and our ability to maintain or expand our business.
Acquisitions
Our liquidity and capital resources have been significantly impacted by acquisitions and may be impacted in the foreseeable future by additional acquisitions. As discussed elsewhere in this report, as part of our growth strategy we plan to expand our brand portfolio with disciplined acquisitions of complementary brands. We have historically financed acquisitions with borrowings and cash flows from operating activities. As a result, our interest expense has in the past increased as a result of additional
39
indebtedness we have incurred in connection with acquisitions, and will increase with any additional indebtedness we may incur to finance future acquisitions, if any. The impact of future acquisitions, whether financed with additional indebtedness or otherwise, may have a material impact on our liquidity.
Environmental and Health and Safety Costs
We have not made any material expenditures during fiscal 2010, 2009 and 2008 in order to comply with environmental laws or regulations. Based on our experience to date, we believe that the future cost of compliance with existing environmental laws and regulations (and liability for known environmental conditions) will not have a material adverse effect on our consolidated financial condition, results of operations or liquidity. However, we cannot predict what environmental or health and safety legislation or regulations will be enacted in the future or how existing or future laws or regulations will be enforced, administered or interpreted, nor can we predict the amount of future expenditures that may be required in order to comply with such environmental or health and safety laws or regulations or to respond to such environmental claims.
Debt
Senior Secured Credit Facility. As amended, our $25.0 million revolving credit facility and our $130.0 million of term loan borrowings mature in February 2013. The following discussion of the credit facility describes the credit facility as amended through the date of this report.
Interest under the revolving credit facility, including any outstanding letters of credit, is determined based on alternative rates that we may choose in accordance with the revolving credit facility, including the base lending rate per annum plus an applicable margin of 2.00%, and LIBOR plus an applicable margin of 3.00%. We pay a commitment fee of 0.50% per annum on the unused portion of the revolving credit facility. Interest under the term loan facility is determined based on alternative rates that we may choose in accordance with the credit facility, including the base lending rate per annum plus an applicable margin of 1.00%, and LIBOR plus an applicable margin of 2.00%.
Our obligations under the credit facility are jointly and severally and fully and unconditionally guaranteed on a senior basis by all of our existing and certain future domestic subsidiaries. The credit facility is secured by substantially all of our and our domestic subsidiaries' assets except our and our domestic subsidiaries' real property. The credit facility provides for mandatory prepayment upon certain asset dispositions and issuances of securities, as defined. The credit facility contains covenants that restrict, among other things, our ability to incur additional indebtedness, pay dividends and create certain liens. The credit facility also contains certain financial maintenance covenants, which, among other things, specify maximum capital expenditure limits, a minimum interest coverage ratio and a maximum senior and total leverage ratio, each ratio as defined. As of January 1, 2011, we were in compliance with all of the covenants in the credit facility. Proceeds of the revolving credit facility are restricted to funding our working capital requirements, capital expenditures and acquisitions of companies in the same or a similar line of business as our company, subject to specified criteria. The maximum letter of credit capacity under the revolving credit facility is $10.0 million, with a fronting fee of 3.0% per annum for all outstanding letters of credit.
At January 1, 2011, the available borrowing capacity under our revolving credit facility, net of outstanding letters of credit of $0.5 million, was $24.5 million. We have not drawn upon the revolving credit facility since its inception in October 2004 and, based upon our cash and cash equivalents on hand and working capital requirements, we have no plans to do so for the foreseeable future.
In February 2007, we entered into a six-year interest rate swap agreement in order to effectively fix at 7.0925% the interest rate payable for our $130.0 million of term loan borrowings under the credit agreement through the life of the term loan borrowings. On January 18, 2011, we terminated the interest rate swap agreement by making a payment of $12.4 million to the counterparty, representing
40
the approximate present value of the expected remaining settlement payments that otherwise were to have been due to the counterparty through maturity of the term loan. In connection with the termination, we and the counterparty released each other from all obligations under the interest rate swap agreement, including, without limitation, the obligation to make periodic payments thereunder. We did not pay any termination penalty in connection with the termination of the interest rate swap agreement. As a result of the termination, our interest obligations for the term loan borrowings through maturity in 2013 will now be determined based upon a floating rate as described above.
In February 2007, we initially designated the interest rate swap as a cash flow hedge and recorded changes in the fair value of the swap in accumulated other comprehensive loss, net of tax in our consolidated balance sheet. In September 2008 due to the counterparty's bankruptcy, we determined that the interest rate swap was no longer an effective hedge for accounting purposes. Accordingly, subsequent to that determination, we recorded changes in the swap's fair value in current earnings in net interest expense in our consolidated statements of operations. We obtained third-party verification of fair value at the end of each reporting period. As of January 1, 2011, the fair value of the interest rate swap was an unrealized loss of $12.0 million and is recorded in current liabilities on our consolidated balance sheet. The amount recorded in accumulated other comprehensive loss will be reclassified to net interest expense over the remaining life of the term loan borrowings as we make interest payments. Net interest expense in fiscal 2010 includes a charge of $0.4 million relating to unrealized loss on the interest rate swap and a reclassification of $1.7 million of the amount recorded in accumulated other comprehensive loss related to the swap. Net interest expense in fiscal 2010 also includes a reduction in interest income primarily due to lower interest rates.
We expect to reclassify $3.7 million of accumulated other comprehensive loss to net interest expense through maturity of the term loan borrowings in 2013, with $1.7 million being reclassified in 2011. As a result of the swap termination, we currently expect our interest expense for the term loan borrowings to be reduced by approximately $6.2 million in each of fiscal 2011 and 2012 and by approximately $1.1 million in fiscal 2013, or a total of approximately $13.5 million through maturity of the term loan borrowing. However, any increase in LIBOR during that time period, will reduce the expected interest expense reduction.
7.625% Senior Notes due 2018. In January 2010, we issued $350.0 million aggregate principal amount of 7.625% senior notes due 2018 at a public offering price of 99.271% of their face value. Accordingly, the original issue discount and debt financing costs are being amortized through the maturity date of the senior notes. Interest on the senior notes is payable on January 15 and July 15 of each year. The senior notes will mature on January 15, 2018, unless earlier retired or redeemed as described below.
On or after January 15, 2014, we may redeem some or all of the senior notes at a redemption price of 103.813% beginning January 15, 2014 and thereafter at prices declining annually to 100% on or after January 15, 2017, plus accrued and unpaid interest to the date of redemption. We may redeem up to 35% of the aggregate principal amount of the notes prior to January 15, 2013 with the net proceeds from certain equity offerings at a redemption price of 107.625% plus accrued and unpaid interest to the date of redemption. We may also redeem some or all of the notes at any time prior to January 15, 2014 at a redemption price equal to a specified make-whole amount plus accrued and unpaid interest to the date of redemption. In addition, if we undergo a change of control, we may be required to offer to repurchase the notes at the repurchase price of 101% plus accrued and unpaid interest to the date of redemption.
We may also, from time to time, seek to retire senior notes through cash repurchases of senior notes and/or exchanges of senior notes for equity securities, in open market purchases, privately negotiated transactions or otherwise. Such repurchases or exchanges, if any, will depend on prevailing market conditions, our liquidity requirements, contractual restrictions and other factors. The amounts involved may be material.
41
Our obligations under the senior notes are jointly and severally and fully and unconditionally guaranteed on a senior basis by all of our existing and certain future domestic subsidiaries. The senior notes and the subsidiary guarantees are our and the guarantors' general unsecured obligations and are effectively junior in right of payment to all of our and the guarantors' secured indebtedness and to the indebtedness and other liabilities of our non-guarantor subsidiaries; are pari passu in right of payment to all of our and the guarantors' existing and future unsecured senior debt; and are senior in right of payment to all of our and the guarantors' future subordinated debt. Our foreign subsidiary is not a guarantor, and any future foreign or partially owned domestic subsidiaries will not be guarantors, of our senior notes.
Our senior notes indenture contains covenants with respect to us and the guarantors and restricts the incurrence of additional indebtedness and the issuance of capital stock; the payment of dividends or distributions on, and redemption of, capital stock; a number of other restricted payments, including certain investments; specified creation of liens, certain sale-leaseback transactions and sale of certain specified assets; fundamental changes, including consolidation, mergers and transfers of all or substantially all of our assets; and specified transactions with affiliates. Each of the covenants is subject to a number of important exceptions and qualifications. As of January 1, 2011, we were in compliance with all of the covenants in the senior notes indenture.
Loss on Extinguishment of Debt. Loss on extinguishment of debt during fiscal 2009 included $10.2 million of costs relating to our repurchase and redemption of $96.3 million aggregate principal amount of 12% senior subordinated notes during fiscal 2009, including $5.8 million for the payment of a repurchase premium and a non-cash charge of $4.4 million for the write-off of unamortized deferred financing costs associated with the notes repurchased. In connection with the retirement of the remaining 12% senior subordinated notes and our 8% senior notes during the first quarter of 2010, we incurred a loss on extinguishment of debt of approximately $15.2 million during fiscal 2010, including the repurchase premium and other expenses of $10.7 million and as mentioned above, a write-off and expense of $4.5 million of deferred debt financing costs.
Stock and Debt Repurchase Program.
On February 22, 2011, our board of directors authorized a stock and debt repurchase program for the repurchase of up to $25.0 million of our common stock and/or 7.625% senior notes through March 31, 2012. Under the authorization, our company may purchase shares of common stock and/or senior notes from time to time in the open market or in privately negotiated transactions in compliance with the applicable rules and regulations of the Securities and Exchange Commission.
The timing and amount of stock and/or debt repurchases under the program, if any, will be at the discretion of management, and will depend on available cash, market conditions and other considerations. Therefore, there can be no assurance as to the number of shares, if any, that will be repurchased under the repurchase program, or the aggregate dollar amount of the shares or principal amount of senior notes, if any, repurchased. We may discontinue the program at any time. Any shares or senior notes repurchased pursuant to the repurchase program will be cancelled.
Future Capital Needs
We are highly leveraged. On January 1, 2011, our total long-term debt of $477.7 million, net of our cash and cash equivalents of $98.7 million was $379.0 million. Stockholders' equity as of that date was $230.6 million.
Our ability to generate sufficient cash to fund our operations depends generally on our results of operations and the availability of financing. Our management believes that our cash on hand, cash flow from operating activities and available borrowing capacity under our revolving credit facility will be sufficient for the foreseeable future to fund operations, meet debt service requirements, fund capital
42
expenditures, make future acquisitions within our line of business, if any, and pay our anticipated dividends on our common stock. We expect to make capital expenditures of up to $11.0 million in fiscal 2011.
Seasonality
Sales of a number of our products tend to be seasonal and may be influenced by holidays, changes in seasons or other annual events. In the aggregate, however, sales of our products are not heavily weighted to any particular quarter due to the offsetting nature of demands for our diversified product portfolio. Sales during the fourth quarter are generally higher than those of the preceding three quarters.
We purchase most of the produce used to make our shelf-stable pickles, relishes, peppers, tomatoes and other related specialty items during the months of July through October, and we purchase substantially all of our maple syrup requirements during the months of April through August. Consequently, our liquidity needs are greatest during these periods.
Inflation
During fiscal 2008 and to a limited extent during 2009, we were faced with significant cost increases for certain commodities and packaging materials. We manage this risk by entering into short-term supply contracts and advance commodities purchase agreements from time to time, and if necessary, by raising prices. Our cost increases in fiscal 2008 were partially attributable to the spike in oil and natural gas prices, which had a substantial impact on our raw material, packaging and transportation costs. Through sales price increases and cost saving efforts we have been more than able to offset the impact of recent packaging and transportation cost increases.
We expect significant cost increases for raw materials, transportation and energy costs in the market place during 2011. However, as discussed above, we are currently locked into our supply and prices for substantially all major commodities (other than maple syrup) through 2011 at less than a 1% cost increase as compared to fiscal 2010. During 2009 and 2010, our sales price increases and our cost saving measures more than offset our cost increases. To the extent we are unable to offset present and future cost increases, our operating results will be negatively impacted.
Recent Accounting Pronouncements
In September 2006, the Financial Accounting Standards Board (FASB) issued a new standard relating to fair value measurements, which defines fair value, establishes a framework for measuring fair value and expands disclosures about fair value measurements. In January 2010, the FASB amended the standard to require additional disclosures related to transfers between levels in the hierarchy of fair value measurement. The amendment is effective for interim and annual reporting periods beginning after December 15, 2009. The amendment does not change how fair values are measured. Accordingly, the amendment does not impact our results of operations or financial position.
Off-balance Sheet Arrangements
As of January 1, 2011, we did not have any off-balance sheet arrangements as defined in Item 303(a)(4)(ii) of Regulation S-K.
43
Commitments and Contractual Obligations
Our contractual obligations and commitments principally include obligations associated with our outstanding indebtedness and future minimum operating lease obligations as set forth in the following table as of January 1, 2011.
| |
Payments Due by Period | ||||||||||||||||||
|---|---|---|---|---|---|---|---|---|---|---|---|---|---|---|---|---|---|---|---|
Contractual Obligations:
|
Total | Fiscal 2011 |
Fiscal 2012 |
Fiscal 2013 |
Fiscal 2014 |
Fiscal 2015 and Thereafter |
|||||||||||||
| |
(In thousands) |
||||||||||||||||||
Long-term debt—principal |
$ | 480,000 | $ | — | $ | — | $ | 130,000 | $ | — | $ | 350,000 | |||||||
Long-term debt—interest(1) |
206,791 | 35,908 | 35,908 | 28,224 | 26,688 | 80,063 | |||||||||||||
Operating leases |
21,998 | 5,613 | 5,384 | 4,359 | 3,282 | 3,360 | |||||||||||||
Pension obligations(2) |
3,175 | 3,175 | — | — | — | — | |||||||||||||
Total |
$ | 711,964 | $ | 44,696 | $ | 41,292 | $ | 162,583 | $ | 29,970 | $ | 433,423 | |||||||
- (1)
- Includes
interest obligations as of January 1, 2011, on our 7.625% senior notes through scheduled maturity on January 15, 2018. Also includes
interest obligations for our $130.0 million of term loan borrowings under our credit facility as of January 1, 2011. As of January 1, 2011, the entire $130.0 million was
subject to a six-year interest rate swap agreement that effectively fixed the interest rate at 7.0925% through the February 2013 maturity date. On January 18, 2011, we terminated
the interest rate swap agreement. As a result of the termination, our interest obligations will be determined at a floating rate as described above under "Debt—Senior Secured Credit
Facility." As a result of the swap termination, we expect our interest expense for the term loan borrowings to be reduced by approximately $6.2 million in each of fiscal 2011 and 2012 and by
approximately $1.1 million in fiscal 2013, or a total of $13.5 million through maturity of the term loan borrowings. However, any increase in LIBOR during that time period, will reduce
the expected interest expense reduction.
- (2)
- During the first quarter of fiscal 2011, we have made $1.6 million of the pension obligation payments set forth in the table for fiscal 2011. We expect to make $1.5 million of additional voluntary contributions during the remainder of fiscal 2011. Our expected contributions beyond fiscal 2011 are not currently determinable.
Forward-Looking Statements
This report includes forward-looking statements, including without limitation the statements under "Management's Discussion and Analysis of Financial Condition and Results of Operations." The words "believes," "anticipates," "plans," "expects," "intends," "estimates," "projects" and similar expressions are intended to identify forward-looking statements. These forward looking statements involve known and unknown risks, uncertainties and other factors that may cause our actual results, performance and achievements, or industry results, to be materially different from any future results, performance, or achievements expressed or implied by any forward-looking statements. We believe important factors that could cause actual results to differ materially from our expectations include the following:
- •
- our substantial leverage;
- •
- the effects of rising costs for our raw materials, packaging and ingredients;
- •
- crude oil prices and their impact on distribution, packaging and energy costs;
- •
- our ability to successfully implement sales price increases and cost saving measures to offset any cost increases;
- •
- intense competition, changes in consumer preferences, demand for our products and local economic and market conditions;
- •
- our continued ability to promote brand equity successfully, to anticipate and respond to new consumer trends, to develop new products and markets, to broaden brand portfolios in order to
44
- •
- the risks associated with the expansion of our business;
- •
- our possible inability to integrate any businesses we acquire;
- •
- our ability to access the credit markets and our borrowing costs and credit ratings, which may be influenced by credit
markets generally and the credit ratings of our competitors;
- •
- the effects of currency movements of the Canadian dollar as compared to the U.S. dollar;
- •
- other factors that affect the food industry generally, including:
- —
- recalls if products become adulterated or misbranded, liability if product consumption causes injury, ingredient
disclosure and labeling laws and regulations and the possibility that consumers could lose confidence in the safety and quality of certain food products;
- —
- competitors' pricing practices and promotional spending levels;
- —
- fluctuations in the level of our customers' inventories and credit and other business risks related to our customers
operating in a challenging economic and competitive environment; and
- —
- the risks associated with third-party suppliers and co-packers, including the risk that any failure by one or
more of our third-party suppliers or co-packers to comply with food safety or other laws and regulations may disrupt our supply of raw materials or certain finished goods products or
injure our reputation; and
- •
- other factors discussed elsewhere in this report, including under Item 1A, "Risk Factors," and in our other public filings with the SEC.
compete effectively with lower priced products and in markets that are consolidating at the retail and manufacturing levels and to improve productivity;
Developments in any of these areas could cause our results to differ materially from results that have been or may be projected by or on our behalf.
All forward-looking statements included in this report are based on information available to us on the date of this report. We undertake no obligation to publicly update or revise any forward-looking statement, whether as a result of new information, future events or otherwise. All subsequent written and oral forward-looking statements attributable to us or persons acting on our behalf are expressly qualified in their entirety by the cautionary statements contained in this report.
We caution that the foregoing list of important factors is not exclusive. We urge investors not to unduly rely on forward-looking statements contained in this report.
Item 7A. Quantitative and Qualitative Disclosures About Market Risk.
In the normal course of operations, we are exposed to market risks arising from adverse changes in interest rates. Market risk is defined for these purposes as the potential change in the fair value of a financial asset or liability resulting from an adverse movement in interest rates.
Interest under our $25.0 million revolving credit facility, including any outstanding letters of credit, is determined based on alternative rates that we may choose in accordance with the revolving credit facility, including the base lending rate per annum plus an applicable margin of 2.00%, and LIBOR plus an applicable margin of 3.00%. Interest under our term loan facility is determined based on alternative rates that we may choose in accordance with the credit facility, including the base lending rate per annum plus an applicable margin of 1.00%, and LIBOR plus an applicable margin of 2.00%. The revolving credit facility was undrawn at January 1, 2011 and January 2, 2010, and we currently have no plans to draw upon the facility for the foreseeable future. The available borrowing capacity
45
under our revolving credit facility, net of outstanding letters of credit of $0.5 million, was $24.5 million at January 1, 2011.
We had $130.0 million of term loan borrowings outstanding at January 1, 2011 and January 2, 2010. As of those dates, the term loan borrowings were effectively fixed at 7.0925% based upon a six-year interest rate swap agreement that we entered into in February 2007. See the discussion of the interest rate swap under the heading "Liquidity and Capital Resources—Debt—Senior Secured Credit Facility" in Item 7, "Management's Discussion and Analysis of Financial Condition and Results of Operations" for additional information. We terminated the interest rate swap agreement in January 2011 and interest under our term loan borrowings is now determined at a variable rate as set forth above. A 100 basis point increase in interest rates, applied to our term loan borrowings at January 1, 2011, would result in an annual increase in interest expense of $1.3 million and a corresponding reduction in cash-flow of approximately $0.8 million.
Cash and cash equivalents, trade accounts receivable, income tax receivable, trade accounts payable, accrued expenses and dividends payable are reflected on our consolidated balance sheets at carrying value, which approximates fair value due to the short-term nature of these instruments.
The carrying values and fair values of our term loan borrowings, senior notes and senior subordinated notes as of January 1, 2011 and January 2, 2010 are as follows (in thousands):
| |
January 1, 2011 | January 2, 2010 | |||||||||||
|---|---|---|---|---|---|---|---|---|---|---|---|---|---|
| |
Carrying Value | Fair Value(1) | Carrying Value | Fair Value(1) | |||||||||
Senior Secured Term Loan due 2013 |
$ | 130,000 | $ | 128,050 | $ | 130,000 | $ | 127,400 | |||||
8% Senior Notes due 2011 |
— | — | 240,000 | 243,000 | |||||||||
7.625% Senior Notes due 2018 |
347,748 | (2) | 362,250 | — | — | ||||||||
12% Senior Subordinated Notes due 2016 |
— | — | 69,541 | 69,172 | |||||||||
- (1)
- Fair
values are estimated based on quoted market prices.
- (2)
- The carrying value of the 7.625% senior notes is net of discount. The face amount of the senior notes is $350.0 million.
The information under the heading "Inflation" in Item 7, "Management's Discussion and Analysis of Financial Condition and Results of Operations" is incorporated herein by reference.
46
Item 8. Financial Statements and Supplementary Data.
The consolidated balance sheets at January 1, 2011 and January 2, 2010 and the consolidated statements of operations, changes in stockholders' equity and comprehensive income, and cash flows for fiscal 2010, 2009 and 2008 and related notes are set forth below.
47
REPORT OF INDEPENDENT REGISTERED PUBLIC ACCOUNTING FIRM
The
Board of Directors and Stockholders
B&G Foods, Inc.:
We have audited the accompanying consolidated balance sheets of B&G Foods, Inc. and subsidiaries as of January 1, 2011 and January 2, 2010, and the related consolidated statements of operations, changes in stockholders' equity and comprehensive income, and cash flows for the years ended January 1, 2011, January 2, 2010 and January 3, 2009. In connection with our audits of the consolidated financial statements, we also have audited the schedule of valuation and qualifying accounts. These consolidated financial statements and financial statement schedule are the responsibility of the Company's management. Our responsibility is to express an opinion on these consolidated financial statements and financial statement schedule based on our audits.
We conducted our audits in accordance with the standards of the Public Company Accounting Oversight Board (United States). Those standards require that we plan and perform the audit to obtain reasonable assurance about whether the financial statements are free of material misstatement. An audit includes examining, on a test basis, evidence supporting the amounts and disclosures in the financial statements. An audit also includes assessing the accounting principles used and significant estimates made by management, as well as evaluating the overall financial statement presentation. We believe that our audits provide a reasonable basis for our opinion.
In our opinion, the consolidated financial statements referred to above present fairly, in all material respects, the financial position of B&G Foods, Inc. and subsidiaries as of January 1, 2011 and January 2, 2010, and the results of their operations and their cash flows for the years ended January 1, 2011, January 2, 2010 and January 3, 2009, in conformity with U.S. generally accepted accounting principles. Also, in our opinion, the related financial statement schedule, when considered in relation to the basic consolidated financial statements taken as a whole, presents fairly, in all material respects, the information set forth therein.
We have also audited, in accordance with the standards of the Public Company Accounting Oversight Board (United States), B&G Foods, Inc.'s internal control over financial reporting as of January 1, 2011, based on criteria established in Internal Control—Integrated Framework issued by the Committee of Sponsoring Organizations of the Treadway Commission (COSO), and our report dated March 1, 2011 expressed an unqualified opinion on the effectiveness of the Company's internal control over financial reporting.
/s/ KPMG LLP
Short
Hills, New Jersey
March 1, 2011
48
REPORT OF INDEPENDENT REGISTERED PUBLIC ACCOUNTING FIRM
The
Board of Directors and Stockholders
B&G Foods, Inc.:
We have audited B&G Foods, Inc.'s internal control over financial reporting as of January 1, 2011, based on criteria established in Internal Control—Integrated Framework issued by the Committee of Sponsoring Organizations of the Treadway Commission (COSO). B&G Foods, Inc.'s management is responsible for maintaining effective internal control over financial reporting and for its assessment of the effectiveness of internal control over financial reporting, included in "Management's Report on Internal Control Over Financial Reporting." Our responsibility is to express an opinion on the Company's internal control over financial reporting based on our audit.
We conducted our audit in accordance with the standards of the Public Company Accounting Oversight Board (United States). Those standards require that we plan and perform the audit to obtain reasonable assurance about whether effective internal control over financial reporting was maintained in all material respects. Our audit included obtaining an understanding of internal control over financial reporting, assessing the risk that a material weakness exists, and testing and evaluating the design and operating effectiveness of internal control based on the assessed risk. Our audit also included performing such other procedures as we considered necessary in the circumstances. We believe that our audit provides a reasonable basis for our opinion.
A company's internal control over financial reporting is a process designed to provide reasonable assurance regarding the reliability of financial reporting and the preparation of financial statements for external purposes in accordance with generally accepted accounting principles. A company's internal control over financial reporting includes those policies and procedures that (1) pertain to the maintenance of records that, in reasonable detail, accurately and fairly reflect the transactions and dispositions of the assets of the company; (2) provide reasonable assurance that transactions are recorded as necessary to permit preparation of financial statements in accordance with generally accepted accounting principles, and that receipts and expenditures of the company are being made only in accordance with authorizations of management and directors of the company; and (3) provide reasonable assurance regarding prevention or timely detection of unauthorized acquisition, use, or disposition of the company's assets that could have a material effect on the financial statements.
Because of its inherent limitations, internal control over financial reporting may not prevent or detect misstatements. Also, projections of any evaluation of effectiveness to future periods are subject to the risk that controls may become inadequate because of changes in conditions, or that the degree of compliance with the policies or procedures may deteriorate.
In our opinion B&G Foods, Inc. maintained, in all material respects, effective internal control over financial reporting as of January 1, 2011, based on criteria established in Internal Control—Integrated Framework issued by the Committee of Sponsoring Organizations of the Treadway Commission (COSO).
We also have audited, in accordance with the standards of the Public Company Accounting Oversight Board (United States), the consolidated balance sheets of B&G Foods, Inc. and subsidiaries as of January 1, 2011 and January 2, 2010, and the related consolidated statements of operations, changes in stockholders' equity and comprehensive income, and cash flows for the years ended January 1, 2011, January 2, 2010 and January 3, 2009, and our report dated March 1, 2011 expressed an unqualified opinion on those consolidated financial statements.
/s/ KPMG LLP
Short
Hills, New Jersey
March 1, 2011
49
B&G FOODS, INC. AND SUBSIDIARIES
Consolidated Balance Sheets
(In thousands, except share and per share data)
| |
January 1, 2011 |
January 2, 2010 |
|||||||
|---|---|---|---|---|---|---|---|---|---|
Assets |
|||||||||
Current assets: |
|||||||||
Cash and cash equivalents |
$ | 98,738 | $ | 39,930 | |||||
Trade accounts receivable, less allowance for doubtful accounts and discounts of $765 and $631 in 2010 and 2009 |
34,445 | 34,488 | |||||||
Inventories |
74,563 | 86,134 | |||||||
Prepaid expenses |
1,715 | 2,523 | |||||||
Income tax receivable |
171 | 864 | |||||||
Deferred income taxes |
5,439 | 1,981 | |||||||
Total current assets |
215,071 | 165,920 | |||||||
Property, plant and equipment, net |
60,812 | 53,598 | |||||||
Goodwill |
253,744 | 253,353 | |||||||
Trademarks |
228,000 | 227,220 | |||||||
Other intangibles, net |
104,001 | 109,868 | |||||||
Other assets |
10,095 | 6,935 | |||||||
Total assets |
$ | 871,723 | $ | 816,894 | |||||
Liabilities and Stockholders' Equity |
|||||||||
Current liabilities: |
|||||||||
Trade accounts payable |
$ | 15,531 | $ | 22,574 | |||||
Accrued expenses |
25,584 | 18,326 | |||||||
Interest rate swap |
12,012 | — | |||||||
Dividends payable |
8,099 | 8,052 | |||||||
Total current liabilities |
61,226 | 48,952 | |||||||
Long-term debt |
477,748 | 439,541 | |||||||
Other liabilities |
4,232 | 19,265 | |||||||
Deferred income taxes |
97,932 | 83,528 | |||||||
Total liabilities |
641,138 | 591,286 | |||||||
Commitments and contingencies (Note 12) |
|||||||||
Stockholders' equity: |
|||||||||
Preferred stock, $0.01 par value per share. Authorized 1,000,000 shares; no shares issued or outstanding |
— | — | |||||||
Common stock, $0.01 par value per share. Authorized 125,000,000 and 100,000,000 shares; 47,639,924 and 47,367,292 issued and outstanding as of January 1, 2011 and January 2, 2010 |
476 | 474 | |||||||
Additional paid-in capital |
201,770 | 231,549 | |||||||
Accumulated other comprehensive loss |
(7,002 | ) | (9,377 | ) | |||||
Retained earnings |
35,341 | 2,962 | |||||||
Total stockholders' equity |
230,585 | 225,608 | |||||||
Total liabilities and stockholders' equity |
$ | 871,723 | $ | 816,894 | |||||
See accompanying Notes to Consolidated Financial Statements.
50
B&G FOODS, INC. AND SUBSIDIARIES
Consolidated Statements of Operations
(In thousands, except per share data)
| |
Year Ended | |||||||||||
|---|---|---|---|---|---|---|---|---|---|---|---|---|
| |
January 1, 2011 |
January 2, 2010 |
January 3, 2009 |
|||||||||
Net sales |
$ | 513,337 | $ | 501,016 | $ | 486,896 | ||||||
Cost of goods sold |
345,668 | 352,283 | 352,967 | |||||||||
Gross profit |
167,669 | 148,733 | 133,929 | |||||||||
Operating expenses: |
||||||||||||
Sales, marketing and warehousing expenses |
44,723 | 43,084 | 44,888 | |||||||||
General and administrative expenses |
11,772 | 10,882 | 8,707 | |||||||||
Amortization expense |
6,457 | 6,450 | 6,450 | |||||||||
Operating income |
104,717 | 88,317 | 73,884 | |||||||||
Other expenses: |
||||||||||||
Interest expense, net |
40,342 | 49,432 | 58,067 | |||||||||
Loss on extinguishment of debt |
15,224 | 10,220 | — | |||||||||
Income before income tax expense |
49,151 | 28,665 | 15,817 | |||||||||
Income tax expense |
16,772 | 11,224 | 6,084 | |||||||||
Net income |
$ | 32,379 | $ | 17,441 | $ | 9,733 | ||||||
Earnings per share: |
||||||||||||
Basic |
$ | 0.68 | $ | 0.44 | $ | 0.27 | ||||||
Diluted |
$ | 0.67 | $ | 0.44 | $ | 0.27 | ||||||
Cash dividends declared per share |
$ | 0.68 | $ | 0.72 | $ | 0.81 | ||||||
See accompanying Notes to Consolidated Financial Statements.
51
B&G FOODS, INC. AND SUBSIDIARIES
Consolidated Statements of Changes in Stockholders' Equity and Comprehensive Income
(In thousands, except share and per share data)
| |
Common Stock | |
Accumulated Other Comprehensive Loss |
|
|
|||||||||||||||
|---|---|---|---|---|---|---|---|---|---|---|---|---|---|---|---|---|---|---|---|---|
| |
Additional Paid-in Capital |
Accumulated Deficit/Retained Earnings |
Total Stockholders Equity |
|||||||||||||||||
| |
Shares | Amount | ||||||||||||||||||
Balance at December 29, 2007 |
36,778,988 | $ | 368 | $ | 202,197 | $ | (3,718 | ) | $ | (24,212 | ) | $ | 174,635 | |||||||
Foreign currency translation |
— | — | — | (165 | ) | — | $ | (165 | ) | |||||||||||
Cash flow hedge (net of $624 of taxes) |
— | — | — | (1,022 | ) | — | (1,022 | ) | ||||||||||||
Reclassification to interest expense (net of $187 of taxes) |
— | — | — | 307 | — | 307 | ||||||||||||||
Change in pension benefit (net of $4,736 of taxes) |
— | — | — | (7,760 | ) | — | (7,760 | ) | ||||||||||||
Net income |
— | — | — | — | 9,733 | 9,733 | ||||||||||||||
Comprehensive income |
$ | 1,093 | ||||||||||||||||||
Share-based compensation |
18,000 | — | 1,032 | — | — | 1,032 | ||||||||||||||
Repurchase of common stock |
(550,331 | ) | (6 | ) | (2,545 | ) | — | — | (2,551 | ) | ||||||||||
Dividends declared on common stock, $0.806 per share |
— | — | (29,561 | ) | — | — | (29,561 | ) | ||||||||||||
Balance at January 3, 2009 |
36,246,657 | $ | 362 | $ | 171,123 | $ | (12,358 | ) | $ | (14,479 | ) | $ | 144,648 | |||||||
Foreign currency translation |
— | — | — | 178 | — | $ | 178 | |||||||||||||
Reclassification to interest expense (net of $642 of taxes) |
— | — | — | 1,051 | — | 1,051 | ||||||||||||||
Change in pension benefit (net of $1,070 of taxes) |
— | — | — | 1,752 | — | 1,752 | ||||||||||||||
Net income |
— | — | — | — | 17,441 | 17,441 | ||||||||||||||
Comprehensive income |
$ | 20,422 | ||||||||||||||||||
Issuance of common stock |
11,500,000 | 115 | 86,485 | — | — | 86,600 | ||||||||||||||
Share-based compensation |
24,135 | — | 4,599 | — | — | 4,599 | ||||||||||||||
Repurchase of common stock |
(403,500 | ) | (3 | ) | (2,331 | ) | — | — | (2,334 | ) | ||||||||||
Dividends declared on common stock, $0.68 per share |
— | — | (28,327 | ) | — | — | (28,327 | ) | ||||||||||||
Balance at January 2, 2010 |
47,367,292 | $ | 474 | $ | 231,549 | $ | (9,377 | ) | $ | 2,962 | $ | 225,608 | ||||||||
Foreign currency translation |
— | — | — | 72 | — | $ | 72 | |||||||||||||
Reclassification to interest expense (net of $660 of taxes) |
— | — | — | 1,033 | — | 1,033 | ||||||||||||||
Change in pension benefit (net of $834 of taxes) |
— | — | — | 1,270 | — | 1,270 | ||||||||||||||
Net income |
— | — | — | — | 32,379 | 32,379 | ||||||||||||||
Comprehensive income |
$ | 34,754 | ||||||||||||||||||
Share-based compensation |
— | — | 3,747 | — | — | 3,747 | ||||||||||||||
Issuance of common stock for share-based compensation |
272,632 | 2 | (1,462 | ) | — | — | (1,460 | ) | ||||||||||||
Tax benefit from issuance of common stock for share-based compensation |
— | — | 326 | — | — | 326 | ||||||||||||||
Dividends declared on common stock, $0.68 per share |
— | — | (32,390 | ) | — | — | (32,390 | ) | ||||||||||||
Balance at January 1, 2011 |
47,639,924 | $ | 476 | $ | 201,770 | $ | (7,002 | ) | $ | 35,341 | $ | 230,585 | ||||||||
See accompanying Notes to Consolidated Financial Statements
52
B&G FOODS, INC. AND SUBSIDIARIES
Consolidated Statements of Cash Flows
(In thousands)
| |
Year Ended | |||||||||||||
|---|---|---|---|---|---|---|---|---|---|---|---|---|---|---|
| |
January 1, 2011 |
January 2, 2010 |
January 3, 2009 |
|||||||||||
Cash flows from operating activities: |
||||||||||||||
Net income |
$ | 32,379 | $ | 17,441 | $ | 9,733 | ||||||||
Adjustments to reconcile net income to net cash provided by operating activities: |
||||||||||||||
Depreciation and amortization |
15,023 | 14,695 | 15,552 | |||||||||||
Amortization of deferred debt financing costs and bond discount |
2,016 | 2,759 | 3,169 | |||||||||||
Loss on extinguishment of debt |
15,224 | 10,220 | — | |||||||||||
Deferred income taxes |
9,452 | 9,445 | 7,250 | |||||||||||
Unrealized loss (gain) on interest rate swap |
436 | (1,541 | ) | 5,569 | ||||||||||
Reclassification to net interest expense for interest rate swap |
1,693 | 1,693 | 494 | |||||||||||
Share-based compensation expense |
3,747 | 4,599 | 1,032 | |||||||||||
Excess tax benefits from share-based compensation |
(326 | ) | — | — | ||||||||||
Provision for doubtful accounts |
127 | (59 | ) | 7 | ||||||||||
Changes in assets and liabilities, net of effects of business acquired: |
||||||||||||||
Trade accounts receivable |
1,174 | 2,149 | 5,777 | |||||||||||
Inventories |
18,548 | 2,765 | 4,282 | |||||||||||
Prepaid expenses |
808 | (48 | ) | 1,081 | ||||||||||
Income tax receivable |
1,019 | 1,357 | (1,652 | ) | ||||||||||
Other assets |
(1,136 | ) | (169 | ) | 1,202 | |||||||||
Trade accounts payable |
(7,118 | ) | (4,712 | ) | (4,840 | ) | ||||||||
Accrued expenses |
7,164 | 2,303 | (5,743 | ) | ||||||||||
Other liabilities |
(1,353 | ) | (43 | ) | (2,417 | ) | ||||||||
Net cash provided by operating activities |
98,877 | 62,854 | 40,496 | |||||||||||
Cash flows from investing activities: |
||||||||||||||
Capital expenditures |
(10,965 | ) | (10,704 | ) | (10,631 | ) | ||||||||
Payment for acquisition of business |
(14,602 | ) | — | — | ||||||||||
Net cash used in investing activities |
(25,567 | ) | (10,704 | ) | (10,631 | ) | ||||||||
Cash flows from financing activities: |
||||||||||||||
Payments for repurchase of long-term debt |
(320,259 | ) | (102,035 | ) | — | |||||||||
Proceeds from issuance of long-term debt |
347,448 | — | — | |||||||||||
Payments for repurchase of common stock |
— | (2,334 | ) | (2,551 | ) | |||||||||
Proceeds from issuance of common stock, net |
— | 86,600 | — | |||||||||||
Dividends paid |
(32,343 | ) | (26,437 | ) | (31,196 | ) | ||||||||
Excess tax benefits from share-based compensation |
326 | — | — | |||||||||||
Payments of tax withholding on behalf of employees for net share settlement of share-based compensation |
(1,460 | ) | — | — | ||||||||||
Payments of debt financing costs |
(8,246 | ) | (671 | ) | — | |||||||||
Net cash used in financing activities |
(14,534 | ) | (44,877 | ) | (33,747 | ) | ||||||||
Effect of exchange rate fluctuations on cash and cash equivalents |
32 | 98 | (165 | ) | ||||||||||
Net increase (decrease) in cash and cash equivalents |
58,808 | 7,371 | (4,047 | ) | ||||||||||
Cash and cash equivalents at beginning of year |
39,930 | 32,559 | 36,606 | |||||||||||
Cash and cash equivalents at end of year |
$ | 98,738 | $ | 39,930 | $ | 32,559 | ||||||||
Supplemental disclosures of cash flow information: |
||||||||||||||
Cash interest payments |
$ | 30,302 | $ | 49,227 | $ | 48,389 | ||||||||
Cash income tax payments |
$ | 6,376 | $ | 1,615 | $ | 711 | ||||||||
Cash income tax refunds |
$ | (5 | ) | $ | (1,180 | ) | $ | (110 | ) | |||||
Non-cash transactions: |
||||||||||||||
Dividends declared and not yet paid |
$ | 8,099 | $ | 8,052 | $ | 6,162 | ||||||||
See accompanying Notes to Consolidated Financial Statements
53
B&G FOODS, INC. AND SUBSIDIARIES
Notes to Consolidated Financial Statements
January 1, 2011, January 2, 2010 and January 3, 2009
(1) Nature of Operations
Organization and Nature of Operations
B&G Foods, Inc. is a holding company, the principal assets of which are the capital stock of its subsidiaries. Unless the context requires otherwise, references in this report to "B&G Foods," "our company," "we," "us" and "our" refer to B&G Foods, Inc. and its subsidiaries.
We operate in one industry segment and manufacture, sell and distribute a diverse portfolio of high-quality shelf-stable foods across the United States, Canada and Puerto Rico. Our products are marketed under many recognized brands, including Ac'cent, B&G, B&M, Brer Rabbit, Cream of Rice, Cream of Wheat, Don Pepino, Emeril's, Grandma's Molasses, Joan of Arc, Las Palmas, Maple Grove Farms of Vermont, Ortega, Polaner, Red Devil, Regina, Sa-són, Sclafani, Trappey's, Underwood, Vermont Maid and Wright's. Our products include hot cereals, fruit spreads, canned meats and beans, spices, seasonings, hot sauces, wine vinegar, maple syrup, molasses, salad dressings, Mexican-style sauces, taco shells and kits, salsas, pickles, peppers, tomato-based products and other specialty food products. We compete in the retail grocery, food service, specialty, private label, club and mass merchandiser channels of distribution. We distribute our products throughout the United States via a nationwide network of independent brokers and distributors to supermarket chains, food service outlets, mass merchants, warehouse clubs, non-food outlets and specialty food distributors.
Sales of a number of our products tend to be seasonal and may be influenced by holidays, changes in seasons or other annual events. In the aggregate, however, sales of our products are not heavily weighted to any particular quarter due to the offsetting nature of demands for our diversified product portfolio. Sales during the fourth quarter are generally higher than those of the preceding three quarters. We purchase most of the produce used to make our shelf-stable pickles, relishes, peppers, tomatoes and other related specialty items during the months of July through October, and we purchase substantially all of our maple syrup requirements during the months of April through August. Consequently, our liquidity needs are greatest during these periods.
Common Stock Offering. In September 2009, we completed a public offering of 11,500,000 shares of our common stock at a price of $8.00 per share. After deducting underwriting discounts and commissions and other expenses, we received proceeds of approximately $86.6 million. We used the net proceeds of the offering, together with cash on hand, to redeem $90.0 million principal amount of our 12% senior subordinated notes due 2016 in November 2009, at a purchase price of 106.0% of the principal amount plus accrued and unpaid interest.
Automatic Separation of the EISs. Each Enhanced Income Security (EIS) represented one share of our common stock and $7.15 principal amount of our senior subordinated notes. In connection with our partial redemption of the senior subordinated notes described above, all of the EISs automatically separated into the component shares of common stock and senior subordinated notes on October 30, 2009. Following the automatic separation of the EISs, holders of shares of common stock and senior subordinated notes were no longer able to combine such securities to form EISs. As a result, we no longer have any EISs outstanding. The remaining senior subordinated notes were subsequently repurchased or redeemed during the first quarter of fiscal 2010. See Note 6.
54
B&G FOODS, INC. AND SUBSIDIARIES
Notes to Consolidated Financial Statements (Continued)
January 1, 2011, January 2, 2010 and January 3, 2009
(1) Nature of Operations (Continued)
Fiscal Year
Our financial statements are presented on a consolidated basis. We utilize a 52-53 week fiscal year ending on the Saturday closest to December 31. The fiscal year ended January 3, 2009 (fiscal 2008) contained 53 weeks and the fiscal years ended January 1, 2011 (fiscal 2010) and January 2, 2010 (fiscal 2009) contained 52 weeks each.
Business and Credit Concentrations
Our exposure to credit loss in the event of non-payment of accounts receivable by customers is estimated in the amount of the allowance for doubtful accounts. We perform ongoing credit evaluations of our customers' financial condition. As of January 1, 2011, we do not believe we have any significant concentration of credit risk with respect to our trade accounts receivable. Our top ten customers accounted for approximately 50.6%, 50.5% and 48.1% of consolidated net sales in fiscal 2010, 2009 and 2008, respectively. Our top ten customers accounted for approximately 53.2%, 52.7% and 56.1% of our receivables as of the end of fiscal 2010, 2009 and 2008, respectively. Other than Wal-Mart, which accounted for 16.2%, 16.0% and 14.3% of our consolidated net sales in fiscal 2010, 2009 and 2008, respectively, no single customer accounted for more than 10.0%, of consolidated net sales in fiscal 2010, 2009 and 2008. Other than Wal-Mart, which accounted for 15.0% of our consolidated receivables as of the end of fiscal 2010 and Wal-Mart and C&S Wholesale Grocery, which accounted for 12.5% and 11.1% of our consolidated receivables, respectively, as of the end of fiscal 2009, and 13.2% and 17.7%, respectively, as of the end of fiscal 2008, no single customer accounted for more than 10.0% of our consolidated receivables as of the end of fiscal 2010, 2009 and 2008.
During fiscal 2010, 2009 and 2008 our sales to foreign countries represented less than 1.0% of net sales. Our foreign sales are primarily to customers in Canada.
On November 18, 2010, we acquired the Don Pepino and Sclafani brands for $14.6 million from Violet Packing LLC, referred to as the "Don Pepino acquisition" in the remainder of these notes to our consolidated financial statements. In connection with the acquisition, we acquired inventory of $7.0 million, property, plant and equipment of $4.8 million, other working capital of $1.0 million and goodwill and other intangible assets of $1.8 million. See Note 5. Inventory has been recorded at estimated selling price less costs of disposal and a reasonable profit and the property, plant and equipment and other intangible assets have been recorded at fair value as determined by a third-party valuation. The Don Pepino acquisition was not material to our consolidated results of operations or financial position and, therefore, pro forma financial information is not presented.
(2) Summary of Significant Accounting Policies
(a) Basis of Presentation
The consolidated financial statements include the accounts of B&G Foods, Inc. and its subsidiaries. All intercompany balances and transactions have been eliminated.
(b) Use of Estimates
The preparation of financial statements in accordance with accounting principles generally accepted in the United States requires our management to make a number of estimates and assumptions relating to the reporting of assets and liabilities and the disclosure of contingent assets and
55
B&G FOODS, INC. AND SUBSIDIARIES
Notes to Consolidated Financial Statements (Continued)
January 1, 2011, January 2, 2010 and January 3, 2009
(2) Summary of Significant Accounting Policies (Continued)
liabilities at the date of the consolidated financial statements and the reported amounts of revenues and expenses during the reporting period. Some of the more significant estimates and assumptions made by management involve trade and consumer promotion expenses; allowances for excess, obsolete and unsaleable inventories; pension benefits; purchase accounting allocations; the recoverability of goodwill, trademarks, other intangible assets, property, plant and equipment and deferred tax assets; and the accounting for share-based compensation expense. Actual results could differ significantly from these estimates and assumptions.
Management evaluates its estimates and assumptions on an ongoing basis using historical experience and other factors that management believe to be reasonable under the circumstances, including the current economic environment. We adjust such estimates and assumptions when facts and circumstances dictate. Volatility in the credit and equity markets can increase the uncertainty inherent in such estimates and assumptions.
(c) Cash and Cash Equivalents
For purposes of the consolidated statements of cash flows, all highly liquid debt instruments with maturities of three months or less when acquired are considered to be cash and cash equivalents.
(d) Inventories
Inventories are stated at the lower of cost or market and include direct material, direct labor, overhead, warehousing and product transfer costs. Cost is determined using the first-in, first-out and average cost methods. Inventories have been reduced by an allowance for excess, obsolete and unsaleable inventories. The allowance is an estimate based on our management's review of inventories on hand compared to estimated future usage and sales.
(e) Property, Plant and Equipment
Property, plant and equipment are stated at cost. Depreciation on plant and equipment is calculated using the straight-line method over the estimated useful lives of the assets, 10 to 30 years for buildings and improvements, 5 to 12 years for machinery and equipment, and 2 to 5 years for office furniture and vehicles. Leasehold improvements are amortized on a straight-line basis over the shorter of the lease term or estimated useful life of the asset. Expenditures for maintenance, repairs and minor replacements are charged to current operations. Expenditures for major replacements and betterments are capitalized. We capitalize interest on qualifying assets based on our effective interest rate. During fiscal 2010, 2009 and 2008 we capitalized $0.1 million, $0.2 million and $0.2 million, respectively.
(f) Goodwill and Trademarks
Goodwill and indefinite-lived intangible assets (trademarks) are tested for impairment at least annually and whenever events or circumstances occur indicating that goodwill or indefinite-lived intangibles might be impaired.
We perform the annual impairment tests as of the last day of each fiscal year. The annual goodwill impairment test involves a two-step process. The first step of the impairment test involves comparing the fair value of our company with our company's carrying value, including goodwill. If the carrying value of our company exceeds our fair value, we perform the second step of the impairment test to determine the amount of the impairment loss. The second step of the goodwill impairment test involves comparing the implied fair value of goodwill with the carrying value of that goodwill and recognizing a
56
B&G FOODS, INC. AND SUBSIDIARIES
Notes to Consolidated Financial Statements (Continued)
January 1, 2011, January 2, 2010 and January 3, 2009
(2) Summary of Significant Accounting Policies (Continued)
loss for the difference. Calculating our fair value for purposes of the second step of the impairment test requires significant estimates and assumptions by management. We estimate our fair value by applying third party market value indicators to our net income before net interest expense, loss on extinguishment of debt, income taxes, depreciation and amortization (which we define as EBITDA). We test indefinite-lived intangible assets for impairment by comparing their carrying value to their fair value.
We completed our annual impairment tests for fiscal 2010, 2009 and 2008 with no adjustments to the carrying values of goodwill and indefinite-lived intangibles.
(g) Other Intangible Assets
Customer relationship intangibles are presented at cost, net of accumulated amortization, and are amortized on a straight-line basis over their estimated useful lives of 18 to 20 years. Other intangible assets are presented at cost, net of accumulated amortization, and are amortized on a straight-line basis over their estimated useful lives of two years.
(h) Deferred Debt Financing Costs
Debt financing costs are capitalized and amortized over the term of the related debt agreements and are classified as other non-current assets. Amortization of deferred debt financing costs for fiscal years 2010, 2009 and 2008 was $1.7 million, $2.8 million and $3.2 million, respectively.
(i) Long-Lived Assets
Long-lived assets, such as property, plant and equipment, and intangibles with estimated useful lives are depreciated or amortized over their respective estimated useful lives to their estimated residual values, and reviewed for impairment whenever events or changes in circumstances indicate that the carrying amount of an asset may not be recoverable. Recoverability of assets to be held and used is measured by a comparison of the carrying amount of an asset to estimated undiscounted future cash flows expected to be generated by the asset. If the carrying amount of an asset exceeds its estimated undiscounted future cash flows, an impairment charge is recognized by the amount by which the carrying amount of the asset exceeds the fair value of the asset. Recoverability of assets held for sale is measured by a comparison of the carrying amount of an asset or asset group to their fair value less estimated costs to sell. Estimating future cash flows and calculating fair value of assets requires significant estimates and assumptions by management.
Assets to be disposed of are separately presented in the consolidated balance sheets and are no longer depreciated.
During fiscal 2010, 2009 and 2008, we amortized $6.5 million per year, of the customer relationship and other intangibles acquired in the Don Pepino, Cream of Wheat and Grandma's molasses acquisitions.
(j) Accumulated Other Comprehensive Loss
Accumulated other comprehensive loss includes foreign currency translation adjustments relating to assets and liabilities located in our foreign subsidiary, changes in our pension benefits due to the initial adoption and ongoing application of the authoritative accounting literature relating to pensions, net of tax and the change in the fair value of an interest rate swap during the period it was designated as an
57
B&G FOODS, INC. AND SUBSIDIARIES
Notes to Consolidated Financial Statements (Continued)
January 1, 2011, January 2, 2010 and January 3, 2009
(2) Summary of Significant Accounting Policies (Continued)
effective cash flow hedge for accounting purposes, net of tax. The amount recorded in accumulated other comprehensive loss related to the swap will be reclassified to net interest expense over the remaining life of the term loan as we make interest payments. The components of accumulated other comprehensive loss are as follows (in thousands):
| |
Foreign Currency Translation |
Interest Rate Swap, Net of Tax |
Pensions, Net of Tax |
Total | |||||||||
|---|---|---|---|---|---|---|---|---|---|---|---|---|---|
January 2, 2010 |
$ | (79 | ) | $ | (3,329 | ) | $ | (5,969 | ) | $ | (9,377 | ) | |
January 1, 2011 |
(7 | ) | (2,296 | ) | (4,699 | ) | (7,002 | ) | |||||
(k) Derivative Instruments
We recognize all derivative instruments either as an asset or a liability in the balance sheet and measure such instruments at fair value. The fair value adjustment is included either in the determination of net income or as a component of accumulated other comprehensive loss depending on the nature of the hedge. We do not engage in derivative instruments for trading purposes.
(l) Revenue Recognition
Revenues are recognized when products are shipped. We report all amounts billed to a customer in a sale transaction as revenue, including those amounts related to shipping and handling. Shipping and handling costs are included in cost of goods sold. Consideration from a vendor to a retailer is presumed to be a reduction to the selling prices of the vendor's products and, therefore, is characterized as a reduction of sales when recognized in the vendor's income statement. As a result, coupon incentives, slotting and promotional expenses are recorded as a reduction of net sales.
(m) Advertising Costs
Advertising costs are expensed as incurred. Advertising costs amounted to approximately $4.9 million, $2.9 million and $3.5 million, for the fiscal years 2010, 2009 and 2008, respectively.
(n) Trade and Consumer Promotion Expenses
We offer various sales incentive programs to customers and consumers, such as promotional expenses, in-store display incentives, slotting fees and coupons. The recognition of expense for these programs involves the use of judgment related to performance and redemption estimates. Estimates are made based on historical experience and other factors. Actual expenses may differ if the level of redemption rates and performance vary from estimates.
(o) Pension Plans
We have defined benefit pension plans covering substantially all of our employees. Our funding policy is to contribute annually the amount recommended by our actuaries. From time to time, however, we voluntarily contribute greater amounts based on pension asset performance, tax considerations and other relevant factors.
58
B&G FOODS, INC. AND SUBSIDIARIES
Notes to Consolidated Financial Statements (Continued)
January 1, 2011, January 2, 2010 and January 3, 2009
(2) Summary of Significant Accounting Policies (Continued)
(p) Share Based Compensation Expense
Performance share long-term incentive awards (LTIAs) granted to our executive officers and certain other members of senior management entitle each participant to earn shares of common stock upon the attainment of certain performance goals over the applicable performance period. The recognition of compensation expense for the LTIAs is initially based on the probable outcome of the performance condition based on the fair value of the award on the date of grant and the anticipated number of shares to be awarded on a straight-line basis over the applicable performance period. The fair value of the awards on the date of grant is determined based upon the closing price of our common stock on the applicable measurement dates (i.e., the deemed grant dates for accounting purposes) reduced by the present value of expected dividends using the risk-free interest-rate as the award holders are not entitled to dividends or dividend equivalents during the vesting period. Our company's performance against the defined performance goals are re-evaluated on a quarterly basis throughout the applicable performance period and the recognition of compensation expense is adjusted for subsequent changes in the estimated or actual outcome. The cumulative effect of a change in the estimated number of shares of common stock to be issued in respect of performance share awards is recognized as an adjustment to earnings in the period of the revision.
(q) Income Tax Expense Estimates and Policies
Income taxes are accounted for under the asset and liability method. Deferred tax assets and liabilities of our company are recognized for the future tax consequences attributable to differences between the financial statement carrying amounts of existing assets and liabilities and their respective tax bases and operating loss and tax credit carryforwards. Deferred tax assets and liabilities are measured using enacted tax rates expected to apply to taxable income in the years in which those temporary differences are expected to be recovered or settled. A valuation allowance is provided when it is more likely than not that all or some portion of the deferred tax asset will not be realized. The effect on deferred tax assets and liabilities of a change in tax rates is recognized in operations in the period that includes the enactment date.
As part of the income tax provision process of preparing our consolidated financial statements, we are required to estimate our income taxes. This process involves estimating our current tax expenses together with assessing temporary differences resulting from differing treatment of items for tax and accounting purposes. These differences result in deferred tax assets and liabilities. We then assess the likelihood that our deferred tax assets will be recovered from future taxable income and to the extent we believe the recovery is not likely, we establish a valuation allowance. Further, to the extent that we establish a valuation allowance or increase this allowance in a financial accounting period, we include such charge in our tax provision, or reduce our tax benefits in our consolidated statements of operations. We use our judgment to determine our provision or benefit for income taxes, deferred tax assets and liabilities and any valuation allowance recorded against our deferred tax assets.
There are various factors that may cause these tax assumptions to change in the near term, and we may have to record a valuation allowance against our deferred tax assets. We cannot predict whether future U.S. federal and state income tax laws and regulations might be passed that could have a material effect on our results of operations. We assess the impact of significant changes to the U.S. federal and state income tax laws and regulations on a regular basis and update the assumptions and
59
B&G FOODS, INC. AND SUBSIDIARIES
Notes to Consolidated Financial Statements (Continued)
January 1, 2011, January 2, 2010 and January 3, 2009
(2) Summary of Significant Accounting Policies (Continued)
estimates used to prepare our consolidated financial statements when new regulations and legislation are enacted. We recognize the benefit of an uncertain tax position that we have taken or expect to take on our income tax returns we file if it is "more likely than not" that such tax position will be sustained based on its technical merits.
(r) Dividends
Cash dividends, if any, are accrued as a liability on our consolidated balance sheets and recorded as a decrease to additional paid-in capital when declared.
(s) Earnings Per Share
Basic earnings per share is calculated by dividing net income by the weighted average number of shares of common stock outstanding. Diluted earnings per share is calculated by dividing net income by the weighted average number of shares of common stock outstanding plus all additional shares of common stock that would have been outstanding if potentially dilutive shares of common stock related to performance shares that may be earned under long-term incentive awards had been issued as of the beginning of the period using the treasury stock method.
| |
Fiscal 2010 |
Fiscal 2009 |
Fiscal 2008 |
||||||||
|---|---|---|---|---|---|---|---|---|---|---|---|
| |
(In thousands, except share and per share data) |
||||||||||
Net income |
$ | 32,379 | $ | 17,441 | $ | 9,733 | |||||
Less: Common stock dividends declared |
32,390 | 28,327 | 29,561 | ||||||||
Undistributed loss |
$ | (11 | ) | $ | (10,886 | ) | $ | (19,828 | ) | ||
Weighted average common shares outstanding: |
|||||||||||
Basic |
47,584,260 | 39,324,897 | 36,715,352 | ||||||||
Net effect of dilutive share-based compensation awards |
699,660 | 33,564 | — | ||||||||
Diluted |
48,283,920 | 39,358,461 | 36,715,352 | ||||||||
Undistributed loss per share |
$ |
— |
$ |
(0.28 |
) |
$ |
(0.54 |
) |
|||
Distributed earnings per share(1): |
|||||||||||
Basic |
$ | 0.68 | $ | 0.72 | $ | 0.81 | |||||
Diluted |
$ | 0.67 | $ | 0.72 | $ | 0.81 | |||||
Earnings per share: |
|||||||||||
Basic |
$ | 0.68 | $ | 0.44 | $ | 0.27 | |||||
Diluted |
$ | 0.67 | $ | 0.44 | $ | 0.27 | |||||
- (1)
- "Distributed earnings" may differ from actual per share amounts paid as dividends as the earnings per share computation under GAAP requires the use of the weighted average, rather than the actual number of shares outstanding.
During the first three quarters of fiscal 2008 our board of directors declared quarterly cash dividends of $0.212 per share (or $0.848 per share per annum), on our common stock. During fiscal 2010, 2009 and the fourth quarter of fiscal 2008 our board of directors declared quarterly cash dividends of $0.17 per share ($0.68 per share per annum), on our common stock.
60
B&G FOODS, INC. AND SUBSIDIARIES
Notes to Consolidated Financial Statements (Continued)
January 1, 2011, January 2, 2010 and January 3, 2009
(2) Summary of Significant Accounting Policies (Continued)
(u) Recently Issued Accounting Standards
In September 2006, the Financial Accounting Standards Board (FASB) issued a new standard relating to fair value measurements, which defines fair value, establishes a framework for measuring fair value and expands disclosures about fair value measurements. In January 2010, the FASB amended the standard to require additional disclosures related to transfers between levels in the hierarchy of fair value measurement. The amendment is effective for interim and annual reporting periods beginning after December 15, 2009. The amendment does not change how fair values are measured. Accordingly, the amendment does not impact our results of operations or financial position.
(3) Inventories
Inventories consist of the following as of the dates indicated (in thousands):
| |
January 1, 2011 | January 2, 2010 | ||||||
|---|---|---|---|---|---|---|---|---|
Raw materials and packaging |
$ | 23,000 | $ | 32,793 | ||||
Work in process |
274 | 1,239 | ||||||
Finished goods |
51,289 | 52,102 | ||||||
Total |
$ | 74,563 | $ | 86,134 | ||||
(4) Property, Plant and Equipment, net
Property, plant and equipment, net consists of the following as of the dates indicated (in thousands):
| |
January 1, 2011 | January 2, 2010 | ||||||
|---|---|---|---|---|---|---|---|---|
Land |
$ | 2,990 | $ | 1,775 | ||||
Buildings and improvements |
35,107 | 30,159 | ||||||
Machinery and equipment |
94,163 | 85,187 | ||||||
Office furniture and vehicles |
9,128 | 8,350 | ||||||
Construction-in-progress |
286 | 344 | ||||||
|
141,674 | 125,815 | ||||||
Less: accumulated depreciation |
(80,862 | ) | (72,217 | ) | ||||
Total |
$ | 60,812 | $ | 53,598 | ||||
(5) Goodwill and Other Intangible Assets
The carrying amount of goodwill changed as follows during fiscal 2010 and fiscal 2009 (in thousands):
| |
Fiscal 2010 | Fiscal 2009 | |||||
|---|---|---|---|---|---|---|---|
Beginning balance |
$ | 253,353 | $ | 253,353 | |||
Don Pepino acquisition |
391 | — | |||||
Ending balance |
$ | 253,744 | $ | 253,353 | |||
61
B&G FOODS, INC. AND SUBSIDIARIES
Notes to Consolidated Financial Statements (Continued)
January 1, 2011, January 2, 2010 and January 3, 2009
(5) Goodwill and Other Intangible Assets (Continued)
The carrying amount of trademarks, which have an indefinite life, changed as follows during fiscal 2010 and fiscal 2009 (in thousands):
| |
Fiscal 2010 | Fiscal 2009 | |||||
|---|---|---|---|---|---|---|---|
Beginning balance |
$ | 227,220 | $ | 227,220 | |||
Don Pepino acquisition |
780 | — | |||||
Ending balance |
$ | 228,000 | $ | 227,220 | |||
The carrying amount of other intangible assets changed as follows during fiscal 2010 and 2009 (in thousands):
| |
Customer Relationship Intangibles |
Other Intangible Assets |
Total Other Intangible Assets |
Less: Accumulated Amortization |
Total | |||||||||||
|---|---|---|---|---|---|---|---|---|---|---|---|---|---|---|---|---|
Balance at January 3, 2009 |
$ | 129,000 | $ | — | $ | 129,000 | $ | (12,682 | ) | $ | 116,318 | |||||
Amortization expense |
— | — | — | (6,450 | ) | (6,450 | ) | |||||||||
Balance at January 2, 2010 |
$ | 129,000 | $ | — | $ | 129,000 | $ | (19,132 | ) | $ | 109,868 | |||||
Don Pepino acquisition |
440 | 150 | 590 | — | 590 | |||||||||||
Amortization expense |
— | — | — | (6,457 | ) | (6,457 | ) | |||||||||
Balance at January 1, 2011 |
$ | 129,440 | $ | 150 | $ | 129,590 | $ | (25,589 | ) | $ | 104,001 | |||||
We expect to recognize $6.5 million of amortization expense per year associated with our current other intangible assets during fiscal 2011 and each of the next four succeeding years.
(6) Long-Term Debt
Long-term debt consists of the following as of the dates indicated (in thousands):
| |
January 1, 2011 | January 2, 2010 | ||||||
|---|---|---|---|---|---|---|---|---|
Senior secured credit facility: |
||||||||
Revolving credit facility |
$ | — | $ | — | ||||
Term loan |
130,000 | 130,000 | ||||||
7.625% Senior Notes due 2018, net of unamortized discount of $2,252 at January 1, 2011 |
347,748 | — | ||||||
12% Senior Subordinated Notes due 2016 |
— | 69,541 | ||||||
8% Senior Notes due 2011 |
— | 240,000 | ||||||
Total long-term debt |
$ | 477,748 | $ | 439,541 | ||||
Senior Secured Credit Facility. During the third quarter of 2009, Credit Suisse replaced Lehman Commercial Paper Inc. as the administrative agent under our credit facility. Also during the third quarter of 2009, the credit facility was amended to, among other things, extend the maturity date for the undrawn revolving credit facility from January 2011 to February 2013. As amended, our $25.0 million revolving credit facility and our $130.0 million of term loan borrowings mature in February 2013. The following discussion of the credit facility describes the credit facility as amended through the date of issuance of the accompanying consolidated financial statements.
62
B&G FOODS, INC. AND SUBSIDIARIES
Notes to Consolidated Financial Statements (Continued)
January 1, 2011, January 2, 2010 and January 3, 2009
(6) Long-Term Debt (Continued)
Interest under the revolving credit facility, including any outstanding letters of credit, is determined based on alternative rates that we may choose in accordance with the revolving credit facility, including the base lending rate per annum plus an applicable margin of 2.00%, and LIBOR plus an applicable margin of 3.00%. We pay a commitment fee of 0.50% per annum on the unused portion of the revolving credit facility. Interest under the term loan facility is determined based on alternative rates that we may choose in accordance with the credit facility, including the base lending rate per annum plus an applicable margin of 1.00%, and LIBOR plus an applicable margin of 2.00%.
Our obligations under the credit facility are jointly and severally and fully and unconditionally guaranteed on a senior basis by all of our existing and certain future domestic subsidiaries. The credit facility is secured by substantially all of our and our domestic subsidiaries' assets except our and our domestic subsidiaries' real property. The credit facility provides for mandatory prepayment upon certain asset dispositions and issuances of securities, as defined. The credit facility contains covenants that restrict, among other things, our ability to incur additional indebtedness, pay dividends and create certain liens. The credit facility also contains certain financial maintenance covenants, which, among other things, specify maximum capital expenditure limits, a minimum interest coverage ratio and a maximum senior and total leverage ratio, each ratio as defined. As of January 1, 2011, we were in compliance with all of the covenants in the credit facility. Proceeds of the revolving credit facility are restricted to funding our working capital requirements, capital expenditures and acquisitions of companies in the same or similar line of business as our company, subject to specified criteria. The maximum letter of credit capacity under the revolving credit facility is $10.0 million, with a fronting fee of 3.0% per annum for all outstanding letters of credit.
At January 1, 2011, the available borrowing capacity under our revolving credit facility, net of outstanding letters of credit of $0.5 million, was $24.5 million. We have not drawn upon the revolving credit facility since its inception in October 2004 and, based upon our cash and cash equivalents on hand and working capital requirements, we have no plans to do so for the foreseeable future.
In February 2007, we entered into a six-year interest rate swap agreement in order to effectively fix at 7.0925% the interest rate payable for our $130.0 million of term loan borrowings under the credit agreement through the life of the term loan borrowings. We initially designated the interest rate swap as a cash flow hedge and recorded changes in the fair value of the swap in accumulated other comprehensive loss, net of tax in our consolidated balance sheet. In September 2008 due to the counterparty's bankruptcy, we determined that the interest rate swap was no longer an effective hedge for accounting purposes. Accordingly, subsequent to that determination, we recorded changes in the swap's fair value in current earnings in net interest expense in our consolidated statements of operations. We obtained third-party verification of fair value at the end of each reporting period. As of January 1, 2011, the fair value of the interest rate swap was an unrealized loss of $12.0 million and is recorded in current liabilities on our consolidated balance sheet. The amount recorded in accumulated other comprehensive loss will be reclassified to net interest expense over the remaining life of the term loan borrowings as we make interest payments. Net interest expense in fiscal 2010 includes a charge of $0.4 million relating to unrealized loss on the interest rate swap and a reclassification of $1.7 million of the amount recorded in accumulated other comprehensive loss related to the swap. Net interest expense in fiscal 2010 also includes a reduction in interest income primarily due to lower interest rates. On January 18, 2011, we terminated the interest rate swap agreement. See Note 14.
63
B&G FOODS, INC. AND SUBSIDIARIES
Notes to Consolidated Financial Statements (Continued)
January 1, 2011, January 2, 2010 and January 3, 2009
(6) Long-Term Debt (Continued)
7.625% Senior Notes due 2018. In January 2010, we issued $350.0 million aggregate principal amount of 7.625% senior notes due 2018 at a public offering price of 99.271% of their face value. The original issue discount of $2.6 million will be amortized over the life of the notes as interest expense. Interest on the senior notes is payable on January 15 and July 15 of each year. The senior notes will mature on January 15, 2018, unless earlier retired or redeemed as described below.
On or after January 15, 2014, we may redeem some or all of the senior notes at a redemption price of 103.813% beginning January 15, 2014 and thereafter at prices declining annually to 100% on or after January 15, 2017, plus accrued and unpaid interest to the date of redemption. We may redeem up to 35% of the aggregate principal amount of the notes prior to January 15, 2013 with the net proceeds from certain equity offerings at a redemption price of 107.625% plus accrued and unpaid interest to the date of redemption. We may also redeem some or all of the notes at any time prior to January 15, 2014 at a redemption price equal to a specified make-whole amount plus accrued and unpaid interest to the date of redemption. In addition, if we undergo a change of control, we may be required to offer to repurchase the notes at the repurchase price of 101% plus accrued and unpaid interest to the date of redemption.
We may also, from time to time, seek to retire senior notes through cash repurchases of senior notes and/or exchanges of senior notes for equity securities, in open market purchases, privately negotiated transactions or otherwise. Such repurchases or exchanges, if any, will depend on prevailing market conditions, our liquidity requirements, contractual restrictions and other factors. The amounts involved may be material.
Our obligations under the senior notes are jointly and severally and fully and unconditionally guaranteed on a senior basis by all of our existing and certain future domestic subsidiaries. The senior notes and the subsidiary guarantees are our and the guarantors' general unsecured obligations and are effectively junior in right of payment to all of our and the guarantors' secured indebtedness and to the indebtedness and other liabilities of our non-guarantor subsidiaries; are pari passu in right of payment to all of our and the guarantors' existing and future unsecured senior debt; and are senior in right of payment to all of our and the guarantors' future subordinated debt. Our foreign subsidiary is not a guarantor, and any future foreign or partially owned domestic subsidiaries will not be guarantors, of our senior notes.
Our senior notes indenture contains covenants with respect to us and the guarantors and restricts the incurrence of additional indebtedness and the issuance of capital stock; the payment of dividends or distributions on, and redemption of, capital stock; a number of other restricted payments, including certain investments; specified creation of liens, certain sale-leaseback transactions and sale of certain specified assets; fundamental changes, including consolidation, mergers and transfers of all or substantially all of our assets; and specified transactions with affiliates. Each of the covenants is subject to a number of important exceptions and qualifications. As of January 1, 2011, we were in compliance with all of the covenants in the senior notes indenture.
Subsidiary Guarantees. We have no assets or operations independent of our direct and indirect subsidiaries. All of our present domestic subsidiaries jointly and severally and fully and unconditionally guarantee our long-term debt, and management has determined that our Canadian subsidiary, which is our only subsidiary that is not a guarantor of our long-term debt is a "minor subsidiary" as that term is
64
B&G FOODS, INC. AND SUBSIDIARIES
Notes to Consolidated Financial Statements (Continued)
January 1, 2011, January 2, 2010 and January 3, 2009
(6) Long-Term Debt (Continued)
used in Rule 3-10 of Regulation S-X promulgated by the SEC. There are no significant restrictions on our ability and the ability of our subsidiaries to obtain funds from our respective subsidiaries by dividend or loan. Consequently, separate financial statements have not been presented for our subsidiaries because management has determined that they would not be material to investors.
12% Senior Subordinated Notes due 2016. During fiscal 2009, we repurchased $96.3 million principal amount of our senior subordinated notes, including $6.3 million in a privately negotiated transaction, and $90.0 million at a cash redemption price of 106% of the principal amount of the notes being redeemed, plus accrued and unpaid interest. In January 2010, we repurchased $44.7 million aggregate principal amount of the senior subordinated notes with a portion of the proceeds of our public offering of 7.625% senior notes due 2018 at a repurchase price of 106.5% of such principal amount plus accrued and unpaid interest. In February 2010, we repurchased or redeemed the remaining $24.8 million aggregate principal amount of the senior subordinated notes at a price equal to 106.0% of such principal amount, plus accrued and unpaid interest.
8% Senior Notes due 2011. In January 2010, we repurchased $238.9 million aggregate principal amount of the 8% senior notes with a portion of the proceeds of our public offering of 7.625% senior notes due 2018 at a repurchase price of 102.375% of such principal amount plus accrued and unpaid interest, and set aside sufficient proceeds of the offering to repurchase or redeem the remaining 8% senior notes. In February 2010, we repurchased or redeemed the remaining $1.1 million aggregate principal amount of the 8% senior notes at a price equal to 102.0% of such principal amount, plus accrued and unpaid interest.
Deferred Debt Financing Costs. During fiscal 2009, we wrote-off and expensed $4.4 million of deferred debt financing costs relating to the repurchase during the year of $96.3 million principal amount of senior subordinated notes. During fiscal 2009, we also capitalized approximately $0.7 million of additional debt financing costs in connection with an amendment to our credit facility. In connection with the issuance of our 7.625% senior notes in January 2010, we capitalized approximately $8.2 million of debt financing costs during the first quarter of 2010, which will be amortized over the term of the senior notes. During the first quarter of 2010, we wrote-off and expensed $4.5 million of deferred debt financing costs relating to the retirement of our remaining $69.5 million principal amount of 12% senior subordinated notes and $240.0 million principal amount of 8% senior notes. As of January 1, 2011 and January 2, 2010 we had net deferred debt financing costs of $8.7 million and $6.7 million, respectively.
Loss on Extinguishment of Debt. Loss on extinguishment of debt during fiscal 2009 included $10.2 million of costs relating to our repurchase and redemption of $96.3 million aggregate principal amount of senior subordinated notes during fiscal 2009, including $5.8 million for the payment of a repurchase premium and a non-cash charge of $4.4 million for the write-off of unamortized deferred financing costs associated with the notes repurchased. In connection with the retirement of the remaining 8% senior notes and 12% senior subordinated notes, we incurred a loss on extinguishment of debt of approximately $15.2 million during the first quarter of 2010, including the repurchase premium and other expenses of $10.7 million and as mentioned above, a write-off and expense of $4.5 million of deferred debt financing costs.
65
B&G FOODS, INC. AND SUBSIDIARIES
Notes to Consolidated Financial Statements (Continued)
January 1, 2011, January 2, 2010 and January 3, 2009
(6) Long-Term Debt (Continued)
Contractual Maturities. As of January 1, 2011, the aggregate contractual maturities of long-term debt are as follows (in thousands):
Fiscal Year:
|
|
||||
|---|---|---|---|---|---|
2011 |
$ | — | |||
2012 |
— | ||||
2013 |
130,000 | ||||
2014 |
— | ||||
2015 |
— | ||||
Thereafter |
350,000 | ||||
Total |
$ | 480,000 | |||
Accrued Interest. At January 1, 2011 and January 2, 2010 accrued interest of $13.2 million and $7.3 million, respectively, is included in accrued expenses in the accompanying consolidated balance sheets.
(7) Fair Value Measurements
The authoritative accounting literature relating to fair value measurements defines fair value as the price that would be received to sell an asset or paid to transfer a liability in an orderly transaction between market participants at the measurement date (an exit price). The accounting literature outlines a valuation framework and creates a fair value hierarchy in order to increase the consistency and comparability of fair value measurements and the related disclosures. Under generally accepted accounting principles, certain assets and liabilities must be measured at fair value, and the accounting literature details the disclosures that are required for items measured at fair value.
Financial assets and liabilities are measured using inputs from the three levels of the fair value hierarchy under the accounting literature. The three levels are as follows:
Level 1—Inputs are unadjusted quoted prices in active markets for identical assets or liabilities.
Level 2—Inputs, other than quoted market prices included within Level 1, that are observable for the asset or liability, either directly or indirectly. We used a discounted cash flow analysis of the implied yield curves to value our interest rate swap. While these inputs are observable, they are not all quoted market prices, so the fair values of our interest rate swap fall in Level 2.
Level 3—Unobservable inputs that reflect our assumptions about the assumptions that market participants would use in pricing the asset or liability.
In accordance with the fair value hierarchy described above, the following table shows the fair value of our interest rate swap as of January 1, 2011, which is included in current liabilities and January 2, 2010, which is included in other liabilities in our consolidated balance sheets (in thousands):
| |
|
Fair Value Measurements | ||||||||||
|---|---|---|---|---|---|---|---|---|---|---|---|---|
| |
Description | Level 1 | Level 2 | Level 3 | ||||||||
January 1, 2011 |
Interest rate swap | $ | — | $ | 12,012 | $ | — | |||||
January 2, 2010 |
Interest rate swap | $ | — | $ | 11,576 | $ | — | |||||
66
B&G FOODS, INC. AND SUBSIDIARIES
Notes to Consolidated Financial Statements (Continued)
January 1, 2011, January 2, 2010 and January 3, 2009
(7) Fair Value Measurements (Continued)
Cash and cash equivalents, trade accounts receivable, income tax receivable, trade accounts payable, accrued expenses and dividends payable are reflected in the consolidated balance sheets at carrying value, which approximates fair value due to the short-term nature of these instruments.
The carrying values and fair values of our term loan borrowings, senior notes and senior subordinated notes as of January 1, 2011 and January 2, 2010 are as follows (in thousands):
| |
January 1, 2011 | January 2, 2010 | |||||||||||
|---|---|---|---|---|---|---|---|---|---|---|---|---|---|
| |
Carrying Value | Fair Value(1) | Carrying Value | Fair Value(1) | |||||||||
Senior Secured Term Loan due 2013 |
$ | 130,000 | $ | 128,050 | $ | 130,000 | $ | 127,400 | |||||
8% Senior Notes due 2011 |
— | — | 240,000 | 243,000 | |||||||||
7.625% Senior Notes due 2018 |
347,748 | (2) | 362,250 | — | — | ||||||||
12% Senior Subordinated Notes due 2016 |
— | — | 69,541 | 69,172 | |||||||||
- (1)
- Fair
values are estimated based on quoted market prices.
- (2)
- The carrying value of the 7.625% senior notes is net of discount. The face amount of the senior notes is $350.0 million.
As of the end of fiscal 2010 and fiscal 2009, our term loan borrowings were subject to an interest rate swap discussed in Notes 6, 8 and 14.
(8) Disclosures about Derivative Instruments and Hedging Activities
The following table presents the fair value and the location within our consolidated balance sheet of all assets and liabilities associated with derivative instruments not designated as hedging instruments for accounting purposes (in thousands):
| |
|
Asset Derivatives |
Liability Derivatives |
Asset Derivatives |
Liability Derivatives |
||||||||||
|---|---|---|---|---|---|---|---|---|---|---|---|---|---|---|---|
Derivatives not designated as hedging instruments
|
Balance Sheet Location |
Fair Value at January 1, 2011 |
Fair Value at January 1, 2011 |
Fair Value at January 2, 2010 |
Fair Value at January 2, 2010 |
||||||||||
Interest rate swap |
Current liabilities | — | $ | 12,012 | — | — | |||||||||
Interest rate swap |
Other liabilities | — | — | — | $ | 11,576 | |||||||||
See Notes 6, 7 and 14 for additional information regarding the interest rate swap. We do not currently have any derivatives designated as hedging instruments.
The following tables present the impact of derivative instruments and their location within our consolidated statements of operations (in thousands):
| |
Amount of Loss Recognized in Income on Derivatives |
Amount of Loss Recognized in Income on Derivatives |
|
|||||
|---|---|---|---|---|---|---|---|---|
Derivatives not designated as hedging instruments
|
Fiscal Year Ended January 1, 2011 |
Fiscal Year Ended January 2, 2010 |
Location of Loss Recognized in Income on Derivatives |
|||||
Interest rate swap |
$ | 2,129 | * | $ | 152 | * | Interest expense, net | |
- *
- The amount included in net interest expense for fiscal 2010 consists of $436 unrealized loss on the interest rate swap and $1,693 charge (pre-tax) for the reclassification to net interest expense from accumulated other comprehensive income,
67
B&G FOODS, INC. AND SUBSIDIARIES
Notes to Consolidated Financial Statements (Continued)
January 1, 2011, January 2, 2010 and January 3, 2009
(8) Disclosures about Derivative Instruments and Hedging Activities (Continued)
respectively. The amount included in net interest expense for fiscal 2009 consists of $1,541 unrealized gain on the interest rate swap, and $1,693 charge (pre-tax) for the reclassification to net interest expense from accumulated other comprehensive income, respectively.
(9) Income Taxes
The components of income before income tax expense consist of the following (in thousands):
| |
Fiscal 2010 | Fiscal 2009 | Fiscal 2008 | ||||||||
|---|---|---|---|---|---|---|---|---|---|---|---|
U.S. |
$ | 49,103 | $ | 28,644 | $ | 15,771 | |||||
Foreign |
48 | 21 | 46 | ||||||||
Total |
$ | 49,151 | $ | 28,665 | $ | 15,817 | |||||
Income tax expense (benefit) consists of the following (in thousands):
| |
Fiscal 2010 | Fiscal 2009 | Fiscal 2008 | |||||||||
|---|---|---|---|---|---|---|---|---|---|---|---|---|
Current: |
||||||||||||
Federal |
$ | 6,806 | $ | 1,665 | $ | (1,181 | ) | |||||
State |
505 | 83 | — | |||||||||
Foreign |
9 | 31 | 15 | |||||||||
Subtotal |
7,320 | 1,779 | (1,166 | ) | ||||||||
Deferred: |
||||||||||||
Federal |
9,824 | 8,300 | 6,782 | |||||||||
State |
(372 | ) | 1,145 | 468 | ||||||||
Subtotal |
9,452 | 9,445 | 7,250 | |||||||||
Total |
$ | 16,772 | $ | 11,224 | $ | 6,084 | ||||||
Income tax expense differs from the expected income tax expense (computed by applying the U.S. federal income tax rate of 35% for fiscal years 2010, 2009 and 2008 to income before income tax expense) as a result of the following:
| |
Fiscal 2010 | Fiscal 2009 | Fiscal 2008 | |||||||||
|---|---|---|---|---|---|---|---|---|---|---|---|---|
Expected tax expense |
35.0 | % | 35.0 | % | 35.0 | % | ||||||
Increase (decrease): |
||||||||||||
State income taxes, net of federal income tax benefit/expense |
2.3 | % | 4.2 | % | 3.3 | % | ||||||
Impact on deferred taxes from changes in state tax rates |
(2.1 | )% | — | — | ||||||||
Permanent differences |
(0.8 | )% | (0.2 | )% | 0.6 | % | ||||||
Other differences |
(0.3 | )% | 0.2 | % | (0.4 | )% | ||||||
Total |
34.1 | % | 39.2 | % | 38.5 | % | ||||||
68
B&G FOODS, INC. AND SUBSIDIARIES
Notes to Consolidated Financial Statements (Continued)
January 1, 2011, January 2, 2010 and January 3, 2009
(9) Income Taxes (Continued)
In fiscal 2010, changes in state tax laws impacting apportionment rates resulted in a decrease of our blended state rate, resulting in a tax benefit of $1.1 million.
The tax effects of temporary differences that give rise to significant portions of the deferred tax assets and deferred tax liabilities are presented below (in thousands):
| |
January 1, 2011 | January 2, 2010 | ||||||||
|---|---|---|---|---|---|---|---|---|---|---|
Deferred tax assets: |
||||||||||
Accounts receivable, principally due to allowance |
$ | 37 | $ | 38 | ||||||
Inventories, principally due to additional costs capitalized for tax purposes |
752 | 841 | ||||||||
Accruals and other liabilities |
8,120 | 9,685 | ||||||||
Net operating loss and tax credit carryforwards |
66 | 314 | ||||||||
Deferred debt financing costs |
249 | 369 | ||||||||
Total gross deferred tax assets |
9,224 | 11,247 | ||||||||
Deferred tax liabilities: |
||||||||||
Plant and equipment |
(5,845 | ) | (4,888 | ) | ||||||
Goodwill |
(29,811 | ) | (25,939 | ) | ||||||
Trademarks |
(62,362 | ) | (58,880 | ) | ||||||
Other intangible assets |
(3,183 | ) | (2,413 | ) | ||||||
Prepaid expenses |
(516 | ) | (674 | ) | ||||||
Total gross deferred tax liabilities |
(101,717 | ) | (92,794 | ) | ||||||
Net deferred tax liability |
$ | (92,493 | ) | $ | (81,547 | ) | ||||
In assessing the realizability of deferred tax assets, management considers whether it is more likely than not that some portion or all of the deferred tax assets will not be realized. The ultimate realization of deferred tax assets is dependent upon the generation of future taxable income during the periods in which those temporary differences become deductible. Management considers the scheduled reversal of deferred tax liabilities, projected future taxable income and tax planning strategies in making this assessment. Based upon the level of historical taxable income and projections for future taxable income and reversal of deferred tax liabilities over the periods in which the deferred tax assets are deductible, management believes it is more likely than not that we will realize the benefits of these deductible differences, at January 1, 2011. The amount of the deferred tax assets considered realizable, however, could be reduced in the near term if estimates of future taxable income during future periods are reduced.
The valuation allowance at January 1, 2011 and January 2, 2010 was $0.
At January 1, 2011, we have certain state net operating loss carryforwards of $15.6 million, which are available to offset future taxable income, if any, through 2029, which will generate approximately $0.1 million of a cash tax benefit. As a result of our acquisitions in prior years, the annual utilization of the net operating loss carryforwards acquired is limited under certain provisions of the Internal Revenue Code.
69
B&G FOODS, INC. AND SUBSIDIARIES
Notes to Consolidated Financial Statements (Continued)
January 1, 2011, January 2, 2010 and January 3, 2009
(9) Income Taxes (Continued)
At January 1, 2011 we have intangibles of $245.9 million for tax purposes, which are amortizable through 2025.
We operate in multiple taxing jurisdictions within the United States and Canada and from time to time face audits from various tax authorities regarding the deductibility of certain expenses, state income tax nexus, intercompany transactions, transfer pricing and other matters. Although we do not believe that we are currently under examination in any of our major tax jurisdictions, we remain subject to examination in all of our tax jurisdictions until the applicable statutes of limitations expire. As of January 1, 2011, a summary of the tax years that remain subject to examination in our major tax jurisdictions are:
United States—Federal |
2009 and forward | |
United States—States |
2006 and forward | |
Canada |
2006 and forward |
As of January 1, 2011, we do not have any reserves for uncertain tax positions. Our policy is to classify interest and penalties that result from any income tax uncertainties as income tax expense.
(10) Capital Stock
Authorized Common Stock. During fiscal 2010, we amended our certificate of incorporation to (1) rename our Class A common stock simply as "common stock," (2) eliminate the 25,000,000 authorized shares of Class B common stock, none of which were then outstanding, and (3) increase our authorized shares of common stock from 100 million to 125 million.
The following table sets forth the activity in the number of shares of common outstanding (in thousands):
| |
Common Stock | ||||
|---|---|---|---|---|---|
Common stock outstanding at December 29, 2007 |
36,779 | ||||
Shares issued for share-based compensation |
18 | ||||
Repurchases of common stock |
(550 | ) | |||
Common stock outstanding at January 3, 2009 |
36,247 | ||||
Shares issued in public offering |
11,500 | ||||
Shares issued for share-based compensation |
24 | ||||
Repurchases of common stock |
(404 | ) | |||
Common stock outstanding at January 2, 2010 |
47,367 | ||||
Shares issued for share-based compensation |
273 | ||||
Common stock outstanding at January 1, 2011 |
47,640 | ||||
Voting Rights. The holders of our common stock are entitled to one vote per share with respect to each matter on which the holders of our common stock are entitled to vote. The holders of our common stock are not entitled to cumulate their votes in the election of our directors.
70
B&G FOODS, INC. AND SUBSIDIARIES
Notes to Consolidated Financial Statements (Continued)
January 1, 2011, January 2, 2010 and January 3, 2009
(10) Capital Stock (Continued)
Dividends. The holders of our common stock are entitled to receive dividends, if any, as they may be lawfully declared from time to time by our board of directors, subject to any preferential rights of holders of any outstanding shares of preferred stock. In the event of any liquidation, dissolution or winding up of our company, common stockholders are entitled to share ratably in our assets available for distribution to the stockholders, subject to the prior rights of holders of any outstanding preferred stock.
During fiscal 2010 and 2009, our board of directors declared quarterly cash dividends on our common stock of $0.17 per share. During fiscal 2008, our board of directors declared quarterly cash dividends on our common stock of $0.212 per share during each of the first three quarters and $0.17 per share during the fourth quarter.
Additional Issuance of Our Authorized Common Stock and Preferred Stock. Additional shares of our authorized common stock and preferred stock may be issued, as determined by our board of directors from time to time, without approval of holders of our common stock, except as may be required by applicable law or the rules of any stock exchange or automated quotation system on which our securities may be listed or traded. Our board of directors has the authority by resolution to determine and fix, with respect to each series of preferred stock prior to the issuance of any shares of the series to which such resolution relates, the designations, powers, preferences and rights of the shares of preferred stock of such series and any qualifications, limitations or restrictions thereof.
Stock Repurchases. We did not repurchase any shares of common stock during fiscal 2010. We repurchased and retired 403,500 shares of common stock at an average cost per share (excluding fees and commissions) of $5.76, or $2.3 million in the aggregate during fiscal 2009, and 550,331 shares of common stock in fiscal 2008 at an average cost per share (excluding fees and commissions) of $4.60, or $2.6 million in the aggregate, pursuant to a stock repurchase program originally authorized by our board of directors in October 2008. The stock repurchase program authorization expired during the third quarter of 2010.
(11) Pension Benefits
We have defined benefit pension plans covering substantially all of our employees. The benefits are based on years of service and the employee's compensation, as defined.
The following table sets forth our defined benefit pension plans' benefit obligation, fair value of plan assets and funded status recognized in the consolidated balance sheets. We used January 1, 2011
71
B&G FOODS, INC. AND SUBSIDIARIES
Notes to Consolidated Financial Statements (Continued)
January 1, 2011, January 2, 2010 and January 3, 2009
(11) Pension Benefits (Continued)
and January 2, 2010 measurement dates for fiscal 2010 and 2009, respectively, to calculate end of year benefit obligations, fair value of plan assets and annual net periodic benefit cost.
| |
January 1, 2011 |
January 2, 2010 |
||||||
|---|---|---|---|---|---|---|---|---|
| |
(in thousands) |
|||||||
Change in projected benefit obligation: |
||||||||
Projected benefit obligation at beginning of year |
$ | 32,904 | $ | 29,038 | ||||
Actuarial loss |
496 | 1,101 | ||||||
Service cost |
1,498 | 1,661 | ||||||
Interest cost |
1,817 | 1,785 | ||||||
Benefits paid |
(773 | ) | (681 | ) | ||||
Projected benefit obligation at end of year |
35,942 | 32,904 | ||||||
Change in plan assets: |
||||||||
Fair value of plan assets at beginning of year |
26,665 | 19,197 | ||||||
Actual gain on plan assets |
4,296 | 4,599 | ||||||
Employer contributions |
4,145 | 3,550 | ||||||
Benefits paid |
(773 | ) | (681 | ) | ||||
Fair value of plan assets at end of year |
34,333 | 26,665 | ||||||
Net amount recognized: |
||||||||
Other assets |
$ | 1,143 | $ | 604 | ||||
Other long-term liabilities |
(2,752 | ) | (6,843 | ) | ||||
Funded status at the end of the year |
$ | (1,609 | ) | $ | (6,239 | ) | ||
Amount recognized in accumulated other comprehensive loss consist of: |
||||||||
Prior service cost |
$ | (305 | ) | $ | (350 | ) | ||
Actuarial loss |
(7,201 | ) | (9,260 | ) | ||||
Deferred taxes |
2,807 | 3,641 | ||||||
Accumulated other comprehensive loss |
$ | (4,699 | ) | $ | (5,969 | ) | ||
The amounts in accumulated other comprehensive loss that are expected to be recognized as components of net periodic benefit cost fiscal 2011 are as follows (in thousands):
Prior service cost |
$ | 45 | ||
Actuarial loss |
279 | |||
|
$ | 324 | ||
72
B&G FOODS, INC. AND SUBSIDIARIES
Notes to Consolidated Financial Statements (Continued)
January 1, 2011, January 2, 2010 and January 3, 2009
(11) Pension Benefits (Continued)
| |
January 1, 2011 |
January 2, 2010 |
|||||
|---|---|---|---|---|---|---|---|
Weighted-average assumptions: |
|||||||
Discount rate |
5.50 | % | 6.00 | % | |||
Rate of compensation increase |
4.00 | % | 4.00 | % | |||
Expected long-term rate of return |
7.25 | % | 7.25 | % | |||
The discount rate used to determine year-end fiscal 2010 and fiscal 2009 pension benefit obligations was derived by matching the plans' expected future cash flows to the corresponding yields from the Citigroup Pension Discount Curve. This yield curve has been constructed to represent the available yields on high-quality fixed-income investments across a broad range of future maturities.
The overall expected long-term rate of return on plan assets assumption is based upon a building-block method, whereby the expected rate of return on each asset class is broken down into three components: (1) inflation, (2) the real risk-free rate of return (i.e., the long-term estimate of future returns on default-free U.S. government securities), and (3) the risk premium for each asset class (i.e., the expected return in excess of the risk-free rate).
All three components are based primarily on historical data, with modest adjustments to take into account additional relevant information that is currently available. For the inflation and risk-free return components, the most significant additional information is that provided by the market for nominal and inflation-indexed U.S. Treasury securities. That market provides implied forecasts of both the inflation rate and risk-free rate for the period over which currently-available securities mature. The historical data on risk premiums for each asset class is adjusted to reflect any systemic changes that have occurred in the relevant markets; e.g., the higher current valuations for equities, as a multiple of earnings, relative to the longer-term average for such valuations.
While the precise expected long-term return derived using the above approach will fluctuate somewhat from year to year, our policy is to hold this long-term assumption constant as long as it remains within a reasonable tolerance from the derived rate.
Net periodic cost includes the following components (in thousands):
| |
Fiscal 2010 | Fiscal 2009 | Fiscal 2008 | ||||||||
|---|---|---|---|---|---|---|---|---|---|---|---|
Service cost—benefits earned during the period |
$ | 1,498 | $ | 1,661 | $ | 1,361 | |||||
Interest cost on projected benefit obligation |
1,817 | 1,785 | 1,497 | ||||||||
Expected return on plan assets |
(2,052 | ) | (1,463 | ) | (1,832 | ) | |||||
Amortization of unrecognized prior service cost |
45 | 45 | 45 | ||||||||
Amortization of loss/(gain) |
311 | 743 | (12 | ) | |||||||
Net pension cost |
$ | 1,619 | $ | 2,771 | $ | 1,059 | |||||
The asset allocation for our pension plans at the end of fiscal 2010 and fiscal 2009, and the target allocation for fiscal 2011, by asset category, follows. The fair value of plan assets for these plans is $34.3 million and $26.7 million at the end of fiscal 2010 and fiscal 2009, respectively. The expected long-term rate of return on these plan assets was 7.25% in fiscal 2010 and fiscal 2009.
73
B&G FOODS, INC. AND SUBSIDIARIES
Notes to Consolidated Financial Statements (Continued)
January 1, 2011, January 2, 2010 and January 3, 2009
(11) Pension Benefits (Continued)
Our pension plan assets are managed by outside investment managers; assets are rebalanced at the end of each quarter. Our investment strategy with respect to pension assets is to maximize return while protecting principal. The investment manager has the flexibility to adjust the asset allocation and move funds to the asset class that offers the most opportunity for investment returns.
| |
|
Percentage of Plan Assets at Year End |
||||||||
|---|---|---|---|---|---|---|---|---|---|---|
Asset Category
|
Target Allocation |
January 1, 2011 |
January 2, 2010 |
|||||||
Equity securities |
60 | % | 51 | % | 47 | % | ||||
Fixed income securities |
38 | % | 42 | % | 47 | % | ||||
Cash |
2 | % | 7 | % | 6 | % | ||||
Total |
100 | % | 100 | % | 100 | % | ||||
The general investment objective of each of the pension plans is to grow the plan assets in relation to the plan liabilities while prudently managing the risk of a decrease in the plan's assets relative to those liabilities. To meet this objective, our management has adopted the above target allocations that it reconsiders from time to time as circumstances change.
The fair values of our pension plan assets at January 1, 2011 and January 2, 2010, utilizing the fair value hierarchy discussed in Note 7 follow (in thousands):
| |
January 1, 2011 | January 2, 2010 | ||||||||||||
|---|---|---|---|---|---|---|---|---|---|---|---|---|---|---|
| |
Level 1 | Levels 2 & 3 | Level 1 | Levels 2 & 3 | ||||||||||
Asset Category |
||||||||||||||
Cash |
$ | 2,260 | $ | — | $ | 1,521 | $ | — | ||||||
Equity securities: |
||||||||||||||
U.S. mutual funds |
13,467 | — | 9,560 | — | ||||||||||
International mutual funds |
586 | — | 446 | — | ||||||||||
U.S. common stocks(1) |
3,404 | — | 2,465 | — | ||||||||||
Fixed income securities: |
||||||||||||||
U.S. mutual funds |
14,616 | — | 12,126 | — | ||||||||||
U.S. corporate bonds |
— | — | 547 | — | ||||||||||
Total |
$ | 34,333 | $ | — | $ | 26,665 | $ | — | ||||||
- (1)
- All of the equity securities listed under "U.S. common stocks" are shares of our company's common stock. Under the Employee Retirement Income Security Act (ERISA), our pension plans may not invest more than 10% of their assets in company securities.
The investment portfolio contains a diversified blend of common stocks, bonds, cash equivalents and other investments, which may reflect varying rates of return. The investments are further diversified within each asset classification. The portfolio diversification provides protection against a single security or class of securities having a disproportionate impact on aggregate performance. The long-term target allocations for plans assets are 60% in equities, 38% in fixed income and 2% in cash equivalents, although the actual plan asset allocations may be within a range around these targets. The
74
B&G FOODS, INC. AND SUBSIDIARIES
Notes to Consolidated Financial Statements (Continued)
January 1, 2011, January 2, 2010 and January 3, 2009
(11) Pension Benefits (Continued)
actual asset allocations are reviewed and rebalanced on a periodic basis to maintain the target allocations.
Information about the expected cash flows for the pension plan follows (in thousands):
| |
Pension Benefits | ||||
|---|---|---|---|---|---|
Company contributions: |
|||||
2011 |
$ | 3,075 | |||
Benefit payments: |
|||||
2011 |
$ | 975 | |||
2012 |
1,035 | ||||
2013 |
1,125 | ||||
2014 |
1,320 | ||||
2015 |
1,511 | ||||
2016 to 2020 |
10,589 | ||||
As of the date of issuance of the accompanying consolidated financial statements, we made $1.6 million of defined benefit pension plan contributions during fiscal 2011. We expect to make approximately $1.5 million in additional voluntary contribution payments during the remainder of fiscal 2011.
We also sponsor a defined contribution plan covering substantially all of our employees. Employees may contribute to this plan and these contributions are matched by us at varying amounts. Contributions for the matching component of this plan amounted to $0.7 million, $0.6 million and $0.8 million for fiscal 2010, fiscal 2009 and fiscal 2008, respectively.
Pension expense relating to a multi-employer pension plan amounted to $1.1 million for fiscal 2010, fiscal 2009 and fiscal 2008.
(12) Commitments and Contingencies
Operating Leases. We have several noncancelable operating leases, primarily for our corporate headquarters, one of our manufacturing facilities, warehouses, transportation equipment and machinery. These leases generally require us to pay all executory costs such as maintenance, taxes and insurance. Total rental expense for our operating leases was $6.1 million, $5.7 million and $4.2 million, for the fiscal years 2010, 2009 and 2008, respectively.
75
B&G FOODS, INC. AND SUBSIDIARIES
Notes to Consolidated Financial Statements (Continued)
January 1, 2011, January 2, 2010 and January 3, 2009
(12) Commitments and Contingencies (Continued)
As of January 1, 2011, future minimum lease payments under non-cancelable operating leases (with initial or remaining lease terms in excess of one year) for the periods set forth below are as follows (in thousands):
Fiscal year ending:
|
Third Parties | ||||
|---|---|---|---|---|---|
2011 |
$ | 5,613 | |||
2012 |
5,384 | ||||
2013 |
4,359 | ||||
2014 |
3,282 | ||||
2015 |
622 | ||||
Thereafter |
2,738 | ||||
Total |
$ | 21,998 | |||
Legal Proceedings. We are from time to time involved in various claims and legal actions arising in the ordinary course of business, including proceedings involving product liability claims, worker's compensation and other employee claims, and tort and other general liability claims, as well as trademark, copyright, patent infringement and related claims and legal actions. In the opinion of our management, the ultimate disposition of any currently pending claims or actions will not have a material adverse effect on our consolidated financial position, results of operations or liquidity.
On May 7, 2009, SK Foods, LP, one of our former suppliers filed a voluntary petition for relief under chapter 11 of the United States Bankruptcy Code. In September 2009, B&G Foods filed proofs of claim in SK Foods' bankruptcy cases to assert substantial damage claims against SK Foods and its affiliates for, among other things, fraud, breach of contract, indemnity, RICO and antitrust violations, and to preserve offset and recoupment rights for such claims against any amounts allegedly owing to SK Foods or its affiliates and certain other claims against SK Foods and its affiliates. On March 24, 2010, the bankruptcy trustee in the bankruptcy proceedings involving SK Foods filed an adversary proceeding against our company alleging, among other things, breach of contract, avoidance of setoff, violation of the automatic stay, goods sold and delivered, objection to claims and equitable subordination and asserting damages of approximately $16.0 million. B&G Foods answered the complaint denying the bankruptcy trustee's allegations against B&G Foods as being without merit. In addition, B&G Foods filed a counterclaim alleging, among other things, breach of multiple contracts, breach of express indemnity, breach of warranties, fraudulent inducement, negligent and intentional misrepresentation, violations of the Sherman Antitrust Act, violations of the Robinson-Patman Act, violations of California's Cartwright Act, violations of California's Unfair Practices Act, violations of California's Unfair Competition Law, RICO violations, account stated and recoupment. During the third quarter of 2010, to avoid expense and the uncertainly of litigation, we entered into a settlement agreement with the bankruptcy trustee and the Bank of Montreal, the agent for SK Foods' secured lenders, pursuant to which we agreed to pay the Bank of Montreal, on behalf of the secured lenders, $1.6 million in exchange for a mutual release pursuant to which the bankruptcy trustee and the Bank of Montreal (as agent for the secured lenders), on the one hand, and B&G Foods, on the other, would release each other from all claims and counter-claims related to the adversary proceeding and B&G Foods' proofs of claim in SK Foods' bankruptcy cases. In the fourth quarter of 2010, the bankruptcy court approved the settlement and we recorded a gain in cost of goods sold of approximately $1.3 million resulting from the write-off of $3.1 million of accounts payable on our books relating to SK
76
B&G FOODS, INC. AND SUBSIDIARIES
Notes to Consolidated Financial Statements (Continued)
January 1, 2011, January 2, 2010 and January 3, 2009
(12) Commitments and Contingencies (Continued)
Foods, partially offset by the $1.6 million settlement payment (which was paid in January 2011) and approximately $0.2 million of related expenses.
Environmental. We are subject to environmental laws and regulations in the normal course of business. We did not make any material expenditures during fiscal 2010, 2009 or 2008 in order to comply with environmental laws or regulations. Based on our experience to date, management believes that the future cost of compliance with existing environmental laws and regulations (and liability for known environmental conditions) will not have a material adverse effect on our consolidated financial condition, results of operations or liquidity. However, we cannot predict what environmental or health and safety legislation or regulations will be enacted in the future or how existing or future laws or regulations will be enforced, administered or interpreted, nor can we predict the amount of future expenditures that may be required in order to comply with such environmental or health and safety laws or regulations or to respond to such environmental claims.
Collective Bargaining Agreements. As of January 1, 2011, approximately 354 of our 749 employees, or 47.3%, were covered by collective bargaining agreements, of which 173 were covered by a collective bargaining agreements expiring within the next 12 months. Our collective bargaining agreement with the Drivers, Salesmen, Warehousemen, Milk Processors, Cannery, Dairy Employees and Helpers Union (Local No. 695) that covers our Stoughton, Wisconsin employees is scheduled to expire on March 31, 2011. As of the date of issuance of the accompanying consolidated financial statements, we are in negotiations for a new collective bargaining agreement for our Stoughton, Wisconsin facility. However, we cannot assure you that we will be able to negotiate a new Stoughton collective bargaining agreement on terms satisfactory to us, or at all, and without production interruptions, including labor stoppages. If prior to the expiration of the Stoughton collective bargaining agreement we are unable to reach a new agreement without union action or any such new agreement is not on terms satisfactory to us, our business, financial condition or results of operations could be materially and adversely affected. At this time, however, management does not expect that the outcome of these negotiations will have a material adverse impact on our business, financial condition or results of operations.
Severance and Change of Control Agreements. We have employment agreements with each of our six executive officers. The agreements generally continue until terminated by the executive or by us, and provide for severance payments under certain circumstances, including termination by us without cause (as defined) or as a result of the employees' death or disability, or termination by us or a deemed termination upon a change of control (as defined). Severance benefits include payments for salary continuation, continuation of health care and insurance benefits, present value of additional pension credits and, in the case of a change of control, accelerated vesting under compensation plans and potential excise tax liability and gross up payments.
(13) Incentive Plans
Annual Bonus Plan. Annually, our board of directors establishes a bonus plan that provides for cash awards to be made to our executive officers and other senior managers upon our company's attainment of pre-set annual financial objectives. Awards are normally paid in cash in a lump sum following the close of each plan year. At January 1, 2011 and January 2, 2010, accrued expenses in the accompanying consolidated balance sheets include annual bonus accruals of $3.8 million and $3.5 million, respectively.
77
B&G FOODS, INC. AND SUBSIDIARIES
Notes to Consolidated Financial Statements (Continued)
January 1, 2011, January 2, 2010 and January 3, 2009
(13) Incentive Plans (Continued)
2008 Omnibus Incentive Compensation Plan. Upon the recommendation of our compensation committee, our board of directors on March 10, 2008 adopted (subject to stockholder approval) the B&G Foods, Inc. 2008 Omnibus Incentive Compensation Plan, which we refer to as the 2008 Omnibus Plan. Our stockholders approved the 2008 Omnibus Plan at our annual meeting on May 6, 2008.
The 2008 Omnibus Plan authorizes the grant of performance share awards, restricted stock, options, stock appreciation rights, deferred stock, stock units and cash-based awards to employees, non-employee directors and consultants. Subject to adjustment as provided in the plan, the total number of shares of common stock available for awards under the plan is 4,500,000, of which 4,185,233 were available for future issuance as of January 1, 2011. Some of those shares are subject to outstanding performance share long-term incentive awards (LTIAs) as described in the table below.
Performance Share Awards. Beginning in fiscal 2008, our compensation committee has made annual grants of performance share LTIAs to our executive officers and certain other members of senior management under the 2008 Omnibus Plan. The LTIAs entitle the participant to earn shares of common stock upon the attainment of certain performance goals over the applicable performance period. The performance period is typically three years. However, in order to phase in the program, the compensation committee granted three sets of performance share awards in 2008, with a one-year, two-year and three-year performance period, respectively.
The LTIAs, each have a threshold, target and maximum payout. The awards are settled based upon our performance over the applicable performance period. For the LTIAs granted to date, the applicable performance metric is and has been "excess cash" (as defined in the award agreements). If our performance fails to meet the performance threshold, then the awards will not vest and no shares will be issued pursuant to the awards. If our performance meets or exceeds the performance threshold, then a varying amount of shares from the threshold amount (50% of the target number of shares) up to the maximum amount (300% of the target number of shares) may be earned.
Subject to the performance goal for the applicable performance period being certified in writing by our compensation committee as having been achieved, shares of common stock are issued prior to March 15 following the completion of the performance period.
251,368 shares of common stock were issued in March 2010 in respect of LTIAs. The excess tax benefit recorded to additional paid in capital as of the result of the issuance was $0.3 million. No shares of common stock were issued for LTIAs in 2009 or 2008.
The following table sets forth the compensation expense recognized for LTIAs during the last three fiscal years and where that expense is reflected in our consolidated statements of operations (in thousands):
Consolidated Statements of Operations Location
|
Fiscal 2010 | Fiscal 2009 | Fiscal 2008 | ||||||||
|---|---|---|---|---|---|---|---|---|---|---|---|
Cost of goods sold |
$ | 626 | $ | 814 | $ | 144 | |||||
Sales, marketing and warehousing expenses |
593 | 846 | 149 | ||||||||
General and administrative expenses |
1,902 | 2,764 | 565 | ||||||||
Total compensation expense for LTIAs |
$ | 3,121 | $ | 4,424 | $ | 858 | |||||
As of January 1, 2011, there was $3.8 million of unrecognized compensation expense related to LTIAs, which is expected to be recognized over the next 24 months.
78
B&G FOODS, INC. AND SUBSIDIARIES
Notes to Consolidated Financial Statements (Continued)
January 1, 2011, January 2, 2010 and January 3, 2009
(13) Incentive Plans (Continued)
The following table details the activity in our LTIAs for fiscal 2010 as follows:
| |
Number of Performance Shares(1) |
Weighted Average Grant Date Fair Value (per share)(2) |
|||||
|---|---|---|---|---|---|---|---|
Beginning of fiscal 2010 |
1,918,466 | $ | 4.09 | ||||
Granted |
595,254 | $ | 7.63 | ||||
Vested |
(399,842 | ) | $ | 7.65 | |||
Forfeited |
(72,441 | ) | $ | 3.13 | |||
End of fiscal 2010 |
2,041,437 | $ | 4.46 | ||||
- (1)
- Solely
for purposes of this table, the number of performance shares is based on the participants earning the maximum number of performance shares
(i.e., 300% of the target number of performance shares).
- (2)
- The fair value of the awards was determined based upon the closing price of our common stock on the applicable measurement dates (i.e., the deemed grant dates for accounting purposes) reduced by the present value of expected dividends using the risk-free interest-rate as the award holders are not entitled to dividends or dividend equivalents during the vesting period.
Non-Employee Director Stock Grants. Each of our non-employee directors receives an annual equity grant as part of his or her non-employee director compensation. These shares fully vest when issued. In the aggregate, 21,264 shares, 24,135 shares and 18,000 shares of common stock were issued to non-employee directors in fiscal 2010, fiscal 2009 and fiscal 2008, respectively. For each of fiscal 2010, fiscal 2009 and fiscal 2008, compensation expense of $0.2 million relating to the grants is reflected in general and administrative expenses in our consolidated statements of operations.
(14) Subsequent Events
Termination of Interest Rate Swap Agreement. In February 2007, we entered into a six-year interest rate swap agreement in order to effectively fix at 7.0925% the interest rate payable for our $130.0 million of term loan borrowings under the credit agreement through the life of the term loan borrowings, which mature in February 2013. On January 18, 2011, we terminated the interest rate swap agreement by making a payment of $12.4 million to the counterparty, representing the approximate present value of the expected remaining settlement payments that otherwise were to have been due to the counterparty through maturity of the term loan. In connection with the termination, we and the counterparty released each other from all obligations under the interest rate swap agreement, including, without limitation, the obligation to make periodic payments thereunder. We did not pay any termination penalty in connection with the termination of the interest rate swap agreement. As a result of the termination, our interest obligations for the term loan borrowings through maturity in 2013 will now be based upon the loan's floating rate as described in Note 6.
We expect to reclassify $3.7 million of accumulated other comprehensive loss to net interest expense through maturity of the term loan borrowings in 2013, with $1.7 million being reclassified in 2011.
Stock and Debt Repurchase Program. On February 22, 2011, our board of directors authorized a stock and debt repurchase program for the repurchase of up to $25.0 million of our common stock and/or 7.625% senior notes through March 31, 2012. Under the authorization, our company may purchase shares of common stock and/or senior notes from time to time in the open market or in
79
B&G FOODS, INC. AND SUBSIDIARIES
Notes to Consolidated Financial Statements (Continued)
January 1, 2011, January 2, 2010 and January 3, 2009
(14) Subsequent Events (Continued)
privately negotiated transactions in compliance with the applicable rules and regulations of the Securities and Exchange Commission.
The timing and amount of stock and/or debt repurchases under the program, if any, will be at the discretion of management, and will depend on available cash, market conditions and other considerations. Therefore, there can be no assurance as to the number of shares, if any, that will be repurchased under the repurchase program, or the aggregate dollar amount of the shares or principal amount of senior notes, if any, repurchased. We may discontinue the program at any time. Any shares or senior notes repurchased pursuant to the repurchase program will be cancelled.
(15) Quarterly Financial Data (unaudited)
| |
First Quarter |
Second Quarter |
Third Quarter |
Fourth Quarter |
||||||||||
|---|---|---|---|---|---|---|---|---|---|---|---|---|---|---|
| |
(in thousands, expect per share data) |
|||||||||||||
Net sales |
||||||||||||||
2010 |
$ | 125,182 | $ | 121,145 | $ | 125,144 | $ | 141,866 | ||||||
2009 |
$ | 118,638 | $ | 122,899 | $ | 123,871 | $ | 135,608 | ||||||
Gross profit |
||||||||||||||
2010 |
$ | 42,028 | $ | 39,398 | $ | 39,184 | $ | 47,059 | ||||||
2009 |
$ | 38,749 | $ | 36,866 | $ | 36,224 | $ | 36,894 | ||||||
Net income |
||||||||||||||
2010 |
$ | 326 | $ | 8,493 | $ | 9,282 | $ | 14,278 | ||||||
2009 |
$ | 5,913 | $ | 6,029 | $ | 4,161 | $ | 1,338 | ||||||
Earnings per share |
||||||||||||||
2010—Basic |
$ | 0.01 | $ | 0.18 | $ | 0.19 | $ | 0.30 | ||||||
2010—Diluted |
$ | 0.01 | $ | 0.18 | $ | 0.19 | $ | 0.29 | ||||||
2009—Basic and Diluted |
$ | 0.16 | $ | 0.17 | $ | 0.11 | $ | 0.03 | ||||||
Cash dividends declared per share |
||||||||||||||
2010 |
$ | 0.17 | $ | 0.17 | $ | 0.17 | $ | 0.17 | ||||||
2009 |
$ | 0.17 | $ | 0.17 | $ | 0.17 | $ | 0.17 | ||||||
Earnings per share were computed individually for each of the quarters presented using the weighted average number of shares outstanding during each quarterly period, while earnings per share for the full year were computed using the weighted average number of shares outstanding during the full year; therefore, the sum of the earnings per share and distributed earnings amounts for the quarters may not equal the total for the full year. During fiscal 2010 and fiscal 2009, our board of directors declared quarterly cash dividends on our common stock of $0.17 per share.
80
B&G FOODS, INC. AND SUBSIDIARIES
Schedule of Valuation and Qualifying Accounts
(In thousands)
| Column A | Column B | Column C | Column D | Column E | ||||||||||||
|---|---|---|---|---|---|---|---|---|---|---|---|---|---|---|---|---|
| |
|
Additions | |
|
||||||||||||
Description
|
Balance at beginning of period |
Charged to costs and expenses |
Charged to other accounts— describe |
Deductions— describe |
Balance at end of period |
|||||||||||
Year ended January 3, 2009: |
||||||||||||||||
Allowance for doubtful accounts and discounts |
$ | 745 | $ | 7 | — | $ | 7 | (a) | $ | 745 | ||||||
Inventory reserve |
$ | 440 | $ | 75 | — | — | $ | 515 | ||||||||
Year ended January 2, 2010: |
||||||||||||||||
Allowance for doubtful accounts and discounts |
$ | 745 | $ | (59 | ) | — | $ | 55 | (a) | $ | 631 | |||||
Inventory reserve |
$ | 515 | $ | — | — | $ | 65 | (b) | $ | 450 | ||||||
Year ended January 1, 2011: |
||||||||||||||||
Allowance for doubtful accounts and discounts |
$ | 631 | $ | 127 | — | $ | (7 | )(a) | $ | 765 | ||||||
Inventory reserve |
$ | 450 | $ | — | — | $ | 25 | (b) | $ | 425 | ||||||
- (a)
- Represents
bad-debt write-offs (recoveries).
- (b)
- Represents inventory write-offs.
81
Item 9. Changes in and Disagreement With Accountants on Accounting and Financial Disclosure.
None.
Item 9A. Controls and Procedures.
Evaluation of Disclosure Controls and Procedures.
As required by Rule 13a-15(b) under the Securities Exchange Act of 1934, as amended, our management, including our chief executive officer and our chief financial officer, conducted an evaluation of the effectiveness of the design and operation of our disclosure controls and procedures as of the end of the period covered by this report. As defined in Rules 13a-15(e) and 15d-15(e) under the Exchange Act, disclosure controls and procedures are controls and other procedures that we use that are designed to ensure that information required to be disclosed by us in the reports we file or submit under the Exchange Act is recorded, processed, summarized and reported, within the time periods specified in the SEC's rules and forms. Disclosure controls and procedures include, without limitation, controls and procedures designed to ensure that information required to be disclosed by us in the reports we file or submit under the Exchange Act is accumulated and communicated to our management, including our chief executive officer and our chief financial officer, as appropriate, to allow timely decisions regarding required disclosure.
Based on that evaluation, our chief executive officer and our chief financial officer concluded that our disclosure controls and procedures were effective as of the end of the period covered by this report.
Management's Report on Internal Control Over Financial Reporting.
Our management is responsible for establishing and maintaining adequate internal control over financial reporting, as such term is defined in Rules 13a-15(f) and 15d-15(f) under the Exchange Act. Our management, including our chief executive officer and chief financial officer, conducted an evaluation of our internal control over financial reporting based on the framework in Internal Control—Integrated Framework issued by the Committee of Sponsoring Organizations of the Treadway Commission.
Based on our evaluation under the framework of Internal Control—Integrated Framework, our management concluded that our internal control over financial reporting was effective at January 1, 2011. The effectiveness of our internal control over financial reporting as of January 1, 2011 was audited by KPMG LLP, an independent registered public accounting firm, as stated in their report which is included in Part II, Item 8, "Financial Statements and Supplementary Data" of this report.
Our internal control system is designed to provide reasonable assurance to our management and board of directors regarding the preparation and fair presentation of published consolidated financial statements in accordance with generally accepted accounting principles. All internal control systems, no matter how well designed, have inherent limitations. Therefore, even those systems determined to be effective can provide only reasonable assurance with respect to financial statement preparation and presentation and may not prevent or detect misstatements. Also, projections of any evaluation of effectiveness to future periods are subject to the risk that controls may become inadequate because of changes in conditions, or that the degree of compliance with the policies or procedures may deteriorate.
Changes in Internal Control Over Financial Reporting.
As required by Rule 13a-15(d) under the Exchange Act, our management, including our chief executive officer and our chief financial officer, also conducted an evaluation of our internal control over financial reporting to determine whether any change occurred during the last quarter of fiscal
82
2010 that has materially affected, or is reasonably likely to materially affect, our internal control over financial reporting. Based on that evaluation, our chief executive officer and our chief financial officer concluded that there has been no change during the last quarter of fiscal 2010 that has materially affected, or is reasonably likely to materially affect, our internal control over financial reporting.
Inherent Limitations on Effectiveness of Controls.
Our company's management, including the chief executive officer and chief financial officer, does not expect that our disclosure controls or our internal control over financial reporting will prevent or detect all errors and all fraud. A control system, no matter how well designed and operated, can provide only reasonable, not absolute, assurance that the control system's objectives will be met. The design of a control system must reflect the fact that there are resource constraints, and the benefits of controls must be considered relative to their costs. Further, because of the inherent limitations in all control systems, no evaluation of controls can provide absolute assurance that misstatements due to error or fraud will not occur or that all control issues and instances of fraud, if any, within our company have been detected. These inherent limitations include the realities that judgments in decision-making can be faulty and that breakdowns can occur because of simple error or mistake. Controls can also be circumvented by the individual acts of some persons, by collusion of two or more people, or by management override of the controls. The design of any system of controls is based in part on certain assumptions about the likelihood of future events, and there can be no assurance that any design will succeed in achieving its stated goals under all potential future conditions. Projections of any evaluation of controls effectiveness to future periods are subject to risks. Over time, controls may become inadequate because of changes in conditions or deterioration in the degree of compliance with policies or procedures.
None.
83
Item 10. Directors, Executive Officers and Corporate Governance.
With the exception of the information relating to our Code of Business Conduct and Ethics that is presented in Part I, Item 1 of this report under the heading "Available Information," the information required by this Item will appear in the sections entitled "Corporate Governance," "Proposal 1—Election of Directors," "Our Management," "Section 16(a) Beneficial Ownership Reporting Compliance," "Compensation Committee Interlocks and Insider Participation" and "Report of the Compensation Committee" included in our definitive proxy statement to be filed on or before May 2, 2011, relating to the 2011 annual meeting of stockholders, which information is incorporated herein by reference.
Item 11. Executive Compensation.
The information required by this item will appear in the section entitled "Executive Compensation" and "Compensation Discussion and Analysis" included in our definitive proxy statement to be filed on or before May 2, 2011, relating to the 2011 annual meeting of stockholders, which information is incorporated herein by reference.
Item 12. Security Ownership of Certain Beneficial Owners and Management and Related Stockholder Matters.
Securities Authorized for Issuance Under Equity Compensation Plans. The following table summarizes information, as of January 1, 2011, relating to the 2008 Omnibus Incentive Compensation Plan, which was approved by the company's stockholders and under which restricted stock, options, stock appreciation rights, deferred stock, stock units and cash-based awards to employees, non-employee directors and consultants may be granted from time to time.
Equity Compensation Plan Information
Plan Category
|
Number of securities to be issued upon exercise of outstanding options, warrants and rights (a) |
Weighted-average exercise price of outstanding options, warrants and rights (b) |
Number of securities remaining available for future issuance under equity compensation plans (excluding securities reflected in column (a)) (c) |
||||||||
|---|---|---|---|---|---|---|---|---|---|---|---|
Equity compensation plans approved by security holders |
2,041,437 | (1) | (2) | 2,143,796 | (1)(3) | ||||||
Equity compensation plans not approved by security holders |
— | — | — | ||||||||
Total |
2,041,437 | (1) | — | 2,143,796 | (1)(3) | ||||||
- (1)
- For
the 2008 to 2010 performance share long-term incentive awards (LTIAs), 2009 to 2011 performance share LTIAs and 2010 to 2012 performance
share LTIAs, includes the maximum number of shares (i.e., 300% of the target number of shares) of common stock that may be issued under the 2008 Omnibus Incentive Compensation Plan in respect
of the LTIAs, subject to the achievement of specified performance goals. There is, however, no guarantee that all or any part of these performance based awards will actually be earned and that shares
of common stock will be issued upon completion of the performance cycles. 403,428 shares of common stock (less any shares withheld for minimum statutory tax withholding) will be issued in March 2011
in respect of the 2008 to 2010 LTIAs.
- (2)
- Not
applicable.
- (3)
- As of the end of fiscal 2010, of the 4,500,000 shares authorized for issuance under the 2008 Omnibus Plan, 4,185,233 remained available for issuance. This number exceeds the number set forth in column (c) because the actual number of
84
shares to be issued is likely to be substantially lower than the number of shares listed in column (a) because plan participants are likely to have shares withheld by our company to satisfy tax withholding requirements. In addition, as noted in footnote (1) above, the chart assumes maximum awards (i.e., 300% of the target number of shares) will be earned for the performance share LTIAs. There is no certainty, however, that awards will in fact be achieved at the maximum level or at all. Shares not issued due to withholding and shares not issued due to failure to satisfy performance goals do not count against the maximum number of remaining authorized shares under the plan.
The remaining information required by this item will appear in the section entitled "Security Ownership of Certain Beneficial Owners and Management" included in our definitive proxy statement to be filed on or before May 2, 2011, relating to the 2011 annual meeting of stockholders, which information is incorporated herein by reference.
Item 13. Certain Relationships and Related Transactions, and Director Independence.
The information required by this item will appear in the section entitled "Certain Relationships and Related Transactions" and "Corporate Governance" included in our definitive proxy statement to be filed on or before May 2, 2011, relating to the 2011 annual meeting of stockholders, which information is incorporated herein by reference.
Item 14. Principal Accountant Fees and Services.
The information required by this item will appear in the section entitled "Independent Registered Public Accounting Firm Fees" included in our definitive proxy statement to be filed on or before May 2, 2011, relating to the 2011 annual meeting of stockholders, which information is incorporated herein by reference.
85
Item 15. Exhibits, Financial Statement Schedules.
(a) The following documents are filed as part of this report.
(1) |
Consolidated Financial Statements: The following consolidated financial statements are included in Part II, Item 8 of this report. | |||
|
Page |
|||
Reports of Independent Registered Public Accounting Firm. |
48 |
|||
Consolidated Balance Sheets as of January 1, 2011 and January 2, 2010. |
50 |
|||
Consolidated Statements of Operations for the years ended January 1, 2011, January 2, 2010 and January 3, 2009. |
51 |
|||
Consolidated Statements of Changes in Stockholders' Equity and Comprehensive Income for the years ended January 1, 2011, January 2, 2010 and January 3, 2009. |
52 |
|||
Consolidated Statements of Cash Flows for the years ended January 1, 2011, January 2, 2010 and January 3, 2009. |
53 |
|||
Notes to Consolidated Financial Statements. |
54 |
|||
(2) |
Financial Statement Schedule. The following financial statement schedule is included in Part II, Item 8 of this report. |
|||
Schedule II—Schedule of Valuation and Qualifying Accounts. |
81 |
|||
(3) |
Exhibits. |
|||
| EXHIBIT NO. | DESCRIPTION | ||
|---|---|---|---|
| 3.1 | Second Amended and Restated Certificate of Incorporation of B&G Foods, Inc. (Filed as Exhibit 3.1 to B&G Foods' Current Report on Form 8-K filed on August 13, 2010, and incorporated by reference herein) | ||
3.2 |
Amended and Restated Bylaws of B&G Foods, Inc. (Filed as Exhibit 3.1 to B&G Foods' Current Report on Form 8-K filed on May 25, 2007, and incorporated by reference herein) |
||
4.1 |
Indenture, dated as of January 25, 2010, between B&G Foods, Inc. and The Bank of New York Mellon, as trustee (Filed as Exhibit 4.1 to B&G Foods' Current Report on Form 8-K filed on January 25, 2010, and incorporated by reference herein) |
||
4.2 |
First Supplemental Indenture, dated as of January 25, 2010, between B&G Foods, Inc., BGH Holdings, Inc., Bloch & Guggenheimer, Inc. Burnham & Morrill Company, William Underwood Company, and The Bank of New York Mellon, as trustee, relating to the 7.625% senior notes due 2018 (Filed as Exhibit 4.2 to B&G Foods' Current Report on Form 8-K filed on January 25, 2010, and incorporated by reference herein) |
||
4.3 |
Form of 7.625% Senior Note due 2018 (included in Exhibit 4.2) |
||
4.4 |
Form of stock certificate for common stock. (Filed as Exhibit 4.1 to B&G Foods' Current Report on Form 8-K filed on August 13, 2010, and incorporated by reference herein) |
||
86
| EXHIBIT NO. | DESCRIPTION | ||
|---|---|---|---|
| 10.1 | Amended and Restated Credit Agreement, dated as of February 23, 2007, between B&G Foods, Inc., as Borrower, the Several Lenders from time to time parties thereto, Lehman Brothers Inc. and Credit Suisse Securities (USA) LLC, as Joint Lead Arrangers and Joint Bookrunners, Credit Suisse Securities (USA) LLC, as Syndication Agent and Lehman Commercial Paper Inc., as Administrative Agent (Filed as Exhibit 10.1 to B&G Foods' Current Report on Form 8-K filed on February 28, 2007, and incorporated by reference herein) | ||
10.2 |
First Amendment to Amended and Restated Credit Agreement and Resignation and Appointment Agreement, dated as of August 5, 2009, among B&G Foods, Inc., each Lender party thereto, certain subsidiaries of B&G Foods, Inc., Lehman Commercial Paper, Inc., as the Existing Agent, Swing Line Lender and as a Revolving Credit Lender, and Credit Suisse, Cayman Islands Branch, as the Successor Agent and successor Swing Line Lender (Filed as Exhibit 10.1 to B&G Foods' Current Report on Form 8-K filed on August 10, 2009, and incorporated by reference herein) |
||
10.3 |
Guarantee and Collateral Agreement, dated as of October 14, 2004, by B&G Foods, Inc. and certain of its subsidiaries in favor of Lehman Commercial Paper, Inc., as Administrative Agent. (Filed as Exhibit 10.2 to B&G Foods' Current Report on Form 8-K filed on October 20, 2004, and incorporated by reference herein) |
||
10.4 |
First Amendment, dated as of January 10, 2006, to Guarantee and Collateral Agreement, by B&G Foods, Inc. and certain of its subsidiaries in favor of Lehman Commercial Paper, Inc., as Administrative Agent (Filed as Exhibit 10.6 to B&G Foods' Annual Report on Form 10-K filed March 7, 2006, and incorporated by reference herein) |
||
10.5 |
Agreement by and between MSLO Emeril Acquisition Sub LLC (successor by assignment to Emeril's Food of Love Productions, L.L.C.) and B&G Foods, Inc. dated June 9, 2000 (Filed with as Exhibit 10.13 to Amendment No. 2 to Registration Statement on Form S-1 (file no. 333-112680) filed on May 3, 2004, and incorporated herein by reference) |
||
10.6 |
Amended and Restated Employment Agreement by and between David L. Wenner and B&G Foods, Inc., dated as of December 31, 2008 (Filed as Exhibit 10.1 to B&G Foods' Current Report on Form 8-K filed on January 6, 2009, and incorporated by reference herein) |
||
10.7 |
Amended and Restated Employment Agreement by and between Robert C. Cantwell and B&G Foods, Inc., dated as of December 31, 2008 (Filed as Exhibit 10.2 to B&G Foods' Current Report on Form 8-K filed on January 6, 2009, and incorporated by reference herein) |
||
10.8 |
Amended and Restated Employment Agreement by and between Vanessa E. Maskal and B&G Foods, Inc., dated as of December 31, 2008 (Filed as Exhibit 10.3 to B&G Foods' Current Report on Form 8-K filed on January 6, 2009, and incorporated by reference herein) |
||
10.9 |
Amended and Restated Employment Agreement by and between James H. Brown and B&G Foods, Inc., dated as of December 31, 2008 (Filed as Exhibit 10.4 to B&G Foods' Current Report on Form 8-K filed on January 6, 2009, and incorporated by reference herein) |
||
87
| EXHIBIT NO. | DESCRIPTION | ||
|---|---|---|---|
| 10.10 | Amended and Restated Employment Agreement by and between Scott E. Lerner and B&G Foods, Inc., dated as of December 31, 2008 (Filed as Exhibit 10.5 to B&G Foods' Current Report on Form 8-K filed on January 6, 2009, and incorporated by reference herein) | ||
10.11 |
Employment Agreement, dated as of August 6, 2009, between William F. Herbes and B&G Foods, Inc. (Filed as Exhibit 10.2 to B&G Foods' Current Report on Form 8-K filed on August 10, 2009, and incorporated by reference herein) |
||
10.12 |
Employment Agreement, dated as of March 5, 2010, between William H. Wright and B&G Foods, Inc. |
||
12.1 |
Computation of Ratio of Earnings to Fixed Charges. |
||
21.1 |
Subsidiaries of B&G Foods, Inc. |
||
23.1 |
Consent of KPMG LLP. |
||
31.1 |
Certification pursuant to Rule 13a-14(a) or Rule 15d-14(a) of the Securities Exchange Act of 1934 of the Chief Executive Officer. |
||
31.2 |
Certification pursuant to Rule 13a-14(a) or Rule 15d-14(a) of the Securities Exchange Act of 1934 of the Chief Financial Officer. |
||
32.1 |
Certification pursuant to 18 U.S.C. Section 1350, as adopted pursuant to Section 906 of the Sarbanes-Oxley Act of 2002, of the Chief Executive Officer and Chief Financial Officer. |
||
88
Pursuant to the requirements of the Securities Exchange Act of 1934, the registrant has duly caused this report to be signed on its behalf by the undersigned thereunto duly authorized.
| Dated: March 1, 2011 | B&G FOODS, INC. | |||
By: |
/s/ ROBERT C. CANTWELL Robert C. Cantwell Executive Vice President of Finance and Chief Financial Officer |
|||
Pursuant to the requirements of the Securities Exchange Act of 1934, this report has been signed below by the following persons on behalf of the registrant and in the capacities and on the dates indicated.
NAME
|
TITLE
|
DATE
|
||
|---|---|---|---|---|
| /s/ STEPHEN C. SHERRILL Stephen C. Sherrill |
Chairman of the Board of Directors | March 1, 2011 | ||
/s/ DAVID L. WENNER David L. Wenner |
President, Chief Executive Officer and Director (Principal Executive Officer) |
March 1, 2011 |
||
/s/ ROBERT C. CANTWELL Robert C. Cantwell |
Executive Vice President of Finance, Chief Financial Officer and Director (Principal Financial and Accounting Officer) |
March 1, 2011 |
||
/s/ CYNTHIA T. JAMISON Cynthia T. Jamison |
Director |
March 1, 2011 |
||
/s/ CHARLES F. MARCY Charles F. Marcy |
Director |
March 1, 2011 |
||
/s/ DENNIS M. MULLEN Dennis M. Mullen |
Director |
March 1, 2011 |
||
/s/ CHERYL M. PALMER Cheryl M. Palmer |
Director |
March 1, 2011 |
||
/s/ ALFRED POE Alfred Poe |
Director |
March 1, 2011 |
89