Attached files
| file | filename |
|---|---|
| 8-K - SIGNET JEWELERS LIMITED 8-K - SIGNET JEWELERS LTD | a51673315.htm |
| EX-99.1 - EXHIBIT 99.1 - SIGNET JEWELERS LTD | a51673315ex99_1.htm |
Exhibit 99.2

Second Quarter Fiscal 2018 ResultsThursday, August 24, 2017

Forward Looking Statements & Other Disclosure Matters Forward-Looking Statements – This presentation contains statements which are forward-looking statements within the meaning of the Private Securities Litigation Reform Act of 1995. These statements, based upon management's beliefs and expectations as well as on assumptions made by and data currently available to management, include statements regarding, among other things, Signet's results of operation, financial condition, liquidity, prospects, growth, strategies and the industry in which Signet operates. The use of the words "expects," "intends," "anticipates," "estimates," "predicts," "believes," "should," "potential," "may," "forecast," "objective," "plan," or "target," and other similar expressions are intended to identify forward-looking statements. These forward-looking statements are not guarantees of future performance and are subject to a number of risks and uncertainties, including but not limited to Signet’s expectations about the benefits and costs of the R2Net transaction, including future financial and operating results, Signet’s expectations, including timing, regarding the anticipated closings of the various credit portfolio transactions, the anticipated terms and availability of financing and the timing of closing, statements about the benefits of the credit portfolio sales including future financial and operating results, Signet’s or the other parties’ ability to satisfy the requirements for consummation of the agreements relating to the credit portfolio transactions, including due to regulatory or legal impediments, the outcome of Signet’s conversion of its accounting methodology, the effect of regulatory conditions on the credit purchase agreements and credit program agreements, general economic conditions, regulatory changes following the United Kingdom’s announcement to exit from the European Union, a decline in consumer spending, the merchandising, pricing and inventory policies followed by Signet, the reputation of Signet and its brands, the level of competition in the jewelry sector, the cost and availability of diamonds, gold and other precious metals, regulations relating to customer credit, seasonality of Signet’s business, financial market risks, deterioration in customers’ financial condition, exchange rate fluctuations, changes in Signet’s credit rating, changes in consumer attitudes regarding jewelry, management of social, ethical and environmental risks, security breaches and other disruptions to Signet’s information technology infrastructure and databases, inadequacy in and disruptions to internal controls and systems, changes in assumptions used in making accounting estimates relating to items such as extended service plans and pensions, risks related to Signet being a Bermuda corporation, the impact of the acquisition of Zale Corporation on relationships, including with employees, suppliers, customers and competitors, and our ability to successfully integrate Zale Corporation’s operations and to realize synergies from the transactionFor a discussion of these and other risks and uncertainties which could cause actual results to differ materially from those expressed in any forward-looking statement, see the “Risk Factors” section of Signet's Fiscal 2017 Annual Report on Form 10-K filed with the SEC on March 16, 2017 and quarterly reports on Form 10-Q. Signet undertakes no obligation to update or revise any forward-looking statements to reflect subsequent events or circumstances, except as required by law.
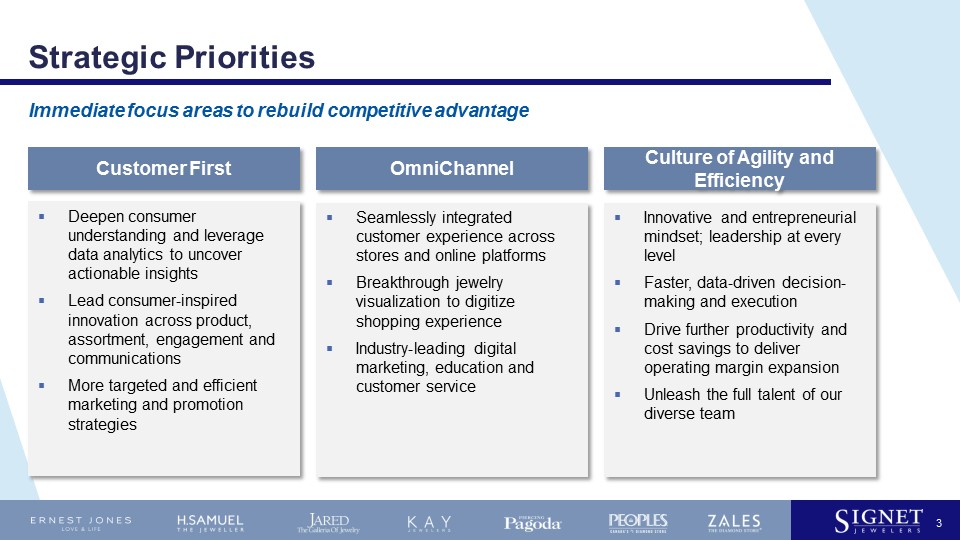
Strategic Priorities 3 Deepen consumer understanding and leverage data analytics to uncover actionable insights Lead consumer-inspired innovation across product, assortment, engagement and communicationsMore targeted and efficient marketing and promotion strategies Customer First Seamlessly integrated customer experience across stores and online platforms Breakthrough jewelry visualization to digitize shopping experienceIndustry-leading digital marketing, education and customer service OmniChannel Innovative and entrepreneurial mindset; leadership at every levelFaster, data-driven decision-making and executionDrive further productivity and cost savings to deliver operating margin expansionUnleash the full talent of our diverse team Culture of Agility and Efficiency Immediate focus areas to rebuild competitive advantage

Strategic Acquisition of R2Net, owner of JamesAllen.com JamesAllen.com is a leading, fast-growing online retailer of diamond jewelry with millennial appeal and superior average transaction value (“ATV”)Grew revenues more than 2.5x in two years Annual projected sales in excess of $200M in Fiscal 2018 Clear path to profitability – accretive to earnings in Fiscal 2019Significant OmniChannel growth opportunities through implementation of R2Net’s innovation capabilities and digital technology across Signet’s stores and online to reinvent shopping experienceOded Edelman to remain President of JamesAllen.com and become Chief Digital Innovation Advisor of SignetCurrently expected to close in Q3 subject to customary closing conditions and regulatory approvals 4 Transaction accelerates Signet’s OmniChannel strategy and creates significant growth opportunities

Second Quarter Fiscal 2018 Summary Same store sales increased 1.4%. Key drivers included:Fashion jewelry – On-trend wins around stacking, layering; EverUs, Le VianBranded bridal jewelry – Neil Lane, Vera Wang, Leo and ChosenKay Jewelers, Peoples, Piercing PagodaeCommerce – Robust online performanceMarketing and promotions – More targeted and simpler messaging delivering sales gainsTiming shift of Mother’s Day was favorable to SSS by 380 bpsEPS of $1.33 up from $1.06 same period last year:Controlled operating expense to deliver profitability in a heavily promotional environmentTiming shift of Mother’s Day was favorable to EPS by approximately $0.15Operating margin expansion of 100 bps – including 70 bps of which was attributable to the combined impact of the net credit transaction as well as CEO-and-other expenses 5
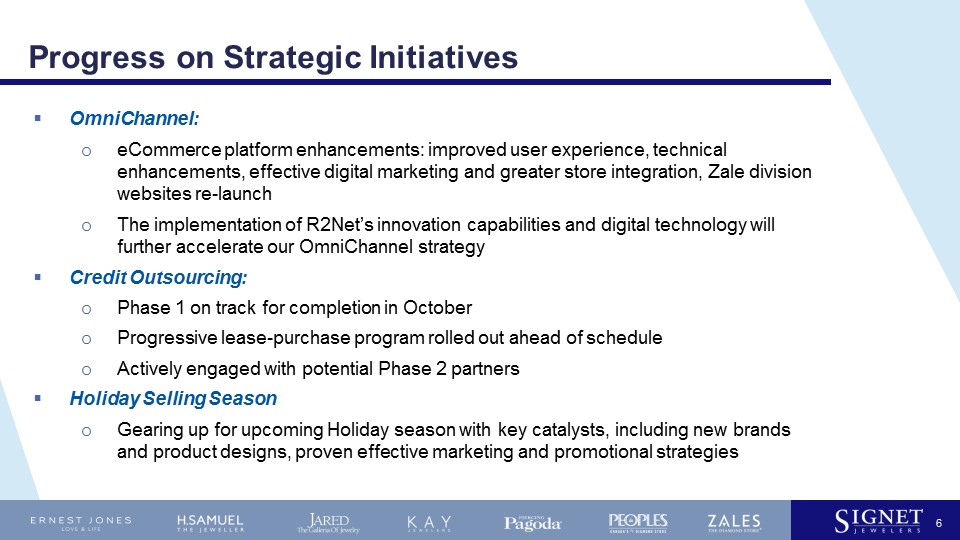
Progress on Strategic Initiatives OmniChannel:eCommerce platform enhancements: improved user experience, technical enhancements, effective digital marketing and greater store integration, Zale division websites re-launchThe implementation of R2Net’s innovation capabilities and digital technology will further accelerate our OmniChannel strategyCredit Outsourcing:Phase 1 on track for completion in OctoberProgressive lease-purchase program rolled out ahead of scheduleActively engaged with potential Phase 2 partnersHoliday Selling Season Gearing up for upcoming Holiday season with key catalysts, including new brands and product designs, proven effective marketing and promotional strategies 6
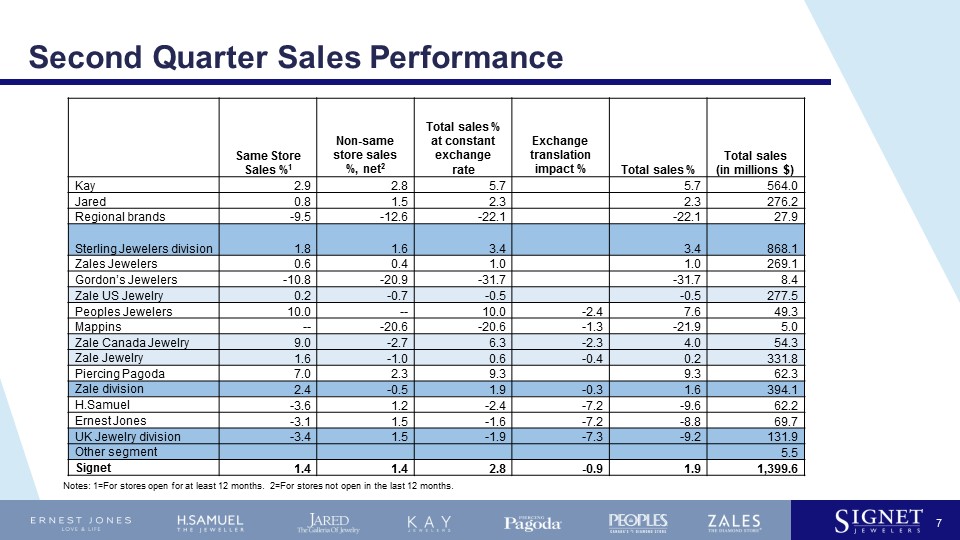
Second Quarter Sales Performance 7 Notes: 1=For stores open for at least 12 months. 2=For stores not open in the last 12 months. Same Store Sales %1 Non-same store sales %, net2 Total sales % at constant exchange rate Exchange translation impact % Total sales % Total sales(in millions $) Kay 2.9 2.8 5.7 5.7 564.0 Jared 0.8 1.5 2.3 2.3 276.2 Regional brands -9.5 -12.6 -22.1 -22.1 27.9 Sterling Jewelers division 1.8 1.6 3.4 3.4 868.1 Zales Jewelers 0.6 0.4 1.0 1.0 269.1 Gordon’s Jewelers -10.8 -20.9 -31.7 -31.7 8.4 Zale US Jewelry 0.2 -0.7 -0.5 -0.5 277.5 Peoples Jewelers 10.0 -- 10.0 -2.4 7.6 49.3 Mappins -- -20.6 -20.6 -1.3 -21.9 5.0 Zale Canada Jewelry 9.0 -2.7 6.3 -2.3 4.0 54.3 Zale Jewelry 1.6 -1.0 0.6 -0.4 0.2 331.8 Piercing Pagoda 7.0 2.3 9.3 9.3 62.3 Zale division 2.4 -0.5 1.9 -0.3 1.6 394.1 H.Samuel -3.6 1.2 -2.4 -7.2 -9.6 62.2 Ernest Jones -3.1 1.5 -1.6 -7.2 -8.8 69.7 UK Jewelry division -3.4 1.5 -1.9 -7.3 -9.2 131.9 Other segment 5.5 Signet 1.4 1.4 2.8 -0.9 1.9 1,399.6
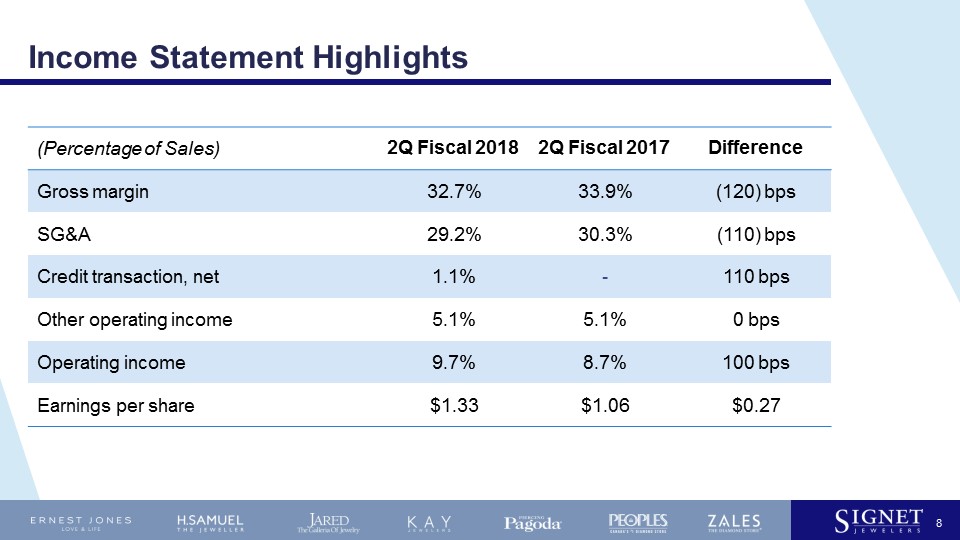
Income Statement Highlights (Percentage of Sales) 2Q Fiscal 2018 2Q Fiscal 2017 Difference Gross margin 32.7% 33.9% (120) bps SG&A 29.2% 30.3% (110) bps Credit transaction, net 1.1% - 110 bps Other operating income 5.1% 5.1% 0 bps Operating income 9.7% 8.7% 100 bps Earnings per share $1.33 $1.06 $0.27 8

Working Capital and Free Cash Flow Inventory $2.3 billion, down 5.6%, while Q2 total sales increased 1.9%Prudent inventory management, particularly Zales brandsUnderperforming collections reduced across organizationFree cash flow YTD $304M, up $96M 9 Note: Free cash flow is a non-GAAP measure defined as the net cash provided by operating activities less purchases of property, plant and equipment.
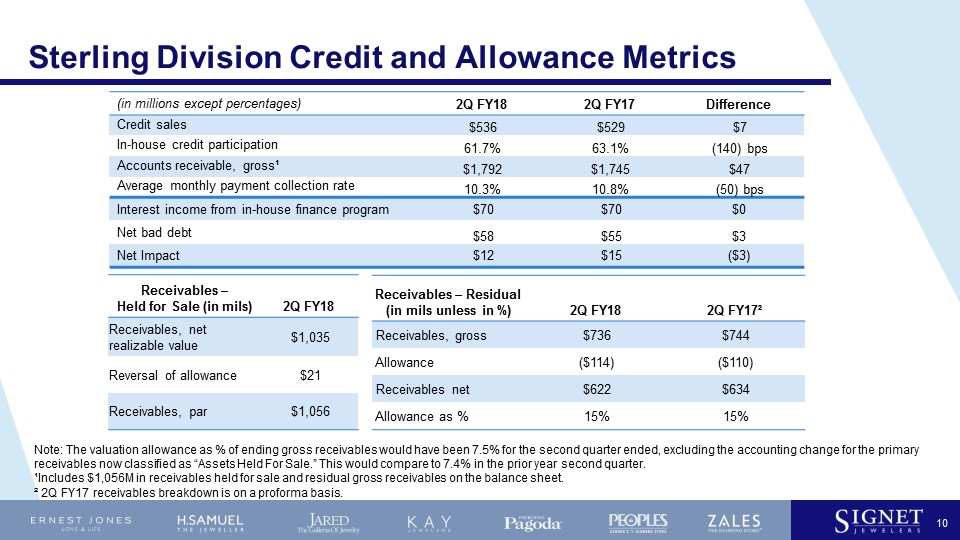
Sterling Division Credit and Allowance Metrics (in millions except percentages) 2Q FY18 2Q FY17 Difference Credit sales $536 $529 $7 In-house credit participation 61.7% 63.1% (140) bps Accounts receivable, gross¹ $1,792 $1,745 $47 Average monthly payment collection rate 10.3% 10.8% (50) bps Interest income from in-house finance program $70 $70 $0 Net bad debt $58 $55 $3 Net Impact $12 $15 ($3) Receivables – Residual (in mils unless in %) 2Q FY18 2Q FY17² Receivables, gross $736 $744 Allowance ($114) ($110) Receivables net $622 $634 Allowance as % 15% 15% 10 Note: The valuation allowance as % of ending gross receivables would have been 7.5% for the second quarter ended, excluding the accounting change for the primary receivables now classified as “Assets Held For Sale.” This would compare to 7.4% in the prior year second quarter.¹Includes $1,056M in receivables held for sale and residual gross receivables on the balance sheet. ² 2Q FY17 receivables breakdown is on a proforma basis. Receivables –Held for Sale (in mils) 2Q FY18 Receivables, net realizable value $1,035 Reversal of allowance $21 Receivables, par $1,056

Sterling Division Credit Portfolio: Phase I Outsourcing Impact 11 $20.7M pre-tax non-cash gain in Q2 associated with classification of prime receivables as “Assets Held For Sale”$5.9M in transaction costs in Q2; ~$35M expected for full year~$1B of proceeds to Signet at transaction close:$600M to repay ABS facility$400M to repay short-term loan associated with R2Net acquisition$10M beneficial interest gain on profit sharing upon close $22M decline in EBIT due to:$28M net unfavorable due to loss of prime portfolio net contribution$6M partial offset from net SG&A savingsEPS accretion expected as Q2 share repurchases more than offset reduction in EBIT$4M in interest expense savingsAllowance metrics to move unfavorably due to fewer prime receivables One-time Items Q4 Considerations Key Assumptions Transaction closes in October to minimize disruption during the Holiday seasonNo material impact on revenue Signet will continue to fund the sales associated with the non-prime receivables until Phase II is completed

Financial Guidance 12 Reiterated SSS guidance; Updated EPS guidance to reflect the benefits from strategic outsourcing of credit portfolio, partially offset by CEO separation costs and R2Net acquisition costs 1 Net impact of outsourcing the credit portfolio includes: elimination of bad debt expense and late fee income from prime A/R; elimination of selling, general and administrative expenses ("SGA") related to in-house credit department; economic profit sharing on prime A/R; servicing fees associated with Genesis Financial who will service the remaining book; elimination of finance charge income from the prime A/R; and elimination of interest expense associated with the $600 million asset-backed securitization that will be repaid with proceeds from sale of the prime A/R.2 Net impact includes: gain recognized on the reversal of the allowance for bad debt related to the prime A/R reclassified as assets held for sale; beneficial interest that will be recognized upon sale of prime A/R; and credit transaction costs related to legal, advisory, implementation and retention expense. 3 R2Net transaction costs include legal, advisory, and financing expenses.4 In the second quarter, $400 million of share repurchases associated with the expected credit transaction proceeds to be received in October were accelerated. Initial Guidance, March 9 Est. change (per share unless indicated) Guidance, August 24 SSS Down low-mid single-digit % - Down low-mid single-digit % EPS $7.00 - $7.40 $7.00 - $7.40 Net impact from outsourcing credit portfolio1 ($0.16) Net transaction cost including gain on sale of prime A/R2 ($0.05) CEO separation costs ($0.03) R2Net transaction costs3 ($0.10) Share repurchase acceleration4 $0.50 EPS $7.16 - $7.56 Effective tax rate 24% - 25% - 24% Weighted average common shares 74 million - 75 million (5 mill.) 69 million - 70 million Capital expenditures in $ 260 million - 275 million - 260 million - 275 million Selling square footage growth -1% to 0% - -1% to 0%

Signet Jewelers Ltd.