Attached files
Table of Contents
UNITED STATES
SECURITIES AND EXCHANGE COMMISSION
Washington, D.C. 20549
FORM 10-K
| x | Annual report pursuant to Section 13 or 15(d) of the Securities Exchange Act of 1934 |
For the fiscal year ended January 30, 2010
Commission file number 1-32349
SIGNET JEWELERS LIMITED
(Exact name of Registrant as specified in its charter)
| Bermuda | Not Applicable | |
| (State or other jurisdiction of incorporation) | (I.R.S. Employer Identification Number) |
Clarendon House
2 Church Street
Hamilton HM11
Bermuda
(441) 296 5872
(Address and telephone number including area code of principal executive offices)
Securities registered pursuant to Section 12(b) of the Act:
| Title of Each Class |
Name of Each Exchange on which Registered | |
| Common Shares of $0.18 each | The New York Stock Exchange |
Securities registered pursuant to Section 12(g) of the Act: None
Indicate by check mark if the registrant is a well-known seasoned issuer, as defined in Rule 405 of the Securities Act. Yes x No ¨
Indicate by check mark if the registrant is not required to file reports pursuant to Section 13 or 15(d) of the Securities Exchange Act of 1934. Yes ¨ No x
Indicate by check mark whether the Registrant (1) has filed all reports required to be filed by Section 13 or 15(d) of the Securities Exchange Act of 1934 during the preceding 12 months (or for such shorter period that the registrant was required to file such reports), and (2) has been subject to such filing requirements for the past 90 days. Yes x No ¨
Indicate by check mark whether the Registrant has submitted electronically and posted on its corporate web site, if any, every Interactive Data File required to be submitted and posted pursuant to Rule 405 of Regulation S-T during the preceding 12 months (or for such shorter period that the registrant was required to submit and post such files). Yes ¨ No ¨
Indicate by check mark if disclosure of delinquent filers pursuant to Item 405 of Regulation S-K is not contained herein, and will not be contained to the best of Registrant’s knowledge in definitive proxy or information statements incorporated by reference in Part III of this Form 10-K or any amendment to this Form 10-K. x
Indicate by check mark whether the Registrant is a large accelerated filer, an accelerated filer, a non-accelerated filer or a smaller reporting company.
Large accelerated filer x Accelerated filer ¨ Non-accelerated filer ¨ Smaller reporting company ¨
Indicate by check mark whether the Registrant is a shell company (as defined in Rule 12b-2 of the Act). Yes ¨ No x
The aggregate market value of voting Common Shares held by non-affiliates of the Registrant (based upon the closing sales price quoted on the New York Stock Exchange) as of July 31, 2009 was $1,884,972,890.
Number of Common Shares outstanding on March 21, 2010: 85,511,574
DOCUMENTS INCORPORATED BY REFERENCE
The Registrant will incorporate by reference information required in response to Part III, Items 10-14, in its definitive proxy statement for its annual meeting of shareholders, to be filed with the Securities and Exchange Commission within 120 days of January 30, 2010.
Table of Contents
CHANGE OF REPORTING STATUS
Effective January 31, 2010, Signet ceased to be a foreign private issuer and became a foreign issuer subject to the rules and regulations under the U.S. Securities Exchange Act of 1934 (“Exchange Act”) applicable to domestic US issuers. Signet is filing this Annual Report on Form 10-K, whereas previously it filed on Form 20-F.
REFERENCES
Unless the context otherwise requires, references to “Signet,” refer to Signet Jewelers Limited (and before September 11, 2008, to Signet Group plc) and its consolidated subsidiaries. References to the “Company” are to Signet Jewelers Limited. References to “Predecessor Company” are to Signet Group plc prior to the reorganization that was effected on September 11, 2008, and financial and other results and statistics for fiscal 2008 and prior periods relate to Signet prior to such reorganization.
PRESENTATION OF FINANCIAL INFORMATION
All references to “dollars,” “US dollars,” “$,” “cents” and “c” are to the lawful currency of the United States of America. Signet prepares its financial statements in US dollars. All references to “pounds,” “pounds sterling,” “sterling,” “£,” “pence,” and “p” are to the lawful currency of the United Kingdom.
Percentages in tables have been rounded and accordingly may not add up to 100%. Certain financial data may have been rounded. As a result of such rounding, the totals of data presented in this document may vary slightly from the actual arithmetical totals of such data.
Throughout this Annual Report on Form 10-K, financial data has been prepared in accordance with accounting principles generally accepted in the United States (“GAAP”). However Signet gives certain additional non-GAAP measures in order to provide increased insight into the underlying or relative performance of the business. An explanation of each non-GAAP measure used can be found in Item 6.
Fiscal Year
Signet’s fiscal year ends on the Saturday nearest to January 31. As used herein, “fiscal 2012,” “fiscal 2011,” “fiscal 2010,” “fiscal 2009” and “fiscal 2008” refer to the 52 week periods ending January 28, 2012, January 29, 2011, January 30, 2010, January 31, 2009 and February 2, 2008 respectively. As used herein, “fiscal 2007” refers to the 53 week period ending February 3, 2007, “fiscal 2006” and “fiscal 2005” refer to the 52 week periods ended January 28, 2006 and January 29, 2005 respectively.
This Annual Report on Form 10-K contains statements which are forward-looking statements within the meaning of the Private Securities Litigation Reform Act of 1995. These statements, based upon management’s beliefs and expectations as well as on assumptions made by and information currently available to management, include statements regarding, among other things, the results of operation, financial condition, liquidity, prospects, growth, strategies and the industry in which Signet operates. The use of the words “expects,” “intends,” “anticipates,” “estimates,” “predicts,” “believes,” “should,” “potential,” “may,” “forecast,” “objective,” “plan” or “target,” and other similar expressions are intended to identify forward-looking statements. These forward-looking statements are not guarantees of future performance and are subject to a number of risks and uncertainties, including but not limited to general economic conditions, the merchandising, pricing and inventory policies followed by Signet, the reputation of Signet, the level of competition in the jewelry sector, the price and availability of diamonds, gold and other precious metals, seasonality of the business and financial market risk.
Important factors which may cause actual results to differ materially from those expressed in any forward looking statement include, but are not limited to, those described in Item 1A and elsewhere in this Form 10-K. Except as required by applicable law, rules or regulations, Signet undertakes no obligation to update publicly any forward-looking statements in this Annual Report on Form 10-K that may occur due to any change in management’s expectations or to reflect future events or circumstances.
1
Table of Contents
FISCAL 2010 ANNUAL REPORT ON FORM 10-K
TABLE OF CONTENTS
| PAGE | ||||
| 1 | ||||
| PART I | ||||
| ITEM 1. |
3 | |||
| ITEM 1A. |
31 | |||
| ITEM 1B. |
38 | |||
| ITEM 2. |
38 | |||
| ITEM 3. |
40 | |||
| ITEM 4. |
40 | |||
| PART II | ||||
| ITEM 5. |
41 | |||
| ITEM 6. |
47 | |||
| ITEM 7. |
MANAGEMENT’S DISCUSSION AND ANALYSIS OF FINANCIAL CONDITION AND RESULTS OF OPERATIONS |
55 | ||
| ITEM 7A. |
87 | |||
| ITEM 8. |
90 | |||
| ITEM 9. |
CHANGES IN AND DISAGREEMENTS WITH ACCOUNTANTS ON ACCOUNTING AND FINANCIAL DISCLOSURE |
131 | ||
| ITEM 9A. |
131 | |||
| ITEM 9B. |
132 | |||
| PART III | ||||
| ITEM 10. |
133 | |||
| ITEM 11. |
133 | |||
| ITEM 12. |
SECURITY OWNERSHIP OF CERTAIN BENEFICIAL OWNERS AND MANAGEMENT AND RELATED STOCKHOLDER MATTERS |
133 | ||
| ITEM 13. |
CERTAIN RELATIONSHIPS AND RELATED TRANSACTIONS, AND DIRECTOR INDEPENDENCE |
133 | ||
| ITEM 14. |
133 | |||
| PART IV | ||||
| ITEM 15. |
134 | |||
2
Table of Contents
PART I
| ITEM 1. | BUSINESS |
OVERVIEW
Signet is the world’s largest specialty retail jeweler by sales, with stores in the US, UK, Republic of Ireland and Channel Islands. Signet is incorporated in Bermuda and its address and telephone number are shown on the cover of this document. Its corporate website is www.signetjewelers.com, from where documents that the Company is obliged to file or furnish with the US Securities and Exchange Commission (“SEC”) may be viewed or downloaded free of charge.
Signet’s US division operated 1,361 stores in 50 states at January 30, 2010. Its stores trade nationally in malls and off-mall locations as Kay Jewelers (“Kay”), and regionally under a number of well-established mall-based brands. Destination superstores trade nationwide as Jared The Galleria Of Jewelry (“Jared”). The US market accounts for about 40% of worldwide diamond sales (source: IDEX Online). Based on publicly available data, management believes Signet’s US division was the largest specialty jeweler in the US in calendar 2009 with sales approximately 1.8 times those of the next biggest such retailer. See page 8 for a description of Signet’s US division.
The UK division’s stores trade as “H.Samuel,” “Ernest Jones,” and “Leslie Davis,” and are situated in prime ‘High Street’ locations (main shopping thoroughfares with high pedestrian traffic) or major shopping malls. The UK market accounts for less than 2% of worldwide diamond sales (source: IDEX Online/Office for National Statistics). The UK division operated 552 stores at January 30, 2010, including 14 stores in the Republic of Ireland and three in the Channel Islands. Based on publicly filed accounts, management believes Signet’s UK division was the largest specialty retailer of fine jewelry in the UK with sales in calendar 2008 approximately 1.7 times those of the next biggest such retailer. See page 22 for a description of Signet’s UK division.
Competition and sector consolidation
In the US, for calendar 2009 Signet had an approximate 4.4% share of the $58.8 billion total jewelry market (source: U.S. Bureau of Economic Analysis (“BEA”)). The specialty retail jewelry market was provisionally estimated to be $27.2 billion (source: US Census Bureau). During calendar 2008 and calendar 2009, the US specialty jewelry sector underwent an accelerated rate of consolidation, as weak competitors exited the market. Three of the top ten middle market brands by sales at January 1, 2008 liquidated, and a fourth has been in Chapter 11 for over a year. Management estimates that the number of US specialty jewelry outlets has declined by between 10% and 15% since January 1, 2008, and believes that financial and liquidity issues are reducing the ability of many other specialty jewelers to compete effectively.
As a result of management’s strategy to focus on enhancing its competitive strengths, the US division was able to take advantage of these trends and increased its market share by 40 basis points from 9.0% of the US specialty jewelry sector in calendar 2008 to 9.4% in calendar 2009 (source: US Census Bureau). These sector trends are anticipated to continue in calendar 2010 and provide further opportunity for the US division to gain profitable market share. In addition, management believes the US division will be better prepared than many in its sector to take advantage of an upturn in consumer expenditure, whenever it occurs, due to its focus on customer needs, its operating philosophy of continuous improvement and its strong balance sheet.
In the UK, for calendar 2008, the most recent year for which data is available, Signet had an approximate 11% share of the £4.9 billion total jewelry market (source: Office for National Statistics). Data for 2009 is due for publication on March 30, 2010. While similar specialty retail jewelry data is not available for the UK market as for the US market, management believes that the economic environment has also resulted in an acceleration of the rate at which other jewelry stores are leaving the market and a weakening of many competitors.
3
Table of Contents
Operating principles
Management aims to build long term value by focusing on the customer and providing a superior merchandise selection in high quality real estate locations. Effective advertising draws consumers into our stores, where the objective is to provide outstanding service. The operating principles that help management achieve these aims are:
| • | excellence in execution; |
| • | test before investing; |
| • | continuous improvement; and |
| • | disciplined investment. |
Operational execution
Management recognizes that while the level of expenditure on jewelry is discretionary and consumers may trade down in a more challenging economic environment, the expression of romance and appreciation, for example through bridal jewelry and gift giving, remain very important human needs, as is self reward. Therefore, helping to satisfy those needs is central to driving sales. As a result, the training of staff to better understand the shopper’s requirements, communicate the value of the merchandise selected and ‘close the sale,’ remains a high priority. Management also aims to increase the attraction of Signet’s store brands to consumers through the use of differentiated merchandise (see page 15), while also offering a compelling value proposition in more basic ranges, including increased use of “value items” (see page 16), by utilizing its supply chain and merchandising expertise, scale and balance sheet strength. In addition, management intends to leverage national television advertising and customer relationship marketing, which it believes are the most effective and cost efficient forms of marketing available, to at least maintain its leading share of relevant marketing messages (“share of voice”).
STRATEGY AND OBJECTIVES
In the more buoyant economic conditions experienced between fiscal 2002 and mid fiscal 2009, management’s strategy had been to:
| • | maintain a strong balance sheet; |
| • | continue the achievement of sector leading performance standards on both sides of the Atlantic; |
| • | maximize store productivity in the US and the UK; and |
| • | grow new store space in the US. |
Fiscal 2010 strategy
Reflecting the dramatic change in economic and financial market conditions in the second half of fiscal 2009, same store sales declined by 14.9% in the fourth quarter of fiscal 2009 and underlying operating margin was materially reduced. As a result management reviewed and amended Signet’s strategy to:
| • | enhance Signet’s position as the strongest middle market specialty retail jeweler; |
| • | focus on profit and cash flow maximization to maintain a strong balance sheet; and |
| • | reduce business risk. |
In the changed economic environment, management judged that it was preferable, and a much lower risk strategy, to aim to maximize sales by gaining profitable market share in existing stores by focusing on enhancing competitive strengths rather than opening additional locations.
4
Table of Contents
Fiscal 2010 financial objectives
For fiscal 2010, this strategy resulted in the following financial objectives being set:
| • | $100 million US cost saving program; |
| • | significantly reduce working capital; |
| • | lower capital expenditure by about 50%, to approximately $55 million; and |
| • | achieve a positive free cash flow of between $175 million and $225 million. |
The US division slightly exceeded the cost savings target of $100 million (excluding inflation, net bad debt and volume related costs on sales above plan). Signet achieved a $221.5 million reduction in working capital primarily through reducing inventory by $226.5 million. Capital expenditure was $43.6 million, $11 million below the target level. The positive free cash flow; non-GAAP measure, see Item 6, in fiscal 2010 was $471.9 million, more than twice the objective, reflecting the reduction in working capital and a better than expected trading performance.
Fiscal 2011 strategy
While the results for fiscal 2010 exceeded the financial objectives for that year, and the US and UK economies showed some initial signs of stabilization in late fiscal 2010, activity remains below former levels and the outlook continues to be uncertain, particularly in the UK. The strategy in fiscal 2011 is therefore broadly similar to that of fiscal 2010. However, it is not anticipated that a further realignment of costs and working capital will be implemented given the stable sales performance in fiscal 2010.
Consistent with Signet’s strategy, management remains focused on improving store productivity, primarily by gaining profitable market share. Both the US and UK divisions entered the downturn as industry leaders and continue to endeavor to better meet customer requirements by further enhancing their competitive advantages.
This is expected to increase the performance gap between Signet and others in the sector in the basic retail disciplines of store operations, supply chain management and merchandising, marketing and quality of real estate. Over the last decade, the US division’s share of the US specialty jewelry market has increased from 5.2% to 9.4%; the aim is to achieve a further profitable increase in 2010. Significant store capacity exited the US specialty jewelry marketplace in calendar 2009 and management believes that many of the remaining firms are less able to compete due to financial pressures.
As always, profit and cash flow maximization remain a priority. Therefore management will continue to keep a tight control of gross merchandise margin, costs and inventory.
The strategy also encompasses maintaining a strong balance sheet and financial flexibility. These are significant advantages within the specialty jewelry sector when negotiating with landlords and suppliers. The business is able to invest in new merchandise ranges to drive sales and in information technology to improve productivity. In addition, a strong balance sheet enables the US division to provide credit to customers that meet consistent authorization standards at a time when other sources of consumer finance are contracting and many specialty jewelry competitors are finding third party provision of credit to be increasingly expensive.
5
Table of Contents
Fiscal 2011 financial objectives
In fiscal 2011, management’s financial objectives for the business are the following:
| • | Controllable costs to be little changed from fiscal 2010 at constant exchange rates, that is costs excluding net bad debt charge, expenses that vary with sales, the US vacation entitlement policy change (see page 66) and the impact from the amendments to the Truth in Lending Act (see page 21) |
| • | Capital expenditure of about $80 million |
| • | Positive free cash flow of between $150 million and $200 million |
MEDIUM TERM OUTLOOK
Management believes that Signet’s two operating divisions have the opportunity to take advantage of their enhanced competitive positions to gain profitable market share and, as any improvements to the economy take place, grow sales and increase store productivity. In addition, as the economy stabilizes there is the potential for the ratio of the net bad debt charge on customer receivables to sales within the US division to return to nearer historic, lower levels. The increasing consolidation of the jewelry supply chain may allow the business to strengthen relationships with suppliers, facilitating the possibility of developing differentiated merchandise, and potentially improving the efficiency of its supply chain. Management also believe that Signet’s strong balance sheet and superior operating metrics should allow its operating divisions to take advantage of investment opportunities that meet management’s return criteria, particularly space growth in the US, more quickly than competitors. Furthermore, Signet is in a position to take advantage of strategic opportunities that meet management’s demanding investment returns, should they arise.
BACKGROUND
Business segment
Signet’s results derive from one business segment – the retailing of jewelry, watches and associated services. The business is managed as two geographical operating divisions: the US division (approximately 78% of sales) and the UK division (approximately 22% of sales). Both divisions are managed by executive committees, which report through divisional Chief Executives to Signet’s Chief Executive to the Board of Directors of Signet (the “Board”). Each divisional executive committee is responsible for operating decisions within parameters established by the Board.
Detailed financial information about both divisions is found in Note 2 of Item 8.
History and development
Signet Group plc was incorporated in England and Wales on January 27, 1950 under the name Ratners (Jewellers) Limited. The name of the company was changed on December 10, 1981 to Ratners (Jewellers) Public Limited Company, on February 9, 1987 to Ratners Group plc, and on September 10, 1993 to Signet Group plc. On September 11, 2008, Signet Group plc became a wholly-owned subsidiary of Signet Jewelers Limited, a new company incorporated in Bermuda under the Companies Act 1981 of Bermuda, following the completion of a scheme of arrangement approved by the High Court of Justice in England and Wales under the UK Companies Act 2006. Shareholders of Signet Group plc became shareholders of Signet Jewelers Limited, owning 100% of that company. Signet Jewelers Limited is governed by the laws of Bermuda.
Signet expanded rapidly by acquisition during the period 1984 to 1990. It first entered the US market in 1987 by acquiring Sterling Inc., a company based in Akron, Ohio. Kay Jewelers, Inc. was acquired in 1990. Since 1990 the only corporate acquisition made by Signet was that of Marks & Morgan Jewelers Inc. in 2000.
6
Table of Contents
Signet listed on the London Stock Exchange (“LSE”) in 1968. In 1988, American Depositary Shares (“ADSs”) of Signet began trading on NASDAQ and in November 2004 the listing for the ADSs was moved to the New York Stock Exchange (“NYSE”). On September 11, 2008, as part of the scheme of arrangement discussed above, each Signet Group plc share was consolidated on a 1-for-20 basis, and each ADS on a 1-for-2 basis. On the same date Signet Jewelers Limited’s shares were listed on the NYSE and a secondary listing was obtained on the Official List of the United Kingdom Listing Authority (from April 2010, following implementation of the FSA’s review of the UK listing regime, all secondary listings, including the Company’s, will be relabeled as standard listings).
Trademarks and trade names
Signet is not dependent on any material patents or licenses in either the US or the UK. However, it does have several well-established trademarks and trade names which are significant in maintaining its reputation and competitive position in the jewelry retailing industry. These registered trademarks and trade names include the following in Signet’s US operations: Kay Jewelers; Jared The Galleria Of Jewelry; JB Robinson Jewelers; Marks & Morgan Jewelers; Belden Jewelers; Weisfield Jewelers; Osterman Jewelers; Shaw’s Jewelers; Rogers Jewelers; LeRoy’s Jewelers; Goodman Jewelers; Friedlander’s Jewelers; Every kiss begins with Kay; Peerless Diamond; Hearts Desire; Perfect Partner; Open Hearts by Jane Seymour; and Love’s Embrace. Trademarks and trade names include the following in Signet’s UK operations: H.Samuel; Ernest Jones; Leslie Davis; Forever Diamond; and Perfect Partner.
The value of Signet’s trademarks and trade names are material but are not reflected on its balance sheet. Their value is maintained and increased by Signet’s expenditure on staff training, marketing and store investment.
Seasonality
Signet’s sales are seasonal, with the first and second quarters each normally accounting for slightly more than 20% of annual sales, the third quarter a little under 20% and the fourth quarter for about 40% of sales, with December being by far the most important month of the year. Due to sales leverage, Signet’s operating income is even more seasonal, with nearly all of the UK division’s, and a little over 50% of the US division’s operating income normally occurring in the fourth quarter. Selling, general and administrative costs occur broadly evenly during the year, while net financing expenses are usually higher in the second half of the year reflecting the normal peak in working capital requirements just ahead of the key holiday trading period.
Employees
In fiscal 2010 the average number of full-time equivalent persons employed was 16,320 (US: 12,596; UK: 3,724). Signet usually employs a limited number of temporary employees during its fourth quarter. None of Signet’s employees in the UK and less than 1% of Signet’s employees in the US are covered by collective bargaining agreements. Signet considers its relationship with its employees to be excellent.
Further information on Signet’s employees can be found elsewhere in this Report.
| Year ended | ||||||
| Fiscal 2010 | Fiscal 2009 | Fiscal 2008 | ||||
| Average number of employees |
||||||
| US |
12,596 | 13,218 | 13,396 | |||
| UK |
3,724 | 3,697 | 3,847 | |||
| Total |
16,320 | 16,915 | 17,243 | |||
7
Table of Contents
US DIVISION
US market
Total US jewelry sales, including watches and fashion jewelry, are provisionally estimated by the BEA to have been $58.8 billion in calendar 2009. The BEA figures are subject to frequent and sometimes large revisions. During July 2009, the BEA made significant downward revisions to its sales database back to 1993.
The US jewelry market has grown at a compound annual growth rate of 4.5% over the last 25 years. While Signet’s major competitors are other specialty jewelers, Signet also faces competition from other retailers that sell jewelry including department stores, discount stores, apparel outlets and internet retailers. Management believes that the jewelry category competes with other sectors, such as electronics, clothing and furniture, as well as travel and restaurants for consumers’ discretionary spending, particularly with regard to gift giving but less so with regard to bridal (engagement, wedding and anniversary) jewelry.
In calendar 2009, the US jewelry market contracted by a provisional estimated 1.9% (source: BEA), reflecting the continuing challenging economic environment. Based on provisional estimates, the specialty jewelry sector fell by 3.9% to $27.2 billion in calendar 2009 (source: US Census Bureau). As with the BEA figures, during 2009 downward revisions were made to the US Census Bureau figures for the preceding four years. The specialty sector saw a provisional decline in market share to 46.2% in calendar 2009 from 47.1% in calendar 2008.
The US division’s share of the specialty jewelry market increased to 9.4% in calendar 2009 from 9.0% in calendar 2008, based on initial estimates by the US Census Bureau. In fiscal 2010, the US division’s same store sales fell by 3.5% in the first three quarters, but increased by 7.4% in the fourth quarter. Spending by higher income consumers was weak in the first three quarters, but began to recover in the fourth quarter and this was reflected in the performance of Jared.
US Competitive Strengths
Store operations and human resources
The ability of the sales associate to explain the merchandise and its value is essential to most jewelry purchases
| • | Centrally prepared training schedules and materials are used by all stores and help ensure a consistently high level of customer service |
| • | All store managers are required to be trained diamontologists, so as to provide expert knowledge to customers |
| • | The US division employs over 5,000 qualified diamontologists, about 17% of all those awarded this qualification by the Diamond Council of America since 1998 |
| • | Measurable daily store standards provide staff with clear performance targets |
| • | Each store receives a monthly customer experience report helping to identify opportunities to improve customer service |
Merchandising
Offering the consumer greater value and selection
| • | Leading supply chain capability among middle market specialty jewelers provides better value to the customer |
| • | Each store is merchandised on an individual basis so as to provide appropriate selection |
| • | Highly responsive demand-driven merchandise systems enable swifter response to changes in customer behavior |
8
Table of Contents
| • | 24 hour re-supply capability means items wanted by customers are more likely to be in stock |
| • | In fiscal 2010, about 20% of merchandise sales accounted for by differentiated ranges (see page 15) |
Marketing
Leading brands in middle market sector
| • | Largest marketing budget in specialty jewelry sector, based on publicly available data, allowing more advertising impressions than competitors |
| • | Kay and Jared are able to achieve leverage through national television advertising |
| • | A proprietary marketing database of 26 million names provides significant opportunities for customer relationship marketing |
Real estate
Well designed stores in primary locations with high visibility and traffic flows
| • | Strict real estate criteria consistently applied over time has resulted in a high-quality store base |
| • | Well tested formats and locations reduce the risk of investing in new stores |
| • | The division’s high store productivity and financial strength make Signet an attractive tenant for landlords |
Customer finance
Ability to facilitate customer transactions
| • | About 53% of sales utilize financing provided by Signet |
| • | Dedicated, proprietary credit underwriting standards more accurately reflect Signet’s customer than those used by a typical third party scorecard |
| • | Manage the provision of customer finance in the context of the US business rather than by a third party’s priorities |
9
Table of Contents
US Brand Reviews
Location of Kay, Jared and Regional stores by state January 30, 2010

| Fiscal 2011 Planned |
Fiscal 2010 |
Fiscal 2009 |
Fiscal 2008 |
|||||||||
| Total opened during the year |
8 | 16 | 77 | 108 | ||||||||
| Kay |
6 | 8 | (1) | 57 | (1) | 68 | ||||||
| Jared |
2 | 7 | 17 | 19 | ||||||||
| Regional brands |
— | 1 | 3 | 21 | ||||||||
| Total closed during the year |
(50 | ) | (56 | ) | (75 | ) | (17 | ) | ||||
| Kay |
(14 | ) | (11 | ) | (25 | ) | (6 | ) | ||||
| Jared |
— | — | — | — | ||||||||
| Regional brands |
(36 | ) | (45 | )(1) | (50 | )(1) | (11 | ) | ||||
| Total open at the end of the year |
1,319 | 1,361 | 1,401 | 1,399 | ||||||||
| Kay |
915 | 923 | 926 | 894 | ||||||||
| Jared |
180 | 178 | 171 | 154 | ||||||||
| Regional brands |
224 | 260 | 304 | 351 | ||||||||
| Average sales per store in thousands(2) |
$1,814 | $1,788 | $1,996 | |||||||||
| Kay |
$1,582 | $1,536 | $1,710 | |||||||||
| Jared |
$4,046 | $4,491 | $5,341 | |||||||||
| Regional brands |
$1,163 | $1,160 | $1,344 | |||||||||
| (Decrease)/increase in net new store space |
(2 | )% | (1 | )% | 4 | % | 10 | % | ||||
| Percentage increase/(decrease) in same store sales |
0.2 | % | (9.7 | )% | (1.7 | )% | ||||||
| (1) | Includes two regional stores rebranded as Kay in fiscal 2010, and 14 in fiscal 2009. |
| (2) | Based only upon stores operated for the full fiscal year. |
10
Table of Contents
Sales data by brand
| Change on previous year | ||||||||||||||||
| Fiscal 2010 |
Sales | Average unit selling price |
Sales | Same store sales |
Average unit selling price |
|||||||||||
| Kay |
$ | 1,508.2m | $ | 307 | 4.8 | % | 4.4 | % | (7.4 | )% | ||||||
| Jared |
$ | 722.5m | $ | 713 | (1) | (0.5 | )% | (6.0 | )% | (7.3 | )%(1) | |||||
| Regional brands |
$ | 326.8m | $ | 329 | (11.9 | )% | (4.0 | )% | (4.8 | )% | ||||||
| US |
$ | 2,557.5m | $ | 324 | 0.8 | % | 0.2 | % | (16.8 | )% | ||||||
| (1) | Excludes the charm bracelet category, see page 14. |
Kay Jewelers
Kay operated 923 stores in 50 states at January 30, 2010 (January 31, 2009: 926 stores). Since fiscal 2005, Kay has been the largest specialty retail jewelry brand in the US, based on sales, and has subsequently increased its leadership position. Kay targets households with an income of between $35,000 and $100,000. Such households account for between 45% and 50% of US jewelry expenditure. Details of Kay’s performance over the last five years are given below:
| Fiscal 2010 |
Fiscal 2009 |
Fiscal 2008 |
Fiscal 2007(1) |
Fiscal 2006 | |||||||||||
| Sales (million) |
$ | 1,508.2 | $ | 1,439.1 | $ | 1,489.6 | $ | 1,486.7 | $ | 1,290.1 | |||||
| Stores at year end |
923 | 926 | 894 | 832 | 781 | ||||||||||
| (1) | 53 week year. |
Kay sales were $1,508.2 million during fiscal 2010 (fiscal 2009: $1,439.1 million). The increase in sales was due to a 14% rise in the number of transactions partly offset by a decrease in the average retail price of merchandise sold to $307 (fiscal 2009: $331), primarily reflecting changes in merchandise mix. Same store sales increased by 4.4% during the year, with the fourth quarter up 7.7%. During fiscal 2010, the number of Kay stores fell by three to 923. The Kay website, www.kay.com, was enhanced further and e-commerce sales increased significantly, but remain small in the context of the brand.
Kay stores typically occupy about 1,500 square feet and have around 1,250 square feet of selling space. They have historically been located in enclosed regional malls. Since 2002, new formats have been developed for locations outside of traditional malls, because management believes these alternative locations present an opportunity to reach new customers who are aware of the brand but have no convenient access to a store, or for customers who prefer not to shop in an enclosed mall. Such stores further leverage the strong Kay brand, marketing support and the central overhead. In addition, nearly all current retail construction projects undertaken in recent years by developers are in formats other than enclosed regional malls.
Recent net openings, current composition and planned openings in fiscal 2011 are shown below:
| Expected net change fiscal 2011 |
Stores at January 30, 2010 |
Net openings | |||||||||||||||
| Fiscal 2010 |
Fiscal 2009 |
Fiscal 2008 |
Fiscal 2007 |
Fiscal 2006 | |||||||||||||
| Enclosed mall |
(6 | ) | 794 | (1 | )(1) | 6 | (1) | 17 | 26 | 25 | |||||||
| Off-mall |
(4 | ) | 111 | (2 | ) | 18 | 40 | 21 | 14 | ||||||||
| Outlet |
2 | 18 | — | 8 | 5 | 4 | — | ||||||||||
| Total |
(8 | ) | 923 | (3 | ) | 32 | 62 | 51 | 39 | ||||||||
| (1) | Includes two regional stores rebranded as Kay in fiscal 2010, and 14 in fiscal 2009. |
11
Table of Contents
Jared The Galleria Of Jewelry
Jared is the leading off-mall destination specialty retail jewelry chain in its sector of the market, based on sales, with 178 stores in 35 states as at January 30, 2010 (January 31, 2009: 171). The first Jared store was opened in 1993, and, since its roll-out began in 1998, it has grown to become the fourth largest US specialty retail jewelry brand by sales. Each Jared is equivalent in size to about four of the division’s mall stores and its average retail price of diamond merchandise sold, is more than double that of a Kay store. In space terms, Jared is equivalent to over 700 US division mall stores. Its main competitors are independent operators. The next two largest such chains significantly reduced their store numbers during fiscal 2010 from 23 to 20 and 20 to 10 stores respectively. Jared targets households with an income of between $50,000 and $150,000. Management believe that such households account for about 45% of US jewelry expenditure. Management believes this to be an under-served sector. An important distinction of a destination store is that the potential customer visits the store with a greater intention of making a jewelry purchase, whereas in a mall there is a possibility that the potential shopper is undecided about the product category in which they will ultimately make a purchase.
Details of Jared’s performance over the last five years are given below:
| Fiscal 2010 |
Fiscal 2009 |
Fiscal 2008 |
Fiscal 2007(1) |
Fiscal 2006 | |||||||||||
| Sales (million) |
$ | 722.5 | $ | 726.2 | $ | 756.4 | $ | 664.4 | $ | 534.2 | |||||
| Stores at year end |
178 | 171 | 154 | 135 | 110 | ||||||||||
| (1) | 53 week year. |
Jared sales were $722.5 million during fiscal 2010 (fiscal 2009: $726.2 million). Same store sales decreased by 6.0% during the year, but increased by 9.1% in the fourth quarter. The decrease in same store sales was due to a fall in the number of transactions excluding the charm bracelet category and, primarily reflecting changes in the merchandise mix, a decrease in the average retail price of merchandise sold to $713 (fiscal 2009: $769), excluding the impact of a charm bracelet range rolled out during fiscal 2010 (see page 14). The portfolio of stores increased by seven to 178. The Jared website, www.jared.com, was enhanced having become transactional during fiscal 2009. E-commerce sales increased significantly but are only a small proportion of sales.
A key point of differentiation, compared to a typical mall store, is Jared’s higher quality of customer service. As a result of its larger size, more specialist staff are available and additional in-depth selling methodologies may be used, such as the ‘white glove’ presentation of timepieces.
Every Jared store has an on-site design and repair workshop where most repairs are completed within one hour. The center also mounts loose diamonds in settings and provides a custom design service when required. Each store also has at least one diamond viewing room, a children’s play area and complimentary refreshments.
The typical Jared store continues to have about 4,800 square feet of selling space and around 6,000 square feet of total space. Jared locations are normally free-standing sites in shopping developments with high visibility and traffic flow, and positioned close to major roads. Jared stores operate in retail centers that normally contain strong retail co-tenants, including other category killer destination stores such as Barnes & Noble, Best Buy, Home Depot and Bed, Bath & Beyond, as well as some smaller specialty units.
Recent net openings, current composition and planned openings in fiscal 2011 are shown below:
| Expected net openings fiscal 2011 |
Stores at January 30, 2010 |
Net openings | ||||||||||||
| Fiscal 2010 |
Fiscal 2009 |
Fiscal 2008 |
Fiscal 2007 |
Fiscal 2006 | ||||||||||
| Total |
2 | 178 | 7 | 17 | 19 | 25 | 17 | |||||||
12
Table of Contents
US Regional Brands
Signet also operates mall stores under a variety of established regional trading names. At January 30, 2010, 260 regional brand stores operated in 36 states (January 31, 2009: 304 stores in 37 states). The leading brands include JB Robinson Jewelers, Marks & Morgan Jewelers and Belden Jewelers. Nearly all of these stores are located in malls where there is also a Kay store and target a similar customer. As the average sales per store is less than that of the Kay chain, and they do not have the leverage of national TV advertising, regional brand stores are more likely to be closed than Kay stores. Details of regional brands’ performance over the last five years are given below:
| Fiscal 2010 |
Fiscal 2009 |
Fiscal 2008 |
Fiscal 2007(1) |
Fiscal 2006 | |||||||||||
| Sales (million) |
$ | 326.8 | $ | 370.8 | $ | 459.7 | $ | 501.0 | $ | 484.5 | |||||
| Stores at year end |
260 | 304 | 351 | 341 | 330 | ||||||||||
| (1) | 53 week year. |
Regional brand sales for fiscal 2010 were $326.8 million (fiscal 2009: $370.8 million). The decrease in sales was due to store closures, a fall in the number of transactions, and a decrease in the average retail price of merchandise sold to $329 (fiscal 2009: $346), primarily reflecting changes in merchandise mix. Same store sales decreased by 4.0% during the year, but increased in the fourth quarter by 2.8%.
The location and size of regional brand stores within a mall is similar to that of a Kay store, and consideration is given to changing a regional brand store to Kay where the overall return on capital employed, including any resulting impact on other stores operated by the US division, may be increased. In fiscal 2010, two regionally branded stores were converted to the Kay format (fiscal 2009: 14). New regional chain stores are opened only if real estate satisfying the US division’s investment criteria becomes available in their respective trading areas.
Recent net closures and openings, current composition and planned closures in fiscal 2011 are shown below:
| Expected net change fiscal 2011 |
Stores at January 30, 2010 |
Net (closures) / openings | |||||||||||||||
| Fiscal 2010 |
Fiscal 2009 |
Fiscal 2008 |
Fiscal 2007 |
Fiscal 2006 | |||||||||||||
| Total |
(36 | ) | 260 | (44 | )(1) | (47 | )(1) | 10 | 11 | 9 | |||||||
| (1) | Includes two regional stores rebranded as Kay in fiscal 2010 and 14 in fiscal 2009. |
US Functional Review
Operating structure
While the US division operates under 12 different brands, many functions are integrated to gain economies of scale. For example, store operations have a separate dedicated field management team for the mall brands, Jared and the in-store repair function, while there is a combined diamond sourcing function.
US Customer Service and Human Resources
In specialty jewelry retailing, the level and quality of customer service is a key competitive factor as nearly every in-store transaction involves the sales associate taking a piece of jewelry or a watch out of a display case and presenting it to the potential customer. Therefore the ability to recruit, train and retain suitably qualified sales staff is important in determining sales, profitability and the rate of net store space growth. Consequently the US division has in place comprehensive recruitment, training and incentive programs and uses employee attitude and customer satisfaction surveys. A continual priority of the US division is to improve the quality of
13
Table of Contents
customer experiences in its existing stores, while providing sufficient staff that are well trained and with suitable experience to run any new stores being opened.
During fiscal 2010, focus was on increasing the efficiency of in-store execution and aligning store staff hours to sales volume, subject to minimum staffing levels. In addition, at the start of fiscal 2010 a further reduction in staffing levels at the divisional head office was implemented. Staff training, which centered on product knowledge and selling skills, remained a priority. In a difficult year, employees remained motivated, focused on maintaining excellence in execution, and were well, and appropriately, incentivized.
US Merchandising and Purchasing
Management believes that merchandise selection, availability, and value for money are critical factors to success for a specialty retail jeweler. In the US business, the range of merchandise offered and the high level of inventory availability are supported centrally by extensive and continuous research and testing. Best-selling products are identified and replenished rapidly through analysis of sales by stock keeping unit. This approach enables the US division to deliver a focused assortment of merchandise to maximize sales and inventory turn, and minimize the need for discounting. Management believes that the US division is better able than its competitors to offer greater value and consistency of merchandise, due to its supply chain advantages discussed below. In addition, in recent years management has developed and continues to execute a strategy to increase the proportion of differentiated merchandise sold in response to consumer demand.
In the second half of fiscal 2009, a charm bracelet range was tested in a limited number of Jared stores. The test was successful and the range was rolled out to nearly all Jared stores in October 2009. The typical customer for this range was in the Jared demographic, but had not previously shopped at a Jared store. The typical average selling price of an item from the range was significantly below the average for Jared, but the purchase frequency was greater. As a result, the introduction of the charm bracelet range materially increased traffic and transaction volume for Jared, but greatly lowered the average selling price. Therefore items from this range have been excluded from the calculation of the average selling price for Jared. Management believes that this provides a better indication of the trend in buying patterns of the core Jared customer.
Average merchandise unit selling price ($), excluding repairs, warranty and other miscellaneous sales
| Fiscal 2010 |
Fiscal 2009 |
Fiscal 2008 |
Fiscal 2007 |
Fiscal 2006 | ||||||
| Kay |
307 | 331 | 327 | 317 | 305 | |||||
| Jared(1) |
713 | 769 | 747 | 719 | 697 | |||||
| Regional brands |
329 | 346 | 343 | 332 | 324 |
| (1) | Excluding the charm bracelet category. |
The average unit selling price fell in fiscal 2010 compared to fiscal 2009. During the first nine months of fiscal 2010, the decrease was 13% (mall brands down by 7% and Jared, excluding charm bracelets was down by 9%). This reflected mix changes offset by a small benefit from price increases implemented in the first quarter of fiscal 2009. In the fourth quarter of fiscal 2010, the average unit selling price decreased by 20% (mall brands down by 7% and Jared, excluding charm bracelets, down by 3%).
Merchandise mix
About 76% of the jewelry and watch sales of the US division contain one or more diamonds. Other significant merchandise categories are gold and silver jewelry (including charms) without any gemstone; other jewelry which mostly contains gemstones, such as sapphires, rubies, emeralds and pearls; and watches. In fiscal 2010, sales of silver jewelry and charms increased markedly.
14
Table of Contents
Sales of jewelry can also be divided by purpose of purchase, with bridal, which includes engagement, wedding and anniversary purchases, accounting for 45% to 50% of the US division’s sales. Other reasons for buying jewelry and watches include gift giving, which is important at Christmas, Valentine’s Day and Mother’s Day, and self reward. The bridal category is believed by management to be more stable than the other two major reasons for buying jewelry, but it is still dependent on the economic environment as customers can trade down to lower price points.
A further categorization of merchandise is generic, branded and differentiated. Generic merchandise are items and styles available from a wide range of jewelry retailers, such as solitaire rings and diamond stud earrings. It also includes styles such as diamond fashion bracelets, ‘circle’ items and concepts promoted by De Beers such as ‘Journey’ diamond jewelry and ‘right hand’ rings. Within the generic category, the US division has exclusive designs of particular styles and also has ‘value items’, see page 16. Branded merchandise is mostly watches, but also includes ranges such as the Pandora™ charm bracelet which was rolled out to most Jared stores for Christmas 2009. Differentiated merchandise, are items that are branded and exclusive to the US division in its marketplace or where it is not widely available in other specialty jewelry retailers. The US division’s sales of differentiated merchandise increased significantly in fiscal 2010, see below.
In addition to selling jewelry and watches, the US division also makes other related sales such as design and repair services, and warranties. See page 18.
US division merchandise mix, excluding repairs, warranty and other miscellaneous sales
| Fiscal 2010 |
Fiscal 2009 |
Fiscal 2008 | ||||
| % | % | % | ||||
| Diamonds and diamond jewelry |
76 | 75 | 75 | |||
| Gold & silver jewelry, including charms |
8 | 7 | 7 | |||
| Other jewelry |
9 | 11 | 11 | |||
| Watches |
7 | 7 | 7 | |||
| 100 | 100 | 100 | ||||
Differentiated ranges
Differentiated merchandise includes:
| • | the Leo Diamond® range, which is sold exclusively by Signet in the US and the UK, was the first diamond to be independently and individually certified to be visibly brighter; |
| • | the Peerless Diamond® , an Ideal Cut diamond with a superior, measured return of light, available only in Jared stores; |
| • | exclusive ranges of jewelry by Le Vian®, a prestigious fashion jewelry brand with a 500 year history. In addition, the US division’s mall brand stores are the only specialty retail jeweler to offer Le Vian® merchandise in covered regional malls; |
| • | Open Hearts by Jane Seymour®, a range of jewelry designed by the actress and artist Jane Seymour, which was successfully tested and launched in fiscal 2009; and |
| • | Love’s EmbraceTM, a new collection, which was tested and rolled out during fiscal 2010. |
Management believes that the US division’s scale, well trained sales staff, ability to advertise on national television, strong balance sheet and record of success, make it the preferred retail partner for jewelry manufacturers wishing to develop distinctive new jewelry merchandise. As a result, management also believes that it is offered such merchandise before other US retailers and is well positioned to negotiate restricted
15
Table of Contents
distribution agreements with such manufacturers. Differentiated ranges raise the profile of the US division’s store brands, help to drive sales, have a gross merchandise margin rate a little above the US division as a whole and improve inventory turn. Differentiated merchandise performed very well and increased as a share of sales to about 20% in fiscal 2010 (fiscal 2009: 10% to 15%). The US division further developed the Open Hearts by Jane Seymour® selection and successfully launched the Love’s EmbraceTM range. There was continued success with the Leo Diamond® and merchandise from Le Vian®. Therefore it is planned to develop additional differentiated ranges and to further expand those already launched.
Value items
By planning ahead and using its expertise in the loose, polished diamond market and the jewelery manufacturing sector, the US division engineered value items that appealed to the more cost conscious consumer. These items utilize Signet’s ability to identify anomalies in the supply chain, together with its scale and balance sheet strength, to purchase merchandise on advantageous terms. The savings achieved, together with a lower gross merchandise margin, result in such value items offering great value to the consumer. These items are prominently displayed in printed marketing materials. In fiscal 2010, due to parts of the supply chain being under financial pressure, there were more anomalies in pricing than normal. Management took advantage of this to offer a greater range of value items in the Christmas 2009 catalog, so as to cater to an anticipated increase in the proportion of consumers that would be value-conscious. In fiscal 2010 these items performed well and helped drive achieved gross merchandise margin dollars, but did contribute to a lower gross merchandise margin rate in the fourth quarter.
Direct sourcing of polished diamonds
Management believes that the US division has a competitive cost and quality advantage because about 42% (fiscal 2009: 43%) of diamond merchandise sold is sourced through contract manufacturing. This involves Signet purchasing loose polished diamonds on the world markets and outsourcing the casting, assembly and finishing operations to third parties. By using this approach, the cost of merchandise is reduced, enabling the US division to provide better value to the consumer, which helps to increase market share and achieve higher gross merchandise margins. Contract manufacturing is generally utilized on basic items with proven, non-volatile, historical sales patterns that represent a lower risk of over or under purchasing the quantity required.
The contract manufacturing strategy also allows Signet’s buyers to gain a detailed understanding of the manufacturing cost structure and improves the prospects of negotiating better prices for the supply of finished products.
The proportion of diamonds sourced loose decreased in fiscal 2010 due to the growth of differentiated ranges, where merchandise is more likely to be bought complete.
Rough diamond initiative
In fiscal 2006, Signet commenced a multi-year trial involving the purchase and contract cutting and polishing of rough diamonds to supply the US division. In the third quarter of fiscal 2009, given the prevailing economic environment, the initiative was discontinued. The remaining associated inventory was disposed of during fiscal 2010.
Sourcing of finished merchandise
Merchandise is purchased as a finished product where the complexity of the item is great, the merchandise is considered likely to have a less predictable sales pattern or where cost can be reduced. In addition, a significant proportion of differentiated merchandise is purchased in this way. This method of buying inventory provides the opportunity to reserve inventory held by vendors and to make returns or exchanges with the supplier, thereby reducing the risk of over or under purchasing. Management believes that the division’s scale and strong balance sheet enables it to purchase merchandise at a lower price, and on better terms, than most of its competitors.
16
Table of Contents
Merchandise held on consignment
Merchandise held on consignment is used to enhance product selection and test new designs. This minimizes exposure to changes in fashion trends and obsolescence, and provides the flexibility to return non-performing merchandise. At January 30, 2010, the US division held $135 million (January 31, 2009: $202 million) of merchandise on consignment (see Note 11, Item 8).
Suppliers
In fiscal 2010, the five largest suppliers collectively accounted for approximately 25% (fiscal 2009: 22%) of the US division’s total purchases, with the largest supplier accounting for approximately 7% (fiscal 2009: 8%). The US division’s supply chain is integrated on a worldwide basis, with diamond cutting and jewelry manufacturing being predominantly carried out in Asia.
The division benefits from close commercial relationships with a number of suppliers and damage to, or loss of, any of these relationships could have a detrimental effect on results. Although management believes that alternative sources of supply are available, the abrupt loss or disruption of any significant supplier during the three month period (August to October) leading up to the Christmas season could result in a material adverse effect on performance. Therefore a regular dialogue is maintained with suppliers, particularly in the present economic climate.
The luxury and prestige watch manufacturers and distributors normally grant agencies to sell their ranges on a store by store basis. Signet sells its luxury watch brands primarily through Jared and management believes that the watch brands help attract customers to Jared and build sales in all categories.
Raw materials and the supply chain
The jewelry industry generally is affected by fluctuations in the price and supply of diamonds, gold and, to a much lesser extent, other precious and semi-precious metals and stones.
The ability of Signet to increase retail prices to reflect higher commodity costs varies, and an inability to increase retail prices could result in lower profitability. Historically, jewelry retailers have, over time, been able to increase prices to reflect changes in commodity costs. However, particularly sharp increases and volatility in commodity costs usually result in a time lag before increased commodity costs are fully reflected in retail prices due to the slow inventory turn, hedging activities and the use of average cost accounting in the calculation of costs of goods sold by some retailers. Diamonds account for about 55% of the US division’s cost of goods sold, and in fiscal 2010, the cost of diamonds in the qualities and sizes required, declined. While diamond prices increased somewhat towards the end of the year, they remained below the level paid in fiscal 2009. The cost of gold, which accounts for about 20% of the US division’s cost of goods sold, again increased in fiscal 2010. Overall, commodity cost movements in fiscal 2010 had a limited net impact on the cost of goods sold.
In early fiscal 2011, the US division implemented selective price increases for merchandise that contains a significant proportion of gold to reflect higher commodity costs. These ranges account for less than 30% of the US division’s sales.
Signet undertakes some hedging of its requirement for gold through the use of options, forward contracts and commodity purchasing. It does not hedge against fluctuations in the cost of diamonds. The cost of raw materials is only part of the costs involved in determining the retail selling price of jewelry, with labor costs also being a significant factor. Management continues to seek ways to reduce the cost of goods sold by improving the efficiency of its supply chain.
The largest product category sold by Signet is diamonds and diamond jewelry. The supply and price of diamonds in the principal world markets are significantly influenced by a single entity, De Beers, through its subsidiary, the
17
Table of Contents
Diamond Trading Company, although its market share has been decreasing. Significant changes in the diamond supply chain in recent years have also resulted from changes in government policy in a number of African diamond producing countries. In addition, the sharp downturn in worldwide demand for diamonds, reflecting the challenging economic environment, may result in further significant changes in the supply chain.
Inventory management
Sophisticated inventory management systems for merchandise testing, assortment planning, allocation and replenishment are in place, thereby reducing inventory risk by enabling management to identify and respond quickly to changes in consumers’ buying patterns. The majority of merchandise is common to all US division mall stores, with the remainder allocated to reflect demand in individual stores. Management believes that the merchandising and inventory management systems, as well as improvements in the productivity of the centralized distribution center, have allowed the US division to achieve inventory turns at least comparable to those of competitors, even though it has a significantly less mature store base and undertakes more direct sourcing of merchandise. The vast majority of inventory is held at stores rather than in the central distribution facility.
In fiscal 2010, management reduced inventory levels by about $225 million, primarily reflecting the lower level of sales experienced in fiscal 2009. This was achieved by tight control of purchases rather than discounting, as the US division’s procedures are designed to minimize clearance merchandise. A further inventory realignment is not planned in fiscal 2011. As a result of superior systems and a very experienced inventory management team, together with Signet’s strong balance sheet and liquidity, the US division was able to quickly respond to better than expected demand in the fourth quarter.
Other sales
While design and repair services represent less than 10% of sales, they account for approximately 30% of transactions and have been identified by management as an important opportunity to build consumers’ trust, particularly in the Jared division. All Jared stores have a highly visible jewelry workshop, which is open the same hours as the store. The workshops meet the repair requirements of the store in which they are located and also carry out work for the US division’s mall brand stores. As a result, nearly all customer repairs are carried out by the US division’s own staff, unlike most other chain jewelers which do this through sub-contractors. The design and repair function has its own field management and training structure.
For about 15 years, the US division has sold a lifetime repair warranty for jewelry. The warranty covers services such as ring sizing, refinishing and polishing, rhodium plating white gold, earring repair, chain soldering and the resetting of diamonds and gemstones that arise due to the normal usage of the merchandise. This work is carried out in-house.
US Marketing and Advertising
Management believes customers’ confidence in the retailer, store brand name recognition and advertising of differentiated ranges, are important factors in determining buying decisions in the specialty jewelry sector because the majority of merchandise is unbranded. Therefore, the US division continues to strengthen and promote its reputation by aiming to deliver superior customer service and build brand name recognition. In fiscal 2010, there was increased focus on including differentiated merchandise in national television advertising. The marketing channels used include television, radio, print, catalog, direct mail, telephone marketing, point of sale signage, in-store displays and electronic methods. Marketing activities are carefully tested and their success monitored by methods such as market research and sales productivity.
While marketing activities are undertaken throughout the year, the level of activity is concentrated at periods when customers are expected to be most receptive to marketing messages, which is before Christmas Day,
18
Table of Contents
Valentine’s Day and Mother’s Day. A significant majority of the marketing expenditure is on national television advertising which provides an opportunity to leverage its cost over time if the number of stores or sales increases.
Statistical and technology-based systems are employed to support a customer marketing program that uses a proprietary database of 26 million names to strengthen the relationship with customers through mail, telephone and email communications. The program targets current customers with special savings and merchandise offers during key trading periods. In addition, invitations to special in-store promotional events are extended throughout the year.
Historically, generic marketing activity undertaken by De Beers in the US to promote diamonds and diamond jewelry designs was important in influencing the size of the total jewelry market and the popularity of particular styles of jewelry. With the significant reduction by De Beers of its promotional expenditure on diamonds and diamond jewelry, management believes that marketing carried out by specialty jewelry retailers has become more important. Given the size of the marketing budgets for Kay and Jared, management believes this has increased the US division’s competitive marketing advantage, in particular the ability to advertise differentiated merchandise on national television is of growing importance. The US division’s five year record of gross advertising spend is given below:
| Fiscal 2010 |
Fiscal 2009 |
Fiscal 2008 |
Fiscal 2007(1) |
Fiscal 2006 | |||||||||||
| Gross advertising spend (million) |
$ | 153.0 | $ | 188.4 | $ | 204.0 | $ | 184.5 | $ | 152.8 | |||||
| Percent to sales (%) |
6.0 | 7.4 | 7.5 | 7.0 | 6.6 | ||||||||||
| (1) | 53 week year. |
In fiscal 2010, to reflect lower anticipated sales levels, marketing expenditure was further concentrated on the most productive channels and brands, and was planned to be in line with the advertising to sales ratio typical before fiscal 2008. The ratio of gross advertising spend to sales during fiscal 2010 was 6.0% (fiscal 2009: 7.4%), which was below the planned level due to the better than expected sales growth achieved in the fourth quarter of fiscal 2010. Dollar gross marketing expenditure was reduced by 18.8% to $153.0 million (fiscal 2009: $188.4 million). Marketing efforts were focused on national television advertising for Kay and Jared, and the US division continued to have the leading ‘share of voice’ within the US jewelry sector. Television advertising impressions in the fourth quarter of fiscal 2010 for Kay were down mid single digits and for Jared increased marginally.
Websites
The Kay and Jared websites are among the most visited in the specialty jewelry sector and primarily provide potential customers with a source of information about the merchandise available. A significant majority of customers who buy after visiting the websites, do so in store where they can physically examine the product. Sales made directly from the websites rose significantly in fiscal 2010 but remain small in the context of the US division.
US Real Estate
Given the challenging environment, and management’s strict investment criteria, action was taken in early fiscal 2009 to sharply slow the rate of store space growth and the level of store refurbishments. This was achieved by reducing the number of stores opened and increasing store closures as leases expired. Net store space in fiscal 2010 decreased by 1% (fiscal 2009: increase 4%), see table on page 82 for details. Capital expenditure in new and existing stores was $18.2 million (fiscal 2009: $56.3 million). Working capital investment, that is inventory and receivables, associated with new stores was $28.2 million (fiscal 2009: $66.5 million). In fiscal 2011, store capital expenditure is planned to amount to about $5 million on new space and about $35 million on existing stores, with about $11 million of working capital investment associated with new store openings.
19
Table of Contents
Recent and planned investment in the store portfolio is set out below:
| Fiscal 2011 planned |
Fiscal 2010 |
Fiscal 2009 |
Fiscal 2008 | |||||
| $million | $million | $million | $million | |||||
| New store fixed capital investment |
5 | 10.1 | 39.0 | 60.1 | ||||
| Other store fixed capital investment |
35 | 8.1 | 17.3 | 28.0 | ||||
| Total store fixed capital investment |
40 | 18.2 | 56.3 | 88.1 | ||||
| Working capital investment in new stores |
11 | 28.2 | 66.5 | 118.8 |
As a result of the growth of Jared and the development of Kay outside of its enclosed mall base, the US division is increasingly competing with independent specialty jewelry retailers that are able to adjust their competitive stance, for example on pricing, to local market conditions. This can put individual stores at a competitive disadvantage as the US division has a national pricing strategy.
US Customer Finance
In the US jewelry market, management believes that it is necessary for specialty retailers to offer credit facilities to the consumer. In fiscal 2010, 53.5% (fiscal 2009: 53.2%) of the US division’s sales were made using one of its in-house customer finance programs.
Management regards the provision of an in-house customer finance program, rather than one provided by a third party, as a competitive advantage for a number of reasons:
| • | credit policies are decided by taking into account the overall impact on the business rather than by a third party whose priorities may conflict with those of the division; |
| • | authorization and collection models are based on the behavior of the division’s consumers; |
| • | it allows management to establish and implement customer service standards appropriate for the business; |
| • | it provides a database of regular customers and their spending patterns; |
| • | investment in systems and management of credit offerings appropriate for the business can be facilitated; and |
| • | it maximizes cost effectiveness by utilizing in-house capability. |
Furthermore the various customer finance programs help to establish long term relationships with customers and complement the marketing strategy by enabling a greater number of purchases, higher units per transaction and greater value sales.
In addition to interest-bearing accounts, a significant proportion of credit sales are made using interest-free financing for one year or less, subject to certain conditions. In most US states, customers are offered optional third party credit insurance.
The customer financing operation is fully integrated into the management of the US division and is not a separate operating division nor does it report separate results. All assets and liabilities relating to customer financing are shown on the balance sheet and there are no associated off-balance sheet arrangements. Signet’s current balance sheet and access to liquidity do not constrain the US division’s ability to grant credit, which is a further competitive advantage in the current economic environment.
Allowances for uncollectible amounts are recorded as a charge to cost of goods sold in the income statement. The allowance is calculated using a model that analyzes factors such as delinquency rates, recovery rates and other portfolio data. A 100% allowance is made for any amount that is 90 days past due on a recency basis. The calculation is reviewed by management to assess whether, based on economic events, additional analyses are required to appropriately estimate losses inherent in Signet’s portfolio.
20
Table of Contents
Credit authorization and collection systems were centralized in 1994 and the overall credit offer to customers has been little changed during the last 15 years although the detailed terms have been changed, for example due to amendments to the Truth in Lending Act.
Each individual application for credit is evaluated against set criteria. The risks associated with the granting of credit to particular groups of customers with similar characteristics are balanced against the gross merchandise margin earned by the proposed sales to those customers. During fiscal 2010, an increase in credit acceptance rates followed the introduction of revised authorization criteria for some credit applicants based on the historic performance of parts of the credit portfolio. This did not reflect a change in the risk profile by which the credit operation was managed and was part of the normal review of such criteria. Management believes that a primary driver of the level of uncollectible receivables is the rate of change in the level of unemployment. Cash flows associated with the granting of credit to customers of the individual store are included in the projections used when considering store investment proposals.
As at January 30, 2010, the gross US receivables stood at $921.5 million (January 31, 2009: $886.1 million) and there was a bad debt allowance of $72.2 million (January 31, 2009: $69.5 million). The average level of gross receivables during fiscal 2010 was $845.1 million (fiscal 2009: $840.5 million).
Customer financing statistics
| Fiscal 2010 |
Fiscal 2009 |
Fiscal 2008 |
||||||||||
| Opening receivables (million) |
$ | 886.1 | $ | 900.6 | $ | 828.8 | ||||||
| Credit sales (million) |
$ | 1,368.2 | $ | 1,349.2 | $ | 1,422.4 | ||||||
| Closing receivables (million) |
$ | 921.5 | $ | 886.1 | $ | 900.6 | ||||||
| Credit sales as % of total sales |
53.5 | % | 53.2 | % | 52.6 | % | ||||||
| Number of active credit accounts at year end |
936,286 | 893,740 | 940,069 | |||||||||
| Average outstanding account balance |
$ | 1,016 | $ | 1,028 | $ | 997 | ||||||
| Average monthly collection rate |
12.5 | % | 13.1 | % | 13.9 | % | ||||||
| Net bad debt to total sales |
5.6 | % | 4.9 | % | 3.4 | % | ||||||
| Net bad debt to credit sales |
10.4 | % | 9.2 | % | 6.5 | % | ||||||
| Period end bad debt allowance to period end receivables |
7.8 | % | 7.8 | % | 6.7 | % | ||||||
In fiscal 2010, the net bad debt charge at 5.6% of total US sales (fiscal 2009: 4.9%) was 0.7% higher than in fiscal 2009 and was again well above the tight range of 2.8% to 3.4% experienced in the ten years prior to fiscal 2009. However the performance in the fourth quarter showed some initial signs of stabilizing. Credit participation was little changed at 53.5% (fiscal 2009: 53.2%), and in the fourth quarter it was 20 basis points lower than in the comparable quarter in fiscal 2009.
Customer financing administration
Authorizations and collections are performed centrally at the US head office, rather than in each individual store. The majority of credit applications are processed and approved automatically after being initiated via in-store terminals, through a toll-free phone number or on-line through the US division’s websites. The remaining applications are reviewed by credit authorization agents. All applications are evaluated by scoring credit and using data obtained through third party credit bureaus. Collection procedures use risk-based calling and first call resolution strategies. In fiscal 2010, information technology, systems support and collection strategies were made more effective and additional investment is planned in fiscal 2011.
Truth in Lending Act
In fiscal 2011, the US division will have to comply with certain new provisions of the Truth in Lending Act, that became effective on February 22, 2010 and others of which will come into force in August 2010. Where possible,
21
Table of Contents
actions have been taken to reduce the impact of these new provisions. Management expects that these new provisions will directly and adversely impact operating income by a net $15 million to $20 million in fiscal 2011, primarily because they will limit the timing and actions that the US division can take when a customer fails to make an agreed repayment. There may be a further indirect impact on sales arising from these amendments as a result of changes in consumer behavior. In addition, systems, procedures and credit terms have been amended to comply with changes in legislation.
Third party credit sales
In addition to in-house credit sales, the US stores accept major credit cards. Third party credit sales are treated as cash sales and accounted for approximately 39% (fiscal 2009: 38%) of total US sales during fiscal 2010.
US Management Tools and Communications
The US division’s integrated and comprehensive information systems provide detailed, timely information to monitor and evaluate many aspects of the business. They are designed to support financial reporting and management control functions such as merchandise testing, loss prevention and inventory control, as well as reduce the time sales staff spend on administrative tasks and increase time spent on sales activities.
All stores are supported by the internally developed Store Information System, which includes electronic point of sale (“EPOS”) processing, in-house credit authorization and support, a district manager information system and constant broadband connectivity for all retail locations for data communications including e-mail. The EPOS system updates sales, in-house credit and perpetual inventory replenishment systems throughout the day for each store.
US Regulation
The US division is required to comply with numerous US federal and state laws and regulations covering areas such as consumer protection, consumer privacy, consumer credit (including the Truth in Lending Act, see above), consumer credit insurance, truth in advertising and employment legislation. Management monitors changes in these laws to ensure that its practices comply with applicable requirements.
UK DIVISION
Movements in the US dollar to pound sterling exchange rate have an impact on the results of Signet as the UK division is managed in pounds sterling as sales and costs are both incurred in that currency, and its results are then translated into US dollars for external reporting purposes. The following information for the UK division is given in pounds sterling. Management believes that this presentation assists in the understanding of the performance of the UK division. The impact on reported US dollar figures of movements in pound sterling to the US dollar exchange rate is particularly marked in periods of exchange rate volatility. See Item 6 for analysis of results at constant exchange rates; non-GAAP measures.
UK market
The UK jewelry market grew at a compound rate of 3.7% per annum from 1997 to 2008 and grew by 2.6% in 2008, the last full year for which data is available (source: Office of National Statistics). Office of National Statistics figures are subject to frequent and sometimes large revisions. During 2009 revised figures were released that reduced the previous three year’s data by an average of 10.4%. In addition, management believes that Office of National Statistics data is of limited value in evaluating the market in which the UK division competes, due to the importance of the high end international jewelry retail business within the UK marketplace. Data for calendar 2009 is due to be published on March 30, 2010. Per capita spend on jewelry in the UK remains at approximately half of the level of the US.
22
Table of Contents
The performance of the UK jewelry market can also be judged from the volume of jewelry items containing gold hallmarked by Assay Offices in the UK. Hallmarking volumes grew at a compound rate of 2.2% from 1997 to 2008. The volume declined in 2008 by 34.2% and in 2009 by 32.6% (source: Assay Offices of Great Britain).
Market structure
The UK market includes specialty retail jewelers and general retailers who sell jewelry, such as catalog showrooms, department stores, supermarkets, mail order catalogs and internet based retailers. The retail jewelry market is very fragmented and competitive, with a substantial number of independent specialty jewelry retailers. From business directories, management believes there are approximately 7,300 specialty retail jewelry stores in the UK, a decrease of about 100 on the previous year.
In the middle market, H.Samuel competes with a large number of independent jewelers, only one of which has more than 100 stores. Some competition, at the lower end of the H.Samuel product range, also comes from a catalog showroom operator, discount jewelry retailers and supermarkets, many of whom have more stores than H.Samuel.
In the upper middle market, Ernest Jones competes with independent specialty retailers and a limited number of other upper middle market chains, the largest three of which had 143, 66 and 34 stores respectively at January 30, 2010.
UK Competitive Strengths
Store operations and human resources
The ability of the sales associate to explain the merchandise and its value is essential to most jewelry purchases
| • | Industry-leading training, granted third party accreditation, helps staff provide good customer service |
| • | 93% of store management have passed the Jewellery Education and Training Course 1 accredited by the National Association of Goldsmiths, demonstrating professionalism of staff. The UK division employs 32% of the total number of people that have passed this qualification |
| • | Management trained to support sales associate development programs and build general management skills |
| • | Commission based compensation program developed to improve recruitment and retention of high quality staff |
Merchandising
Consumer offered greater value and selection
| • | Leading supply chain capability in the UK jewelry sector, which provides better value to the customer |
| • | Responsive demand-driven merchandise systems enable swifter responses to changes in customer behavior |
| • | Scale to offer exclusive products which improves differentiation from competitors |
| • | 24 hour re-supply capability means items wanted by customers are more likely to be in stock |
Marketing
Leading brands in middle market sector
| • | Ability to leverage brand perception through scale of marketing spend |
23
Table of Contents
| • | Leading integrated e-commerce and retail store service within the specialty jewelry sector |
| • | Marketing database of over 14 million names enables extensive customer relationship marketing |
| • | H.Samuel is the only specialty jeweler using national TV advertising |
Real estate
Well designed stores in primary locations with high visibility and traffic flows
| • | Strict real estate criteria consistently applied over time has resulted in a high-quality store base |
| • | Revised store format, more suited to selling diamonds, fine jewelry and watches |
| • | Signet’s high store productivity and financial strength make it an attractive tenant to landlords |
UK Brand Reviews
Sales data by brand
| Change on previous year | |||||||||||||||||||
| Fiscal 2010 |
Sales | Average unit selling price |
Reported sales |
Sales at constant exchange rates |
Same store sales |
Average selling price |
|||||||||||||
| H.Samuel |
£ | 247.8m | £ | 52 | (10.0 | )% | (1.0 | )% | (1.7 | )% | 7.8 | % | |||||||
| Ernest Jones |
£ | 209.8m | £ | 228 | (1) | (8.5 | )% | 0.7 | % | (3.2 | )% | 12.5 | %(1) | ||||||
| Other |
£ | 3.6m | n/a | n/a | n/a | n/a | n/a | ||||||||||||
| UK |
£ | 461.2m | £ | 78 | (9.3 | )% | (0.1 | )% | (2.4 | )% | 5.5 | % | |||||||
| (1) | Excludes the charm bracelet category |
H.Samuel
H.Samuel accounted for 12% of Signet’s sales in fiscal 2010 (fiscal 2009: 13%), and is the largest specialty retail jewelry chain in the UK with an approximate 6% share of the total jewelry market. With nearly 150 years of jewelry heritage, it serves the core middle market and its customers typically have an annual household income of between £15,000 and £40,000. It sells a broad range of gold and silver jewelry, an increasing proportion of diamond merchandise and a wide selection of watches, including Accurist, Citizen, DKNY, Guess, Rotary, Sekonda and Seksy. It also sells an increasingly focused range of gifts and collectables such as Nao and Swarovski.
H.Samuel had 347 stores at January 30, 2010 (January 31, 2009: 352) and is represented in nearly all large and most medium sized shopping centers, with an increasing focus on larger centers. Since September 2005, it has had an e-commerce capability, www.hsamuel.co.uk, which is the most visited UK specialty jewelry website (source: Hitwise).
In fiscal 2010, H.Samuel sales were £247.8 million (fiscal 2009: £250.3 million). E-commerce sales grew strongly but remain small in the context of the division. The average retail price of merchandise sold in H.Samuel was £52 (fiscal 2009: £48), and sales per store decreased to £712,000 (fiscal 2009: £718,000). The typical store selling space continues to be 1,100 square feet.
| Fiscal 2010 |
Fiscal 2009 |
Fiscal 2008 |
Fiscal 2007(1) |
Fiscal 2006 | |||||||||||
| Sales (million) |
£ | 247.8 | £ | 250.3 | £ | 256.7 | £ | 260.8 | £ | 256.2 | |||||
| Stores at year end |
347 | 352 | 359 | 375 | 386 | ||||||||||
| (1) | 53 week year. |
24
Table of Contents
H.Samuel store data
| Fiscal 2010 |
Fiscal 2009 |
Fiscal 2008 |
||||||||||
| Number of stores: |
||||||||||||
| Opened during the year |
— | 5 | 1 | |||||||||
| Closed during the year |
(5 | ) | (12 | ) | (17 | ) | ||||||
| Open at year end |
347 | 352 | 359 | |||||||||
| Percentage (decrease)/increase in same store sales |
(1.7 | )% | (2.6 | )% | 1.3 | % | ||||||
| Average sales per store in thousands(1) |
£ | 712 | £ | 718 | £ | 722 | ||||||
| (1) | Including only stores operated for the full fiscal year. |
Customer service is an increasingly key point of differentiation for H.Samuel and therefore staff training remains a priority. Historically the brand’s customers self selected merchandise from window displays and primarily required a ‘cash and wrap’ service. Over the last nine years a more open store design was implemented and at January 30, 2010, 253 stores accounting for 80% of sales traded in this format. This is reflected in an increase over time in diamond jewelry and watch sales in the merchandise mix, and a rise in the average selling price.
Merchandising initiatives to increase further the differentiation of H.Samuel stores and to reinforce the brand perception as a specialty jeweler continue.
H.Samuel merchandise mix (excluding repairs, warranty and other miscellaneous sales)
| Fiscal 2010 |
Fiscal 2009(1) |
Fiscal 2008(1) | ||||
| % | % | % | ||||
| Diamonds and diamond jewelry |
22 | 22 | 22 | |||
| Gold and silver jewelry, including charms |
28 | 27 | 28 | |||
| Other jewelry |
13 | 13 | 12 | |||
| Watches |
25 | 26 | 25 | |||
| Gifts and other |
12 | 12 | 13 | |||
| 100 | 100 | 100 | ||||
| (1) | The fiscal 2008 and 2009 figures have been restated due to a reallocation by the UK division of certain merchandise between categories. |
In fiscal 2010, H.Samuel used national television advertising supplemented by advertising in national newspapers, catalog distributions and customer relationship marketing during the Christmas season. For the remainder of the year, a series of themed catalogs displayed in stores, mailed directly to targeted customers and distributed in newspapers, together with customer relationship marketing were the primary forms of marketing.
In fiscal 2010, two refits or resites were completed (fiscal 2009: 15) and 42 stores were redecorated (fiscal 2009: 27). Five refits or resites and 65 store redecorations are planned in fiscal 2011. The cost of store refurbishment has decreased significantly as the structural cost of removing window-based displays, to create the more open customer oriented store design, is not being repeated. In addition, the period of time between store refits is longer for the customer oriented store format.
H.Samuel has increasingly focused on bigger stores in larger shopping destinations, where it is better able to offer more specialist customer service and a wider range of jewelry, and benefit from the more open format. This reflects changing shopping patterns of customers. The number of H.Samuel stores in smaller markets has therefore declined as leases expire or suitable real estate transactions became available. Over the last five years there has been a reduction of 51 stores and about ten are planned to close in fiscal 2011.
25
Table of Contents
Ernest Jones
Ernest Jones accounted for 10% of Signet’s sales in fiscal 2010 (fiscal 2009: 11%), and is the second largest specialty retail jewelry brand in the UK with an approximate 5% share of the total jewelry market. It serves the upper middle market and its customers typically have an annual household income of between £30,000 and £50,000. Ernest Jones sells a broad range of diamond and gold jewelry as well as prestige watches such as Baume & Mercier, Breitling, Cartier, Hamilton, Longines, Omega, Rado, Raymond Weil, Rolex and Tag Heuer. It also sells contemporary fashion watches such as Burberry, DKNY, Emporio Armani, Gucci, Hugo Boss, and a range of traditional watches including Rotary, Seiko and Tissot.
Ernest Jones had 205 stores at January 30, 2010 (January 31, 2009: 206) and is represented in nearly all large shopping centers. The typical store selling space continues to be 900 square feet. Since September 2006, Ernest Jones has had an e-commerce capability, www.ernestjones.co.uk, which is the second most visited UK specialty jewelry website (source: Hitwise).
Where local market size and merchandise considerations allow, a two-site strategy is followed using the Leslie Davis trading name. While having a similar customer profile to Ernest Jones, Leslie Davis is differentiated where possible by its product offer. There were 15 Leslie Davis stores at January 30, 2010 (January 31, 2009: 15).
In fiscal 2010, Ernest Jones sales were £209.8 million (fiscal 2009: £208.3 million). E-commerce is showing good growth although it accounted for only a small proportion of sales. Sales per store were £1,027,000 (fiscal 2009: £1,047,000) and the average selling price was £228 (fiscal 2009: £203) excluding the charm bracelet category that was significantly expanded in the second half of fiscal 2010 and has a much lower average selling price and higher purchase frequency than is typical in Ernest Jones.
| Fiscal 2010 |
Fiscal 2009 |
Fiscal 2008 |
Fiscal 2007(1) |
Fiscal 2006 | |||||||||||
| Sales (million) |
£ | 209.8 | £ | 208.3 | £ | 219.4 | £ | 217.6 | £ | 208.5 | |||||
| Stores at year end |
205 | 206 | 204 | 206 | 207 | ||||||||||
| (1) | 53 week year. |
Ernest Jones store data(1)
| Fiscal 2010 |
Fiscal 2009 |
Fiscal 2008 |
||||||||||
| Number of stores: |
||||||||||||
| Opened during the year |
1 | 5 | — | |||||||||
| Closed during the year |
(2 | ) | (3 | ) | (2 | ) | ||||||
| Open at year end |
205 | 206 | 204 | |||||||||
| Percentage (decrease)/increase in same store sales |
(3.2 | )% | (4.0 | )% | 2.9 | % | ||||||
| Average sales per store in thousands(2) |
£ | 1,027 | £ | 1,047 | £ | 1,105 | ||||||
| (1) | Including Leslie Davis stores. |
| (2) | Including only stores operated for the full fiscal year. |
During fiscal 2010, a further 17 stores (including one new store) were converted to an enhanced store design. Increased emphasis was again placed on customer relationship marketing. The quality of staff training was further improved, with over 46% of Ernest Jones staff having gained an externally recognized jewelry industry qualification.
Watch participation in the merchandise mix was 35% and Ernest Jones continues to develop its relationships with leading watch distributors. Diamond jewelry sales were 39% (fiscal 2009: 40%).
26
Table of Contents
Ernest Jones merchandise mix (excluding repairs, warranty and other miscellaneous sales)
| Fiscal 2010 |
Fiscal 2009(1) |
Fiscal 2008(1) | ||||
| % | % | % | ||||
| Diamonds and diamond jewelry |
39 | 40 | 41 | |||
| Gold and silver jewelry, including charms |
14 | 13 | 14 | |||
| Other jewelry |
10 | 10 | 9 | |||
| Watches |
35 | 35 | 33 | |||
| Gifts and other |
2 | 2 | 3 | |||
| 100 | 100 | 100 | ||||
| (1) | The fiscal 2008 and 2009 figures have been restated due to a reallocation of certain merchandise between categories. |
During fiscal 2010, 16 refits and resites were completed (fiscal 2009: 31 refits and resites were completed, including two Leslie Davis stores). At January 30, 2010, 99 stores (January 31, 2009: 82), accounting for 63% of sales, traded in the more open format, including 58 in the enhanced design (January 31, 2009: 41), which had been successfully tested in fiscal 2008. This design increases the differentiation of the Ernest Jones stores from other specialty jewelers. 18 refits and resites are planned for fiscal 2011. In addition, 19 redecorations are planned (fiscal 2010: five).
The number of Ernest Jones stores has been broadly stable over the last five years and is expected to decline by about five in fiscal 2011. While locations would be considered for new stores, it would depend on the availability of both suitable sites and prestige watch agencies and none are planned in fiscal 2011.
UK Functional Review
Operating Structure
Signet’s UK division operates as two brands with a single support structure and distribution center.
UK Customer Service and Human Resources
Management regards customer service as an essential element in the success of its business, and the division’s scale enables it to invest in industry-leading training. The Signet Jewellery Academy, a multi-year program and framework for training and developing standards of capability, is operated for all store staff. It utilizes a training system developed by the division called the “Amazing Customer Experience” (“ACE”). An ACE Index customer feedback survey gives a reflection of customers’ experiences and forms part of the monthly performance statistics that are monitored on a store by store basis. In fiscal 2010, the UK division implemented an improved staff coaching methodology.
The UK divisional head office staff numbers were reduced in early fiscal 2010 as part of a cost reduction program. Store staff hours continued to be flexed, where possible, to reflect sales volumes.
UK Merchandising and Purchasing
Management believes that the UK division’s leading position in the UK jewelry sector is an advantage when sourcing merchandise, enabling delivery of better value to the customer. An example of this is its capacity to contract with jewelry manufacturers to assemble products, utilizing directly sourced gold and diamonds. In addition, the UK division has the scale to utilize sophisticated merchandising systems to test, track, forecast and respond to consumer preferences. The vast majority of inventory is held at stores rather than in the central distribution facility.
The UK division sells an extensive range of merchandise including gold and silver jewelry, watches, diamond and gemstone set jewelry and gifts. As with other UK specialty retail jewelers, most jewelry sold is 9 carat gold.
27
Table of Contents
Average merchandise unit selling price (£)
| Fiscal 2010 |
Fiscal 2009 |
Fiscal 2008 |
Fiscal 2007 |
Fiscal 2006 | ||||||
| H. Samuel |
52 | 48 | 44 | 42 | 38 | |||||
| Ernest Jones(1) |
228 | 203 | 180 | 163 | 148 |
| (1) | Excluding the charm bracelet category |
Merchandise Mix
The average unit selling price increased by 6% in fiscal 2010, reflecting price increases implemented during fiscal 2010 and merchandise mix changes. Value items and the charm bracelet category performed well.
UK division merchandise mix (excluding repairs, warranty and other miscellaneous sales)
| Fiscal 2010 |
Fiscal 2009(1) |
Fiscal 2008(1) | ||||
| % | % | % | ||||
| Diamonds and diamond jewelry |
30 | 30 | 31 | |||
| Gold and silver jewelry, including charms |
22 | 21 | 21 | |||
| Other jewelry |
11 | 11 | 11 | |||
| Watches |
30 | 30 | 29 | |||
| Gifts and other |
7 | 8 | 8 | |||
| 100 | 100 | 100 | ||||
| (1) | The fiscal 2008 and 2009 figures have been restated due to a reallocation by the UK division of certain merchandise between categories. |
Direct sourcing
The UK division employs contract manufacturers for approximately 23% (fiscal 2009: 26%) of the diamond merchandise sold, thereby achieving cost savings. The decline in contract manufacturing reflected the strategy to grow value items, which were directly sourced from manufacturers. Approximately 20% of the UK business’s gold jewelry is manufactured on a contract basis through a buying office in Vicenza, Italy.
Suppliers
Merchandise is purchased from a range of suppliers and manufacturers and economies of scale and buying power continued to be achieved by combining the purchases of H.Samuel and Ernest Jones. In fiscal 2010, the five largest of these suppliers (three watch and two jewelry) together accounted for approximately 30% of total UK division purchases (fiscal 2009: approximately 30%), with the largest accounting for around 6%.
Foreign exchange
Fine gold and loose diamonds account for about 20% and 10% respectively of the merchandise cost of goods sold. The prices of these are determined by international markets and the pound sterling to US dollar exchange rate. The other major category of goods purchased are watches and the pound sterling to Swiss franc has an important influence on their cost. In total, between 20% to 25% of cost of goods purchased are made in US dollars. The pound sterling to US dollar exchange rate also has a significant indirect impact on the UK division’s cost of goods sold for other purchases. The price of fine gold in pounds sterling increased substantially during fiscal 2010 due to substantial increases in the dollar gold price and weakness of the pound sterling against the US dollar. The weakness in the pound sterling also adversely impacted the cost of diamonds and many other merchandise items. To largely mitigate these higher costs, the UK division increased prices.
28
Table of Contents
UK Marketing and Advertising
The UK division has strong, well-established brands and leverages them with advertising (television, print and online), catalogs and the development of customer relationship marketing techniques. Few of its competitors have sufficient scale to utilize all these marketing methods successfully. Marketing campaigns are designed to reinforce and develop further the distinct brand identities. The campaigns for both brands aim to expand the overall customer base and improve customer loyalty. The UK division’s five year record of gross advertising spend is given below:
| Fiscal 2010 |
Fiscal 2009 |
Fiscal 2008 |
Fiscal 2007(1) |
Fiscal 2006 | |||||||||||
| Gross advertising spend (million) |
£ | 10.2 | £ | 12.6 | £ | 14.6 | £ | 14.6 | £ | 15.1 | |||||
| Percent to sales (%) |
2.2 | 2.8 | 3.1 | 3.1 | 3.2 | ||||||||||
| (1) | 53 week year. |
Gross marketing spend was reduced by 19% to £10.2 million (fiscal 2009: £12.6 million), the ratio to sales being 2.2% (fiscal 2009: 2.8%). While this may have had an adverse impact on the sales of H.Samuel, management believes that there was a positive impact on profitability. H.Samuel continued to use television advertising in the fourth quarter and expanded customer relationship marketing. For Ernest Jones, expenditure was focused on customer relationship marketing. Catalogs remain an important marketing tool for both H.Samuel and Ernest Jones. The e-commerce capabilities of both H.Samuel and Ernest Jones were enhanced during the year and their websites are the two most visited specialty jewelry websites in the UK (source: Hitwise).
UK Real Estate
In fiscal 2010, total store capital expenditure was £6.7 million (fiscal 2009: £18.4 million), as a result of a lower level of store refurbishment reflecting the uncertainty of investment proposals achieving the required return for authorization in the current economic environment. At January 30, 2010, 64% of the UK division’s stores (January 31, 2009: 60% of stores) were trading in the open consumer oriented format, and there were 347 H.Samuel stores (January 31, 2009: 352) and 205 Ernest Jones stores (January 31, 2009: 206). In fiscal 2011, store fixed capital investment is planned to be about £9 million.
Recent and planned investment in the store portfolio is set out below:
| Fiscal 2011 planned |
Fiscal 2010 |
Fiscal 2009 |
Fiscal 2008 | ||||||||
| Major store refurbishments and relocations |
23 | 18 | 46 | 27 | |||||||
| New H.Samuel stores |
— | — | 4 | 1 | |||||||
| New Ernest Jones stores |
— | 1 | 5 | — | |||||||
| Store fixed capital investment |
~£9m | £ | 7m | £ | 18m | £ | 9m | ||||
UK Insurance Loss Replacement Business
While substantially all the UK division’s sales are made directly to the consumer, management believes, based on its knowledge of the industry, that Signet is the leading UK jewelry retailer in the insurance loss replacement business. This involves the settlement of insurance claims by product replacement through jewelry stores rather than by cash settlements from the insurance company. A lower gross margin is earned on these transactions than on sales to individual customers. However, the UK division benefits from the resulting higher level of sales, greater customer traffic in the stores and the opportunity to create and build relationships with new customers. Given its nationwide store portfolio, breadth of product range and ability to invest in systems to support the business, the UK division has benefited from insurance companies settling claims in this manner. In fiscal 2010, the proportion of sales value generated from the insurance loss replacement business increased, but remains small in the context of the division.
29
Table of Contents
UK Customer Finance
Following a successful test in early fiscal 2008, the UK division rolled out an enhanced third party own-label customer finance program. The program continued to grow in fiscal 2009 and fiscal 2010. The card is administered and funded by, and default risk resides with, a third party. The UK division pays a fee for this facility based on a percentage of the transaction value, which varies depending on which credit option is taken by the customer. In fiscal 2010, approximately 5% (fiscal 2009: 4%) of the division’s sales value was made through the customer finance program. Signet does not provide this service itself as the demand for customer finance is of insufficient scale. Bank credit card sales, which are treated as cash transactions, accounted for approximately 35% of sales (fiscal 2009: 31%).
UK Management Tools and Communications
EPOS equipment, retail management systems, purchase order management systems and merchandise planning processes are in place to support financial management, inventory planning and control, purchasing, merchandising, replenishment and distribution and can usually ensure replacement within 48 hours of any merchandise sold.
A perpetual inventory process allows store managers to check inventory by product category. These systems are designed to assist in the control of shrinkage, fraud prevention, financial analysis of retail operations, merchandising and inventory control.
UK Regulation
Various laws and regulations affect Signet’s UK operations. These cover areas such as consumer protection, consumer credit, data protection, health and safety, waste disposal, employment legislation and planning and development standards. Management monitors changes in these laws with a view to ensuring that Signet’s practices comply with legal requirements.
AVAILABLE INFORMATION
Since February 1, 2010, Signet files annual reports on Form 10-K, quarterly reports on Form 10-Q, current reports on Form 8-K, proxy statements and other information with the SEC. Prior to January 31, 2010, Signet filed annual reports on Form 20-F and other reports on Form 6-K. Such information, and amendments to reports previously filed or furnished, is available free of charge from our corporate website, www.signetjewelers.com, as soon as reasonably practicable after such materials are filed with or furnished to the SEC.
30
Table of Contents
| ITEM 1A. | RISK FACTORS |
Spending on goods that are, or are perceived to be “luxuries”, such as jewelry, is discretionary and is affected by general economic conditions. Therefore adverse changes in the economy may unfavorably impact Signet’s sales and earnings
Jewelry purchases are discretionary and are dependent on general economic conditions, particularly as jewelry is often perceived to be a luxury purchase. Adverse changes in the economy and periods when discretionary spending by consumers may be under pressure, such as those currently being experienced, may unfavorably impact sales and earnings.
The success of Signet’s operations depends to a significant extent upon a number of factors relating to discretionary consumer spending. These include economic conditions, and perceptions of such conditions by consumers, consumer confidence, employment, the rate of change in employment, the level of consumers’ disposable income and income available for discretionary expenditure, the savings ratio, business conditions, interest rates, consumer debt and asset values, availability of credit and levels of taxation for the economy as a whole and in regional and local markets where it operates.
About half of US sales are made utilizing credit provided by Signet. Therefore any deterioration in the consumers’ financial position could adversely impact sales and earnings
Any significant deterioration in general economic conditions or increase in consumer debt levels may inhibit consumers’ use of credit and decrease the consumers’ ability to satisfy Signet’s requirement to authorize credit and could in turn have an adverse effect on the US division’s sales. Furthermore, any downturn in general or local economic conditions, in particular an increase in unemployment, in the markets in which the US division operates may adversely affect its collection of outstanding credit accounts receivable, its net bad debt charge and hence earnings.
Changes to the regulatory requirements regarding the granting of credit to customers could adversely impact sales and operating income
About half of US sales utilize in-house customer financing programs and about a further 39 per cent of purchases are made using third party credit cards. The ability to extend credit to customers and the terms on which it is achieved depends on many factors, including compliance with applicable state and federal laws and regulations, any of which may change from time to time, and any change in regulations, or the application of regulations, relating to the provision of credit and associated services could adversely affect sales and income. In the US, certain new provisions of the Truth in Lending Act became effective on February 22, 2010 with further provisions expected to be introduced in August 2010, which limit the US division’s ability to charge fees and interest in relation to the provision of customer financing. Management estimates that this will have an adverse impact on operating income of between $15 million and $20 million in fiscal 2011 and by $20 million and $25 million in a full year. In addition, other restrictions and regulations arising from applicable law could cause limitations in credit terms currently offered or a reduction in the level of credit granted by the US division, or by third parties and this could adversely impact sales, income or cash flow, as could any reduction in the level of credit granted by the US division, or by third parties, as a result of the restrictions placed on fees and interest charged.
Signet’s share price may be volatile
Signet’s share price may fluctuate substantially as a result of variations in the actual or anticipated financial results and financing conditions of Signet and of other companies in the retail industry. In addition, the stock market has experienced price and volume fluctuations that have affected the market price of many retail and other shares in a manner unrelated, or disproportionate to, the operating performance of these companies.
31
Table of Contents
Restrictions on the Signet’s ability to make distributions to shareholders may adversely impact the share price
In light of the adverse impact of the economic downturn on Signet’s financial performance, and the outlook in the medium term, in January 2009, the Board decided that it was inappropriate to make any form of distribution to shareholders. In addition, the amended revolving credit facility agreement and amended note purchase agreement entered into on March 13, 2009 contain terms that prohibit the Company from making distributions to shareholders (see page 77) until February 2011. Thereafter, until the private placement notes have been repaid there are restrictions on the Company’s ability to make shareholder distributions. As such, the Company can give no assurances that any form of distribution will be made to shareholders in the medium term.
The concentration of a significant proportion of sales and an even larger share of profits in the fourth quarter means results are dependent on the performance during that period
Signet’s business is highly seasonal, with a significant proportion of its sales and operating profit generated during its fourth quarter, which includes the Christmas season. Management expects to continue to experience a seasonal fluctuation in its sales and earnings. Therefore there is limited ability to compensate for shortfalls in fourth quarter sales or earnings by changes in its operations and strategies in other quarters, or to recover from any extensive disruption, for example due to sudden adverse changes in consumer confidence, inclement weather conditions having an impact on a significant number of stores in the last few days immediately before Christmas Day or disruption to warehousing and store replenishment systems. A significant shortfall in results for the fourth quarter of any fiscal year would therefore be expected to have a material adverse effect on the annual results of operations. Disruption at lesser peaks in sales at Valentine’s Day and Mother’s Day would impact the results to a lesser extent.
Signet is dependent upon the availability of equity and debt financing to fund its operations
While Signet has a strong balance sheet with significant cash balances and available lines of credit, it is dependent upon, to some extent, the availability of equity and debt financing to help fund its operations and growth. If Signet’s access to capital were to become significantly constrained, its financing costs would likely increase, its financial condition would be harmed and future results of operations could be adversely affected. The changes in general credit market conditions also affect Signet’s ability to arrange, and the cost of arranging, credit facilities.
Management prepares annual budgets, medium term plans and headroom models which help to identify the future capital requirements, so that appropriate facilities can be put in place on a timely basis. If these models are inaccurate, adequate facilities may not be available.
Signet’s borrowing agreements include various financial covenants and operating restrictions. A material deterioration in its financial performance could result in a covenant being breached. If Signet were to breach a financial covenant it would have to renegotiate its terms with current lenders or find alternative sources of finance if current lenders required early repayment.
In addition, Signet’s reputation in the financial markets and its corporate governance practices can influence the availability of capital, the cost of capital and its share price.
As Signet has material cash balances, it is exposed to counter party risks
At January 30, 2010, Signet had cash and cash equivalents of $316.2 million (January 31, 2009: $96.8 million). These balances are predominantly held in ‘AAA’ rated liquidity funds and also with various banks.
If a liquidity fund were to default or one of the banks were to become bankrupt, Signet may be unable to recover these amounts or obtain access to them in a timely manner.
32
Table of Contents
Movements in the pound sterling to US dollar exchange rates impact the results and balance sheet of Signet
Signet publishes its consolidated annual financial statements in US dollars. It held approximately 87% of its total assets in US dollars at January 30, 2010 and generated approximately 78% of its sales and 85% of its operating income in US dollars for the fiscal year then ended. The remainder of Signet’s assets, sales and operating income are in the UK. Therefore its results and balance sheet are subject to fluctuations in the exchange rate between the pound sterling and the US dollar. Accordingly, any decrease in the weighted average value of the pound sterling against the US dollar would decrease reported sales and operating income.
The average exchange rate is used to prepare the income statement and is calculated from the weekly average exchange rates weighted by sales of the UK Division. As a result, Signet’s results are particularly impacted by movements in the fourth quarter of its fiscal year, with the exchange rate in the first three weeks of December having the largest impact on the average exchange rate used. A movement in the year to date exchange rate from that in the prior quarter in a particular fiscal year will result in that quarter’s results being impacted by adjustments to sales and costs in prior quarters to reflect the changed year to date exchange rate. This can have a particularly noticeable impact on results for the third quarter. In addition, as the UK division’s selling, general and administrative expenses are spread more evenly between quarters than its sales, these expenses can be particularly impacted in the fourth quarter.
Where pounds sterling are held or used to fund the cash flow requirements of the business, any decrease in the weighted average value of the pound sterling against the US dollar would reduce the amount of consolidated cash and cash equivalents and increase the amount of consolidated borrowings.
In addition, the prices of materials and certain products bought on the international markets by the UK division are denominated in US dollars, and therefore the division has an exposure to exchange rate fluctuations on the cost of goods sold.
Fluctuations in the availability and pricing of polished diamonds and gold, which account for the majority of Signet’s merchandise costs, could adversely impact its earnings
The jewelry industry generally is affected by fluctuations in the price and supply of diamonds, gold and, to a lesser extent, other precious and semi-precious metals and stones.
An inability to increase retail prices to reflect higher commodity costs would result in lower profitability. Historically jewelry retailers have been able, over time, to increase prices to reflect changes in commodity costs. However, particularly sharp increases and volatility in commodity costs usually result in a time lag before increased commodity costs are fully reflected in retail prices. There is no certainty that such price increases will be sustainable, so downward pressure on gross merchandise margins (see page 57 for definition) and earnings may occur.
Diamonds are the largest product category sold by Signet. The supply and price of diamonds in the principal world markets are significantly influenced by a single entity—the Diamond Trading Company (“DTC”), a subsidiary of De Beers Consolidated Mines Limited. The DTC’s share of the diamond supply chain has decreased over recent years and this may result in more volatility in rough diamond prices.
The availability of diamonds is to some extent dependent on the political situation in diamond producing countries. Until alternative sources can be developed, any sustained interruption in the supply of diamonds from the significant producing countries could adversely affect Signet and the retail jewelry industry as a whole.
Due to the sharp decline in demand for diamonds in the second half of fiscal 2009 and in the first six months of fiscal 2010, particularly in the US which accounts for about 40% of worldwide demand, the supply chain was overstocked with polished diamonds. Combined with the reduced levels of credit availability, the over supply of
33
Table of Contents
diamonds resulted in decreases in the price of loose polished diamonds of all sizes and qualities. This was particularly marked in diamonds larger, and of better quality, than the type that Signet typically purchases. In the fourth quarter of fiscal 2010, the price of polished diamonds purchased by Signet increased but remained below the level of fiscal 2009. The cost of diamonds may increase further during fiscal 2011.
As a result of the overstocked position many major rough diamond producers very significantly reduced the supply of rough diamonds, particularly in the first half of fiscal 2010. The future level of supply of rough diamonds and the demand for polished diamonds is unknown, and this could result in volatility in the cost of diamonds to Signet.
It is forecast that over the medium and longer term, the demand for diamonds will probably increase faster than the growth in supply; therefore the cost of diamonds is anticipated to rise over time, although short term fluctuations in price may occur.
While jewelry manufacture is the major final demand for gold, the cost of gold is currently driven by investment transactions which have resulted in a significant increase in its cost. Therefore Signet’s cost of merchandise and potentially its earnings may be adversely impacted by investment market considerations.
The failure to satisfy the accounting requirements for ‘hedge accounting’, or default or bankruptcy of a counter party to a hedging contract, could adversely impact results
Signet hedges some of its purchases of gold and US dollar requirements of its UK division. The failure to satisfy the requirements of the appropriate accounting requirements, or default or bankruptcy of a counterparty to a contract, could increase the volatility of results and may impact the timing of recognition of gains and losses in the income statement.
The inability of Signet to obtain merchandise that customers wish to purchase, particularly ahead of, and during, the fourth quarter, would adversely impact sales
The abrupt loss or disruption of any significant supplier during the three month period (August to October) leading up to the fourth quarter would result in a material adverse effect on Signet’s business. The sharp downturn in world diamond sales, the increased level of bankruptcies among jewelry retailers and the considerable worldwide tightening in credit availability has increased the probability that a supplier may cease trading.
Also, if management misjudges expected customer demand, or fails to identify such changes and its supply chain does not respond in a timely manner, it could adversely impact Signet’s results by causing either a shortage of merchandise or an accumulation of excess inventory.
Signet benefits from close commercial relationships with a number of suppliers. Damage to, or loss of, any of these relationships could have a detrimental effect on results. Management holds regular reviews with major suppliers. Signet’s most significant supplier accounts for 5% of merchandise.
The luxury and prestige watch manufacturers and distributors normally grant agencies to sell their ranges on a store by store basis, and most of the leading brands have been steadily reducing the number of agencies over recent years. The watch brands sold by Ernest Jones, and to a lesser extent Jared, help attract customers and build sales in all categories. Therefore an inability to obtain or retain watch agencies for a location could harm the performance of that particular store. In the case of Ernest Jones, the inability to gain additional prestige watch agencies is an important factor in, and does reduce the likelihood of, opening new stores, which could adversely impact sales growth.
34
Table of Contents
An inability to recruit, train and retain suitably qualified staff could adversely impact sales and earnings
In specialty jewelry retailing, the level and quality of customer service is a key competitive factor as nearly every in-store transaction involves the sales associate taking a piece of jewelry or a watch out of a display case and presenting it to the potential customer. Therefore an inability to recruit, train and retain suitably qualified sales staff could adversely impact sales and earnings.
Loss of confidence by consumers in Signet’s brand names, poor execution of marketing programs and reduced marketing expenditure could have a detrimental impact on sales
Primary factors in determining customer buying decisions in the jewelry sector include customer confidence in the retailer together with the level and quality of customer service. The ability to differentiate Signet’s stores from competitors by its branding, marketing and advertising programs is an important factor in attracting consumers. If these programs are poorly executed or the level of support for them is reduced, it could harm the ability of Signet to attract customers.
The DTC promotes diamonds and diamond jewelry in the US. The level of support provided by the DTC and the success of the promotions influence the size of the total jewelry market in the US. As the DTC’s market share has significantly reduced, it is changing its approach from generic marketing support of diamonds to one more closely associated with its own efforts to develop a brand such as the “Forevermark” and “Everlon.” The impact of the loss of generic marketing support is currently unknown and could unfavorably impact the overall market for diamonds and diamond jewelry and adversely impact sales and earnings.
The retail jewelry industry is highly fragmented and competitive. Aggressive discounting or “going out of business sales” by competitors may adversely impact Signet’s performance in the short term
The retail jewelry industry is competitive. If Signet’s competitive position deteriorates, operating results or financial condition could be adversely affected.
Aggressive discounting by competitors, particularly those facing financial pressures or holding ‘going out of business sales’, may adversely impact Signet’s performance in the short term. This is particularly the case for easily comparable pieces of jewelry, of similar quality, sold through stores that are situated near to those that Signet operates. Management believes that a further above normal reduction in the number of US specialty jewelry stores is likely in fiscal 2011 and that further restructuring within the sector may occur which could result in aggressive discounting of competitors’ merchandise. In particular, Signet’s largest specialty jewelry competitor in the US, Zale Corporation, reported in its Quarterly Report on Form 10-Q filed on March 11, 2010 that “Based on our cash flow projections for the remainder of calendar 2010, we may not have sufficient liquidity to meet our operating needs.” The impact of all the foregoing on the competitive environment in which Signet operates is uncertain.
As a result of the growth of Jared and the development of Kay outside of its enclosed mall base, the US division is increasingly competing with independent specialty jewelry retailers that are able to adjust their competitive stance, for example on pricing, to local market conditions. This can put individual stores at a competitive disadvantage as the US division has a national pricing strategy.
Price increases may have an adverse impact on Signet’s performance
If significant price increases are implemented by either division across a wide range of merchandise, the impact on earnings will depend on, among other factors, the pricing by competitors of similar products and the response by the consumer to higher prices. Such price increases may result in lower achieved gross merchandise margin dollars and adversely impact earnings.
While Signet’s major competitors are other specialty jewelers, Signet also faces competition from other retailers including department stores, discount stores, apparel outlets and internet retailers that sell jewelry. In addition,
35
Table of Contents
other retail categories, for example electronics, and other forms of expenditure, such as travel, also compete for consumers’ discretionary expenditure. This is particularly so during the Christmas gift giving season. Therefore the price of jewelry relative to other products influences the proportion of consumers’ expenditure that is spent on jewelry. If the relative price of jewelry increases, Signet’s sales may decline.
Long term changes in consumer attitudes to jewelry could be unfavorable and harm jewelry sales
Consumer attitudes to diamonds, gold and other precious metals and gemstones also influence the level of Signet’s sales. Attitudes could be affected by a variety of issues including concern over the source of raw materials; the impact of mining and refining of minerals on the environment, the local community and the political stability of the producing country; labor conditions in the supply chain; and the availability and consumer attitudes to substitute products such as cubic zirconia, moissanite and of laboratory created diamonds. A negative change in consumer attitudes to jewelry could adversely impact sales.
The inability to rent stores that satisfy management’s operational and financial criteria could harm sales, as could changes in locations where customers shop
Signet’s results are dependent on a number of factors relating to its stores. These include the availability of desirable property, the demographic characteristics of the area around the store, the design and maintenance of the stores, the availability of attractive locations within the shopping center that also meet the operational and financial criteria of management, the terms of leases and its relationship with major landlords. The US division leases 16% of its store locations from Simon Property Group and 13% from General Growth Management. In fiscal 2010, Simon Property Group made an offer to acquire General Growth Management Inc. Signet has no other relationship with any lessor relating to 10% or more of its store locations. If Signet is unable to rent stores that satisfy its operational and financial criteria, or if there is a disruption in its relationship with its major landlords, sales could be adversely affected.
Given the length of property leases that Signet enters into, it is dependent upon the continued popularity of particular retail locations. As the US division continues to test and develop new types of store locations there can be no certainty as to their success.
The UK division has a more diverse range of store locations than in the US, including some exposure to smaller retail centers which do not justify the investment required to refurbish the site to the current store format. Consequently the UK division is gradually closing stores in such locations as leases expire or satisfactory property transactions can be executed; however the ability to secure such property transactions is not certain. As the UK division is already represented in nearly all major retail centers, a small annual decrease in store space is expected in the medium term which will adversely impact sales growth.
The rate of new store development is dependent on a number of factors including obtaining suitable real estate, the capital resources of Signet, the availability of appropriate staff and management and the level of the financial return on investment required by management.
Signet’s success is dependent on the strength and effectiveness of its relationships with its various stakeholders whose behavior may be affected by its management of social, ethical and environmental risks
Social, ethical and environmental matters influence Signet’s reputation, demand for merchandise by consumers, the ability to recruit staff, relations with suppliers and standing in the financial markets. Signet’s success is dependent on the strength and effectiveness of its relationships with its various stakeholders: customers, shareholders, employees and suppliers. In recent years, stakeholder expectations have increased and Signet’s success and reputation will depend on its ability to meet these higher expectations.
36
Table of Contents
Inadequacies in and disruption to internal controls and systems could result in lower sales and increased costs or adversely impact the reporting and control procedures
Signet is dependent on the suitability, reliability and durability of its systems and procedures, including its accounting, information technology, data protection, warehousing and distribution systems. If support ceased for a critical externally supplied software package, several of which are used in the UK division, management would have to implement an alternative software package or begin supporting the software internally. Disruption to parts of the business could result in lower sales and increased costs.
In fiscal 2011, the UK division is changing its external information technology services provider. This could give rise to system disruption.
In fiscal 2012, management plans to relocate various functions, such as external financial reporting, budgeting, management accounting and treasury functions from London, England to Akron, Ohio. This could result in a high level of staff turnover in those functions and disruption to systems which could adversely impact the control and accounting functions of Signet.
An adverse decision in legal proceedings could reduce earnings
In March 2008, private plaintiffs filed a class action lawsuit for an unspecified amount against Sterling Jewelers Inc. (“Sterling”), a subsidiary of Signet, in U.S. District Court for the Southern District of New York federal court. In September 2008, the US Equal Opportunities Commission filed a lawsuit against Sterling in U.S. District Court for the Western District of New York. Sterling denies the allegations from both parties and intends to defend them vigorously. If, however, it is unsuccessful in either defense, Sterling could be required to pay substantial damages.
Failure to comply with labor regulations could harm the business
Failure by Signet to comply with labor regulations could result in fines and legal actions. In addition, the ability to recruit and retain staff could be harmed.
Failure to comply with changes in law and regulations could adversely affect the business
Signet’s policies and procedures are designed to comply with all applicable laws and regulations. Changing legal and regulatory requirements (particularly in the US) have increased the complexity of the regulatory environment in which the business operates and the cost of compliance. Failure to comply with the various regulations may result in damage to Signet’s reputation, civil and criminal liability, fines and penalties, and further increase the cost of regulatory compliance.
Any difficulty integrating an acquisition or a business combination may result in expected returns and other projected benefits from such an exercise not being realized
While management does not currently contemplate any acquisition or business combination, Signet may in the future make acquisitions or be involved in a business combination. Any difficulty in integrating an acquisition or a business combination may result in expected returns and other projected benefits from such an exercise not being realized. A significant transaction could also disrupt the operation of its current activities. Signet’s borrowing agreements place constraints on its ability to make an acquisition or enter into a business combination.
Changes in assumptions used in calculating pension assets and liabilities may impact Signet’s results and balance sheet
In the UK, Signet operates a defined benefit pension scheme (the “Group Scheme”), which ceased to admit new employees in 2004. The valuation of the Group Scheme’s assets and liabilities partly depends on assumptions
37
Table of Contents
based on the financial markets as well as longevity and staff retention rates. This valuation is particularly sensitive to material changes in the value of equity investments held by the Group Scheme, changes in the UK AA rated corporate bond yields which are used in the measurement of the liabilities, changes in market expectations for long term price inflation and new evidence on projected longevity rates. Funding requirements and the income statement items relating to this closed Group Scheme are also influenced by these factors.
Under the UK Pensions Act 2004, the Pensions Regulator has powers to vary and impose funding arrangements that could be more onerous than may be agreed with or proposed to the trustees. In addition, the provisions of the Pensions Act 2004 may restrict Signet’s freedom to undertake certain re-organization steps or to effect returns on capital or unusual dividends without the prior agreement of the Group Scheme trustees, in consultation with the Pensions Regulator. A negative change in the assumptions used to calculate the value of pension assets and liabilities may adversely impact Signet’s results and balance sheet.
Loss of one or more key executive officers or employees could adversely impact performance, as could the appointment of an inappropriate successor or successors
Signet’s future success will depend substantially upon the ability of senior management and other key employees to implement the business strategy. While Signet has entered into employment contracts with such key personnel, the retention of their services cannot be guaranteed and the loss of such services, or the inability to attract and retain talented personnel, could have a material adverse effect on Signet’s ability to conduct its business. The Chief Executive has announced his intention to stand down on January 29, 2011, and the Group Finance Director has announced that he plans to retire at the conclusion of the Company’s Annual General Meeting to be held in June 2010.
The appointment of an appropriate successor to either of these positions could be challenging given Signet’s leadership position within the jewelry sector. Any outside appointment may not have the same level of experience in the jewelry sector as the retiring executives. However, internal appointments may have considerably less experience in managing a public company than an external appointment. In addition, there could be short term disruption during the transition period between senior executives and further management changes may occur as a result of an appointment.
Investors may face difficulties in enforcing proceedings against Signet Jewelers Limited as it is domiciled in Bermuda
It is doubtful whether courts in Bermuda would enforce judgments obtained by investors in other jurisdictions, including the US and the UK, against the Company or its directors or officers under the securities laws of those jurisdictions or entertain actions in Bermuda against the Company or its directors or officers under the securities laws of other jurisdictions.
| ITEM 1B. UNRESOLVED | STAFF COMMENTS |
Not applicable.
| ITEM 2. | PROPERTIES |
Signet attributes great importance to the location and appearance of its stores. Accordingly, in both Signet’s US and UK operations, investment decisions on selecting sites and refurbishing stores are made centrally, and strict real estate and investment criteria are applied.
US property
Substantially all of Signet’s US stores are leased. In addition to a minimum annual rental, the majority of mall stores are also liable to pay turnover related rent based on sales above a specified base level. In fiscal 2010, most
38
Table of Contents
of the division’s mall stores only made base rental payments. Under the terms of a typical lease, the US business is required to conform and maintain its usage to agreed standards, including meeting required advertising expenditure as a percentage of sales, and is responsible for its proportionate share of expenses associated with common area maintenance, utilities and taxes of the mall. The initial term of a mall store lease is generally ten years. Towards the end of a lease, management evaluates whether to renew a lease and refit the store, using the same operational and investment criteria as for a new store. Where management is uncertain whether the location will meet management’s required return on investment, but the store is profitable, the leases may be renewed for one to three years during which time the store’s performance is further evaluated. There are typically about 200 such mall brand stores at any one time. Jared stores are normally opened on 20 year leases with options to extend the lease, and rents are not turnover related. A refurbishment of a Jared store is normally undertaken every ten years. At January 30, 2010 the average unexpired lease term of US leased premises was six years and about half of leases had terms expiring within five years. The cost of refitting a store is similar to the cost of fitting out a new store which is typically between $330,000 and $390,000 for a mall location and between $850,000 and $1,250,000 for a Jared store. In fiscal 2009 and fiscal 2010, the level of new store openings was substantially below that in fiscal 2006, fiscal 2007 and fiscal 2008. Management expects that store openings in fiscal 2011 and fiscal 2012 will also be less than in fiscal 2006, fiscal 2007 and fiscal 2008. In fiscal 2010, the level of major store refurbishment was below that of recent years with 16 mall locations being completed (fiscal 2009: 38). It is anticipated that refurbishment activity will increase in fiscal 2011 to 52, including 22 Jared locations. The investment will be financed by cash flow from operating activities.
The US division leases 16% of its store locations from Simon Property Group and 13% from General Growth Management, Inc. In fiscal 2010, Simon Property Group made an offer to acquire General Growth Management Inc. The division has no other relationship with any lessor relating to 10% or more of its store locations.
During the past five fiscal years, the US business generally has been successful in renewing its store leases as they expire and has not experienced difficulty in securing suitable locations for its stores. No store lease is individually material to Signet’s US operations.
A 340,000 square foot head office and distribution facility is leased in Akron, Ohio. On February 2, 2007 a new 25 year lease was entered into for this facility. On January 1, 2007 a 25 year lease was entered into for an 86,000 square foot office building next door to the head office. Space surplus to Signet’s requirements in this building is currently sublet or is available to be sublet. A 19,000 square foot repair center was opened during fiscal 2006 and is owned by a subsidiary of Signet. There are no plans for any major capital expenditure related to the head office and distribution facilities.
UK property
At January 30, 2010, Signet’s UK division traded from seven freehold premises, five premises where the lease had a remaining term in excess of 25 years and 542 other leasehold premises. The division’s stores are generally leased under full repairing and insuring leases (equivalent to triple net leases in the US). Wherever possible Signet is shortening the length of new leases that it enters into, or including break clauses in order to improve the flexibility of its lease commitments. At January 30, 2010, the average unexpired lease term of UK premises with lease terms of less than 25 years was seven years, and a majority of leases had either break clauses or terms expiring within five years. Rents are usually subject to upward review every five years if market conditions so warrant. An increasing proportion of rents also have an element related to the sales of a store, subject to a minimum annual value. For details of assigned leases and sublet premises see page 83.
At the end of the lease period, subject to certain limited exceptions, UK leaseholders generally have statutory rights to enter into a new lease of the premises on negotiated terms. As current leases expire, Signet believes that it will be able to renew leases, if desired, for present store locations or to obtain leases in equivalent or improved locations in the same general area. Signet has not experienced difficulty in securing leases for suitable locations for its UK stores. No store lease is individually material to Signet’s UK operations.
39
Table of Contents
A typical H.Samuel store historically has had a major refurbishment every seven years and an Ernest Jones store every ten years. Once an H.Samuel store has been converted to the current format, the cost and frequency of subsequent major refurbishments is less, but much less costly store redecorations are now required, typically every five years. At January 30, 2010, 73% of H.Samuel stores and 48% of Ernest Jones stores traded in the converted format. It is anticipated that by the end of fiscal 2014 nearly all the UK stores will trade in the converted format. The investment will be financed by cash from operating activities. The cost of refitting to the customer friendly open format is between £200,000 and £300,000 for H. Samuel and Ernest Jones. The cost of subsequently refitting an H.Samuel store is approximately half as much and there is also expected to be a reduction in the cost of subsequent refits for Ernest Jones.
Signet owns a 255,000 square foot warehouse and distribution center in Birmingham, where certain of the UK division’s central administration functions are based, as well as e-commerce fulfillment. The remaining activities are situated in a 36,200 square foot office in Borehamwood, Hertfordshire which is held on a 15 year lease entered into in 2005. There are no plans for any major capital expenditure related to offices or the distribution center in the UK.
Certain central functions are located in a 7,200 square foot office in central London, on a ten year lease which was entered into in 2005.
Distribution capacity
The capacity of the US distribution center was increased in fiscal 2009 and it is anticipated that there will be sufficient capacity to support medium term sales growth. The UK distribution center has sufficient capacity for the anticipated future requirements of the business.
| ITEM 3. | LEGAL PROCEEDINGS |
See discussion of legal proceedings in Note 21 of Item 8.
| ITEM 4. | REMOVED AND RESERVED |
40
Table of Contents
PART II
| ITEM 5. | MARKET FOR REGISTRANT’S COMMON EQUITY, RELATED STOCKHOLDER MATTERS AND ISSUER PURCHASES OF EQUITY SECURITIES |
Market information
Prior to September 11, 2008, the ordinary shares of Signet Group plc (the “Predecessor Company”) were traded on the London Stock Exchange and American Depositary Shares (“ADSs”) representing those shares were quoted on the NYSE. Each ADS represented ten ordinary shares. Prior to November 16, 2004, the ADSs were traded on NASDAQ (symbol: SIGY). Prior to October 18, 2004 the ratio of ordinary shares per ADS had been 30:1.
On September 11, 2008 with the approval of the High Court of Justice in England and Wales, a scheme of arrangement (the “Scheme”) was effected. Under the terms of the Scheme, a new group holding company, Signet Jewelers Limited, was established. Common Shares in the new company, which has its primary listing on the NYSE, were distributed to the shareholders of the Predecessor Company in proportion to their original holding (subject to fractional entitlements) following a 1-for-20 reverse share split (share consolidation). Holders of ADSs received one new Common Share for every two ADSs held.
Historic share prices have been adjusted for the events noted above.
The following table sets forth the high and low share price on each stock exchange for the periods indicated.
| New York Stock Exchange Price per share |
London Stock Exchange Price per share | |||||||
| High | Low | High | Low | |||||
| $ | £ | |||||||
| Fiscal 2009 |
||||||||
| First quarter |
28.16 | 20.20 | 14.25 | 10.05 | ||||
| Second quarter |
30.40 | 17.70 | 15.50 | 8.85 | ||||
| Third quarter |
25.55 | 10.18 | 13.35 | 6.05 | ||||
| Fourth quarter |
12.69 | 7.04 | 7.93 | 4.78 | ||||
| Full year |
30.40 | 7.04 | 15.50 | 4.78 | ||||
| Fiscal 2010 |
||||||||
| First quarter |
16.50 | 6.06 | 11.10 | 4.12 | ||||
| Second quarter |
22.24 | 16.01 | 13.53 | 10.36 | ||||
| Third quarter |
28.58 | 20.34 | 17.25 | 11.93 | ||||
| Fourth quarter |
28.97 | 23.72 | 17.65 | 14.34 | ||||
| Full year |
28.97 | 6.06 | 17.65 | 4.12 | ||||
Number of holders
As of March 21, 2010 there were 13,652 shareholders of record. However when including shareholders that hold equity in broker accounts under street names, nominee accounts or employee share purchase plans, management estimates the shareholder base at approximately 29,000.
Dividend policy
In fiscal 2009, total equity dividends of $123.8 million were paid. Historic dividend per share amounts have been restated to reflect the 1-for-20 reverse stock split that took place on September 11, 2008. In July 2008, a dividend of $1.2634 per share was paid and in November 2008, an interim dividend of $0.192 per share was paid.
Signet did not pay any dividends in fiscal 2010, nor is it expected to do so in fiscal 2011. The restrictions contained in its borrowing agreements to making shareholder distributions are discussed in Item 7.
41
Table of Contents
Performance graph
The following Performance Graph and related information shall not be deemed “soliciting material” or to be filed with the SEC, nor shall such information be incorporated by reference into any future filing under the Securities Act of 1933 or Securities Exchange Act of 1934, each as amended, except to the extent that Signet specifically incorporates it by reference into such filing.
Historical share price performance should not be relied upon as an indication of future share price performance.
The following graph compares the cumulative total return to holders of Signet’s Common Shares against the cumulative total return of the Russell 1000 Index and Dow Jones General Retailers Index for the five year period ended January 30, 2010. The comparison of the cumulative total returns for each investment assumes that $100 was invested in Signet’s Common Shares and the respective indices on February 1, 2005 through January 30, 2010 including reinvestment of any dividends, and is adjusted to reflect the 1-for-20 share consolidation and the scheme of arrangement discussed above.
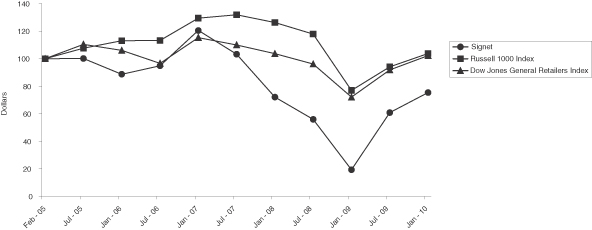
The following graph compares the cumulative total return to holders of Signet’s Common Shares against the cumulative total return of the FTSE All Share Index and the FTSE General Retailers Index for the five year period ended January 30, 2010. The comparison of the cumulative total returns for each investment assumes that £100 was invested in Signet’s Common Shares and the respective indices for the period February 1, 2005 through January 30, 2010 including reinvestment of any dividends, and is adjusted to reflect the 1-for-20 share consolidation and the scheme of arrangement discussed above.
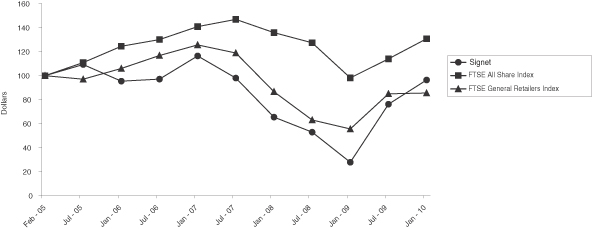
42
Table of Contents
Exchange controls
The Company is classified by the Bermuda Monetary Authority as a non-resident of Bermuda for exchange control purposes. The transfer of Common Shares between persons regarded as resident outside Bermuda for exchange control purposes may be effected without specific consent under the Exchange Control Act of 1972 and regulations thereunder and the issue of Common Shares to persons regarded as resident outside Bermuda for exchange control purposes may be effected without specific consent under the Exchange Control Act of 1972 and regulations thereunder. Issues and transfers of Common Shares involving any person regarded as resident in Bermuda for exchange control purposes may require specific prior approval under the Exchange Control Act of 1972.
The owners of Common Shares who are ordinarily resident outside Bermuda are not subject to any restrictions on their rights to hold or vote their shares. Because the Company has been designated as a non-resident for Bermuda exchange control purposes, there are no restrictions on its ability to transfer funds in and out of Bermuda or to pay dividends to US residents who are holders of Common Shares, other than in respect of local Bermuda currency.
Taxation
The following are brief and general summaries of the United Kingdom and United States taxation treatment of holding and disposing of Common Shares. The summaries are based on existing law, including statutes, regulations, administrative rulings and court decisions, and what is understood to be current HM Revenue and Customs (“HMRC”) and Internal Revenue Service (“IRS”) practice, all as in effect on the date of this document. Future legislative, judicial or administrative changes or interpretations could alter or modify statements and conclusions set forth below, and these changes or interpretations could be retroactive and could affect the tax consequences of holding and disposing of Common Shares. The summaries do not consider the consequences of holding and disposing of Common Shares under tax laws of countries other than the UK, the US (or any US laws other than those pertaining to income tax) and Bermuda, nor do the summaries consider any alternative minimum tax, state or local consequences of holding and disposing of Common Shares.
The summaries provide general guidance to persons resident, ordinarily resident and domiciled for tax purposes in the UK who hold Common Shares as an investment, and to US holders (as defined below) who hold Common Shares as capital assets (within the meaning of section 1221 of the US Internal Revenue Code), and not to any holders who are taxable in the UK on a remittance basis or who are subject to special tax rules, such as banks, financial institutions, broker-dealers, persons subject to mark-to-market treatment, UK resident individuals who hold their Common Shares under a personal equity plan, persons that hold their Common Shares as a position in part of a straddle, conversion transaction, constructive sale or other integrated investment, US holders whose “functional currency” is not the US dollar, persons who received their Common Shares by exercising employee share options or otherwise as compensation, persons who have acquired their Common Shares by virtue of any office or employment, S corporations or other pass-through entities (or investors in S corporations or other pass-through entities), mutual funds, insurance companies, exempt organizations, US holders subject to the alternative minimum tax, certain expatriates or former long term residents of the US, and US holders that directly or by attribution hold 10% or more of the voting power of the Company’s shares.
The summaries are not intended to provide specific advice and no action should be taken or omitted to be taken in reliance upon it. If you are in any doubt about your taxation position, or if you are ordinarily resident or domiciled outside the United Kingdom or resident or otherwise subject to taxation in a jurisdiction outside the United Kingdom or the United States, you should consult your own professional advisers immediately.
The Company is incorporated in Bermuda. The directors intend to conduct the Company’s affairs such that, based on current law and practice of the relevant tax authorities, the Company will not become resident for tax purposes in any other territory. This guidance is written on the basis that the Company does not become resident in a territory other than Bermuda.
43
Table of Contents
UK Taxation
Chargeable gains
A disposal of Common Shares by a shareholder who is resident or ordinarily resident in the UK may, depending on individual circumstances (including the availability of exemptions or allowable losses), give rise to a liability to (or an allowable loss for the purposes of) UK taxation of chargeable gains.
Any chargeable gain or allowable loss on a disposal of the Common Shares should be calculated taking into account the allowable cost to the holder of acquiring his Common Shares. In the case of corporate shareholders, to this should be added, when calculating a chargeable gain but not an allowable loss, indexation allowance on the allowable cost. (Indexation allowance is not available for non-corporate shareholders).
Individuals who hold their Common Shares within an individual savings account (“ISA”) and are entitled to ISA-related tax reliefs in respect of the same, will generally not be subject to UK taxation of chargeable gains in respect of any gain arising on a disposal of Common Shares.
Taxation of dividends on Common Shares
Under current UK law and practice, UK withholding tax is not imposed on dividends.
Subject to anti-avoidance rules and the satisfaction of certain conditions, UK resident shareholders who are within the charge to UK corporation tax will in general not be subject to corporation tax on dividends paid by the Company on the Common Shares.
A UK resident individual shareholder who is liable to UK income tax at no more than the basic rate will be liable to income tax on dividends paid by the Company on the Common Shares at the dividend ordinary rate (10% in tax year 2009/10). A UK resident individual shareholder who is liable to UK income tax at the higher rate will be subject to income tax on the dividend income at the dividend upper rate (32.5% in 2009/10). A new rate of income tax (the “additional rate”) will apply to individuals with taxable income over £150,000 with effect from April 6, 2010. A UK resident individual shareholder subject to the additional rate will be liable to income tax on their dividend income at a new higher rate of 42.5% of the gross dividend to the extent that the gross dividend when treated as the top slice of the shareholder’s income falls above the £150,000 threshold.
UK resident individuals in receipt of dividends from the Company, if they own less than a 10% shareholding in the Company, will be entitled to a non-payable dividend tax credit (currently at the rate of 1/9th of the cash dividend paid (or 10% of the aggregate of the net dividend and related tax credit)). Assuming that there is no withholding tax imposed on the dividend (as to which see the section on Bermuda taxation below), the individual is treated as receiving for UK tax purposes gross income equal to the cash dividend plus the tax credit. The tax credit is set against the individual’s tax liability on that gross income. The result is that a UK resident individual shareholder who is liable to UK income tax at no more than the basic rate will have no further UK income tax to pay on a Company dividend. A UK resident individual shareholder who is liable to UK income tax at the higher rate will have further UK income tax to pay of 22.5% of the dividend plus the related tax credit (or 25% of the cash dividend, assuming that there is no withholding tax imposed on that dividend). From April 6, 2010, a UK resident individual subject to income tax at the additional rate will have further UK income tax to pay of 32.5% of the dividend plus the tax credit (or 36 1/9% of the cash dividend, assuming that there is no withholding tax imposed on that dividend), to the extent that the gross dividend falls above the threshold for the new 50% rate of income tax.
Individual shareholders who hold their Common Shares in an ISA and are entitled to ISA-related tax reliefs in respect of the same will not be taxed on the dividends from those Common Shares but are not entitled to recover from HMRC the tax credit on such dividends.
44
Table of Contents
Stamp duty/stamp duty reserve tax (“SDRT”)
In practice, stamp duty should generally not need to be paid on an instrument transferring Common Shares. No SDRT will generally be payable in respect of any agreement to transfer Common Shares or Depositary Interests. The statements in this paragraph summarize the current position on stamp duty and SDRT and are intended as a general guide only. They assume that the Company will not be UK managed and controlled and that the Common Shares will not be registered in a register kept in the UK by or on behalf of the UK. The Company has confirmed that it does not intend to keep such a register in the UK.
US Taxation
As used in this discussion, the term “US holder” means a beneficial owner of Common Shares who is for US federal income tax purposes: (i) an individual US citizen or resident; (ii) a corporation, or entity treated as a corporation, created or organized in or under the laws of the United States; (iii) an estate the income of which is subject to US federal income taxation regardless of its source; or (iv) a trust if either: (a) a court within the US is able to exercise primary supervision over the administration of such trust and one or more US persons have the authority to control all substantial decisions of such trust; or (b) the trust has a valid election in effect to be treated as a US resident for US federal income tax purposes.
If a partnership (or other entity classified as a partnership for US federal tax income purposes) holds Common Shares, the US federal income tax treatment of a partner will generally depend upon the status of the partner and the activities of the partnership. Partnerships, and partners in partnerships, holding Common Shares are encouraged to consult their tax advisers.
*****
INTERNAL REVENUE SERVICE CIRCULAR 230 NOTICE: TO ENSURE COMPLIANCE WITH INTERNAL REVENUE SERVICE CIRCULAR 230, HOLDERS ARE HEREBY NOTIFIED THAT: (A) ANY DISCUSSION OF FEDERAL TAX ISSUES CONTAINED OR REFERRED TO IN THIS DOCUMENT IS NOT INTENDED TO BE USED, AND CANNOT BE USED, BY HOLDERS FOR THE PURPOSES OF AVOIDING PENALTIES THAT MAY BE IMPOSED ON THEM UNDER THE INTERNAL REVENUE CODE; (B) SUCH DISCUSSION IS WRITTEN IN CONNECTION WITH THE PROMOTION OR MARKETING OF THE TRANSACTIONS OR MATTERS ADDRESSED HEREIN; AND (C) HOLDERS SHOULD SEEK ADVICE BASED ON THEIR PARTICULAR CIRCUMSTANCES FROM AN INDEPENDENT TAX ADVISER.
*****
Dividends and other distributions upon Common Shares
Distributions made with respect to Common Shares will generally be includable in the income of a US holder as ordinary dividend income, to the extent paid out of current or accumulated earnings and profits of the Company as determined in accordance with US federal income tax principles. The amount of such dividends will generally be treated partly as US-source and partly as foreign-source dividend income in proportion to the earnings from which they are considered paid for as long as 50% or more of the company’s shares are directly or indirectly owned by US persons. Dividend income received from the Company will not be eligible for the “dividends received deduction” generally allowed to US corporations under the US Code. Subject to applicable limitations, including a requirement that the Common Shares be listed for trading on the NYSE, the NASDAQ Stock Market, or another qualifying US exchange, dividends with respect to Common Shares so listed that are paid to non-corporate US holders in taxable years beginning before January 1, 2011 will generally be taxable at a maximum tax rate of 15%.
45
Table of Contents
Sale or exchange of Common Shares
Gain or loss realised by a US holder on the sale or exchange of Common Shares generally will be subject to US federal income tax as capital gain or loss in an amount equal to the difference between the US holder’s tax basis in the Common Shares and the amount realized on the disposition. Such gain or loss will be long term capital gain or loss if the US holder held the Common Shares for more than one year. Gain or loss, if any, will generally be US source for foreign tax credit purposes. The deductibility of capital losses is subject to limitations.
Information reporting and backup withholding
Payments of dividends on, and proceeds from a sale or other disposition of, Common Shares, may, under certain circumstances, be subject to information reporting and backup withholding at a rate of 28% of the cash payable to the holder, unless the holder provides proof of an applicable exemption or furnishes its taxpayer identification number, and otherwise complies with all applicable requirements of the backup withholding rules. Any amounts withheld from payments to a US holder under the backup withholding rules are not additional tax and should be allowed as a refund or credit against the US holder’s US federal income tax liability, provided the required information is timely furnished to the IRS.
Passive foreign investment company status
A non-US corporation will be classified as a passive foreign investment company (a “PFIC”) for any taxable year if at least 75% of its gross income consists of passive income (such as dividends, interest, rents, royalties or gains on the disposition of certain minority interests), or at least 50% of the average value of its assets consists of assets that produce, or are held for the production of, passive income. For the purposes of these rules, a non US corporation is considered to hold and receive directly the assets and income of any other corporation of whose shares it owns at least 25% by value. Consequently, the Company’s classification under the PFIC rules will depend primarily upon the composition of Signet’s assets and income.
If the Company is characterized as a PFIC, US holders would suffer adverse tax consequences, and US federal income tax consequences different from those described above may apply. These consequences may include having gains realized on the disposition of Common Shares treated as ordinary income rather than capital gain and being subject to punitive interest charges on certain distributions and on the proceeds of the sale or other disposition of Common Shares. The Company believes that it is not a PFIC and that it will not be a PFIC for the foreseeable future. However, since the tests for PFIC status depend upon facts not entirely within a company’s control, such as the amounts and types of its income and values of its assets, no assurance can be provided that the Company will not become a PFIC. US holders should consult their own tax advisers regarding the potential application of the PFIC rules to the Common Shares.
Bermuda Taxation
At the present time, there is no Bermuda income or profits tax, withholding tax, capital gains tax, capital transfer tax, estate duty or inheritance tax payable by the Company or by its shareholders in respect of its Common Shares. The Company has obtained an assurance from the Minister of Finance of Bermuda under the Exempted Undertakings Tax Protection Act 1966 that, in the event that any legislation is enacted in Bermuda imposing any tax computed on profits or income, or computed on any capital asset, gain or appreciation or any tax in the nature of estate duty or inheritance tax, such tax shall not, until March 28, 2016, be applicable to it or to any of its operations or to its shares, debentures or other obligations except insofar as such tax applies to persons ordinarily resident in Bermuda or is payable by it in respect of real property owned or leased by it in Bermuda.
46
Table of Contents
| ITEM 6. | SELECTED CONSOLIDATED FINANCIAL DATA |
The financial data included below for fiscal 2010, fiscal 2009 and fiscal 2008 have been derived from the audited consolidated financial statements included in Item 8. The financial data for these periods should be read in conjunction with the financial statements, including the notes thereto, and Item 7. The financial data included below for fiscal 2007 and fiscal 2006 have been derived from the previously published consolidated audited financial statements not included in this document.
The financial statements of Signet for fiscal 2008, fiscal 2007 and fiscal 2006 were prepared in accordance with International Financial Reporting Standards, which differ in certain respects from US GAAP. Any figures used for these years have been converted to US GAAP in this Form 10-K.
Historic per share data have been adjusted to take account of the 1-for-20 reverse share split (share consolidation) undertaken as part of the move of the primary listing of the shares of the parent company to the NYSE, effective September 11, 2008.
47
Table of Contents
| Fiscal 2010 |
Fiscal 2009 |
Fiscal 2008(1) |
Fiscal 2007(1)(2) |
Fiscal 2006(1) |
||||||||||||||||
| $million | $million | $million | $million | $million | ||||||||||||||||
| Income Statement: |
||||||||||||||||||||
| Sales |
3,290.7 | 3,344.3 | 3,665.3 | 3,559.2 | 3,154.1 | |||||||||||||||
| Cost of sales |
(2,213.8 | ) | (2,264.2 | ) | (2,414.6 | ) | (2,266.3 | ) | (1,990.1 | ) | ||||||||||
| Gross margin |
1,076.9 | 1,080.1 | 1,250.7 | 1,292.9 | 1,164.0 | |||||||||||||||
| Selling, general and administrative expense |
(916.5 | ) | (969.2 | ) | (1,000.8 | ) | (979.6 | ) | (876.8 | ) | ||||||||||
| Impairment of goodwill |
— | (516.9 | ) | — | — | — | ||||||||||||||
| Relisting costs |
— | (10.5 | ) | — | — | — | ||||||||||||||
| Other operating income, net |
115.4 | 119.2 | 108.8 | 91.5 | 83.3 | |||||||||||||||
| Operating income/(loss), net |
275.8 | (297.3 | ) | 358.7 | 404.8 | 370.5 | ||||||||||||||
| Interest income |
0.8 | 3.6 | 6.3 | 16.7 | 4.3 | |||||||||||||||
| Interest expense |
(34.8 | ) | (32.8 | ) | (28.8 | ) | (34.2 | ) | (20.5 | ) | ||||||||||
| Income/(loss) before income taxes |
241.8 | (326.5 | ) | 336.2 | 387.3 | 354.3 | ||||||||||||||
| Income taxes |
(77.7 | ) | (67.2 | ) | (116.4 | ) | (134.6 | ) | (116.3 | ) | ||||||||||
| Net income/(loss) |
164.1 | (393.7 | ) | 219.8 | 252.7 | 238.0 | ||||||||||||||
| Earnings/(loss) per share: basic |
$ | 1.92 | $ | (4.62 | ) | $ | 2.58 | $ | 2.92 | $ | 2.74 | |||||||||
| diluted |
$ | 1.91 | $ | (4.62 | ) | $ | 2.55 | $ | 2.86 | $ | 2.74 | |||||||||
| Dividends per share |
— | $ | 1.45 | $ | 1.45 | $ | 1.43 | $ | 1.19 | |||||||||||
| Fiscal 2010 |
Fiscal 2009 |
Fiscal 2008(1) |
Fiscal 2007(1)(2) |
Fiscal 2006(1) |
||||||||||||||||
| $million | $million | $million | $million | $million | ||||||||||||||||
| Balance sheet: |
||||||||||||||||||||
| Working capital |
1,814.5 | 1,675.9 | 1,776.3 | 1,723.5 | 1,211.9 | |||||||||||||||
| Total assets |
2,924.2 | 2,953.9 | 3,599.4 | 3,508.2 | 2,863.1 | |||||||||||||||
| Cash and cash equivalents |
316.2 | 96.8 | 41.7 | 152.3 | 92.9 | |||||||||||||||
| Loans and overdrafts |
(44.1 | ) | (187.5 | ) | (36.3 | ) | (5.5 | ) | (267.4 | ) | ||||||||||
| Long term debt |
(280.0 | ) | (380.0 | ) | (380.0 | ) | (380.0 | ) | — | |||||||||||
| Total shareholders’ equity |
1,797.6 | 1,609.7 | 2,321.2 | 2,227.9 | 2,062.9 | |||||||||||||||
| Common shares in issue (million) |
85.5 | 85.3 | 85.3 | 85.7 | 86.9 | |||||||||||||||
| Cash flow: |
||||||||||||||||||||
| Net cash provided by operating activities |
515.4 | 164.4 | 140.8 | 199.3 | 200.7 | |||||||||||||||
| Net cash flows used in investing activities |
(43.5 | ) | (113.3 | ) | (139.4 | ) | (123.8 | ) | (123.1 | ) | ||||||||||
| Net debt(3) |
(7.9 | ) | (470.7 | ) | (374.6 | ) | (233.2 | ) | (174.5 | ) | ||||||||||
| Ratios: |
||||||||||||||||||||
| Effective tax rate |
32.1 | % | (20.6 | %) | 34.6 | % | 34.8 | % | 32.8 | % | ||||||||||
| Gearing(3) |
0.4 | % | 29.2 | % | 21.2 | % | 13.9 | % | 11.5 | % | ||||||||||
| ROCE(3) |
11.4 | % | 9.6 | % | 17.3 | % | 22.4 | % | 22.3 | % | ||||||||||
| Fixed charge cover(3) |
2.0 | x | 1.9 | x | 2.4 | x | 2.6 | x | 2.6 | x | ||||||||||
| (1) | Based on audited IFRS, converted to US GAAP. |
| (2) | 53 week year. |
| (3) | Net debt, gearing, ROCE and fixed charge cover are non-GAAP measures, see below. |
48
Table of Contents
| Fiscal 2010 |
Fiscal 2009 |
Fiscal 2008 |
Fiscal 2007 |
Fiscal 2006 |
|||||||||||
| Store data: |
|||||||||||||||
| Store numbers (at end of period) |
|||||||||||||||
| US |
1,361 | 1,401 | 1,399 | 1,308 | 1,221 | ||||||||||
| UK |
552 | 558 | 563 | 581 | 593 | ||||||||||
| Percentage (decrease)/increase in same store sales |
|||||||||||||||
| US |
0.2 | % | (9.7 | )% | (1.7 | )% | 6.2 | % | 7.1 | % | |||||
| UK |
(2.4 | )% | (3.3 | )% | 2.0 | % | 1.2 | % | (8.2 | )% | |||||
| Signet |
(0.4 | )% | (8.2 | )% | (0.7 | )% | 4.8 | % | 2.4 | % | |||||
| Number of employees (full-time equivalents) |
16,320 | 16,915 | 17,243 | 16,836 | 15,652 |
GAAP AND NON-GAAP MEASURES
The discussion and analysis of Signet’s results of operations, financial condition and liquidity contained in this Report are based upon the consolidated financial statements of Signet which are prepared in accordance with US GAAP and should be read in conjunction with Signet’s financial statements and the related notes included in Item 8. A number of non-GAAP measures are used by management to analyze and manage the performance of the business, and the required disclosures for these non-GAAP measures are given below. In particular, the terms “underlying” and “underlying at constant exchange rates” are used in a number of places. “Underlying” is used to indicate where adjustments for significant, unusual and non-recurring items have been made and “underlying at constant exchange rates” indicates where the underlying items have been further adjusted to eliminate the impact of exchange rate movements on translation of pound sterling amounts to US dollars.
Management does not, nor does it suggest investors should, consider such non-GAAP measures in isolation from, or in substitute for, financial information prepared in accordance with GAAP.
Exchange translation impact
Movements in the US dollar to pound sterling exchange rate have an impact on the results. The UK division is managed in pounds sterling as sales and costs are incurred in that currency and its results are then translated into US dollars for external reporting purposes. Management believes it is inappropriate to hedge this exposure as the UK division’s sales and costs are both incurred in pounds sterling, and therefore believes it assists in understanding the performance of Signet and its UK division if constant currency figures are given. This is particularly so in periods when exchange rates are volatile.
The constant currency amounts are calculated by retranslating the prior year figures using the current year’s exchange rate.
1. Underlying operating income, underlying income/(loss) before income tax, underlying net income, underlying earnings per share and underlying operating margin percentage
In fiscal 2009, the following non-recurring costs were included in operating income: $516.9 million for impairment of goodwill; and $10.5 million of relisting costs in respect of the move in primary listing to the NYSE. In fiscal 2010, the US division benefited by $13.4 million due to a change in its vacation entitlement policy. This benefit will not recur in subsequent fiscal years. Management considers it useful to exclude these significant, unusual and non-recurring items to analyze and explain changes and trends in Signet’s and its divisions’ results. These underlying amounts are also shown excluding the impact of movements in the pound sterling to US dollar exchange rate.
49
Table of Contents
(a) Fiscal 2010 reconciliation to underlying results
| Fiscal 2010 reported |
Impact of change in vacation entitlement policy |
Fiscal 2010 underlying (non- GAAP) |
||||||||||
| $million | $million | $million | ||||||||||
| Sales by origin and destination: |
||||||||||||
| US |
2,557.5 | — | 2,557.5 | |||||||||
| UK |
733.2 | — | 733.2 | |||||||||
| 3,290.7 | — | 3,290.7 | ||||||||||
| Operating income: |
||||||||||||
| US |
235.8 | (13.4 | ) | 222.4 | ||||||||
| UK |
56.5 | — | 56.5 | |||||||||
| Unallocated |
(16.5 | ) | — | (16.5 | ) | |||||||
| 275.8 | (13.4 | ) | 262.4 | |||||||||
| Income before income taxes: |
241.8 | (13.4 | ) | 228.4 | ||||||||
| Net income |
164.1 | (8.3 | ) | 155.8 | ||||||||
| Basic earnings per share: |
$ | 1.92 | $ | (0.09 | ) | $ | 1.83 | |||||
| Diluted earnings per share: |
$ | 1.91 | $ | (0.09 | ) | $ | 1.82 | |||||
(b) Fiscal 2009 reconciliation to underlying results and constant exchange rates
| Fiscal 2009 reported |
Impact of goodwill impairment and relisting |
Fiscal 2009 underlying (non- GAAP) |
Impact of exchange rate movement |
Fiscal 2009 underlying at constant exchange rates (non- GAAP) |
|||||||||||||||
| $million | $million | $million | $million | $million | |||||||||||||||
| Sales by origin and destination: |
|||||||||||||||||||
| US |
2,536.1 | — | 2,536.1 | — | 2,536.1 | ||||||||||||||
| UK |
808.2 | — | 808.2 | (73.9 | ) | 734.3 | |||||||||||||
| 3,344.3 | — | 3,344.3 | (73.9 | ) | 3,270.4 | ||||||||||||||
| Operating (loss)/income: |
|||||||||||||||||||
| US |
(236.4 | ) | 408.0 | 171.6 | — | 171.6 | |||||||||||||
| UK |
(37.4 | ) | 108.9 | 71.5 | (6.5 | ) | 65.0 | ||||||||||||
| Unallocated |
(23.5 | ) | 10.5 | (13.0 | ) | 1.2 | (11.8 | ) | |||||||||||
| (297.3 | ) | 527.4 | 230.1 | (5.3 | ) | 224.8 | |||||||||||||
| (Loss)/income before income taxes: |
(326.5 | ) | 527.4 | 200.9 | (5.6 | ) | 195.3 | ||||||||||||
| Net (loss)/income |
(393.7 | ) | 527.4 | 133.7 | (3.8 | ) | 129.9 | ||||||||||||
| Basic (loss)/earnings per share: |
$ | (4.62 | ) | $ | 6.19 | $ | 1.57 | $ | (0.05 | ) | $ | 1.52 | |||||||
| Diluted (loss)/earnings per share: |
$ | (4.62 | ) | $ | 6.19 | $ | 1.57 | $ | (0.05 | ) | $ | 1.52 | |||||||
50
Table of Contents
(c) Fiscal 2010 percentage change in underlying results and at constant exchange rates
| Fiscal 2010 reported |
Fiscal 2009 reported |
Change as reported |
Fiscal 2010 underlying (non- GAAP) |
Fiscal 2009 underlying (non- GAAP) |
Underlying change (non- GAAP) |
Fiscal 2009 underlying at constant exchange rates (non- GAAP) |
Fiscal 2010 underlying change at constant exchange rates (non- GAAP) |
||||||||||||||||||||||
| $million | $million | % | $million | $million | % | $million | % | ||||||||||||||||||||||
| Sales by origin and destination: |
|||||||||||||||||||||||||||||
| US |
2,557.5 | 2,536.1 | 0.8 | 2,557.5 | 2,536.1 | 0.8 | 2,536.1 | 0.8 | |||||||||||||||||||||
| UK |
733.2 | 808.2 | (9.3 | ) | 733.2 | 808.2 | (9.3 | ) | 734.3 | (0.1 | ) | ||||||||||||||||||
| 3,290.7 | 3,344.3 | (1.6 | ) | 3,290.7 | 3,344.3 | (1.6 | ) | 3,270.4 | 0.6 | ||||||||||||||||||||
| Operating income/(loss): |
|||||||||||||||||||||||||||||
| US |
235.8 | (236.4 | ) | n/a | 222.4 | 171.6 | 29.6 | 171.6 | 29.6 | ||||||||||||||||||||
| UK |
56.5 | (37.4 | ) | n/a | 56.5 | 71.5 | (21.0 | ) | 65.0 | (13.1 | ) | ||||||||||||||||||
| Unallocated |
(16.5 | ) | (23.5 | ) | n/a | (16.5 | ) | (13.0 | ) | (26.9 | ) | (11.8 | ) | (39.8 | ) | ||||||||||||||
| 275.8 | (297.3 | ) | n/a | 262.4 | 230.1 | 14.0 | 224.8 | 16.7 | |||||||||||||||||||||
| Income/(loss)before income taxes: |
241.8 | (326.5 | ) | n/a | 228.4 | 200.9 | 13.7 | 195.3 | 16.9 | ||||||||||||||||||||
| Net income/(loss) |
164.1 | (393.7 | ) | n/a | 155.8 | 133.7 | 16.5 | 129.9 | 19.9 | ||||||||||||||||||||
| Basic earnings/(loss) per share: |
$ | 1.92 | $ | (4.62 | ) | n/a | $ | 1.83 | $ | 1.57 | 16.6 | $ | 1.52 | 20.4 | |||||||||||||||
| Diluted earnings/(loss) per share: |
$ | 1.91 | $ | (4.62 | ) | n/a | $ | 1.82 | $ | 1.57 | 15.9 | $ | 1.52 | 19.7 | |||||||||||||||
(d) Fiscal 2009 percentage change in underlying results and at constant exchange rates
| Fiscal 2009 reported |
Fiscal 2008 reported |
Change as reported |
Impact of goodwill impairment and relisting |
Fiscal 2009 underlying (non- GAAP) |
Impact of exchange rate movement |
Fiscal 2008 at constant exchange rates (non- GAAP) |
Fiscal 2009 underlying change at constant exchange rates (non- GAAP) |
||||||||||||||||||||||
| $million | $million | % | $million | $million | $million | $million | % | ||||||||||||||||||||||
| Sales by origin and destination: |
|||||||||||||||||||||||||||||
| US |
2,536.1 | 2,705.7 | (6.3 | ) | — | 2,536.1 | — | 2,705.7 | (6.3 | ) | |||||||||||||||||||
| UK |
808.2 | 959.6 | (15.8 | ) | — | 808.2 | (119.9 | ) | 839.7 | (3.8 | ) | ||||||||||||||||||
| 3,344.3 | 3,665.3 | (8.8 | ) | — | 3,344.3 | (119.9 | ) | 3,545.4 | (5.7 | ) | |||||||||||||||||||
| Operating (loss)/income: |
|||||||||||||||||||||||||||||
| US |
(236.4 | ) | 265.2 | n/a | 408.0 | 171.6 | — | 265.2 | (35.3 | ) | |||||||||||||||||||
| UK |
(37.4 | ) | 109.3 | n/a | 108.9 | 71.5 | (13.7 | ) | 95.6 | (25.2 | ) | ||||||||||||||||||
| Unallocated |
(23.5 | ) | (15.8 | ) | 48.7 | 10.5 | (13.0 | ) | 2.0 | (13.8 | ) | (5.8 | ) | ||||||||||||||||
| (297.3 | ) | 358.7 | n/a | 527.4 | 230.1 | (11.7 | ) | 347.0 | (33.7 | ) | |||||||||||||||||||
| (Loss)/income before income taxes: |
(326.5 | ) | 336.2 | n/a | 527.4 | 200.9 | (12.2 | ) | 324.0 | (38.0 | ) | ||||||||||||||||||
| Net (loss)//income |
(393.7 | ) | 219.8 | n/a | 527.4 | 133.7 | (7.9 | ) | 211.9 | (36.9 | ) | ||||||||||||||||||
| Basic (loss)/earnings per share: |
$ | (4.62 | ) | $ | 2.58 | n/a | $ | 6.19 | $ | 1.57 | $ | (0.09 | ) | $ | 2.49 | (36.9 | ) | ||||||||||||
| Diluted (loss)/earnings per share: |
$ | (4.62 | ) | $ | 2.55 | n/a | $ | 6.19 | $ | 1.57 | $ | (0.09 | ) | $ | 2.46 | (36.2 | ) | ||||||||||||
51
Table of Contents
(e) Fourth quarter fiscal 2010 percentage change in underlying results and at constant exchange rates
The underlying results are reported results adjusted for an unfavourable $1.6 million movement in the fourth quarter vacation entitlement accrual in fiscal 2010 and $408.0 million and $108.9 million impairment of goodwill for the US and UK divisions respectively during fiscal 2009.
| 13 weeks ended January 30, 2010 reported |
13 weeks ended January 31, 2009 reported |
Change as reported |
13 weeks ended January 30, 2010 underlying (non-GAAP) |
13 weeks ended January 31, 2009 underlying (non-GAAP) |
Underlying change (non-GAAP) |
13 weeks ended January 31, 2009 underlying change at constant exchange rates (non-GAAP) |
13 weeks ended January 30, 2010 underlying change at constant exchange rates (non-GAAP) |
|||||||||||||||||||||
| $million | $million | % | $million | $million | % | $million | % | |||||||||||||||||||||
| Sales by origin and destination: |
||||||||||||||||||||||||||||
| US |
920.8 | 862.1 | 6.8 | 920.8 | 862.1 | 6.8 | 862.1 | 6.8 | ||||||||||||||||||||
| UK |
282.8 | 261.5 | 8.1 | 282.8 | 261.5 | 8.1 | 287.3 | (1.6 | ) | |||||||||||||||||||
| 1,203.6 | 1,123.6 | 7.1 | 1,203.6 | 1,123.6 | 7.1 | 1,149.4 | 4.7 | |||||||||||||||||||||
| Operating income/(loss): |
||||||||||||||||||||||||||||
| US |
124.2 | (327.1 | ) | n/a | 125.8 | 80.9 | 55.5 | 80.9 | 55.5 | |||||||||||||||||||
| UK |
60.4 | (39.3 | ) | n/a | 60.4 | 69.6 | (13.2 | ) | 63.4 | (4.7 | ) | |||||||||||||||||
| Unallocated |
(4.7 | ) | (0.1 | ) | n/a | (4.7 | ) | (0.1 | ) | n/a | (1.2 | ) | n/a | |||||||||||||||
| 179.9 | (366.5 | ) | n/a | 181.5 | 150.4 | 20.7 | 143.1 | 26.8 | ||||||||||||||||||||
| Income/(loss before taxes |
172.4 | (373.6 | ) | n/a | 174.0 | 143.3 | 21.4 | 135.6 | 28.3 | |||||||||||||||||||
| Net income/(loss) |
117.2 | (424.0 | ) | n/a | 118.2 | 95.3 | 24.0 | 90.1 | 31.2 | |||||||||||||||||||
| Basic Earnings/(loss) per share |
$ | 1.37 | $ | (4.97 | ) | n/a | $ | 1.38 | $ | 1.12 | 23.2 | $ | 1.06 | 30.2 | ||||||||||||||
| Diluted Earnings/(loss) per share |
$ | 1.36 | $ | (4.97 | ) | n/a | $ | 1.37 | $ | 1.12 | 22.3 | $ | 1.06 | 29.2 | ||||||||||||||
2. Cost of sales, gross margin and selling, general and administrative expenses at constant exchange rates
Management considers it useful to exclude the impact of exchange rate movements to analyze and explain changes and trends in Signet’s costs.
| Fiscal 2010 reported |
Fiscal 2009 reported |
Change as reported |
Impact of exchange rate movement |
Fiscal 2009 at constant exchange rates (non-GAAP) |
Fiscal 2010 change at constant exchange rates (non-GAAP) |
|||||||||||||
| $million | $million | % | $million | $million | % | |||||||||||||
| Cost of sales |
(2,213.8 | ) | (2,264.2 | ) | (2.2 | ) | 48.4 | (2,215.8 | ) | (0.1 | ) | |||||||
| Gross margin |
1,076.9 | 1,080.1 | (0.3 | ) | (25.5 | ) | 1,054.6 | 2.1 | ||||||||||
| Selling, general and administrative expenses |
(916.5 | ) | (969.2 | ) | (5.4 | ) | 20.5 | (948.7 | ) | (3.4 | ) |
52
Table of Contents
3. Net debt
Net debt is the total of loans, overdrafts and long term debt less cash and cash equivalents, and is helpful in providing a measure of the total indebtedness of the business.
| January 30, 2010 |
January 31, 2009 |
February 2, 2008 |
|||||||
| $million | $million | $million | |||||||
| Long-term debt |
(280.0 | ) | (380.0 | ) | (380.0 | ) | |||
| Loans and overdrafts |
(44.1 | ) | (187.5 | ) | (36.3 | ) | |||
| (324.1 | ) | (567.5 | ) | (416.3 | ) | ||||
| Cash and cash equivalents |
316.2 | 96.8 | 41.7 | ||||||
| Net debt |
(7.9 | ) | (470.7 | ) | (374.6 | ) | |||
4. Net debt to shareholders equity excluding goodwill (“Gearing”)
Gearing is the ratio of net debt to shareholders equity excluding goodwill, and is a useful measure for understanding the financial leverage of the business on a consistent basis.
5. Return on capital employed excluding goodwill (“ROCE”)
ROCE is calculated by dividing the annual operating income by the average monthly capital employed excluding goodwill for that year, expressed as a percentage. Capital employed includes other intangible assets, property, plant and equipment, other non-current receivables, inventories, trade and other receivables; less trade and other payables, deferred income and retirement benefit obligations. This is a key performance indicator used by management for assessing the effective operation of the business and is considered a useful disclosure for investors as it provides a measure of the return on Signet’s and the divisions’ operating assets and has historically been used for some performance awards.
6. Fixed charge cover; net debt to earnings before interest, taxes, depreciation and amortization; and net tangible asset value
These non-GAAP measures are calculated exactly in accordance with Signet’s debt covenants as defined in the original and amended material Note Purchase and Facility Agreements. They are reported to the Note Holders and the lending banks and need to be met in order to maintain these funding facilities. The reporting of these measures provides an investor with an understanding of Signet’s ability to meet these conditions, which are described in Item 7.
7. Net income adjusted for non-cash items
Net income adjusted for non-cash items shows the amount of net cash flow generated from Signet’s operating activities before changes in operating assets and liabilities. It is a useful measure to summarize the cash generated from activities reported in the income statement.
53
Table of Contents
| Fiscal 2010 |
Fiscal 2009 |
Fiscal 2008 |
|||||||
| $million | $million | $million | |||||||
| Net income/(loss) |
164.1 | (393.7 | ) | 219.8 | |||||
| Adjustments to reconcile net income/(loss) to cash flows provided by operations: |
|||||||||
| Depreciation of property, plant and equipment |
101.0 | 108.1 | 109.2 | ||||||
| Amortization of other intangible assets |
7.9 | 6.4 | 4.7 | ||||||
| Impairment of goodwill |
— | 516.9 | — | ||||||
| Pension |
(5.3 | ) | 0.2 | (2.0 | ) | ||||
| Share-based compensation expense/(income) |
5.6 | 0.7 | (3.4 | ) | |||||
| Deferred taxation |
15.5 | 24.7 | 6.9 | ||||||
| Facility amendment fees included in net income |
4.3 | — | — | ||||||
| Other non-cash movements |
0.8 | (2.8 | ) | (3.0 | ) | ||||
| (Profit)/loss on disposal of property, plant and equipment |
— | (0.7 | ) | 1.4 | |||||
| Net income adjusted for non-cash items |
293.9 | 259.8 | 333.6 | ||||||
8. Free cash flow
Free cash flow is a non-GAAP measure defined as the net cash provided by operating activities less net cash flows used in investing activities. Management considers that this is helpful in understanding how the business is generating cash from its operating and investing activities that can be used to meet the financing needs of the business. Free cash flow does not represent the residual cash flow available for discretionary expenditure.
| Fiscal 2010 |
Fiscal 2009 |
Fiscal 2008 |
|||||||
| $million | $million | $million | |||||||
| Net cash provided by operating activities |
515.4 | 164.4 | 140.8 | ||||||
| Net cash flows used in investing activities |
(43.5 | ) | (113.3 | ) | (139.4 | ) | |||
| Free cash flow |
471.9 | 51.1 | 1.4 | ||||||
54
Table of Contents
| ITEM 7. | MANAGEMENT’S DISCUSSION AND ANALYSIS OF FINANCIAL CONDITION AND RESULTS OF OPERATIONS |
This Annual Report on Form 10-K contains statements which are forward-looking statements within the meaning of the Private Securities Litigation Reform Act of 1995. These statements, based upon management’s beliefs and expectations as well as on assumptions made by and information currently available to management, include statements regarding, among other things, the results of operation, financial condition, liquidity, prospects, growth, strategies and the industry in which Signet operates. The use of the words “expects,” “intends,” “anticipates,” “estimates,” “predicts,” “believes,” “should,” “potential,” “may,” “forecast,” “objective,” “plan” or “target,” and other similar expressions are intended to identify forward-looking statements. These forward-looking statements are not guarantees of future performance and are subject to a number of risks and uncertainties, including but not limited to general economic conditions, the merchandising, pricing and inventory policies followed by Signet, the reputation of Signet, the level of competition in the jewelry sector, the price and availability of diamonds, gold and other precious metals, seasonality of the business and financial market risk.
Important factors which may cause actual results to differ materially from those expressed in any forward-looking statements include, but are not limited to, those described in Item 1A and elsewhere in this Form 10-K. Except as required by applicable law, rules or regulations, Signet undertakes no obligation to update publicly any forward-looking statements in this Annual Report on Form 10-K that may occur due to any change in management’s expectations or to reflect future events or circumstances.
GAAP AND NON-GAAP MEASURES
The following discussion and analysis of the results of operations, financial condition and liquidity is based upon the consolidated financial statements of Signet which are prepared in accordance with US GAAP. The following information should be read in conjunction with Signet’s financial statements and the related notes included in Item 8. A number of non-GAAP measures are used by management to analyze and manage the performance of the business, and the required disclosures for these measures are given in Item 6.
The Company’s management does not, nor does it suggest investors should, consider such non-GAAP measures in isolation from, or in substitute for, financial information prepared in accordance with GAAP.
Exchange translation impact
The average exchange rate is used to prepare the income statement and is calculated from the weekly average exchange rates weighted by sales of the UK division. This means that results are particularly impacted by movements in the fourth quarter of its fiscal year, with the exchange rate in the first three weeks of December having the largest effect on the average exchange rate used. A movement in the year to date exchange rate from that in the prior quarter in a particular fiscal year, will result in that quarter’s results being impacted by adjustments to sales and costs in prior quarters to reflect the changed year to date exchange rate. This can have a particularly noticeable impact on Signet’s results for the third quarter as the results for the third quarter are close to break-even. In addition, as the UK division’s selling, administrative and general expenses are spread more evenly between quarters than its sales, these expenses can be particularly impacted in the fourth quarter. In fiscal 2011, it is anticipated a one cent movement in the pound sterling to US dollar exchange rate would impact income before income tax by approximately $0.3 million.
55
Table of Contents
OVERVIEW
The key drivers of operating profitability are:
| • | sales performance; |
| • | achieved gross merchandising margin; |
| • | level of expenses; |
| • | balance between the change in same store sales and sales from new store space; and |
| • | movements in the US dollar to pound sterling exchange rate, as about 22% of Signet’s sales and about 15% of operating income, including unallocated costs, are generated in the UK and Signet reports its results in US dollars. |
These are discussed more fully below.
Sales
Sales performance in both the US and UK divisions is driven by the change in same store sales and contribution from changes in net store space.
Same store sales are a function of the number of units sold and the average selling price of those units. The average selling price can alter due to changes in the buying patterns of consumers or due to price changes. For example, historically Signet’s customers had been purchasing larger, higher quality diamonds, which had lifted the average selling price. However, in the second half of fiscal 2009 and in fiscal 2010, the challenging economic environment resulted in the typical consumer buying items with a lower average selling price. In early fiscal 2009, a new pricing architecture was implemented which resulted in a higher average selling price in both the US and UK divisions to reflect the increase in the cost of merchandise, primarily due to the higher cost of gold. Further price increases were implemented by the UK division in fiscal 2010. Such price increases usually result in an initial reduction in the number of units sold followed by a recovery in volumes, but not to the prior level, all other factors being constant.
A new store typically has sales of about 60% that of a five year old store, and will only contribute to sales for part of the fiscal year in which it is opened. Store openings are usually planned to occur in the third quarter and store closures in January. When investing in new space, management has stringent operating and financial criteria. Due to the very challenging economic environment, US net space decreased by 1% in fiscal 2010 and a broadly similar decline is anticipated in fiscal 2011. This is in contrast to net space growth in the US of 4% in fiscal 2009, 10% in fiscal 2008 and 11% in fiscal 2007. The majority of the historic space growth reflected expansion of the Jared format. In the UK, there was a decline in space of 1% in fiscal 2010, a 1% increase in fiscal 2009 and a 4% decline in fiscal 2008. Typically there is a small decline in UK space as the H.Samuel chain withdraws from smaller sized retail markets, and there are very limited new space opportunities for either H.Samuel or Ernest Jones to offset these closures. A 2% decline in space is planned by the UK division in fiscal 2011.
Net change in store space
| US | UK | Signet | |||||||
| Planned fiscal 2011 |
(2 | )% | (2 | )% | (2 | )% | |||
| Fiscal 2010 |
(1 | )% | (1 | )% | (1 | )% | |||
| Fiscal 2009 |
4 | % | 1 | % | 3 | % | |||
| Fiscal 2008 |
10 | % | (4 | )% | 7 | % |
In fiscal 2010, total sales fell to $3,290.7 million (fiscal 2009: $3,344.3 million), down by 1.6% on a reported basis and up by 0.6% at constant exchange rates; non-GAAP measure, see Item 6. Same store sales decreased by
56
Table of Contents
0.4% and net change in store space contributed 1.0% to sales. See page 62 for further analysis. In the fourth quarter total sales increased to $1,203.6 million (fiscal 2009: $1,123.6 million), up by 7.1% on a reported basis and by 4.7% at constant exchange rates; non-GAAP measure, see Item 6. Same store sales increased by 5.2% and net change in store space had an adverse impact of 0.5%.
Cost of sales
Cost of sales, which is used to arrive at gross profit, takes into account all costs incurred in the purchase, processing and distribution of the merchandise, all costs directly incurred in the operation and support of the retail outlets as well as the net provision for uncollectible receivables. The classification of distribution and selling costs varies from retailer to retailer and few retailers have in-house customer finance programs. Therefore Signet’s gross profit percentage may not be directly comparable to other retailers.
Gross merchandise margin
The gross merchandise margin is the difference between the selling price achieved and the cost of merchandise sold expressed as a percentage of the sales price. In retail jewelry, the gross merchandise margin percentage is above the average for specialty retailers, reflecting the slow inventory turn. Gross merchandise margin dollars is the difference expressed in monetary terms. The trend in gross merchandise margin depends on Signet’s pricing policy, movements in the cost of goods sold, changes in sales mix and the direct cost of providing services such as repairs. In early fiscal 2009, management increased prices in both the US and the UK. Further price increases were implemented in the UK in fiscal 2010.
In general, the gross merchandise margin of gold jewelry is above that of diamond jewelry, whilst that of watches and gift products is normally below that of diamond jewelry. Within the diamond jewelry category, the gross merchandise margin varies depending on the proportion of the merchandise cost accounted for by the value of the diamonds; the greater the proportion, the lower the gross merchandise margin. In addition, the gross merchandise margin of a Jared store is slightly below the mall brands, although at maturity the store contribution percentage of a Jared site is similar to that of a mall store. The gross merchandise margin of differentiated merchandise is usually a little above average for that product category, while that of a value item is a little below average. A change in merchandise mix will therefore have an impact on the US and UK division’s gross merchandise margin and a change in the proportion of sales from Jared will have an impact on the gross merchandise margin of both the US division and Signet as a whole. In the US division, until fiscal 2008, the growth of Jared, the increase in sales of higher value diamonds (both of which had been helping to drive same store sales growth), and higher commodity costs meant that the US gross merchandise margin showed a small decline in most years. Since fiscal 2009, the gross merchandise margin has increased as these trends reversed.
Commodity costs
Important factors that impact gross merchandise margin are the cost of polished diamonds and gold. In the US, about 55% of the cost of merchandise sold is accounted for by polished diamonds and about 20% is accounted for by gold. In the UK, diamonds and gold account for about 10% and 20% respectively of the cost of merchandise sold, and watches for about 38%. The pound sterling to US dollar exchange rate also has a material impact as a significant proportion of the merchandise sold in the UK is purchased in US dollars. Signet uses gold and currency hedges to reduce its exposure to market volatility in the cost of gold and the pound sterling to dollar exchange rate, but does not do so for polished diamonds. For gold, the hedging period is normally a maximum of one year. For currencies, the hedging period can extend to 24 months, although the majority of hedge contracts will normally be for a maximum of 18 months.
The price of diamonds varies depending on their size, cut, color and clarity. The price of diamonds of the size and quality typically purchased by Signet showed little variation over the fiscal years 2007, 2008 and 2009. Due to the sharp decline in demand for diamonds in the second half of fiscal 2009, particularly in the US which
57
Table of Contents
accounts for about 40% of worldwide diamond demand (source: IDEX Online (“IDEX”)), the supply chain became overstocked with diamonds. Combined with the reduced levels of credit availability, the oversupply of diamonds resulted in a fall in the price of loose polished diamonds of all sizes and qualities for most of fiscal 2010. The IDEX Global Diamond Price Index is an independent source that tracks diamond prices in the IDEX inventory database. While IDEX tracks price movements in its database they are not representative of all transactions in polished diamonds and do not necessarily reflect prices paid by Signet. IDEX reports show that the price of diamonds over three carats, which is larger than Signet usually purchases, are more volatile than for sizes and qualities that are typically used in merchandise sold by Signet. In the final quarter of fiscal 2010, polished diamond prices increased a little, but remained below fiscal 2009 levels. Demand for diamonds is primarily driven by the manufacture and sale of diamond jewelry and their future price is uncertain.
The cost of gold has steadily increased during the last three fiscal years, primarily reflecting increased investment demand rather than changes in the usage for jewelry manufacture. During fiscal 2010, the cost of gold increased from an average of $943 per troy ounce in February 2009 to $1,118 per troy ounce in January 2010. Since the start of fiscal 2011 the cost of gold has been volatile, but has averaged above the $1,100 level. The future price of gold is uncertain.
Signet uses an average cost inventory methodology and therefore the impact of movements in the cost of diamonds and gold on gross merchandise margin is smoothed. In addition, as jewelry inventory turns slowly, the impact takes some time to be fully reflected in the gross merchandise margin. As inventory turn is faster in the fourth quarter than in the other three quarters, changes in the cost of merchandise are more quickly reflected in the gross merchandise margin in that quarter. Furthermore the hedging activities result in movements in the purchase cost of merchandise taking sometime before being reflected in the gross merchandise margin.
Operating income margin
To maintain the operating income margin, Signet needs to achieve same store sales growth sufficient to offset any adverse movement in gross merchandise margin, any increase in operating costs (including the net bad debt charge) and the impact of any immature selling space. Same store sales growth above the level required to offset the factors outlined above, allows the business to achieve leverage of its fixed cost base and improve operating income margin. Slower sales growth or a sales decline would normally result in a reduced operating income margin. In exceptional cases, such as through the US division’s cost saving measures implemented in fiscal 2010 and described below, Signet may be able to reduce costs enough to increase operating margin. A key factor in driving operating income margin is the level of average sales per store, with higher productivity allowing leverage of expenses incurred in performing store and central functions. Therefore a slower rate of net new space growth is beneficial to operating income margin while an acceleration in growth is adverse.
The impact on operating income of a sharp, unexpected increase or decrease in same store sales performance is marked. This is particularly so when it occurs in the fourth quarter. However, the impact on operating income of short term sales variances (either adverse or favorable) is less in the US division than the UK, as certain variable expenses such as sales-related rent and staff incentives account for a higher proportion of costs in the US division than in the UK division. In the medium term, there is more opportunity to adjust costs to the changed sales level, but the time taken to do so varies depending on the type of cost. An example of where it can take a number of months to adjust costs is expenditure on national network television advertising in the US, where Signet makes most of its commitments for the year ahead during its second quarter. It is even more difficult to reduce base lease costs in the short or medium term, as leases in US malls are typically for ten years, Jared sites for 20 years and in the UK for five plus years.
The operating margin may also be impacted by significant, unusual and non-recurring items. For example, in fiscal 2010, the vacation entitlement policy in the US division was changed, see page 66 for details. This resulted in the selling, general and administrative costs being reduced while operating income increased by $13.4 million; this benefit will not be repeated in subsequent years. In fiscal 2009, there was a provision for goodwill
58
Table of Contents
impairment of $516.9 million, see page 70, and relisting costs of $10.5 million related to the move of Signet’s primary listing to the NYSE from the LSE, see page 71.
Results of Operations
| Fiscal 2010 |
Fiscal 2009 |
Fiscal 2008 |
|||||||
| $million | $million | $million | |||||||
| Sales |
3,290.7 | 3,344.3 | 3,665.3 | ||||||
| Cost of sales |
(2,213.8 | ) | (2,264.2 | ) | (2,414.6 | ) | |||
| Gross margin |
1,076.9 | 1,080.1 | 1,250.7 | ||||||
| Selling, general and administrative expenses |
(916.5 | ) | (969.2 | ) | (1,000.8 | ) | |||
| Impairment of goodwill |
— | (516.9 | ) | — | |||||
| Relisting costs |
— | (10.5 | ) | — | |||||
| Other operating income, net |
115.4 | 119.2 | 108.8 | ||||||
| Operating income/(loss), net |
275.8 | (297.3 | ) | 358.7 | |||||
| Net financing costs |
(34.0 | ) | (29.2 | ) | (22.5 | ) | |||
| Income/(loss) before income taxes |
241.8 | (326.5 | ) | 336.2 | |||||
| Income taxes |
(77.7 | ) | (67.2 | ) | (116.4 | ) | |||
| Net income/(loss) |
164.1 | (393.7 | ) | 219.8 | |||||
The following tables set forth for the periods indicated, the underlying selling, general and administrative expenses adjusted for the change in US vacation entitlement policy and underlying operating income adjusted for the change in US vacation entitlement policy, goodwill impairment and relisting costs:
| Fiscal 2010 |
Fiscal 2009 |
Fiscal 2008 |
|||||||
| $million | $million | $million | |||||||
| Selling, general and administrative expenses |
(916.5 | ) | (969.2 | ) | (1,000.8 | ) | |||
| Add impact of change in US vacation entitlement policy |
(13.4 | ) | — | — | |||||
| Underlying selling, general and administrative expenses(1) |
(929.9 | ) | (969.2 | ) | (1,000.8 | ) | |||
| Fiscal 2010 |
Fiscal 2009 |
Fiscal 2008 |
|||||||
| $million | $million | $million | |||||||
| Operating income/(loss) |
275.8 | (297.3 | ) | 358.7 | |||||
| Add impairment of goodwill |
— | 516.9 | — | ||||||
| Add relisting costs |
— | 10.5 | — | ||||||
| Less impact of change in US vacation entitlement policy |
(13.4 | ) | — | — | |||||
| Underlying operating income(1) |
262.4 | 230.1 | 358.7 | ||||||
| (1) | Non-GAAP measure, see Item 6. |
59
Table of Contents
The following table sets forth for the periods indicated, the percentage of net sales represented by certain items included in the statements of consolidated income:
| Fiscal 2010 |
Fiscal 2009 |
Fiscal 2008 |
|||||||
| % | % | % | |||||||
| Sales |
100.0 | 100.0 | 100.0 | ||||||
| Cost of sales |
(67.3 | ) | (67.7 | ) | (65.9 | ) | |||
| Gross margin |
32.7 | 32.3 | 34.1 | ||||||
| Selling, general and administrative |
(27.8 | ) | (29.0 | ) | (27.3 | ) | |||
| Impairment of goodwill |
— | (15.5 | ) | — | |||||
| Relisting costs |
— | (0.3 | ) | — | |||||
| Other operating income, net |
3.5 | 3.6 | 3.0 | ||||||
| Operating income/(loss), net |
8.4 | (8.9 | ) | 9.8 | |||||
| Net financing costs |
(1.1 | ) | (0.9 | ) | (0.6 | ) | |||
| Income/(loss) before income taxes |
7.3 | (9.8 | ) | 9.2 | |||||
| Income taxes |
(2.3 | ) | (2.0 | ) | (3.2 | ) | |||
| Net income/(loss) |
5.0 | (11.8 | ) | 6.0 | |||||
The following tables set forth for the periods indicated, the percentage of net sales represented by the underlying selling, general and administrative expenses adjusted for the change in US vacation entitlement policy and underlying operating income adjusted for the change in US vacation entitlement policy, goodwill impairment and relisting costs:
| Fiscal 2010 |
Fiscal 2009 |
Fiscal 2008 |
|||||||
| % | % | % | |||||||
| Selling, general and administrative |
(27.8 | ) | (29.0 | ) | (27.3 | ) | |||
| Add impact of change in US vacation entitlement policy |
(0.4 | ) | — | — | |||||
| Underlying selling, general and administrative expenses(1) |
(28.2 | ) | (29.0 | ) | (27.3 | ) | |||
| Fiscal 2010 |
Fiscal 2009 |
Fiscal 2008 |
|||||||
| % | % | % | |||||||
| Operating income/(loss) |
8.4 | (8.9 | ) | 9.8 | |||||
| Add impairment of goodwill |
— | 15.5 | — | ||||||
| Add relisting costs |
— | 0.3 | — | ||||||
| Less impact of change in US vacation entitlement policy |
(0.4 | ) | — | — | |||||
| Underlying operating income(1) |
8.0 | 6.9 | 9.8 | ||||||
| (1) | Non-GAAP measure, see Item 6. |
60
Table of Contents
The following table sets forth for fiscal 2010 and fiscal 2009 certain items included in the statement of consolidated income at constant exchange rates. Information for fiscal 2008 at constant exchange rates is not provided as this is the first time that Signet has provided this additional disclosure.
| Fiscal 2010 reported |
Fiscal 2009 reported |
Change as reported |
Impact of exchange rate movement |
Fiscal 2009 at constant exchange rates (non-GAAP) |
Fiscal 2010 change at constant exchange rates (non-GAAP) |
|||||||||||||
| $million | $million | % | $million | $million | % | |||||||||||||
| Sales |
3,290.7 | 3,344.3 | (1.6 | ) | (73.9 | ) | 3,270.4 | 0.6 | ||||||||||
| Cost of sales |
(2,213.8 | ) | (2,264.2 | ) | (2.2 | ) | 48.4 | (2,215.8 | ) | (0.1 | ) | |||||||
| Gross margin |
1,076.9 | 1,080.1 | (0.3 | ) | (25.5 | ) | 1,054.6 | 2.1 | ||||||||||
| Sales, general & administrative costs |
(916.5 | ) | (969.2 | ) | (5.4 | ) | 20.5 | (948.7 | ) | (3.4 | ) | |||||||
| Goodwill impairment |
— | (516.9 | ) | n/a | (10.5 | ) | (527.4 | ) | n/a | |||||||||
| Relisting costs |
— | (10.5 | ) | n/a | — | (10.5 | ) | n/a | ||||||||||
| Other operating income, net |
115.4 | 119.2 | (3.2 | ) | (0.4 | ) | 118.8 | (2.9 | ) | |||||||||
| Operating income/(loss) |
275.8 | (297.3 | ) | n/a | (15.9 | ) | (313.2 | ) | n/a | |||||||||
In the following analysis of results, while the overall performance is discussed, the focus of the commentary is on the US and UK divisions individually, as this reflects the way that Signet is managed. The analysis of the UK division is based on constant exchange rates as the division’s performance is managed in pounds sterling as sales and costs are both incurred in that currency.
Divisional operating income before the impact of the change in US vacation entitlement policy, goodwill impairment and relisting costs is given in the following table:
| Fiscal 2010 |
Fiscal 2009 |
Fiscal 2008 |
|||||||
| $million | $million | $million | |||||||
| Operating income/(loss), net |
|||||||||
| US |
235.8 | (236.4 | ) | 265.2 | |||||
| UK |
56.5 | (37.4 | ) | 109.3 | |||||
| Unallocated |
(16.5 | ) | (23.5 | ) | (15.8 | ) | |||
| Consolidated total |
275.8 | (297.3 | ) | 358.7 | |||||
| Impact of change in US vacation policy in fiscal 2010, goodwill impairment and relisting costs in fiscal 2009 |
|||||||||
| US |
13.4 | (408.0 | ) | — | |||||
| UK |
— | (108.9 | ) | — | |||||
| Unallocated (relisting costs) |
— | (10.5 | ) | — | |||||
| Consolidated total |
13.4 | (527.4 | ) | — | |||||
| Underlying operating income(1) |
|||||||||
| US |
222.4 | 171.6 | 265.2 | ||||||
| UK |
56.5 | 71.5 | 109.3 | ||||||
| Unallocated |
(16.5 | ) | (13.0 | ) | (15.8 | ) | |||
| Consolidated total |
262.4 | 230.1 | 358.7 | ||||||
| (1) | Non-GAAP measure, see Item 6. |
61
Table of Contents
COMPARISON OF FISCAL 2010 TO FISCAL 2009
Summary of fiscal 2010
| • | Same store sales: down by 0.4% |
| • | Total sales: down by 1.6% to $3,290.7 million |
| • | Operating margin: increased to 8.4% |
| – | Underlying operating margin 8.0%: up 110 basis points(1) |
| • | Operating income: up to $275.8 million |
| – | Underlying operating income: up by 14.0% to $262.4 million(1) |
| • | Net income before income taxes: up to $241.8 million |
| – | Underlying net income before income taxes: up by 13.7% to $228.4 million(1) |
| • | Diluted earnings per share: up to $1.91 |
| – | Underlying diluted earnings per share: up 15.9% to $1.82(1) |
| (1) | Non-GAAP measure, see Item 6. |
Sales
Same store sales fell 0.4% in fiscal 2010. Total sales were down by 1.6% to $3,290.7 million (fiscal 2009: $3,344.3 million), reflecting an increase of 0.6% at constant exchange rates; non-GAAP measure, see Item 6. The breakdown of the sales performance was as follows:
Change in sales
| US | UK | Signet | ||||||||||
| % | % | % | ||||||||||
| Same store sales |
0.2 | (2.4 | ) | (0.4 | ) | |||||||
| Change in net new store space |
0.6 | 2.3 | 1.0 | |||||||||
| Change at constant exchange rates |
0.8 | (0.1 | ) | 0.6 | ||||||||
| Exchange translation(1) |
— | (9.2 | ) | (2.2 | ) | |||||||
| Total sales growth as reported |
0.8 | (9.3 | ) | (1.6 | ) | |||||||
| Sales, million |
$ | 2,557.5 | $ | 733.2 | $ | 3,290.7 | ||||||
| % of total |
77.7 | % | 22.3 | % | 100.0 | % | ||||||
| (1) | The average pound sterling to US dollar exchange rate for the period was £1/$1.59 (fiscal 2009: £1/$1.75). |
62
Table of Contents
US sales
The sales performance in fiscal 2010 was primarily influenced by the challenging economic conditions with same store sales up 0.2% and total sales up by 0.8% to $2,557.5 million (fiscal 2009: $2,536.1 million). Trading in fiscal 2010 started much stronger than the end of the fourth quarter of fiscal 2009, with the Valentine’s Day period achieving a small increase in same store sales. The balance of the first quarter, and the second quarter saw same store sales down between 4% and 6%. Spending by higher income consumers was particularly weak in the first half, and this was reflected in the performance of Jared. The rate of decrease in same store sales slowed in the third quarter to 2.4% as a result of a marked slowing in the rate of sales decline experienced in Jared. The mall brands maintained broadly stable same store sales in the first three quarters. Same store sales in the fourth quarter increased by 7.4%. In fiscal 2010, the contribution from net changes in store space was 0.6%, much less than in recent years. Sales performance by format is given in the table below.
| Fiscal 2010 |
Fiscal 2009 |
Change | Change in store space |
Same store sales |
Change in average selling price |
|||||||||||
| $million | $million | % | % | % | % | |||||||||||
| Kay |
1,508.2 | 1,439.1 | 4.8 | (0.4 | ) | 4.4 | (7.4 | ) | ||||||||
| Regional brands |
326.8 | 370.8 | (11.9 | ) | 7.9 | (4.0 | ) | (4.8 | ) | |||||||
| Mall brands |
1,835.0 | 1,809.9 | 1.4 | 1.4 | 2.8 | (7.1 | ) | |||||||||
| Jared |
722.5 | 726.2 | (0.5 | ) | (5.5 | ) | (6.0 | ) | (7.3 | )(1) | ||||||
| US division |
2,557.5 | 2,536.1 | 0.8 | (0.6 | ) | 0.2 | (16.8 | ) | ||||||||
| (1) | Excluding charm bracelet category. |
In fiscal 2010, there was a decrease in average unit selling price of 16.8%, which was due to mix changes reflecting customers’ buying patterns rather than reduced prices. The decline in average unit selling price was balanced by an increase in transaction volumes, which resulted in same store sales being little different from the prior year. During the first nine months the decrease in average unit selling price was 13%, and in the fourth quarter the decline was 19.6%. For Kay and the regional brands, the average unit selling price in fiscal 2010 fell by 7.4% and 4.8% respectively. For Jared, the average unit selling price, excluding the charm bracelet category, decreased by 7.3% in fiscal 2010.
Charm bracelets are a successful initiative tested in some Jared stores beginning in October 2008 and rolled out to nearly all Jared stores in October 2009. The characteristics of the charm bracelet category are very different from that of the typical Jared merchandise. For example, the average unit selling price of a charm is only about 5% of the average selling price of other merchandise in Jared; however charms have a much greater frequency of purchase and a transaction often involves multiple units. If the charm bracelet category was included in the Jared average unit selling price, the trend in customer transactions in a significant majority of the business would not be demonstrated.
UK sales
In fiscal 2010, UK same store sales decreased by 2.4% and total sales declined by 9.3% to $733.2 million (fiscal 2009: $808.2 million), a fall of 0.1% at constant exchange rates; non-GAAP measure, see Item 6. In the first three quarters of fiscal 2010, same store sales decreased by 3.0%. The fourth quarter saw some improvement in trend with same store sales declining by 1.5%. The average unit selling price rose, reflecting price increases implemented to offset a rise in the cost of goods sold. The impact of changes in net store space was a sales increase of 2.3% reflecting a lower level of temporary store closures as a result of a reduced level of store refurbishments. The change in the average US dollar to pound sterling exchange rate from $1.75 in fiscal 2009 to $1.59 in fiscal 2010 reduced reported sales by 9.2%. Sales in pounds sterling declined in H.Samuel by 1.0% to £247.8 million (fiscal 2009: £250.3 million) and in Ernest Jones rose by 0.7% to £209.8 million (fiscal 2009: £208.3 million).
63
Table of Contents
| Fiscal 2010 |
Fiscal 2009 |
Change | Impact of exchange rate movement |
Change at constant exchange rates(1) (non-GAAP) |
Change in store space |
Same store sales |
Change in average selling price |
|||||||||||||||
| $million | $million | % | % | % | % | % | % | |||||||||||||||
| H.Samuel |
394.0 | 438.0 | (10.0 | ) | (9.0 | ) | (1.0 | ) | (0.7 | ) | (1.7 | ) | 7.8 | |||||||||
| Ernest Jones |
333.5 | 364.5 | (8.5 | ) | (9.2 | ) | 0.7 | (3.9 | ) | (3.2 | ) | 12.5 | (2) | |||||||||
| Other |
5.7 | 5.7 | n/a | n/a | n/a | n/a | n/a | n/a | ||||||||||||||
| UK division |
733.2 | 808.2 | (9.3 | ) | (9.2 | ) | (0.1 | ) | (2.3 | ) | (2.4 | ) | 5.5 | |||||||||
| (1) | Non-GAAP measure, see Item 6. |
| (2) | Excluding charm bracelet category. |
In fiscal 2010, the average unit selling price was up 5.5%, which was primarily due to higher prices reflecting an increase in the cost of acquiring merchandise as a result of the weakness of the pound sterling against the US dollar, and higher commodity costs. However, the increase in average unit selling prices was balanced by a decrease in transaction volumes resulting in same store sales being little different from the prior year. During the first three quarters the average unit selling price increased by 6.6%, and in the fourth quarter it rose by 3.9%. The average unit selling price in H.Samuel rose by 7.8% and in Ernest Jones, excluding the charm bracelet category, by 12.5%. The Ernest Jones average unit price excludes the charm bracelet category as its characteristics are very different from that of the typical Ernest Jones merchandise. For example, the average unit selling price of a charm is only about 10% of the average selling price of other merchandise in Ernest Jones but charms have a much greater frequency of purchase and a transaction often involves multiple units.
Cost of sales
In fiscal 2010, cost of sales was $2,213.8 million (fiscal 2009: $2,264.2 million), a decline of 2.2% as reported and 0.1% at constant exchange rates; non-GAAP measure, see Item 6. The decrease in cost of sales reflected lower sales, a small increase in gross merchandise margin rate, lower operating costs of retail units and a higher level of net bad debt provision on customer receivables in the US division.
Gross margin
In fiscal 2010, gross margin was $1,076.9 million (fiscal 2009: $1,080.1 million), down by 0.3% and up by 2.1% at constant exchange rates; non-GAAP measure, see Item 6.
Selling, general and administrative expenses
In fiscal 2010, selling, general and administrative expenses were $916.5 million (fiscal 2009: $969.2 million), down by 5.4% on a reported basis and by 3.4% at constant exchange rates; non-GAAP measure, see Item 6. This decrease reflected savings in employment costs and lower marketing expenditure.
Other operating income
In fiscal 2010, other operating income, which is predominantly interest income from in-house customer finance, was $115.4 million (fiscal 2009: $119.2 million), down by 3.2%. This primarily reflected lower sales in fiscal 2009. In fiscal 2010, there was a lower monthly collection rate of 12.5% (fiscal 2009: 13.1%). Sales using in-house customer finance were similar to the prior year at 53.5% of total sales (fiscal 2009: 53.2%)
64
Table of Contents
Operating income, net
In fiscal 2010, operating income was $275.8 million (fiscal 2009: loss $297.3 million), an underlying increase of 14.0%. The underlying increase at constant exchange rates was 16.7%; non-GAAP measure, see Item 6. The factors influencing the operating margin are set out below.
Operating margin movement
| US | UK | Total | |||||||
| % | % | % | |||||||
| Fiscal 2009 operating margin |
(9.3 | ) | (4.6 | ) | (8.9 | )(2) | |||
| Goodwill impairment and relisting costs |
16.1 | 13.4 | 15.8 | ||||||
| Fiscal 2009 underlying operating margin(1) |
6.8 | 8.8 | 6.9 | (2) | |||||
| Gross merchandise margin |
0.4 | (0.2 | ) | 0.2 | |||||
| Expenses leverage/(deleverage) |
1.5 | (0.9 | ) | 0.9 | |||||
| Fiscal 2010 underlying operating margin(1) |
8.7 | 7.7 | 8.0 | (2) | |||||
| Change in US vacation entitlement policy |
0.5 | — | 0.4 | ||||||
| Fiscal 2010 operating margin |
9.2 | 7.7 | 8.4 | (2) | |||||
| (1) | Non-GAAP measure, see Item 6. |
| (2) | Includes unallocated costs, principally central costs; see page 66. |
US division operating income
In fiscal 2010, the US division’s operating income was $235.8 million (fiscal 2009: loss $236.4 million), an underlying increase of 29.6%; non-GAAP measure, see Item 6. See table above for an analysis of the movement in operating margin.
Gross merchandise margin rate was in-line with management’s expectations at the start of fiscal 2010 and increased by 40 basis points compared to fiscal 2009. There was a broadly neutral impact from commodity costs, with lower diamond prices offsetting a higher cost of gold. The growth in differentiated merchandise was balanced by higher sales of value items. A lower average selling price, the growth in sales by Kay and price increases implemented in the first quarter of fiscal 2009 were beneficial. In the fourth quarter, a decline of 30 basis points in gross merchandise margin reflected a planned increase of more promotional value items in the sales mix.
A $100 million cost saving program was an important initiative in fiscal 2010. Prompt action was taken at the start of the year to realign the cost base to the lower level of sales, without weakening the division’s competitive position. Store staff hours and divisional head office staffing levels were both reduced. The $100 million target was slightly exceeded and some of the additional savings were reinvested in national television advertising in the fourth quarter. The net change in space had little impact on expenses in fiscal 2010. The cost reduction program more than offset the combined effect of cost inflation and an adverse net bad debt performance, delivering a net positive impact of 150 basis points to US operating margin from expenses.
As part of the cost reduction program, it was planned that the ratio of gross marketing spend to sales should be realigned to a range typical of the period before fiscal 2008, that is 6.4% to 7.0%, from 7.4% in fiscal 2009. However, as a result of a better than anticipated performance in fourth quarter sales, the ratio was 6.0%. Marketing expenditure was concentrated on the most productive channels and brands, that is national television advertising for Kay and Jared, and direct marketing for all brands. Gross marketing expenditure was $153.0 million (fiscal 2009: $188.4 million).
The largest element of the central cost reductions related to the dismantling of the infrastructure previously required to support annual space growth of 8% to 10%.
65
Table of Contents
It is anticipated that future changes in store hours are likely to be proportionate to changes in sales; while the advertising to sales ratio is expected to return over time to historic levels, subject to unexpected changes in fourth quarter sales performance. The infrastructure to support space growth will only begin to be reinstated when the US division identifies new opportunities that satisfy the required investment returns.
The net bad debt charge at 5.6% of total US sales during fiscal 2010 (fiscal 2009: 4.9%) continued well above the 2.8% to 3.4% range of the ten years prior to fiscal 2009. Some initial signs of stabilization in the ratio were seen in the fourth quarter. Credit participation was little changed at 53.5% during fiscal 2010 (fiscal 2009: 53.2%).
Change in US vacation entitlement policy
In fiscal 2010, there was a $13.4 million benefit from a change in the US division’s vacation entitlement policy that will not be repeated in future years. Previously employees became entitled to their full annual vacation allowance if they were employed on the first day of the year. Commencing in fiscal 2010, holiday entitlement is accrued over the fiscal year broadly in line with employment.
UK division operating income
In fiscal 2010, the UK division’s operating income was $56.5 million (fiscal 2009: loss $37.4 million), an underlying decrease of 21.0%, and of 13.1% at constant exchange rates; non-GAAP measure, see Item 6. See table above for an analysis of the movement in operating margin.
Gross merchandise margin percentage was a little better than management’s expectations at the start of fiscal 2010 and decreased by 20 basis points compared to fiscal 2009. Price increases largely offset the impact of higher gold costs and the weakness of pound sterling against the US dollar.
Despite a broadly stable pound sterling cost base, there was a negative impact of 90 basis points on the operating margin due to sales deleverage as a result of the decline in same store sales. The cost base was a little higher than originally targeted, as additional property closure expenses were incurred in the fourth quarter. While UK management undertook a cost reduction exercise, there was less opportunity to reduce costs than in the US division as a similar review had already occurred in the UK in fiscal 2007. In addition, inflationary cost pressures were greater in the UK than in the US from property rental expenses and pension costs. Gross marketing spend was reduced to $16.3 million in fiscal 2010 (fiscal 2009: $22.1 million), the decrease at constant exchange rates was 19.1%. The marketing spend to sales ratio declined to 2.2% (fiscal 2009: 2.8%). H.Samuel continued to use television advertising in the fourth quarter, but at a reduced level. Customer relationship marketing was increased for both H.Samuel and Ernest Jones.
Unallocated costs
Unallocated costs principally relate to costs that are not allocated to the US and UK divisions in Signet’s management accounts (“central costs”), and were $16.5 million in fiscal 2010 (fiscal 2009: $23.5 million), the decrease due to the absence of $10.5 million relisting costs. The underlying increase mainly reflected higher costs relating to staff and advisors.
Interest income and expense
In fiscal 2010, interest income fell to $0.8 million (fiscal 2009: $3.6 million), as a result of lower interest rates. Interest expense rose to $34.8 million (fiscal 2009: $32.8 million). While there were lower levels of variable debt and a $100 million prepayment at par to note holders made in March 2009, the rate of interest on the outstanding notes increased by 200 basis points, and there was a charge of $3.4 million in the first quarter in respect of fees associated with the amendment of Signet’s borrowing agreements. Further costs of $5.9 million were capitalized and $0.9 million of the capitalized amount was amortized in fiscal 2010.
66
Table of Contents
Income/(loss) before income taxes
In fiscal 2010, income before income taxes was $241.8 million (fiscal 2009: loss $326.5 million), an underlying increase of 13.7%, and an underlying increase at constant exchange rates of 16.9%; non-GAAP measures, see Item 6.
Provision for income taxes
In fiscal 2010, the charge to income taxes was $77.7 million (fiscal 2009: $67.2 million), an effective tax rate of 32.1% (fiscal 2009: (20.6%)). The underlying effective tax rate in fiscal 2010, excluding the US vacation entitlement policy adjustment was 31.8% (fiscal 2009: 33.5% underlying effective tax rate excluding goodwill impairment and relisting costs). The decline of 170 basis points in the underlying effective tax rate primarily related to the benefit of changes in intra-group financing arrangements and the favorable resolution of certain prior year tax issues. Subject to the geographic mix of taxable income and the outcome of various uncertain tax positions (see Note 6 of Item 8), the effective tax rate in fiscal 2011 is expected to be approximately 33%.
Net income/(loss)
In fiscal 2010, net income was $164.1 million (fiscal 2009: net loss $393.7 million) reflecting an underlying increase of 16.5%, and an underlying increase at constant exchange rates of 19.9%; non-GAAP measure, see Item 6.
Earnings/(loss) per share
In fiscal 2010, basic and diluted earnings per share were $1.92 and $1.91 respectively (fiscal 2009: loss per share basic and diluted: $4.62), an underlying increase in basic and diluted earnings per share of 16.6% and 15.9%, and an underlying increase at constant exchange rates of 20.4% and 19.7% respectively; non-GAAP measure, see Item 6.
COMPARISON OF FISCAL 2009 TO FISCAL 2008
Summary of fiscal 2009
| • | Same store sales: down by 8.2% |
| • | Total sales: down by 8.8% to $3,344.3 million |
| • | Operating margin (8.9)%; down 1880 basis points |
| – | Underlying operating margin 6.9%: down 290 basis points(1) |
| • | Net operating loss of $297.3 million |
| – | Underlying net operating profit: down by 35.9% to $230.1 million(1) |
| • | Net loss before income taxes: $326.5 million |
| – | Underlying net income before income taxes: down by 40.2% to $200.9 million(1) |
| • | Loss per share: $4.62 |
| – | Underlying earnings per share: down 39.1% to $1.57(1) |
| (1) | Non-GAAP measures, see Item 6. |
67
Table of Contents
Sales
In fiscal 2009, total sales decreased to $3,344.3 (fiscal 2008: $3,665.3 million), down by 8.8% on a reported basis and 5.7% at constant exchange rates; non-GAAP measures, see Item 6. This reflected lower sales in both the US and UK divisions due to the factors discussed below.
Components of fiscal 2009 sales movement
| US | UK | Total | |||||||
| % | % | % | |||||||
| Same store sales |
(9.7 | ) | (3.3 | ) | (8.2 | ) | |||
| Change in net new store space |
3.4 | (0.5 | ) | 2.5 | |||||
| Sales at constant exchange rates |
(6.3 | ) | (3.8 | ) | (5.7 | ) | |||
| Exchange translation |
— | (12.0 | ) | (3.1 | ) | ||||
| Total sales decline |
(6.3 | ) | (15.8 | ) | (8.8 | ) | |||
US sales
In a very challenging retail environment, US same store sales were down 9.7% and total sales were $2,536.1 million in fiscal 2009 (fiscal 2008: $2,705.7 million). Sales performance was primarily driven by the difficult economic conditions with same store sales falling by 6.0% in the first three quarters. Following the sharp deterioration in consumer sentiment in mid September 2008, and a further decline in early December 2008, same store sales in the fourth quarter were 16.1% lower than the comparable quarter in fiscal 2008. Spending by higher income consumers was particularly weak in the fourth quarter, and this was reflected in the performance of Jared. The contribution from net new store space was 3.4%, less than in recent years, reflecting a slower rate of expansion. Sales declined in Kay by 3.4% to $1,439.1 million (fiscal 2008: $1,489.6 million), in Jared by 4.0% to $726.2 million (fiscal 2008: $756.4 million) and in the regional brands by 19.3% to $370.8 million (fiscal 2008: $459.7 million).
The average unit selling price increased by 0.3% in fiscal 2009. During the first nine months the increase was 7% (mall brands up by 7% and Jared up by 5%), reflecting the price increases implemented in the first quarter. However, in the fourth quarter the consumer traded down and the average unit selling price decreased by 10% (mall brands down by 7% and Jared down by 4%). The Jared average unit price excludes the impact of the launch of a new charm bracelet range in some stores. The overall volume of transactions in fiscal 2009 was significantly lower than in fiscal 2008.
UK sales
In fiscal 2009, same store sales decreased by 3.3% (H.Samuel down 2.6% and Ernest Jones down 4.0%). Total sales decreased by 3.8% at constant exchange rates and were $808.2 million as reported (fiscal 2008: $959.6 million). In the first nine months of fiscal 2009, same store sales increased 0.8% (H.Samuel up by 1.1% and Ernest Jones up by 0.5%). As in the US, the fourth quarter experienced a sharp deterioration in consumer sentiment with the upper end consumer being particularly weak. As a result, same store sales declined from the prior year by 9.2% (H.Samuel down by 7.8% and Ernest Jones by 11.0%). The impact of changes in net new store space was to decrease sales by 0.5% and foreign exchange movements reduced reported sales by 12.0%. Sales in pounds sterling declined in H.Samuel by 2.5% to £250.3 million (fiscal 2008: £256.7 million) and in Ernest Jones by 5.1% to £208.3 million (fiscal 2008: £219.4 million).
The average unit selling price increased 9% in fiscal 2009, reflecting price increases implemented in late fiscal 2008 and early fiscal 2009 and merchandise mix changes. The consumer was more cautious in the fourth quarter, with average unit selling price in the first three quarters having been up 12% over the comparable period in fiscal 2008 and up by only 4% in the fourth quarter. The watch category performed better than average, particularly the
68
Table of Contents
prestige ranges in Ernest Jones. The number of key value items were increased and performed well. The volume of transactions in fiscal 2009 was significantly lower than in fiscal 2008.
Cost of sales
In fiscal 2009, cost of sales was $2,264.2 million (fiscal 2008: $2,414.6 million), the decline of 6.2% reflecting lower sales partly offset by increases in expenses associated with new stores and a higher cost of gold.
Gross margin
In fiscal 2009, gross margin was $1,080.1 million (fiscal 2008: $1,250.7 million), down by 13.6%. This reflected deleverage of the expense base.
Selling, general and administrative expenses
In fiscal 2009, selling, general and administrative expenses were $969.2 million (fiscal 2008: $1,000.8 million), down by 3.2%. This decrease reflected expense savings and the impact of the change in the pound sterling to US dollar exchange rate on selling, general and administrative expenses in the UK division and central function.
Other operating income
In fiscal 2009, other operating income was $119.2 million (fiscal 2008: $108.8 million), up by 9.6%. This primarily reflected the decline in US sales being more than offset by the growth of sales funded by the in-house customer finance which rose to 53.2% of total sales (fiscal 2008: 52.6%) and a lower monthly collection rate of 13.1% (fiscal 2008: 13.9%).
Operating loss, net
On a reported basis there was a net operating loss of $297.3 million (fiscal 2008: $358.7 million). Underlying net operating income was $230.1 million; non-GAAP measure, see Item 6. The factors influencing the operating margin are set out below.
Operating margin movement
| US | UK | Total(2) | |||||||
| % | % | % | |||||||
| Fiscal 2008 operating margin |
9.8 | 11.4 | 9.8 | ||||||
| Gross merchandise margin |
1.2 | — | 0.9 | ||||||
| Expenses deleverage |
(4.2 | ) | (2.6 | ) | (3.8 | ) | |||
| Underlying fiscal 2009 margin(1) |
6.8 | 8.8 | 6.9 | ||||||
| Goodwill impairment and relisting costs |
(16.1 | ) | (13.4 | ) | (15.8 | ) | |||
| Fiscal 2009 operating margin |
(9.3 | ) | (4.6 | ) | (8.9 | ) | |||
| (1) | Non-GAAP measure, see Item 6. |
| (2) | Includes unallocated costs, principally central costs. |
US division operating loss
In fiscal 2009, the US division’s operating loss was $236.4 million (fiscal 2008: income $265.2 million). The underlying operating income was $171.6 million; non-GAAP measure, see Item 6. See table above for an analysis of the year to year change in operating margin. Gross merchandise margin rate was ahead of expectations and increased by 120 basis points compared to last year, with a particularly strong performance in
69
Table of Contents
the fourth quarter. This reflected price increases implemented during the first quarter of fiscal 2009 and favorable changes in mix resulting from management initiatives, including the planned expansion of exclusive merchandise, which more than offset commodity cost increases. There was a negative impact of 380 basis points in fiscal 2008 reflecting the deleverage of the underlying cost base due to the decline in same store sales, which included the impact of the adverse move in performance of the receivables portfolio, and of 40 basis points due to the impact of new store space.
In fiscal 2009, the net bad debt charge, at 4.9% of total sales (fiscal 2008: 3.4%), was well above the 2.8% to 3.4% range of the past ten years. This reflected the challenging economic environment. The increase in bad debt was partially offset by higher income from the receivables portfolio. Credit participation increased somewhat to 53.2% (fiscal 2008: 52.6%) reflecting a higher level of applications offset by a significant increase in the level of credit applications rejected. The fall in credit acceptance rate reflected management action to reduce exposure to particular types of customer and a lower proportion of customers satisfying the US division’s credit requirements.
Overall the expense base in fiscal 2009 was similar to fiscal 2008, excluding the impact of new space. Tight control of costs offset the increase in net bad debt charge and inflationary cost increases in occupancy, utilities, freight and staff wage rates. Actions taken included reductions in store staff hours partly to reflect lower transaction volumes, significantly lower levels of radio advertising and savings in central costs.
UK division operating loss
In fiscal 2009, the UK division’s net operating loss was $37.4 million (fiscal 2008: income $109.3 million). The underlying operating income was $71.5 million; non-GAAP measure, see Item 6. See table above for an analysis of the movement in operating margin. The gross merchandise margin rate was unchanged with price increases offsetting adverse mix changes, greater promotional activity and higher commodity costs. There was a negative impact of 260 basis points in fiscal 2009 reflecting the deleverage of the underlying cost base due to the decline in same store sales.
Overall, a tight control of expenses resulted in the underlying cost base in fiscal 2009 being broadly similar to that in fiscal 2008. Actions taken included reductions in staff costs and changes in the marketing strategy for Ernest Jones.
Unallocated costs
Unallocated cost principally related to central costs and in fiscal 2009 were $13.0 million (fiscal 2008: $15.8 million). This reflected the movement in the pound sterling to US dollar exchange rate, as well as a foreign exchange gain more than offsetting an underlying increase in costs.
Goodwill impairment
Historically management undertook an annual goodwill impairment test at its year end or when there was a triggering event. In fiscal 2009, in addition to the annual impairment review, there were a number of triggering events in the fourth quarter due to a significant decline in profitability reflecting the impact of the economic downturn on operations, and the even greater decline in its share price resulting in a substantial discount of the market capitalization to net tangible asset value (that is, shareholders’ funds excluding intangible assets). An evaluation of the recorded goodwill was undertaken and it was determined that it was impaired. Accordingly, to reflect the impairment, Signet recorded a non-cash charge of $516.9 million, which eliminated the value of goodwill on its balance sheet. See “Critical accounting policies” starting on page 84 for further details. The goodwill write off had no impact on borrowing agreements or the net tangible assets of Signet.
70
Table of Contents
Relisting costs
On September 11, 2008, the primary listing of Signet moved to the NYSE from the LSE and the parent company became Signet Jewelers Limited, a Bermuda domiciled company. The non-recurring costs associated with these changes amounted to $10.5 million.
Interest income and expenses
In fiscal 2009, net financial costs rose to $29.2 million (fiscal 2008: $22.5 million). The increase was primarily due to higher levels of net debt.
(Loss)/income before income taxes
In fiscal 2009, loss before income taxes was $326.5 million (fiscal 2008: income of $336.2 million). Excluding goodwill impairment and relisting costs, income before income tax was $200.9 million, down by 40.2% on a reported basis and by 38.0% on a constant exchange rate basis; non-GAAP measure, see Item 6.
Provision for income taxes
The charge to income taxes was $67.2 million in fiscal 2009 (fiscal 2008: $116.4 million), an effective tax rate of (20.6)% (fiscal 2008: 34.6%). The underlying effective tax rate in fiscal 2009 excluding goodwill impairment and relisting costs was 33.5% (fiscal 2008: underlying effective tax rate 34.6%). The decline of 110 basis points in the underlying effective rate reflected a lower proportion of profits from the US division and a reduced level of expenditure disallowable for tax than in fiscal 2008.
Net (loss)/income
The net loss for fiscal 2009 was $393.7 million (fiscal 2008: $219.8 million net income). Underlying net income for fiscal 2009 was $133.7 million (fiscal 2008: $219.8 million); non-GAAP measure, see Item 6.
(Loss)/earnings per share
On a reported basis, basic and diluted loss per share were $4.62 (fiscal 2008 earnings per share: basic $2.58 and diluted $2.55). Underlying basic and diluted earnings per share in fiscal 2009 were both $1.57; non-GAAP measure, see Item 6.
71
Table of Contents
LIQUIDITY AND CAPITAL RESOURCES
Summary cash flow
The following table provides a summary of Signet’s cash flows for fiscal 2010, fiscal 2009 and fiscal 2008:
| Fiscal 2010 |
Fiscal 2009 |
Fiscal 2008 |
|||||||
| $million | $million | $million | |||||||
| Net income/(loss) |
164.1 | (393.7 | ) | 219.8 | |||||
| Adjustments to reconcile net income/(loss) to net cash provided by operating activities |
129.8 | 653.5 | 113.8 | ||||||
| Net income adjusted for non-cash items(1) |
293.9 | 259.8 | 333.6 | ||||||
| Changes in operating assets and liabilities |
221.5 | (95.4 | ) | (192.8 | ) | ||||
| Net cash provided by operating activities |
515.4 | 164.4 | 140.8 | ||||||
| Net cash flows used in investing activities |
(43.5 | ) | (113.3 | ) | (139.4 | ) | |||
| Free cash flow(1) |
471.9 | 51.1 | 1.4 | ||||||
| Dividends paid |
— | (123.8 | ) | (123.9 | ) | ||||
| Net change in common shares(2) |
1.0 | 0.1 | (23.0 | ) | |||||
| 472.9 | (72.6 | ) | (145.5 | ) | |||||
| (Repayment)/proceeds of debt during year(3) |
(243.4 | ) | 160.6 | 31.1 | |||||
| Facility amendment fees paid |
(9.3 | ) | — | — | |||||
| Increase/(decrease) in cash and cash equivalents |
220.2 | 88.0 | (114.4 | ) | |||||
| (1) | Non-GAAP measure, see Item 6. |
| (2) | Proceeds from issuance of Common Shares less purchase of treasury shares. |
| (3) | Proceeds from short term borrowings less repayment of long term debt. |
Reconciliation of changes in net debt(2)
The following table provides a reconciliation of Signet’s changes in net debt for fiscal 2010, fiscal 2009 and fiscal 2008:
| Fiscal 2010 |
Fiscal 2009 |
Fiscal 2008 |
|||||||
| $million | $million | $million | |||||||
| Repayment/(proceeds) of debt during year(1) |
243.4 | (160.6 | ) | (31.1 | ) | ||||
| Increase/(decrease) in cash and cash equivalents |
220.2 | 88.0 | (114.4 | ) | |||||
| Change in net debt during the year(2) |
463.6 | (72.6 | ) | (145.5 | ) | ||||
| Net debt at start of period(2) |
(470.7 | ) | (374.6 | ) | (233.2 | ) | |||
| Net debt at end of period before effect of exchange rate changes(2) |
(7.1 | ) | (447.2 | ) | (378.7 | ) | |||
| Effect of exchange rate changes on cash and cash equivalents |
(0.8 | ) | (32.9 | ) | 3.8 | ||||
| Effect of exchange rate changes on short term borrowings and long term debt |
— | 9.4 | 0.3 | ||||||
| Net debt at end of period |
(7.9 | ) | (470.7 | ) | (374.6 | ) | |||
| (1) | Proceeds from short term borrowings less repayment of long term debt. |
| (2) | Non-GAAP measure, see Item 6. |
72
Table of Contents
OVERVIEW
Managements’s objective is to maintain a strong balance sheet, as it regards financial stability as a competitive advantage. Another important factor in determining financial stability is liquidity, or access to cash. In the current challenging economic environment these two factors take on additional importance.
Operating activities provide the primary source of cash and are influenced by a number of factors, such as:
| • | net income, which is primarily influenced by sales and operating income margins; |
| • | changes in the level of inventory; |
| • | proportion of US sales made using in-house customer financing programs and the average monthly collection rate of the credit balances; |
| • | seasonal pattern of trading; and |
| • | working capital movements associated with changes in store space. |
Other sources of cash are increased borrowings or the issuance of Common Shares for cash.
Impact of new store openings on cash flow
When analyzing cash flow, management believes it is important to distinguish between cash flows of the existing business and discretionary expenditures related to new store space. As there is very limited potential to open new stores in the UK, this relates to new store space in the US. Therefore working capital investment and capital expenditure related to new US store space is separately identified in the following discussion.
In fiscal 2010, one of Signet’s financial objectives was to achieve positive free cash flow of between $175.0 million and $225.0 million; non-GAAP measure, see Item 6. During the year, cash and cash equivalents increased by $220.2 million (fiscal 2009: $88.0 million) and debt decreased by $243.4 million (fiscal 2009: increase $160.6 million). The achieved decrease in net debt was therefore $463.6 million (fiscal 2009: $72.6 million). Net debt at January 30, 2010 was $7.9 million (January 31, 2009: $470.7 million); non-GAAP measure, see Item 6. Gearing at January 30, 2010 was 0.4% (January 31, 2009: 29.2%); non-GAAP measure, see Item 6. The peak level of net debt in fiscal 2010 was about $480 million (fiscal 2009: about $670 million).
Cash flow from operating activities
As a retail business, Signet receives cash when it makes a sale to a customer or when the payment has been processed by the relevant bank if the payment is made by credit or debit card. In the US division, where the customer makes use of financing provided by Signet, the cash is received over a period of time. In fiscal 2010, 53.5% (fiscal 2009: 53.2%) of the US division’s sales were made using finance provided by Signet. The average monthly collection rate from the credit portfolio was 12.5% (fiscal 2009: 13.1%).
Signet typically pays for merchandise about 30 days after receipt. Due to the nature of specialty retail jewelry, it is usual for inventory to be held on average for approximately 12 months before it is sold. In addition, Signet, holds consignment inventory, nearly all of which is in the US, which at January 30, 2010 amounted to $134.6 million (January 31, 2009: $202.1 million). The principal terms of the consignment agreement, which can generally be terminated by either party, are such that Signet can return any or all of the inventory to the relevant supplier without financial or commercial penalties. When Signet sells consignment inventory, it becomes liable to the supplier for the cost of the item. The sale of any such inventory is accounted for on a gross basis (see principal accounting policies, Item 8).
Signet’s largest class of operating expense relates to staff costs. These are typically paid on a weekly, two weekly or monthly basis, with annual bonus payments also being made. Operating lease payments in respect of stores occupied are normally paid on a monthly basis by the US division and on a quarterly basis by the UK division.
73
Table of Contents
Payment for advertising on television, radio or in newspapers is usually made between 30 and 60 days after the advertisement appears. Other expenses have various payment terms, none of which are material.
Adjustments to reconcile net income/loss to cash flow provided by operations
The major adjustment to reconcile net income/loss to cash flow provided by operations is normally depreciation of property, plant and equipment. There can also be significant, unusual and non-recurring items, such as the $516.9 million impairment of goodwill in fiscal 2009.
In fiscal 2010, net income adjusted for non-cash items increased to $293.9 million (fiscal 2009: $259.8 million); non-GAAP measure, see Item 6. The adjustments for non-cash items were $129.8 million (fiscal 2009: $653.5 million), with depreciation and amortization being $108.9 million (fiscal 2009: $114.5 million). The decrease in depreciation reflected the planned reduction in space growth and store refurbishment as well as the impact of foreign exchange movements on the reported figure for the UK division.
Changes in operating assets and liabilities
Signet’s working capital requirements fluctuate during the year as a result of the seasonal nature of sales and movements in the pound sterling to US dollar exchange rate. The working capital needs of the business are normally relatively stable from January to August. As inventory is purchased for the fourth quarter, there is a working capital outflow which reaches its highest levels in mid to late November. The peak level of working capital can be accentuated by new store openings. The working capital position then reverses over the key selling period of December.
The change in inventory and receivables in the US division is primarily driven by the sales performance of the existing stores and the net change in store space. The value of inventory in the UK division is also impacted by movements in the pound sterling to US dollar exchange rate. Growth or decline in same store sales will normally result in a smaller proportionate movement in inventory than in same store sales. Changes in the sourcing practices and merchandise mix of the business can also result in changes in inventory. For example, the cessation of the initiative to directly source rough diamonds in late fiscal 2009 reduced working capital requirements as did the growth in fiscal 2010 of differentiated merchandise ranges, which have a faster average merchandise turn. In the US, a change in receivables would proportionately reflect changes in sales if credit participation levels remain the same and receivable collection rates were unaltered. Changes in credit participation and the collection rate also impact the level of receivables. Movements in deferred revenue reflect the level of US sales and the attachment rate of warranty sales. Therefore if sales increase, working capital would be expected to increase. Similarly, a decrease in sales would be expected to result in a reduction in working capital.
Investment in new space requires significant investment in working capital, as well as fixed capital investment, due to the slow inventory turn, and the additional investment required to fund sales in the US utilizing in-house customer finance. Of the total investment required to open a new store, between 60% and 70% is typically accounted for by working capital. New stores are usually opened in the third quarter or early in the fourth quarter of the fiscal year. A reduction in the number of store openings results in the difference between the level of net debt in the first half of a fiscal year and the peak level being lower, while an increase in the number of store openings would have the opposite impact.
In line with Signet’s financial objectives for fiscal 2010, there was an inflow from operating assets and liabilities of $221.5 million (fiscal 2009: outflow of $95.4 million). Due to the seasonal trading pattern, the cash inflow from operating assets and liabilities was $4.9 million in the fourth quarter (fourth quarter fiscal 2009: outflow of $16.4 million). There was a decrease in inventory of $226.5 million (fiscal 2009: $12.7 million), following a realignment to a lower level of sales and the much reduced space growth in the US division. The level of accounts receivable rose by $32.4 million reflecting the increase in sales in the fourth quarter of fiscal 2010 in the US division.
74
Table of Contents
The adverse impact of exchange rate changes on currency swaps was $0.7 million (fiscal 2009: $49.6 million). Signet historically swapped significant amounts of pound sterling deposits and inter-company balances into US dollars on a short term basis to reduce the level of US dollar debt. These cash and inter-company balances, the size of which fluctuated during the year, reflected an historic restriction on dividend payments by the UK division, which was lifted in the fourth quarter of fiscal 2009, following a ruling by the High Court of Justice of England and Wales. As a result, Signet greatly increased its ability to reduce the size of its pounds sterling deposits and inter-company balances on a permanent basis by paying dividends up through the corporate structure. This enabled Signet to meaningfully reduce its cash flow exposure to changes in the pound sterling to US dollar exchange rate.
In fiscal 2010, investment in inventory and receivables associated with US space growth was reduced by $38.4 million to $28.2 million (fiscal 2009: $66.6 million) reflecting only seven new mall stores and seven new Jared locations (fiscal 2009: 46 mall stores and 17 Jared locations). Of the working capital investment of $28.2 million in new US space in fiscal 2010, $12.0 was for inventory and $16.2 million related to customer financing (fiscal 2009: $39.6 million and $27.0 million respectively). An inflow from inventory and repayment of customer financing arose from US store closures that occurred in calendar 2009. In the UK division, the change in net store space was not significant. The following tables provide a summary of movement in inventory and account receivables as a result of new space growth in the US and the performance of the rest of Signet’s operations for fiscal 2010, fiscal 2009 and fiscal 2008:
| Fiscal 2010 |
Fiscal 2009 |
Fiscal 2008 | ||||||
| $million | $million | $million | ||||||
| Increase in inventories due to new space in US |
12.0 | 39.6 | 78.5 | |||||
| Other (decrease)/increase in inventories |
(238.5 | ) | (52.3 | ) | 18.3 | |||
| Total (decrease)/increase in inventories |
(226.5 | ) | (12.7 | ) | 96.8 | |||
| Fiscal 2010 |
Fiscal 2009 |
Fiscal 2008 | ||||||
| $million | $million | $million | ||||||
| Increase in accounts receivable due to new space in US |
16.2 | 27.0 | 40.3 | |||||
| Other increase/(decrease) in accounts receivable |
16.2 | (47.5 | ) | 15.9 | ||||
| Total increase/(decrease) in accounts receivable |
32.4 | (20.5 | ) | 56.2 | ||||
Investing activities
Investment activities primarily reflect the purchases of property, plant and equipment related to the:
| • | rate of space expansion in the US, |
| • | number of store refurbishment and relocation carried out, and |
| • | provision of divisional head offices, which include its US and UK distribution facilities. |
In addition, purchases of intangible assets, primarily of information technology for use in the business, are also made.
When appraising a store investment, management uses an investment hurdle rate of a 20% internal rate of return on a pre-tax basis over a five year period assuming the release of working capital at the end of the five years. Capital expenditure accounts for about 36% of the investment in a new Jared store and for about 33% of the investment in a mall store. The balance is accounted for by investment in inventory and the funding of customer financing. Signet typically carries out a major refurbishment of its stores every ten years but does have some
75
Table of Contents
discretion as to the timing of such expenditure. A major store refurbishment is evaluated using the same investment procedures and criteria as for a new store. Minor store redecorations are typically carried out every five years. In addition to major store refurbishments, Signet carries out minor store refurbishments where stores are profitable but do not satisfy the investment hurdle rate required for a full refurbishment; this is usually associated with a short term lease renewal. Where possible, the investment appraisal approach is also used to evaluate other investment opportunities.
Net cash flow used in investing activities was $43.5 million (fiscal 2009: $113.3 million), as a result of reduced capital investment in the existing businesses on both sides of the Atlantic and a reduced rate of US new space growth.
The following table provides a summary of capital expenditure as a result of new space growth in the US, other additions in the US, and of capital additions in the UK and unallocated, for fiscal 2010, fiscal 2009 and fiscal 2008:
| Fiscal 2010 |
Fiscal 2009 |
Fiscal 2008 |
|||||||
| $million | $million | $million | |||||||
| Capital additions due to new US space |
10.1 | 39.0 | 60.1 | ||||||
| Other capital additions in US |
21.0 | 37.7 | 51.0 | ||||||
| Capital additions in US |
31.1 | 76.7 | 111.1 | ||||||
| Capital additions in UK and unallocated |
12.5 | 38.2 | 29.3 | ||||||
| Total purchases of property, plant, equipment and other intangible assets |
43.6 | 114.9 | 140.4 | ||||||
| Ratio of capital additions to depreciation and amortization in US |
39.7 | % | 91.3 | % | 154.1 | % | |||
| Ratio of capital additions to depreciation and amortization in UK |
41.0 | % | 124.9 | % | 68.4 | % | |||
| Ratio of capital additions to depreciation and amortization for Signet |
40.0 | % | 100.3 | % | 123.3 | % |
In fiscal 2010, in both the US and UK divisions, capital additions were less than depreciation and amortization. This was a result of the use of more cautious sales forecasts in the investment appraisal process reflecting the challenging economic environment. As a result fewer new stores were opened, fewer stores were refurbished and more stores were closed rather than refurbished at the end of leases. Investment in information technology was temporarily reduced.
Free cash flow
Free cash flow is net cash provided by operating activities less net cash flow used in investing activities; non-GAAP measure, see Item 6. Positive free cash flow in fiscal 2010 was $471.9 million (fiscal 2009: $51.1 million; fiscal 2008: $1.4 million), primarily as a result of a significant realignment of working capital to reflect lower sales in the existing business. This was achieved even though net income adjusted for non-cash items; non-GAAP measure, see Item 6; declined from $333.6 million in fiscal 2008 to $293.9 million in fiscal 2010. In fiscal 2009, a reduced level of cash being invested in working capital in the existing business and a lower level of investment in new US space than in fiscal 2008 led to an increase in free cash flow. Management believes that there is limited scope for a further reduction in working capital. Other factors for the increase in free cash flow in fiscal 2010 were a higher net income adjusted for non-cash items, a reduction in investment in the existing business and reduced investment in new US store space.
76
Table of Contents
To reflect the impact of investment in new US space on cash flow, the following summary provides an analysis of free cash flow before such investment and the working capital and capital expenditure required by new US space.
| Fiscal 2010 |
Fiscal 2009 |
Fiscal 2008 |
|||||||
| $million | $million | $million | |||||||
| Net income adjusted for non-cash items(1) |
293.9 | 259.8 | 333.6 | ||||||
| Change in operating assets & liabilities, excluding impact of new US stores |
249.7 | (28.8 | ) | (74.0 | ) | ||||
| Investing activities excluding new US stores |
(33.4 | ) | (74.3 | ) | (79.3 | ) | |||
| Free cash flow(1) before investment in new US stores |
510.2 | 156.7 | 180.3 | ||||||
| Change in operating assets & liabilities due to new US space |
(28.2 | ) | (66.6 | ) | (118.8 | ) | |||
| Investing activities related to new US space |
(10.1 | ) | (39.0 | ) | (60.1 | ) | |||
| Investment in new US stores |
(38.3 | ) | (105.6 | ) | (178.9 | ) | |||
| Free cash flow(1) |
471.9 | 51.1 | 1.4 | ||||||
| (1) | non-GAAP measures, see Item 6. |
In fiscal 2010, net income adjusted for non-cash items was $293.9 million, an increase of $34.1 million on fiscal 2009 reflecting an improvement in profitability. In fiscal 2010, a management objective was a reduction in working capital and $249.7 million was generated from changes in operating assets and liabilities, excluding the impact of new US stores (fiscal 2009: use of $28.8 million). The level of investment in the existing business in fiscal 2010 was $33.4 million (fiscal 2009: $74.3 million). This level of investment was temporarily below the current level of maintenance capital expenditure of about $75 million to $80 million. Free cash flow before investment in new US stores increased to $510.2 million in fiscal 2010 from $156.7 million in fiscal 2009.
Reflecting the change in strategy, with a focus on strengthening the balance sheet by focusing on cash generation rather than US space growth, and the uncertain economic outlook which resulted in few investment opportunities satisfying management’s investment hurdle rate, investment in new US space decreased to $38.3 million in fiscal 2010 (fiscal 2009: $105.6 million).
Financing activities
The major items within financing activities are discussed below:
Dividends
In the light of economic prospects and financial market conditions, as well as a focus on debt reduction, the Board concluded in January 2009 that it was not appropriate to pay equity dividends. No equity dividends were paid in fiscal 2010 (fiscal 2009: $123.8 million).
Restrictions on dividend payments
Under the amended borrowing agreements, (see page 80 for details) no “Shareholder Returns” (defined as including dividends, share buybacks or other similar payments) may be made in fiscal 2010 or fiscal 2011.
In fiscal 2012 and fiscal 2013, Shareholder Returns may only be made to the extent that amounts of any February 2011 or 2012 prepayment offer to Note Holders are not accepted by the Note Holders. The minimum amount of
77
Table of Contents
each such offer being the Note Holders’ pro rata share of 60% of any reduction in net debt that occurred over the preceding fiscal year. In addition, such Shareholder Returns may only be made if:
| • | the fixed charge cover is above 1.7:1, |
| • | Signet is in compliance with the amended facility, and |
| • | Signet can demonstrate projected compliance with the fixed charge cover for the following 12 months. |
Subsequent to January 2013, Shareholder Returns may be no greater than the amount of an additional prepayment offer rejected by the Note Holders and may only be made if:
| • | previous offers have been made to prepay an aggregate of $190 million of the Notes, inclusive of the $100 million March 18, 2009 prepayment, and |
| • | an additional prepayment offer at a 2% premium to par has been made, the size of which is at Signet’s discretion. |
In addition, under Bermuda law, a company may not declare or pay dividends if there are reasonable grounds for believing that the company is, or would after the payment be, unable to pay its liabilities as they become due or that the realizable value of its assets would thereby be less than the aggregate of its liabilities, its issued share capital and its share premium accounts.
Proceeds from issues of Common Shares
In fiscal 2010, a sum of $1.0 million (fiscal 2009: $0.1 million) was received from the issuance of Common Shares. Other than equity based compensation awards granted to employees, Signet has not issued Common Shares as a financing activity for over ten years.
Purchases of treasury shares
Signet may repurchase Common Shares in the open market pursuant to programs approved by the Board but is currently restricted from doing so by its borrowing agreements (see page 80). No repurchases of Common Shares took place in fiscal 2010 or fiscal 2009. In fiscal 2008, $29.0 million was utilized for such repurchases.
Movement in cash and indebtedness
During fiscal 2010, Signet reduced short-term borrowings by $143.4 million (fiscal 2009: increase $160.6 million) and repaid long-term borrowings of $100.0 million. Cash and cash equivalents increased by $220.2 million (fiscal 2009: $88.0 million). The US dollar to pound sterling exchange rate moved from $1.45 at January 31, 2009 to $1.60 at January 30, 2010, with the average exchange rate used in the preparation of Signet’s income statements being $1.59 (fiscal 2009: $1.75). Signet holds a fluctuating amount of pounds sterling reflecting the cash generative nature of the UK division. Movements in the exchange rates prevailing at the time of these flows create exchange rate movements on the cash balances with an adverse impact of $0.8 million on cash and cash equivalents, and $nil on debt (fiscal 2009, adverse impact of $32.9 million and a gain $9.4 million respectively).
Net debt; non-GAAP measure, see Item 6; at January 30, 2010 was $7.9 million (January 31, 2009: $470.7 million), a decrease of $462.8 million (fiscal 2009: $141.4 million increase). Debt at January 30, 2010 was $324.1 million (January 31, 2009: $567.5 million), with cash and cash equivalents amounting to $316.2 million (January 31, 2009: $96.8 million). Gearing, that is the ratio of net debt to shareholders’ equity, was 0.4% (January 31, 2009: 29.2%); non-GAAP measure, see Item 6. The peak level of net debt in fiscal 2010 was about $480 million (fiscal 2009: about $670 million).
78
Table of Contents
Capital availability
Signet’s level of borrowings and cash balances fluctuates during the year reflecting its cash flow performance, which depends on the factors described above. Management believes that cash balances and the committed borrowing facilities (described more fully below) currently available to the business, are sufficient for both its present and near term requirements. In fiscal 2010, the peak level of net debt was about $480 million (fiscal 2009: about $670 million). In fiscal 2011, the peak net debt is expected to be lower.
The following table provides a summary of the Signet’s working capital position and capitalization as at January 30, 2010, January 31, 2009 and February 2, 2008:
| January 30, 2010 |
January 31, 2009 |
February 2, 2008 | ||||
| $million | $million | $million | ||||
| Working capital |
1,814.5 | 1,675.9 | 1,776.3 | |||
| Capitalization: |
||||||
| Net debt(1) |
7.9 | 470.7 | 374.6 | |||
| Shareholders’ equity |
1,797.6 | 1,609.7 | 2,321.2 | |||
| Total capitalization |
1,805.5 | 2,080.4 | 2,695.8 | |||
| Additional amounts available under credit agreements |
370.0 | 432.5 | 553.7 |
| (1) | Non-GAAP measure, see Item 6. |
The following table provides relevant measures of liquidity and capital resources as at January 30, 2010, January 31, 2009 and February 2, 2008:
| January 30, 2010 |
January 31, 2009 |
February 2, 2008 |
|||||||
| Gearing(1) |
0.4 | % | 29.2 | % | 21.2 | % | |||
| Net tangible asset value(2) ($ million) |
1,773.4 | 1,585.8 | 1,743.2 | ||||||
| Net debt to earnings before interest, tax, depreciation and amortization(2) |
0.02x | 1.4x | 0.8x | ||||||
| Fixed charge cover(2) |
2.0x | 1.9x | 2.4x |
| (1) | Non-GAAP measure, see Item 6. |
| (2) | These non-GAAP measures are calculated in accordance with Signet’s credit agreements detailed below. |
In addition to cash generated from operating activities, Signet also has funds available from various credit agreements. The principle agreements are outlined below.
Amended Revolving Credit Facility Agreement
The terms of the Amended Revolving Credit Facility Agreement (the “Facility Agreement”) which runs from March 2009 until June 2013, inter alia, include:
| • | the ability by Signet to draw in the form of multi-currency cash advances and the issuance of letters of credit; and |
| • | a margin of 2.25% above LIBOR, subject to adjustment depending on the performance of Signet, with the minimum being 1.75% above LIBOR and the maximum being 2.75% above LIBOR. Commitment fees are paid on the undrawn portion of this credit facility at a rate of 40% of the applicable margin. |
79
Table of Contents
The continued availability of the Facility Agreement is conditional upon Signet achieving certain financial performance criteria and abiding by certain operating restrictions, including those set out below:
| • | the ratio of Consolidated Net Debt to Consolidated EBITDA (Earnings Before Interest, Tax, Depreciation and Amortization) shall not exceed 2:1 for each quarter, except the third quarter when it shall not exceed 2.5:1; |
| • | Consolidated Net Worth (total net tangible assets) shall not fall below $800 million; |
| • | the ratio of EBITDAR (Earnings Before Interest, Tax, Depreciation, Amortization, Rents and Operating Lease Expenditure) to Fixed Charges (Consolidated Net Interest Expenditure plus Rents and Operating Lease Expenditure excluding Service Charges and Rates) shall be equal to or greater than 1.4:1 for the trailing 12 months at each quarter end to January 2012, then increasing to 1.55:1 until January 2013 and then to 1.85:1 for subsequent periods; |
| • | beginning with fiscal 2011, the facility will be reduced, on a pro rata basis with the Notes outstanding (see below), by 60% of any reduction in net debt from the prior year end; |
| • | no “Shareholder Returns” (defined as including dividends, share buybacks or other similar payments) shall be made during fiscal 2010 or fiscal 2011, and thereafter such returns may only be made if the amended fixed charge cover is above 1.7:1, there are no subsisting defaults and the directors confirm that they expect Signet to continue to comply with the covenant in the following 12 months; and |
| • | capital expenditure shall not exceed $71 million in fiscal 2010, $93 million in fiscal 2011, $115 million in fiscal 2012 and $205 million in fiscal 2013. |
The Facility Agreement retains certain provisions which are customary for this type of agreement, including standard “negative pledge” and “pari passu” clauses. The facility was undrawn at January 30, 2010 (January 31, 2009: $135 million).
A change was agreed with Signet’s Revolving Credit Facility banking group that the facility be reduced to $300 million from $370 million on March 19, 2010.
Amended note purchase agreement
The original Note Purchase Agreement took the form of fixed rate investor certificate notes (“Notes”). At January 31, 2009, the Notes outstanding were Series (A) $100 million 5.95% due 2013; Series (B) $150 million 6.11% due 2016, and Series (C) $130 million 6.26% due 2018.
The terms of the amended Note Purchase Agreement (“Amended Note Purchase Agreement”), where they are different to those in the Facility Agreement disclosed above, are, inter alia:
| • | the coupon increased by an additional 2.0% (subject to a further 1.0% increase until fiscal 2013 if the amended fixed charge coverage ratio is less than 1.6:1, and an additional 1.0% increase if Note Holders are subject to increased capital charges as a result of a requirement to post additional reserves under applicable insurance regulations, as determined by the insurance regulator); |
| • | a prepayment of $100 million at par plus accrued interest on March 18, 2009. Subsequent prepayment offers, at par, to be made in February/March of each of the following calendar years—2010, 2011, 2012 and 2013. The minimum amount of each such offer being the Note Holders’ pro rata share of 60% of any reduction in net debt that occurred over the preceding fiscal year (the “Required Offers”). Any proportion of the 2011, 2012 or 2013 offers rejected by Note Holders may be applied to Shareholder Returns, as defined in the Facility Agreement; |
80
Table of Contents
| • | Subsequent to January 2013, Shareholder Returns may be no greater than the amount of an additional prepayment offer rejected by the Note Holders and may only be made if: |
| – | previous offers have been made to prepay an aggregate of $190 million of the Notes, inclusive of the $100 million March 18, 2009 prepayment, |
| – | an additional prepayment offer at a 2% premium to par has been made, the size of which is at Signet’s discretion, and |
| • | restrictions on capital expenditure similar to the Facility Agreement for fiscal 2010, fiscal 2011, fiscal 2012 and fiscal 2013, provided that in fiscal 2012 and 2013 the Required Offers have been made, otherwise the restrictions on capital expenditure in fiscal 2012 will be $85 million and in fiscal 2013 and thereafter will be $100 million. No unspent capital expenditure is able to be carried forward. |
In accordance with its borrowing agreements, Signet made a prepayment at par to its Note Holders on March 9, 2010 of $50.9 million. Following this repayment there were $229.1 million of Notes outstanding, comprising: Series (A) $58.9 million due 2013; Series (B) $89.1 million due 2016, and Series (C) $81.1 million due 2018, with a weighted average coupon of 8.12%.
Signet has the right to prepay the remaining outstanding notes at any time, with such prepayment being made at a premium to par as determined by the provisions of the ‘Make Whole’ calculation contained within the Amended Note Purchase Agreement. Variations in the ‘Make Whole’ premium amount are largely determined by movements in 3, 6 and 8 year US Treasury yields.
Asset backed variable funding note conduit securitization facility
In October 2008, a 364 day $100m Series 2007 asset backed variable funding note conduit securitization facility for general corporate purposes was entered into. Under this securitization, interests in the US receivables portfolio are sold to Bryant Park, a conduit administered by HSBC Securities (USA) Inc. This facility was not utilized and was terminated in April 2009.
Other borrowing agreements
At January 30, 2010, Signet had borrowings of $44.1 million (January 31, 2009: $52.5 million) under various bank overdraft facilities.
Credit rating
Signet does not have a public credit rating.
KNOWN TRENDS AND UNCERTAINTIES
US division
The current economic environment remains challenging and the prospects for same store sales remain uncertain. For fiscal 2011, the gross merchandise margin is expected to be at least at the level achieved in fiscal 2010, with a decrease in diamond costs and selective price increases offsetting a rise in the cost of gold.
Controllable expenses are expected to be broadly flat, with some benefit from store closures largely balancing inflation. However, two factors will have an adverse impact. First, the non-recurring benefit recognized in fiscal 2010 of $13.4 million arising from the change in vacation entitlement policy; and second, an anticipated net direct adverse impact on operating income in the range of $15 million to $20 million in fiscal 2011 resulting from amendments to the Truth in Lending Act. There may be a further indirect impact to sales arising from these amendments as a result of changes in consumer behavior. Expenses will also vary with sales to the extent they are above or below budgeted levels. In the US, these variable expenses account for 12% to 15% of sales. The net bad debt charge is uncertain and the primary driver of its performance is the economic environment.
81
Table of Contents
A further slowing in the rate of new store openings will take place in fiscal 2011, with the number of store closures is anticipated to be a little lower than in fiscal 2010. This will result in a small decline in store space (see table below). However, there will be an increased level of store refurbishment and investment in information technology. Capital expenditure in fiscal 2011, is anticipated to be about $60 million (fiscal 2010: $31.1 million).
| Kay Mall |
Kay Off-mall |
Regionals | Jared(1) | Total | Net space change |
||||||||||||
| January 2009 |
795 | 131 | 304 | 171 | 1,401 | 4 | % | ||||||||||
| Opened |
5 | (2) | 3 | 1 | 7 | 16 | |||||||||||
| Closed |
(6 | ) | (5 | ) | (45 | )(2) | — | (56 | ) | ||||||||
| January 2010 |
794 | 129 | 260 | 178 | 1,361 | (1 | )% | ||||||||||
| Openings (planned) |
4 | 2 | — | 2 | 8 | ||||||||||||
| Closures (approx.) |
(10 | ) | (4 | ) | (36 | ) | — | (50 | ) | ||||||||
| January 2011 (approx.) |
788 | 127 | 224 | 180 | 1,319 | (2 | )% | ||||||||||
| (1) | A Jared store is equivalent in size to just over four mall stores. |
| (2) | Includes two regional stores rebranded as Kay. |
UK division
Gross merchandise margin in fiscal 2011 is expected to be somewhat below that achieved in fiscal 2010, primarily reflecting a higher cost of gold and a rise in value added tax partly offset by price increases. Action has been taken to improve staff scheduling and to reduce property costs, with the objective of slightly reducing pound sterling costs compared with those of fiscal 2010.
As part of the long term strategy of focusing on major shopping centers, rather than traditional, less profitable high street locations, a further small reduction in net store space is expected in fiscal 2011 (see table below). As a result of higher expenditure on store maintenance and information technology, capital expenditure in fiscal 2011 is anticipated to be approximately $20 million (fiscal 2010: $12.5 million).
| Open store format | |||||||||||||||
| H.Samuel | Ernest Jones(1) |
Total | H.Samuel | Ernest Jones | |||||||||||
| January 2009 |
352 | 206 | 558 | 71 | % | 40 | % | ||||||||
| Opened |
— | 1 | 1 | ||||||||||||
| Closed |
(5 | ) | (2 | ) | (7 | ) | |||||||||
| January 2010 |
347 | 205 | 552 | 73 | % | 48 | % | ||||||||
| Openings (planned) |
— | — | — | ||||||||||||
| Closures (approx.) |
(10 | ) | (5 | ) | (15 | ) | |||||||||
| January 2011 (approx.) |
337 | 200 | 537 | 75 | % | 60 | % | ||||||||
| (1) | Includes stores trading as Leslie Davis. |
Expected effective tax rate
It is expected that, subject to the geographic mix of taxable income and the outcome of various uncertain tax positions, Signet’s effective tax rate in fiscal 2011 will be approximately 33%.
Cash flow objectives
In fiscal 2011, it is management’s objective to achieve a positive free cash flow of between $150 million and $200 million, that is net cash provided by operating activities less net cash flows used in investing activities. This
82
Table of Contents
is lower than achieved in fiscal 2010, as there is limited scope to further reduce working capital. The impact of the recently implemented amendments to the Truth in Lending Act on cash flow is uncertain. Investing activities in fiscal 2011 are budgeted to use about $80 million (fiscal 2010: $43.5 million), broadly in line with maintenance capital expenditure. In accordance with the Board’s strategy and Signet’s borrowing agreements, there is no intention to pay any dividends nor make any share repurchases in fiscal 2011.
Trading in the first seven weeks of fiscal 2011
An encouraging start has been made to fiscal 2011, with same store sales in the first seven weeks up 6.4%. In the US, same store sales were up 7.8%, with Jared especially strong, and the mall brands achieving a solid increase. In the UK, same store sales were down 0.1%, with Ernest Jones driving the better performance.
OFF-BALANCE SHEET ARRANGEMENTS
Merchandise held by way of consignment
Signet held $134.6 million of consignment inventory at January 30, 2010 (January 31, 2009: $202.1 million) which is not recorded on the balance sheet. The principal terms of the consignment agreements, which can generally be terminated by either side, are such that Signet can return any, or all of, the inventory to the relevant supplier without financial or commercial penalty.
Contingent property liabilities
Approximately 124 UK property leases had been assigned by Signet at January 30, 2010 (and remained unexpired and occupied by assignees at that date) and approximately 27 additional properties were sub-let at that date. Should the assignees or sub-tenants fail to fulfill any obligations in respect of those leases or any other leases which have at any other time been assigned or sub-let, Signet or one of its UK subsidiaries may be liable for those defaults. The number of such claims arising to date has been small, and the liability, which is charged to the income statement as it arises, has not been material.
Contractual Obligations
A summary of operating lease obligations is set out below. These primarily relate to minimum payments due under store lease arrangements. The majority of the store operating leases provide for the payment of base rentals plus real estate taxes, insurance, common area maintenance fees and merchant association dues. Additional information regarding Signet’s operating leases is available in Item 2, and Note 21, included in Item 8.
Long term debt obligations comprise borrowings with an original maturity of greater than one year. Purchase obligations comprise contracts entered into for the forward purchase of gold and US dollars with an original maturity of greater than one year. These contracts are taken out to manage market risks. It is expected that operating commitments will be funded from future operating cash flows and no additional facilities will be required to meet these obligations.
Contractual obligations as at January 30, 2010
| Less than One year |
Between one and three years |
Between three and five years |
More than five years |
Total | ||||||
| $million | $million | $million | $million | $million | ||||||
| Long term debt obligations(1) |
— | — | 73.7 | 206.3 | 280.0 | |||||
| Operating lease obligations(2) |
287.4 | 513.3 | 430.3 | 1,081.0 | 2,312.0 | |||||
| Purchase obligations |
7.6 | — | — | — | 7.6 | |||||
| Fixed interest and commitment fee payments |
25.3 | 50.6 | 35.0 | 32.7 | 143.6 | |||||
| Creditors falling due after one year |
— | — | — | 7.2 | 7.2 | |||||
| Current income tax |
44.1 | — | — | — | 44.1 | |||||
| Total |
364.4 | 563.9 | 539.0 | 1,327.2 | 2,794.5 | |||||
83
Table of Contents
| (1) | As at January 30, 2010, Signet had no long-term floating rate indebtedness. On March 9, 2010, Signet made a prepayment of $50.9 million in relation to the long-term debt obligations. Following this prepayment, the revised contractual obligation between three and five years is $58.9 million and more than five years is $170.2 million and the total is $229.1 million. |
| (2) | Operating lease obligations relate to minimum payments due under store lease arrangements. Most store operating leases require payment of real estate taxes, insurance and common area maintenance fees. Real estate taxes, insurance and common area maintenance fees were approximately 35% of base rentals for fiscal 2010. These are not included in the table above. Some operating leases also require additional payments based on a percentage of sales. |
Not included in the table above are obligations under employment agreements (including pensions) and ordinary course purchase orders for merchandise.
PENSIONS
Signet has one defined benefit plan for UK based staff (the “Group Scheme”), that was closed to new members in 2004. All other pension arrangements consist of defined contribution plans. The net impact of foreign exchange movements on the assets and liabilities of the UK scheme in fiscal 2010 was $1.2 million. There was an actuarial loss on the Group Scheme liabilities of $17.2 million (fiscal 2009: $21.9 million gain). The fair value of the Group Scheme’s assets excluding the impact of foreign exchange movements increased by $32.7 million (fiscal 2009: $51.9 million decrease). There was a retirement benefit deficit on the balance sheet of $4.8 million (January 31, 2009: $12.9 million) before a related deferred tax asset of $1.4 million (January 31, 2009: $3.6 million). The last triennial actuarial valuation was carried out as at April 5, 2009 and another will be carried out as at April 5, 2012. The valuation is updated at each fiscal year end.
The cash contribution to the Group Scheme in fiscal 2010 was $12.8 million (fiscal 2009: $6.0 million). Signet has committed to contributing $9.6 million each year for the next seven years in addition to the ongoing service contributions. As a result, Signet expects to contribute $15.2 million into the pension scheme in fiscal 2011. If the deficit increases or decreases significantly, then this contribution might increase or decrease accordingly.
IMPACT OF INFLATION
The impact of inflation on Signet’s results for the past three years has not been significant apart from the impact of the increased cost of gold, and in the UK, the impact on merchandise costs due to the weakness of pound sterling against the US dollar.
IMPACT OF CLIMATE CHANGE
Signet recognizes that climate change is a major risk to society and therefore continues to take steps to reduce Signet’s climate impact. Management believes that climate change has a largely indirect influence on Signet’s performance and that it is of limited significance to the business.
CRITICAL ACCOUNTING POLICIES
Critical accounting policies covering areas of greater complexity or those particularly subject to the exercise of judgment are listed below. There are no material off-balance sheet structures. The principal accounting policies are set out in the financial statements in Item 8.
Foreign currency translation
The results of subsidiaries with functional currencies other than US dollars are translated into US dollars at the weighted average rates of exchange during the period and their balance sheets are translated at the rates at the
84
Table of Contents
balance sheet date. The average exchange rate is calculated using the weekly exchange rates weighted by the level of sales within the relevant period. The income statement for fiscal 2010 used an average exchange rate of $1.59 to £1 pound sterling and there is no significant exposure to movements in exchange rates of other currencies. A one cent increase in this rate would increase reported net income by $0.2 million. Exchange differences arising from the translation of the net assets of these subsidiary undertakings are included in other comprehensive income. Other exchange differences arising from foreign currency transactions are included in operating income. The results for fiscal 2009 include the impact from more significant movements between the US dollar and pound sterling than other years, which created larger exchange rate translation differences.
Revenue recognition
Where a contractual obligation is borne by Signet, revenue from the sale of extended service agreements is deferred and recognized, net of incremental costs arising from the initial sale, in proportion to anticipated claims arising. This period is based on the historical claims experience of the business, which has been consistent since these products were launched. Management reviews the pattern of claims at the end of each year to determine any significant trends that may require changes to revenue recognition rates.
When promotional vouchers providing an incentive to enter into a future purchase are issued, the estimated fair value of these vouchers is treated as deferred revenue. The fair value of these vouchers is calculated based on prior years’ experience.
The deferred revenue that represents income under extended warranty agreements and voucher promotions at the end of fiscal 2010 was $261.0 million (fiscal 2009: $262.6 million).
Provision is made for future returns expected within the stated return period, based on previous percentage return rates experienced.
Depreciation and impairment
Depreciation is provided on freehold and long leasehold premises over a useful life not exceeding 50 years. Freehold land is not depreciated. Depreciation is provided on other fixed assets at rates between 10% and 33 1/3%. Storefit depreciation rates have been set based on the refit cycle for each store fascia and the useful lives of each individual element of the storefit. Cash registers and other IT equipment have separately determined depreciation rates.
In the UK, there are circumstances where refurbishments are carried out close to the end of the lease term, such that the expected life of the newly installed leasehold improvements will exceed the lease term. Where the renewal of the lease is reasonably assured, such storefronts, fixtures and fittings are depreciated over a period equal to the lesser of their economic useful life, or the remaining lease term plus the period of reasonably assured renewal. Reasonable assurance is gained through evaluation of the right to enter into a new lease, the performance of the store and potential availability of alternative sites.
Where appropriate, impairments are made on assets that have a fair value less than net book value. Management has identified potentially impaired assets considering the cash flows of individual stores where trading since the initial opening of the store has reached a mature stage. Where such stores deliver negative cash flows, the related store assets have been considered for impairment by reference to estimated future cash flows for these stores. In fiscal 2010, the income statement includes a charge of $2.9 million for impairment of assets (fiscal 2009: $7.6 million).
Taxation
Accruals for income tax contingencies require management to make judgments and estimates in relation to tax audit issues and exposures. Amounts reserved are based on management’s interpretation of country-specific tax
85
Table of Contents
law and the likelihood of settlement. Tax benefits are not recognized unless the tax positions are more likely than not to be sustained. Once recognized, management reviews each material tax benefit taking account of potential settlement through negotiation and/or litigation. Any established reserves are included in payables. Any recorded exposure to interest and penalties on tax liabilities is included in the income tax charge.
Goodwill
Goodwill represents the excess of the cost of acquisitions over the fair value of the net assets at the date of acquisition. Goodwill is not amortized but reviewed for impairment. Management completed a detailed review of the carrying value of goodwill in fiscal 2009 and determined that goodwill was fully impaired. The fiscal 2009 income statement reflected a $516.9 million impairment of goodwill accordingly.
Accounts receivable
Accounts receivable are stated net of an allowance for uncollectible balances. This allowance is based on Signet’s past experience and the payment history of individual customers, which reflect the prevailing economic environment. The allowance at January 30, 2010 was $73.2 million against a gross accounts receivable balance of $931.2 million. This compares to a valuation allowance of $69.9 million against a gross accounts receivable balance of $895.1 million at January 31, 2009. Management regularly reviews its individual receivable balances and when it assesses that a balance has become irrecoverable it is fully written off. Signet provides credit facilities to customers upon completing appropriate credit tests.
Interest receivable from the US in-house customer finance program is classified as other operating income.
Inventory valuation
Inventory is valued on an average cost basis and includes appropriate overheads. Overheads allocated to inventory cost are only those directly related to bringing inventory to its present location and condition. These include relevant warehousing, distribution and certain buying, security and data processing costs.
Where necessary, provision is made for obsolete, slow-moving and damaged inventory. This provision represents the difference between the cost of the inventory and its estimated market value, based upon inventory turn rates, market conditions and trends in consumer demand. The size of this provision also reflects the timing of the physical scrappage of aged, damaged or defective merchandise. The assessment of the provision has taken into account the challenging market conditions and recent trading activity. The total inventory provision at January 30, 2010 was $32.5 million (fiscal 2009: $12.6 million). Total net inventory at January 30, 2010 was $1,173.1 million, a decrease of $191.3 million on January 31, 2009.
In the US, inventory losses are recognized at the mid-year and fiscal year end based on complete physical inventories. In the UK, inventory losses are recorded as identified on a perpetual inventory system and an estimate is made of losses for the period from the last inventory count date to the end of the fiscal year on a store by store basis. These estimates are based on the overall divisional inventory loss experience since the last inventory count.
Hedge accounting
Changes in the fair value of financial instruments that are designated and effective as hedges of future cash flows are recognized directly in equity through the statement of comprehensive income. Any ineffective portion of the gain or loss is recognized immediately in the income statement.
UK retirement benefits
The expected liabilities of the Group Scheme are calculated based primarily on assumptions regarding salary and pension increases, inflation rates, discount rates, projected life expectancy and the long term rate of return
86
Table of Contents
expected on the Group Scheme’s assets. A full actuarial valuation was completed as at April 5, 2009 and the Group Scheme valuation is updated at each year end. The discount rate assumption of 6.6% applied for fiscal 2010 is based on the yield at the balance sheet date of long dated AA rated corporate bonds of equivalent currency and term to the Group Scheme’s liabilities. A 0.1% increase in this discount rate would decrease the pension charge of $7.5 million in fiscal 2010 by $0.2 million. The value of the assets of the Group Scheme is measured as at the balance sheet date, which is particularly dependent on the value of equity investments held at that date. The overall impact on the consolidated balance sheet is significantly mitigated as the members of the Group Scheme are only in the UK and account for about 9% of UK employees. The Group Scheme ceased to admit new employees from April 2004. In addition, if net accumulated actuarial gains and losses exceed 10% of the greater of plan assets or plan liabilities, Signet amortizes those gains or losses that exceed this 10% over the average remaining service period of the employees. The funded status of the Group Scheme at January 30, 2010 was a $4.8 million deficit (fiscal 2009: $12.9 million deficit).
| ITEM 7A. QUANTITATIVE | AND QUALITATIVE DISCLOSURES ABOUT MARKET RISK |
Signet is exposed to market risk arising from changes in foreign currency exchange rates, certain commodity prices and interest rates.
Signet monitors and manages these market exposures as a fundamental part of its overall risk management program, which recognizes the volatility of financial markets and seeks to reduce the potentially adverse effects of this volatility on Signet’s operating results.
MARKET RISK MANAGEMENT POLICY
A committee of the Board is responsible for the implementation of market risk management policies within the treasury policies and guidelines framework, which are deemed to be appropriate by the Board for the management of market risk.
Signet’s exposure to market risk is managed by the Signet’s treasury department. Where deemed necessary to achieve the objective of reducing market risk volatility on Signet’s operating results, certain derivative instruments are entered into by specialist treasury personnel. Signet uses derivative financial instruments for risk management purposes only.
A description of Signet’s accounting policies for derivative instruments is included in Note 1 of Item 8. Signet’s current portfolio of derivative financial instruments consists of forward foreign currency exchange contracts, foreign currency option contracts, foreign currency swaps, forward contracts for the purchase of gold and option contracts for the purchase of gold. An analysis quantifying the fair value change in derivative financial instruments held by Signet to manage its exposure to foreign exchange rates, commodity prices and interest rates is detailed on page 88.
Foreign currency exchange rate risk
Signet redenominated its share capital and changed its functional currency to US dollars with effect from February 5, 2007 and since this date has published its consolidated annual financial statements in US dollars. Some 87% of total assets were held in US dollars at January 30, 2010 and approximately 78% of its sales and 85% of its operating income were generated in US dollars for fiscal 2010. Nearly all the remainder of Signet’s assets, sales and operating income are in pounds sterling.
In translating the results of its UK operations, Signet’s results are subject to fluctuations in the exchange rate between the pound sterling and the US dollar. Any depreciation in the weighted average value of the US dollar against the pound sterling could increase reported revenues and operating profit and any appreciation in the weighted average value of the US dollar against the pound sterling could decrease reported revenues and operating profit. The Board has chosen not to hedge the translation effect of exchange rate movements on Signet’s operating results.
87
Table of Contents
The UK division buys on international markets certain products and materials that are priced in US dollars, and therefore has an exposure to exchange rates on the cost of goods sold. Signet uses certain derivative financial instruments to hedge this exposure, within treasury guidelines approved by the Board.
Signet holds a fluctuating amount of pounds sterling cash reflecting the cash generative characteristics of the UK division. Signet’s objective is to minimize net foreign exchange exposure to the income statement on sterling denominated items through managing this level of cash, sterling denominated intercompany balances and US dollar to sterling swaps. In order to manage the foreign exchange exposure and minimize the level of pounds sterling cash held by the company, the sterling denominated subsidiaries pay dividends regularly to their immediate holding companies.
Commodity price risk
Commodity price risk is the possibility of higher or lower costs due to changes in the prices of commodities.
Signet’s results are subject to fluctuations in the underlying cost price of diamonds and certain precious metals which are key raw material components of the products sold by Signet.
It is Signet’s policy to minimize the impact of precious metal commodity price volatility on operating results through the use of outright forward purchases of, or by entering into options to purchase, precious metals within treasury guidelines approved by the Board. In particular, Signet undertakes some hedging of its requirement for gold through the use of options, forward contracts and commodity purchasing, while fluctuations in the cost of diamonds are not hedged.
Interest rate risk
Signet’s interest income or charge is exposed to volatility in interest rates. This exposure is driven by both the currency denomination of the debt (US dollars or pounds sterling), the mix of fixed and floating rate debt used and the total amount of cash and debt outstanding.
Sensitivity analysis
Management has used a sensitivity analysis technique that measures the change in the fair value of Signet’s financial instruments from hypothetical changes in market rates as shown in the table below.
Fair value changes arising from:
| Fair Value January 30, 2010 |
1% rise in interest rates |
10% depreciation of $ against £ |
10% depreciation of precious metal prices |
Fair value January 31, 2009 |
|||||||||||
| $million | $million | $million | $million | $million | |||||||||||
| Foreign exchange contracts |
0.2 | — | (3.2 | ) | — | 12.1 | |||||||||
| Commodity contracts |
0.8 | — | — | (11.1 | ) | 12.0 | |||||||||
| Floating rate borrowings |
(44.1 | ) | (0.4 | ) | — | — | (187.5 | ) | |||||||
| Fixed rate borrowings |
(327.1 | ) | 15.3 | — | — | (293.0 | ) | ||||||||
| Floating rate bank deposits |
315.1 | 3.2 | 4.5 | — | 95.6 |
The amounts generated from the sensitivity analysis quantify the impact of market risk assuming that certain adverse market conditions, specified in the table above, occur. They are not forward-looking estimates of market risk. Actual results in the future are likely to differ materially from those projected due to changes in the portfolio of financial instruments held and actual developments in the global financial markets.
Any changes in the portfolio of financial instruments held and developments in the global financial markets may cause fluctuations in interest rates, exchange rates and precious metal prices to exceed the hypothetical amounts
88
Table of Contents
disclosed in the table above. The sensitivity scenarios are intended to allow an expected risk measure to be applied to the scenarios, as opposed to the scenarios themselves being an indicator of the maximum expected risk.
The example shown for changes in the fair values of borrowings and associated derivative financial instruments at January 30, 2010 is set out in the table above. The fair values of borrowings and derivative financial instruments are estimated by discounting the future cash flows to net present values using appropriate market rates prevailing at the period end.
The estimated changes in fair values for interest rate movements are based on an increase of 1% (100 basis points) in the specific rate of interest applicable to each class of financial instruments from the levels effective at January 30, 2010 with all other variables remaining constant.
The estimated changes in the fair value for foreign exchange rates are based on a 10% depreciation of the pound sterling against US dollar from the levels applicable at January 30, 2010 with all other variables remaining constant.
89
Table of Contents
| ITEM 8. | FINANCIAL STATEMENTS AND SUPPLEMENTARY DATA |
Report of Independent Registered Public Accounting Firm
The Board of Directors and Shareholders
Signet Jewelers Limited:
We have audited the accompanying consolidated balance sheets of Signet Jewelers Limited and subsidiaries as of January 30, 2010 and January 31, 2009, and the related consolidated income statements, and consolidated statements of shareholders’ equity, accumulated other comprehensive income, and cash flows for each of the 52 week periods ended January 30, 2010, January 31, 2009, and February 2, 2008. We have also audited Signet Jewelers Limited’s internal control over financial reporting as of January 30, 2010, based on criteria established in Internal Control—Integrated Framework issued by the Committee of Sponsoring Organizations of the Treadway Commission (COSO). Signet Jewelers Limited’s management is responsible for these consolidated financial statements, for maintaining effective internal control over financial reporting, and for its assessment of the effectiveness of internal control over financial reporting, included in the accompanying Management’s annual report on internal control over financial reporting. Our responsibility is to express an opinion on these consolidated financial statements and an opinion on the Company’s internal control over financial reporting based on our audits.
We conducted our audits in accordance with the standards of the Public Company Accounting Oversight Board (United States). Those standards require that we plan and perform the audits to obtain reasonable assurance about whether the financial statements are free of material misstatement and whether effective internal control over financial reporting was maintained in all material respects. Our audits of the consolidated financial statements included examining, on a test basis, evidence supporting the amounts and disclosures in the financial statements, assessing the accounting principles used and significant estimates made by management, and evaluating the overall financial statement presentation. Our audit of internal control over financial reporting included obtaining an understanding of internal control over financial reporting, assessing the risk that a material weakness exists, and testing and evaluating the design and operating effectiveness of internal control based on the assessed risk. Our audits also included performing such other procedures as we considered necessary in the circumstances. We believe that our audits provide a reasonable basis for our opinions.
A company’s internal control over financial reporting is a process designed to provide reasonable assurance regarding the reliability of financial reporting and the preparation of financial statements for external purposes in accordance with generally accepted accounting principles. A company’s internal control over financial reporting includes those policies and procedures that (1) pertain to the maintenance of records that, in reasonable detail, accurately and fairly reflect the transactions and dispositions of the assets of the company; (2) provide reasonable assurance that transactions are recorded as necessary to permit preparation of financial statements in accordance with generally accepted accounting principles, and that receipts and expenditures of the company are being made only in accordance with authorizations of management and directors of the company; and (3) provide reasonable assurance regarding prevention or timely detection of unauthorized acquisition, use, or disposition of the company’s assets that could have a material effect on the financial statements.
Because of its inherent limitations, internal control over financial reporting may not prevent or detect misstatements. Also, projections of any evaluation of effectiveness to future periods are subject to the risk that controls may become inadequate because of changes in conditions, or that the degree of compliance with the policies or procedures may deteriorate.
In our opinion, the consolidated financial statements referred to above present fairly, in all material respects, the financial position of Signet Jewelers Limited and subsidiaries as of January 30, 2010 and January 31, 2009, and the results of its operations and its cash flows for each of the 52 week periods ended January 30, 2010, January 31, 2009, and February 2, 2008, in conformity with U.S. generally accepted accounting principles. Also in our opinion, Signet Jewelers Limited maintained, in all material respects, effective internal control over financial reporting as of January 30, 2010, based on criteria established in Internal Control—Integrated Framework issued by the Committee of Sponsoring Organizations of the Treadway Commission.
KPMG Audit Plc
London, United Kingdom
March 25, 2010
90
Table of Contents
Consolidated income statements
| Fiscal 2010 |
Fiscal 2009 |
Fiscal 2008 |
Notes | |||||||||||
| $million | $million | $million | ||||||||||||
| Sales |
3,290.7 | 3,344.3 | 3,665.3 | 2 | ||||||||||
| Cost of sales |
(2,213.8 | ) | (2,264.2 | ) | (2,414.6 | ) | ||||||||
| Gross margin |
1,076.9 | 1,080.1 | 1,250.7 | |||||||||||
| Selling, general and administrative expenses |
(916.5 | ) | (969.2 | ) | (1,000.8 | ) | ||||||||
| Impairment of goodwill |
— | (516.9 | ) | — | 12 | |||||||||
| Relisting costs |
— | (10.5 | ) | — | ||||||||||
| Other operating income, net |
115.4 | 119.2 | 108.8 | 3 | ||||||||||
| Operating income/(loss), net |
275.8 | (297.3 | ) | 358.7 | 2 | |||||||||
| Interest income |
0.8 | 3.6 | 6.3 | |||||||||||
| Interest expense |
(34.8 | ) | (32.8 | ) | (28.8 | ) | ||||||||
| Income/(loss) before income taxes |
241.8 | (326.5 | ) | 336.2 | ||||||||||
| Income taxes |
(77.7 | ) | (67.2 | ) | (116.4 | ) | 6 | |||||||
| Net income/(loss) |
164.1 | (393.7 | ) | 219.8 | ||||||||||
| Earnings/(loss) per share – basic |
$ | 1.92 | $ | (4.62 | ) | $ | 2.58 | 7 | ||||||
| – diluted |
$ | 1.91 | $ | (4.62 | ) | $ | 2.55 | 7 | ||||||
All of the above relate to continuing activities attributable to equity shareholders.
The accompanying notes are an integral part of these consolidated financial statements.
91
Table of Contents
Consolidated balance sheets
| January 30, 2010 |
January 31, 2009 |
Notes | ||||||
| $million | $million | |||||||
| Assets |
||||||||
| Current assets: |
||||||||
| Cash and cash equivalents |
316.2 | 96.8 | 9 | |||||
| Accounts receivable, net |
858.0 | 825.2 | 10 | |||||
| Other receivables |
27.9 | 81.8 | ||||||
| Other current assets |
58.4 | 45.0 | ||||||
| Deferred tax assets |
2.2 | — | 6 | |||||
| Inventories |
1,173.1 | 1,364.4 | 11 | |||||
| Total current assets |
2,435.8 | 2,413.2 | ||||||
| Non-current assets: |
||||||||
| Property, plant and equipment, net |
396.9 | 452.1 | 13 | |||||
| Other intangible assets, net |
24.2 | 23.9 | 12 | |||||
| Other assets |
12.6 | 9.9 | ||||||
| Deferred tax assets |
54.7 | 54.8 | 6 | |||||
| Total assets |
2,924.2 | 2,953.9 | ||||||
| Liabilities and Shareholders’ equity |
||||||||
| Current liabilities: |
||||||||
| Loans and overdrafts |
44.1 | 187.5 | 17 | |||||
| Accounts payable |
66.2 | 42.2 | ||||||
| Accrued expenses and other current liabilities |
272.1 | 274.8 | 14 | |||||
| Deferred revenue |
120.1 | 120.1 | 15 | |||||
| Deferred tax liabilities |
74.7 | 56.9 | 6 | |||||
| Income taxes payable |
44.1 | 55.8 | ||||||
| Total current liabilities |
621.3 | 737.3 | ||||||
| Non-current liabilities: |
||||||||
| Long-term debt |
280.0 | 380.0 | 17 | |||||
| Other liabilities |
79.6 | 71.5 | 16 | |||||
| Deferred revenue |
140.9 | 142.5 | 15 | |||||
| Retirement benefit obligation |
4.8 | 12.9 | 19 | |||||
| Total liabilities |
1,126.6 | 1,344.2 | ||||||
| Commitments and contingencies |
21 | |||||||
| Shareholders’ equity: |
||||||||
| Common shares of $0.18 par value: authorized 500 million shares, 85.5 million shares issued and outstanding (2009: 85.3 million issued and outstanding) |
15.4 | 15.3 | 20 | |||||
| Additional paid-in capital |
169.9 | 164.5 | ||||||
| Other reserves |
235.2 | 235.2 | 20 | |||||
| Treasury shares: 0.03 million shares of $0.18 par value (2009: 0.1 million shares) |
(1.1 | ) | (10.7 | ) | 20 | |||
| Retained earnings |
1,556.4 | 1,400.9 | 20 | |||||
| Accumulated other comprehensive loss |
(178.2 | ) | (195.5 | ) | ||||
| Total shareholders’ equity |
1,797.6 | 1,609.7 | ||||||
| Total liabilities and shareholders’ equity |
2,924.2 | 2,953.9 | ||||||
The accompanying notes are an integral part of these consolidated financial statements.
92
Table of Contents
Consolidated statements of cash flows
| Fiscal 2010 |
Fiscal 2009 |
Fiscal 2008 |
|||||||
| $million | $million | $million | |||||||
| Cash flows from operating activities |
|||||||||
| Net income/(loss) |
164.1 | (393.7 | ) | 219.8 | |||||
| Adjustments to reconcile net income/(loss) to net cash provided by operating activities: |
|||||||||
| Depreciation of property, plant and equipment |
101.0 | 108.1 | 109.2 | ||||||
| Amortization of other intangible assets |
7.9 | 6.4 | 4.7 | ||||||
| Impairment of goodwill |
— | 516.9 | — | ||||||
| Pension |
(5.3 | ) | 0.2 | (2.0 | ) | ||||
| Share-based compensation |
5.6 | 0.7 | (3.4 | ) | |||||
| Deferred taxation |
15.5 | 24.7 | 6.9 | ||||||
| Facility amendment fees included in net income |
4.3 | — | — | ||||||
| Other non-cash movements |
0.8 | (2.8 | ) | (3.0 | ) | ||||
| Loss/(profit) on disposal of property, plant and equipment |
— | (0.7 | ) | 1.4 | |||||
| Changes in operating assets and liabilities: |
|||||||||
| (Increase)/decrease in accounts receivable |
(32.4 | ) | 20.5 | (56.2 | ) | ||||
| Decrease/(increase) in other receivables |
51.4 | (18.2 | ) | (5.2 | ) | ||||
| (Increase)/decrease in other current assets |
(27.7 | ) | 1.4 | 0.7 | |||||
| Decrease/(increase) in inventories |
226.5 | 12.7 | (96.8 | ) | |||||
| Increase/(decrease) in accounts payable |
22.0 | (38.0 | ) | (31.7 | ) | ||||
| (Decrease)/increase in accrued expenses and other liabilities |
(5.5 | ) | 6.1 | 7.7 | |||||
| (Decrease)/increase in deferred revenue |
(2.3 | ) | (9.8 | ) | 9.6 | ||||
| Decrease in income taxes payable |
(9.8 | ) | (20.5 | ) | (19.0 | ) | |||
| Effect of exchange rate changes on currency swaps |
(0.7 | ) | (49.6 | ) | (1.9 | ) | |||
| Net cash provided by operating activities |
515.4 | 164.4 | 140.8 | ||||||
| Investing activities |
|||||||||
| Purchase of property, plant and equipment |
(35.8 | ) | (105.1 | ) | (129.1 | ) | |||
| Purchase of other intangible assets |
(7.8 | ) | (9.8 | ) | (11.3 | ) | |||
| Proceeds from sale of property, plant and equipment |
0.1 | 1.6 | 1.0 | ||||||
| Net cash flows used in investing activities |
(43.5 | ) | (113.3 | ) | (139.4 | ) | |||
| Financing activities |
|||||||||
| Dividends paid |
— | (123.8 | ) | (123.9 | ) | ||||
| Proceeds from issue of common shares |
1.0 | 0.1 | 6.0 | ||||||
| Purchase of treasury shares |
— | — | (29.0 | ) | |||||
| Facility amendment fees paid |
(9.3 | ) | — | — | |||||
| (Repayment of)/proceeds from short-term borrowings |
(143.4 | ) | 160.6 | 31.1 | |||||
| Repayment of long-term debt |
(100.0 | ) | — | — | |||||
| Net cash flows (used in)/provided by financing activities |
(251.7 | ) | 36.9 | (115.8 | ) | ||||
| Cash and cash equivalents at beginning of period |
96.8 | 41.7 | 152.3 | ||||||
| Increase/(decrease) in cash and cash equivalents |
220.2 | 88.0 | (114.4 | ) | |||||
| Effect of exchange rate changes on cash and cash equivalents |
(0.8 | ) | (32.9 | ) | 3.8 | ||||
| Cash and cash equivalents at end of period |
316.2 | 96.8 | 41.7 | ||||||
| Supplemental cash flow information |
|||||||||
| Interest paid |
35.6 | 32.5 | 29.8 | ||||||
| Income taxes paid |
72.0 | 63.0 | 128.5 |
The accompanying notes are an integral part of these consolidated financial statements.
93
Table of Contents
Consolidated statements of shareholders’ equity
| Common shares at par value |
Deferred shares at par value |
Additional paid-in- capital |
Other reserves (Note 20) |
Treasury shares |
Retained earnings |
Accumulated other comprehensive (loss)/income |
Total shareholders equity |
||||||||||||||||
| $million | $million | $million | $million | $million | $million | $million | $million | ||||||||||||||||
| Balance at February 3, 2007 |
14.0 | — | 138.5 | 235.1 | (13.3 | ) | 1,855.5 | (1.9 | ) | 2,227.9 | |||||||||||||
| Comprehensive income: |
|||||||||||||||||||||||
| - Net income |
— | — | — | — | — | 219.8 | — | 219.8 | |||||||||||||||
| - Foreign currency translation adjustments |
— | — | — | — | — | — | (0.2 | ) | (0.2 | ) | |||||||||||||
| - Changes in fair value of derivative instruments, net of tax |
— | — | — | — | — | — | 11.2 | 11.2 | |||||||||||||||
| - Actuarial gains and losses on pension scheme, net of tax |
— | — | — | — | — | — | (9.4 | ) | (9.4 | ) | |||||||||||||
| - Prior service costs on pension scheme, net of tax |
— | — | — | — | — | — | 0.8 | 0.8 | |||||||||||||||
| Total comprehensive income |
222.2 | ||||||||||||||||||||||
| Translation of common shares prior to cancellation |
1.4 | — | (1.4 | ) | — | — | — | — | — | ||||||||||||||
| Cancellation of pound par common shares |
(15.4 | ) | — | 15.4 | — | — | — | — | — | ||||||||||||||
| Issuance of dollar par common shares |
15.4 | — | (15.4 | ) | — | — | — | — | — | ||||||||||||||
| Issuance of deferred shares |
— | 0.1 | — | — | — | — | — | 0.1 | |||||||||||||||
| Dividends |
— | — | — | — | — | (123.9 | ) | — | (123.9 | ) | |||||||||||||
| Share options exercised |
— | — | 6.9 | — | 2.5 | (4.0 | ) | — | 5.4 | ||||||||||||||
| Share-based compensation expense |
— | — | 18.5 | — | — | — | — | 18.5 | |||||||||||||||
| Purchase of own shares |
(0.1 | ) | — | — | 0.1 | — | (29.0 | ) | — | (29.0 | ) | ||||||||||||
| Balance at February 2, 2008 |
15.3 | 0.1 | 162.5 | 235.2 | (10.8 | ) | 1,918.4 | 0.5 | 2,321.2 | ||||||||||||||
| Comprehensive loss: |
|||||||||||||||||||||||
| - Net loss |
— | — | — | — | — | (393.7 | ) | — | (393.7 | ) | |||||||||||||
| - Foreign currency translation adjustments |
— | — | — | — | — | — | (190.4 | ) | (190.4 | ) | |||||||||||||
| - Changes in fair value of derivative instruments, net of tax |
— | — | — | — | — | — | 1.8 | 1.8 | |||||||||||||||
| - Actuarial gains and losses on pension scheme, net of tax |
— | — | — | — | — | — | (28.8 | ) | (28.8 | ) | |||||||||||||
| - Prior service costs on pension scheme, net of tax |
— | — | — | — | — | — | 21.4 | 21.4 | |||||||||||||||
| Total comprehensive loss |
(589.7 | ) | |||||||||||||||||||||
| Exchange of 1,705.5m par common shares in Signet Group Plc for 1,705.5m par common shares in Signet Jewelers Limited(1) |
— | (0.1 | ) | — | — | — | — | — | (0.1 | ) | |||||||||||||
| Dividends |
— | — | — | — | — | (123.8 | ) | — | (123.8 | ) | |||||||||||||
| Share options exercised |
— | — | — | — | 0.1 | — | — | 0.1 | |||||||||||||||
| Share-based compensation expense |
— | — | 2.0 | — | — | — | — | 2.0 | |||||||||||||||
| Balance at January 31, 2009 |
15.3 | — | 164.5 | 235.2 | (10.7 | ) | 1,400.9 | (195.5 | ) | 1,609.7 | |||||||||||||
| Comprehensive income: |
|||||||||||||||||||||||
| - Net income |
— | — | — | — | — | 164.1 | — | 164.1 | |||||||||||||||
| - Foreign currency translation adjustments |
— | — | — | — | — | — | 21.4 | 21.4 | |||||||||||||||
| - Changes in fair value of derivative instruments, net of tax |
— | — | — | — | — | — | (7.0 | ) | (7.0 | ) | |||||||||||||
| - Actuarial gains and losses on pension scheme, net of tax |
— | — | — | — | — | — | 3.6 | 3.6 | |||||||||||||||
| - Prior service costs on pension scheme, net of tax |
— | — | — | — | — | — | (0.7 | ) | (0.7 | ) | |||||||||||||
| Total comprehensive income |
181.4 | ||||||||||||||||||||||
| Reclassification of loss on share options exercised in prior periods |
— | — | — | — | 7.7 | (7.7 | ) | — | — | ||||||||||||||
| Share options exercised |
— | — | — | — | 1.9 | (0.9 | ) | — | 1.0 | ||||||||||||||
| Share-based compensation expense |
0.1 | — | 5.4 | — | — | — | — | 5.5 | |||||||||||||||
| Balance at January 30, 2010 |
15.4 | — | 169.9 | 235.2 | (1.1 | ) | 1,556.4 | (178.2 | ) | 1,797.6 | |||||||||||||
| (1) | As part of the scheme of arrangement and in connection with the change in primarily listing, the shareholders of the Predecessor Company exchanged 1,705,541,827 shares of par value $0.009 each in Signet Group Plc for 1,705,541,827 common shares of par value $0.009 each in Signet Jewelers Limited. Signet Jewelers Limited does not have any deferred shares. |
The accompanying notes are an integral part of these consolidated financial statements.
94
Table of Contents
Consolidated statements of accumulated other comprehensive income
| Pension plans | |||||||||||||||
| Foreign currency translation |
Changes in derivative instruments |
Actuarial (losses)/ gains |
Prior service (cost)/credit |
Accumulated other comprehensive (loss)/income |
|||||||||||
| $million | $million | $million | $million | $million | |||||||||||
| Balance at February 3, 2007 |
26.1 | 5.1 | (26.6 | ) | (6.5 | ) | (1.9 | ) | |||||||
| Other comprehensive income: |
|||||||||||||||
| Foreign currency translation |
(0.2 | ) | — | — | — | (0.2 | ) | ||||||||
| Changes in fair value of derivative instruments |
— | 12.0 | — | — | 12.0 | ||||||||||
| Actuarial loss |
— | — | (13.5 | ) | — | (13.5 | ) | ||||||||
| Prior service cost |
— | — | — | 1.2 | 1.2 | ||||||||||
| Deferred tax on items recognized in equity |
— | (0.8 | ) | 4.1 | (0.4 | ) | 2.9 | ||||||||
| 2.4 | |||||||||||||||
| Balance at February 2, 2008 |
25.9 | 16.3 | (36.0 | ) | (5.7 | ) | 0.5 | ||||||||
| Other comprehensive loss: |
|||||||||||||||
| Foreign currency translation |
(190.4 | ) | — | — | — | (190.4 | ) | ||||||||
| Changes in fair value of derivative instruments |
— | 5.9 | — | — | 5.9 | ||||||||||
| Actuarial loss |
— | — | (40.2 | ) | — | (40.2 | ) | ||||||||
| Prior service cost |
— | — | — | 29.9 | 29.9 | ||||||||||
| Deferred tax on items recognized in equity |
— | (4.1 | ) | 11.4 | (8.5 | ) | (1.2 | ) | |||||||
| (196.0 | ) | ||||||||||||||
| Balance at January 31, 2009 |
(164.5 | ) | 18.1 | (64.8 | ) | 15.7 | (195.5 | ) | |||||||
| Other comprehensive income: |
|||||||||||||||
| Foreign currency translation |
21.4 | — | — | — | 21.4 | ||||||||||
| Changes in fair value of derivative instruments |
— | (8.6 | ) | — | — | (8.6 | ) | ||||||||
| Actuarial gain |
— | — | 5.0 | — | 5.0 | ||||||||||
| Prior service cost |
— | — | — | (1.0 | ) | (1.0 | ) | ||||||||
| Deferred tax on items recognized in equity |
— | 1.6 | (1.4 | ) | 0.3 | 0.5 | |||||||||
| 17.3 | |||||||||||||||
| Balance at January 30, 2010 |
(143.1 | ) | 11.1 | (61.2 | ) | 15.0 | (178.2 | ) | |||||||
The accompanying notes are an integral part of these consolidated financial statements.
95
Table of Contents
Notes to the financial statements
1. Principal accounting policies
Signet Jewelers Limited (the “Company”) and its subsidiary undertakings is a leading retailer of jewelry, watches and associated services. Signet manages its business as two geographical segments, being the United States of America (the “US”) and the United Kingdom (the “UK”). The US division operates retail stores under brands including Kay Jewelers, Jared The Galleria Of Jewelry and various regional brands while the UK division’s retail stores operate under brands including H.Samuel and Ernest Jones.
On September 11, 2008 the Company, which is domiciled in Bermuda, was introduced as the parent company in accordance with a Scheme of Arrangement under the UK Companies Act 2006 (the “Scheme”). On this date shareholders in Signet Group plc exchanged their outstanding shares for Common Shares in the Company. Signet Group plc, the previous parent company, that was subsequently been renamed as Signet Group Limited, became a wholly and directly owned subsidiary of the Company.
For the periods prior to September 11, 2008 these financial statements represent the financial position, results of operations and cash flows of Signet Group plc and its subsidiaries and subsequent to this date represent the financial position, results of operations and cash flows of Signet Jewelers Limited and its subsidiaries.
In relation to the financial statements of Signet, the following accounting policies have, unless otherwise stated, been applied consistently in dealing with items which are considered material in all reporting periods presented herein.
(a) Basis of preparation
The consolidated financial statements of Signet are prepared in accordance with US GAAP and include the results of the Company and its subsidiary undertakings made up for the 52 week period ended January 30, 2010 (“fiscal 2010”). The comparative periods are for the 52 week period ended January 31, 2009 (“fiscal 2009”) and the 52 week period ended February 2, 2008 (“fiscal 2008”). Intercompany balances have been eliminated on consolidation.
(b) Use of estimates
The preparation of consolidated financial statements, in conformity with US GAAP and Security and Exchange Commission (“SEC”) regulations, requires management to make estimates and assumptions that affect the reported amounts of assets and liabilities, disclosure of contingent assets and liabilities at the date of the consolidated financial statements and reported amounts of revenues and expenses during the reporting period. Actual results could differ from those estimates. Estimates and assumptions are primarily made in relation to the valuation of receivables, the valuation of inventory, depreciation and asset impairment, the valuation of employee benefits, income taxes and contingencies.
(c) Foreign currency translation
The results of subsidiary undertakings whose functional currency is not US dollars are translated into US dollars at the weighted average rate of exchange during the period and their balance sheets are translated at the rates ruling at the balance sheet date. Exchange differences arising from the translation of the net assets of overseas subsidiary undertakings into US dollars and matched foreign currency borrowings are included in accumulated other comprehensive (loss)/income.
Monetary assets and liabilities denominated in foreign currencies at the balance sheet date are translated into the relevant functional currency at the foreign exchange rate in effect at that date, with gains and losses recorded in other operating income. Transaction gains and losses are also recognized in arriving at operating income.
96
Table of Contents
Notes to the financial statements (continued)
(d) Revenue recognition
Revenue is recognized when:
| • | there is persuasive evidence of an agreement or arrangement; |
| • | delivery of products has occurred or services have been rendered; |
| • | the seller’s price to the buyer is fixed and determinable; and |
| • | collectability is reasonably assured. |
Signet’s revenue streams and their respective accounting treatments are discussed below:
Merchandise sales
Store sales are recognized when the customer receives and pays for the merchandise at the store with either cash or credit card. For online sales, sales are recognized at the estimated time the customer has received the merchandise. Amounts related to shipping and handling that are billed to customers are reflected in sales and the related costs are reflected in cost of sales.
Revenue on the sale of merchandise is reported net of anticipated returns and sales tax collected. Returns are based on previous return rates experienced.
Any deposits received from a customer for merchandise are deferred and recognized when the customer receives the merchandise.
Certain of Signet’s merchandise sales are derived from providing replacement merchandise on behalf of insurance organizations to their customers who have experienced a loss of their property. In these cases, the sales price is established by contract with the insurance organization and revenue on the sale is recognized upon receipt of the merchandise by the customer.
Merchandise repairs
Revenue on repair of merchandise is recognized when the service is complete and the customer collects the merchandise at the store.
Extended service and lifetime warranty agreements
At the option of the customer and separately from the purchase of merchandise, Signet sells extended service and lifetime warranty agreements on certain merchandise. The terms of the lifetime warranty agreements obligate Signet, subject to certain conditions, to perform repair work beyond normal wear and tear over the lifetime of the product. Revenue from the sale of extended service and lifetime warranty agreements is recognized in proportion to the costs expected to be incurred in performing services under the agreements. Revenue recognized in a period is based on the historical claims experience of the business. Management reviews the pattern of claims at the end of each period to determine any significant trends that may require changes to revenue recognition rates.
Where Signet sells extended service and lifetime warranty agreements in the capacity as an agent on behalf of a third party, commission revenue is recognized at time of sale less an estimate of cancellations based on historical experience.
97
Table of Contents
Notes to the financial statements (continued)
Sale vouchers
When vouchers issued on a purchase give a discount against a future purchase, the estimated fair value of those vouchers to the customer is treated as deferred revenue. This revenue is then recognized as vouchers are redeemed over the period until voucher expiry.
Sale of consignment inventory
Sales of consignment inventory are accounted for on a gross sales basis. This reflects that the Company is the primary obligor providing independent advice, guidance and after sales service to customers. The products sold from consignment inventory are indistinguishable to the customer from other products that are sold from purchased inventory. They are sold on the same terms and are not separately identified as consignment items in the stores. The Company selects the products and suppliers at its own discretion and is responsible for the physical security of the products making it liable for any inventory loss. It also takes the credit risk of a sale to the customer.
(e) Cost of sales and selling, general and administrative expenses
Cost of sales includes all costs incurred in the purchase, processing and distribution of the merchandise and all costs directly incurred in the operation and support of retail outlets. This includes inbound freight charges, purchasing and receiving costs, inspection and internal transfer costs. Cost of sales also includes the net provision for uncollectible receivables for the US division. Selling, general and administrative expenses include all costs not directly incurred in the purchase, processing and distribution of merchandise or support of the retail outlets. This includes selling, administration, finance and management expenses.
(f) Store opening costs
The opening costs of new locations are expensed as incurred.
(g) Advertising and promotional costs
Advertising and promotional costs are expensed within selling, general and administrative expenses. Production costs are expensed at the first communication of the advertisements, whilst communication expenses are incurred each time the advertisement is communicated. For catalogues and circulars, costs are all expensed at the first date they can be viewed by the consumer. Point of sale promotional material is expensed when first displayed in the stores. Advertising costs totalled $169.3 million in fiscal 2010 (fiscal 2009: $210.6 million; fiscal 2008: $233.2 million).
(h) Other intangible assets
Other intangible assets, which comprise computer software purchased or developed for internal use, are stated at cost less accumulated amortization. Costs are capitalized in accordance with the provisions of Accounting Standards Codification (“ASC”) 350-40. Signet’s policy provides for the capitalization of external direct costs of materials and services associated with developing or obtaining internal use computer software. In addition, Signet also capitalizes certain payroll and payroll-related costs for employees who are directly associated with internal use computer projects. Amortization is charged on a straight-line basis over periods from three to five years.
(i) Property, plant and equipment
Property, plant and equipment are stated at cost less accumulated depreciation and impairment losses. Maintenance and repair costs are expensed as incurred.
98
Table of Contents
Notes to the financial statements (continued)
Depreciation on freehold and leasehold retail premises is calculated over the lesser of 50 years or the lease term. Long leaseholds relate to leases that have an original and unexpired lease term of greater than 25 years. Freehold land is not depreciated.
Depreciation on other fixed assets is provided on a straight-line basis over the estimated useful lives at the following annual rates:
Plant, machinery and vehicles – rates up to 33 1/3%,
Shopfronts, fixtures and fittings – rates up to 33 1/3%.
Leasehold improvements are depreciated over the shorter of the term of the lease or the estimated useful life of the improvements. Where the renewal of a lease is reasonably assured, the depreciation period for shopfronts, fixtures and fittings may exceed the remaining initial lease term, if constructed significantly after, and not contemplated at, the beginning of the lease term.
At the time property, plant and equipment is retired or otherwise disposed of, the cost and accumulated depreciation are eliminated from the asset and accumulated depreciation accounts.
Property, plant and equipment is reviewed for impairment whenever events or changes in circumstances indicate that the carrying amount of an asset may not be recoverable. Potentially impaired assets or asset groups are identified by reviewing the cash flows of individual stores. Recoverability of assets to be held and used is measured by a comparison of the carrying amount of an asset to estimated undiscounted future cash flows expected to be generated by the asset. If the undiscounted cash flow is less than the asset’s carrying amount, the impairment charge recognized is determined by estimating the fair value of the assets and recording a loss for the amount that the carrying value exceeds the estimated fair value. Property, plant and equipment at stores planned for closure are depreciated over a revised estimate of their useful lives.
(j) Inventories
Inventories represent raw materials and goods held for resale and are valued at the lower of cost or market value. Cost is determined using average cost and includes overheads directly related to bringing inventory to its present location and condition. These include relevant warehousing, distribution and certain buying, security and data processing costs. Market value is defined as estimated selling price less all estimated costs of completion and costs to be incurred in marketing, selling and distribution. Inventory write-downs are made for obsolete, slow moving or defective items and shrinkage. The write-down is equal to the difference between the cost of inventory and its estimated market value based upon assumptions of targeted inventory turn rates, future demand, management strategy and market conditions. Shrinkage is estimated for the period from the last inventory date to the end of the fiscal year on a store by store basis. Such estimates are based on experience. Physical inventories are taken at least once annually for all store locations and for distribution centers.
(k) Vendor contributions
Contributions are received from vendors through various programs and arrangements including cooperative advertising. Where vendor contributions are received in respect of identifiable promotional events, these are matched against the costs of these promotions. Vendor contributions which are received as general contributions and not against specific promotional events are recognized when the inventory is sold.
(l) In-house customer finance programs
Signet operates an in-house program in the US business to allow customers to finance merchandise purchases. The programs have various billing and payment structures, including varying minimum payment levels and
99
Table of Contents
Notes to the financial statements (continued)
finance charge rates and fees. Signet recognizes finance charges in accordance with the contractual agreements. Gross interest earned is recorded as other operating income in the income statement. See Note 3. Allowances for uncollectible amounts are recorded as a charge to cost of sales in the income statement.
(m) Accounts receivable
Accounts receivable, stated at their nominal amounts, include amounts outstanding from Signet’s in-house customer finance programs and third party credit cards. Accounts receivable under the customer finance programs are shown net of an allowance for uncollectible amounts. The allowance is an estimate of inherent losses as of the balance sheet date, and is calculated using a model that analyzes factors such as delinquency rates, recovery rates and other portfolio data. The calculation is reviewed by management to assess whether, based on economic events, additional analyses are required to appropriately estimate losses inherent in the portfolio.
(n) Leases
Assets held under capital leases relate to leases where substantially all the risks and rewards of the asset have passed to Signet. All other leases are defined as operating leases. Where operating leases include clauses in respect of predetermined rent increases, those rents are charged to the income statement on a straight-line basis over the lease term, including any construction period or other rental holiday. Other rentals paid under operating leases are charged to the income statement as incurred. Premiums paid to acquire short leasehold properties and inducements to enter into a lease are recognized on a straight line basis over the lease term.
Certain leases provide for contingent rentals that are not measurable at inception. These contingent rentals are primarily based on a percentage of sales that is in excess of a predetermined level. These amounts are excluded from minimum rent and are included in the determination of rent expense when it is probable that the expense has been incurred and the amount is reasonably estimable.
(o) Taxation
Income taxes are accounted for using the asset and liability method. Under this method, deferred income taxes arise from temporary differences between the tax basis of assets and liabilities and their reported amounts in the consolidated financial statements. A valuation allowance is established against deferred tax assets when it is more likely than not that some portion or all of the deferred tax assets will not be realized.
On February 4, 2007 Signet adopted ASC 740-10 “Accounting for Uncertainty in Income Taxes”. The standard established a two-step approach for recognizing and measuring tax benefits, with tax benefits arising from uncertain income tax positions only being recognized when considered to be more likely than not sustained upon examination by the taxing authority. A recognized tax position is then measured at the largest amount of benefit that is greater than 50% likely of being realized upon settlement. ASC 740-10 also provides guidance on derecognition, classification, interest and penalties, disclosure and transition issues. Signet recognizes interest and penalties related to unrecognized tax benefits in income tax expense.
At any point in time, many tax years are subject to, or are in the process of, audit by various taxing authorities. To the extent that management’s estimates of settlements change, or the final tax outcome of these matters is different than the amounts recorded, such differences will impact the income tax provision in the period in which such determinations are made.
(p) Employee benefits
Signet operates a defined benefit pension scheme in the UK (the “Group Scheme”) which ceased to admit new employees from April 2004. The Group Scheme, covering one of the executive directors and participating eligible employees, provides benefits based on members’ salaries at retirement. The Group Scheme’s assets are held by the Group Scheme trustees and are completely separate from those of Signet.
100
Table of Contents
Notes to the financial statements (continued)
The net periodic cost of the Group Scheme is measured on an actuarial basis using the projected unit credit method and several actuarial assumptions, the most significant of which are the discount rate and the expected long-term rate of return on plan assets. Other material assumptions include rates of participant mortality, the expected long-term rate of compensation and pension increases and rates of employee termination. Gains and losses occur when actual experience differs from actuarial assumptions. If such gains or losses exceed ten percent of the greater of plan assets or plan liabilities, Signet amortizes those gains or losses over the average remaining service period of the employees.
The net periodic pension cost is charged to selling, general and administrative expenses in the income statement.
The funded status of the Group Scheme is recognized on the balance sheet, and is the difference between the fair value of plan assets and the benefit obligation measured at the balance sheet date. Any gains or losses and prior service costs or credits that arise during the period but are not included as components of net periodic benefit cost are recognized, net of tax, in the period within other comprehensive (loss)/income.
Signet also operates a defined contribution pension scheme in the UK and sponsors a defined contribution 401(k) retirement savings plan in the US. Contributions made by Signet to these pension arrangements are charged to the income statement as incurred.
(q) Derivative financial instruments and hedge accounting
Signet uses derivative financial instruments for other than trading purposes to alter the risk profile of an existing underlying exposure. Forward foreign currency exchange contracts are used to manage currency and commodity exposures arising from future purchases.
Derivative financial instruments are measured at fair value and are recognized as assets or liabilities on the balance sheet with changes in the fair value of the derivatives being recognized immediately in the income statement or accumulated other comprehensive (loss)/income, depending on the timing and designated purpose of the derivative.
Changes in the fair value of derivative financial instruments that are designated and effective as hedges of future cash flows are recognized directly in equity as a component of accumulated other comprehensive (loss)/income. Changes in the fair value of derivatives that do not qualify for hedge accounting, together with any hedge ineffectiveness, is recognized immediately in other operating income, net. For the effective portion of cash flow hedges, amounts previously recognized in equity are recognized in the income statement in the same period in which the hedged item affects net income or loss.
(r) Cash and cash equivalents
Cash and cash equivalents comprise money market deposits and amounts placed with external fund managers with an original maturity of three months or less, and are carried at cost which approximates to fair value.
(s) Borrowing costs
Borrowings comprise interest bearing bank loans, private placement loan notes, and bank overdrafts. Borrowing costs are capitalized and amortized into interest expense over the contractual term of the related loan.
(t) Share-based compensation
Signet measures share-based compensation cost for awards classified as equity at the grant date, based on the estimated fair value of the award, and recognizes the cost as an expense on a straight-line basis (net of estimated
101
Table of Contents
Notes to the financial statements (continued)
forfeitures) over the requisite service period of employees. Certain of Signet’s share plans include a condition whereby vesting is contingent on growth exceeding the scheme target adjusted by movements in the relevant UK or US Retail Price Index (“RPI”). The RPI condition is neither a market nor a performance condition, and consequently any awards granted with this condition are classified as liability awards.
Signet measures share-based compensation cost for awards classified as liabilities at fair value, which is re-measured at the end of each reporting period until the performance criteria have been satisfied and the amounts are reclassified to equity. Changes in the fair value that occur while the award is liability classified are recognized as a compensation cost over the requisite service period.
Signet estimates fair value using a Black-Scholes valuation model for the Long Term Incentive Plan (“LTIP”) options; all other share-based awards are valued using a binomial valuation model. Deferred tax assets for awards that result in deductions on the income tax returns of subsidiary undertakings are recorded by Signet based on the amount of compensation cost recognized and the subsidiary undertaking’s statutory tax rate in the jurisdiction in which it will receive a deduction. Differences between the deferred tax assets recognized for financial reporting purposes and the actual tax deduction reported on the subsidiary undertaking’s income tax return are recorded in additional paid-in-capital (if the tax deduction exceeds the deferred tax asset) or in the income statement (if the deferred tax asset exceeds the tax deduction and no additional paid-in-capital exists from previous awards).
Share-based compensation is recorded in selling, general and administrative expenses in the income statement, along with the relevant salary cost.
See Note 22 for a further description of Signet’s share option plans.
(u) Contingent liabilities
Provisions for contingent liabilities are recorded for probable losses when management is able to estimate the loss.
(v) Common shares
When new shares are issued, they are recorded in Common Shares at their par value. The excess of the issue price over the par value is recorded in additional paid-in-capital.
The cost of own shares purchased to satisfy the exercise of employee share options is deducted from total equity and the proceeds of their onward transfer are credited to total equity.
(w) Dividends
Dividends are provided for in the period in which they are formally approved.
(x) Recently issued accounting pronouncements
Adopted during the period
Accounting standards codification
In June 2009, the FASB issued ASC 805-10 (formerly SFAS No. 168), “The FASB Accounting Standards Codification and the Hierarchy of Generally Accepted Accounting Principles”. ASC 805-10 provides for the FASB Accounting Standards Codification (the “Codification”) to become the single official source of authoritative US GAAP. The Codification does not change US GAAP but reorganizes the literature. ASC 805-10 is effective for interim and annual periods ending after September 15, 2009 and only affects disclosures by Signet.
102
Table of Contents
Notes to the financial statements (continued)
Disclosures about derivative instruments and hedging activities
In March 2008, the FASB issued ASC 815-10 (formerly SFAS No. 161), “Disclosures about Derivative Instruments and Hedging Activities”. The Statement requires companies with derivative instruments to disclose information that should enable financial statement users to understand how and why a company uses derivative instruments, how derivative instruments and related hedged items are accounted for and how derivative instruments and related hedged items affect a company’s financial position, financial performance and cash flows. The required disclosures include the fair value of derivative instruments and their gains or losses in tabular format, information about credit risk related contingent features in derivative agreements, counterparty credit risk and a company’s strategies and objectives for using derivative instruments. ASC 815-10 expands the current disclosure framework and is effective prospectively for periods beginning on or after November 15, 2008. Adoption of ASC 815-10 increased disclosure requirements but does not affect Signet’s financial position, operating results or cash flows.
Postretirement benefit plan assets
In December 2008, the FASB issued ASC 715-20 (formerly FSP FAS 132(R)-1) “Employers’ Disclosures about Postretirement Benefit Plan Assets”. ASC 715-20 provides guidance on an employer’s disclosures about plan assets of a defined benefit pension or postretirement plan including more information about how investment allocation decisions are made, more information about major categories of plan assets and the fair-value techniques and inputs used to measure assets. ASC 715-20 is effective for annual periods ending after December 15, 2009. Adoption of ASC 715-20 increased disclosure requirements but does not affect Signet’s financial position, operating results or cash flows.
Subsequent events
In May 2009, the FASB issued ASC 855-10 (formerly SFAS No. 165) regarding the period after the balance sheet date during which management of a reporting entity shall evaluate events or transactions that may occur for potential recognition or disclosure in the financial statements. Additionally, ASC 855-10 sets out recognition and disclosure requirements for events or transactions that occur after the balance sheet date, including a requirement to disclose the date through which subsequent events have been evaluated. ASC 855-10 is effective prospectively for periods ending after June 15, 2009. Adoption of ASC 855-10 has increased disclosure requirements but has not affected Signet’s financial position, operating results or cash flows.
To be adopted in future periods
Fair value measurements and disclosures
In August 2009, the FASB issued ASU 2009-05, which amends ASC 820-10 “Fair Value Measurements and Disclosures”. ASU 2009-05 provides guidance on the valuation techniques used to measure fair value in situations where a quoted price in an active market for the identical liability is not available. ASU 2009-05 is effective for the first reporting period beginning after issuance and the adoption of these amendments is not expected to have a material effect on Signet.
Revenue recognition—multi-deliverable arrangements
In October 2009, the FASB issued ASU 2009-13, which amends ASC 605-25 “Revenue Recognition—Multi-Deliverable Arrangements”. ASU 2009-13 requires arrangement consideration to be allocated to all deliverables at inception using a relative selling price method and establishes a selling price hierarchy for determining the selling price of a deliverable. The update also expands the disclosure requirements to include additional detail
103
Table of Contents
Notes to the financial statements (continued)
regarding the deliverables, method of calculation of selling price and the timing of revenue recognition. ASU 2009-13 is effective prospectively for revenue arrangements entered into or materially modified in fiscal years beginning on or after June 15, 2010. The adoption of these amendments is not expected to have a material effect on Signet.
2. Segmental information
Signet’s sales are derived from the retailing of jewelry, watches, other products and services. Signet is managed as two geographical operating segments, being the US and UK divisions. These segments represent channels of distribution that offer similar merchandise and service and have similar marketing and distribution strategies. Both divisions are managed by executive committees, which report through a divisional Chief Executive to Signet’s Chief Executive who in turn reports to the Board. Each divisional executive committee is responsible for operating decisions within parameters set by the Board. The performance of each division is regularly evaluated based on sales and operating income. The operating segments do not include certain central costs which is consistent with the treatment in Signet’s management accounts. There are no material transactions between operating segments.
| Fiscal 2010 |
Fiscal 2009 |
Fiscal 2008 |
|||||||
| $million | $million | $million | |||||||
| Sales: |
|||||||||
| US |
2,557.5 | 2,536.1 | 2,705.7 | ||||||
| UK |
733.2 | 808.2 | 959.6 | ||||||
| Total sales |
3,290.7 | 3,344.3 | 3,665.3 | ||||||
| Operating income/(loss), net(1): |
|||||||||
| US |
235.8 | (236.4 | ) | 265.2 | |||||
| UK |
56.5 | (37.4 | ) | 109.3 | |||||
| Unallocated(2) |
(16.5 | ) | (23.5 | ) | (15.8 | ) | |||
| Total operating income/(loss) |
275.8 | (297.3 | ) | 358.7 | |||||
| Depreciation and amortization: |
|||||||||
| US |
78.4 | 84.0 | 72.1 | ||||||
| UK |
30.5 | 30.5 | 41.8 | ||||||
| Total depreciation and amortization |
108.9 | 114.5 | 113.9 | ||||||
| Capital additions: |
|||||||||
| US |
31.1 | 76.7 | 111.1 | ||||||
| UK |
12.5 | 38.1 | 28.6 | ||||||
| Unallocated(2) |
— | 0.1 | 0.7 | ||||||
| Total capital additions |
43.6 | 114.9 | 140.4 | ||||||
| (1) | In fiscal 2009, operating loss, net included $516.9 million (US: $408.0 million; UK: $108.9 million) of goodwill impairment, and an additional $10.5 million of costs were included in unallocated in respect of moving the primary listing to the NYSE. |
| (2) | Unallocated principally relates to central costs. |
104
Table of Contents
Notes to the financial statements (continued)
| January 30, 2010 |
January 31, 2009 |
|||||
| $million | $million | |||||
| Total assets: |
||||||
| US |
2,280.7 | 2,287.0 | ||||
| UK |
383.6 | 343.1 | ||||
| Unallocated |
259.9 | 323.8 | ||||
| Total assets |
2,924.2 | 2,953.9 | ||||
| Total long-lived assets: |
||||||
| US |
327.0 | 374.9 | ||||
| UK |
93.6 | 100.5 | ||||
| Unallocated |
0.5 | 0.6 | ||||
| Total long-lived assets |
421.1 | 476.0 | ||||
| Total liabilities: |
||||||
| US |
(697.0 | ) | (894.8 | ) | ||
| UK |
(148.0 | ) | (112.7 | ) | ||
| Unallocated |
(281.6 | ) | (336.7 | ) | ||
| Total liabilities |
(1,126.6 | ) | (1,344.2 | ) | ||
Sales by product
| Fiscal 2010 |
Fiscal 2009 |
Fiscal 2008 | ||||
| $million | $million | $million | ||||
| Diamonds and diamond jewelry |
1,978.5 | 1,898.9 | 2,068.5 | |||
| Watches |
385.6 | 391.6 | 444.8 | |||
| Gold, silver jewelry, other products and services |
926.6 | 1,053.8 | 1,152.0 | |||
| Total sales |
3,290.7 | 3,344.3 | 3,665.3 | |||
Sales to any individual customer were not significant to Signet’s consolidated sales.
3. Other operating income, net
| Fiscal 2010 |
Fiscal 2009 |
Fiscal 2008 | ||||
| $million | $million | $million | ||||
| Interest income from in-house customer finance programs |
115.0 | 114.4 | 108.4 | |||
| Other |
0.4 | 4.8 | 0.4 | |||
| Other operating income, net |
115.4 | 119.2 | 108.8 | |||
105
Table of Contents
Notes to the financial statements (continued)
4. Staff costs
Staff costs were as follows:
| Fiscal 2010 |
Fiscal 2009 |
Fiscal 2008 |
|||||
| $million | $million | $million | |||||
| Wages and salaries |
614.6 | 620.4 | 635.7 | ||||
| Social security costs |
53.5 | 52.9 | 54.5 | ||||
| Pension costs |
8.8 | 12.2 | 11.4 | ||||
| Share-based compensation expense/(income) |
4.9 | 0.7 | (3.4 | ) | |||
| Total staff costs |
681.8 | 686.2 | 698.2 | ||||
5. Foreign currency translation
The exchange rates used for translation of UK pound transactions and balances in these accounts are as follows:
| Fiscal 2010 |
Fiscal 2009 |
Fiscal 2008 | ||||
| Income statement (average rate) |
1.59 | 1.75 | 2.00 | |||
| Balance sheet (period end rate) |
1.60 | 1.45 | 1.97 |
6. Taxation
| Fiscal 2010 |
Fiscal 2009 |
Fiscal 2008 |
|||||||
| $million | $million | $million | |||||||
| Income/(loss) before income taxes: |
|||||||||
| – US |
154.2 | (309.8 | ) | 203.7 | |||||
| – Foreign |
87.6 | (16.7 | ) | 132.5 | |||||
| Total income/(loss) before income taxes |
241.8 | (326.5 | ) | 336.2 | |||||
| Current taxation: |
|||||||||
| – US |
42.5 | 10.6 | 67.5 | ||||||
| – Foreign |
19.7 | 31.9 | 42.0 | ||||||
| Deferred taxation: |
|||||||||
| – US |
18.1 | 26.5 | 9.5 | ||||||
| – Foreign |
(2.6 | ) | (1.8 | ) | (2.6 | ) | |||
| Total income taxes |
77.7 | 67.2 | 116.4 | ||||||
| Fiscal 2010 |
Fiscal 2009 |
Fiscal 2008 |
|||||||
| $million | $million | $million | |||||||
| Sources of deferred taxation are as follows: |
|||||||||
| US property, plant and equipment |
1.9 | 14.3 | (2.6 | ) | |||||
| Foreign property, plant and equipment |
(1.3 | ) | (1.0 | ) | (2.5 | ) | |||
| Inventory valuation |
16.4 | 7.1 | 21.3 | ||||||
| Allowances for doubtful debts |
(0.6 | ) | (2.6 | ) | (3.2 | ) | |||
| Revenue deferral (extended service agreements) |
2.3 | (1.9 | ) | (5.5 | ) | ||||
| Straight line lease payments |
(1.7 | ) | (2.4 | ) | (2.2 | ) | |||
| Deferred compensation |
(0.6 | ) | 12.3 | (1.7 | ) | ||||
| Retirement benefit obligations |
— | — | (1.2 | ) | |||||
| Other temporary differences |
(0.9 | ) | (1.1 | ) | 4.5 | ||||
| 15.5 | 24.7 | 6.9 | |||||||
106
Table of Contents
Notes to the financial statements (continued)
As the statutory rate of corporation tax in Bermuda is 0%, the differences between the federal income tax rate in the US and the effective tax rates for Signet have been presented below:
| Fiscal 2010 |
Fiscal 2009 |
Fiscal 2008 |
|||||||
| % | % | % | |||||||
| US federal income tax rates |
35.0 | (35.0 | ) | 35.0 | |||||
| US state income taxes |
2.1 | 0.9 | 1.7 | ||||||
| Differences between US federal and foreign statutory income tax rates |
(2.5 | ) | (2.1 | ) | (2.1 | ) | |||
| Goodwill impairment not tax deductible |
— | 55.4 | — | ||||||
| Expenditure permanently disallowable for tax purposes, net of permanent undercharges |
2.4 | 2.0 | 1.0 | ||||||
| Benefit of intra-group financing arrangements |
(1.8 | ) | — | — | |||||
| Over provision in respect of previous periods |
(3.1 | ) | (0.6 | ) | (1.0 | ) | |||
| Effective tax rate |
32.1 | 20.6 | 34.6 | ||||||
Signet’s effective tax rate is lower than the US federal income tax rate because a proportion of Signet’s business is conducted outside the US and is subject to tax at lower rates. The reduction in Signet’s effective tax rate due to lower rates of foreign tax is offset by the impact of US state tax rates on US taxable income.
Signet’s future effective tax rate is dependent on changes in the geographic mix of incomes and the movement in foreign exchange translation rates. It is likely that there will be greater volatility in Signet’s effective tax rate going forward owing to changes in the tax environment in both the US and foreign jurisdictions.
Deferred tax assets/(liabilities) consisted of the following:
| January 30, 2010 | January 31, 2009 | |||||||||||||||||
| Assets | (Liabilities) | Total | Assets | (Liabilities) | Total | |||||||||||||
| $million | $million | $million | $million | $million | $million | |||||||||||||
| US property, plant and equipment |
— | (32.0 | ) | (32.0 | ) | — | (30.1 | ) | (30.1 | ) | ||||||||
| Foreign property, plant and equipment |
4.1 | — | 4.1 | 2.5 | — | 2.5 | ||||||||||||
| Inventory valuation |
— | (100.9 | ) | (100.9 | ) | — | (84.5 | ) | (84.5 | ) | ||||||||
| Allowances for doubtful debts |
25.3 | — | 25.3 | 24.7 | — | 24.7 | ||||||||||||
| Revenue deferral (extended service agreements) |
45.8 | — | 45.8 | 48.1 | — | 48.1 | ||||||||||||
| Straight line lease payments |
21.4 | — | 21.4 | 19.7 | — | 19.7 | ||||||||||||
| Deferred compensation |
2.7 | — | 2.7 | 1.0 | — | 1.0 | ||||||||||||
| Retirement benefit obligations |
1.4 | — | 1.4 | 3.6 | — | 3.6 | ||||||||||||
| Other temporary differences |
14.8 | — | 14.8 | 13.1 | — | 13.1 | ||||||||||||
| Value of foreign capital losses |
23.9 | — | 23.9 | 20.2 | — | 20.2 | ||||||||||||
| Total deferred tax asset/(liability) |
139.4 | (132.9 | ) | 6.5 | 132.9 | (114.6 | ) | 18.3 | ||||||||||
| Valuation allowance |
(24.3 | ) | — | (24.3 | ) | (20.4 | ) | — | (20.4 | ) | ||||||||
| Deferred tax asset/(liability) |
115.1 | (132.9 | ) | (17.8 | ) | 112.5 | (114.6 | ) | (2.1 | ) | ||||||||
| Current assets |
2.2 | — | ||||||||||||||||
| Current liabilities |
(74.7 | ) | (56.9 | ) | ||||||||||||||
| Non-current assets |
54.7 | 54.8 | ||||||||||||||||
| Deferred tax liability |
(17.8 | ) | (2.1 | ) | ||||||||||||||
As of January 30, 2010 Signet had foreign gross capital loss carry forwards of $85.4 million (fiscal 2009: $72.1 million) which are only available to offset future capital gains, if any, over an indefinite period.
107
Table of Contents
Notes to the financial statements (continued)
The increase in the total valuation allowance in fiscal 2010 was $3.9 million (fiscal 2009: $7.6 million net decrease; fiscal 2008: $1.6 million net decrease). The valuation allowance primarily relates to foreign capital loss carry forwards that, in the judgment of management, are not more likely than not to be realized.
The difference on foreign currency translation in respect of deferred tax posted directly to other comprehensive income in fiscal 2010 was $1.0 million credit (fiscal 2009: $3.0 million charge; fiscal 2008: $0.1 million charge). Signet believes that it is more likely than not that deferred tax assets as of January 30, 2010 will be offset where permissible by deferred tax liabilities or realized on future tax returns, primarily from the generation of future taxable income.
The following table summarizes the activity related to unrecognized tax benefits:
| Fiscal 2010 |
Fiscal 2009 |
Fiscal 2008 |
|||||||
| $million | $million | $million | |||||||
| Balance at beginning of period |
18.8 | 19.2 | 18.2 | ||||||
| Increases related to current year tax positions |
1.0 | 2.1 | 3.4 | ||||||
| Prior year tax positions |
|||||||||
| Increases |
— | — | 2.3 | ||||||
| Decreases |
(1.5 | ) | (0.6 | ) | (2.8 | ) | |||
| Cash settlements |
(4.0 | ) | — | (1.9 | ) | ||||
| Difference on foreign currency translation |
0.6 | (1.9 | ) | — | |||||
| Balance at end of period |
14.9 | 18.8 | 19.2 | ||||||
Signet has business activity in all states within the US and files income tax returns for the US federal jurisdiction and all applicable states. Signet also files income tax returns in the UK and certain other foreign jurisdictions. Signet is subject to US federal and state examinations by tax authorities for tax years after October 29, 2005 and is subject to examination by the UK tax authority for tax years after January 31, 2005.
As of January 30, 2010 Signet had approximately $14.9 million (fiscal 2009: $18.8 million; fiscal 2008: $19.2 million) of unrecognized tax benefits in respect of uncertain tax positions, all of which would favorably affect the effective income tax rate if resolved in its favor. These unrecognized tax benefits relate to financing arrangements and intra-company charges which are subject to different and changing interpretations of tax law.
During fiscal 2010, agreement was reached with the Internal Revenue Service in the US in respect of the treatment of certain financing arrangements and a cash settlement was paid of approximately $4.0 million, excluding interest thereon. Apart from this settlement, there has been no material change in the amount of unrecognized tax benefits in respect of uncertain tax positions during fiscal 2010.
Signet recognizes accrued interest and, where appropriate, penalties related to unrecognized tax benefits within income tax expense. In fiscal 2010 the total amount of interest and penalties recognized in income tax expense in the consolidated income statement was $0.3 million, net credit (fiscal 2009: $nil, net; fiscal 2008: $1.1 million, net charge). As of January 30, 2010 Signet had accrued interest of $2.2 million (fiscal 2009: $3.8 million; fiscal 2008: $3.8 million).
Over the next twelve months management believes that it is reasonably possible that there could be a reduction of substantially all of the unrecognized tax benefits as of January 30, 2010, due to settlement of the uncertain tax positions with the tax authorities.
108
Table of Contents
Notes to the financial statements (continued)
7. Earnings/(loss) per share
| Fiscal 2010 |
Fiscal 2009 |
Fiscal 2008 | ||||||||
| Net income/(loss) ($ million) |
164.1 | (393.7 | ) | 219.8 | ||||||
| Basic weighted average number of shares in issue (million) |
85.3 | 85.2 | 85.2 | |||||||
| Dilutive effect of share options (million) |
0.4 | — | 0.9 | |||||||
| Diluted weighted average number of shares in issue (million) |
85.7 | 85.2 | 86.1 | |||||||
| Earnings/(loss) per share—basic |
$ | 1.92 | $ | (4.62 | ) | $ | 2.58 | |||
| Earnings/(loss) per share—diluted |
$ | 1.91 | $ | (4.62 | ) | $ | 2.55 | |||
Basic and diluted earnings per share in fiscal 2008 have been recalculated following the 1-for-20 share consolidation discussed in Note 20. The basic weighted average number of shares excludes shares held by the Employee Share Ownership Trust (“ESOT”) as such shares are not considered outstanding and do not qualify for dividends. The effect of excluding the ESOT shares is to reduce the average number of shares in fiscal 2010 by 64,085 (fiscal 2009: 81,951; fiscal 2008 (recalculated): 107,337). The calculation of fully diluted EPS for the fiscal 2010 excludes options to purchase 2,333,995 shares (fiscal 2009: 3,456,839 share options; fiscal 2008 (recalculated): 1,689,675 share options) on the basis that their effect on EPS was anti-dilutive.
8. Dividends
| Fiscal 2010 |
Fiscal 2009 |
Fiscal 2008 | ||||
| $million | $million | $million | ||||
| Final dividend paid of $nil per share (fiscal 2009: 6.317c; fiscal 2008: 6.317c) |
— | 107.4 | 107.6 | |||
| Interim dividend paid of $nil per share (fiscal 2009: 0.96c; fiscal 2008: 0.96c) |
— | 16.4 | 16.3 | |||
| Total dividends |
— | 123.8 | 123.9 | |||
9. Cash and cash equivalents
| January 30, 2010 |
January 31, 2009 | |||
| $million | $million | |||
| Bank deposits |
315.1 | 95.6 | ||
| Cash on hand |
1.1 | 1.2 | ||
| Total cash and cash equivalents |
316.2 | 96.8 | ||
10. Accounts receivable, net
| January 30, 2010 |
January 31, 2009 |
|||||
| $million | $million | |||||
| Accounts receivable by geographic location |
||||||
| – US |
921.5 | 886.1 | ||||
| – Other |
9.7 | 9.0 | ||||
| 931.2 | 895.1 | |||||
| Less: valuation allowances |
(73.2 | ) | (69.9 | ) | ||
| Total accounts receivable – net |
858.0 | 825.2 | ||||
109
Table of Contents
Notes to the financial statements (continued)
The aging of trade receivables at the reporting date on a recency of payment basis was:
| January 30, 2010 | January 31, 2009 | |||||||||
| Gross | Valuation allowance |
Gross | Valuation allowance |
|||||||
| $million | $million | $million | $million | |||||||
| Not past due |
729.6 | (21.7 | ) | 693.1 | (20.8 | ) | ||||
| Past due 0 – 90 days |
154.7 | (4.8 | ) | 157.7 | (4.9 | ) | ||||
| More than 90 days |
46.9 | (46.7 | ) | 44.3 | (44.2 | ) | ||||
| 931.2 | (73.2 | ) | 895.1 | (69.9 | ) | |||||
Valuation allowances:
| Balance at beginning of period |
Bad debt expense |
Utilized(1) | Balance at end of period | ||||||
| $million | $million | $million | $million | ||||||
| Fiscal 2008 |
52.2 | 93.6 | (83.6 | ) | 62.2 | ||||
| Fiscal 2009 |
62.2 | 124.7 | (117.0 | ) | 69.9 | ||||
| Fiscal 2010 |
69.9 | 144.0 | (140.7 | ) | 73.2 |
| (1) | Including the impact of foreign exchange translation between opening and closing balance sheet dates. |
Bad debt expense is net of recoveries of $11.8 million, $17.1 million and $16.7 million in fiscal 2010, fiscal 2009 and fiscal 2008, respectively.
11. Inventories
| January 30, 2010 |
January 31, 2009 | |||
| $million | $million | |||
| Raw materials |
9.5 | 25.5 | ||
| Finished goods |
1,163.6 | 1,338.9 | ||
| Total inventory |
1,173.1 | 1,364.4 | ||
Signet held $134.6 million of consignment inventory at January 30, 2010 (January 31, 2009: $202.1 million) which is not recorded on the balance sheet. The principal terms of the consignment agreements, which can generally be terminated by either side, are such that Signet can return any or all of the inventory to the relevant suppliers without financial or commercial penalties and the supplier can vary the inventory prices.
Inventory provisions
| Balance at beginning of period |
Charged to profit |
Utilized(1) | Balance at end of period | ||||||
| $million | $million | $million | $million | ||||||
| Fiscal 2008 |
14.7 | 39.6 | (36.8 | ) | 17.5 | ||||
| Fiscal 2009 |
17.5 | 35.8 | (40.7 | ) | 12.6 | ||||
| Fiscal 2010 |
12.6 | 47.3 | (27.4 | ) | 32.5 |
| (1) | Including the impact of foreign exchange translation between opening and closing balance sheet dates. |
110
Table of Contents
Notes to the financial statements (continued)
12. Goodwill and other intangible assets, net
| Computer software |
Purchased goodwill | ||||||||||
| US | UK | Total goodwill |
|||||||||
| $million | $million | $million | $million | ||||||||
| Cost: |
|||||||||||
| At February 2, 2008 |
33.2 | 674.1 | 238.2 | 912.3 | |||||||
| Additions |
9.8 | — | — | — | |||||||
| Transfers |
(1.0 | ) | — | — | — | ||||||
| Translation differences |
(3.1 | ) | — | (62.9 | ) | (62.9 | ) | ||||
| At January 31, 2009 |
38.9 | 674.1 | 175.3 | 849.4 | |||||||
| Additions |
7.8 | — | — | — | |||||||
| Disposals |
(0.1 | ) | — | — | — | ||||||
| Translation differences |
0.9 | — | 18.1 | 18.1 | |||||||
| At January 30, 2010 |
47.5 | 674.1 | 193.4 | 867.5 | |||||||
| Amortization: |
|||||||||||
| At February 2, 2008 |
11.2 | 266.1 | 90.2 | 356.3 | |||||||
| Charged in period |
6.4 | — | — | — | |||||||
| Impairment charge |
— | 408.0 | 108.9 | 516.9 | |||||||
| Transfers |
(1.0 | ) | — | — | — | ||||||
| Translation differences |
(1.6 | ) | — | (23.8 | ) | (23.8 | ) | ||||
| At January 31, 2009 |
15.0 | 674.1 | 175.3 | 849.4 | |||||||
| Charged in period |
7.9 | — | — | — | |||||||
| Disposals |
(0.1 | ) | — | — | — | ||||||
| Translation differences |
0.5 | — | 18.1 | 18.1 | |||||||
| At January 30, 2010 |
23.3 | 674.1 | 193.4 | 867.5 | |||||||
| Net book value: |
|||||||||||
| At January 30, 2010 |
24.2 | — | — | — | |||||||
| At January 31, 2009 |
23.9 | — | — | — | |||||||
Computer software is stated at cost less accumulated amortization. Amortization charges are recorded in selling, general and administrative expenses in the income statement. The weighted average amortization period for additions in the period is five years.
The reporting units for the purpose of goodwill impairment testing are the US and UK operating segments. At January 31, 2009 Signet performed an impairment test of goodwill and determined that it was fully impaired. This resulted in the recognition in fiscal 2009 of a loss on impairment of goodwill of $516.9 million. The process which led to the decision that goodwill was fully impaired was as follows:
During the fourth quarter of fiscal 2009, Signet experienced a significant decline in its operating performance reflecting the weakness in the macroeconomic environment. Management performed the first step of the impairment assessment for each of the reporting units by comparing the fair value of the two reporting units with their carrying amounts, including goodwill. It was determined there was a potential impairment of goodwill in both reporting units.
In order to measure the amount of goodwill impairment, management performed the second step of the assessment in which the implied fair value of the goodwill of the two reporting units was compared to the book value of that goodwill. The fair value of each of the reporting units was measured considering the present value of future discounted cash flows that each reporting unit was expected to generate in the future. The significant
111
Table of Contents
Notes to the financial statements (continued)
estimates used in this calculation included: the weighted average costs of capital of the US and UK reporting units; long-term growth rates; expected changes to selling prices, direct costs and profitability of the businesses; and working capital requirements. These projections were based on detailed budgets that are prepared on an annual basis and took into account the weakening of operating results. Management used discount rates that reflect assessments of the time value of money and the risks specific to Signet. To validate the reasonableness of the reporting unit fair values that had been calculated, the aggregate fair values were rationalized to the enterprise market capitalization of Signet at that time. In addition to traditional control premiums the key factor contributing to the difference between the combined fair value of the reporting units and the total market capitalization was the Company share price, which was adversely impacted by general stock market conditions and the significantly depressed economic outlook.
Based on the analysis completed, it was established that the carrying amount of each reporting unit’s goodwill exceeded the implied fair value of that unit’s goodwill. This resulted in a full impairment of the carrying value of goodwill and the recognition in fiscal 2009 of a loss on impairment of goodwill of $516.9 million.
Management estimates that the annual amortization charge in respect of computer software held at January 30, 2010 for each of the next five fiscal years will be as follows:
| $million | ||
| Fiscal 2011 |
7.7 | |
| Fiscal 2012 |
6.3 | |
| Fiscal 2013 |
5.2 | |
| Fiscal 2014 |
3.7 | |
| Fiscal 2015 |
1.3 |
Estimated amortization expense can be affected by various factors including future acquisitions and disposals.
13. Property, plant and equipment, net
| Land and buildings | Plant, machinery and vehicles |
Shopfronts, fixtures and fittings |
Total | |||||||||||||||
| Freehold | Long leasehold |
Short leasehold |
||||||||||||||||
| $million | $million | $million | $million | $million | $million | |||||||||||||
| Cost: |
||||||||||||||||||
| At February 2, 2008 |
16.9 | 1.6 | 34.3 | 129.0 | 950.2 | 1,132.0 | ||||||||||||
| Additions |
— | — | 5.0 | 8.8 | 91.3 | 105.1 | ||||||||||||
| Disposals |
(0.8 | ) | — | (0.6 | ) | (54.0 | ) | (78.5 | ) | (133.9 | ) | |||||||
| Transfers |
— | — | 2.1 | — | (2.1 | ) | — | |||||||||||
| Translation differences |
(3.0 | ) | (0.4 | ) | (3.4 | ) | (9.4 | ) | (62.3 | ) | (78.5 | ) | ||||||
| At January 31, 2009 |
13.1 | 1.2 | 37.4 | 74.4 | 898.6 | 1,024.7 | ||||||||||||
| Additions |
— | — | 1.6 | 3.9 | 30.3 | 35.8 | ||||||||||||
| Disposals |
— | — | (0.4 | ) | (1.0 | ) | (119.6 | ) | (121.0 | ) | ||||||||
| Translation differences |
0.9 | 0.1 | 1.0 | 2.8 | 18.6 | 23.4 | ||||||||||||
| At January 30, 2010 |
14.0 | 1.3 | 39.6 | 80.1 | 827.9 | 962.9 | ||||||||||||
112
Table of Contents
Notes to the financial statements (continued)
| Land and buildings | Plant, machinery and vehicles |
Shopfronts, fixtures and fittings |
Total | |||||||||||||||
| Freehold | Long leasehold |
Short leasehold |
||||||||||||||||
| $million | $million | $million | $million | $million | $million | |||||||||||||
| Depreciation: |
||||||||||||||||||
| At February 2, 2008 |
6.2 | 0.8 | 16.8 | 101.5 | 517.5 | 642.8 | ||||||||||||
| Charged in period |
0.3 | 0.1 | 3.1 | 12.6 | 92.0 | 108.1 | ||||||||||||
| Disposals |
(0.1 | ) | — | (0.4 | ) | (54.0 | ) | (78.5 | ) | (133.0 | ) | |||||||
| Transfers |
— | — | 0.4 | — | (0.4 | ) | — | |||||||||||
| Translation differences |
(1.8 | ) | (0.4 | ) | (2.6 | ) | (6.0 | ) | (34.5 | ) | (45.3 | ) | ||||||
| At January 31, 2009 |
4.6 | 0.5 | 17.3 | 54.1 | 496.1 | 572.6 | ||||||||||||
| Charged in period |
0.3 | 0.6 | 3.1 | 9.5 | 87.5 | 101.0 | ||||||||||||
| Disposals |
— | — | (0.4 | ) | (0.9 | ) | (119.6 | ) | (120.9 | ) | ||||||||
| Translation differences |
0.4 | 0.1 | 0.9 | 1.9 | 10.0 | 13.3 | ||||||||||||
| At January 30, 2010 |
5.3 | 1.2 | 20.9 | 64.6 | 474.0 | 566.0 | ||||||||||||
| Net book value: |
||||||||||||||||||
| At January 30, 2010 |
8.7 | 0.1 | 18.7 | 15.5 | 353.9 | 396.9 | ||||||||||||
| At January 31, 2009 |
8.5 | 0.7 | 20.1 | 20.3 | 402.5 | 452.1 | ||||||||||||
Property, plant and equipment are stated at cost. Freehold properties on the consolidated balance sheet include $6.5 million of depreciable assets (January 31, 2009: $6.1 million). The charge for the period includes $2.9 million (fiscal 2009: $7.6 million, fiscal 2008: $10.5 million) for impairment of assets.
14. Accrued expenses and other current liabilities
| January 30, 2010 |
January 31, 2009 | |||
| $million | $million | |||
| Social security and payroll taxes |
5.6 | 10.9 | ||
| Other taxes |
24.7 | 24.7 | ||
| Other liabilities |
45.3 | 53.4 | ||
| Accrued compensation |
67.9 | 54.0 | ||
| Accrued expenses |
128.6 | 131.8 | ||
| Total accrued expenses and other current liabilities |
272.1 | 274.8 | ||
Sales returns reserve included in accrued expenses:
| Balance at beginning of period |
Adjustment(1) | Balance at end of period | |||||
| $million | $million | $million | |||||
| Fiscal 2008 |
9.6 | (1.2 | ) | 8.4 | |||
| Fiscal 2009 |
8.4 | (0.6 | ) | 7.8 | |||
| Fiscal 2010 |
7.8 | 0.3 | 8.1 |
| (1) | Adjustment relates to sales returns previously provided for and changes in estimate and the impact of foreign exchange translation between opening and closing balance sheet dates. |
113
Table of Contents
Notes to the financial statements (continued)
15. Deferred revenue
Deferred revenue represents income under extended service warranty agreements and voucher promotions.
| January 30, 2010 |
January 31, 2009 | |||
| $million | $million | |||
| Warranty deferred revenue |
243.6 | 243.1 | ||
| Other |
17.4 | 19.5 | ||
| Total deferred revenue |
261.0 | 262.6 | ||
| Current liabilities |
120.1 | 120.1 | ||
| Non-current liabilities |
140.9 | 142.5 | ||
| Total deferred revenue |
261.0 | 262.6 | ||
Warranty reserve
| Balance at beginning of period |
Warranties sold |
Revenue recognized |
Balance at end of period | ||||||
| $million | $million | $million | $million | ||||||
| Fiscal 2008 |
232.7 | 166.5 | (152.6 | ) | 246.6 | ||||
| Fiscal 2009 |
246.6 | 149.6 | (153.1 | ) | 243.1 | ||||
| Fiscal 2010 |
243.1 | 159.2 | (158.7 | ) | 243.6 |
16. Other liabilities—non-current
| January 30, 2010 |
January 31, 2009 | |||
| $million | $million | |||
| Accrued expenses |
60.2 | 54.7 | ||
| Lease loss reserve |
12.0 | 10.1 | ||
| Other liabilities |
7.4 | 6.7 | ||
| Total other liabilities |
79.6 | 71.5 | ||
A lease loss reserve is recorded for the net present value of the difference between the contractual rent obligations and the rate at which income is received or expected to be received from subleasing the properties.
| January 30, 2010 |
January 31, 2009 |
||||
| $million | $million | ||||
| At beginning of period |
10.1 | 9.6 | |||
| Adjustments, net |
1.8 | 4.6 | |||
| Utilization(1) |
0.1 | (4.1 | ) | ||
| At end of period |
12.0 | 10.1 | |||
| (1) | Including the impact of foreign exchange translation between opening and closing balance sheet dates. |
The cash expenditures on the remaining lease loss reserve are expected to be paid over the various remaining lease terms through 2017.
114
Table of Contents
Notes to the financial statements (continued)
17. Loans, overdrafts and long-term debt
| January 30, 2010 |
January 31, 2009 | |||
| $million | $million | |||
| Current liabilities—loans and overdrafts |
||||
| Revolving credit facility |
— | 135.0 | ||
| Bank overdraft |
44.1 | 52.5 | ||
| 44.1 | 187.5 | |||
| Non-current liabilities—Long-term debt |
||||
| US private placement |
280.0 | 380.0 | ||
| Total loans, overdrafts and long-term debt |
324.1 | 567.5 | ||
Loans and overdrafts
Revolving Credit Facility
On June 26, 2008, Signet entered into an unsecured $520 million multi-currency Revolving Credit Facility with a syndicate of banks for a period of five years at a variable interest rate and at a maximum margin of 1.75% above LIBOR. On March 13, 2009 Signet amended this agreement (“Facility Agreement”), under which the revolving credit agreement was reduced in size to $370 million, the maximum margin was increased to 2.75% above LIBOR and the covenants were amended. In the period from March 2009, the applicable margin has been both 2.25% and 1.75% above LIBOR. Commitment fees are paid on the undrawn portion of this credit facility at a rate of 40.0% of the applicable margin.
At January 30, 2010 the amount outstanding under this facility was $nil (January 31, 2009: $135.0 million).
The principal financial covenants on this facility are as follows:
| • | the ratio of Consolidated Net Debt (cash and cash equivalents less borrowings falling due within one year and borrowings falling due in more than one year) to Consolidated EBITDA (Earnings Before Interest, Tax, Depreciation & Amortization) shall not exceed 2:1 for each quarter, except in the third quarter when it shall not exceed 2.5:1; |
| • | Consolidated Tangible Net Worth (total tangible net assets) must not fall below $800 million; |
| • | the ratio of Consolidated EBITDAR (Earnings Before Interest, Tax, Depreciation, Amortization, Rents and Operating Lease Expenditure) to Fixed Charges (Consolidated Net Interest Expenditure plus Rents and Operating Lease Expenditure excluding Service Charges and Rates) shall be equal to or greater than 1.4:1 for the trailing 12 months at each quarter end to January 2012, increasing to 1.55:1 until January 2013 and then to 1.85:1 for subsequent periods; |
| • | beginning with fiscal 2011, the facility will be reduced, on a pro rata basis with the Notes outstanding, by 60% of any reduction in net debt from the prior year end; |
| • | no “Shareholder Returns” (defined as including dividends, share buybacks or other similar payments) shall be made during fiscal 2010 or fiscal 2011, and thereafter such returns may only be made if the amended fixed charge cover is above 1.7:1, there are no subsisting defaults and the directors confirm that they expect Signet to continue to comply with the covenant in the following 12 months; and |
| • | capital expenditure shall not exceed $71 million in fiscal 2010, $93 million in fiscal 2011, $115 million in fiscal 2012 and $205 million in fiscal 2013. |
115
Table of Contents
Notes to the financial statements (continued)
Conduit securitization facility (“Conduit”)
On October 24, 2008 Signet entered into a 364 day $100 million Conduit. Under this securitization, interests in the US private label credit card receivables portfolio held by a trust would be sold to Bryant Park, a Conduit administered by HSBC Securities (USA) Inc., in the form of a secured revolving variable rate certificate. The Conduit bore interest at a margin of 0.85% above the cost of funds paid by Bryant Park and commitment fees were paid on the undrawn portion at a rate of 0.30%. At January 31, 2009 no receivable interests had been placed in trust for sale. Accordingly, the amount outstanding under the Conduit was $nil. On April 9, 2009 the $100 million Conduit was terminated by Signet.
Long-term debt
US Private Placement
On March 30, 2006 Signet entered into a US Private Placement Note Term Series Purchase Agreement, (“US Private Placement”) which was funded largely from US insurance institutional investors in the form of fixed rate investor certificate notes (“Notes”). These Notes represented 7, 10 or 12 year maturities. Interest on the Notes is payable semi-annually with the face value payable at time of maturity. The Series A Notes were $100.0 million at face value, bore interest at 5.95% and are due in May 2013; Series B Notes were $150.0 million at face value, bore interest at 6.11% and are due in May 2016 and Series C Notes were $130.0 million at face value, bore interest at 6.26% and are due in May 2018. The aggregate issuance was at face value for $380.0 million and the funding date was May 23, 2006. The proceeds from this debt issuance were used to refinance the receivable securitization program that was due to mature in November 2006, and for general corporate purposes. The notes rank pari passu with Signet’s other senior unsecured debt. On March 13, 2009 Signet entered into an amendment agreement. Under this agreement $100 million of the notes was prepaid at par plus accrued interest to and including March 18, 2009 and the covenants were amended. The principal financial covenants under the amended agreement are in line with the Facility Agreement as described above.
Signet has the right to prepay the remaining outstanding notes at any time, with such prepayment being made at a premium to par as determined by the provisions of the ‘Make Whole’ calculation contained within the Amended Note Purchase Agreement. Variations in the ‘Make Whole’ premium amount are largely determined by movements in 3, 6 and 8 year US Treasury yields.
Additional amendments to the terms of the Note Purchase agreement are:
| • | A 2.0% increase in the coupon (subject to a further 1.0% increase until fiscal 2013 if the amended fixed charge coverage ratio is less than 1.6:1, and an additional 1.0% increase if Note Holders are subject to increased capital charges as a result of a requirement to post additional reserves under applicable insurance regulations, as determined by the insurance regulator); |
| • | Subsequent prepayment offers, at par, are to be made in February or March of each of the following years—2010, 2011, 2012 and 2013—the minimum amount of each such offer being principally the Note Holders’ pro rata share of 60% of any reduction in net debt that occurred over the preceding fiscal year. Any proportion of the 2011, 2012 or 2013 offers rejected by Note Holders may be applied to Shareholder Returns, as defined in the Amended Facility Agreement; |
| • | Subsequent to January 2013, Shareholder Returns may be no greater than the amount of an additional prepayment offer rejected by the Note Holders and may only be made if: |
| – | previous offers have been made to prepay an aggregate of $190 million of the Notes, inclusive of the $100 million March 18, 2009 prepayment, |
| – | an additional prepayment offer at a 2% premium to par has been made, the size of which is at Signet’s discretion, and |
116
Table of Contents
Notes to the financial statements (continued)
| • | Restrictions on capital expenditure similar to the Amended Facility Agreement for fiscal 2010, fiscal 2011, fiscal 2012 and fiscal 2013, provided that in fiscal 2012 and 2013 the Required Offers have been made, otherwise the restrictions on capital expenditure in fiscal 2012 will be $85 million and in fiscal 2013 will be $100 million. |
Amendment fees and other related costs for the Revolving Credit Facility and the US Private Placement of $5.9 million were capitalized, with a further $3.4 million charged to the income statement in fiscal 2010. $0.9 million of the capitalized balance was amortized in fiscal 2010.
No other interest bearing material loans or overdrafts were entered into during the year. The weighted average interest rate on other loans and overdrafts was 3.1% in fiscal 2009 and 5.3% in fiscal 2008.
18. Financial instruments and fair value
Signet’s principal financial instruments are comprised of cash, cash deposits/investments and overdrafts, accounts receivable and payable, derivatives, a revolving credit facility and fixed rate notes. Signet does not enter into derivative transactions for trading purposes. Derivative transactions are used by Signet for risk management purposes to address risks inherent in Signet’s business operations and sources of finance. The main risks arising from Signet’s operations are interest rate risk, liquidity risk, and market risk including foreign currency risk and commodity risk. Signet uses derivative financial instruments to manage and mitigate these risks under policies reviewed and approved by the Board.
Interest rate risk
Signet’s operations are financed principally by $280 million fixed rate notes under the US Private Placement. Signet may enter into various interest rate protection agreements in order to limit the impact of movements in interest rates on its borrowings. There were no interest rate protection agreements outstanding at January 30, 2010 (January 31, 2009: $nil).
Liquidity risk
Signet’s objective is to ensure that it has access to, or the ability to generate sufficient cash from either internal or external sources in a timely and cost-effective manner to meet its commitments as they become due and payable. Signet manages liquidity risks as part of the overall risk management policy. Management produces forecasting and budgeting information that is reviewed and monitored by the Board. Retained funds and external financing are the main source of funding supplementing Signet’s resources in meeting liquidity requirements. The main external sources of funding include the Amended US Private Placement, consisting of Series A Notes of $73.7 million, Series B Notes of $110.5 million, and Series C Notes of $95.8 million, which fall due in 2013, 2016 and 2018 respectively, and an unsecured revolving credit facility of $370 million, against which $nil was drawn as of January 30, 2010 (January 31, 2009: $135.0 million).
Market risk
Signet generates revenues and expenses in pounds sterling and US dollars. As a portion of Signet’s UK division purchases are denominated in US dollars, Signet enters into foreign currency forward exchange contracts, foreign currency option contracts and foreign currency swaps to manage this exposure to the US dollar. The fair value of these contracts is recorded in other assets and other liabilities.
For currency and commodity contracts that are qualifying cash flow hedges, changes in fair value are recorded as a component of accumulated other comprehensive income/(loss). Amounts are reclassified from other
117
Table of Contents
Notes to the financial statements (continued)
comprehensive income/(loss) into earnings when the hedged exposure affects earnings. For contracts that do not meet the strict hedge accounting requirements, changes in fair value are recorded in other operating expenses.
Signet holds a fluctuating amount of pounds sterling cash reflecting the cash generative characteristics of the UK division. Signet’s objective is to minimize net foreign exchange exposure to the income statement on sterling denominated items through managing this level of cash, sterling denominated intercompany balances and US dollar to sterling swaps. In order to manage the foreign exchange exposure and minimize the level of pounds sterling cash held by the company, the sterling denominated subsidiaries pay dividends regularly to their immediate holding companies.
Credit risk and concentrations of credit risk
Credit risk represents the loss that would be recognized at the reporting date if counterparties failed to perform as contracted. Signet does not anticipate non-performance by counterparties of its financial instruments. Signet does not require collateral or other security to support financial instruments with credit risk; however it is Signet’s policy to only hold cash and cash equivalent investments and to transact financial instruments with financial institutions with a certain minimum credit rating. Management does not believe Signet is exposed to any significant concentrations of credit risk that arise from derivatives or accounts receivable.
Derivatives
Signet is exposed to foreign currency exchange risk arising from various currency exposures. Signet enters into forward foreign currency exchange contracts and foreign currency option contracts, principally in US dollars, in order to limit the impact of movements in foreign exchange rates on its forecast foreign currency purchases. The total notional amount of these foreign currency contracts outstanding as at January 30, 2010 was $37.2 million. These contracts have been designated as cash flow hedges and will be settled over the next 17 months.
Signet enters into forward purchase contracts and option purchase contracts for commodities in order to reduce its exposure to significant movements in the price of the underlying precious metal raw material. The total notional amount of commodity contracts outstanding as at January 30, 2010 was $100 million. These contracts have been designated as cash flow hedges and will be settled over the next 12 months.
For derivatives that are designated and qualify as a cash flow hedge, the effective portion of the gain or loss on the derivative is reported as a component of other comprehensive income (“OCI”) and reclassified into earnings in the same period in which the hedged item affects net income or loss. Gains and losses on derivatives that do not qualify for hedge accounting, together with any hedge ineffectiveness, are recognized immediately in other operating income, net. Signet does not hold derivative contracts for trading purposes.
Foreign currency contracts not designated as cash flow hedges are used to hedge currency flows through Signet’s bank accounts to ensure that Signet is not exposed to foreign currency exchange risk in its cash and borrowings.
118
Table of Contents
Notes to the financial statements (continued)
The following table summarizes the fair value and presentation of derivative instruments in the consolidated balance sheets:
| Derivative assets | ||||||||
| January 30, 2010 |
January 31, 2009 | |||||||
| Balance sheet location |
Fair value | Balance sheet location |
Fair value | |||||
| $million | $million | |||||||
| Derivatives designated as hedging instruments: |
||||||||
| Foreign currency contracts |
Other current assets | 0.6 | Other current assets | 12.0 | ||||
| Commodity contracts |
Other current assets | 2.4 | Other current assets | 12.0 | ||||
| 3.0 | 24.0 | |||||||
| Derivatives not designated as hedging instruments: |
||||||||
| Foreign currency contracts |
Other current assets | — | Other current assets | 0.1 | ||||
| — | 0.1 | |||||||
| Total derivative assets |
3.0 | 24.1 | ||||||
| Derivative liabilities | |||||||||
| January 30, 2010 | January 31, 2009 | ||||||||
| Balance sheet location |
Fair value | Balance sheet location |
Fair value | ||||||
| $million | $million | ||||||||
| Derivatives designated as hedging instruments: |
|||||||||
| Foreign currency contracts |
Other current liabilities | (0.4 | ) | Other current liabilities | — | ||||
| Commodity contracts |
Other current liabilities | (1.6 | ) | Other current liabilities | — | ||||
| (2.0 | ) | — | |||||||
| Derivatives not designated as hedging instruments: |
|||||||||
| Foreign currency contracts |
Other current liabilities | — | Other current liabilities | — | |||||
| — | — | ||||||||
| Total derivative liabilities |
(2.0 | ) | — | ||||||
The following tables summarize the effect of derivative instruments on the consolidated income statements:
| Amount of gain/(loss) recognized in OCI on derivatives (Effective portion) |
Location of gain/(loss) reclassified from accumulated OCI into income (Effective portion) |
Amount of gain/(loss) reclassified from accumulated OCI into income (Effective portion) |
||||||||||
| Fiscal 2010 |
Fiscal 2009 |
Fiscal 2010 |
Fiscal 2009 |
|||||||||
| $million | $million | $million | $million | |||||||||
| Derivatives in cash flow hedging relationships: |
||||||||||||
| Foreign currency contracts |
(3.0 | ) | 16.5 | Cost of sales | 7.8 | (1.2 | ) | |||||
| Commodity contracts |
7.3 | 2.8 | Cost of sales | 5.1 | 14.6 | |||||||
| Total |
4.3 | 19.3 | 12.9 | 13.4 | ||||||||
119
Table of Contents
Notes to the financial statements (continued)
| Location of gain/(loss) recognized in income on derivatives (Ineffective portion) |
Amount of gain/(loss) recognized in income on derivatives (Ineffective portion) |
||||||
| Fiscal 2010 |
Fiscal 2009 |
||||||
| $million | $million | ||||||
| Derivatives in cash flow hedging relationships: |
|||||||
| Foreign currency contracts |
Other operating income, net | — | 2.0 | ||||
| Commodity contracts |
Other operating income, net | — | (0.5 | ) | |||
| Total |
— | 1.5 | |||||
| Location of gain/(loss) recognized in income on derivatives |
Amount of gain/(loss) recognized in income on derivatives |
|||||||
| Fiscal 2010 |
Fiscal 2009 |
|||||||
| $million | $million | |||||||
| Derivatives not designated as hedging instruments: |
||||||||
| Foreign currency contracts |
Other operating income, net | (0.7 | ) | (49.6 | ) | |||
| Total |
(0.7 | ) | (49.6 | ) | ||||
Fair value
The estimated fair value of Signet’s financial instruments held or issued to finance Signet’s operations is summarized below. Certain estimates and judgments were required to develop the fair value amounts. The fair value amounts shown below are not necessarily indicative of the amounts that Signet would realize upon disposition nor do they indicate Signet’s intent or ability to dispose of the financial instrument. Assets and liabilities that are carried at fair value are required to be classified and disclosed in one of the following three categories:
Level 1—quoted market prices in active markets for identical assets and liabilities
Level 2—observable market based inputs or unobservable inputs that are corroborated by market data
Level 3—unobservable inputs that are not corroborated by market data
Signet determines fair value based upon quoted prices when available or through the use of alternative approaches, such as discounting the expected cash flows using market interest rates commensurate with the credit quality and duration of the investment. The methods Signet uses to determine fair value on an instrument-specific basis are detailed below.
| January 30, 2010 | January 31, 2009 | |||||||||||
| Carrying amount |
Significant other observable inputs (Level 2) |
Carrying amount |
Significant other observable inputs (Level 2) |
|||||||||
| $million | $million | |||||||||||
| Assets: |
||||||||||||
| Forward foreign currency contracts and swaps |
0.6 | 0.6 | 12.1 | 12.1 | ||||||||
| Forward commodity contracts |
2.4 | 2.4 | 12.0 | 12.0 | ||||||||
| Liabilities: |
||||||||||||
| Borrowings |
(324.1 | ) | (371.3 | ) | (567.5 | ) | (480.5 | ) | ||||
| Forward foreign currency contracts and swaps |
(0.4 | ) | (0.4 | ) | — | — | ||||||
| Forward commodity contracts |
(1.6 | ) | (1.6 | ) | — | — | ||||||
120
Table of Contents
Notes to the financial statements (continued)
The fair value of derivative financial instruments has been determined based on market value equivalents at the balance sheet date, taking into account the current interest rate environment, current foreign currency forward rates or current commodity forward rates. These are held as assets and liabilities within other receivables and other payables, and all contracts have a maturity of less than eighteen months. The fair value of Signet’s Private Placement Note debt is determined by discounting to present value the known future coupon and final Note redemption amounts at market yields as of the balance sheet date. The carrying amounts of cash and cash equivalents, accounts receivable, other receivables, accounts payable and accrued liabilities approximate fair value because of the short term maturity of these amounts.
19. Pension schemes
The Group Scheme, which ceased to admit new employees from April 2004, is a funded scheme with assets, held in a separate trustee administered fund which is independently managed. January 30, 2010 and January 31, 2009 measurement dates were used in determining the Group Scheme’s benefit obligation and fair value of plan assets. Contributions to the Group Scheme were assessed as at April 5, 2009.
The following schedules provide information concerning the Group Scheme as of and for the fiscal years ended January 30, 2010 and January 31, 2009:
| Fiscal 2010 |
Fiscal 2009 |
|||||
| $million | $million | |||||
| Change in Group Scheme assets: |
||||||
| Fair value at beginning of year |
139.5 | 248.1 | ||||
| Actual return on Group Scheme assets |
28.7 | (48.1 | ) | |||
| Employer contributions |
12.8 | 6.0 | ||||
| Members’ contributions |
0.6 | 0.8 | ||||
| Benefits paid |
(9.4 | ) | (10.6 | ) | ||
| Foreign currency changes |
14.8 | (56.7 | ) | |||
| Fair value of Group Scheme assets at end of year |
187.0 | 139.5 | ||||
| Fiscal 2010 |
Fiscal 2009 |
|||||
| $million | $million | |||||
| Change in benefit obligation: |
||||||
| Benefit obligation at beginning of year |
152.4 | 253.7 | ||||
| Service cost |
4.3 | 6.1 | ||||
| Past service cost |
— | (28.8 | ) | |||
| Interest cost |
10.7 | 13.0 | ||||
| Members’ contributions |
0.6 | 0.8 | ||||
| Actuarial loss/(gain) |
17.2 | (21.9 | ) | |||
| Benefits paid |
(9.4 | ) | (10.6 | ) | ||
| Foreign currency changes |
16.0 | (59.9 | ) | |||
| Benefit obligation at end of year |
191.8 | 152.4 | ||||
| Funded status at end of year: Group Scheme assets less benefit obligation |
(4.8 | ) | (12.9 | ) | ||
121
Table of Contents
Notes to the financial statements (continued)
| Fiscal 2010 |
Fiscal 2009 |
|||||
| $million | $million | |||||
| Amounts recognized in the balance sheet consist of: |
||||||
| Non current liabilities |
(4.8 | ) | (12.9 | ) | ||
| Net liability recognized |
(4.8 | ) | (12.9 | ) | ||
Amounts recognized in accumulated other comprehensive income/(loss) consists of:
| Fiscal 2010 |
Fiscal 2009 |
Fiscal 2008 |
|||||||
| $million | $million | $million | |||||||
| Net actuarial loss |
(61.2 | ) | (64.8 | ) | (36.0 | ) | |||
| Net prior service credit |
15.0 | 15.7 | (5.7 | ) |
The estimated actuarial loss and prior service credit for the Group Scheme that will be amortized from accumulated other comprehensive income/(loss) into net periodic benefit cost over the next fiscal year are $4.9 million and $(1.0) million, respectively.
The accumulated benefit obligation for the Group Scheme was $183.4 million and $144.8 million at January 30, 2010 and January 31, 2009, respectively.
The projected benefit obligation and fair value of plan assets for the Group Scheme at January 30, 2010 were $191.8 million and $187.0 million, respectively. At January 31, 2009 the projected benefit obligation and fair value of plan assets for the Group Scheme were $152.4 million and $139.5 million, respectively.
The components of net periodic pension cost and other amounts recognized in other comprehensive income/(loss) for the Group Scheme are as follows:
| Fiscal 2010 |
Fiscal 2009 |
Fiscal 2008 |
|||||||
| $million | $million | $million | |||||||
| Components of net periodic benefit cost: |
|||||||||
| Service cost |
4.3 | 6.1 | 8.0 | ||||||
| Interest cost |
10.7 | 13.0 | 13.4 | ||||||
| Expected return on Group Scheme assets |
(11.2 | ) | (15.8 | ) | (19.1 | ) | |||
| Amortization of unrecognized prior service (credit)/cost |
(1.0 | ) | 1.1 | 1.2 | |||||
| Amortization of unrecognized actuarial loss |
4.7 | 1.8 | 0.9 | ||||||
| Net periodic benefit cost |
7.5 | 6.2 | 4.4 | ||||||
| Other changes in scheme assets and benefit obligations recognized in other comprehensive (income)/loss |
(4.0 | ) | 10.3 | 12.3 | |||||
| Total recognized in net periodic benefit cost and other comprehensive loss/(income) |
3.5 | 16.5 | 16.7 | ||||||
| January 30, 2010 |
January 31, 2009 |
|||||
| Assumptions used to determine benefit obligations (at the end of the year): |
||||||
| Discount rate |
5.60 | % | 6.60 | % | ||
| Salary increases |
5.00 | % | 5.00 | % | ||
| Assumptions used to determine net periodic pension costs (at the start of the year): |
||||||
| Discount rate |
6.60 | % | 5.90 | % | ||
| Expected return on Group Scheme assets |
7.25 | % | 7.20 | % | ||
| Salary increases |
5.00 | % | 5.00 | % |
122
Table of Contents
Notes to the financial statements (continued)
The discount rate is based upon published rates for high-quality fixed-income investments that produce expected cash flows that approximate the timing and amount of expected future benefit payments.
The expected return on the Group Scheme assets assumption is based upon the historical return and future expected returns for each asset class, as well as the target asset allocation of the portfolio of Group Scheme assets.
Signet’s overall investment strategy is guided by an objective of achieving a return on the investments, which is consistent with the long-term return assumptions to ensure the Group Scheme obligations are met. The long term target allocation for the Group Scheme’s assets is equities 68%, bonds 27% and property 5%. The investment policy is to carry a balance of funds to achieve these aims. These funds carry investments in UK and overseas equities, UK corporate bonds, UK Gilts and property. The Group Scheme invests in UK commercial property through a Pooled Pensions Property Fund, giving exposure to a diversified portfolio of assets.
The fair value of the assets in the Group Scheme at January 30, 2010 are required to be classified and disclosed in one of the following three categories:
Level 1—quoted market prices in active markets for identical assets and liabilities
Level 2—observable market based inputs or unobservable inputs that are corroborated by market data
Level 3—unobservable inputs that are not corroborated by market data
The value and classification of these assets was as follows:
| Fair value measurements at January 30, 2010 | ||||||
| Total | Quoted prices in active markets for identical assets (Level 1) |
Significant Unobservable inputs (Level 3) | ||||
| $million | $million | $million | ||||
| Asset category: |
||||||
| Diversified equity securities |
118.9 | 118.9 | — | |||
| Bonds |
57.2 | 57.2 | — | |||
| Property |
9.1 | — | 9.1 | |||
| Cash |
1.8 | 1.8 | — | |||
| Total |
187.0 | 177.9 | 9.1 | |||
The Group Scheme does not hold any investment in Signet shares or in property occupied by or other assets used by Signet.
Signet expects to contribute a minimum of $15.2 million to the Group Scheme in fiscal 2011. The expected increase in contributions, in accordance with a deficit recovery plan, arises as a result of the increased funding deficit indicated by the results of the actuarial valuation as at April 5, 2009.
The following benefit payments, which reflect expected future service, as appropriate, are estimated to be paid by the Group Scheme:
| $million | ||
| Fiscal 2011 |
10.0 | |
| Fiscal 2012 |
10.1 | |
| Fiscal 2013 |
10.2 | |
| Fiscal 2014 |
10.2 | |
| Fiscal 2015 |
10.3 | |
| Fiscal 2016 to fiscal 2020 |
52.9 |
123
Table of Contents
Notes to the financial statements (continued)
In June 2004, Signet introduced a defined contribution plan which replaced the Group Scheme for new UK employees. The contributions to this scheme in the period were $0.3 million (fiscal 2009: $0.3 million; fiscal 2008: $0.2 million).
In the US, Signet sponsors a defined contribution 401(k) retirement savings plan for all eligible employees who meet minimum age and service requirements. The assets of this plan are held in a separate trust and Signet matches 25% of up to 6% of employee elective salary deferrals. Since December 2008, Signet’s matching element has been suspended. Signet’s contributions to this plan in fiscal 2010 were $0.1 million (fiscal 2009: $6.6 million; fiscal 2008: $4.8 million). The US division has also established two unfunded, non-qualified deferred compensation plans, one of which permits certain management and highly compensated employees or directors to elect annually to defer all or a portion of their remuneration and earn interest on the deferred amounts (“DCP”) and the other of which is frozen as to new participants and new deferrals. Until December 2008, the DCP also provided for a matching contribution based on each participant’s annual remuneration deferral. The plan permits such contributions on a discretionary basis. In connection with these plans, Signet has invested in trust-owned life insurance policies. The cost recognized in connection with the DCP in fiscal 2010 were $0.5 million (fiscal 2009: $1.5 million; fiscal 2008: $1.7 million). During the year, a distribution of $38.1 million was made to certain management employees from the plans.
20. Common shares, deferred shares, treasury shares and reserves
Common Shares
On February 5, 2007, the Company redenominated its Common Shares from pounds sterling into US dollars. This was accomplished by a cancellation of the outstanding pound sterling shares and issuance of an equal amount of US dollar denominated shares. The par value of each US dollar Common Share was 0.9 cents and each shareholder received one dollar Common Share in exchange for one pound sterling Common Share. The US dollar Common Shares have the same rights and restrictions as the previous pound sterling Common Shares.
On September 11, 2008, as part of the Scheme of Arrangement, the Company’s shares were consolidated via a 1-for-20 share consolidation. The par value of each new Common Share is 18 cents. The consideration received in respect of Common Shares issued during the year in respect of share options was $1.0 million (fiscal 2009: $0.1 million; fiscal 2008: $6.0 million). The Company did not purchase any treasury shares in fiscal 2010 (fiscal 2009: nil).
Deferred shares
To satisfy UK listing requirements, £50,000 of share capital was held by the Group Company Secretary of the Predecessor Company and denominated in pounds sterling until September 11, 2008. Since that date, Signet has not had any deferred shares.
Treasury shares
Treasury shares represent the cost of shares in the Company purchased in the market and held by the Employee Stock Ownership Trust (“ESOT”) to satisfy options under Signet’s share option schemes. In fiscal 2010 the trustee transferred 52,425 shares to the holders of executive share and LTIP options granted to UK employees. In aggregate the subscription monies amounted to $1.0 million. The trustee held 29,526 shares at January 30, 2010, 29,526 shares at March 31, 2010 and 81,951 shares at January 31, 2009.
In fiscal 2010 the trustee of the ESOT subscribed in cash for a total of 1,978 shares in order to provide shares to satisfy the exercise of executive share options granted to US employees. In aggregate the subscription monies amounted to $0.03 million at option exercise prices between $17.42 and $21.56. The subscription prices were the NYSE market prices on the last business days before the dates on which the respective terms of issue were fixed, and varied between $21.98 and $27.81 per share.
124
Table of Contents
Notes to the financial statements (continued)
On various dates during fiscal 2010 a total of 265 shares were subscribed for in cash by holders of options. In aggregate the option proceeds amounted to $0.01 million at option exercise prices between $13.13 and $32.66 per share. The option proceeds were the market prices at the various times at which the options were granted. The NYSE market prices on the dates of issue varied between $26.10 and $27.12 per share. Details of options in respect of shares are shown in Note 22.
Other reserves
Other reserves consist of special reserves and a capital redemption reserve established in accordance with the Laws of England and Wales.
The Predecessor Company established a special reserve prior to 1997 in connection with reductions in additional paid-in capital which can only be used to write off existing goodwill resulting from acquisitions and otherwise only for purposes permitted for share premium accounts under the laws of England and Wales.
The capital redemption reserve has arisen on the cancellation of previously issued Common Shares and represents the nominal value of those shares cancelled.
Retained earnings
Following a capital reduction in 1997, the Predecessor Company was permitted to make distributions including dividends, share buy-backs and other transactions classed as distributions, only out of income earned after August 2, 1997. Restrictions on distributions out of income earned prior to August 2, 1997 were lifted following a ruling by the High Court of Justice in England and Wales in fiscal 2009. None of the income subject to these restrictions was earned by, or paid up by way of dividend to, the Company or to the Predecessor Company, prior to the lifting of these restrictions in fiscal 2009.
21. Commitments and contingencies
Operating leases
Signet occupies certain properties and holds plant, machinery and vehicles under operating leases; it does not have any capital leases.
Rental expense for operating leases are as follows:
| Fiscal 2010 |
Fiscal 2009 |
Fiscal 2008 |
|||||||
| $million | $million | $million | |||||||
| Minimum rentals |
312.8 | 314.7 | 316.0 | ||||||
| Contingent rent |
5.6 | 5.3 | 10.1 | ||||||
| Sublease income |
(5.3 | ) | (6.3 | ) | (7.0 | ) | |||
| Total |
313.1 | 313.7 | 319.1 | ||||||
The future minimum operating lease payments for operating leases having initial or non-cancelable terms in excess of one year as follows:
| $million | ||
| Fiscal 2011 |
287.4 | |
| Fiscal 2012 |
266.9 | |
| Fiscal 2013 |
246.4 | |
| Fiscal 2014 |
226.6 | |
| Fiscal 2015 |
203.7 | |
| Thereafter |
1,081.0 | |
| Total |
2,312.0 | |
125
Table of Contents
Notes to the financial statements (continued)
Signet has entered into certain sale and leaseback transactions of freehold and long leasehold properties. Under these transactions it continues to occupy the space in the normal course of business. Gains on the transactions are recognized as a reduction of rent expense over the life of the operating lease.
Contingent property liabilities
Approximately 124 UK property leases had been assigned by Signet up to January 30, 2010 (and remained unexpired and occupied by assignees at that date) and approximately 27 additional properties were sub-let at that date. Should the assignees or sub-tenants fail to fulfill any obligations in respect of those leases or any other leases which have at any other time been assigned or sub-let, Signet or one of its UK subsidiaries may be liable for those defaults. The number of such claims arising to date has been small, and the liability, which is charged to the income statement as it arises, has not been material.
Capital commitments
At January 30, 2010 Signet has committed to spend $4.6 million (January 31, 2009: $8.8 million) in respect of capital commitments. These commitments relate to the expansion and renovation of stores.
Legal proceedings
In March 2008, private plaintiffs filed a class action lawsuit for an unspecified amount against Sterling Jewelers Inc. (“Sterling”), a subsidiary of Signet, in the U.S. District Court for the Southern District of New York federal court alleging that US store-level employment practices are discriminatory as to compensation and promotional activities. On September 23, 2008, the US Equal Employment opportunities Commission (“EEOC”) filed a lawsuit against Sterling in the U.S. District Court for the Western District of New York. The EEOC’s lawsuit alleges that Sterling engaged in a pattern or practice of gender discrimination with respect to pay and promotions of female retail store employees from January 1, 2003 to the present. The EEOC asserts claims for unspecified monetary relief and non-monetary relief against the Company on behalf of a class of female employees subjected to these alleged practices. Sterling denies the allegations from both parties and intends to defend them vigorously.
In the ordinary course of business, the company may be subject, from time to time, to various proceedings, lawsuits, disputes or claims.
22. Share-based compensation
Signet operates several share based compensation plans which can be categorized as “Saving Share Plans”, “Executive Plans”, “Long Term Incentive Plans” and “Omnibus Plans”.
Saving Share Plans
Three all-employee share option schemes comprising a savings related share option scheme for UK employees (the “Sharesave Scheme”), a share savings plan intended to qualify under US Section 423 of the US Internal Revenue Code (the “Employee Share Savings Plan”) and a savings related share option scheme for Republic of Ireland employees (the “Irish Sharesave Scheme”) are together referred to as “Saving Share Plans”. The Sharesave Scheme and Irish Sharesave Scheme allow eligible employees to purchase Common Shares at a discount of approximately 20% below the average middle market price of the shares on the London Stock Exchange on either the three dealing days prior to the date that employees are invited to participate or the middle market price on the date of grant, whichever is the higher value. The Employee Share Savings Plan allows employees to purchase Common Shares at a discount of approximately 15% to the closing price on the date of grant. Options granted under the Sharesave Scheme and the Irish Sharesave Scheme vest after 36 months and are generally only exercisable between 36 and 42 months from commencement of the related savings contract. Options granted under the Employee Share Savings Plan vest after 24 months and are generally only exercisable between 24 and 27 months of the grant date. The Saving Share Plans are compensatory and compensation
126
Table of Contents
Notes to the financial statements (continued)
expense is recognized over the requisite service period. In any 10 year period not more than 10% of the issued Common Shares of the Company from time to time may, in aggregate, be issued or be issuable pursuant to options granted under the Saving Share Plans or any other employees’ share plans adopted by Signet.
Executive Plans
Signet operates three 2003 executive share schemes (the “2003 Plans”), together referred to as the “Executive Plans”. Option awards under the Executive Plans are generally granted with an exercise price equal to the market price of the Company’s shares at the date of grant. Options under the Executive Plans are subject to certain internal performance criteria and cannot be exercised unless Signet achieves an annual rate of compound growth in earnings per share, calculated under IFRS, above the respective US and UK retail price indices. The performance criteria is measured over a three year period from the start of the fiscal year in which the award is granted. If the performance criteria is not achieved at the end of the three years from date of grant, the performance criteria extend annually and are retested at the end of the fourth and fifth year before expiring. Commencing January 29, 2006, awards granted under the 2003 Plans are no longer eligible for retesting if performance is not achieved by the end of the third year. The remaining schemes that included retest provisions were tested for the final time at January 30, 2010 and no awards vested. Grants awarded under the 2003 Plans from fiscal 2008 onwards, other than for executive directors, are no longer subject to the performance criteria. Signet’s Executive Plans, which are shareholder approved, permit the grant of share options to employees for up to 10% of the issued Common Shares over any 10 year period, including any other employees share plans adopted by Signet or a maximum of 5% over 10 years including discretionary option plans. A maximum of 8,568,841 shares may be issued pursuant to options granted to US participants in the Executive Plans.
Long Term Incentive Plans
The Long Term Incentive Plan 2000 was replaced by the Long Term Incentive Plan 2005. LTIPs are subject to certain internal performance criteria and cannot be exercised unless there is achievement of an annual rate of compound growth in income before tax above the respective US and UK retail price indices at constant exchange rates of Signet for Signet executives, or, growth in divisional operating income for divisional executives, and, of ROCE of Signet or related division as appropriate. To the extent that the performance criteria are satisfied, the participant will receive a combination of share options and cash in equal value. Compensation expense is recognized over the three-year performance period for all schemes and options granted have 10-year contractual terms. The Company’s LTIPs, which are shareholder approved, permit the grant of share options to employees for up to 10% of the Company’s issued Common Shares over any 10 year period of time, including any other employees share plans adopted by Signet or a maximum of 5% over 10 years including discretionary option plans.
Omnibus Plans
In fiscal 2010 Signet adopted the Omnibus Incentive Plan (the “Omnibus Plan”). Awards that may be granted under the Omnibus Plan include restricted stock units, stock options and stock appreciation rights. The 2009 Awards granted under the Omnibus Plan have two elements, time-based restricted stock and performance-based restricted stock units. The stock and stock units are granted with a $nil exercise price. The time-based restricted stock is subject to continued employment, has the same voting rights and dividend rights as Common Shares (which are payable once the shares have vested) and is measured over a three year vesting period. Performance-based restricted stock units vest based upon the achievement of cumulative actual earnings before interest and taxes (“EBIT”) as a percentage of targeted EBIT for the performance period. Performance is measured over a three year vesting period from the start of the fiscal year in which the award is granted. The Omnibus Plan permits the grant of awards to employees for up to 7,000,000 Common Shares.
Signet recognized a total share-based compensation expense of $5.6 million in fiscal 2010 (fiscal 2009: $0.7 million expense; fiscal 2008: $3.4 million credit). The related tax credit on the share-based compensation expense was $1.6 million; $0.1 million charge; and $1.5 million credit, respectively. The total remaining
127
Table of Contents
Notes to the financial statements (continued)
unrecognized compensation cost related to non-vested share options under all plans amounted to $10.4 million, $3.1 million and $5.0 million relating to fiscal 2010, fiscal 2009 and fiscal 2008 respectively, which will be amortized over the weighted average periods of 1.8 years, 1.9 years and 2.0 years, respectively.
The Company either issues new shares or utilizes treasury shares to satisfy share option exercises under its plans. The Company does not expect to repurchase any shares during fiscal 2011 to satisfy share option exercises. Cash received from the exercise of share options granted under Signet’s plans during fiscal 2010, fiscal 2009 and fiscal 2008 was $1.0 million, $0.1 million and $6.0 million respectively.
Share scheme status
| Saving Share Plans | Omnibus Plans | Executive Plans | LTIPs | ||||||||||||||||
| No. of shares |
WAEP(1) | No. of shares |
WAEP(1) | No. of shares |
WAEP(1) | No. of shares |
WAEP(1) | ||||||||||||
| millions | dollars | millions | dollars | millions | dollars | millions | dollars | ||||||||||||
| Outstanding at January 31, 2009 |
0.5 | 20.27 | — | — | 3.1 | 35.11 | 0.3 | — | |||||||||||
| Movements in period |
|||||||||||||||||||
| Granted |
0.1 | 21.95 | 0.6 | — | — | — | — | — | |||||||||||
| Exercised |
— | — | — | — | (0.1 | ) | 17.83 | — | — | ||||||||||
| Lapsed |
(0.1 | ) | 26.55 | — | — | (0.5 | ) | 37.96 | (0.1 | ) | — | ||||||||
| Outstanding at January 30, 2010 |
0.5 | 18.61 | 0.6 | — | 2.5 | 34.88 | 0.2 | — | |||||||||||
| Exercisable at January 31, 2009 |
0.1 | 29.58 | — | — | 1.0 | 33.26 | — | — | |||||||||||
| Exercisable at January 30, 2010 |
— | — | — | — | 0.9 | 34.46 | — | — | |||||||||||
| (1) | Weighted Average Exercise Price |
The weighted average share price at the date of exercise for share options exercised during fiscal 2010 was $25.57 (fiscal 2009: $25.33; fiscal 2008 (recalculated for 1-for-20 consolidation): $23.80).
The following tables summarize the information about share awards outstanding and exercisable at January 30, 2010, and the inputs used in a binomial model for Saving Share Plans and Executive Plans, and in a Black-Scholes model for LTIP plans, for the calculation of the fair value of options granted in the fiscal 2010, fiscal 2009 and fiscal 2008:
| Saving Share Plans | Omnibus Plans | Executive Plans | LTIPs | |||||||||||||||||||||
| Shares | WACL(2) | WAEP(1) | Shares | WACL(2) | WAEP(1) | Shares | WACL(2) | WAEP(1) | Shares | WACL(2) | WAEP(1) | |||||||||||||
| millions | years | dollars | millions | years | dollars |
millions | years | dollars |
millions | years | dollars | |||||||||||||
| Outstanding |
0.5 | 1.2 | 18.61 | 0.6 | 2.1 | — | 2.5 | 5.9 | 34.88 | 0.2 | 7.8 | — | ||||||||||||
| Exercisable |
— | — | — | — | — | — | 0.9 | 3.4 | 34.46 | — | — | — | ||||||||||||
| Saving Share Plans | Omnibus Plans |
Executive Plans | LTIPs | |||||||||||||||||||||||||||||
| 2010 | 2009 | 2008 | 2010 | 2009 | 2008 | 2009 | 2008 | |||||||||||||||||||||||||
| Share price(3) |
$ | 26.17 | $ | 12.36 | $ | 37.44 | $ | 19.55 | $ | 23.21 | $ | 48.71 | $ | 23.26 | $ | 48.71 | ||||||||||||||||
| Exercise price(3) |
$ | 21.95 | $ | 13.41 | $ | 31.72 | nil | $ | 24.24 | $ | 49.81 | nil | nil | |||||||||||||||||||
| Risk free interest rate |
$ | 1.77 | % | 2.67 | % | 4.49 | % | n/a | 2.49 | % | 4.56 | % | 2.31 | % | 4.61 | % | ||||||||||||||||
| Expected life of options |
2.6 years | 2.7 years | 2.8 years | n/a | 4.3 years | 4.3 years | 3.5 years | 3.5 years | ||||||||||||||||||||||||
| Expected volatility |
47 | % | 36 | % | 26 | % | n/a | 30 | % | 28 | % | 30 | % | 28 | % | |||||||||||||||||
| Dividend yield |
1.9 | % | 0.9 | % | 3.3 | % | 0.2 | % | 4.2 | % | 2.9 | % | 4.2 | % | 2.9 | % | ||||||||||||||||
| Fair value(3) |
$ | 7.36 | $ | 1.87 | $ | 9.18 | $ | 19.43 | $ | 4.01 | $ | 10.77 | $ | 20.11 | $ | 44.06 | ||||||||||||||||
| (1) | Weighted Average Exercise Price |
| (2) | Weighted Average Remaining Contractual Life |
| (3) | Weighted average |
128
Table of Contents
Notes to the financial statements (continued)
The expected volatility is determined by calculating the historical volatility of Signet’s share price over the previous five years. The expected life used in the model is based on the historical exercise behavior of the main categories of option recipients.
The total intrinsic value of awards outstanding and exercisable as of January 30, 2010 was $30.0 million and $0.6 million, respectively, and the aggregate intrinsic value for share options exercised during fiscal 2010, fiscal 2009 and fiscal 2008 was $0.4 million, $0.1 million and $6.6 million respectively.
23. Related party transactions
There are no related party transactions which require disclosure in this Annual Report on Form 10-K.
24. Subsequent events
In accordance with its borrowing agreements, Signet made a prepayment to its Note Holders on March 9, 2010 of $50.9 million. Following this repayment there were $229.1 million of Notes outstanding. A change was agreed with Signet’s Revolving Credit Facility banking group that the facility would be reduced to $300 million from $370 million on March 19, 2010.
129
Table of Contents
QUARTERLY FINANCIAL INFORMATION — UNAUDITED
The sum of the quarterly EPS amounts may not equal the full year amount as the computations of the weighted average shares outstanding for each quarter and the full year are calculated independently.
| Fiscal 2010 Quarters ended | |||||||||
| May 2, 2009 |
August 1, 2009 |
October 31, 2009 |
January 30, 2010 | ||||||
| $million | $million | $million | $million | ||||||
| Sales |
762.6 | 710.8 | 613.7 | 1,203.6 | |||||
| Gross margin |
255.5 | 221.5 | 165.8 | 434.1 | |||||
| Net income/(loss) |
26.3 | 27.6 | (7.0 | ) | 117.2 | ||||
| Earnings/(loss) per share—basic ($) |
0.31 | 0.32 | (0.08 | ) | 1.37 | ||||
| Earnings/(loss) per share—diluted ($) |
0.31 | 0.32 | (0.08 | ) | 1.36 | ||||
| Fiscal 2009 Quarters ended |
||||||||||
| May 3, 2008 |
August 2, 2008 |
November 1, 2008 |
January 31, 2009 |
|||||||
| $million | $million | $million | $million | |||||||
| Sales |
822.5 | 768.9 | 629.3 | 1,123.6 | ||||||
| Gross margin |
277.7 | 249.1 | 174.8 | 378.5 | ||||||
| Net income/(loss) |
25.7 | 19.7 | (15.1 | ) | (424.0 | ) | ||||
| Earnings/(loss) per share—basic ($) |
0.30 | 0.23 | (0.18 | ) | (4.97 | ) | ||||
| Earnings/(loss) per share—diluted ($) |
0.30 | 0.23 | (0.18 | ) | (4.97 | ) | ||||
130
Table of Contents
| ITEM 9. | CHANGES IN AND DISAGREEMENTS WITH ACCOUNTANTS ON ACCOUNTING AND FINANCIAL DISCLOSURE |
None.
| ITEM 9A. | CONTROLS AND PROCEDURES |
The directors review the effectiveness of Signet’s system of internal controls in the following areas:
| • | Financial; |
| • | Operational; |
| • | Compliance; and |
| • | Risk management. |
Signet’s disclosure controls and procedures are designed to help ensure that processes and procedures for information management are in place at all levels of the business. The disclosure controls and procedures aim to provide reasonable assurance that any information disclosed by Signet in the reports that it files or submits under the Exchange Act is recorded, processed, summarized and reported within the time periods specified in the SEC’s rules and forms. The procedures are also designed to ensure that information is accumulated and communicated to management, including the Chief Executive and Group Finance Director, as appropriate to allow timely decisions to be made regarding required disclosure. Signet’s Disclosure Control Committee, which has a written Charter, consists of the Group Finance Director, the Group Company Secretary, the Investor Relations Director and the Group Financial Controller, who consult with Signet’s external advisers and auditor, as necessary. These procedures are designed to enable Signet to make timely, appropriate and accurate public disclosures. The activities and findings of the Disclosure Control Committee are reported to the Audit Committee.
Based on their evaluation of Signet’s disclosure controls and procedures, as of January 30, 2010 and in accordance with the requirements of Section 302 of the Sarbanes-Oxley Act of 2002, the Chief Executive and Group Finance Director have concluded that the disclosure controls and procedures are effective and provide reasonable assurance that information regarding Signet is recorded, processed, summarized and reported and that the information is accumulated and communicated to management to allow timely decisions regarding required disclosure.
Management’s annual report on internal control over financial reporting
Signet’s Board is responsible for establishing and maintaining adequate internal control over financial reporting (as defined in Rule 13a-15(f) under the Exchange Act).
All internal control systems, no matter how well designed, have inherent limitations. Therefore, even those systems determined to be effective can provide only reasonable assurance with respect to financial statement preparation and presentation.
Management conducted an evaluation of internal control over financial reporting based on the framework in Internal Control—Integrated Framework issued by the Committee of Sponsoring Organizations of the Treadway Commission (COSO). Based on this evaluation, management determined that Signet’s internal control over financial reporting was effective as of January 30, 2010. KPMG Audit Plc, which has audited the consolidated financial statements of Signet for fiscal 2010, has also audited the effectiveness of internal control over financial reporting. An unqualified opinion has been issued thereon, the details of which are included within this Annual Report on Form 10-K.
131
Table of Contents
Directors’ responsibility statement
The directors confirm that, to the best of their knowledge and belief:
| • | The financial statements, prepared in accordance with US GAAP, give a true and fair view of the assets, liabilities, financial position and profit for the Company and the undertakings included in the consolidation taken as a whole; and |
| • | Pursuant to the Disclosure and Transparency Rules made under Chapter 4 of the UK Financial Services and Markets Act 2000, the following sections of the Company’s Annual Report on Form 10-K contain a fair review of the development and performance of the business and the position of the Company, and the undertakings included in the consolidation taken as a whole, together with a description of the principal risks and uncertainties that they face: |
| 1. | Item 1 “Business” on pages 3 – 30 |
| 2. | Item 1A “Risk factors” on pages 31 – 38 |
| 3. | Item 7 “Management’s discussion and analysis of financial condition and results of operations” on pages 55 – 87 |
| 4. | Item 7A “Quantitative and qualitative disclosures about market risk” on pages 87 – 89 |
On behalf of the board
| Terry Burman | Walker Boyd | |
| Chief Executive | Group Finance Director |
March 25, 2010
Changes in Internal Control over Financial Reporting
There were no changes in internal control over financial reporting during the quarter ended January 30, 2010 that have materially affected, or are reasonably likely to materially affect, internal control over financial reporting.
| ITEM 9B. | OTHER INFORMATION |
None
132
Table of Contents
PART III
| ITEM 10. | DIRECTORS, EXECUTIVE OFFICERS AND CORPORATE GOVERNANCE |
Information concerning directors, executive officers and corporate governance may be found under the captions “Re-Election of Current Directors,” “Nominees for Directors,” “Board of Directors and Corporate Governance,” “Board Committees,” “Executive Officers of the Company” and “Corporate Governance Guidelines” in our definitive proxy statement for our 2010 Annual General Meeting of Shareholders (the “2010 Proxy Statement”), which will be filed with the SEC within 120 days after the close of our fiscal year. Such information is incorporated herein by reference. The information in the 2010 Proxy Statement set forth under the caption “Section 16(a) Beneficial Ownership Reporting Compliance” is incorporated herein by reference.
| ITEM 11. | EXECUTIVE COMPENSATION |
Information concerning executive compensation may be found under the captions “Compensation Discussion and Analysis,” “Report of the Compensation Committee,” “Executive Compensation” and “Director Compensation (Non-Executive),” in the 2010 Proxy Statement. Such information is incorporated herein by reference.
| ITEM 12. | SECURITY OWNERSHIP OF CERTAIN BENEFICIAL OWNERS AND MANAGEMENT AND RELATED STOCKHOLDER MATTERS |
The information in the 2010 Proxy Statement set forth under the captions “Shareholders Who Beneficially Own At Least Five Percent of the Common Shares” and “Ownership by Directors, Director Nominees and Executive Officers” is incorporated herein by reference.
| ITEM 13. | CERTAIN RELATIONSHIPS AND RELATED TRANSACTIONS, AND DIRECTOR INDEPENDENCE |
The information in the 2010 Proxy Statement set forth under the captions “Board of Directors and Corporate Governance,” “Board Committees” and “Transactions with Related Persons” is incorporated herein by reference.
| ITEM 14. | PRINCIPAL ACCOUNTING FEES AND SERVICES |
The information in the 2010 Proxy Statement set forth under the caption “Appointment of Independent Registered Public Accounting Firm” is incorporated herein by reference.
133
Table of Contents
PART IV
| ITEM 15. | EXHIBITS, FINANCIAL STATEMENT SCHEDULES |
| PAGE | ||
| (1) The following consolidated financial statements are included in Item 8: |
||
| Consolidated Income Statement for the fiscal years ended January 30, 2010, January 31, 2009 and February 2, 2008 |
91 | |
| Consolidated Balance Sheets as of January 30, 2010 and January 31, 2009 |
92 | |
| Consolidated Statements of Cash Flows for the fiscal years ended January 30, 2010, January 31, 2009 and February 2, 2008 |
93 | |
| Consolidated Statements of Shareholders’ Equity for the fiscal years ended January 30, 2010, January 31, 2009 and February 2, 2008 |
94 | |
| Consolidated Statements of Accumulated Other Comprehensive Income for the fiscal years ended January 30, 2010, January 31, 2009 and February 2, 2008 |
95 | |
| Notes to the Financial Statements |
96 | |
| (2) The following exhibits are filed as part of this Annual Report on Form 10-K or are incorporated herein by reference. Where an exhibit is incorporated by reference, the number in parenthesis indicates the document to which cross-reference is made. See the end of this exhibit index for a listing of cross-referenced documents. |
||
| Number |
Description of Exhibits | |
| 3.1 | Memorandum of Association of Signet Limited and Certificate of Incorporation on Change of Name to Signet Jewelers Limited (incorporated by reference to Exhibit 3.1 to the Company’s Registration Statement on Form 8-A, filed September 11, 2008 (“Form 8-A”)). | |
| 3.2 | Bye-laws of Signet Jewelers Limited (incorporated by reference to Exhibit 3.2 to Form 8-A). | |
| 4.1 | Form of common share certificate of Signet Jewelers Limited (incorporated by reference to Exhibit 4.1 to Form 8-A). | |
| 10.1 | Note Purchase Agreement, dated as of March 30, 2006 among Signet Group plc and the several purchasers who are party thereto (incorporated by reference to Exhibit 4.12 to the Company’s Annual Report on Form 20-F, filed May 4, 2006 (“2006 20-F”)). | |
| 10.2* | First Supplemental Agreement amending the Note Purchase Agreement, dated as of May 16, 2008 among Signet Group plc and the several purchasers who are party thereto. | |
| 10.3 | Second Supplemental Agreement amending the Note Purchase Agreement, dated as of March 13, 2009 among Signet Group plc and the several purchasers who are party thereto (incorporated by reference to Exhibit 4.15 to the Company’s Annual Report on Form 20-F, filed April 1, 2009 (“2009 20-F”)). | |
| 10.4* | Depositary Agreement, dated as of September 3, 2008 between Signet Jewelers Limited and Capita IRG Trustees Limited. | |
| 10.5 | Amended and Restated Multicurrency Revolving Facilities Agreement, dated as of March 6, 2009 among Signet Jewelers Limited, Signet Group plc, the borrowers, guarantors, lenders and arrangers named therein and HSBC Bank plc as agent of the lenders (incorporated by reference to Exhibit 4.16 to 2009 20-F). | |
| 10.6 † | Amended and Restated Employment Agreement, dated November 12, 2008 between Sterling Jewelers Inc. and Terry Burman (incorporated by reference to the Company’s Report of Foreign Issuer on Form 6-K, filed November 13, 2008). | |
134
Table of Contents
| Number |
Description of Exhibits | |
| 10.7 † | Executive Service Agreement, dated as of June 14, 1995 between the Company and Walker Boyd, as amended May 15, 2000 (incorporated by reference to Exhibit 4.8 to the Company’s Annual Report on Form 20-F, filed May 11, 2001 (File No. 033-22663)). | |
| 10.8 † | Addendum to Employment Agreement, dated November 10, 2008 between Signet Group plc and Walker Boyd (incorporated by reference to Exhibit 4.2 to 2009 20-F). | |
| 10.9* † | Contract on early retirement for Walker Boyd, dated September 2, 2009 between Signet Jewelers Limited and Walker Boyd. | |
| 10.10 † | Amended and Restated Employment Agreement, dated as of August 6, 2004 between Sterling Jewelers Inc. and Mark Light (incorporated herein by reference to Exhibit 4.14 to 2006 20-F). | |
| 10.11 † | Amendment No. 1 to Amended and Restated Employment Agreement, dated as of January 12, 2006 between Sterling Jewelers Inc. and Mark Light (incorporated by reference to Exhibit 4.15 to 2006 20-F). | |
| 10.12† | Employment Agreement, dated March 1, 2003 between Signet Trading Limited and Robert Anderson (incorporated by reference to Exhibit 4.13 to the Company’s Annual Report on Form 20-F, filed May 3, 2005). | |
| 10.13*† | Amendment No. 3 to Amended and Restated Employment Agreement, dated December 3, 2007 between Sterling Jewelers Inc. and William Montalto. | |
| 10.14*† | Amendment No. 2 to Amended and Restated Employment Agreement dated September 1, 2007 between Sterling Jewelers Inc. and William Montalto. | |
| 10.15*† | Amendment No. 1 to Amended and Restated Employment Agreement dated September 1, 2006 between Sterling Jewelers Inc. and William Montalto. | |
| 10.16*† | Amended and Restated Employment Agreement dated August 9, 2004 between Sterling Jewelers Inc. and William Montalto | |
| 10.17 † | Signet Jewelers Limited Rules of the Sharesave Scheme (incorporated by reference to Exhibit 99.3 to the Company’s Registration Statement on Form S-8, filed September 11, 2008 (File No. 333-153435)). | |
| 10.18 † | Signet Jewelers Limited Rules of the Irish Sharesave Scheme (incorporated by reference to Exhibit 99.4 to the Company’s Registration Statement on Form S-8, filed September 11, 2008 (File No. 333-153435)). | |
| 10.19 † | Signet Jewelers Limited US Stock Option Plan 2008 (incorporated by reference to Exhibit 99.5 to the Company’s Registration Statement on Form S-8, filed September 11, 2008 (File No. 333-153435)). | |
| 10.20 † | Signet Jewelers Limited International Share Option Plan 2008 (incorporated by reference to Exhibit 99.6 to the Company’s Registration Statement on Form S-8, filed September 11, 2008 (File No. 333-153435)). | |
| 10.21 † | Signet Jewelers Limited UK Approved Share Option Plan 2008 (incorporated by reference to Exhibit 99.7 to the Company’s Registration Statement on Form S-8, filed September 11, 2008 (File No. 333-153435)). | |
| 10.22 † | Rules of the Signet Group 2005 Long-Term Incentive Plan (incorporated by reference to Exhibit 4.16 to 2006 20-F). | |
| 10.23 † | Rules of the Signet Group plc Sharesave Scheme (incorporated by reference to Exhibit 99.8 to the Company’s Registration Statement on Form S-8, filed September 11, 2008 (File No. 333-153435)). | |
135
Table of Contents
| Number |
Description of Exhibits | |
| 10.24 † | Rules of the Signet Group plc Sharesave Scheme (The Republic of Ireland) (incorporated by reference to Exhibit 99.9 to the Company’s Registration Statement on Form S-8, filed September 11, 2008 (File No. 333-153435)). | |
| 10.25 † | Signet Group plc International Share Option Plan 2003 (incorporated by reference to Exhibit 99.10 to the Company’s Registration Statement on Form S-8, filed September 11, 2008 (File No. 333-153435)). | |
| 10.26 † | Signet Group plc UK Inland Revenue Approved Share Option Plan 2003 (incorporated by reference to Exhibit 99.10 to the Company’s Registration Statement on Form S-8, filed September 11, 2008 (File No. 333-153435)). | |
| 10.27 † | Signet Group plc Employee Stock Savings Plan (incorporated by reference to Exhibit 99.1 to the Company’s Post-Effective Amendment No. 1 to Registration Statement on Form S-8, filed September 11, 2008 (File No. 333-9634)). | |
| 10.28 † | Signet Group plc US Share Option Plan 2003 (incorporated by reference to Exhibit 99.2 to the Company’s Post-Effective Amendment No. 1 to Registration Statement on Form S-8, filed September 11, 2008 (File No. 333-134192)). | |
| 10.29 † | Signet Group plc 2000 Long-Term Incentive Plan (incorporated by reference to Exhibit 99.1 to the Company’s Post-Effective Amendment No. 1 to Registration Statement on Form S-8, filed September 11, 2008 (File No. 333-12304)). | |
| 10.30 † | Signet Group plc 1993 Executive Share Option Scheme (incorporated by reference to Exhibit 99.1 to the Company’s Post-Effective Amendment No. 1 to Registration Statement on Form S-8, filed September 11, 2008 (File No. 333-8964)). | |
| 10.31 *† | Form of Letter of Appointment of Independent Directors. | |
| 10.32 *† | Form of Deed of Indemnity for Directors. | |
| 21.1* | Subsidiaries of Signet Jewelers Limited. | |
| 23.1* | Consent of independent registered public accounting firm. | |
| 31.1* | Certification of the Chief Executive Officer pursuant to Section 302 of the Sarbanes-Oxley Act of 2002. | |
| 31.2* | Certification of the Chief Financial Officer pursuant to Section 302 of the Sarbanes-Oxley Act of 2002. | |
| 32.1* | Certification of the Chief Executive Officer pursuant to 18 U.S.C. Section 1350, as adopted by Section 906 of the Sarbanes-Oxley Act of 2002. | |
| 32.2* | Certification of the Chief Financial Officer pursuant to 18 U.S.C. Section 1350, as adopted by Section 906 of the Sarbanes-Oxley Act of 2002. | |
| * | Filed herewith |
| † | Management contract or compensatory plan or arrangement |
136
Table of Contents
SIGNATURES
Pursuant to the requirements of Section 13 or 15(d) of the Securities Exchange Act of 1934, the registrant has duly caused this report to be signed on its behalf by the undersigned, thereunto duly authorized.
| Signet Jewelers Limited | ||||||||
| Date: |
March 30, 2010 |
By: | /s/ Walker Boyd |
|||||
| Name: | Walker Boyd | |||||||
| Title: | Group Finance Director | |||||||
Pursuant to the requirements of the Securities Exchange Act of 1934, this report has been signed below by the following persons on behalf of the registrant and in the capacities indicated, on the date set forth below.
| Date |
Signature |
Title | ||||
| March 30, 2010 | By: |
/s/ Terry Burman Terry Burman |
Chief Executive (Principal Executive Officer and Director) | |||
| March 30, 2010 | By: |
/s/ Walker Boyd Walker Boyd |
Group Finance Director (Principal Financial Officer and Director) | |||
| March 30, 2010 | By: |
/s/ Sir Malcolm Williamson Sir Malcolm Williamson |
Chairman of the Board | |||
| March 30, 2010 | By: |
/s/ Robert Blanchard Robert Blanchard |
Director | |||
| March 30, 2010 | By: |
/s/ Dale W. Hilpert Dale W. Hilpert |
Director | |||
| March 30, 2010 | By: |
/s/ Marianne Miller Parrs Marianne Miller Parrs |
Director | |||
| March 30, 2010 | By: |
/s/ Thomas G. Plaskett Thomas G. Plaskett |
Director | |||
| March 30, 2010 | By: |
/s/ Russell Walls Russell Walls |
Director | |||
137