Attached files
| file | filename |
|---|---|
| EX-99.3 - EX-99.3 - Alta Mesa Holdings, LP | d363511dex993.htm |
| EX-99.2 - EX-99.2 - Alta Mesa Holdings, LP | d363511dex992.htm |
| EX-3.2 - EX-3.2 - Alta Mesa Holdings, LP | d363511dex32.htm |
| EX-3.1 - EX-3.1 - Alta Mesa Holdings, LP | d363511dex31.htm |
| EX-2.1 - EX-2.1 - Alta Mesa Holdings, LP | d363511dex21.htm |
| 8-K - 8-K - Alta Mesa Holdings, LP | d363511d8k.htm |
Exhibit 99.1
Alta Mesa Resources Pure-Play STACK Enterprise August 2017
Disclaimer FORWARD-LOOKING STATEMENTS The information in this presentation and the oral statements made in connection therewith include ?forward-looking statements? within the meaning of Section 27A of the Securities Act and Section 21E of the Securities Exchange Act of 1934, as amended. All statements, other than statements of present or historical fact included in this presentation, regarding Silver Run II?s proposed business combination with Alta Mesa Holdings, LP (?Alta Mesa?) and Kingfisher Midstream, LLC (?KFM?), Silver Run II?s ability to consummate the business combination, the benefits of the business combination and Silver Run II?s future financial performance following the business combination, as well as Alta Mesa?s and KFM?s strategy, future operations, financial position, estimated revenues and losses, projected costs, prospects, plans and objectives of management are forward-looking statements. When used in this presentation, including any oral statements made in connection therewith, the words ?could,? ?should,? ?will,? ?may,? ?believe,? ?anticipate,? ?intend,? ?estimate,? ?expect,? ?project,? the negative of such terms and other similar expressions are intended to identify forward-looking statements, although not all forward-looking statements contain such identifying words. These forward-looking statements are based on management?s current expectations and assumptions about future events and are based on currently available information as to the outcome and timing of future events. Except as otherwise required by applicable law, Silver Run II, Alta Mesa and KFM disclaim any duty to update any forward-looking statements, all of which are expressly qualified by the statements in this section, to reflect events or circumstances after the date of this presentation. Silver Run II cautions you that these forward-looking statements are subject to all of the risks and uncertainties, most of which are difficult to predict and many of which are beyond the control of Silver Run II, Alta Mesa and KFM, incident to the development, production, gathering and sale of oil, natural gas and natural gas liquids. These risks include, but are not limited to, commodity price volatility, low prices for oil and/or natural gas, global economic conditions, inflation, increased operating costs, lack of availability of drilling and production equipment, supplies, services and qualified personnel, processing volumes and pipeline throughput, uncertainties related to new technologies, geographical concentration of Alta Mesa?s and KFM?s operations, environmental risks, weather risks, security risks, drilling and other operating risks, regulatory changes, the uncertainty inherent in estimating oil and natural gas reserves and in projecting future rates of production, reductions in cash flow, lack of access to capital, Alta Mesa?s and KFM?s ability to satisfy future cash obligations, restrictions in existing or future debt agreements of Alta Mesa or KFM, the timing of development expenditures, managing Alta Mesa?s and KFM?s growth and integration of acquisitions, failure to realize expected value creation from property acquisitions, title defects and limited control over non-operated properties. Should one or more of the risks or uncertainties described in this presentation and the oral statements made in connection therewith occur, or should underlying assumptions prove incorrect, Silver Run II?s, Alta Mesa?s and KFM?s actual results and plans could differ materially from those expressed in any forward-looking statements. RESERVE INFORMATION Reserve engineering is a process of estimating underground accumulations of hydrocarbons that cannot be measured in an exact way. The accuracy of any reserve estimate depends on the quality of available data, the interpretation of such data and price and cost assumptions made by reserve engineers. In addition, the results of drilling, testing and production activities may justify revisions of estimates that were made previously. If significant, such revisions could impact Alta Mesa?s strategy and change the schedule of any further production and development drilling. Accordingly, reserve estimates may differ significantly from the quantities of oil and natural gas that are ultimately recovered. Estimated Ultimate Recoveries, or ?EURs,? refers to estimates of the sum of total gross remaining proved reserves per well as of a given date and cumulative production prior to such given date for developed wells. These quantities do not necessarily constitute or represent reserves as defined by the Securities and Exchange Commission (the ?SEC?) and are not intended to be representative of anticipated future well results of all wells drilled on Alta Mesa?s STACK acreage. USE OF PROJECTIONS This presentation contains projections for Alta Mesa and KFM, including with respect to their EBITDA, net debt to EBITDA ratio and capital budget, as well as Alta Mesa?s production and KFM?s volumes, for the fiscal years 2017, 2018 and 2019. Neither Silver Run II?s nor Alta Mesa?s and KFM?s independent auditors or Alta Mesa?s independent petroleum engineering firm have audited, reviewed, compiled, or performed any procedures with respect to the projections for the purpose of their inclusion in this presentation, and accordingly, none of them expressed an opinion or provided any other form of assurance with respect thereto for the purpose of this presentation. These projections are for illustrative purposes only and should not be relied upon as being necessarily indicative of future results. In this presentation, certain of the above-mentioned projected information has been repeated (in each case, with an indication that the information is subject to the qualifications presented herein), for purposes of providing comparisons with historical data. The assumptions and estimates underlying the projected information are inherently uncertain and are subject to a wide variety of significant business, economic and competitive risks and uncertainties that could cause actual results to differ materially from those contained in the projected information. Even if our assumptions and estimates are correct, projections are inherently uncertain due to a number of factors outside our control. Accordingly, there can be no assurance that the projected results are indicative of the future performance of Silver Run II, Alta Mesa or KFM or the combined company after completion of any business combination or that actual results will not differ materially from those presented in the projected information. Inclusion of the projected information in this presentation should not be regarded as a representation by any person that the results contained in the projected information will be achieved. USE OF NON-GAAP FINANCIAL MEASURES This presentation includes non-GAAP financial measures, including EBITDA and Adjusted EBITDAX of Alta Mesa. Please refer to the Appendix for a reconciliation of Adjusted EBITDAX to net (loss) income, the most comparable GAAP measure. Silver Run II, Alta Mesa and KFM believe EBITDA and Adjusted EBITDAX are useful because they allow Silver Run II, Alta Mesa and KFM to more effectively evaluate their operating performance and compare the results of their operations from period to period and against their peers without regard to financing methods or capital structure. The computations of EBITDA and Adjusted EBITDAX may not be comparable to other similarly titled measures of other companies. Alta Mesa excludes the items listed in the Appendix from net (loss) income in arriving at Adjusted EBITDAX because these amounts can vary substantially from company to company within its industry depending upon accounting methods and book values of assets, capital structures and the method by which the assets were acquired. Adjusted EBITDAX should not be considered as an alternative to, or more meaningful than, net income as determined in accordance with GAAP or as an indicator of Alta Mesa?s operating performance or liquidity. Certain items excluded from Adjusted EBITDAX are significant components in understanding and assessing a company?s financial performance, such as a company?s cost of capital and tax structure, as well as the historic costs of depreciable assets, none of which are components of Adjusted EBITDAX. Alta Mesa?s presentation of Adjusted EBITDAX should not be construed as an inference that its results will be unaffected by unusual or non-recurring items. INDUSTRY AND MARKET DATA This presentation has been prepared by Silver Run II and includes market data and other statistical information from sources believed by Silver Run II, Alta Mesa and KFM to be reliable, including independent industry publications, government publications or other published independent sources. Some data is also based on the good faith estimates of Alta Mesa and KFM, which are derived from their review of internal sources as well as the independent sources described above. Although Silver Run II, Alta Mesa and KFM believe these sources are reliable, they have not independently verified the information and cannot guarantee its accuracy and completeness. TRADEMARKS AND TRADE NAMES Alta Mesa and KFM own or have rights to various trademarks, service marks and trade names that they use in connection with the operation of their respective businesses. This presentation also contains trademarks, service marks and trade names of third parties, which are the property of their respective owners. The use or display of third parties? trademarks, service marks, trade names or products in this presentation is not intended to, and does not imply, a relationship with Silver Run II, Alta Mesa or KFM, or an endorsement or sponsorship by or of Silver Run II, Alta Mesa or KFM. Solely for convenience, the trademarks, service marks and trade names referred to in this presentation may appear without the , TM or SM symbols, but such references are not intended to indicate, in any way, that Alta Mesa or KFM will not assert, to the fullest extent under applicable law, their rights or the right of the applicable licensor to these trademarks, service marks and trade names. 2
Table of Contents I. Introduction II. Company Overview III. Our Upstream Assets IV. Our Midstream Assets V. Financial Summary VI. Valuation and Timeline Appendix

Introduction

Silver Run II Delivering on Investment Criteria Upstream Midstream Assets economic well Competitively-positioned ? below current oil price ? assets that benefit from strong supply/demand fundamentals High margin core basin ? with low field break-evens, deep inventory Expansion opportunities in ? rapidly growing basin ? Multiple Stacked Pays Locked-in base returns through High-quality assets with ? stable fee-based contracts ? significant unbooked resource potential Assets with return asymmetry from incremental volumes, Opportunities to improve ? moderate margin exposure, ? costs through technology and/or organic growth projects Opportunity to expand Synergy with existing through technology and ? ? upstream portfolio acquisitions Combined upstream and midstream company allows for significant value uplift from financial optimization 5
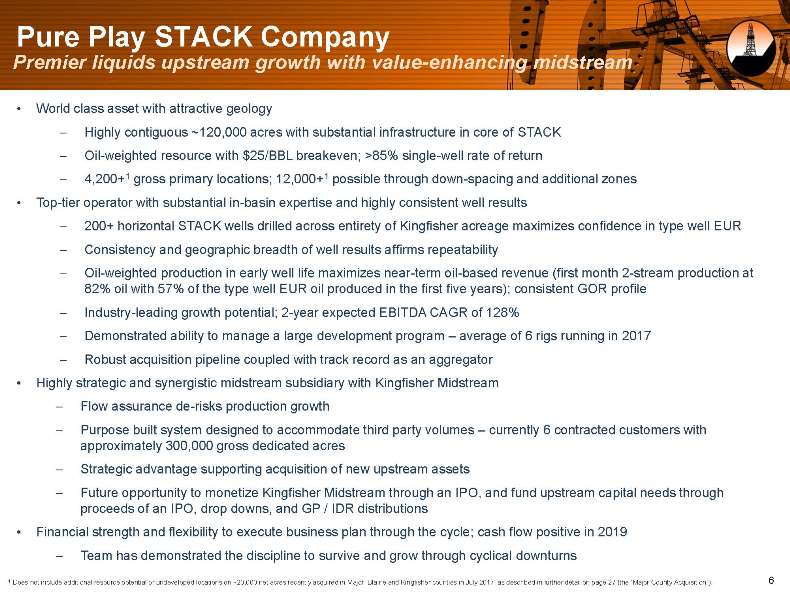
Pure Play STACK Company Premier liquids upstream growth with value-enhancing midstream World class asset with attractive geology —Highly contiguous ~120,000 acres with substantial infrastructure in core of STACK—Oil-weighted resource with $25/BBL breakeven; >85% single-well rate of return —4,200+1 gross primary locations; 12,000+1 possible through down-spacing and additional zones Top-tier operator with substantial in-basin expertise and highly consistent well results —200+ horizontal STACK wells drilled across entirety of Kingfisher acreage maximizes confidence in type well EUR—Consistency and geographic breadth of well results affirms repeatability—Oil-weighted production in early well life maximizes near-term oil-based revenue (first month 2-stream production at 82% oil with 57% of the type well EUR oil produced in the first five years); consistent GOR profile —Industry-leading growth potential; 2-year expected EBITDA CAGR of 128%—Demonstrated ability to manage a large development program ? average of 6 rigs running in 2017—Robust acquisition pipeline coupled with track record as an aggregator Highly strategic and synergistic midstream subsidiary with Kingfisher Midstream—Flow assurance de-risks production growth —Purpose built system designed to accommodate third party volumes ? currently 6 contracted customers with approximately 300,000 gross dedicated acres—Strategic advantage supporting acquisition of new upstream assets—Future opportunity to monetize Kingfisher Midstream through an IPO, and fund upstream capital needs through proceeds of an IPO, drop downs, and GP / IDR distributions Financial strength and flexibility to execute business plan through the cycle; cash flow positive in 2019—Team has demonstrated the discipline to survive and grow through cyclical downturns 1 Does not include additional resource potential or undeveloped locations on ~20,000 net acres recently acquired in Major, Blaine and Kingfisher counties in July 2017, as described in further detail on page 27 (the ?Major County Acquisition?). 6
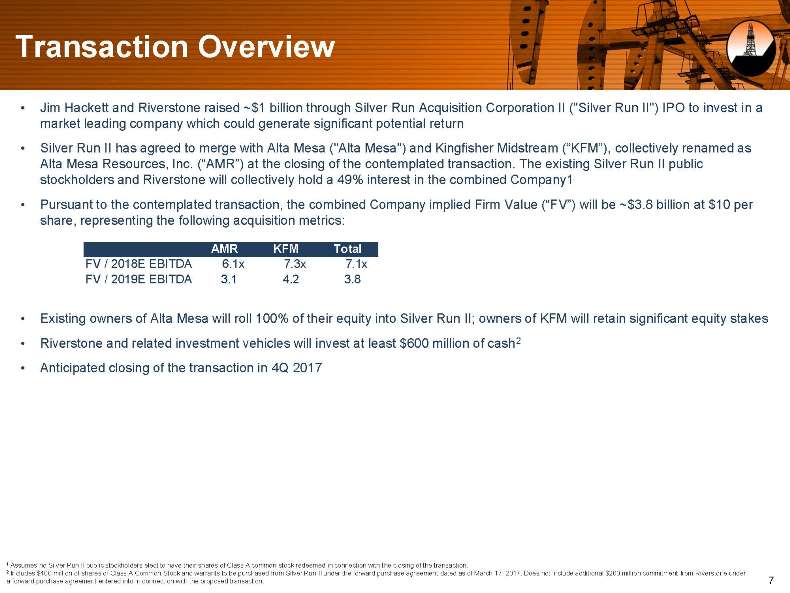
Transaction Overview Jim Hackett and Riverstone raised ~$1 billion through Silver Run Acquisition Corporation II (“Silver Run II”) IPO to invest in a market leading company which could generate significant potential return Silver Run II has agreed to merge with Alta Mesa (“Alta Mesa”) and Kingfisher Midstream (?KFM?), collectively renamed as Alta Mesa Resources, Inc. (?AMR?) at the closing of the contemplated transaction. The existing Silver Run II public stockholders and Riverstone will collectively hold a 49% interest in the combined Company1 Pursuant to the contemplated transaction, the combined Company implied Firm Value (?FV?) will be ~$3.8 billion at $10 per share, representing the following acquisition metrics: AMR KFM Total FV / 2018E EBITDA 6.1x 7.3x 7.1x FV / 2019E EBITDA 3.1 4.2 3.8 Existing owners of Alta Mesa will roll 100% of their equity into Silver Run II; owners of KFM will retain significant equity stakes Riverstone and related investment vehicles will invest at least $600 million of cash2 Anticipated closing of the transaction in 4Q 2017 1 Assumes no Silver Run II public stockholders elect to have their shares of Class A common stock redeemed in connection with the closing of the transaction. 2 Includes $400 million of shares of Class A Common Stock and warrants to be purchased from Silver Run II under the forward purchase agreement dated as of March 17, 2017. Does not include additional $200 million commitment from Riverstone under a forward purchase agreement entered into in connection with the proposed transaction. 7
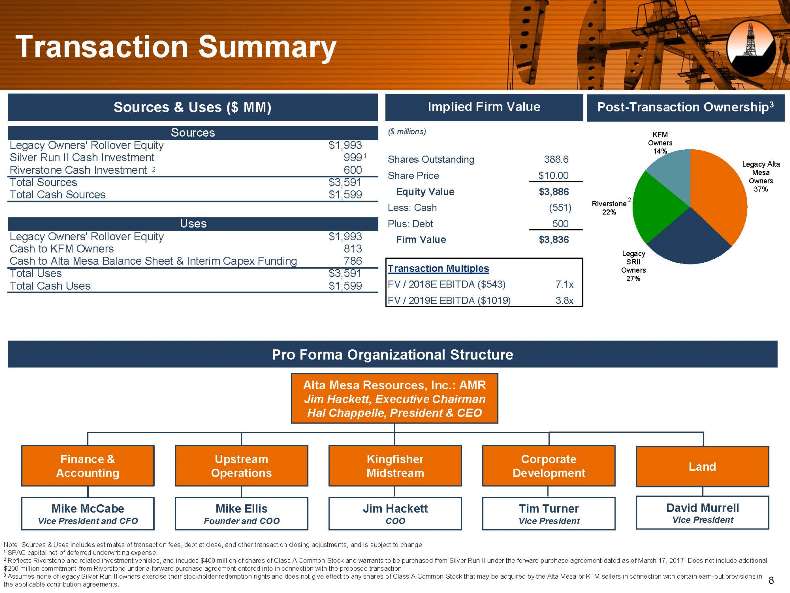
Transaction Summary Sources & Uses ($ MM) Implied Firm Value Post-Transaction Ownership3 Sources ($ millions) KFM Legacy Owners’ Rollover Equity $1,993 Owners 14% Silver Run II Cash Investment 9991 Shares Outstanding 388.6 Legacy Alta Riverstone Cash Investment 2 600 Mesa Share Price $10.00 Total Sources $3,591 Owners Equity Value $3,886 37% Total Cash Sources $1,599 2 Less: Cash (551) Riverstone 22% Uses Plus: Debt 500 Legacy Owners’ Rollover Equity $1,993 Firm Value $3,836 Cash to KFM Owners 813 TRUE Legacy Cash to Alta Mesa Balance Sheet & Interim Capex Funding 786 SRII Transaction Multiples Owners Total Uses $3,591 27% Total Cash Uses $1,599 FV / 2018E EBITDA ($543) 7.1x FV / 2019E EBITDA ($1019) 3.8x Pro Forma Organizational Structure Alta Mesa Resources, Inc.: AMR Jim Hackett, Executive Chairman Hal Chappelle, President & CEO Finance & Upstream Kingfisher Corporate Land Accounting Operations Midstream Development Mike McCabe Mike Ellis Jim Hackett Tim Turner David Murrell Vice President and CFO Founder and COO COO Vice President Vice President Note: Sources & Uses includes estimates of transaction fees, debt at close, and other transaction closing adjustments, and is subject to change. 1 SPAC capital net of deferred underwriting expense. 2 Reflects Riverstone and related investment vehicles, and incudes $400 million of shares of Class A Common Stock and warrants to be purchased from Silver Run II under the forward purchase agreement dated as of March 17, 2017. Does not include additional $200 million commitment from Riverstone under a forward purchase agreement entered into in connection with the proposed transaction. 3 Assumes none of legacy Silver Run II owners exercise their stockholder redemption rights and does not give effect to any shares of Class A Common Stock that may be acquired by the Alta Mesa or KFM sellers in connection with certain earn-out provisions in 8 the applicable contribution agreements.
Company Overview
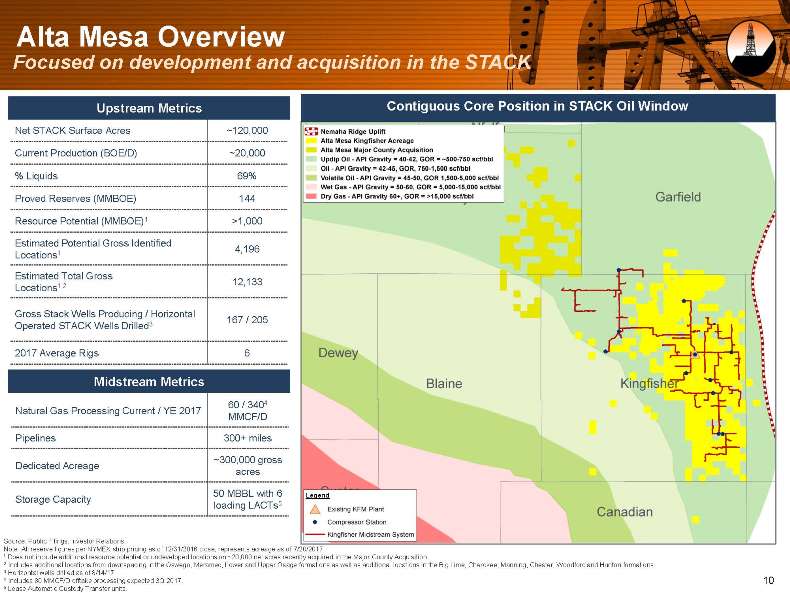
Alta Mesa Overview Focused on development and acquisition in the STACK Upstream Metrics Contiguous Core Position in STACK Oil Window Net STACK Surface Acres ~120,000 Current Production (BOE/D) ~20,000 % Liquids 69% Proved Reserves (MMBOE) 144 Resource Potential (MMBOE)1 >1,000 Estimated Potential Gross Identified 4,196 Locations1 Estimated Total Gross 1,2 12,133 Locations Gross Stack Wells Producing / Horizontal 167 / 205 Operated STACK Wells Drilled3 2017 Average Rigs 6 Midstream Metrics Natural Gas Processing Current / YE 2017 60 / 3404 MMCF/D Pipelines 300+ miles ~300,000 gross Dedicated Acreage acres 50 MBBL with 6 Legend Storage Capacity loading LACTs5 Source: Public Filings, Investor Relations. Note: All reserve figures per NYMEX strip pricing as of 12/31/2016 close; represents acreage as of 7/20/2017. 1 Does not include additional resource potential or undeveloped locations on ~20,000 net acres recently acquired in the Major County Acquisition. 2 Includes additional locations from downspacing in the Oswego, Meramec, Lower and Upper Osage formations as well as additional locations in the Big Lime, Cherokee, Manning, Chester, Woodford and Hunton formations. 3 Horizontal wells drilled as of 8/14/17 4 Includes 80 MMCF/D offtake processing expected 3Q 2017. 10 5 Lease Automatic Custody Transfer units.
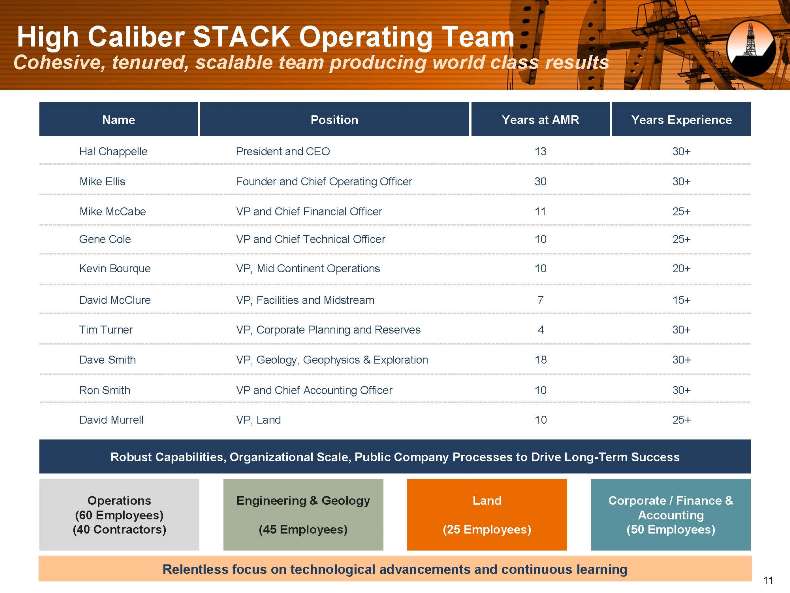
High Caliber STACK Operating Team Cohesive, tenured, scalable team producing world class results Name Position Years at AMR Years Experience Hal Chappelle President and CEO 13 30+ Mike Ellis Founder and Chief Operating Officer 30 30+ Mike McCabe VP and Chief Financial Officer 11 25+ Gene Cole VP and Chief Technical Officer 10 25+ Kevin Bourque VP, Mid Continent Operations 10 20+ David McClure VP, Facilities and Midstream 7 15+ Tim Turner VP, Corporate Planning and Reserves 4 30+ Dave Smith VP, Geology, Geophysics & Exploration 18 30+ Ron Smith VP and Chief Accounting Officer 10 30+ David Murrell VP, Land 10 25+ Robust Capabilities, Organizational Scale, Public Company Processes to Drive Long-Term Success Operations Engineering & Geology Land Corporate / Finance & (60 Employees) Accounting (40 Contractors) (45 Employees) (25 Employees) (50 Employees) Relentless focus on technological advancements and continuous learning 11
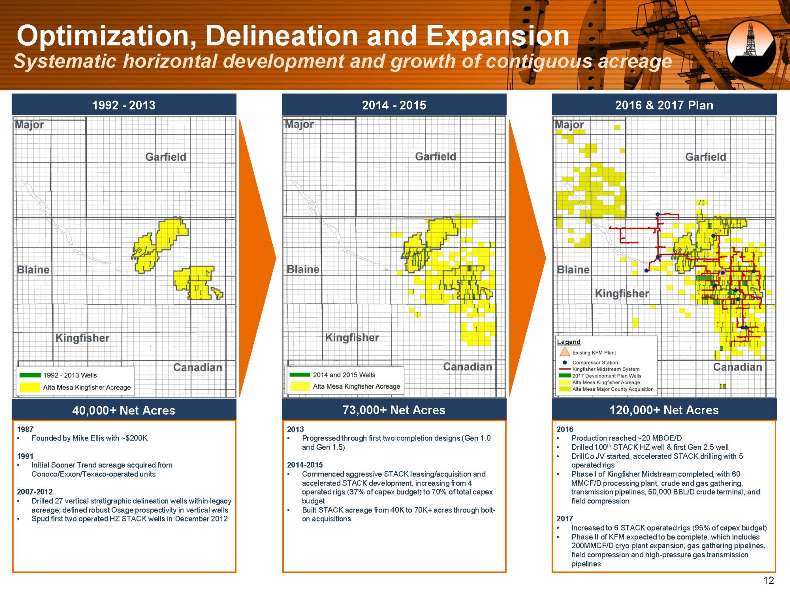
Optimization, Delineation and Expansion Systematic horizontal development and growth of contiguous acreage 1992—2013 2014—2015 2016 & 2017 Plan Legend 40,000+ Net Acres 73,000+ Net Acres 120,000+ Net Acres 1987 2013 2016 Founded by Mike Ellis with ~$200K Progressed through first two completion designs (Gen 1.0 Production reached ~20 MBOE/D and Gen 1.5) Drilled 100th STACK HZ well & first Gen 2.5 well 1991 DrillCo JV started, accelerated STACK drilling with 5 Initial Sooner Trend acreage acquired from 2014-2015 operated rigs Conoco/Exxon/Texaco-operated units Commenced aggressive STACK leasing/acquisition and Phase I of Kingfisher Midstream completed, with 60 accelerated STACK development, increasing from 4 MMCF/D processing plant, crude and gas gathering, 2007-2012 operated rigs (37% of capex budget) to 70% of total capex transmission pipelines, 50,000 BBL/D crude terminal, and Drilled 27 vertical stratigraphic delineation wells within legacy budget field compression acreage; defined robust Osage prospectivity in vertical wells Built STACK acreage from 40K to 70K+ acres through bolt- Spud first two operated HZ STACK wells in December 2012 on acquisitions 2017 Increased to 6 STACK operated rigs (95% of capex budget) Phase II of KFM expected to be complete, which includes 200MMCF/D cryo plant expansion, gas gathering pipelines, field compression and high-pressure gas transmission pipelines 12
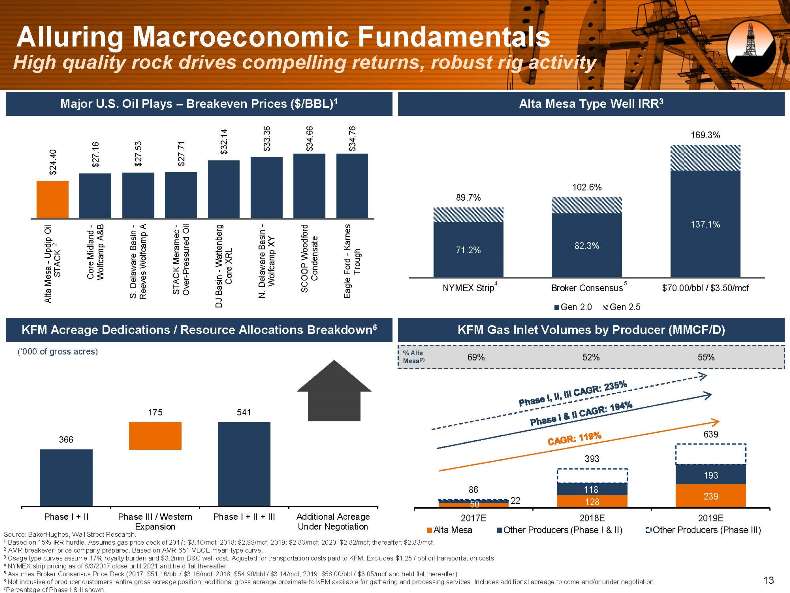
Alluring Macroeconomic Fundamentals High quality rock drives compelling returns, robust rig activity Major U.S. Oil Plays ? Breakeven Prices ($/BBL)1 Alta Mesa Type Well IRR3 169.3% 33.36 34.66 34.76 32.14 $ $ $ 27.16 27.53 27.71 $ 24.40 $ $ $ $ 102.6% 89.7% —B—A— g- 137.1% Oil d n Oil ord A& ecd b er sin Y e ip2p asi amp n a X df o t 82.3% dlan B c te L B Karnes pd m f eram uree— 71.2% U Mi a e R CK r Wo ugh—M X a densa rd r e Wol Wat o e camp TA olfc Press—r Tr S Co W lawar—law olf OP O Con Fo ACK er Co e Mesa De De W C 4 5 T a S NYMEX Strip Broker Consensus $70.00/bbl / $3.50/mcf S Ov Basin A lt S. Reeves J N. Eagl D Gen 2.0 Gen 2.5 KFM Acreage Dedications / Resource Allocations Breakdown6 KFM Gas Inlet Volumes by Producer (MMCF/D) (?000 of gross acres) % Alta Mesa(7) 69% 52% 55% 175 541 639 366 393 193 86 118 239 50 22 128 Phase I + II Phase III / Western Phase I + II + III Additional Acreage 2017E 2018E 2019E Expansion Under Negotiation Alta Mesa Other Producers (Phase I & II) Other Producers (Phase III) Source: BakerHughes, Wall Street Research. 1 Based on 15% IRR hurdle. Assumes gas price deck of 2017: $3.10/mcf; 2018: $2.99/mcf; 2019: $2.83/mcf; 2020: $2.82/mcf; thereafter: $2.83/mcf. 2 AMR breakeven price company prepared. Based on AMR 651 MBOE mean type curve. 3 Osage type curves assume 17% royalty burden and $3.2mm D&C well cost. Adjusted for transportation costs paid to KFM. Excludes $1.25 / bbl oil transportation costs. 4 NYMEX strip pricing as of 8/3/2017 close until 2021 and held flat thereafter. 5 Assumes Broker Consensus Price Deck (2017: $51.16/bbl / $3.16/mcf; 2018: $54.90/bbl / $3.14/mcf; 2019: $58.00/bbl / $3.05/mcf and held flat thereafter). 6 Not inclusive of producer customers? entire gross acreage position; additional gross acreage proximate to KFM available for gathering and processing services. Includes additional acreage to come and/or under negotiation. 13 7Percentage of Phase I & II shown.
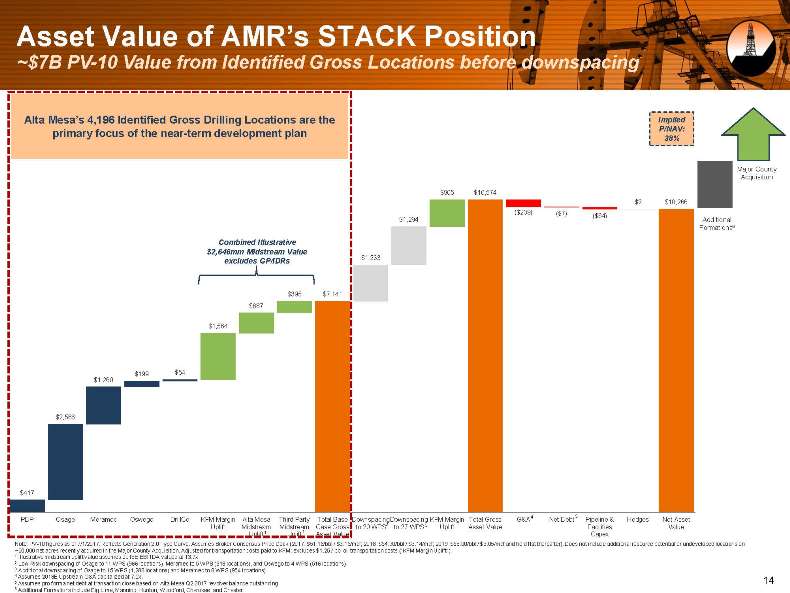
Asset Value of AMR?s STACK Position ~$7B PV-10 Value from Identified Gross Locations before downspacing Alta Mesa?s 4,196 Identified Gross Drilling Locations are the Implied primary focus of the near-term development plan P/NAV: 38% Major County Acquisition $905 $10,574 $2 $10,266 ($239) ($7) ($64) $1,294 Additional Formations6 Combined Illustrative $2,646mm Midstream Value $1,233 excludes GP/IDRs $395 $7,141 $687 $1,564 $199 $54 $1,260 $2,566 $417 4 5 PDP Osage Meramec Oswego DrillCo KFM Margin Alta Mesa Third Party Total Base Downspacing 2 Downspacing KFM Margin Total Gross G&A Net Debt Pipeline & Hedges Net Asset Uplift Midstream Midstream Case Gross to 20 WPS to 27 WPS 3 Uplift Asset Value Facilities Value Uplift 1 Uplift 1 Asset Value Capex Note: PV-10 figures as of 7/1/2017. Reflects Generation 2.0 Type Curve. Assumes Broker Consensus Price Deck (2017: $51.16/bbl / $3.16/mcf; 2018: $54.90/bbl / $3.14/mcf; 2019: $58.00/bbl / $3.05/mcf and held flat thereafter). Does not include additional resource potential or undeveloped locations on ~20,000 net acres recently acquired in the Major County Acquisition. Adjusted for transportation costs paid to KFM; excludes $1.25 / bbl oil transportation costs (?KFM Margin Uplift?). 1 Illustrative midstream uplift value assumes 2018E EBITDA valued at 13.7x. 2 Low Risk downspacing of Osage to 11 WPS (966 locations), Meramec to 5 WPS (318 locations), and Oswego to 4 WPS (516 locations). 3 Additional downspacing of Osage to 15 WPS (1,288 locations) and Meramec to 8 WPS (954 locations). 4 Assumes 2018E Upstream G&A capitalized at 7.5x. 5 Assumes pro forma net debt at transaction close based on Alta Mesa Q2 2017 revolver balance outstanding. 14 6 Additional Formations include Big Lime, Manning, Hunton, Woodford, Cherokee, and Chester.
Our Upstream Assets
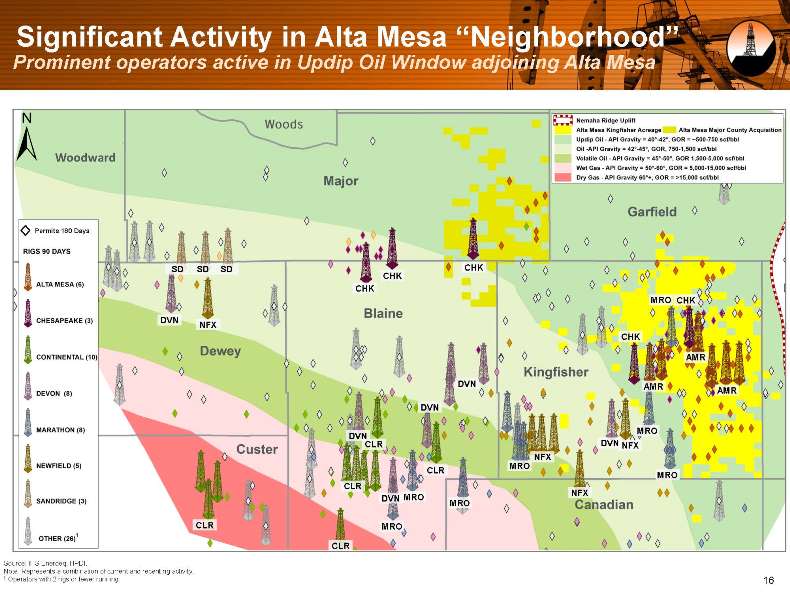
Significant Activity in Alta Mesa ?Neighborhood? Prominent operators active in Updip Oil Window adjoining Alta Mesa Permits 180 Days SD SD SD CHK CHK CHK MRO CHK DVN NFX CHK AMR DVN AMR AMR DVN MRO DVN DVN CLR NFX NFX MRO CLR MRO CLR NFX DVN MRO MRO CLR MRO 1 CLR Source: IHS Enerdeq, HPDI. Note: Represents a combination of current and recent rig activity. 1 Operators with 2 rigs or fewer running. 16
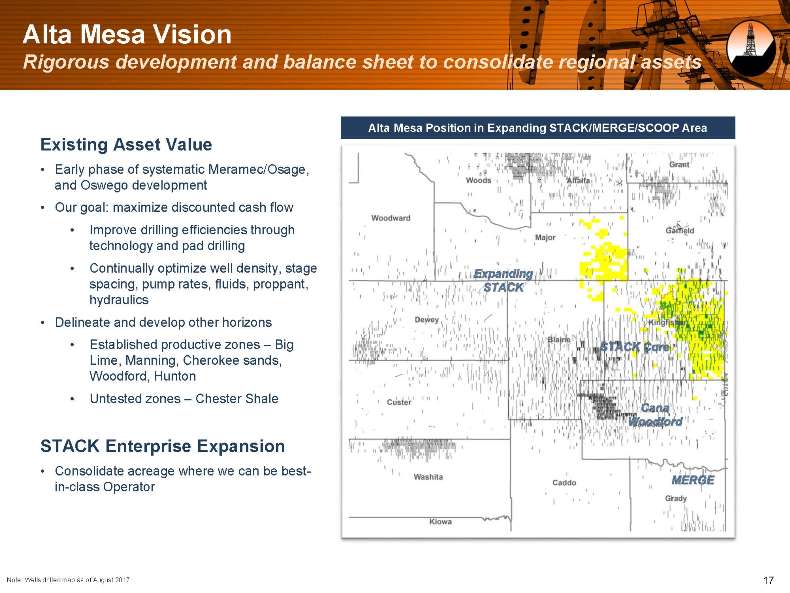
Alta Mesa Vision Rigorous development and balance sheet to consolidate regional assets Alta Mesa Position in Expanding STACK/MERGE/SCOOP Area Existing Asset Value Early phase of systematic Meramec/Osage, and Oswego development Our goal: maximize discounted cash flow Improve drilling efficiencies through technology and pad drilling Continually optimize well density, stage spacing, pump rates, fluids, proppant, hydraulics Delineate and develop other horizons Established productive zones ? Big Lime, Manning, Cherokee sands, Woodford, Hunton Untested zones ? Chester Shale STACK Enterprise Expansion Consolidate acreage where we can be best-in-class Operator Note: Wells drilled map as of August 2017. 17
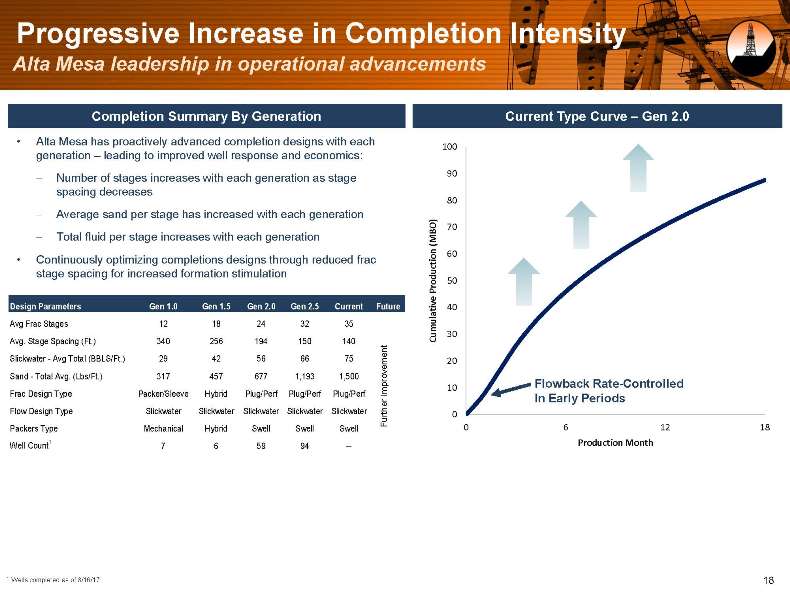
Progressive Increase in Completion Intensity Alta Mesa leadership in operational advancements Completion Summary By Generation Current Type Curve ? Gen 2.0 Alta Mesa has proactively advanced completion designs with each 100 generation ? leading to improved well response and economics:—Number of stages increases with each generation as stage 90 spacing decreases 80- Average sand per stage has increased with each generation generation 70- Total fluid per stage increases with each (MBO) 60 Continuously optimizing completions designs through reduced frac stage spacing for increased formation stimulation Production 50 Design Parameters Gen 1.0 Gen 1.5 Gen 2.0 Gen 2.5 Current Future 40 Avg Frac Stages 12 18 24 32 35 Avg. Stage Spacing (Ft.) 340 256 194 150 140 Cumulative 30 Slickwater—Avg Total (BBLS/Ft.) 29 42 56 66 75 20 Sand—Total Avg. (Lbs/Ft.) 317 457 677 1,193 1,500 Improvement 10 Flowback Rate-Controlled Frac Design Type Packer/Sleeve Hybrid Plug/Perf Plug/Perf Plug/Perf In Early Periods Flow Design Type Slickwater Slickwater Slickwater Slickwater Slickwater Further 0 Packers Type Mechanical Hybrid Swell Swell Swell 0 6 12 18 Well Count1 7 6 59 94 — Production Month 1 Wells completed as of 8/16/17 18
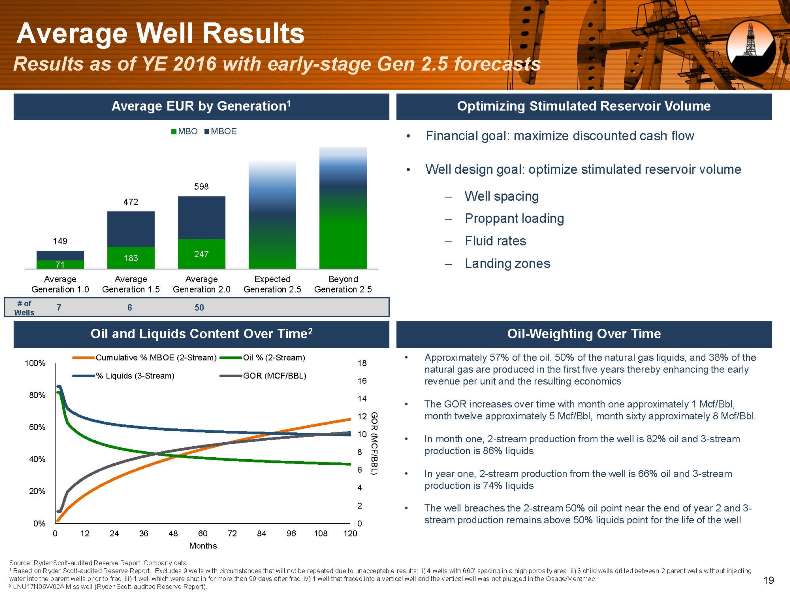
Average Well Results Results as of YE 2016 with early-stage Gen 2.5 forecasts Average EUR by Generation1 Optimizing Stimulated Reservoir Volume MBO MBOE Financial goal: maximize discounted cash flow Well design goal: optimize stimulated reservoir volume 598 —Well spacing 472 —Proppant loading 149—Fluid rates 247 183—Landing zones 71 Average Average Average Expected Beyond Generation 1.0 Generation 1.5 Generation 2.0 Generation 2.5 Generation 2.5 # of 7 6 50 Wells Oil and Liquids Content Over Time2 Oil-Weighting Over Time Cumulative % MBOE (2-Stream) Oil % (2-Stream) Approximately 57% of the oil, 50% of the natural gas liquids, and 38% of the 100% 18 natural gas are produced in the first five years thereby enhancing the early % Liquids (3-Stream) GOR (MCF/BBL) 16 revenue per unit and the resulting economics 80% 14 The GOR increases over time with month one approximately 1 Mcf/Bbl, 12 month twelve approximately 5 Mcf/Bbl, month sixty approximately 8 Mcf/Bbl. 60% GOR 10 In month one, 2-stream production from the well is 82% oil and 3-stream 8 production is 86% liquids 40% 6 (MCF/BBL) In year one, 2-stream production from the well is 66% oil and 3-stream 4 production is 74% liquids 20% 2 The well breaches the 2-stream 50% oil point near the end of year 2 and 3- 0% 0 stream production remains above 50% liquids point for the life of the well 0 12 24 36 48 60 72 84 96 108 120 Months Source: Ryder Scott-audited Reserve Report, Company data. 1 Based on Ryder Scott-audited Reserve Report. Excludes 9 wells with circumstances that will not be repeated due to unacceptable results: i) 4 wells with 660? spacing in a high porosity area, ii) 3 child wells drilled between 2 parent wells without injecting water into the parent wells prior to frac, iii) 1 well which were shut in for more than 90 days after frac, iv) 1 well that fraced into a vertical well and the vertical well was not plugged in the Osage/Meramec. 19 2 LNU17N06W02A Miss well (Ryder Scott-audited Reserve Report).
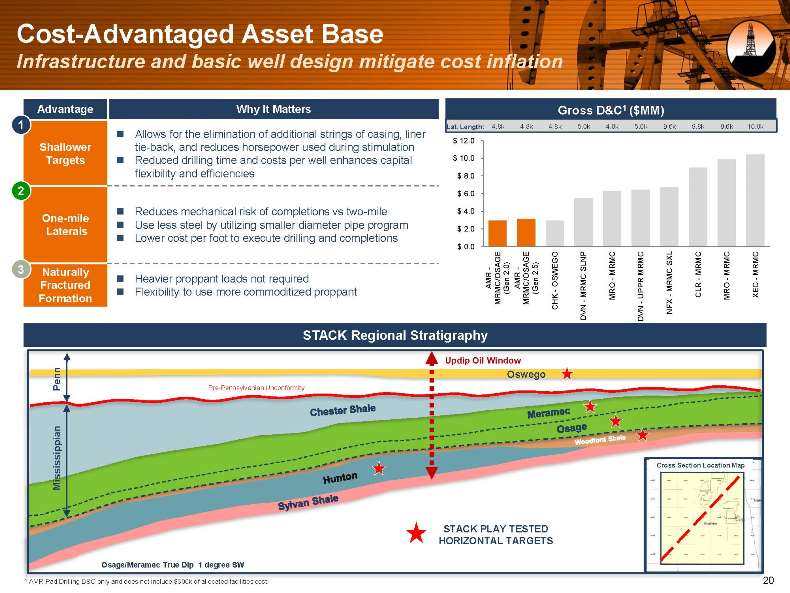
Cost-Advantaged Asset Base Infrastructure and basic well design mitigate cost inflation Advantage Why It Matters Gross D&C1 ($MM) 1 Lat. Length: 4.8k 4.8k 4.8k 5.0k 4.8k 5.0k 9.6k 9.8k 9.6k 10.0k ? Allows for the elimination of additional strings of casing, liner $ 12.0 Shallower tie-back, and reduces horsepower used during stimulation Targets ? Reduced drilling time and costs per well enhances capital $ 10.0 flexibility and efficiencies $ 8.0 2 $ 6.0 ? Reduces mechanical risk of completions vs two-mile $ 4.0 One-mile ? Use less steel by utilizing smaller diameter pipe program $ 2.0 Laterals ? Lower cost per foot to execute drilling and completions $ 0.0 G O NP SXL E — SL 3 Naturally 2.0) 2.5) MRMC MRMC MRMC MRMC MRMC SW C——— ? Heavier proppant loads not required AMR AMR O Fractured—RM RO MRMC RO EC ? Flexibility to use more commoditized proppant (Gen (Gen M— CLR M UPPR M X Formation — MRMC/OSAGE MRMC/OSAGE CHK N FX DV DVN N STACK Regional Stratigraphy Updip Oil Window Oswego Penn Pre-Pennsylvanian Unconformity Mississippian STACK PLAY TESTED HORIZONTAL TARGETS Osage/Meramec True Dip 1 degree SW 1 AMR Pad Drilling D&C only and does not include $300k of allocated facilities cost. 20
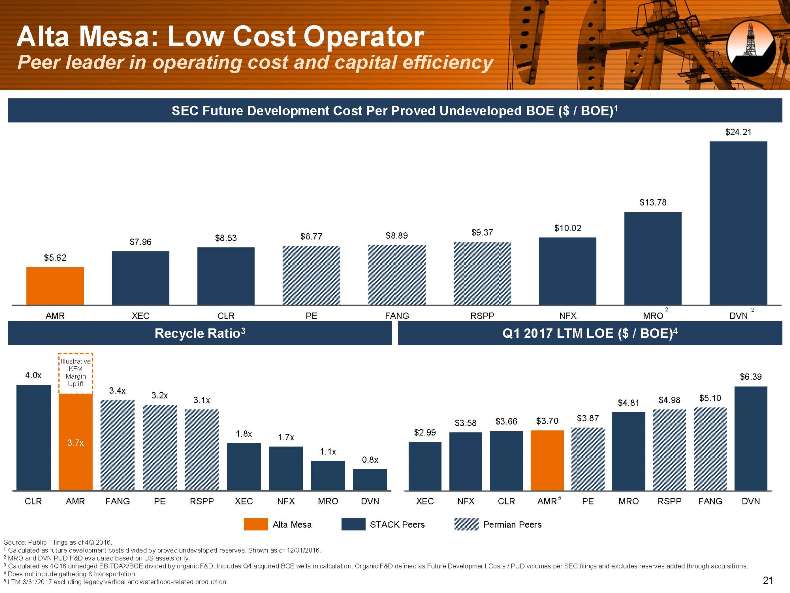
Alta Mesa: Low Cost Operator Peer leader in operating cost and capital efficiency SEC Future Development Cost Per Proved Undeveloped BOE ($ / BOE)1 $24.21 $13.78 $10.02 $8.89 $9.37 $8.53 $8.77 $7.96 $5.62 AMR XEC CLR PE FANG RSPP NFX MRO 2 DVN 2 Recycle Ratio3 Q1 2017 LTM LOE ($ / BOE)4 Illustrative 4.0x KFM Margin $6.39 Uplift 3.4x 3.2x $5.10 3.1x $4.81 $4.98 $3.66 $3.70 $3.87 $3.58 1.8x $2.99 1.7x 3.7x 1.1x 0.8x CLR AMR FANG PE RSPP XEC NFX MRO DVN XEC NFX CLR AMR5 PE MRO RSPP FANG DVN Alta Mesa STACK Peers Permian Peers Source: Public Filings as of 4Q 2016. 1 Calculated as future development costs divided by proved undeveloped reserves. Shown as of 12/31/2016. 2 MRO and DVN PUD F&D evaluated based on US assets only. 3 Calculated as 4Q16 unhedged EBITDAX/BOE divided by organic F&D. Includes Q4 acquired BCE wells in calculation. Organic F&D defined as Future Development Costs / PUD volumes per SEC filings and excludes reserves added through acquisitions. 4 Does not include gathering & transportation. 5 LTM 3/31/2017 excluding legacy vertical and waterflood-related production. 21
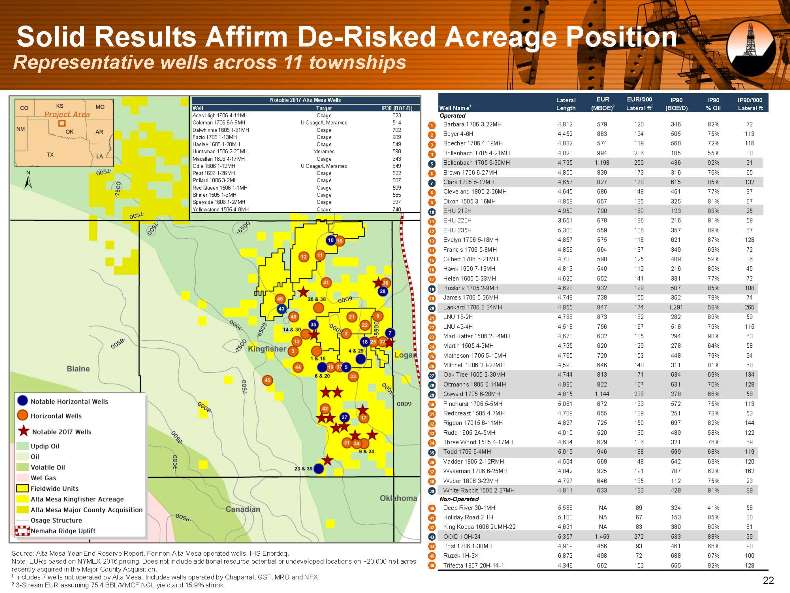
Solid Results Affirm De-Risked Acreage Position Representative wells across 11 townships Notable 2017 Alta Mesa Wells Lateral EUR EUR/‘000 IP90 IP90 IP90/‘000 Well Name1 Length (MBOE)2 Lateral ft2 (BOE/D) % Oil Lateral ft Well Target IP30 (BOE/D) Aces High 1606 4-11MH Osage 823 Operated Coleman 1706 6A-9MH U Osage/L Meramec 514 Barbara 1706 3-22MH 4,812 579 120 346 82% 72 Dalwhinnie 1605 1-31MH Osage 702 1 2 Beyer 4-6H 4,452 863 194 505 75% 113 Fazio 1705 1-13MH Osage 909 Hasley 1605 1-28MH Osage 549 3 Boecher 1706 4-19MH 4,832 574 119 560 72% 116 Huntsman 1506 2-23MH Meramec 598 Bollenbach 1705 4-21MH 4,820 994 206 185 55% 38 Macallan 1806 4-17MH Osage 643 4 5 Bollenbach 1705 6-30MH 4,795 1,198 250 436 92% 91 Odie 1606 1-12MH U Osage/L Meramec 849 Peat 1606 1-26MH Osage 522 6 Brown 1706 6-27MH 4,850 839 173 316 76% 65 Pollard 1805 3-2MH Osage 507 Clark 1705 5-12MH 4,657 827 178 615 85% 132 Red Queen 1506 1-1MH Osage 509 7 8 Cleveland 1805 2-26MH 4,645 686 148 451 77% 97 Shiner 1505 1-3MH Osage 585 Speyside 1606 1-27MH Osage 997 9 Dixon 1505 3-16MH 4,858 657 135 325 81% 67 Yellowstone 1505 4-8MH Osage 740 EHU 219H 4,950 790 160 123 88% 25 10 11 EHU 220H 3,651 678 186 216 91% 59 12 EHU 235H 5,300 559 106 357 89% 67 13 Evelyn 1706 5-18MH 4,857 575 118 621 87% 128 14 Francis 1706 5-8MH 4,856 664 137 349 69% 72 15 Gilbert 1706 6-21MH 4,738 590 125 409 59% 86 16 Hawk 1906 7-13MH 4,813 540 112 216 80% 45 17 Helen 1605 5-33MH 4,620 652 141 331 77% 72 18 Hoskins 1705 2-9MH 4,693 932 199 507 85% 108 19 James 1706 5-26MH 4,748 738 155 352 79% 74 20 Lankard 1706 6-34MH 4,855 847 174 1,291 58% 266 21 LNU 16-2H 4,788 873 182 282 89% 59 22 LNU 49-4H 4,518 756 167 518 79% 115 23 Mad Hatter 1506 2-34MH 4,670 632 135 294 90% 63 24 Martin 1505 4-9MH 4,795 620 129 278 64% 58 25 Matheson 1705 5-10MH 4,765 729 153 448 79% 94 26 Mitchell 1806 2B-27MH 4,598 646 140 311 81% 68 27 Oak Tree 1605 2-30MH 4,744 813 171 634 69% 134 28 Oltmanns 1805 6-14MH 4,930 822 167 631 70% 128 29 Oswald 1705 6-28MH 4,815 1,144 238 278 66% 58 30 Pinehurst 1706 5-5MH 5,061 672 133 572 75% 113 31 Redbreast 1505 4-7MH 4,709 655 139 251 73% 53 32 Rigdon 17015 6-11MH 4,827 725 150 697 82% 144 33 Rudd 1605 2A-5MH 4,010 520 130 489 58% 122 34 Three Wood 1505 4-17MH 4,634 629 136 321 76% 69 35 Todd 1706 6-4MH 5,019 946 188 599 68% 119 36 Vadder 1805 2-12RMH 4,504 669 148 542 63% 120 37 Wakeman 1706 6-25MH 4,842 925 191 787 62% 162 38 Weber 1806 3-22MH 4,797 646 135 112 75% 23 39 White Rabbit 1506 2-27MH 4,811 633 132 428 91% 89 Non-Operated 40 Deep River 30-1MH 5,586 NA 89 324 41% 58 41 Holiday Road 2-1H 5,100 NA 67 153 85% 30 42 King Koopa 1606 2UMH-22 4,691 NA 83 380 60% 81 43 OOID 1OH-24 5,357 1,459 272 533 88% 99 44 Post 1706 1-30MH 4,919 456 93 461 66% 90 Source: Alta Mesa Year-End Reserve Report. For non-Alta Mesa operated wells, IHS Enerdeq. Note: EURs based on NYMEX 2016 pricing. Does not include additional resource potential or undeveloped locations on ~20,000 net acres 45 Ruzek 1H-3X 6,872 498 72 688 67% 100 46 Trifecta 1807 20H-14-1 4,346 662 152 555 92% 128 recently acquired in the Major County Acquisition. 1 Includes 7 wells not operated by Alta Mesa. Includes wells operated by Chaparral, GST, MRO and NFX. 22 2 3-Stream EUR assuming 75.4 BBL/MMCF NGL yield and 15.9% shrink.
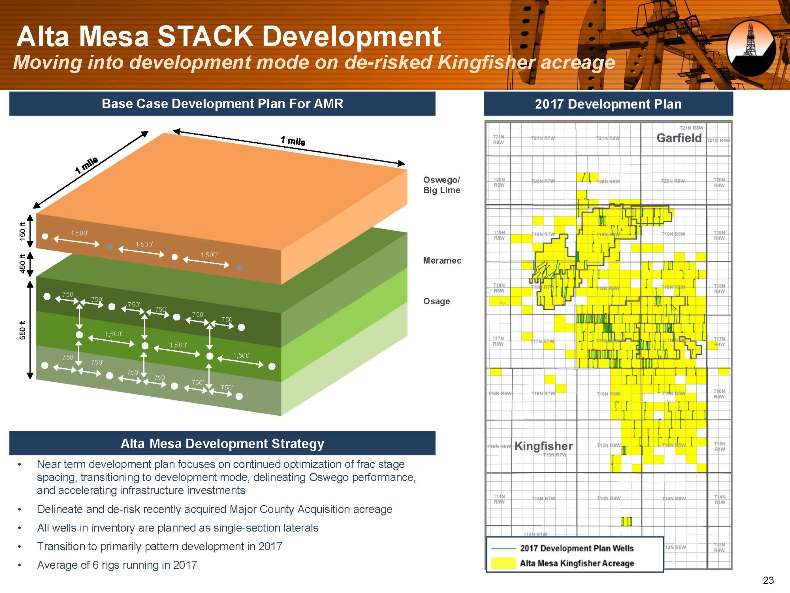
Alta Mesa STACK Development Moving into development mode on de-risked Kingfisher acreage Base Case Development Plan For AMR 2017 Development Plan Oswego/ Big Lime ft 150 1,500? 1,500? ft 1,500? 450 Meramec 750? 750? Osage 750? 750? 750? ft 750? 550 1,500? 1,500? 750? 1,500? 750? 750? 750? 750? 750? Alta Mesa Development Strategy Near term development plan focuses on continued optimization of frac stage spacing, transitioning to development mode, delineating Oswego performance, and accelerating infrastructure investments Delineate and de-risk recently acquired Major County Acquisition acreage All wells in inventory are planned as single-section laterals Transition to primarily pattern development in 2017 Average of 6 rigs running in 2017 23
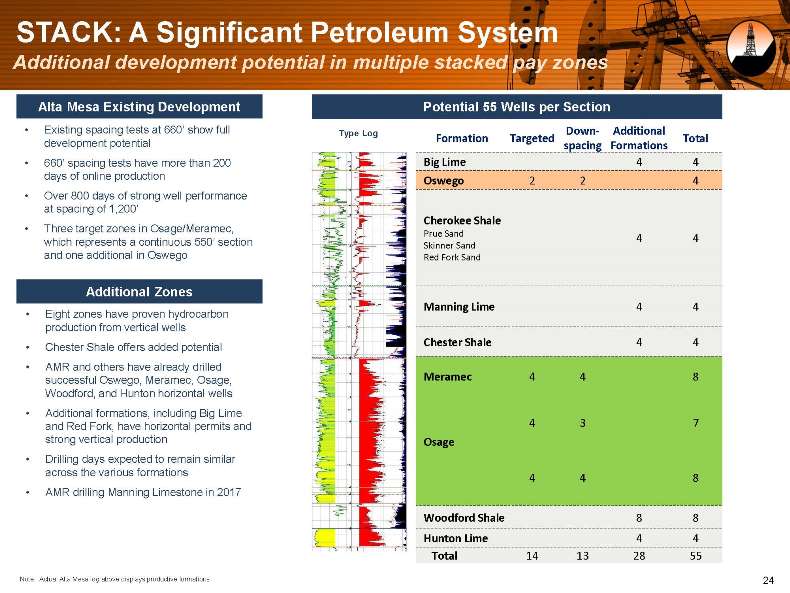
STACK: A Significant Petroleum System Additional development potential in multiple stacked pay zones Alta Mesa Existing Development Potential 55 Wells per Section Existing spacing tests at 660? show full Type Log Down- Additional development potential Formation Targeted Total spacing Formations 660? spacing tests have more than 200 Big Lime 4 4 days of online production Oswego 2 2 4 Over 800 days of strong well performance at spacing of 1,200? Cherokee Shale Three target zones in Osage/Meramec, Prue Sand which represents a continuous 550? section 4 4 Skinner Sand and one additional in Oswego Red Fork Sand Additional Zones Manning Lime 4 4 Eight zones have proven hydrocarbon production from vertical wells Chester Shale offers added potential Chester Shale 4 4 AMR and others have already drilled successful Oswego, Meramec, Osage, Meramec 4 4 8 Woodford, and Hunton horizontal wells Additional formations, including Big Lime and Red Fork, have horizontal permits and 4 3 7 strong vertical production Osage Drilling days expected to remain similar across the various formations 4 4 8 AMR drilling Manning Limestone in 2017 Woodford Shale 8 8 Hunton Lime 4 4 Total 14 13 28 55 Note: Actual Alta Mesa log above displays productive formations. 24
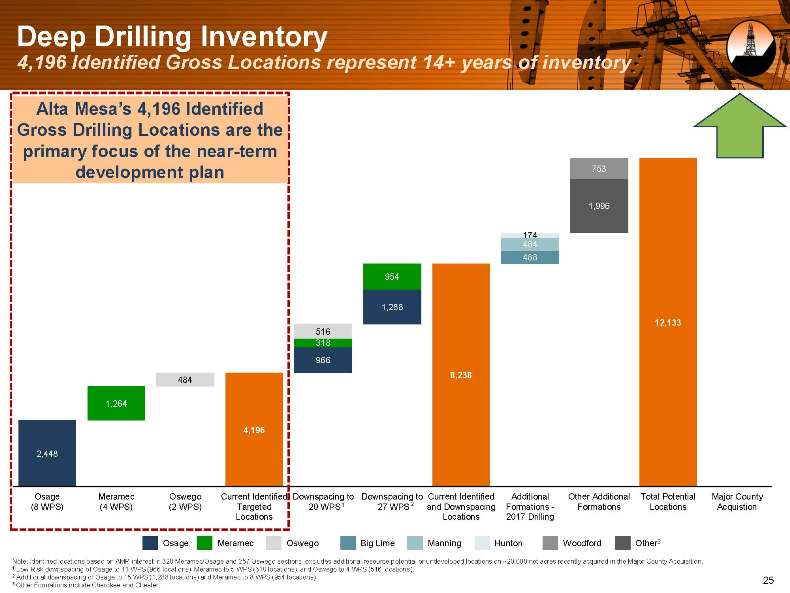
Deep Drilling Inventory 4,196 Identified Gross Locations represent 14+ years of inventory Alta Mesa?s 4,196 Identified Gross Drilling Locations are the primary focus of the near-term development plan 753 1,996 174 484 488 954 1,288 12,133 516 318 966 8,238 484 1,264 4,196 2,448 Osage Meramec Oswego Current Identified Downspacing to Downspacing to Current Identified Additional Other Additional Total Potential Major County (8 WPS) (4 WPS) (2 WPS) Targeted 20 WPS1 27 WPS 2 and Downspacing Formations—Formations Locations Acquistion Locations Locations 2017 Drilling Osage Meramec Oswego Big Lime Manning Hunton Woodford Other3 Note: Identified locations based on AMR interest in 320 Meramec/Osage and 257 Oswego sections; excludes additional resource potential or undeveloped locations on ~20,000 net acres recently acquired in the Major County Acquisition. 1 Low Risk downspacing of Osage to 11 WPS (966 locations), Meramec to 5 WPS (318 locations), and Oswego to 4 WPS (516 locations). 2 Additional downspacing of Osage to 15 WPS (1,288 locations) and Meramec to 8 WPS (954 locations). 25 3 Other Formations include Cherokee and Chester.
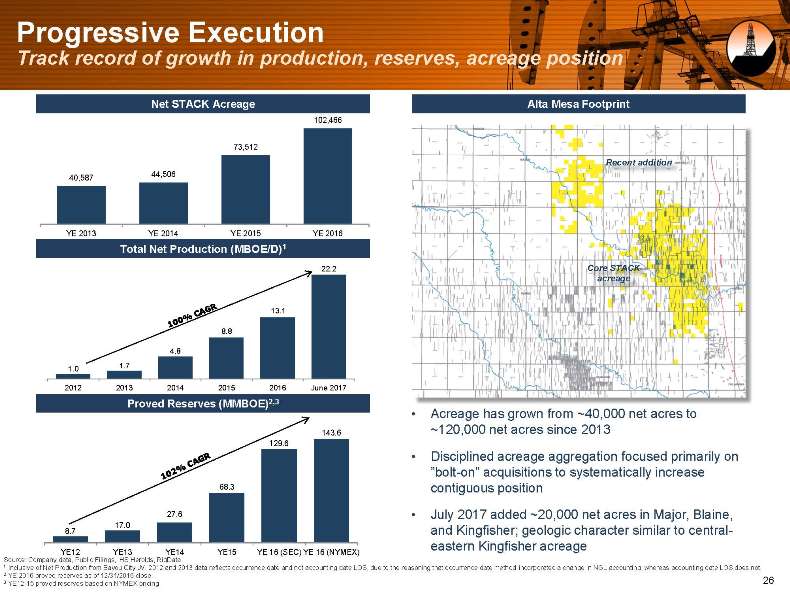
Progressive Execution Track record of growth in production, reserves, acreage position Net STACK Acreage Alta Mesa Footprint 102,466 73,512 Recent addition 44,506 40,587 YE 2013 YE 2014 YE 2015 YE 2016 Total Net Production (MBOE/D)1 22.2 Core STACK acreage 13.1 8.8 4.8 1.0 1.7 2012 2013 2014 2015 2016 June 2017 Proved Reserves (MMBOE)2,3 Acreage has grown from ~40,000 net acres to 143.6 ~120,000 net acres since 2013 129.6 Disciplined acreage aggregation focused primarily on ?bolt-on? acquisitions to systematically increase 68.3 contiguous position 27.6 July 2017 added ~20,000 net acres in Major, Blaine, 17.0 8.7 and Kingfisher; geologic character similar to central-eastern Kingfisher acreage YE12 YE13 YE14 YE15 YE 16 (SEC) YE 16 (NYMEX) Source: Company data, Public Filings, IHS Herolds, RigData. 1 Inclusive of Net Production from Bayou City JV. 2012 and 2013 data reflects occurrence date and not accounting date LOS, due to the reasoning that occurrence date method incorporated a change in NGL accounting; whereas accounting date LOS does not. 2 YE 2016 proved reserves as of 12/31/2016 close. 3 YE12-15 proved reserves based on NYMEX pricing. 26
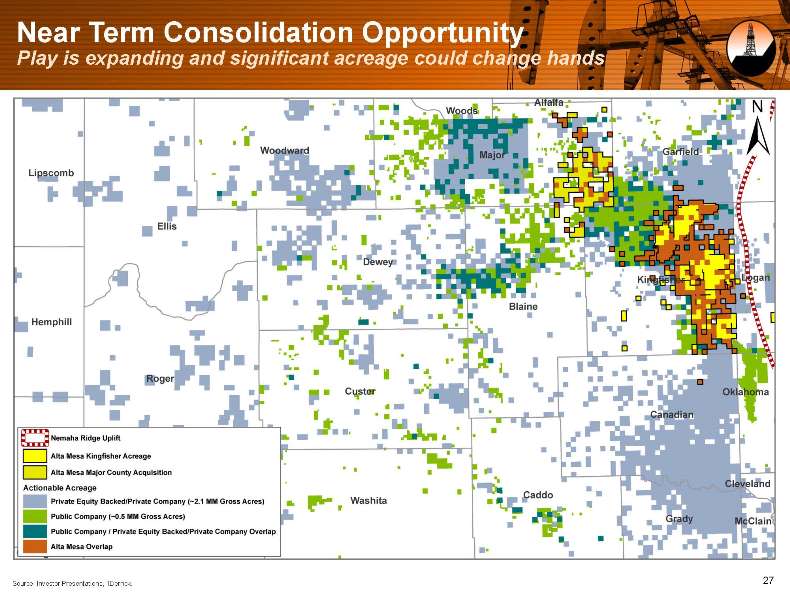
Near Term Consolidation Opportunity Play is expanding and significant acreage could change hands Source: Investor Presentations, 1Derrick. 27
Our Midstream Assets
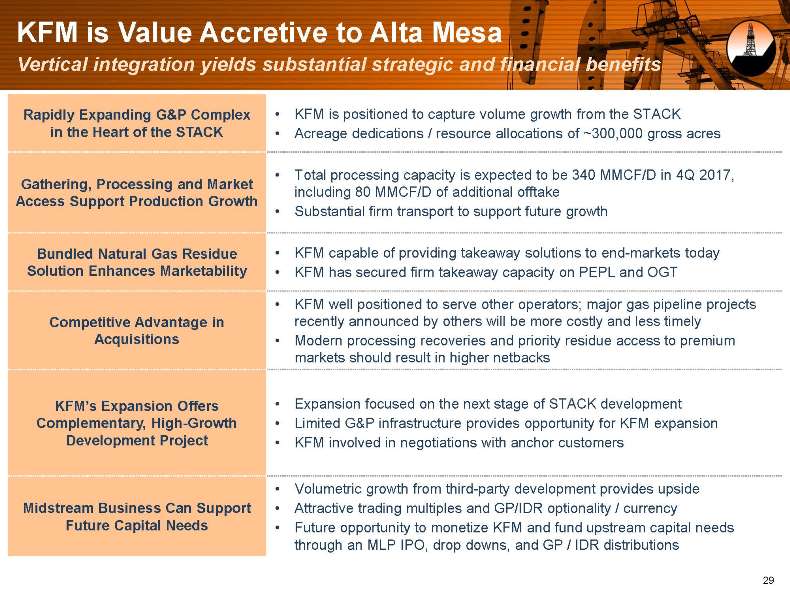
KFM is Value Accretive to Alta Mesa Vertical integration yields substantial strategic and financial benefits Rapidly Expanding G&P Complex KFM is positioned to capture volume growth from the STACK in the Heart of the STACK Acreage dedications / resource allocations of ~300,000 gross acres Total processing capacity is expected to be 340 MMCF/D in 4Q 2017, Gathering, Processing and Market including 80 MMCF/D of additional offtake Access Support Production Growth Substantial firm transport to support future growth Bundled Natural Gas Residue KFM capable of providing takeaway solutions to end-markets today Solution Enhances Marketability KFM has secured firm takeaway capacity on PEPL and OGT KFM well positioned to serve other operators; major gas pipeline projects Competitive Advantage in recently announced by others will be more costly and less timely Acquisitions Modern processing recoveries and priority residue access to premium markets should result in higher netbacks KFM?s Expansion Offers Expansion focused on the next stage of STACK development Complementary, High-Growth Limited G&P infrastructure provides opportunity for KFM expansion Development Project KFM involved in negotiations with anchor customers Volumetric growth from third-party development provides upside Midstream Business Can Support Attractive trading multiples and GP/IDR optionality / currency Future Capital Needs Future opportunity to monetize KFM and fund upstream capital needs through an MLP IPO, drop downs, and GP / IDR distributions 29
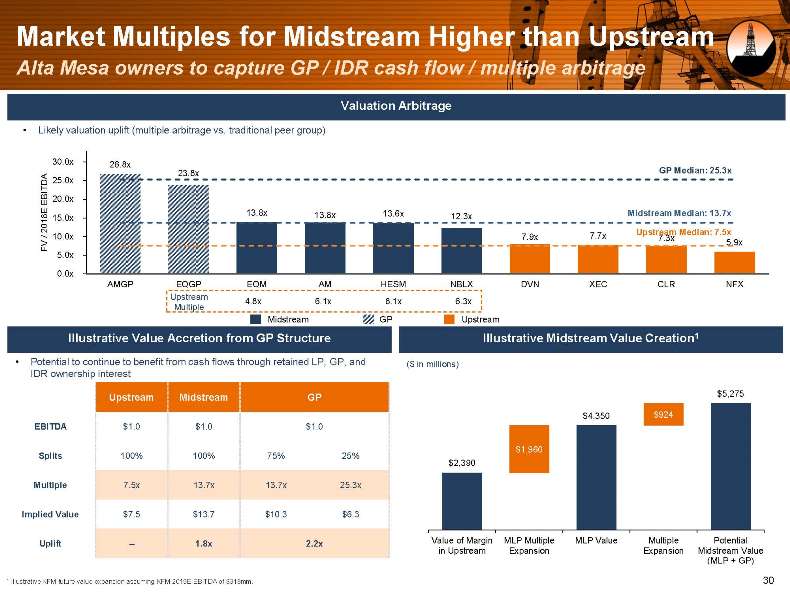
Market Multiples for Midstream Higher than Upstream Alta Mesa owners to capture GP / IDR cash flow / multiple arbitrage Valuation Arbitrage Likely valuation uplift (multiple arbitrage vs. traditional peer group) 30.0x 26.8x A 23.8x GP Median: 25.3x ITD 25.0x E B 20.0x E 13.8x 13.8x 13.6x 12.3x Midstream Median: 13.7x 2018 15.0x / 7.7x Upstream Median: 7.5x 10.0x 7.9x 7.3x FV 5.9x 5.0x 0.0x AMGP EQGP EQM AM HESM NBLX DVN XEC CLR NFX Upstream 4.8x 6.1x 8.1x 6.3x Multiple Midstream GP Upstream Illustrative Value Accretion from GP Structure Illustrative Midstream Value Creation1 Potential to continue to benefit from cash flows through retained LP, GP, and ($ in millions) IDR ownership interest $5,275 r Upstream Midstream GP $4,350 $924 EBITDA $1.0 $1.0 $1.0 $1,960 Splits 100% 100% 75% 25% $2,390 Multiple 7.5x 13.7x 13.7x 25.3x Implied Value $7.5 $13.7 $10.3 $6.3 Uplift — 1.8x 2.2x Value of Margin MLP Multiple MLP Value Multiple Potential in Upstream Expansion Expansion Midstream Value (MLP + GP) 1 Illustrative KFM future value expansion assuming KFM 2019E EBITDA of $318mm. 30
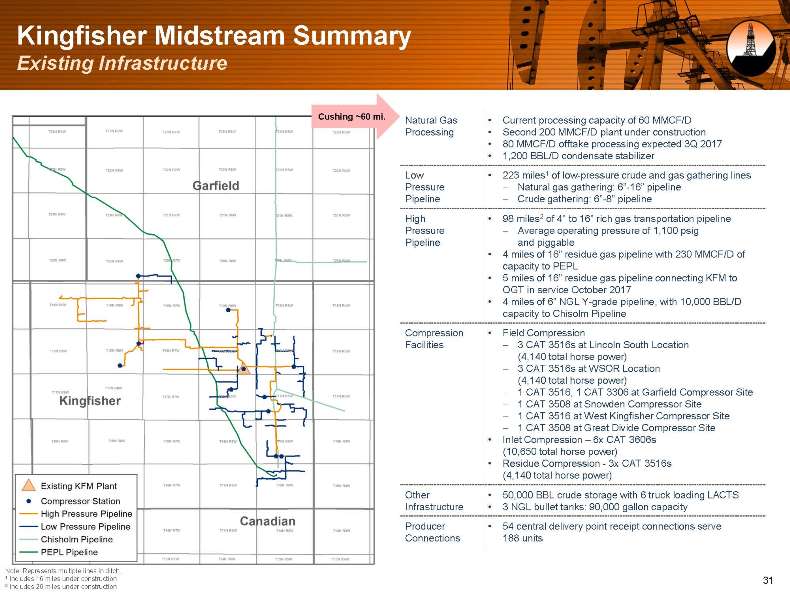
Kingfisher Midstream Summary Existing Infrastructure Cushing ~60 mi. Natural Gas Current processing capacity of 60 MMCF/D Processing Second 200 MMCF/D plant under construction 80 MMCF/D offtake processing expected 3Q 2017 1,200 BBL/D condensate stabilizer Low 223 miles1 of low-pressure crude and gas gathering lines Pressure—Natural gas gathering: 6?-16? pipeline Pipeline—Crude gathering: 6?-8? pipeline High 98 miles2 of 4? to 16? rich gas transportation pipeline Pressure—Average operating pressure of 1,100 psig Pipeline and piggable 4 miles of 16? residue gas pipeline with 230 MMCF/D of capacity to PEPL 5 miles of 16? residue gas pipeline connecting KFM to OGT in service October 2017 4 miles of 6? NGL Y-grade pipeline, with 10,000 BBL/D capacity to Chisolm Pipeline Compression Field Compression Facilities—3 CAT 3516s at Lincoln South Location (4,140 total horse power)—3 CAT 3516s at WSOR Location (4,140 total horse power) —1 CAT 3516, 1 CAT 3306 at Garfield Compressor Site—1 CAT 3508 at Snowden Compressor Site—1 CAT 3516 at West Kingfisher Compressor Site—1 CAT 3508 at Great Divide Compressor Site Inlet Compression ? 6x CAT 3606s (10,650 total horse power) Residue Compression—3x CAT 3516s (4,140 total horse power) Other 50,000 BBL crude storage with 6 truck loading LACTS Infrastructure 3 NGL bullet tanks: 90,000 gallon capacity Producer 54 central delivery point receipt connections serve Connections 188 units Note: Represents multiple lines in ditch. 1 Includes 16 miles under construction 31 2 Includes 20 miles under construction
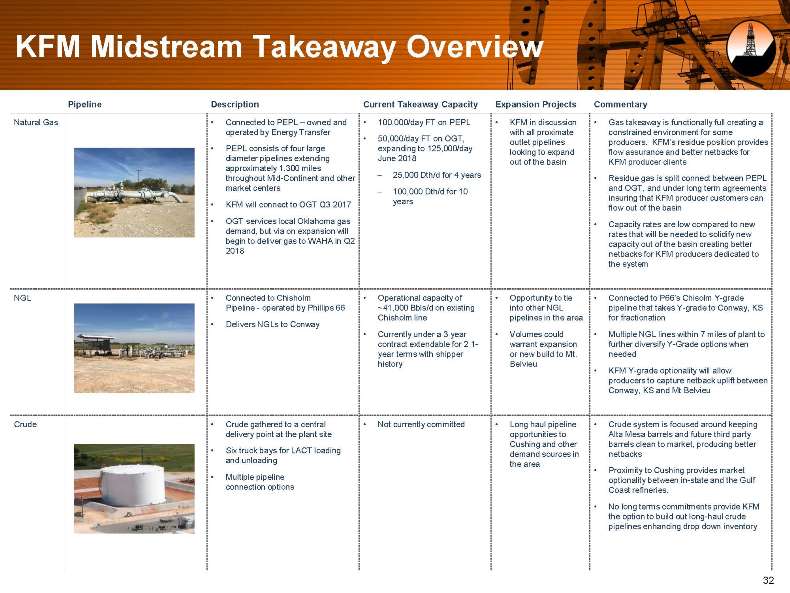
KFM Midstream Takeaway Overview Pipeline Description Current Takeaway Capacity Expansion Projects Commentary Natural Gas Connected to PEPL ? owned and 100,000/day FT on PEPL KFM in discussion Gas takeaway is functionally full creating a operated by Energy Transfer with all proximate constrained environment for some 50,000/day FT on OGT, outlet pipelines producers. KFM?s residue position provides PEPL consists of four large expanding to 125,000/day looking to expand flow assurance and better netbacks for diameter pipelines extending June 2018 out of the basin KFM producer clients approximately 1,300 miles throughout Mid-Continent and other—25,000 Dth/d for 4 years Residue gas is split connect between PEPL market centers—100,000 Dth/d for 10 and OGT, and under long term agreements years insuring that KFM producer customers can KFM will connect to OGT Q3 2017 flow out of the basin OGT services local Oklahoma gas Capacity rates are low compared to new demand, but via on expansion will rates that will be needed to solidify new begin to deliver gas to WAHA in Q2 capacity out of the basin creating better 2018 netbacks for KFM producers dedicated to the system NGL Connected to Chisholm Operational capacity of Opportunity to tie Connected to P66?s Chisolm Y-grade Pipeline—operated by Phillips 66 ~41,000 Bbls/d on existing into other NGL pipeline that takes Y-grade to Conway, KS Chisholm line pipelines in the area for fractionation Delivers NGLs to Conway Currently under a 3 year Volumes could Multiple NGL lines within 7 miles of plant to contract extendable for 2 1- warrant expansion further diversify Y-Grade options when year terms with shipper or new build to Mt. needed history Belvieu KFM Y-grade optionality will allow producers to capture netback uplift between Conway, KS and Mt Belvieu Crude Crude gathered to a central Not currently committed Long haul pipeline Crude system is focused around keeping delivery point at the plant site opportunities to Alta Mesa barrels and future third party Cushing and other barrels clean to market, producing better Six truck bays for LACT loading demand sources in netbacks and unloading the area Proximity to Cushing provides market Multiple pipeline optionality between in-state and the Gulf connection options Coast refineries. No long terms commitments provide KFM the option to build out long-haul crude pipelines enhancing drop down inventory 32
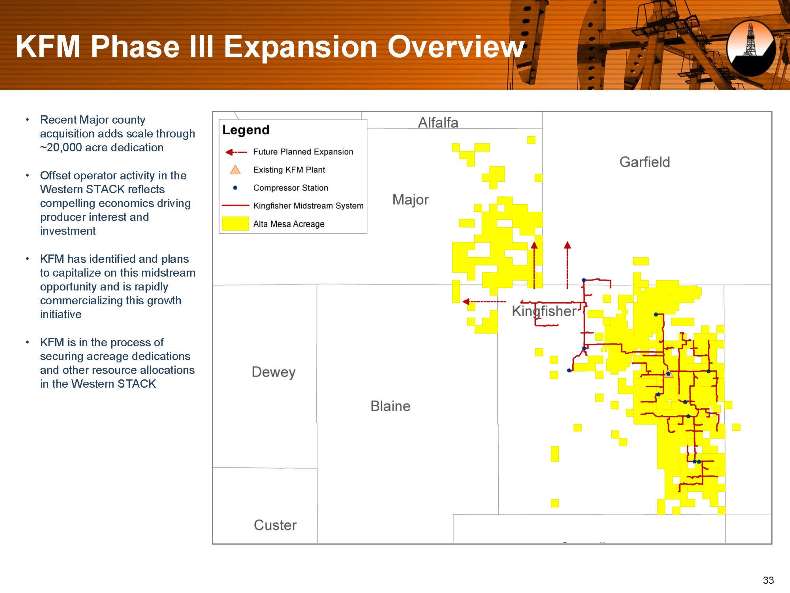
KFM Phase III Expansion Overview Recent Major county acquisition adds scale through ~20,000 acre dedication Offset operator activity in the Western STACK reflects compelling economics driving producer interest and investment KFM has identified and plans to capitalize on this midstream opportunity and is rapidly commercializing this growth initiative KFM is in the process of securing acreage dedications and other resource allocations in the Western STACK 33
Financial Summary
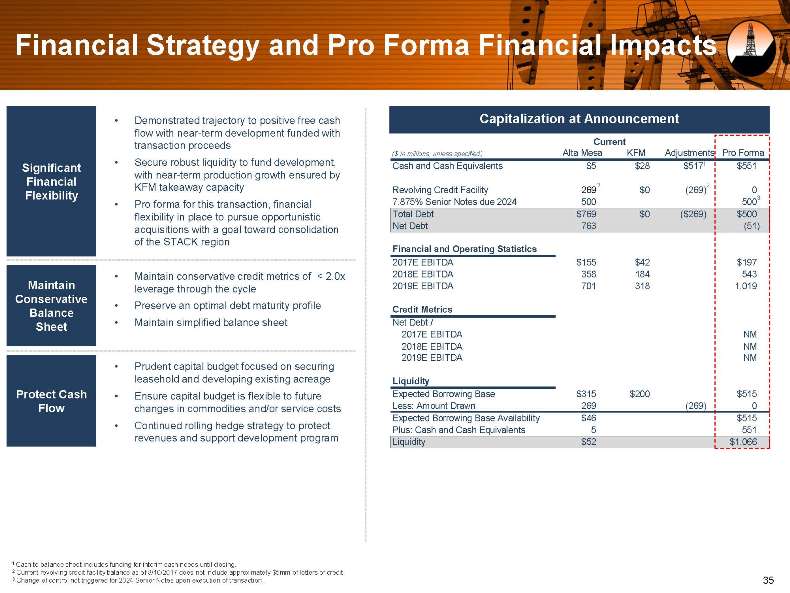
Financial Strategy and Pro Forma Financial Impacts Demonstrated trajectory to positive free cash Capitalization at Announcement flow with near-term development funded with transaction proceeds Current ($ in millions, unless specified) Alta Mesa KFM Adjustments Pro Forma Significant Secure robust liquidity to fund development, Cash and Cash Equivalents $5 $28 $5171 $551 with near-term production growth ensured by Financial 2 2 KFM takeaway capacity Revolving Credit Facility 269 $0 (269) 0 Flexibility 3 Pro forma for this transaction, financial 7.875% Senior Notes due 2024 500 500 flexibility in place to pursue opportunistic Total Debt $769 $0 ($269) $500 acquisitions with a goal toward consolidation Net Debt 763 (51) of the STACK region Financial and Operating Statistics 2017E EBITDA $155 $42 $197 Maintain conservative credit metrics of < 2.0x 2018E EBITDA 358 184 543 Maintain leverage through the cycle 2019E EBITDA 701 318 1,019 Conservative Preserve an optimal debt maturity profile Credit Metrics Balance Sheet Maintain simplified balance sheet Net Debt / 2017E EBITDA NM 2018E EBITDA NM Prudent capital budget focused on securing 2019E EBITDA NM leasehold and developing existing acreage Liquidity Protect Cash Ensure capital budget is flexible to future Expected Borrowing Base $315 $200 $515 Flow changes in commodities and/or service costs Less: Amount Drawn 269 (269) 0 Expected Borrowing Base Availability $46 $515 Continued rolling hedge strategy to protect Plus: Cash and Cash Equivalents 5 551 revenues and support development program Liquidity $52 $1,066 1 Cash to balance sheet includes funding for interim cash needs until closing. 2 Current revolving credit facility balance as of 8/10/2017 does not include approximately $5mm of letters of credit. 3 Change of control not triggered for 2024 Senior Notes upon execution of transaction. 35
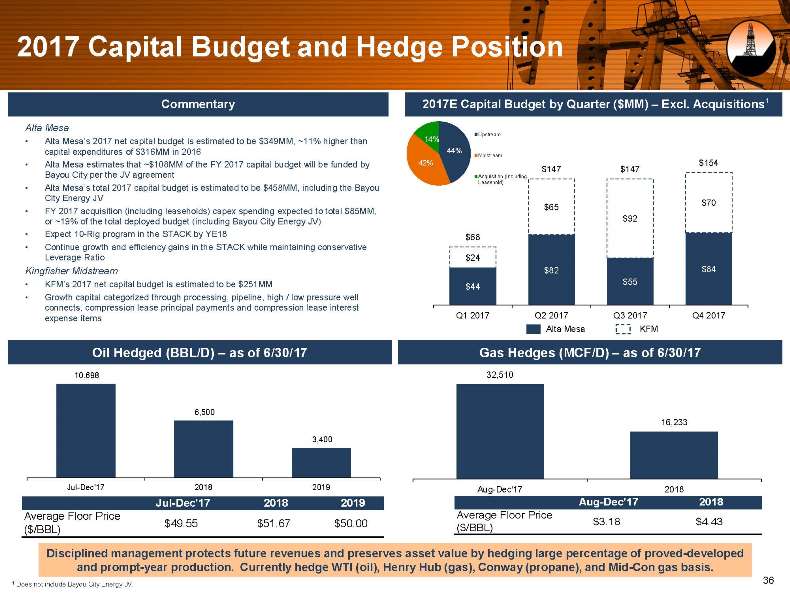
2017 Capital Budget and Hedge Position Commentary 2017E Capital Budget by Quarter ($MM) ? Excl. Acquisitions1 Alta Mesa Upstream Alta Mesa?s 2017 net capital budget is estimated to be $349MM, ~11% higher than 14% capital expenditures of $316MM in 2016 44% Midstream Alta Mesa estimates that ~$108MM of the FY 2017 capital budget will be funded by 42% $154 $147 $147 Bayou City per the JV agreement Acquisition (Including Leasehold) Alta Mesa?s total 2017 capital budget is estimated to be $458MM, including the Bayou City Energy JV $70 $65 FY 2017 acquisition (including leaseholds) capex spending expected to total $85MM, $92 or ~19% of the total deployed budget (including Bayou City Energy JV) Expect 10-Rig program in the STACK by YE18 $68 Continue growth and efficiency gains in the STACK while maintaining conservative Leverage Ratio $24 Kingfisher Midstream $82 $84 KFM?s 2017 net capital budget is estimated to be $251MM $55 $44 Growth capital categorized through processing, pipeline, high / low pressure well connects, compression lease principal payments and compression lease interest Q1 2017 Q2 2017 Q3 2017 Q4 2017 expense items Alta Mesa KFM Oil Hedged (BBL/D) ? as of 6/30/17 Gas Hedges (MCF/D) ? as of 6/30/17 10,698 32,510 6,500 16,233 3,400 Jul-Dec’17 2018 2019 Aug-Dec’17 2018 Jul-Dec’17 2018 2019 Aug-Dec’17 2018 Average Floor Price Average Floor Price $49.55 $51.67 $50.00 $3.18 $4.43 ($/BBL) ($/BBL) Disciplined management protects future revenues and preserves asset value by hedging large percentage of proved-developed and prompt-year production. Currently hedge WTI (oil), Henry Hub (gas), Conway (propane), and Mid-Con gas basis. 1 36 Does not include Bayou City Energy JV.
Valuation and Timeline
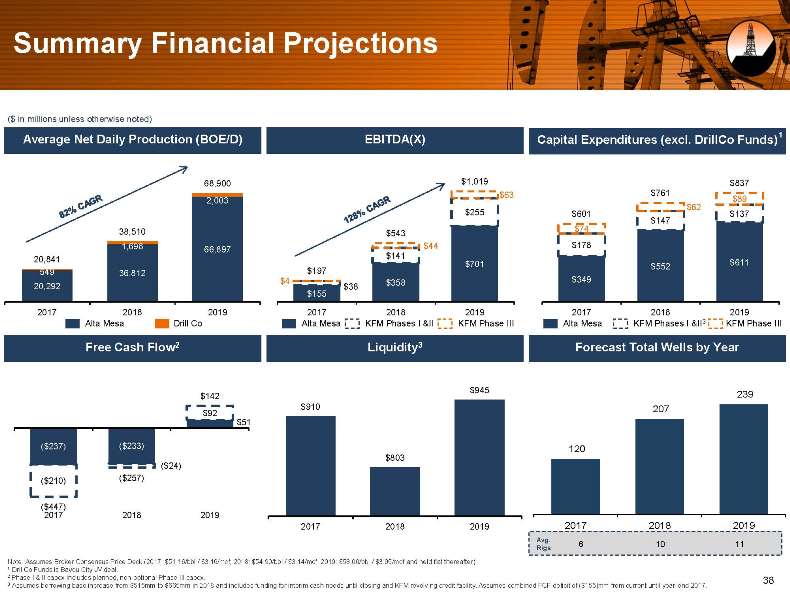
Summary Financial Projections ($ in millions unless otherwise noted) Average Net Daily Production (BOE/D) EBITDA(X) Capital Expenditures (excl. DrillCo Funds) 1 68,900 $1,019 $837 $63 $761 2,003 $62 $89 $255 $601 $137 $74 $147 38,510 $543 1,698 $44 $178 66,897 20,841 $141 $701 $552 $611 549 36,812 $197 $4 $358 $349 20,292 $155 $38 2017 2018 2019 2017 2018 2019 2017 2018 2019 Alta Mesa Drill Co Alta Mesa KFM Phases I &II KFM Phase III Alta Mesa KFM Phases I &II3 KFM Phase III Free Cash Flow2 Liquidity3 Forecast Total Wells by Year $945 239 $142 $910 207 $92 $51 ($237) ($233) 120 ($24) $803 ($210) ($257) (2017 $447) 2018 2019 2017 2018 2019 2017 2018 2019 Avg. 6 10 11 Rigs Note: Assumes Broker Consensus Price Deck (2017: $51.16/bbl / $3.16/mcf; 2018: $54.90/bbl / $3.14/mcf; 2019: $58.00/bbl / $3.05/mcf and held flat thereafter). 1 DrillCo Funds is Bayou City JV deal. 2 Phase I & II capex includes planned, non-optional Phase III capex. 38 3 Assumes borrowing base increase from $515mm to $665mm in 2018 and includes funding for interim cash needs until closing and KFM revolving credit facility. Assumes combined FCF deficit of ($155)mm from current until year-end 2017.
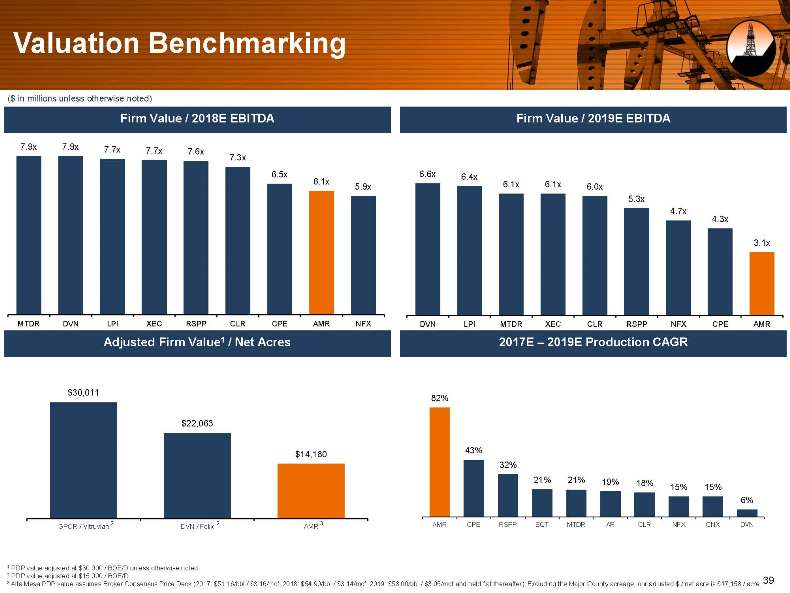
Valuation Benchmarking ($ in millions unless otherwise noted) Firm Value / 2018E EBITDA Firm Value / 2019E EBITDA 7.9x 7.9x 7.7x 7.7x 7.6x 7.3x 6.5x 6.1x 6.6x 6.4x 5.9x 6.1x 6.1x 6.0x 5.3x 4.7x 4.3x 3.1x MTDR DVN LPI XEC RSPP CLR CPE AMR NFX DVN LPI MTDR XEC CLR RSPP NFX CPE AMR Adjusted Firm Value1 / Net Acres 2017E ? 2019E Production CAGR $30,011 82% $22,063 $14,180 43% 32% 21% 21% 19% 18% 15% 15% 6% GPOR / Vitruvian 2 DVN / Felix 2 AMR 3 AMR CPE RSPP EQT MTDR AR CLR NFX CNX DVN 1 PDP value adjusted at $30,000 / BOE/D unless otherwise noted. 2 PDP value adjusted at $15,000 / BOE/D. 3 Alta Mesa PDP value assumes Broker Consensus Price Deck (2017: $51.16/bbl / $3.16/mcf; 2018: $54.90/bbl / $3.14/mcf; 2019: $58.00/bbl / $3.05/mcf and held flat thereafter). Excluding the Major County acreage, our adjusted $ / net acre is $17,158 / acre. 39
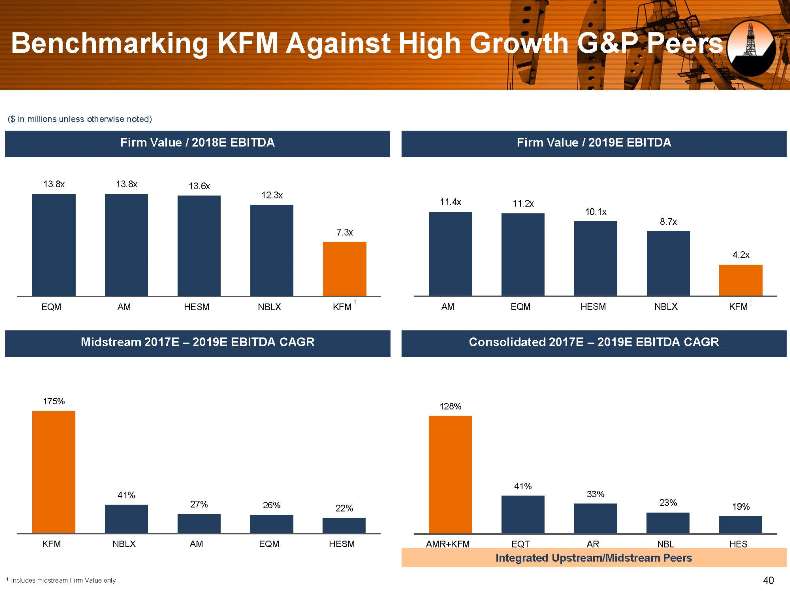
Benchmarking KFM Against High Growth G&P Peers ($ in millions unless otherwise noted) Firm Value / 2018E EBITDA Firm Value / 2019E EBITDA 13.8x 13.8x 13.6x 12.3x 11.4x 11.2x 10.1x 8.7x 7.3x 4.2x 1 1 EQM AM HESM NBLX KFM AM EQM HESM NBLX KFM Midstream 2017E ? 2019E EBITDA CAGR Consolidated 2017E ? 2019E EBITDA CAGR 175% 128% 41% 33% 41% 23% 27% 26% 22% 19% KFM NBLX AM EQM HESM AMR+KFM EQT AR NBL HES Integrated Upstream/Midstream Peers 1 Includes midstream Firm Value only. 40
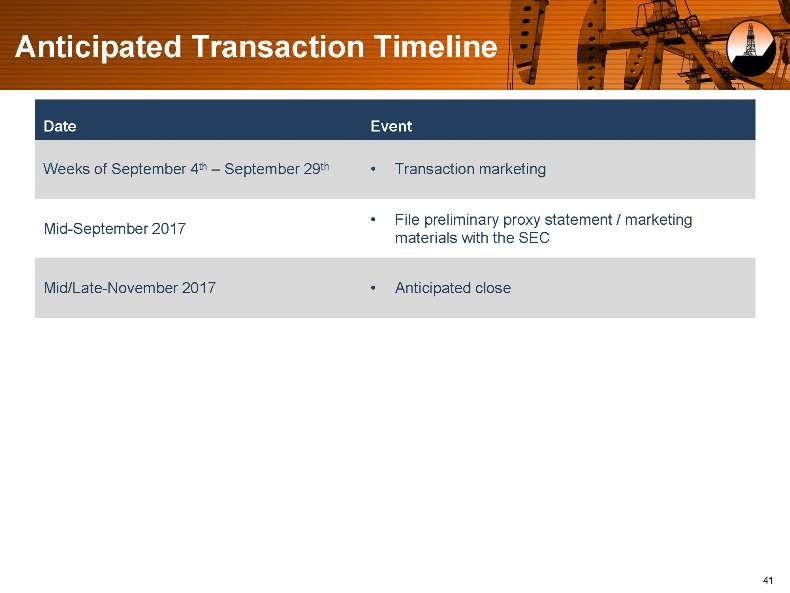
Anticipated Transaction Timeline Date Event Weeks of September 4th ? September 29th Transaction marketing File preliminary proxy statement / marketing Mid-September 2017 materials with the SEC Mid/Late-November 2017 Anticipated close 41
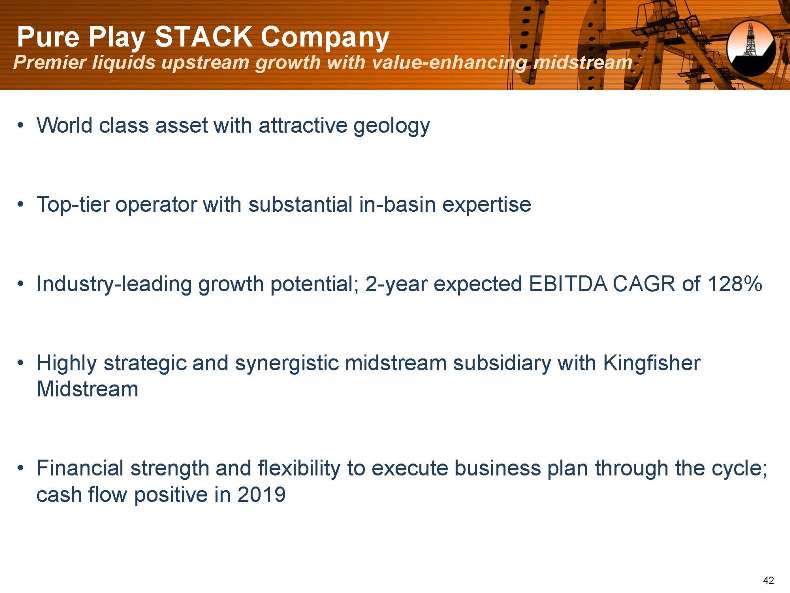
Pure Play STACK Company Premier liquids upstream growth with value-enhancing midstream World class asset with attractive geology Top-tier operator with substantial in-basin expertise Industry-leading growth potential; 2-year expected EBITDA CAGR of 128% Highly strategic and synergistic midstream subsidiary with Kingfisher Midstream Financial strength and flexibility to execute business plan through the cycle; cash flow positive in 2019 42
Appendix
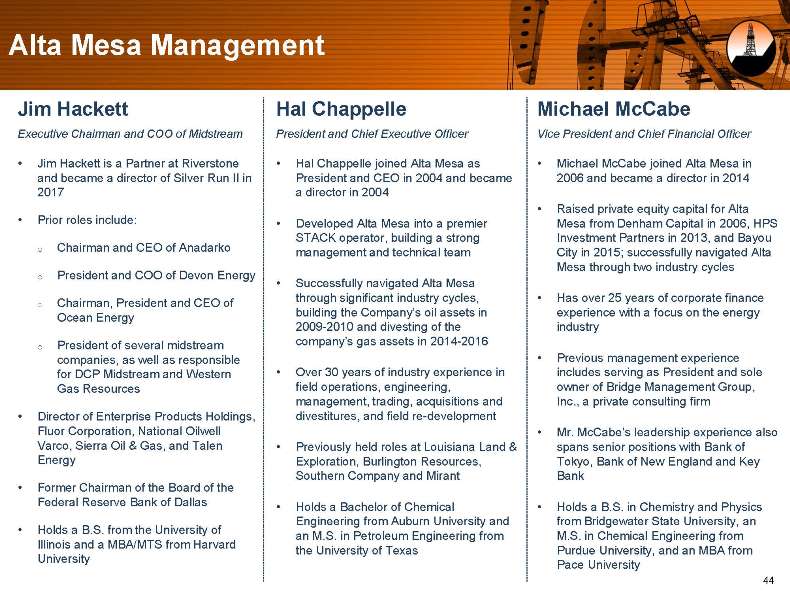
Alta Mesa Management Jim Hackett Hal Chappelle Michael McCabe Executive Chairman and COO of Midstream President and Chief Executive Officer Vice President and Chief Financial Officer Jim Hackett is a Partner at Riverstone Hal Chappelle joined Alta Mesa as Michael McCabe joined Alta Mesa in and became a director of Silver Run II in President and CEO in 2004 and became 2006 and became a director in 2014 2017 a director in 2004 Raised private equity capital for Alta Prior roles include: Developed Alta Mesa into a premier Mesa from Denham Capital in 2006, HPS STACK operator, building a strong Investment Partners in 2013, and Bayou o Chairman and CEO of Anadarko management and technical team City in 2015; successfully navigated Alta Mesa through two industry cycles o President and COO of Devon Energy Successfully navigated Alta Mesa Chairman, President and CEO of through significant industry cycles, Has over 25 years of corporate finance o Ocean Energy building the Company?s oil assets in experience with a focus on the energy 2009-2010 and divesting of the industry company?s gas assets in 2014-2016 o President of several midstream companies, as well as responsible Previous management experience for DCP Midstream and Western Over 30 years of industry experience in includes serving as President and sole Gas Resources field operations, engineering, owner of Bridge Management Group, management, trading, acquisitions and Inc., a private consulting firm Director of Enterprise Products Holdings, divestitures, and field re-development Fluor Corporation, National Oilwell Mr. McCabe?s leadership experience also Varco, Sierra Oil & Gas, and Talen Previously held roles at Louisiana Land & spans senior positions with Bank of Energy Exploration, Burlington Resources, Tokyo, Bank of New England and Key Southern Company and Mirant Bank Former Chairman of the Board of the Federal Reserve Bank of Dallas Holds a Bachelor of Chemical Holds a B.S. in Chemistry and Physics Engineering from Auburn University and from Bridgewater State University, an Holds a B.S. from the University of an M.S. in Petroleum Engineering from M.S. in Chemical Engineering from Illinois and a MBA/MTS from Harvard the University of Texas Purdue University, and an MBA from University Pace University 44
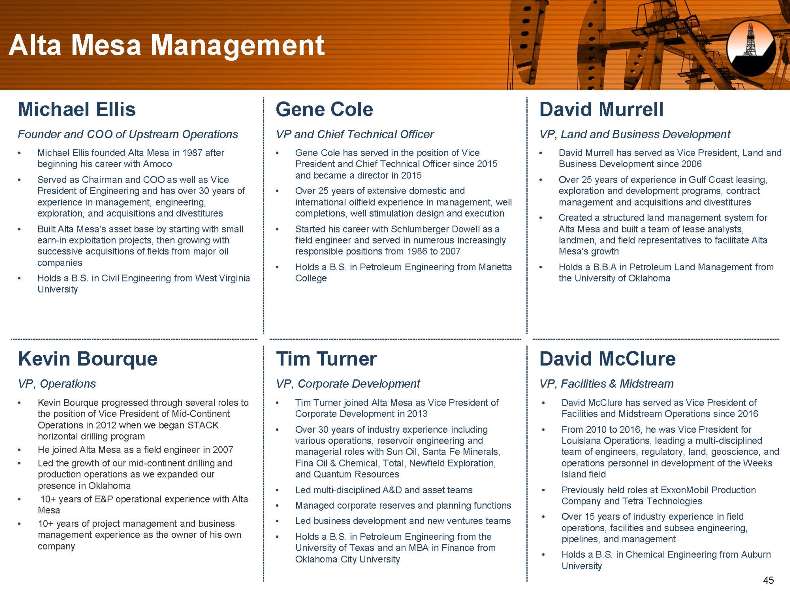
Alta Mesa Management Michael Ellis Gene Cole David Murrell Founder and COO of Upstream Operations VP and Chief Technical Officer VP, Land and Business Development Michael Ellis founded Alta Mesa in 1987 after Gene Cole has served in the position of Vice David Murrell has served as Vice President, Land and beginning his career with Amoco President and Chief Technical Officer since 2015 Business Development since 2006 and became a director in 2015 Served as Chairman and COO as well as Vice Over 25 years of experience in Gulf Coast leasing, President of Engineering and has over 30 years of Over 25 years of extensive domestic and exploration and development programs, contract experience in management, engineering, international oilfield experience in management, well management and acquisitions and divestitures exploration, and acquisitions and divestitures completions, well stimulation design and execution Created a structured land management system for Built Alta Mesa?s asset base by starting with small Started his career with Schlumberger Dowell as a Alta Mesa and built a team of lease analysts, earn-in exploitation projects, then growing with field engineer and served in numerous increasingly landmen, and field representatives to facilitate Alta successive acquisitions of fields from major oil responsible positions from 1986 to 2007 Mesa?s growth companies Holds a B.S. in Petroleum Engineering from Marietta Holds a B.B.A in Petroleum Land Management from Holds a B.S. in Civil Engineering from West Virginia College the University of Oklahoma University Kevin Bourque Tim Turner David McClure VP, Operations VP, Corporate Development VP, Facilities & Midstream Kevin Bourque progressed through several roles to Tim Turner joined Alta Mesa as Vice President of David McClure has served as Vice President of the position of Vice President of Mid-Continent Corporate Development in 2013 Facilities and Midstream Operations since 2016 Operations in 2012 when we began STACK Over 30 years of industry experience including From 2010 to 2016, he was Vice President for horizontal drilling program various operations, reservoir engineering and Louisiana Operations, leading a multi-disciplined He joined Alta Mesa as a field engineer in 2007 managerial roles with Sun Oil, Santa Fe Minerals, team of engineers, regulatory, land, geoscience, and Led the growth of our mid-continent drilling and Fina Oil & Chemical, Total, Newfield Exploration, operations personnel in development of the Weeks production operations as we expanded our and Quantum Resources Island field presence in Oklahoma Led multi-disciplined A&D and asset teams Previously held roles at ExxonMobil Production 10+ years of E&P operational experience with Alta Company and Tetra Technologies Managed corporate reserves and planning functions Mesa Over 15 years of industry experience in field 10+ years of project management and business Led business development and new ventures teams operations, facilities and subsea engineering, management experience as the owner of his own Holds a B.S. in Petroleum Engineering from the pipelines, and management company University of Texas and an MBA in Finance from Holds a B.S. in Chemical Engineering from Auburn Oklahoma City University University 45
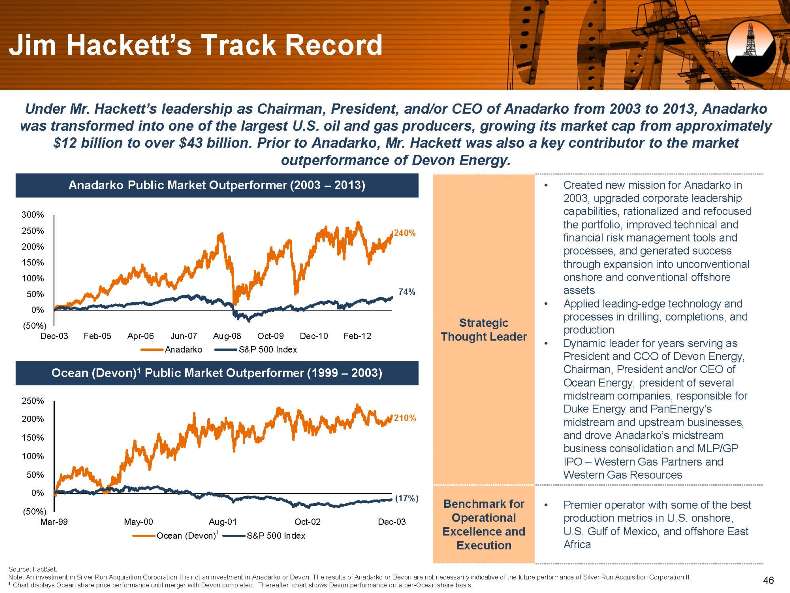
Jim Hackett?s Track Record Under Mr. Hackett?s leadership as Chairman, President, and/or CEO of Anadarko from 2003 to 2013, Anadarko was transformed into one of the largest U.S. oil and gas producers, growing its market cap from approximately $12 billion to over $43 billion. Prior to Anadarko, Mr. Hackett was also a key contributor to the market outperformance of Devon Energy. Anadarko Public Market Outperformer (2003 ? 2013) Created new mission for Anadarko in 2003, upgraded corporate leadership 300% capabilities, rationalized and refocused the portfolio, improved technical and 250% 240% 200% financial risk management tools and processes, and generated success 150% through expansion into unconventional 100% onshore and conventional offshore 50% 74% assets Applied leading-edge technology and 0% processes in drilling, completions, and (50%) Strategic production Dec-03 Feb-05 Apr-06 Jun-07 Aug-08 Oct-09 Dec-10 Feb-12 Thought Leader Dynamic leader for years serving as Anadarko S&P 500 Index President and COO of Devon Energy, Ocean (Devon)1 Public Market Outperformer (1999 ? 2003) Chairman, President and/or CEO of Ocean Energy, president of several midstream companies, responsible for 250% 210% Duke Energy and PanEnergy?s 200% midstream and upstream businesses, 150% and drove Anadarko?s midstream business consolidation and MLP/GP 100% IPO ? Western Gas Partners and 50% Western Gas Resources 0% (17%) Benchmark for Premier operator with some of the best (50%) Mar-99 May-00 Aug-01 Oct-02 Dec-03 Operational production metrics in U.S. onshore, Ocean (Devon)1 S&P 500 Index Excellence and U.S. Gulf of Mexico, and offshore East Execution Africa Source: FactSet. Note: An investment in Silver Run Acquisition Corporation II is not an investment in Anadarko or Devon. The results of Anadarko or Devon are not necessarily indicative of the future performance of Silver Run Acquisition Corporation II. 46 1 Chart displays Ocean share price performance until merger with Devon completed. Thereafter, chart shows Devon performance on a per-Ocean share basis.
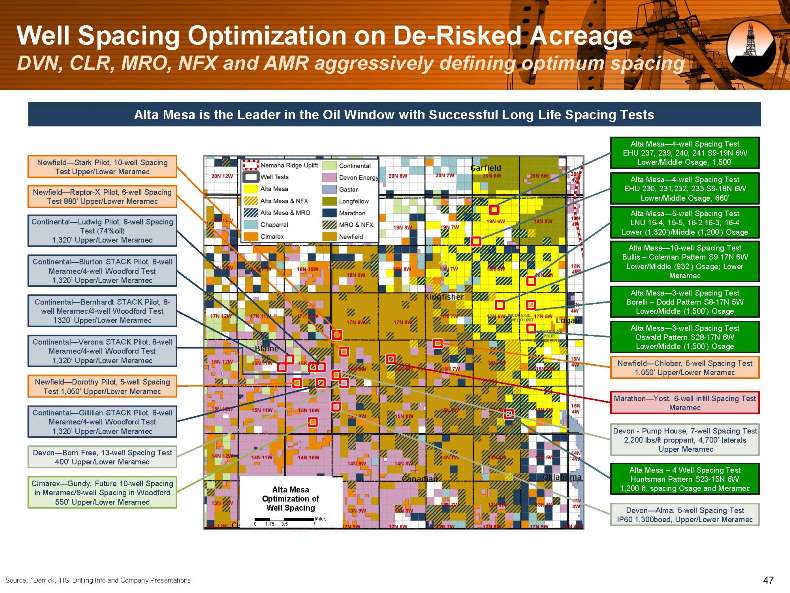
Well Spacing Optimization on De-Risked Acreage DVN, CLR, MRO, NFX and AMR aggressively defining optimum spacing Alta Mesa is the Leader in the Oil Window with Successful Long Life Spacing Tests Alta Mesa?4-well Spacing Test EHU 237, 239, 240, 241 S9-19N 6W Newfield?Stark Pilot, 10-well Spacing Lower/Middle Osage, 1,500? Test Upper/Lower Meramec Alta Mesa?4-well Spacing Test EHU 230, 231,232, 233 S6-18N 6W Newfield?Raptor-X Pilot, 6-well Spacing Lower/Middle Osage, 660? Test 880? Upper/Lower Meramec Alta Mesa?5-well Spacing Test Continental?Ludwig Pilot, 8-well Spacing LNU 15-4, 15-5, 16-2,16-3, 16-4 Test (74%oil) Lower (1,320?)/Middle (1,200?) Osage 1,320? Upper/Lower Meramec Alta Mesa?10-well Spacing Test Bullis ? Coleman Pattern S9 17N 6W Continental?Blurton STACK Pilot, 8-well Lower/Middle (932?) Osage; Lower Meramec/4-well Woodford Test Meramec 1,320? Upper/Lower Meramec Alta Mesa?3-well Spacing Test Continental?Bernhardt STACK Pilot, 8- Borelli ? Dodd Pattern S8-17N 5W well Meramec/4-well Woodford Test Lower/Middle (1,500?) Osage 1320? Upper/Lower Meramec Alta Mesa?3-well Spacing Test Oswald Pattern S28-17N 6W Continental?Verona STACK Pilot, 8-well Lower/Middle (1,500?) Osage Meramec/4-well Woodford Test 1,320? Upper/Lower Meramec Newfield?Chlober, 5-well Spacing Test 1,050? Upper/Lower Meramec Newfield?Dorothy Pilot, 5-well Spacing Test 1,050? Upper/Lower Meramec Marathon?Yost, 6-well infill Spacing Test Meramec Continental?Gillilian STACK Pilot, 8-well Meramec/4-well Woodford Test 1,320? Upper/Lower Meramec Devon—Pump House, 7-well Spacing Test 2,200 lbs/ft proppant, 4,700? laterals Upper Meramec Devon?Born Free, 13-well Spacing Test 400? Upper/Lower Meramec Alta Mesa ? 4 Well Spacing Test Huntsman Pattern S23-15N 6W Cimarex?Gundy, Future 10-well Spacing Alta Mesa ? 1,200 ft. spacing Osage and Meramec in Meramec/9-well Spacing in Woodford 550? Upper/Lower Meramec Optimization of Well Spacing Devon?Alma, 5-well Spacing Test Miles IP60 1,300boed, Upper/Lower Meramec 0 1.75 3.5 7 Source: 1Derrick, IHS, Drilling Info and Company Presentations. 47
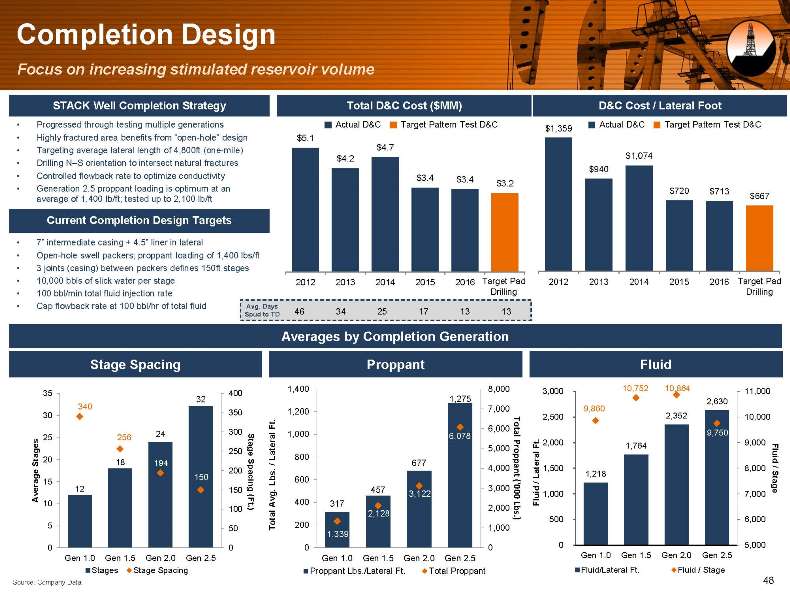
Completion Design Focus on increasing stimulated reservoir volume STACK Well Completion Strategy Total D&C Cost ($MM) D&C Cost / Lateral Foot Progressed through testing multiple generations Actual D&C Target Pattern Test D&C Actual D&C Target Pattern Test D&C $1,359 Highly fractured area benefits from ?open-hole? design $5.1 Targeting average lateral length of 4,800ft (one-mile) $4.7 $4.2 $1,074 Drilling N?S orientation to intersect natural fractures $940 Controlled flowback rate to optimize conductivity $3.4 $3.4 $3.2 Generation 2.5 proppant loading is optimum at an $720 $713 $667 average of 1,400 lb/ft; tested up to 2,100 lb/ft Current Completion Design Targets 7? intermediate casing + 4.5? liner in lateral Open-hole swell packers; proppant loading of 1,400 lbs/ft 3 joints (casing) between packers defines 150ft stages 10,000 bbls of slick water per stage 2012 2013 2014 2015 2016 Target Pad 2012 2013 2014 2015 2016 Target Pad 100 bbl/min total fluid injection rate Drilling Drilling Cap flowback rate at 100 bbl/hr of total fluid Avg. Days Spud to TD 46 34 25 17 13 13 Averages by Completion Generation Stage Spacing Proppant Fluid 1,400 8,000 3,000 10,752 10,864 11,000 35 400 340 32 1,275 2,630 1,200 7,000 9,860 30 350 2,352 2,500 10,000 Ft. 6,000 24 300 l 1,000 6,078 Total 9,750 25 256 St 2,000 9,000 a Ft. 1,764 250 ge 5,000 20 Latera 800 Stages 18 194 / 677Fluid / e 200 4,000 1,500 8,000 s. Proppant Lateral 1,218 150 Spaci b 600 15 L/ erag 12 150 ng 457 3,000 Stage v g. 3,122 1,000 7,000 A 10 (Ft 400 317 Lbs(‘000 Fluid 100 ) .Av 2,000 tal 2,128 ) . 500 6,000 5 T o 200 50 1,000 1,339 0 0 0 0 0 5,000 Gen 1.0 Gen 1.5 Gen 2.0 Gen 2.5 Gen 1.0 Gen 1.5 Gen 2.0 Gen 2.5 Gen 1.0 Gen 1.5 Gen 2.0 Gen 2.5 Stages Stage Spacing Proppant Lbs./Lateral Ft. Total Proppant Fluid/Lateral Ft. Fluid / Stage Source: Company Data. 48
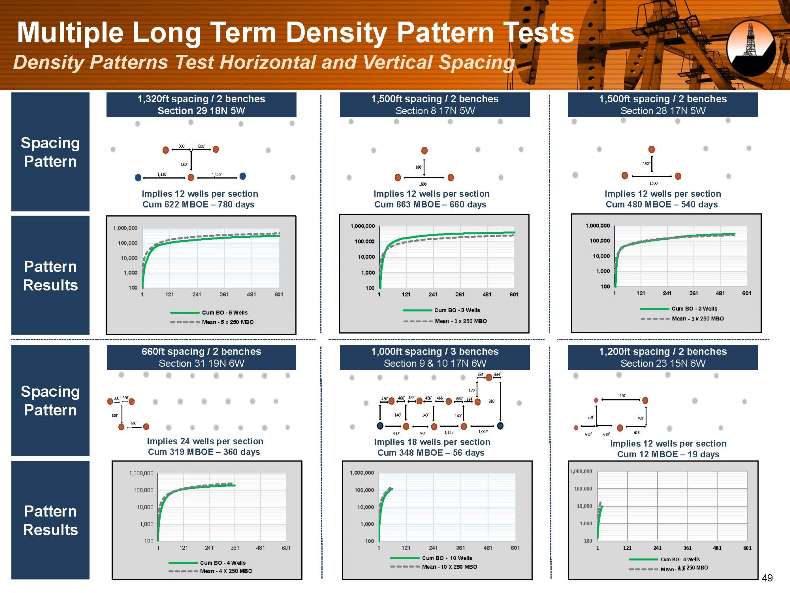
Multiple Long Term Density Pattern Tests Density Patterns Test Horizontal and Vertical Spacing 1,320ft spacing / 2 benches 1,500ft spacing / 2 benches 1,500ft spacing / 2 benches Section 29 18N 5W Section 8 17N 5W Section 28 17N 5W Spacing 600’ 600’ Pattern 180’ 180’ 180’ 1,320’ 1,320’ 1500’ 1500’ Implies 12 wells per section Implies 12 wells per section Implies 12 wells per section Cum 622 MBOE ? 780 days Cum 663 MBOE ? 660 days Cum 480 MBOE ? 540 days 1,000,000 1,000,000 1,000,000 100,000 100,000 100,000 Pattern 10,000 10,000 10,000 1,000 1,000 1,000 Results 100 100 100 1 121 241 361 481 601 1 121 241 361 481 601 1 121 241 361 481 601 Cum BO—3 Wells Cum BO—3 Wells Cum BO—5 Wells Mean—5 x 250 MBO 660ft spacing / 2 benches 1,000ft spacing / 3 benches 1,200ft spacing / 2 benches Section 31 19N 6W Section 9 & 10 17N 6W Section 23 15N 6W 334’ 334’ Spacing 170’ 1236’ 330’ 330’ 466’ 466’ 466’ 466’ 466’ 660’ 334’ 310’ Pattern 180’ 140’ 140’ 140’ 230’ 230’ 660’ 1,126’ 1,002’ 618’ 932’ 932’ 618’ 618’ Implies 24 wells per section Implies 18 wells per section Implies 12 wells per section Cum 319 MBOE ? 360 days Cum 348 MBOE ? 56 days Cum 12 MBOE ? 19 days 1,000,000 1,000,000 1,000,000 100,000 100,000 100,000 Pattern 10,000 10,000 10,000 Results 1,000 1,000 1,000 100 100 100 1 121 241 361 481 601 1 121 241 361 481 601 1 121 241 361 481 601 Cum BO—4 Wells Cum BO— 10 Wells Cum BO—4 Wells Mean—10 X 250 MBO 4 X 250 MBO Mean—4 X Mean—4 259 49
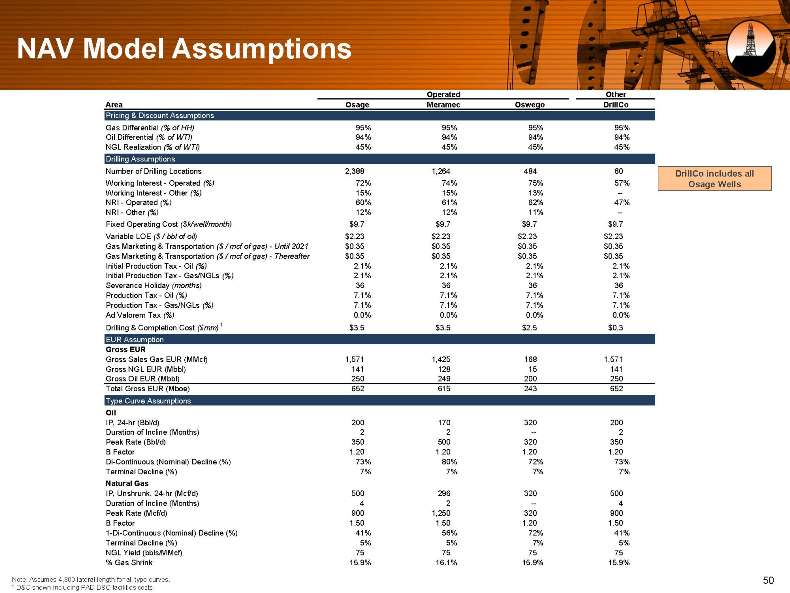
NAV Model Assumptions Operated Other Area Osage Meramec Oswego DrillCo Pricing & Discount Assumptions Gas Differential (% of HH) 95% 95% 95% 95% Oil Differential (% of WTI) 94% 94% 94% 94% NGL Realization (% of WTI) 45% 45% 45% 45% Drilling Assumptions Number of Drilling Locations 2,388 1,264 484 60 DrillCo includes all Working Interest—Operated (%) 72% 74% 75% 57% Osage Wells Working Interest—Other (%) 15% 15% 13% —NRI—Operated (%) 60% 61% 62% 47% NRI—Other (%) 12% 12% 11% —Fixed Operating Cost ($k/well/month) $9.7 $9.7 $9.7 $9.7 Variable LOE ($ / bbl of oil) $2.23 $2.23 $2.23 $2.23 Gas Marketing & Transportation ($ / mcf of gas)—Until 2021 $0.35 $0.35 $0.35 $0.35 Gas Marketing & Transportation ($ / mcf of gas)—Thereafter $0.35 $0.35 $0.35 $0.35 Initial Production Tax—Oil (%) 2.1% 2.1% 2.1% 2.1% Initial Production Tax—Gas/NGLs (%) 2.1% 2.1% 2.1% 2.1% Severance Holiday (months) 36 36 36 36 Production Tax—Oil (%) 7.1% 7.1% 7.1% 7.1% Production Tax—Gas/NGLs (%) 7.1% 7.1% 7.1% 7.1% Ad Valorem Tax (%) 0.0% 0.0% 0.0% 0.0% Drilling & Completion Cost ($mm) 1 $3.5 $3.5 $2.5 $0.3 EUR Assumption Gross EUR Gross Sales Gas EUR (MMcf) 1,571 1,425 168 1,571 Gross NGL EUR (Mbbl) 141 128 15 141 Gross Oil EUR (Mbbl) 250 249 200 250 Total Gross EUR (Mboe) 652 615 243 652 Type Curve Assumptions Oil IP, 24-hr (Bbl/d) 200 170 320 200 Duration of Incline (Months) 2 2 — 2 Peak Rate (Bbl/d) 350 500 320 350 B Factor 1.20 1.20 1.20 1.20 Di-Continuous (Nominal) Decline (%) 73% 80% 72% 73% Terminal Decline (%) 7% 7% 7% 7% Natural Gas IP, Unshrunk, 24-hr (Mcf/d) 500 296 320 500 Duration of Incline (Months) 4 2 — 4 Peak Rate (Mcf/d) 900 1,250 320 900 B Factor 1.50 1.50 1.20 1.50 1-Di-Continuous (Nominal) Decline (%) 41% 56% 72% 41% Terminal Decline (%) 5% 5% 7% 5% NGL Yield (bbls/MMcf) 75 75 75 75 % Gas Shrink 15.9% 16.1% 15.9% 15.9% Note: Assumes 4,800 lateral length for all type curves. 50 1 D&C shown including PAD D&C facilities costs.
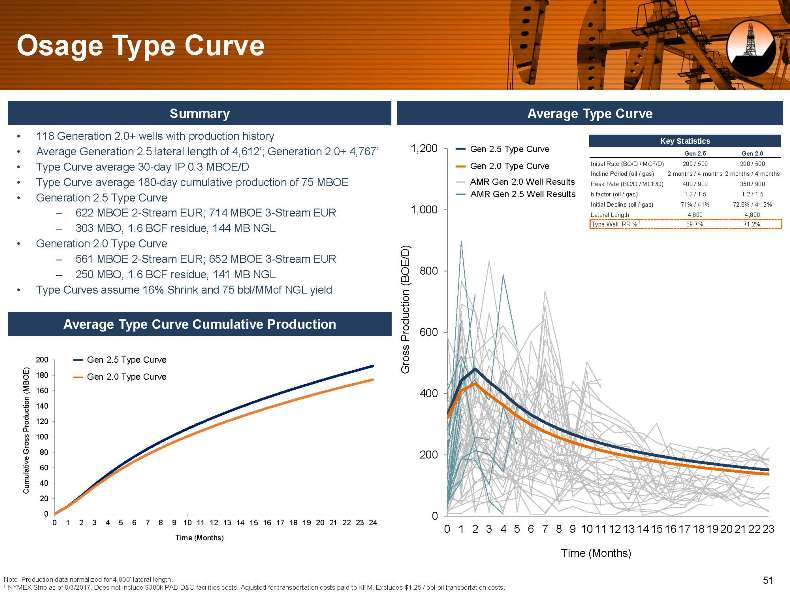
Osage Type Curve Summary Average Type Curve 118 Generation 2.0+ wells with production history Key Statistics Average Generation 2.5 lateral length of 4,612?; Generation 2.0+ 4,767? 1,200 Gen 2.5 Type Curve Gen 2.5 Gen 2.0 Type Curve average 30-day IP 0.3 MBOE/D Gen 2.0 Type Curve Initial Rate (BO/D / MCF/D) 200 / 500 200 / 500 Incline Period (oil / gas) 2 months / 4 months 2 months / 4 months Type Curve average 180-day cumulative production of 75 MBOE AMR Gen 2.0 Well Results Peak Rate (BO/D / MCF/D) 400 / 900 350 / 900 Generation 2.5 Type Curve AMR Gen 2.5 Well Results b factor (oil / gas) 1.2 / 1.5 1.2 / 1.5 1,000 Initial Decline (oil / gas) 71% / 41% 72.6% / 41.2% ? 622 MBOE 2-Stream EUR; 714 MBOE 3-Stream EUR Lateral Length 4,800 4,800 Type Well IRR %1 89.7% 71.2% ? 303 MBO, 1.6 BCF residue, 144 MB NGL Generation 2.0 Type Curve ? 561 MBOE 2-Stream EUR; 652 MBOE 3-Stream EUR /D) E ? 250 MBO, 1.6 BCF residue, 141 MB NGL O 800 ( B Type Curves assume 16% Shrink and 75 bbl/MMcf NGL yield on uc ti Average Type Curve Cumulative Production Prod 600 s 200 Gen 2.5 Type Curve os r G 180 Gen 2.0 Type Curve (MBOE) 160 tion 400 c 140 odu 120 P r oss 100 Gr 80 200 ive ulat 60 u m 40 C 20 0 0 0 1 2 3 4 5 6 7 8 9 10 11 12 13 14 15 16 17 18 19 20 21 22 23 24 0 1 2 3 4 5 6 7 8 9 10 11 12 13 14 15 16 17 18 19 20 21 22 23 Time (Months) Time (Months) Note: Production data normalized for 4,800? lateral length. 51 1 NYMEX Strip as of 8/3/2017. Does not include $300k PAD D&C facilities costs. Adjusted for transportation costs paid to KFM. Excludes $1.25 / bbl oil transportation costs.
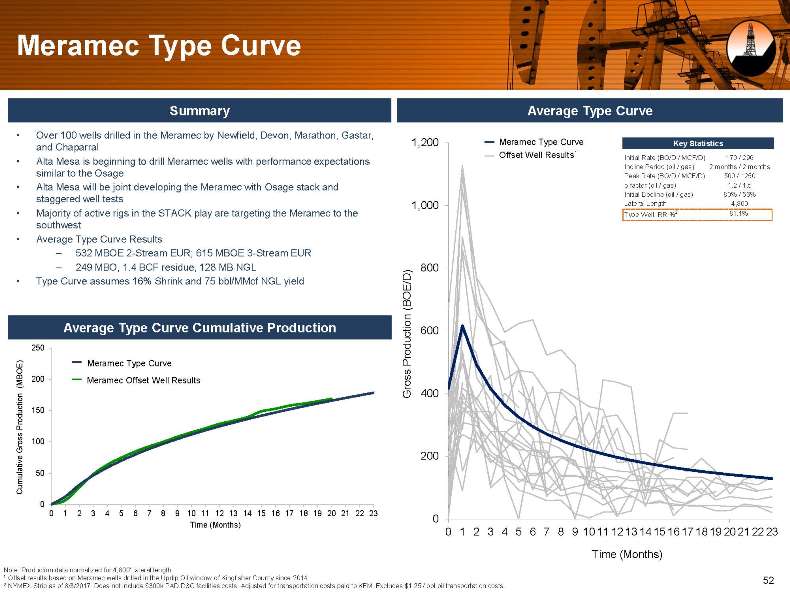
Meramec Type Curve Summary Average Type Curve Over 100 wells drilled in the Meramec by Newfield, Devon, Marathon, Gastar, 1,200 Meramec Type Curve Key Statistics and Chaparral Offset Well Results1 Alta Mesa is beginning to drill Meramec wells with performance expectations Initial Rate (BO/D / MCF/D) 170 / 296 Incline Period (oil / gas) 2 months / 2 months similar to the Osage Peak Rate (BO/D / MCF/D) 500 / 1250 Alta Mesa will be joint developing the Meramec with Osage stack and b factor (oil / gas) 1.2 / 1.5 Initial Decline (oil / gas) 80% / 56% staggered well tests 1,000 Lateral Length 4,800 Majority of active rigs in the STACK play are targeting the Meramec to the Type Well IRR %2 81.1% southwest Average Type Curve Results ? 532 MBOE 2-Stream EUR; 615 MBOE 3-Stream EUR ? 249 MBO, 1.4 BCF residue, 128 MB NGL 800 Type Curve assumes 16% Shrink and 75 bbl/MMcf NGL yield /D) E (BO n Average Type Curve Cumulative Production ctio 600 250 Prod u OE) Meramec Type Curve B (M 200 Meramec Offset Well Results Gross 400 duction 150 r o P Gross 100 e 200 Cumulativ 50 0 0 1 2 3 4 5 6 7 8 9 10 11 12 13 14 15 16 17 18 19 20 21 22 23 0 Time (Months) 0 1 2 3 4 5 6 7 8 9 10 11 12 13 14 15 16 17 18 19 20 21 22 23 Time (Months) Note: Production data normalized for 4,800? lateral length. 1 Offset results based on Meramec wells drilled in the Updip Oil window of Kingfisher County since 2014. 52 2 NYMEX Strip as of 8/3/2017. Does not include $300k PAD D&C facilities costs. Adjusted for transportation costs paid to KFM. Excludes $1.25 / bbl oil transportation costs.
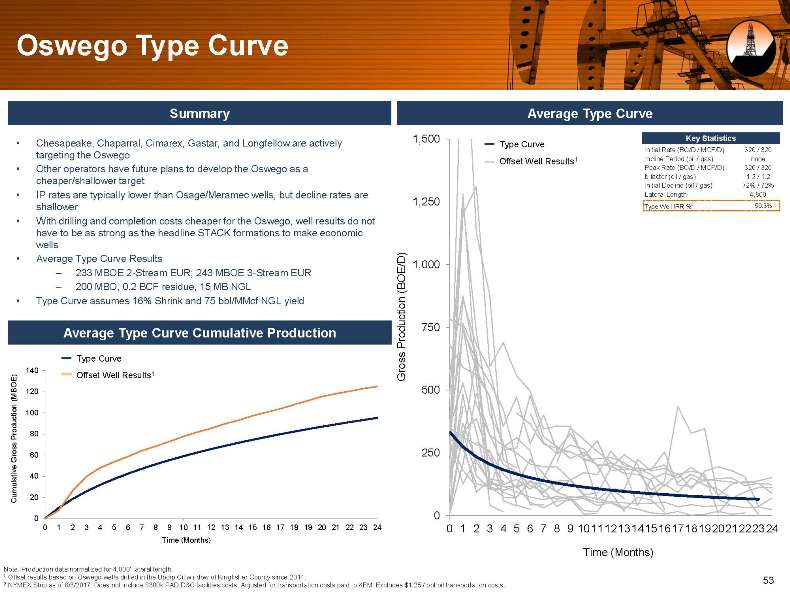
Oswego Type Curve Summary Average Type Curve 1,500 Key Statistics Chesapeake, Chaparral, Cimarex, Gastar, and Longfellow are actively Type Curve Initial Rate (BO/D / MCF/D) 320 / 320 targeting the Oswego Incline Period (oil / gas) none Offset Well Results1 Other operators have future plans to develop the Oswego as a Peak Rate (BO/D / MCF/D) 320 / 320 cheaper/shallower target b factor (oil / gas) 1.2 / 1.2 Initial Decline (oil / gas) 72% / 72% IP rates are typically lower than Osage/Meramec wells, but decline rates are Lateral Length 4,800 1,250 2 59.3% shallower Type Well IRR % With drilling and completion costs cheaper for the Oswego, well results do not have to be as strong as the headline STACK formations to make economic wells Average Type Curve Results /D) 1,000 ? 233 MBOE 2-Stream EUR; 243 MBOE 3-Stream EUR OE ? 200 MBO, 0.2 BCF residue, 15 MB NGL (B Type Curve assumes 16% Shrink and 75 bbl/MMcf NGL yield tion uc Average Type Curve Cumulative Production rod 750 P Type Curve ros s 140 Offset Well Results1 G (MBOE) 120 500 tion 100 oduc Pr 80 oss r G 60 250 ve ati 40 Cumul 20 0 0 0 1 2 3 4 5 6 7 8 9 10 11 12 13 14 15 16 17 18 19 20 21 22 23 24 0 1 2 3 4 5 6 7 8 9 10 11 12 13 14 15 16 17 18 19 20 21 22 23 24 Time (Months) Time (Months) Note: Production data normalized for 4,800? lateral length. 1 Offset results based on Oswego wells drilled in the Updip Oil window of Kingfisher County since 2014. 53 2 NYMEX Strip as of 8/3/2017. Does not include $300k PAD D&C facilities costs. Adjusted for transportation costs paid to KFM. Excludes $1.25 / bbl oil transportation costs.
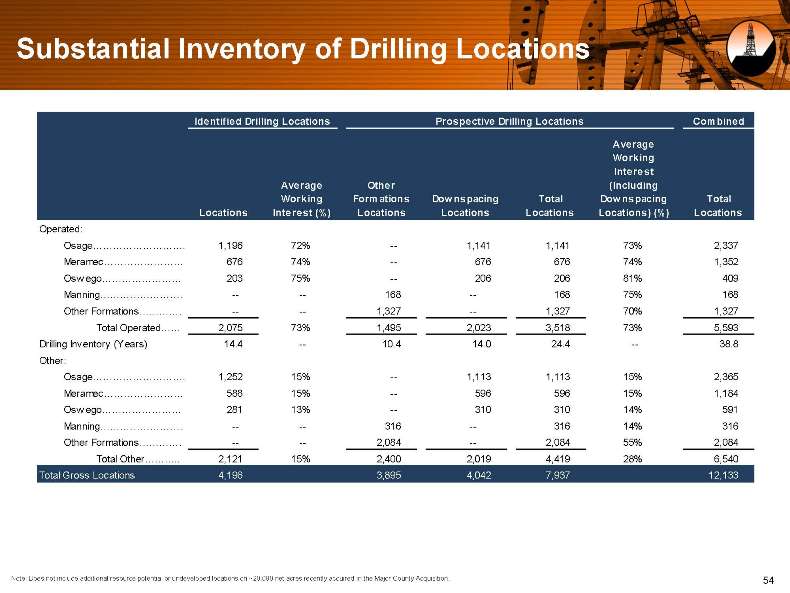
Substantial Inventory of Drilling Locations Identified Drilling Locations Prospective Drilling Locations Combined Average Working Interest Average Other (Including Working Formations Dow nspacing Total Dow nspacing Total Locations Interest (%) Locations Locations Locations Locations) (%) Locations Operated: Osage. 1,196 72% — 1,141 1,141 73% 2,337 Meramec 676 74% — 676 676 74% 1,352 Osw ego 203 75% — 206 206 81% 409 Manning. — — 168 — 168 75% 168 Other Formations. — — 1,327 — 1,327 70% 1,327 Total Operated 2,075 73% 1,495 2,023 3,518 73% 5,593 Drilling Inventory (Years) 14.4 — 10.4 14.0 24.4 — 38.8 Other: Osage. 1,252 15% — 1,113 1,113 15% 2,365 Meramec 588 15% — 596 596 15% 1,184 Osw ego 281 13% — 310 310 14% 591 Manning. — — 316 — 316 14% 316 Other Formations. — — 2,084 — 2,084 55% 2,084 Total Other 2,121 15% 2,400 2,019 4,419 28% 6,540 Total Gross Locations 4,196 3,895 4,042 7,937 12,133 Note: Does not include additional resource potential or undeveloped locations on ~20,000 net acres recently acquired in the Major County Acquisition. 54
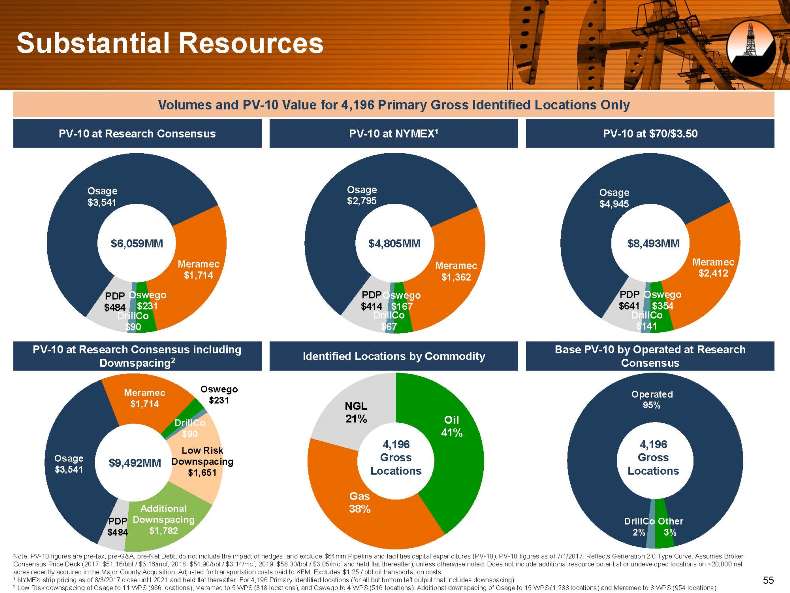
Substantial Resources Volumes and PV-10 Value for 4,196 Primary Gross Identified Locations Only PV-10 at Research Consensus PV-10 at NYMEX1 PV-10 at $70/$3.50 Osage Osage Osage $3,541 $2,795 $4,945 $6,059MM $4,805MM $8,493MM Meramec Meramec Meramec $1,714 $1,362 $2,412 PDP Oswego PDPOswego PDP Oswego $484 $231 $414 $167 $641 $354 DrillCo DrillCo DrillCo $90 $67 $141 PV-10 at Research Consensus including Base PV-10 by Operated at Research Downspacing2 Identified Locations by Commodity Consensus Meramec Oswego Operated $1,714 $231 NGL 95% DrillCo 21% Oil $90 41% 4,196 4,196 Low Risk Osage Downspacing Gross Gross $9,492MM $3,541 $1,651 Locations Locations Gas Additional 38% PDP Downspacing DrillCo Other $484 $1,782 2% 3% Note: PV-10 figures are pre-tax, pre-G&A, pre-Net Debt, do not include the impact of hedges, and exclude $64mm Pipeline and facilities capital expenditures (PV-10). PV-10 figures as of 7/1/2017. Reflects Generation 2.0 Type Curve. Assumes Broker Consensus Price Deck (2017: $51.16/bbl / $3.16/mcf; 2018: $54.90/bbl / $3.14/mcf; 2019: $58.00/bbl / $3.05/mcf and held flat thereafter), unless otherwise noted. Does not include additional resource potential or undeveloped locations on ~20,000 net acres recently acquired in the Major County Acquisition. Adjusted for transportation costs paid to KFM. Excludes $1.25 / bbl oil transportation costs. 1 NYMEX strip pricing as of 8/3/2017 close until 2021 and held flat thereafter. For 4,196 Primary Identified locations (for all but bottom left output that includes downspacing). 55 2 Low Risk downspacing of Osage to 11 WPS (966 locations), Meramec to 5 WPS (318 locations), and Oswego to 4 WPS (516 locations). Additional downspacing of Osage to 15 WPS (1,288 locations) and Meramec to 8 WPS (954 locations).
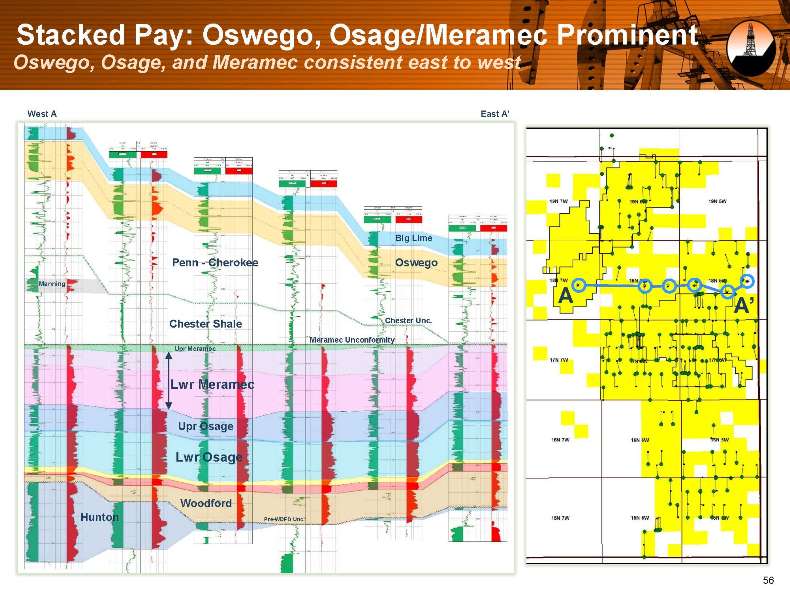
Stacked Pay: Oswego, Osage/Meramec Prominent Oswego, Osage, and Meramec consistent east to west West A East A? Big Lime Penn—Cherokee Oswego Manning A A? Chester Shale Chester Unc. Meramec Unconformity Upr Meramec Lwr Meramec Upr Osage Lwr Osage Woodford Hunton Pre-WDFD Unc. 56
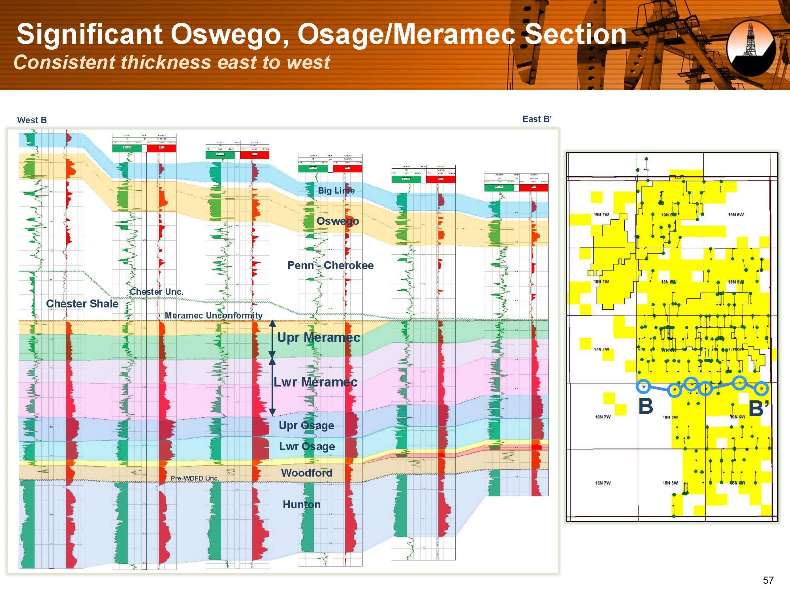
Significant Oswego, Osage/Meramec Section Consistent thickness east to west West B East B? Big Lime Oswego Penn—Cherokee Chester Unc. Chester Shale Meramec Unconformity Upr Meramec Lwr Meramec B B? Upr Osage Lwr Osage Woodford Pre-WDFD Unc. Hunton 57
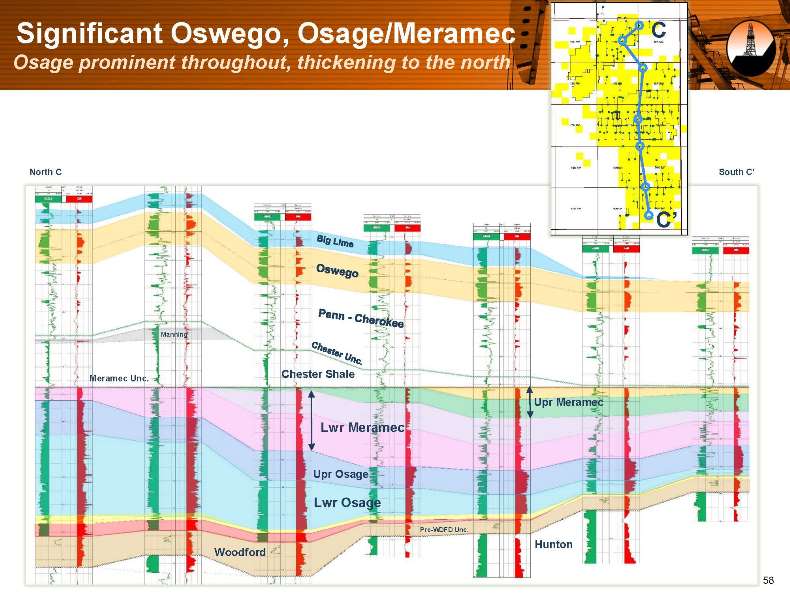
Significant Oswego, Osage/Meramec C Osage prominent throughout, thickening to the north North C South C? C? Manning Meramec Unc. Chester Shale Upr Meramec Lwr Meramec Upr Osage Lwr Osage Pre-WDFD Unc. Hunton Woodford 58
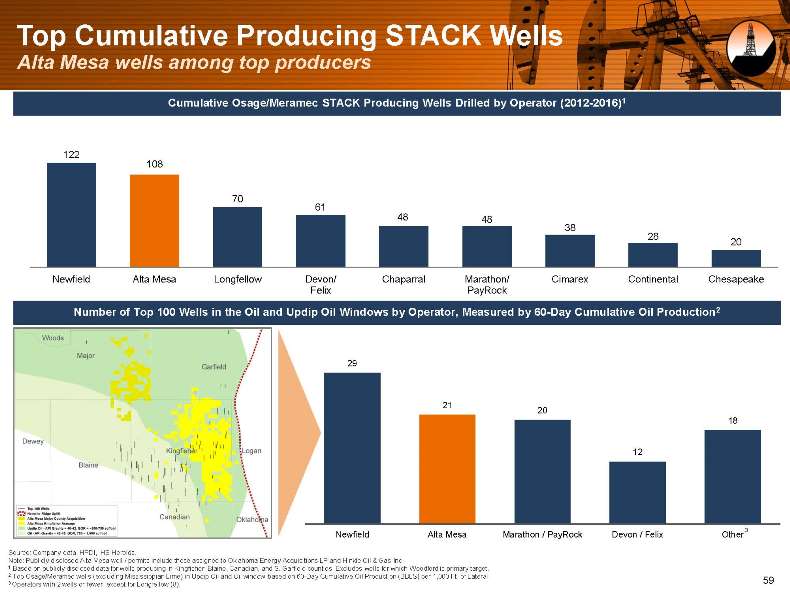
Top Cumulative Producing STACK Wells Alta Mesa wells among top producers Cumulative Osage/Meramec STACK Producing Wells Drilled by Operator (2012-2016)1 122 108 70 61 48 48 38 28 20 Newfield Alta Mesa Longfellow Devon/ Chaparral Marathon/ Cimarex Continental Chesapeake Felix PayRock Number of Top 100 Wells in the Oil and Updip Oil Windows by Operator, Measured by 60-Day Cumulative Oil Production2 29 21 20 18 12 3 Newfield Alta Mesa Marathon / PayRock Devon / Felix Other Source: Company data, HPDI, IHS Herolds. Note: Publicly disclosed Alta Mesa well / permits include those assigned to Oklahoma Energy Acquisitions LP and Hinkle Oil & Gas Inc. 1 Based on publicly disclosed data for wells producing in Kingfisher, Blaine, Canadian, and S. Garfield counties. Excludes wells for which Woodford is primary target. 2 Top Osage/Meramec wells (excluding Mississippian Lime) in Updip Oil and Oil window based on 60-Day Cumulative Oil Production (BBLS) per 1,000 Ft. of Lateral. 3 Operators with 2 wells or fewer, except for Longfellow (8). 59
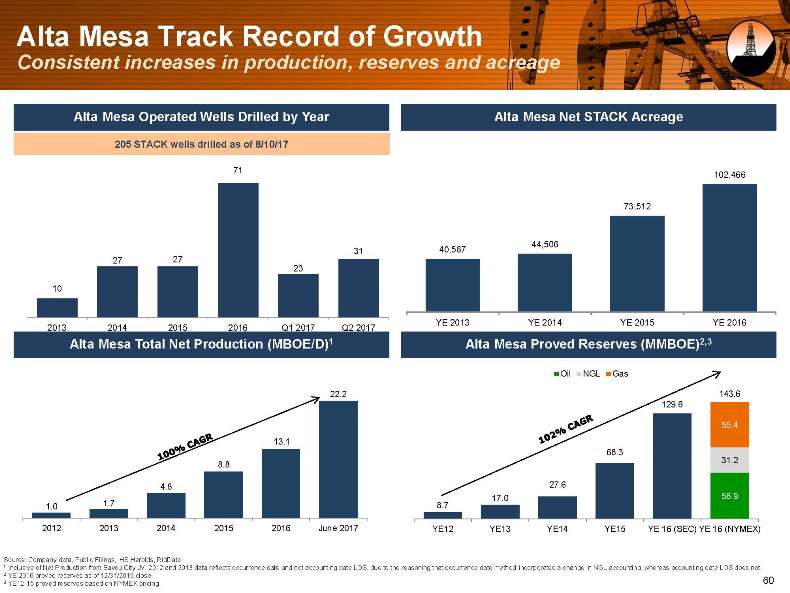
Alta Mesa Track Record of Growth Consistent increases in production, reserves and acreage Alta Mesa Operated Wells Drilled by Year Alta Mesa Net STACK Acreage 205 STACK wells drilled as of 8/10/17 71 102,466 73,512 44,506 31 40,587 27 27 23 10 YE 2013 YE 2014 YE 2015 YE 2016 2013 2014 2015 2016 Q1 2017 Q2 2017 Alta Mesa Total Net Production (MBOE/D)1 Alta Mesa Proved Reserves (MMBOE)2,3 Oil NGL Gas 22.2 143.6 129.6 55.4 13.1 68.3 31.2 8.8 4.8 27.6 1.7 17.0 56.9 1.0 8.7 2012 2013 2014 2015 2016 June 2017 YE12 YE13 YE14 YE15 YE 16 (SEC) YE 16 (NYMEX) Source: Company data, Public Filings, IHS Herolds, RigData. 1 Inclusive of Net Production from Bayou City JV. 2012 and 2013 data reflects occurrence date and not accounting date LOS, due to the reasoning that occurrence date method incorporated a change in NGL accounting; whereas accounting date LOS does not. 2 YE 2016 proved reserves as of 12/31/2016 close. 3 YE12-15 proved reserves based on NYMEX pricing. 60
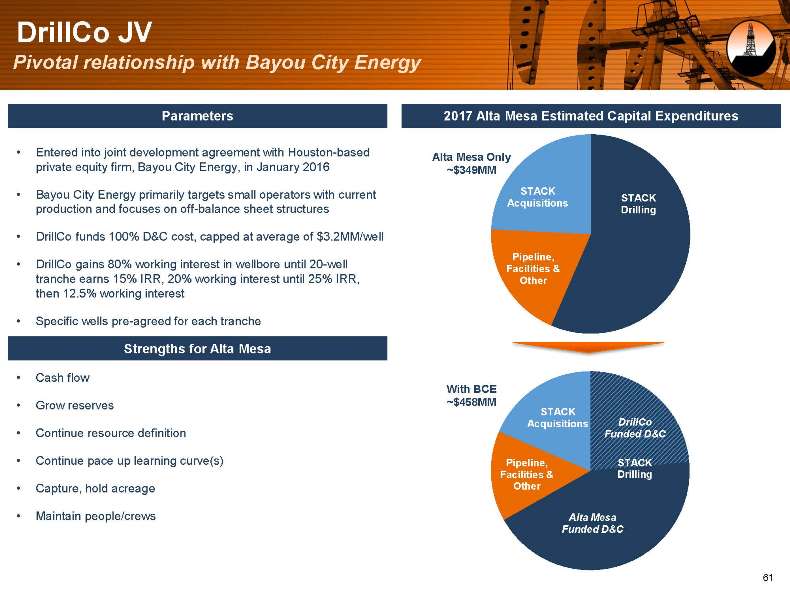
DrillCo JV Pivotal relationship with Bayou City Energy Parameters 2017 Alta Mesa Estimated Capital Expenditures Entered into joint development agreement with Houston-based Alta Mesa Only private equity firm, Bayou City Energy, in January 2016 ~$349MM Bayou City Energy primarily targets small operators with current STACK STACK Acquisitions production and focuses on off-balance sheet structures Drilling DrillCo funds 100% D&C cost, capped at average of $3.2MM/well Pipeline, DrillCo gains 80% working interest in wellbore until 20-well Facilities & tranche earns 15% IRR, 20% working interest until 25% IRR, Other then 12.5% working interest Specific wells pre-agreed for each tranche Strengths for Alta Mesa Cash flow With BCE Grow reserves ~$458MM STACK Acquisitions DrillCo Continue resource definition Funded D&C Continue pace up learning curve(s) Pipeline, STACK Facilities & Drilling Capture, hold acreage Other Maintain people/crews Alta Mesa Funded D&C 61
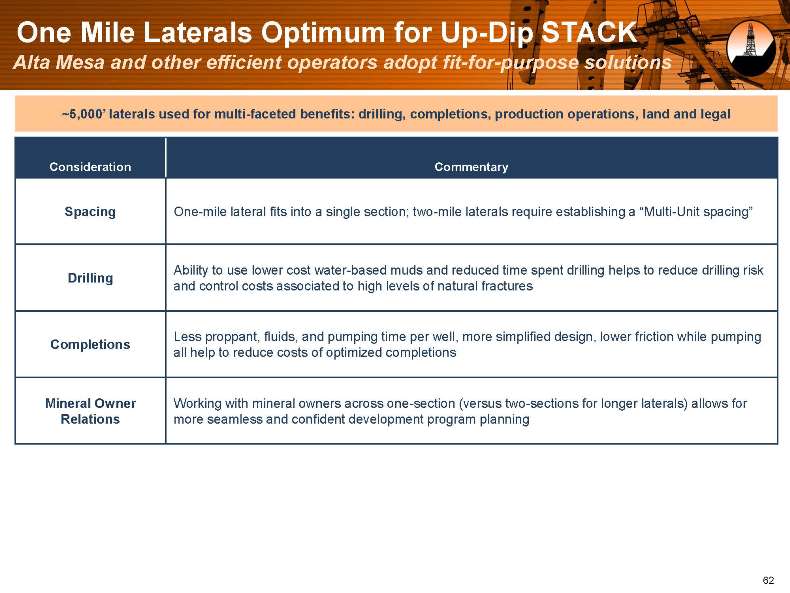
One Mile Laterals Optimum for Up-Dip STACK Alta Mesa and other efficient operators adopt fit-for-purpose solutions ~5,000? laterals used for multi-faceted benefits: drilling, completions, production operations, land and legal Consideration Commentary Spacing One-mile lateral fits into a single section; two-mile laterals require establishing a ?Multi-Unit spacing? Ability to use lower cost water-based muds and reduced time spent drilling helps to reduce drilling risk Drilling and control costs associated to high levels of natural fractures Less proppant, fluids, and pumping time per well, more simplified design, lower friction while pumping Completions all help to reduce costs of optimized completions Mineral Owner Working with mineral owners across one-section (versus two-sections for longer laterals) allows for Relations more seamless and confident development program planning 62
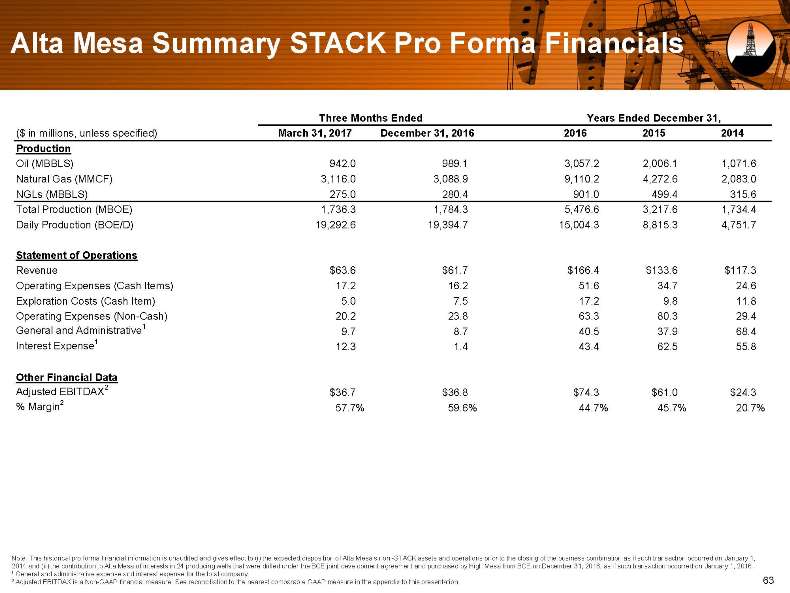
Alta Mesa Summary STACK Pro Forma Financials Three Months Ended Years Ended December 31, ($ in millions, unless specified) March 31, 2017 December 31, 2016 2016 2015 2014 Production Oil (MBBLS) 942.0 989.1 3,057.2 2,006.1 1,071.6 Natural Gas (MMCF) 3,116.0 3,088.9 9,110.2 4,272.6 2,083.0 NGLs (MBBLS) 275.0 280.4 901.0 499.4 315.6 Total Production (MBOE) 1,736.3 1,784.3 5,476.6 3,217.6 1,734.4 Daily Production (BOE/D) 19,292.6 19,394.7 15,004.3 8,815.3 4,751.7 Statement of Operations Revenue $63.6 $61.7 $166.4 $133.6 $117.3 Operating Expenses (Cash Items) 17.2 16.2 51.6 34.7 24.6 Exploration Costs (Cash Item) 5.0 7.5 17.2 9.8 11.8 Operating Expenses (Non-Cash) 20.2 23.8 63.3 80.3 29.4 General and Administrative1 9.7 8.7 40.5 37.9 68.4 Interest Expense1 12.3 1.4 43.4 62.5 55.8 Other Financial Data Adjusted EBITDAX2 $36.7 $36.8 $74.3 $61.0 $24.3 % Margin2 57.7% 59.6% 44.7% 45.7% 20.7% Note: This historical pro forma financial information is unaudited and gives effect to (i) the expected disposition of Alta Mesa?s non -STACK assets and operations prior to the closing of the business combination as if such transaction occurred on January 1, 2014 and (ii) the contribution to Alta Mesa of interests in 24 producing wells that were drilled under the BCE joint development agreement and purchased by High Mesa from BCE on December 31, 2016, as if such transaction occurred on January 1, 2016. 1 General and administrative expense and interest expense for the total company. 2 Adjusted EBITDAX is a Non-GAAP financial measure. See reconciliation to the nearest comparable GAAP measure in the appendix to this presentation. 63
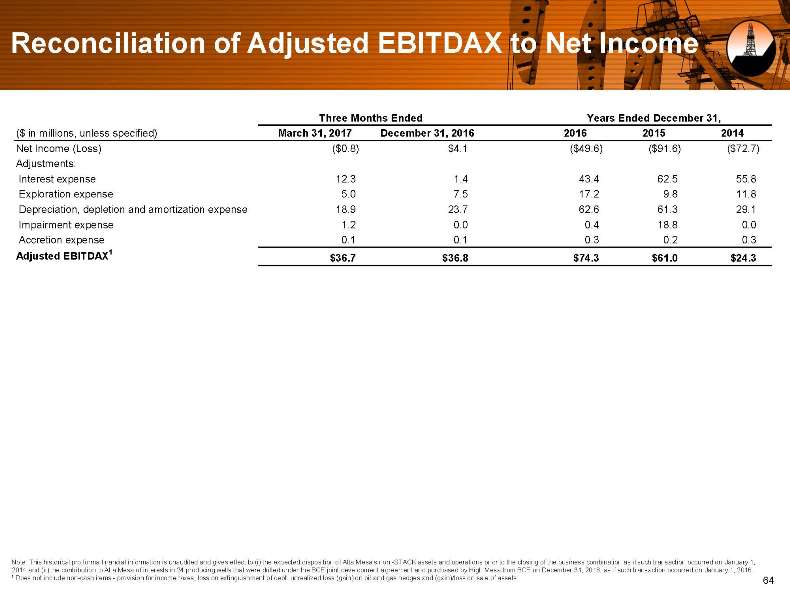
Reconciliation of Adjusted EBITDAX to Net Income Three Months Ended Years Ended December 31, ($ in millions, unless specified) March 31, 2017 December 31, 2016 2016 2015 2014 Net Income (Loss) ($0.8) $4.1 ($49.6) ($91.6) ($72.7) Adjustments: Interest expense 12.3 1.4 43.4 62.5 55.8 Exploration expense 5.0 7.5 17.2 9.8 11.8 Depreciation, depletion and amortization expense 18.9 23.7 62.6 61.3 29.1 Impairment expense 1.2 0.0 0.4 18.8 0.0 Accretion expense 0.1 0.1 0.3 0.2 0.3 Adjusted EBITDAX1 $36.7 $36.8 $74.3 $61.0 $24.3 Note: This historical pro forma financial information is unaudited and gives effect to (i) the expected disposition of Alta Mesa?s non -STACK assets and operations prior to the closing of the business combination as if such transaction occurred on January 1, 2014 and (ii) the contribution to Alta Mesa of interests in 24 producing wells that were drilled under the BCE joint development agreement and purchased by High Mesa from BCE on December 31, 2016, as if such transaction occurred on January 1, 2016. 1 Does not include non-cash items—provision for income taxes, loss on extinguishment of debt, unrealized loss (gain) on oil and gas hedges and (gain)/loss on sale of assets. 64