Attached files
| file | filename |
|---|---|
| EX-31.2 - EXHIBIT 31.2 - MSG NETWORKS INC. | finalmsgnetworksexhibit312.htm |
| EX-32.2 - EXHIBIT 32.2 - MSG NETWORKS INC. | finalmsgnetworksexhibit322.htm |
| EX-32.1 - EXHIBIT 32.1 - MSG NETWORKS INC. | finalmsgnetworksexhibit321.htm |
| EX-31.1 - EXHIBIT 31.1 - MSG NETWORKS INC. | finalmsgnetworksexhibit311.htm |
| EX-23.1 - EXHIBIT 23.1 - MSG NETWORKS INC. | finalmsgnetworksexhibit231.htm |
| EX-21.1 - EXHIBIT 21.1 - MSG NETWORKS INC. | finalmsgnetworksexhibit211.htm |
UNITED STATES SECURITIES AND EXCHANGE COMMISSION
WASHINGTON, D.C. 20549
FORM 10-K
(Mark One)
þ | ANNUAL REPORT PURSUANT TO SECTION 13 OR 15(d) OF THE SECURITIES EXCHANGE ACT OF 1934 |
For the fiscal year ended June 30, 2017
OR
o | TRANSITION REPORT PURSUANT TO SECTION 13 OR 15(d) OF THE SECURITIES EXCHANGE ACT OF 1934 [NO FEE REQUIRED] |
For the transition period from ___________ to _____________
Commission File Number | Registrant; State of Incorporation; Address and Telephone Number | IRS Employer Identification No. | ||
1-34434 | MSG NETWORKS INC. | 27-0624498 | ||
11 Pennsylvania Plaza
New York, NY 10001
(212) 465-6400
Securities registered pursuant to Section 12(b) of the Act: Title of each class: | Name of each Exchange on which Registered: | |
Class A Common Stock | New York Stock Exchange | |
Indicate by check mark if the Registrant is a well-known seasoned issuer, as defined in Rule 405 of the Securities Act. Yes þ No o
Indicate by check mark if the Registrant is not required to file reports pursuant to Section 13 or Section 15(d) of the Act.
Yes o No þ
Indicate by check mark whether the Registrant (1) has filed all reports required to be filed by Section 13 or 15(d) of the Securities Exchange Act of 1934 during the preceding 12 months (or for such shorter period that the Registrant has been required to file such reports), and (2) has been subject to such filing requirements for the past 90 days. Yes þ No o
Indicate by check mark whether the registrant has submitted electronically and posted on its corporate Website, if any, every Interactive Data File required to be submitted and posted pursuant to Rule 405 of Regulation S-T during the preceding 12 months (or for such shorter period that the registrant was required to submit and post such files). Yes þ No o
Indicate by a check mark if disclosure of delinquent filers pursuant to Item 405 of Regulation S-K is not contained herein, and will not be contained, to the best of the Registrant’s knowledge, in definitive proxy or information statements incorporated by reference in Part III of this Form 10-K or any amendment to this Form 10-K. þ
Indicate by check mark whether the registrant is a large accelerated filer, an accelerated filer, a non-accelerated filer, a smaller reporting company, or an emerging growth company. See the definitions of "large accelerated filer," "accelerated filer," "smaller reporting company," and "emerging growth company" in Rule 12b-2 of the Exchange Act.
Large accelerated filer þ | Accelerated filer o |
Non-accelerated filer o (Do not check if a smaller reporting company) | Smaller reporting company o |
Emerging growth company o |
If an emerging growth company, indicate by check mark if the Registrant has elected not to use the extended transition period for complying with any new or revised financial accounting standards provided pursuant to Section 13(a) of the Exchange Act. o
Indicate by check mark whether the Registrant is a shell company (as defined in Rule 12b-2 of the Exchange Act). Yes o No þ
Aggregate market value of the voting and non-voting common equity held by non-affiliates of MSG Networks Inc. as of June 30, 2017 computed by reference to the price at which the common equity was last sold on the New York Stock Exchange as of December 31, 2016, the last business day of the registrant’s most recently completed second fiscal quarter, was approximately: $1,280,192,732.
Number of shares of common stock outstanding as of July 31, 2017:
Class A Common Stock — 61,497,005
Class B Common Stock — 13,588,555
Documents incorporated by reference — Certain information required for Part III of this report is incorporated herein by reference to the proxy statement for the 2017 annual meeting of the Company’s shareholders, expected to be filed within 120 days after the close of our fiscal year.
TABLE OF CONTENTS
Page | |
PART I
Item 1. Business
MSG Networks Inc., formerly The Madison Square Garden Company, is a Delaware corporation with our principal executive offices at 11 Pennsylvania Plaza, New York, NY, 10001. Unless the context otherwise requires, all references to “we,” “us,” “our” or the “Company” refer collectively to MSG Networks Inc., a holding company, and its direct and indirect subsidiaries through which substantially all of our operations are conducted. Our telephone number is 212-465-6400, our Internet address is http://www.msgnetworks.com and the investor relations section of our website is http://investor.msgnetworks.com. We make available, free of charge through the investor relations section of our website, annual reports on Form 10-K, quarterly reports on Form 10-Q and current reports on Form 8-K and amendments to those reports filed or furnished pursuant to Section 13(a) or 15(d) of the Securities Exchange Act of 1934, as amended (the “Exchange Act”), as well as proxy statements, as soon as reasonably practicable after we electronically file such material with, or furnish it to, the Securities and Exchange Commission (“SEC”). References to our website in this report are provided as a convenience and the information contained on, or available through, our website is not part of this or any other report we file with or furnish to the SEC.
The Company was incorporated on July 29, 2009 as an indirect, wholly-owned subsidiary of Cablevision Systems Corporation (“Cablevision”). On February 9, 2010, Cablevision spun off the Company and the Company thereby acquired the subsidiaries of Cablevision that owned, directly and indirectly, all of the partnership interests in MSGN Holdings, L.P., formerly MSG Holdings L.P. (“MSGN L.P.”). MSGN L.P. was the indirect, wholly-owned subsidiary of Cablevision through which Cablevision held the Madison Square Garden businesses. MSGN L.P. is now a wholly-owned subsidiary of the Company, through which the Company conducts substantially all of its operations.
On September 30, 2015 (the “Distribution Date”), the Company distributed to its stockholders all of the outstanding common stock of The Madison Square Garden Company (formerly MSG Spinco, Inc., and referred to herein as “MSG”) (the “Distribution”). MSG owns, directly or indirectly, the sports and entertainment businesses previously owned and operated by the Company’s sports and entertainment segments, owns, leases or operates the arenas and other venues previously owned, leased or operated by the Company and owns the joint venture interests previously owned by the Company. In the Distribution, each holder of the Company’s Class A common stock, par value $0.01 per share (“Class A Common Stock”), of record as of the close of business, New York City time, on September 21, 2015 (the “Record Date”), received one share of MSG Class A common stock, par value $0.01 per share, for every three shares of the Company’s Class A Common Stock held on the Record Date. Each holder of the Company’s Class B common stock, par value $0.01 per share (“Class B Common Stock”), of record as of the Record Date received one share of MSG Class B common stock, par value $0.01 per share, for every three shares of the Company's Class B Common Stock held on the Record Date. Following the Distribution, the Company no longer consolidates the financial results of MSG for purposes of its own financial reporting and the historical financial results of MSG have been reflected in the Company's consolidated financial statements as discontinued operations for all periods presented through the Distribution Date.
Our Company
The Company, an industry leader in sports production, and content development and distribution, owns and operates two award-winning regional sports and entertainment networks, MSG Network (“MSGN”) and MSG+, collectively “MSG Networks.” For more than 40 years, we have been a pioneer in regional sports television, setting a standard of excellence, creativity and technological innovation. Today, our exclusive award-winning programming continues to be a valuable differentiator for our viewers, advertisers and the cable, satellite, telephone and other platforms that distribute our networks (“Distributors”). Our networks are widely distributed throughout our territory, which includes all of New York State and significant portions of New Jersey and Connecticut, as well as parts of Pennsylvania. Our networks are also carried nationally by certain distributors on sports tiers or in similar packages.
We continually seek to enhance the value that our networks provide to viewers, advertisers and Distributors by delivering high-quality, best-in-class content and live viewing experiences utilizing state-of-the-art technology. We operate in the nation’s largest television market, the New York Designated Market Area (“DMA”), and attract an important and coveted demographic. Our unique position in this major media market, as the provider of exclusive live local games of top professional sports teams and other significant sports programming, allows us to optimize distribution revenue and partner with marquee brands to capture advertising sales and explore new content opportunities. We extend the distribution of our content through MSG GO, our live authenticated streaming and video on demand offering, and continue to evaluate new distribution avenues for our programming. In addition, we utilize a dedicated website, and social media platforms to promote our brands by teasing content, spotlighting on-air talent, and providing in-depth information on our networks’ teams.
3
Programming
Beginning with the debut of MSGN as the first regional sports network in the country in 1969, we have been at the forefront of the industry, consistently pushing the boundaries of regional sports coverage. In the process, our networks have become a powerful platform for some of the world’s greatest athletes and entertainers.
With our commitment to programming excellence, we have earned a reputation for best-in-class programming, production, marketing and technical innovation. Over the past 10 years, we have won 162 New York Emmy Awards (“Emmys”) for live sports and original programming. This includes 140 Emmys for MSGN alone — more than any other single station or network in the region over that time frame.
The foundation of our programming is our professional sports coverage. MSGN and MSG+ are home to ten professional sports teams. We deliver live games of the New York Knicks (the “Knicks”) of the National Basketball Association (“NBA”); the New York Rangers (the “Rangers”), New York Islanders (the “Islanders”), New Jersey Devils (the “Devils”) and Buffalo Sabres (the “Sabres”) of the National Hockey League (“NHL”); the New York Liberty (the “Liberty”) of the Women's National Basketball Association (“WNBA”); the New York Red Bulls (the “Red Bulls”) of Major League Soccer (“MLS”), and the Westchester Knicks of the National Basketball Association Gatorade League (“NBAGL”) (formerly known as the National Basketball Association Development League). Additionally, we air programming of the New York Giants (the “Giants”) and Buffalo Bills (the “Bills”) of the National Football League (“NFL”). Our arrangements include long-term media rights agreements with all of our NBA and NHL teams.
Each year, MSGN and MSG+ collectively telecast approximately 500 live professional games, along with a comprehensive lineup of other sporting events, including college football and basketball, and other original programming designed to give fans behind-the-scenes access and insight into the teams and players they love. This content includes comprehensive pre- and post-game coverage throughout the seasons, along with other team-related programming that features coaches, players and more, all of which enable us to capitalize on the extraordinary enthusiasm of our teams’ fans. Distinguishing these shows further is our roster of analysts and on-air talent, which includes Mike Breen, Walt Frazier, Sam Rosen, Joe Micheletti, Al Trautwig, and Kenny Albert, among others.
As the “Official Regional Sports Home” of the Giants NFL franchise, our networks featured content specifically for Giants fans during the 2016-17 NFL season, including: pre-season game replays, a new official post-game show and live coverage of the head coach’s weekly press conference. Other team-related programming included “Giants Training Camp Live,” a series of live shows from Giants training camp, and “Giants First & 10,” a weekly one-hour preview show, as well as a brand new show, “Giants Life,” which takes fans inside the daily lives and routines of the team’s players and coaches. MSG Networks’ western New York viewers enjoyed a slate of programming dedicated to the Bills during the 2016-17 NFL season, including “Bills All Access” and “Bills Tonight”. We also simulcast two of Buffalo’s most popular weekday sports radio shows — “The John Murphy Show,” featuring the voice of the Bills, and “The Instigators,” which provides Sabres fans with exclusive access to the team.
In addition to our live games and team-related programming, we produce a slate of original programming. Notable highlights this past year include: “Beginnings,” which chronicles how athletes and entertainers got their start; and “The MSG Hockey Show,” in which the show’s hosts — Arda Ocal, Will Reeve and Anson Carter — highlight the week’s hottest stories in hockey.
We also license other sports and entertainment programming, which this past year included live National Collegiate Athletic Association (“NCAA”) basketball and football, the New York Cosmos of the North American Soccer League, Union of European Football Association soccer, Bundesliga soccer, and Ultimate Fighting Championship and other mixed martial arts, as well as tennis and boxing programs. In addition, MSG Networks delivered select titles from “30 for 30,” ESPN’s documentary series.
In addition to MSGN and MSG+, the Company distributes programming through MSG GO, our TV Everywhere product. With participating Distributors (currently Altice USA, Comcast, Verizon FiOS, Service Electric Broadband Cable and RCN), MSG GO allows subscribers to access live television and video on demand content using their smartphones, tablets and computers. In February 2017, we reached an agreement with the NHL that allows us to live stream our local Rangers, Islanders, Devils and Sabres telecasts. This enabled us to add our unmatched lineup of live, local NHL games to our existing slate of MSG GO content, which includes all live Knicks, Red Bulls and Liberty games appearing on our networks, as well as current and past episodes of our original programming.
4
Revenue
The Company generates revenues principally from affiliate fees charged to Distributors for the right to carry our programming networks, as well as from the sale of advertising. The following customers each accounted for more than 10% of consolidated revenues for the year ended June 30, 2017: Altice USA, AT&T, Charter, and Verizon.
Affiliation Fee Revenue
Our networks are distributed pursuant to carriage agreements that are typically structured as multi-year agreements with staggered expiration dates and generally provide for annual contractual rate increases. We primarily earn revenue under these agreements based on the number of each Distributor’s subscribers or, in some cases, based on a fixed contractual monthly fee. Our affiliation agreements include certain protections relating to the manner in which our networks are carried and the compensation for such carriage. Examples of such protections include: carriage requirements; penetration minimums (which may require that our networks are made available to significant percentages of our Distributors’ basic subscribers); tag-along requirements (which require that MSGN and MSG+ are carried on the same tier as similar networks); and/or payment minimums (which require us to be compensated based on significant percentages of our Distributors’ subscribers). Affiliation fee revenue constituted at least 90% of our consolidated revenues for the year ended June 30, 2017.
MSGN and MSG+ are widely carried by major Distributors in our region, with an average combined reach of approximately 7.1 million viewing subscribers (as of the most recent available information) in our regional territory, which includes the entire State of New York and significant portions of New Jersey and Connecticut, as well as parts of Pennsylvania. Our networks also enjoy national distribution with certain Distributors on sports tiers or in similar packages.
Advertising Revenue
The Company’s programming, distribution territory and viewer demographics make our networks highly attractive to advertisers. Our networks operate in the largest television market in the country, the New York DMA, and, with our exclusive live game coverage, offer advertisers an increasingly scarce asset in today’s evolving media landscape - the ability to reach engaged audiences on a live basis. MSG Networks’ viewers, a significant portion of which are between the ages of 25-54 with high household incomes, also offer an extremely appealing demographic for advertisers.
In addition, we benefit from our advertising sales representation agreement with MSG, which provides for the packaged sale of certain network advertising inventory as part of team and arena marketing and sponsorship sales.
Advertising revenue is based on the price received for available advertising inventory. Substantially all of our advertising revenue is derived from the sale of inventory in our live professional sports programming. The value of this inventory is dependent upon a number of factors, including team performance, ratings and general economic conditions. Advertising time is sold both in advance and in scatter markets.
Garden of Dreams Foundation
Our Company has a close association with the Garden of Dreams Foundation (the “Foundation”), a non-profit charity that has brightened the lives of more than 325,000 children and their families. The Foundation, which started in 2006, works with 28 partner organizations throughout the tristate area, including hospitals, wish organizations and community-based organizations, to reach children who are facing challenges such as homelessness, extreme poverty, illness and foster care. The Foundation takes pride in its commitment to truly change lives, hosting more than 500 events and programs each year. In 2007, the Company and the Foundation launched “MSG Classroom,” an Emmy Award-winning educational program to teach high school students about the media industry. The eight-week program provides a hands-on opportunity for students to develop skills, including broadcasting, script writing and production, and culminates with the students creating their own special television feature. The MSG Classroom program has been recognized with multiple Beacon Awards in the “Education” category, as well as a New York Emmy Award in the “Community Service” category.
Regulation
The Federal Communications Commission (“FCC”) imposes regulations directly on programming networks and also imposes regulations on certain distributors that affect programming networks indirectly. The rules, regulations, policies and procedures affecting our business are subject to change. The following paragraphs describe the existing legal and regulatory requirements that are most significant to our business today; they do not purport to describe all present and proposed laws and regulations affecting our business.
5
Closed Captioning
Our programming networks must provide closed captioning of video programming for the hearing impaired and meet certain captioning quality standards. The FCC and certain of our affiliation agreements require us to certify compliance with such standards. We are also required to provide closed captioning on certain video content delivered via the Internet.
Commercial Loudness
FCC rules require multichannel video programming distributors (“MVPD”) to ensure that all commercials comply with specified volume standards, and certain of our affiliation agreements require us to certify compliance with such standards.
Advertising Restrictions on Children’s Programming
Any programming and associated Internet websites intended primarily for children under 12 years of age that we may offer must comply with certain limits on commercial content.
Obscenity Restrictions
Distributors are prohibited from transmitting obscene programming, and certain of our affiliation agreements require us to refrain from including such programming on our networks.
Packaging and Pricing
The FCC periodically considers examining whether to adopt rules regulating how programmers package and price their networks, such as whether programming networks require distributors to purchase and carry undesired programming in return for the right to carry desired programming and, if so, whether such arrangements should be prohibited.
Effect of “Must-Carry” Requirements
The FCC’s implementation of the statutory “must-carry” obligations requires cable and satellite distributors to give broadcasters preferential access to channel space. This may reduce the amount of channel space that is available for carriage of our networks.
Website and Mobile Application Requirements
We maintain various websites and mobile applications that may be subject to third-party application store requirements, as well as a range of federal, state and local laws such as privacy, accessibility for persons with disabilities, and consumer protection regulations.
Competition
Distribution of Programming Networks
The business of distributing programming networks is highly competitive. Our programming networks face competition from other programming networks for the right to be carried by a particular distributor, and for the right to be carried on the service tier that will attract the most subscribers. Once a programming network of ours is carried by a distributor, that network competes for viewers not only with the other programming networks available through the distributor, but also with pay-per-view programming and video on demand offerings, as well as Internet and online services, mobile applications, radio, print media, motion picture theaters, home video, and other sources of information, sporting events and entertainment. Each of the following competitive factors are important to our networks: the prices we charge for our programming networks; the quantity, quality and variety of programming offered on our networks; and the effectiveness of our networks’ marketing efforts.
Our ability to successfully compete with other programming networks for distribution may be hampered because the distributors may be affiliated with other programming networks. In addition, because such affiliated distributors may have a substantial number of subscribers, the ability of such competing programming networks to obtain distribution on affiliated distributors may lead to increased subscriber and advertising revenue for such networks because of their increased penetration compared to our programming networks. Even if such affiliated distributors carry our programming networks, there is no assurance that such distributors will not place their affiliated programming network on a more desirable tier, thereby giving the affiliated programming network a competitive advantage over our own.
New or existing programming networks that are owned by or affiliated with broadcast networks such as NBC, ABC, CBS or Fox may also have a competitive advantage over our networks in obtaining distribution through the “bundling” of agreements to carry those programming networks with the agreement giving the distributor the right to carry a broadcast station owned by or affiliated with the network.
6
In addition, content providers (such as certain broadcast and cable networks) and new content developers, distributors and syndicators (such as Amazon and Netflix), are distributing programming directly to consumers on an “over-the-top” (“OTT”) basis. Such direct-to-consumer OTT distribution of content may facilitate consumers eliminating or downgrading their pay television subscription, which may result in certain consumers not receiving our programming networks.
See “Item 1A. Risk Factors — Our Business Faces Intense and Wide-Ranging Competition Which May Have a Material Negative Effect on Our Business and Results of Operations” and “— We May Not Be Able to Adapt to New Content Distribution Platforms and to Changes in Consumer Behavior Resulting From Emerging Technologies, Which May Have a Material Negative Effect on Our Business and Results of Operations.” See also “Part II — Item 7. Management’s Discussion and Analysis of Financial Condition and Results of Operations — Business Overview — Revenue Sources” for a discussion of our customers.
Sources of Programming
We also compete with other networks and other distribution outlets to secure desired programming, including sports-related programming. Competition for programming increases as the number of programming networks and distribution outlets increases. Other programming networks that are affiliated with or otherwise have larger relationships with programming sources such as sports teams or leagues, movie or television studios, or film libraries may have a competitive advantage over us in this area.
Competition for Sports Programming Sources
Because the loyalty of the sports viewing audience to a sports programming network is primarily driven by loyalty to a particular team or teams, access to adequate sources of sports programming is particularly critical to our networks. In connection with the Distribution, the Company entered into long-term media rights agreements with MSG providing us with the exclusive media rights to Knicks and Rangers games, and the Company has long-term media rights agreements with the Islanders, Devils and Sabres. Our rights with respect to these professional teams may be limited in certain circumstances due to rules imposed by the leagues in which they compete. Our programming networks compete for telecast rights for other teams or events principally with national or regional programming networks that specialize in or carry sports programming; local and national commercial broadcast television networks; independent syndicators that acquire and resell such rights nationally, regionally and locally; and Internet and mobile-based distributors of programming. Some of our competitors may own or control, or are owned or controlled by, sports teams, leagues or sports promoters, which gives them an advantage in obtaining telecast rights for such teams or sports. Distributors may also contract directly with the sports teams in their local service areas for the right to distribute games on their systems.
The increasing amount of sports programming available on a national basis, including pursuant to national media rights arrangements (e.g., NBA on ABC, ESPN, and TNT and NHL on NBC and NBC Sports Network), as part of league-controlled sports programming networks (e.g., NBA TV and NHL Network), and in out-of-market packages (e.g., NBA League Pass and NHL Center Ice) and league and other websites and mobile applications, may have an adverse impact on our competitive position as our programming networks compete for distribution and for viewers.
Two professional sports teams located in New York have ownership interests in programming networks featuring the games of their teams, which adversely affects the competitive position of the Company by denying or limiting our access to those games for our own networks and subjecting our networks to competition from these networks.
Competition for Advertising Revenue
The level of our advertising revenue depends in part upon unpredictable and volatile factors beyond our control, such as viewer preferences, the quality and appeal of the competing programming and the availability of other entertainment activities. See “Item 1A. Risk Factors — We Derive Substantial Revenues From the Sale of Advertising Time and Those Revenues Are Subject to a Number of Factors, Many of Which Are Beyond Our Control.”
Employees
As of June 30, 2017 we had approximately 175 full-time union and non-union employees and 613 part-time union and non-union employees. Approximately 74% of our employees were represented by unions as of June 30, 2017. Labor relations in general and in the sports and entertainment industry in particular can be volatile, though we believe that our current relationships with our unions taken as a whole are positive.
7
Financial Information about Segments and Geographic Areas
Following the Distribution, the Company operates and reports financial information in one segment. Substantially all revenues and assets of the Company are attributed to or located in the United States and are primarily concentrated in the New York City metropolitan area. Financial information for each of the years ended June 30, 2017, 2016, and 2015 is set forth in “Part II — Item 7. Management’s Discussion and Analysis of Financial Condition and Results of Operations,” and “Part II — Item 8. Financial Statements and Supplementary Data,” of this Annual Report on Form 10-K.
Item 1A. Risk Factors
The Success of Our Business Depends on Affiliation Fees We Receive Under Our Affiliation Agreements, the Loss of Which or Renewal of Which on Less Favorable Terms May Have a Material Negative Effect on Our Business and Results of Operations.
Our success is dependent upon the existence and terms of our agreements with Distributors. Existing affiliation agreements of our programming networks expire at various dates. We cannot provide assurances that we will be able to renew these affiliation agreements or obtain terms as attractive as our existing agreements in the event of a renewal.
Affiliation fees constitute a significant majority of our revenues. Changes in affiliation fee revenues result from a combination of changes in rates and/or changes in subscriber counts. Reductions in the license fees that we receive per subscriber or in the number of subscribers for which we are paid, including as a result of a loss of or reduction in carriage of our programming networks, would adversely affect our affiliation fee revenue. For example, Distributors may introduce, market and/or modify tiers of programming networks that could impact the number of subscribers that receive our programming networks, including tiers of programming that may exclude our networks. Any loss or reduction in carriage would also decrease the potential audience for our programming, which may adversely affect our advertising revenues. See “— If the Rate of Decline in the Number of Subscribers to Traditional MVPD Services Increases or These Subscribers Shift to Other Services or Bundles That Do Not Include the Company’s Programming Networks, There May Be a Material Negative Effect on the Company’s Affiliation Revenues.”
Our affiliation agreements generally require us to meet certain content criteria, such as minimum thresholds for professional event telecasts throughout the year on our networks. If we were unable to meet these criteria, we could become subject to remedies available to the Distributors, which may include fee reductions, rebates or refunds and/or termination of these agreements in some cases.
In addition, under certain circumstances, an existing affiliation agreement may expire and the parties may have not finalized negotiations of either a renewal of that agreement or a new agreement for certain periods of time. In certain of these circumstances, Distributors may continue to carry the service(s) until the execution of definitive renewal or replacement agreements (or until we or the Distributor determine that carriage should cease).
Occasionally we may have disputes with Distributors over the terms of our affiliation agreements. If not resolved through business discussions, such disputes could result in litigation or actual or threatened termination of an existing agreement.
Our business is dependent upon affiliation relationships with a limited number of Distributors. The loss of any of our significant Distributors, the failure to renew on terms as attractive as our existing agreements (or to do so in a timely manner) or disputes with our counterparties on the interpretation of their agreements with us could materially negatively affect our business and results of operations. See “— We Depend on a Limited Number of Distributors for a Significant Portion of Our Revenues and Further Industry Consolidation Could Adversely Affect Our Business and Results of Operations.”
Our Business Faces Intense and Wide-Ranging Competition Which May Have a Material Negative Effect on Our Business and Results of Operations.
Our business competes, in certain respects and to varying degrees, for viewers and advertisers with other programming networks, pay-per-view, video on demand, event live streaming, and other content offered by distributors. We also compete for viewers and advertisers with content offered over the Internet and broadband services, mobile media, radio, motion picture, home video and other sources of information and entertainment and advertising services. Important competitive factors are the prices charged for programming, the quantity, quality (in particular, the performance of the sports teams whose media rights we control) and the variety of the programming offered and the effectiveness of marketing efforts.
New or existing programming networks that are owned by or affiliated with broadcast networks such as NBC, ABC, CBS or Fox may have a competitive advantage over our networks in obtaining distribution through the “bundling” of agreements to
8
carry those programming networks with the agreement giving the distributor the right to carry a broadcast station owned by or affiliated with the network.
The competitive environment in which our business operates may also be affected by technological developments. It is difficult to predict the future effect of technology on many of the factors affecting our competitive position.
With respect to advertising services, factors affecting the degree and extent of competition include prices, reach and audience demographics among others. Some of our competitors are large companies that have greater financial resources available to them than we do which could impact our viewership and the resulting advertising revenues.
We May Not Be Able to Adapt to New Content Distribution Platforms and to Changes in Consumer Behavior Resulting From Emerging Technologies, Which May Have a Material Negative Effect on Our Business and Results of Operations.
We must successfully adapt to technological advances in our industry, including the emergence of alternative distribution platforms. Our ability to exploit new distribution platforms and viewing technologies may affect our ability to maintain and/or grow our business. Emerging forms of content distribution may provide different economic models and compete with current distribution methods in ways that are not entirely predictable. Such competition could reduce demand for our programming networks or for the offerings of our Distributors, and reduce our revenue from these sources. Content providers (such as certain broadcast and cable networks) and new content developers, distributors and syndicators (such as Amazon and Netflix), are distributing programming directly to consumers on an OTT basis. Such direct-to-consumer OTT distribution of content may facilitate consumers eliminating or downgrading their pay television subscription, which may result in certain consumers not receiving our programming networks. Gaming and other consoles such as Microsoft’s Xbox, Sony’s PlayStation, Nintendo’s Wii, Apple TV, and Roku are also establishing themselves as alternative providers of video services. Such changes may impact the revenues we are able to generate from our traditional distribution methods, by decreasing the viewership of our programming networks on cable and other MVPD systems which are almost entirely directed at television video delivery and/or by making advertising on our programming networks less valuable to advertisers. If we fail to adapt our distribution methods and content to emerging technologies, our appeal to our targeted audiences might decline and there could be a material negative effect on our business and results of operations. MSG GO, which is our live streaming and on-demand product, is available to subscribers through several of our Distributors. There can be no assurance that MSG GO will be able to attract a meaningful number of users.
In addition, advertising revenues could be significantly impacted by emerging technologies, given that advertising sales are dependent on audience measurement provided by third parties, and the results of audience measurement techniques can vary independent of the size of the audience for a variety of reasons, including difficulties related to the traditional statistical sampling methods, ability to measure new distribution platforms and viewing technologies, and the shifting of the marketplace to the use of measurement of different viewer behaviors, such as delayed viewing. In addition, multiplatform campaign verification is in its infancy, and viewership on tablets, smart phones and other mobile devices, which continues to grow, is presently not measured by any one consistently applied method. Moreover, devices that allow users to fast forward or skip programming, including commercials, are causing changes in consumer behavior that may affect the desirability of our programming networks to advertisers. These variations and changes could have a significant effect on advertising revenues.
If the Rate of Decline in the Number of Subscribers to Traditional MVPD Services Increases or These Subscribers Shift to Other Services or Bundles That Do Not Include the Company’s Programming Networks, There May Be a Material Negative Effect on the Company’s Affiliation Revenues.
During the last few years, the number of subscribers to traditional MVPD services in the U.S. has been declining. In addition, Distributors have introduced, marketed and/or modified tiers or bundles of programming that have impacted the number of subscribers that receive our programming networks, including tiers or bundles of programming that exclude our programming networks. As a result of these factors, the Company has experienced a decrease in viewing subscribers during each of our last three fiscal years which has adversely affected our operating results.
If traditional MVPD service offerings are not attractive to consumers due to pricing, increased competition from OTT services, increased dissatisfaction with the quality of traditional MVPD services, poor economic conditions or other factors, more consumers may (i) cancel their traditional MVPD service subscriptions or choose not to subscribe to traditional MVPD services, (ii) elect to instead subscribe to OTT services, which in some cases may be offered at a lower price-point or (iii) elect to subscribe to smaller bundles of programming which may not include our programming networks. If the rate of decline in the number of traditional MVPD service subscribers increases or if subscribers shift to OTT services or smaller bundles of programming that do not include the Company’s programming networks, this may have a material negative effect on the Company’s affiliate revenue.
9
We Depend on a Limited Number of Distributors for a Significant Portion of Our Revenues and Further Industry Consolidation Could Adversely Affect Our Business and Results of Operations.
The pay television industry is highly concentrated, with a relatively small number of distributors serving a significant percentage of pay television subscribers that receive our programming networks, thereby affording the largest distributors significant leverage in their relationship with programming networks, including us. Substantially all of our affiliation fee revenue comes from our top five Distributors. Further consolidation in the industry could reduce the number of distributors available to distribute our programming networks and increase the negotiating leverage of certain distributors, which could adversely affect our revenue. In some cases, if a Distributor is acquired, the affiliation agreement of the acquiring Distributor will govern following the acquisition. In those circumstances, the acquisition of a Distributor that is a party to one or more affiliation agreements with us on terms that are more favorable to us than that of the acquirer could have a material negative impact on our business and results of operations. See Note 18 to the consolidated financial statements included in Item 8 of this Annual Report on Form 10-K.
We Derive Substantial Revenues From the Sale of Advertising Time and Those Revenues Are Subject to a Number of Factors, Many of Which Are Beyond Our Control.
Advertising revenues depend on a number of factors, many of which are beyond our control, such as: (i) the health of the economy in the markets our businesses serve and in the nation as a whole; (ii) general economic trends in the advertising industry; (iii) the popularity of our programming; (iv) the activities of our competitors, including increased competition from other forms of advertising-based media (such as Internet, mobile media, other programming networks, radio and newspaper); (v) shifts in consumer viewing patterns, including consumers watching more non-traditional and shorter-form video content online, and the increased use of DVRs to skip advertisements; (vi) declining consumer tolerance for commercial interruptions; (vii) an increasing shift of advertising expenditures to online and mobile offerings; (viii) increasing audience fragmentation caused by increased availability of alternative forms of leisure and entertainment activities; (ix) consumer budgeting and buying patterns; (x) the extent of distribution; and (xi) team performance. A decline in the economic prospects of advertisers or the economy in general could alter current or prospective advertisers’ spending priorities, which could cause our revenues and operating results to decline significantly in any given period.
In addition, the pricing and volume of advertising may be affected by shifts in spending away from more traditional media toward online and mobile offerings or towards new ways of purchasing advertising, such as through automated purchasing, dynamic advertising insertion, third parties selling local advertising spots and advertising exchanges, some or all of which may not be as advantageous to the Company as current advertising methods.
In addition, we cannot ensure that our programming will achieve favorable ratings. Our ratings depend partly upon unpredictable and volatile factors beyond our control, such as viewer preferences, the level of distribution of our programming, team performance, competing programming and the availability of other entertainment activities. A shift in viewer preferences could cause our advertising revenues to decline as a result of changes to the ratings for our programming and materially negatively affect our business and results of operations. As noted below, MSG has the exclusive right and obligation to sell our advertising availabilities on our behalf for a commission and, as a result, our advertising revenues are dependent to a material extent on MSG’s sales performance, subject to certain termination rights. See “—We Rely on MSG’s Performance Under Various Agreements.”
Our Media Rights Agreements With Various Professional Sports Teams Have Varying Durations and Terms and We May Be Unable to Renew Those Agreements on Acceptable Terms or Such Rights May Be Lost for Other Reasons.
Our business is dependent upon media rights agreements with professional sports teams. Upon expiration, we may seek renewal of these agreements and, if we do, we may be outbid by competing programming networks or others for these agreements or the renewal costs could substantially exceed our costs under the current agreements. Even if we are able to renew such agreements, the Company’s results could be adversely affected if escalations in sports programming rights costs are unmatched by increases in affiliation and advertising revenues. In addition, one or more of these teams may seek to establish their own programming network or join a competitor’s network and, in certain circumstances, we may not have an opportunity to bid for the media rights. Moreover, the value of these agreements may also be affected by various league decisions and/or league agreements that we may not be able to control, including a decision to alter the number of games played during a season. The value of these media rights can also be affected, or we could lose such rights entirely, if a team is liquidated, undergoes reorganization in bankruptcy or relocates to an area where it is not possible or commercially feasible for us to continue to distribute games. Any loss or diminution in the value of rights could impact the extent of the sports coverage offered by us and could materially negatively affect our business and results of operations. In addition, our affiliation
10
agreements typically include certain remedies in the event our networks fail to meet a minimum number of professional events, and, accordingly, any loss of rights could materially negatively affect our business and results of operations.
The Actions of the Basketball and Hockey Leagues May Have a Material Negative Effect on Our Business and Results of Operations.
The governing bodies of the NBA and the NHL have imposed, and may impose in the future, various rules, regulations, guidelines, bulletins, directives, policies and agreements (collectively, “League Rules”), which could have a material negative effect on our business and results of operations. For example, each league imposes rules that define the territories in which we may distribute games of the teams in the applicable league. Changes to these rules or other League Rules, or the adoption of new League Rules, could have a material negative effect on our business and results of operations.
Our Business is Substantially Dependent on the Continued Popularity of the NBA and NHL Teams Whose Media Rights We Control.
Our business has historically been, and we expect will continue to be, dependent on the popularity of the teams whose media rights we control and, in varying degrees, those teams achieving on-court and on-ice success, which can generate fan enthusiasm, resulting in increased viewership and advertising revenues. Furthermore, success in the regular season may qualify a team for participation in the post-season, which generates increased excitement and interest in the teams, which can improve viewership and advertising revenues. In addition, if a team declines in popularity or fails to generate fan enthusiasm, this may negatively impact the terms on which our affiliate agreements are renewed. There can be no assurance that any sports team will continue to generate fan enthusiasm or compete in post-season play and the failure to do so could result in a material negative effect on our business and results of operations.
We May Be Unable to Obtain Programming From Third Parties on Reasonable Terms, Which Could Lead to Higher Costs.
We rely on third parties for sports and other programming for our networks. We compete with other providers of programming to acquire the rights to distribute such programming. If we fail to continue to obtain sports and other programming for our networks on reasonable terms for any reason, including as a result of competition, we could be forced to incur additional costs to acquire such programming or look for alternative programming, which may have a material negative effect on our business and results of operations.
Our Business Depends on the Appeal of Our Programming, Which May Be Unpredictable, and Increased Programming Costs May Have a Material Negative Effect on Our Business and Results of Operations.
Our business depends in part upon viewer preferences and audience acceptance of the programming on our networks. These factors are often unpredictable and subject to influences that are beyond our control, such as the quality and appeal of competing programming, general economic conditions and the availability of other entertainment options. We may not be able to successfully predict interest in proposed new programming and viewer preferences could cause new programming not to be successful or cause our existing programming to decline in popularity. An increase in our costs associated with programming, including original programming, may materially negatively affect our business and results of operations.
Our Business Has Been Adversely Impacted and May, in the Future, Be Materially Adversely Impacted by an Economic Downturn and Financial Instability.
Our business depends upon the ability and willingness of consumers and businesses to subscribe to a package of programming that includes our networks. In addition, our business is dependent upon advertising revenues. As a result, instability and weakness of the U.S. and global economies and the negative effects on consumers’ and businesses’ discretionary spending may materially negatively affect our business and results of operations.
Weather or Other Conditions Which Are Outside Our Control May Disrupt Our Programming and May Have a Material Negative Effect on Our Business and Results of Operations.
Weather or other conditions, including natural disasters, acts of terrorism and similar events, which are outside our control may prevent us or our Distributors from providing our programming to customers, may reduce advertising expenditures and may have a material negative effect on our business and results of operations.
11
We Are Subject to Governmental Regulation and Our Failure to Comply With These Regulations May Have a Material Negative Effect on Our Business and Results of Operations.
Our business is subject to federal, state and local laws and regulations. Some FCC regulations apply to us directly and other FCC regulations, although imposed on distributors, affect programming networks indirectly. See “Item 1. Business — Regulation.” Legislative enactments, court actions, and federal regulatory proceedings could materially affect our programming business by modifying the rates, terms, and conditions under which we offer our programming networks to distributors and the public, or otherwise materially affect the range of our activities or strategic business alternatives. We cannot predict the likelihood or results of any such legislative, judicial, or regulatory actions. Furthermore, to the extent that regulations and laws, either presently in force or proposed, hinder or stimulate the growth of distributors, our business could be affected. The U.S. Congress and the FCC currently have under consideration, and may in the future adopt, amend, or repeal, laws, regulations and policies regarding a wide variety of matters that could, directly or indirectly, affect our business. The regulation of distributors is subject to the political process and has been in constant flux over the past two decades. Further material changes in the law and regulatory requirements must be anticipated. We cannot assure you that our business and our results of operations will not be materially negatively affected by future legislation, new regulation or deregulation.
Our business is, and may in the future be, subject to a variety of other laws and regulations, including licensing requirements; working conditions, labor, immigration and employment laws; and privacy laws.
Our failure to comply with applicable governmental laws and regulations, or to maintain necessary permits or licenses, could have a material negative effect on our business and results of operations.
We Face Continually Evolving Cybersecurity and Similar Risks, Which Could Result in the Disclosure of Confidential Information, Disruption of Our Business, Damage to Our Brands and Reputation, Legal Exposure and Financial Losses.
Through our operations, we may collect, and store, including by electronic means, certain personal information that is provided to us, including through registration on our websites, mobile applications or otherwise in communication or interaction with us. These activities require the use of online services and centralized data storage, including through third party service providers. Data maintained in electronic form is subject to the risk of intrusion, tampering or theft. Our ability to safeguard such personal information and other confidential information, including information regarding the Company and our Distributors, advertisers and employees, is important to our business. We take these matters seriously and take significant steps to protect our stored information. These protections are costly and require ongoing monitoring and updating as technologies change and efforts to overcome security measures become more sophisticated. Despite our efforts, the risks of a data breach cannot be entirely eliminated and our information technology and other systems that maintain and transmit consumer, Distributor, advertiser, Company, employee and other confidential information may be compromised by a malicious penetration of our network security, or that of a third-party service provider, including MSG to which we outsource our information technology support, due to employee error, computer malware or ransomware, viruses, hacking and phishing attacks, or otherwise. Additionally, outside parties may attempt to fraudulently induce employees or users to disclose sensitive or confidential information in order to gain access to data. As a result, such personal and/or confidential information may be lost, disclosed, accessed or taken without their consent, and the security of our other confidential information may be compromised. See —“We Rely on MSG’s Performance Under Various Agreements” for a discussion of services MSG performs on our behalf.
If our electronically stored data is compromised, our ability to conduct business may be interrupted or impaired, we may lose profitable opportunities or the value of those opportunities may be diminished and we may lose revenue as a result of unlicensed use of our intellectual property. Further, a penetration of our network security or other misappropriation or misuse of personal or confidential information could subject us to business and litigation risk, including costs associated with such misappropriation or misuse, and damage our reputation, which could have a material negative effect on our business and results of operations.
We Have Substantial Indebtedness and Are Highly Leveraged, Which Could Adversely Affect Our Business.
Immediately prior to the Distribution we incurred a significant amount of debt, substantially all of the proceeds of which were contributed to MSG. We may also continue to incur additional debt in the future. We are highly leveraged and expect to continue to be highly leveraged. As a result, our interest and principal payments on our borrowings are significant in relation to our revenues and cash flows. These payments reduce our earnings and cash available for other potential business purposes. This leverage also exposes us to significant risk by limiting our flexibility in planning for, or reacting to, changes in our business (whether through competitive pressure or otherwise), the cable and telecommunications industries, and the economy at large. Although our cash flows could decrease in these scenarios, our required payments in respect of indebtedness would not decrease.
12
In addition, our ability to make payments on, or repay or refinance, such debt, and to fund our operating and capital expenditures, depends largely upon our future operating performance. Our future operating performance, to a certain extent, is subject to general economic, financial, competitive, regulatory and other factors that are beyond our control. Furthermore, our interest expense could increase if interest rates increase because our indebtedness bears interest at floating rates or to the extent we have to refinance existing debt with higher cost debt.
We May Require Additional Financing to Fund Our Ongoing Operations and Capital Expenditures, the Availability of Which is Highly Uncertain.
The capital and credit markets can experience volatility and disruption. Such markets can exert extreme downward pressure on stock prices and upward pressure on the cost of new debt capital and can severely restrict credit availability for most issuers.
Although we have a revolving credit facility (see “Part II - Item 7. Management’s Discussion and Analysis of Financial Condition and Results of Operations — Liquidity and Capital Resources — Financing Agreements”), our ability to draw on such facility will depend on our ability to meet certain financial tests and other conditions. In addition, there can be no assurance that we will be able to refinance any such facility in the future or raise any required additional capital or do so on favorable terms. Depending upon conditions in the financial markets and/or the Company’s financial performance, we may not be able to raise capital on favorable terms, or at all.
Organized Labor Matters May Have a Material Negative Effect on Our Business and Results of Operations.
Our business is substantially dependent upon the efforts of unionized workers. Any labor disputes, such as strikes or lockouts, with the unions with which we have collective bargaining agreements, could have a material negative effect on our business and results of operations by impacting our ability to produce or present programming.
In addition, we may be impacted by union relations of the NBA and the NHL. Both the NBA and the NHL have experienced labor difficulties in the past and may have labor issues, such as players’ strikes or management lockouts, in the future. For example, the NBA has experienced labor difficulties, including lockouts during the 1998-99 and 2011-12 seasons, resulting in a shortened regular season in each case. The NHL has also experienced labor difficulties, including lockouts during the 1994-95 and 2012-13 seasons, resulting in a shortened regular season in each case, and a lockout beginning in September 2004, which resulted in the cancellation of the entire 2004-05 NHL season.
The Unavailability of Satellites, Facilities, Systems and/or Software Upon Which We Rely May Have a Material Negative Effect on Our Business and Results of Operations.
We use satellite and other systems to transmit our programming services to Distributors. The distribution facilities include uplinks, communications satellites, and downlinks. Notwithstanding certain back-up and redundant systems, transmissions may be disrupted, including as a result of events that impair uplinks, downlinks or transmission facilities or the impairment of satellite or terrestrial facilities. Currently, there are a limited number of communications satellites available for the transmission of programming. If a disruption occurs, we may not be able to secure alternate distribution facilities in a timely manner. In addition, we rely upon various internal and third-party systems or software in the operation of our business, including, with respect to database, inventory, human resource management, and financial systems. From time to time, certain of these arrangements may not be covered by long-term agreements. In addition, such distribution facilities and/or internal or third party services, systems or software could be adversely impacted by unauthorized breaches. The failure or unavailability of distribution facilities or these internal and third-party services, systems or software, depending upon its severity and duration, could have a material negative effect on our business and results of operations.
We May Become Subject to Infringement or Other Claims Relating to Our Content or Technology.
From time to time, third parties may assert against us alleged intellectual property (e.g., copyright, trademark and patent) or other claims relating to our programming, technologies, digital content or other content, some of which may be important to our business. In addition, our programming could potentially subject us to claims of defamation or similar types of allegations. Any such claims, regardless of their merit, could cause us to incur significant costs. In addition, if we are unable to continue use of certain intellectual property rights, our business and results of operations could be materially negatively impacted.
Theft of Our Intellectual Property May Have a Material Negative Effect on Our Business and Results of Operations.
The success of our business depends in part on our ability to maintain and monetize our intellectual property rights to our programming, technologies, digital content and other content that is material to our business. Theft of our intellectual property, including content, could have a material negative effect on our business and results of operations because it may reduce the revenue that we are able to receive from the legitimate sale and distribution of our content, undermine lawful distribution
13
channels, limit our ability to control the marketing of our content and inhibit our ability to recoup or profit from the costs incurred to create such content. Litigation may be necessary to enforce our intellectual property rights or protect our trade secrets. Any litigation of this nature, regardless of the outcome, could cause us to incur significant costs.
We May Pursue Acquisitions and Other Strategic Investments to Complement or Expand Our Business That May Not Be Successful.
We may explore opportunities to purchase or invest in other businesses or assets that could complement, enhance or expand our current business or that might otherwise offer us growth opportunities, including opportunities that may differ from the Company’s current business. Any transactions that we are able to identify and complete may involve risks, including the commitment of significant capital, the incurrence of indebtedness, the payment of advances, the diversion of management’s attention and resources from our existing business to develop and integrate the acquired or combined business, the inability to successfully integrate such business or assets into our operations, litigation or other claims in connection with acquisitions or against companies we invest in or acquire, our lack of control over joint venture companies and other minority investments, the risk of not achieving the intended results and the exposure to losses if the underlying transactions or ventures are not successful. Any such risks could result in a material negative effect on our business and results of operations.
We Are Controlled by the Dolan Family. As a Result of Their Control, the Dolan Family Has the Ability to Prevent or Cause a Change in Control or Approve, Prevent or Influence Certain Actions by the Company.
We have two classes of common stock:
• | Class A Common Stock, which is entitled to one vote per share and is entitled collectively to elect 25% of our Board of Directors. |
• | Class B Common Stock, which is entitled to ten votes per share and is entitled collectively to elect the remaining 75% of our Board of Directors. |
As of July 31, 2017, the Dolan family, including trusts for the benefit of members of the Dolan family (collectively, the “Dolan Family Group”), collectively own all of our Class B Common Stock, approximately 2.4% of our outstanding Class A Common Stock and approximately 69.6% of the total voting power of all our outstanding common stock. Of this amount, Charles F. Dolan, a director and the father of James L. Dolan, the Executive Chairman, and his spouse control approximately 50.5% of our outstanding Class B Common Stock, approximately 1.2% of our outstanding Class A Common Stock and approximately 35.2% of the total voting power of all our outstanding common stock. The members of the Dolan Family Group holding Class B Common Stock have executed a voting agreement that has the effect of causing the voting power of the holders of our Class B Common Stock to be cast as a block with respect to all matters to be voted on by holders of Class B Common Stock. Under the Stockholders Agreement, the shares of Class B Common Stock owned by members of the Dolan Family Group are to be voted on all matters in accordance with the determination of the Dolan Family Committee, except that the decisions of the Dolan Family Committee are non-binding with respect to the Class B Common Stock owned by certain Dolan family trusts that collectively own 40.5% of the outstanding Class B Common Stock. The Dolan Family Committee consists of Charles F. Dolan and his six children, James L. Dolan, Thomas C. Dolan, Patrick F. Dolan, Kathleen M. Dolan, Marianne Dolan Weber and Deborah A. Dolan-Sweeney (collectively, the “Dolan Siblings”). The Dolan Family Committee generally acts by vote of a majority of the Dolan Siblings, except that approval of a going-private transaction must be approved by a two-thirds vote and approval of a change-in-control transaction must be approved by not less than all but one of the Dolan Siblings.
The Dolan Family Group is able to prevent a change in control of our Company and no person interested in acquiring us will be able to do so without obtaining the consent of the Dolan Family Group. The voting members of the Dolan Family Committee are James L Dolan, Thomas C. Dolan, Kathleen M. Dolan, Deborah A. Dolan-Sweeney and Marianne Dolan Weber, with each member having one vote other than James L. Dolan, who has two votes. Because James L. Dolan has two votes, he has the ability to block Dolan Family Committee approval of any Company change in control transaction. The Dolan Family Group, by virtue of their stock ownership, have the power to elect all of our directors subject to election by holders of Class B Common Stock and are able collectively to control stockholder decisions on matters on which holders of all classes of our common stock vote together as a single class. These matters could include the amendment of some provisions of our certificate of incorporation and the approval of fundamental corporate transactions.
In addition, the affirmative vote or consent of the holders of at least 66 2/3% of the outstanding shares of the Class B Common Stock, voting separately as a class, is required to approve:
• | the authorization or issuance of any additional shares of Class B Common Stock, and |
14
• | any amendment, alteration or repeal of any of the provisions of our certificate of incorporation that adversely affects the powers, preferences or rights of the Class B Common Stock. |
As a result, the Dolan Family Group also has the power to prevent such issuance or amendment.
The Dolan Family Group also controls MSG and AMC Networks Inc. (“AMC Networks”).
We Have Elected to Be a “Controlled Company” for New York Stock Exchange Purposes Which Allows Us Not to Comply With Certain of the Corporate Governance Rules of New York Stock Exchange.
Members of the Dolan Family Group have entered into a Stockholders Agreement relating, among other things, to the voting of their shares of our Class B Common Stock. As a result, we are a “controlled company” under the corporate governance rules of New York Stock Exchange (“NYSE”). Our Board of Directors has elected for the Company to be treated as a “controlled company” under NYSE corporate governance rules and not to comply with the NYSE requirement for a majority independent board of directors and for an independent corporate governance and nominating committee because of our status as a controlled company. Nevertheless, our Board of Directors has elected to comply with the NYSE requirement for an independent compensation committee.
Future Stock Sales, Including as a Result of the Exercise of Registration Rights by Certain of Our Stockholders, Could Adversely Affect the Trading Price of Our Class A Common Stock.
Certain parties have registration rights covering a portion of our shares. We have entered into registration rights agreements with Charles F. Dolan, members of his family, certain Dolan family interests and the Dolan Family Foundation that provide them with “demand” and “piggyback” registration rights with respect to approximately 15 million shares of Class A Common Stock, including shares issuable upon conversion of shares of Class B Common Stock. Sales of a substantial number of shares of Class A Common Stock could adversely affect the market price of the Class A Common Stock and could impair our future ability to raise capital through an offering of our equity securities.
We Share Certain Key Executives and Directors With MSG and/or AMC Networks, Which Means Those Executives Do Not Devote Their Full Time and Attention to Our Affairs and the Overlap May Give Rise to Conflicts.
Our Executive Chairman, James L. Dolan, also serves as Executive Chairman of MSG, and our Executive Vice President, General Counsel and Secretary, Lawrence J. Burian, also serves as the Executive Vice President, General Counsel and Secretary of MSG. As a result, not all of our executive officers devote their full time and attention to the Company’s affairs. In addition, our Vice Chairman, Gregg G. Seibert, also serves as the Vice Chairman of both MSG and AMC Networks, and one of our directors, Charles F. Dolan, is the Executive Chairman of AMC Networks. Furthermore, five members of our Board of Directors are also directors of MSG and five members of our Board of Directors are also directors of AMC Networks concurrently with their service on our Board of Directors. The overlapping officers and directors may have actual or apparent conflicts of interest with respect to matters involving or affecting each company. For example, the potential for a conflict of interest exists when we on the one hand, and MSG or AMC Networks on the other hand, look at certain acquisitions and other corporate opportunities that may be suitable for more than one of the companies. Also, conflicts may arise if there are issues or disputes under the commercial arrangements that exist between MSG or AMC Networks and us. In addition, certain of our directors and officers hold MSG and/or AMC Networks stock, performance stock units, restricted stock units, and/or or cash performance awards. These ownership interests could create actual, apparent or potential conflicts of interest when these individuals are faced with decisions that could have different implications for our Company and MSG or AMC Networks. See “Certain Relationships and Potential Conflicts of Interest” in our Proxy Statement filed with the SEC on October 27, 2016 and “Certain Relationships and Related Party Transactions — Certain Relationships and Potential Conflicts of Interest” in MSG’s registration statement on Form 10 filed with the SEC on September 11, 2015 for a discussion of certain procedures we instituted to help ameliorate such potential conflicts with MSG and/or AMC Networks that may arise.
Our Overlapping Directors and Executive Officers With MSG and/or AMC Networks May Result in the Diversion of Corporate Opportunities and Other Conflicts to MSG and/or AMC Networks and Provisions in Our Amended and Restated Certificate of Incorporation May Provide Us No Remedy in That Circumstance.
The Company acknowledges that directors and officers of the Company may also be serving as directors, officers, employees, consultants or agents of MSG and/or AMC Networks and their respective subsidiaries and that the Company may engage in material business transactions with such entities. The Company’s Board of Directors has adopted resolutions putting in place policies and arrangements whereby the Company has renounced its rights to certain business opportunities and no director or officer of the Company who is also serving as a director, officer, employee, consultant or agent of MSG and/or AMC Networks and their subsidiaries will be liable to the Company or its stockholders for breach of any fiduciary duty that would otherwise
15
exist by reason of the fact that any such individual directs a corporate opportunity (other than certain limited types of opportunities set forth in such policies) to MSG and/or AMC Networks or any of their subsidiaries instead of the Company, or does not refer or communicate information regarding such corporate opportunities to the Company.
We Could Have Significant Tax Liability as a Result of the Distribution.
We have obtained an opinion from Sullivan & Cromwell LLP substantially to the effect that, among other things, the Distribution qualifies as a tax-free distribution under the Internal Revenue Code, (the “Code”). The opinion is not binding on the Internal Revenue Service (the “IRS”) or the courts. Additionally, we have received a private letter ruling from the IRS concluding that certain limited aspects of the Distribution will not prevent the Distribution from satisfying certain requirements for tax-free treatment under the Code. The opinion and the private letter ruling rely on factual representations and reasonable assumptions, which if incorrect or inaccurate may jeopardize the ability to rely on such opinion and letter ruling.
If the Distribution does not qualify for tax-free treatment for U.S. federal income tax purposes, then, in general, we would be subject to tax as if we had sold the MSG common stock in a taxable sale for its fair value. MSG stockholders would be subject to tax as if they had received a distribution equal to the fair value of MSG common stock that was distributed to them, which generally would be treated first as a taxable dividend to the extent of our earnings and profits, then as a non-taxable return of capital to the extent of each holder’s tax basis in its MSG common stock, and thereafter as capital gain with respect to any remaining value. It is expected that the amount of any such taxes to MSG stockholders and us would be substantial.
The Tax Rules Applicable to the Distribution May Restrict Us From Engaging in Certain Corporate Transactions or Equity Capital Transactions Beyond Certain Thresholds for a Period of Time After the Distribution.
To preserve the tax-free treatment of the Distribution to our and MSG’s stockholders, under a tax disaffiliation agreement that was entered into between the Company and MSG, for the two-year period following the Distribution, we are subject to restrictions with respect to our activities, including restrictions relating to certain issuances or repurchases of our common stock, asset sales, mergers and liquidations.
These restrictions may limit our ability during that two-year period to pursue strategic transactions of a certain magnitude that involve the issuance or acquisition of our stock or engage in new businesses or other transactions that might increase the value of our business. These restrictions may also limit our ability to raise significant amounts of cash through the issuance of stock, especially if our stock price were to suffer substantial declines, or through the sale of certain of our assets.
We Rely on MSG’s Performance Under Various Agreements.
In connection with the Distribution, we entered into various agreements with MSG, including a distribution agreement, a tax disaffiliation agreement, a transition services agreement, an employee matters agreement, an advertising sales representation agreement, a trademark license agreement and media rights agreements, as well as certain other arrangements. These agreements govern our relationship with MSG subsequent to the Distribution and include the allocation of employee benefits, taxes and certain other liabilities and obligations attributable to periods prior to the Distribution. In connection with the Distribution, we agreed to provide MSG with indemnities with respect to liabilities arising out of our businesses and MSG agreed to provide us with indemnities with respect to liabilities arising out of the businesses we transferred to MSG. These agreements also include arrangements with respect to transition services and a number of on-going commercial relationships, including our production and exhibition of Knicks and Rangers games, the sale of our advertising inventory by MSG and our use of the “MSG” brand. The advertising sales representation agreement, transition services agreement and trademark licensing agreement are each subject to potential termination by MSG in the event MSG and the Company are no longer affiliates.
MSG provides all or a portion of certain business services that were performed by internal resources prior to the Distribution, such as information technology, accounting, accounts payable, payroll, procurement, tax, legal, human resources, insurance and risk management, investor relations, corporate communications, benefit plan administration and reporting, and internal audit functions as transition services. These services include the collection and storage of certain personal information regarding employees and/or customers as well as information regarding the Company and our Distributors and advertisers. See also “— We Face Continually Evolving Cybersecurity and Similar Risks, Which Could Result in the Disclosure of Confidential Information, Disruption of Our Business, Damage to Our Brands and Reputation, Legal Exposure and Financial Losses”. The transition services agreement is set to expire in September 2017. The Company anticipates entering into a replacement agreement with MSG covering substantially the same services.
The media rights agreements provide us with the exclusive media rights to Knicks and Rangers games. Rights fees under the media rights agreements amounted to approximately $134.3 million for the year ended June 30, 2017. The rights fees increase
16
annually and are subject to adjustments in certain circumstances, including if MSG does not make available a minimum number of games in any year.
Our advertising sales representation agreement with MSG, which has a term through June 30, 2022, provides for MSG to act as our advertising sales representative and includes the exclusive right and obligation to sell certain advertising availabilities on our behalf for a commission. All of our advertising sales personnel were transferred to MSG in connection with the Distribution. As a result of this arrangement, we depend on MSG's performance in the sale of our advertising and have the right to terminate this agreement if certain sales thresholds are not met unless MSG elects to pay the Company the shortfall.
The Company and MSG each rely on the other to perform its obligations under all of these agreements. If MSG were to breach, be unable to satisfy its material obligations under these agreements, including a failure to satisfy its indemnification or other financial obligations, or these agreements otherwise terminate or expire and we do not enter into replacement agreements, we could suffer operational difficulties and/or significant losses.
Item 1B. Unresolved Staff Comments
None.
Item 2. Properties
Significant properties that are leased include approximately 64,000 square feet housing the Company’s administrative and executive offices and approximately 18,000 square feet of studio space in New York City.
Item 3. Legal Proceedings
The Company is a defendant in various lawsuits. Although the outcome of these matters cannot be predicted with certainty, management does not believe that resolution of these lawsuits will have a material adverse effect on the Company.
Item 4. Mine Safety Disclosure
Not applicable.
17
PART II
Item 5. Market for the Registrant’s Common Equity, Related Stockholder Matters and Issuer Purchases of Equity
Securities
Our Class A Common Stock is listed on the NYSE under the symbol “MSGN”.
Performance Graph
The following graph compares the cumulative total return of our Class A Common Stock for the last five years with the performance for the same period of the Russell 3000 Index and the Bloomberg Global Entertainment Media Competitive Peer Index. The comparison assumes an investment of $100 on June 30, 2012 and reinvestment of dividends. The Distribution is treated as a reinvestment of a special dividend pursuant to SEC rules. The stock price performance in this graph is not necessarily indicative of future stock performance.
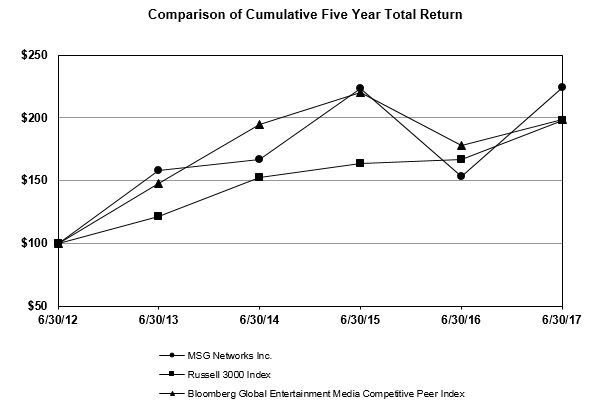
Base Period 6/30/12 | 06/30/13 | 06/30/14 | 06/30/15 | 06/30/16 | 06/30/17 | ||||||||||||||||||
MSG Networks Inc. | $ | 100.00 | $ | 158.25 | $ | 166.80 | $ | 223.00 | $ | 153.15 | $ | 224.13 | |||||||||||
Russell 3000 Index | 100.00 | 121.46 | 152.10 | 163.19 | 166.68 | 197.53 | |||||||||||||||||
Bloomberg Global Entertainment Media Competitive Peer Index | 100.00 | 147.38 | 194.88 | 219.99 | 177.79 | 198.90 | |||||||||||||||||
This performance graph shall not be deemed “filed” for purposes of Section 18 of the Exchange Act or incorporated by reference into any of our filings under the Securities Act of 1933, as amended, or the Exchange Act, except as expressly set forth by specific reference in such filing.
As of June 30, 2017, there were 1,087 holders of record of our Class A Common Stock. There is no public trading market for our Class B Common Stock. As of June 30, 2017, there were 14 holders of record of our Class B Common Stock.
We did not pay any dividend on our common stock during the 2016 and 2017 fiscal years and do not have any current plans to pay a cash dividend on our common stock for the foreseeable future. Our senior secured credit facilities restrict our ability to
18
declare dividends in certain situations (see “Item 7. Management’s Discussion and Analysis of Financial Condition and Results of Operations — Liquidity and Capital Resources — Financing Agreements — Senior Secured Credit Facilities”).
Price Range of MSG Networks Inc. Class A Common Stock
The following tables set forth for the periods indicated the intra-day high and low sales prices per share of our Class A Common Stock as reported on the NYSE (or NASDAQ for stock prices prior to July 30, 2015):
Year Ended June 30, 2017 | High | Low | |||||
For the Quarter ended June 30, 2017 | $ | 25.30 | $ | 20.80 | |||
For the Quarter ended March 31, 2017 | 23.95 | 21.15 | |||||
For the Quarter ended December 31, 2016 | 22.85 | 18.20 | |||||
For the Quarter ended September 30, 2016 | 18.98 | 14.73 | |||||
Year Ended June 30, 2016 | |||||||
For the Quarter ended June 30, 2016 | $ | 18.12 | $ | 15.13 | |||
For the Quarter ended March 31, 2016 | 20.66 | 15.30 | |||||
For the Quarter ended December 31, 2015 | 21.72 | 16.95 | |||||
For the Quarter ended September 30, 2015(a) | 84.53 | 63.50 | |||||
_________________
(a) Share prices for the quarter ended September 30, 2015 do not reflect the impact of the Distribution.
19
Item 6. Selected Financial Data
The operating and balance sheet data included in the following table has been derived from the consolidated financial statements of the Company and its subsidiaries and should be read in conjunction with the consolidated financial statements included in Item 8 of this Annual Report on Form 10-K and with “Item 7. Management’s Discussion and Analysis of Financial Condition and Results of Operations.”
For Years Ended June 30, | |||||||||||||||||||
2017 | 2016 | 2015 | 2014 | 2013 | |||||||||||||||
(in thousands, except per share data) | |||||||||||||||||||
Operating Data: | |||||||||||||||||||
Revenues | $ | 675,352 | $ | 658,198 | $ | 631,010 | $ | 714,514 | $ | 677,733 | |||||||||
Direct operating expenses | 271,751 | 268,024 | 217,233 | 259,434 | 218,665 | ||||||||||||||
Selling, general and administrative expenses | 80,041 | 102,005 | 155,003 | 199,477 | 171,397 | ||||||||||||||
Depreciation and amortization (including impairments) | 10,296 | 14,583 | 17,641 | 20,810 | 21,176 | ||||||||||||||
Gain on sale of Fuse | — | — | (186,178 | ) | — | — | |||||||||||||
Operating income | 313,264 | 273,586 | 427,311 | 234,793 | 266,495 | ||||||||||||||
Other income (expense): | |||||||||||||||||||
Interest income | 2,782 | 2,368 | 2,068 | 1,918 | 2,188 | ||||||||||||||
Interest expense | (40,108 | ) | (31,683 | ) | (4,040 | ) | (5,877 | ) | (5,715 | ) | |||||||||
Miscellaneous expense | — | (2 | ) | (4 | ) | (1,441 | ) | — | |||||||||||
Income from continuing operations before income taxes | 275,938 | 244,269 | 425,335 | 229,393 | 262,968 | ||||||||||||||
Income tax expense | (108,476 | ) | (80,971 | ) | (176,905 | ) | (86,534 | ) | (106,815 | ) | |||||||||
Income from continuing operations | 167,462 | 163,298 | 248,430 | 142,859 | $ | 156,153 | |||||||||||||
Income (loss) from discontinued operations, net of taxes | (120 | ) | (155,664 | ) | 6,271 | (27,791 | ) | $ | (13,771 | ) | |||||||||
Net income | $ | 167,342 | $ | 7,634 | $ | 254,701 | $ | 115,068 | $ | 142,382 | |||||||||
Earnings (loss) per share: | |||||||||||||||||||
Basic | |||||||||||||||||||
Income from continuing operations | $ | 2.23 | $ | 2.17 | $ | 3.22 | $ | 1.85 | $ | 2.05 | |||||||||
Income (loss) from discontinued operations | — | (2.07 | ) | 0.08 | (0.36 | ) | (0.18 | ) | |||||||||||
Net income | 2.22 | 0.10 | 3.30 | 1.49 | 1.87 | ||||||||||||||
Diluted | |||||||||||||||||||
Income from continuing operations | $ | 2.22 | $ | 2.16 | $ | 3.20 | $ | 1.83 | $ | 2.00 | |||||||||
Income (loss) from discontinued operations | — | (2.06 | ) | 0.08 | (0.36 | ) | (0.18 | ) | |||||||||||
Net income | 2.21 | 0.10 | 3.28 | 1.47 | 1.83 | ||||||||||||||
Weighted-average number of common shares outstanding: | |||||||||||||||||||
Basic | 75,213 | 75,152 | 77,138 | 77,142 | 76,268 | ||||||||||||||
Diluted | 75,560 | 75,527 | 77,687 | 78,167 | 77,940 | ||||||||||||||
Balance Sheet Data: | |||||||||||||||||||
Total assets | $ | 805,044 | $ | 806,542 | $ | 3,019,829 | $ | 2,925,961 | $ | 2,732,214 | |||||||||
Total long-term debt | 1,312,845 | 1,477,759 | — | — | — | ||||||||||||||
Capital lease obligations | — | — | — | 1,967 | 2,224 | ||||||||||||||
Total stockholders’ equity (deficiency) | (944,207 | ) | (1,119,958 | ) | 1,723,522 | 1,604,444 | 1,478,935 | ||||||||||||
20
Item 7. Management’s Discussion and Analysis of Financial Condition and Results of Operations
This Management’s Discussion and Analysis of Financial Condition and Results of Operations, or MD&A, may contain forward-looking statements within the meaning of the Private Securities Litigation Reform Act of 1995. Words such as “expects,” “anticipates,” “believes,” “estimates,” “may,” “will,” “should,” “could,” “potential,” “continue,” “intends,” “plans,” and similar words and terms used in the discussion of future operating and financial performance and plans identify forward-looking statements. Investors are cautioned that such forward-looking statements are not guarantees of future performance, results or events and involve risks and uncertainties and that actual results or developments may differ materially from the forward-looking statements as a result of various factors. Factors that may cause such differences to occur include, but are not limited to:
• | the demand for our programming among cable, satellite, telephone and other platforms (“Distributors”) and the subscribers thereto, and our ability to enter into and renew affiliation agreements with Distributors, as well as the impact of consolidation among Distributors; |
• | the level of our revenues, which depends in part on the popularity and competitiveness of the sports teams whose games are broadcast on our networks and the popularity of other content aired on our networks; |
• | the ability of our Distributors to maintain subscriber levels; |
• | the impact of subscribers downgrading their programming packages to levels that do not include our networks; |
• | the security of our program signal and electronic data; |
• | general economic conditions especially in the New York City metropolitan area where we conduct the majority of our operations; |
• | the demand for advertising and sponsorship arrangements and viewer ratings for our networks; |
• | competition, for example, from other regional sports networks; |
• | the relocation or insolvency of professional sports teams with which we have a media rights agreement; |
• | our ability to maintain, obtain or produce content, together with the cost of such content; |
• | our ability to renew or replace our media rights agreements with professional sports teams; |
• | the acquisition or disposition of assets and/or the impact of, and our ability to successfully pursue, acquisitions or other strategic transactions, and the operating and financial performance thereof (including those that we do not control); |
• | the costs associated with, and the outcome of, litigation and other proceedings to the extent uninsured; |
• | the impact of governmental regulations or laws and changes in such regulations or laws; |
• | the impact of league rules, league regulations and/or league agreements and changes thereto; |
• | cybersecurity and similar risks which could result in the disclosure of confidential information, disruption of our business or damage to our brands and reputation; |
• | our substantial debt and high leverage; |
• | reduced access to capital markets or significant increases in costs to borrow; |
• | financial community perceptions of our business, operations, financial condition and the industry in which we operate; |
• | the tax-free treatment of the Distribution; and |
• | the factors described under “Item 1A. Risk Factors” included in this Annual Report on Form 10-K. |
21
We disclaim any obligation to update or revise the forward-looking statements contained herein, except as otherwise required by applicable federal securities laws.
All dollar amounts included in the following MD&A are presented in thousands, except as otherwise noted.
Introduction
MD&A is provided as a supplement to, and should be read in conjunction with the audited consolidated financial statements and footnotes thereto included in this Annual Report on Form 10-K to help provide an understanding of our financial condition, changes in financial condition and results of operations. Unless the context otherwise requires, all references to “we,” “us,” “our” or the “Company” refer collectively to MSG Networks Inc., a holding company, and its direct and indirect subsidiaries through which substantially all of our operations are conducted. The Company owns and operates two regional sports and entertainment networks, MSG Network (“MSGN”) and MSG+, collectively the “MSG Networks.”
On September 30, 2015 (the “Distribution Date”), the Company distributed to its stockholders all of the outstanding common stock of The Madison Square Garden Company (formerly MSG Spinco, Inc., and referred to herein as “MSG”) (the “Distribution”). MSG owns, directly or indirectly, the sports and entertainment businesses previously owned and operated by the Company’s sports and entertainment segments, owns, leases or operates the arenas and other venues previously owned, leased or operated by the Company and owns the joint venture interests previously owned by the Company. In the Distribution, each holder of the Company’s Class A common stock, par value $0.01 per share (“Class A Common Stock”), of record as of the close of business, New York City time, on September 21, 2015 (the “Record Date”), received one share of MSG Class A common stock, par value $0.01 per share, for every three shares of the Company’s Class A Common Stock held on the Record Date. Each holder of the Company’s Class B common stock, par value $0.01 per share (“Class B Common Stock”), of record as of the Record Date received one share of MSG Class B common stock, par value $0.01 per share, for every three shares of the Company's Class B Common Stock held on the Record Date. Following the Distribution, the Company no longer consolidates the financial results of MSG for purposes of its own financial reporting and the historical financial results of MSG have been reflected in the Company's consolidated financial statements as discontinued operations for all periods presented through the Distribution Date.
Following the Distribution, the Company operates and reports financial information in one segment.
This MD&A is organized as follows:
Business Overview. This section provides a general description of our business, as well as other matters that we believe are important in understanding our results of operations and financial condition and in anticipating future trends.
Results of Operations. This section provides an analysis of our consolidated results of operations for the years ended June 30, 2017, 2016 and 2015.
Liquidity and Capital Resources. This section provides a discussion of our financial condition and liquidity, as well as an analysis of our cash flows for the years ended June 30, 2017, 2016 and 2015. The discussion of our financial condition and liquidity includes summaries of (i) our primary sources of liquidity and (ii) our contractual obligations that existed at June 30, 2017.
Recently Issued Accounting Pronouncements Not Yet Adopted and Critical Accounting Policies. This section includes a discussion of accounting policies considered to be important to our financial condition and results of operations and which require significant judgment and estimates on the part of management in their application. In addition, all of our significant accounting policies, including our critical accounting policies, are discussed in the notes to our consolidated financial statements included in Item 8 of this Annual Report on Form 10-K.
22
Business Overview
The Company owns and operates two award-winning regional sports and entertainment networks, MSG Network (“MSGN”) and MSG+, collectively “MSG Networks.” MSGN and MSG+ are home to ten professional sports teams. We deliver live games of the New York Knicks (the “Knicks”) of the National Basketball Association (“NBA”); the New York Rangers (the “Rangers”), New York Islanders (the “Islanders”), New Jersey Devils (the “Devils”) and Buffalo Sabres (the “Sabres”) of the National Hockey League (“NHL”); the New York Liberty of the Women’s National Basketball Association; the New York Red Bulls of Major League Soccer, and the Westchester Knicks of the National Basketball Association Gatorade League (formerly known as the National Basketball Association Development League). Additionally, we air programming of the New York Giants and Buffalo Bills of the National Football League.
Revenue Sources
The Company earns revenues from two primary sources: affiliation fees and advertising.
Affiliation Fee Revenue
The Company earns affiliation fee revenue from distributors that carry our programming networks. The fees we receive depend largely on the demand from subscribers for our programming. Affiliation fee revenue constituted at least 90% of our consolidated revenues for each of the years ended June 30, 2017, 2016 and 2015.
Advertising Revenue
The Company primarily earns advertising revenue through the sale of commercial time to advertisers during our programming or through the sale of program sponsorship rights. The Company has an advertising sales representation agreement with MSG, which has a term through June 30, 2022, that provides for MSG to act as our advertising sales representative and includes the exclusive right and obligation to sell certain advertising availabilities on our behalf for a commission. The advertising sales representation agreement is subject to certain termination rights, including MSG’s right to terminate if MSG and the Company are no longer affiliates and the Company’s right to terminate if certain sales thresholds are not met unless MSG elects to pay the Company the shortfall.
Direct Operating Expenses
Direct operating expenses primarily include the cost of professional team rights acquired under media rights agreements to telecast various sporting events on our networks, and other programming and production costs of our networks.
The Company has long-term media rights agreements with the Knicks, Rangers, Islanders, Devils and Sabres. The professional team media rights acquired under these agreements to telecast various sporting events and other programming for exhibition on our networks are typically expensed on a straight-line basis over the term of the applicable contract or license period. We negotiate directly with the teams to determine the fee and other provisions of the media rights agreements. Media rights fees for sports programming are influenced by, among other things, the size and demographics of the geographic area in which the programming is distributed, and the popularity and/or the competitiveness of a team. In connection with the Distribution, the Company entered into media rights agreements with the Knicks and the Rangers, which provide the Company with exclusive media rights to the teams’ games in their local markets. These agreements were effective July 1, 2015. Prior to the Distribution, these rights fees were eliminated in consolidation; however the pre-Distribution Date amounts are now presented as revenues in the loss from discontinued operations line with the offsetting expense in direct operating expenses, within continuing operations, in the accompanying consolidated statements of operations for the years ended June 30, 2016 and 2015.
Other direct programming and production costs include, but are not limited to, the salaries of our on-air personalities, producers, directors, technicians, writers and other creative staff, as well as expenses associated with location costs, remote facilities and maintaining studios, origination, and transmission facilities.
Selling, General and Administrative Costs
Selling, general and administrative expenses primarily consist of administrative costs, including employee compensation and related benefits, professional fees, as well as sales commissions and marketing costs.
Selling, general and administrative expenses for periods prior to the Distribution include certain corporate overhead expenses that do not meet the criteria for inclusion in discontinued operations.
23
Factors Affecting Operating Results
The financial performance of our business is affected by the affiliation agreements we negotiate with Distributors, the number of subscribers of certain Distributors and also by the advertising rates we charge advertisers. Certain of these factors in turn depend on the popularity and/or performance of the professional sports teams carried on MSG Networks as well as the cost and the attractiveness of our programming content.
Due largely to our long-term media rights agreements with our NBA and NHL teams and the generally recurring nature of our affiliation fee revenue, MSG Networks has consistently produced operating profits over a number of years. Advertising revenues are less predictable and can vary based upon a number of factors, including general economic conditions and team performance.
Our Company’s future performance is also dependent on the U.S. and global economies, the impact of competition, and the relative strength of our current and future advertising customers. Instability and weakness of the U.S. and global economies and the negative effects on consumers’ and businesses’ discretionary spending may materially negatively affect our business and results of operations. See “Part I — Item 1. Business — Regulation” for other factors that may affect operating results.
Other
On July 1, 2014, the Company completed its sale of Fuse, a national music television network, to Fuse Media, Inc. for a cash purchase price of $231,995 and a 15% equity interest of approximately $24,000 in Fuse Media, LLC (“Fuse Media”). The Company recorded a pre-tax gain on the sale of Fuse, which is reflected in operating income in the accompanying consolidated statement of operations for the year ended June 30, 2015, of $186,178 (net of transaction costs of $3,932).
The equity interest in Fuse Media was transferred to MSG in connection with the Distribution.
24
Results of Operations
Comparison of the Year Ended June 30, 2017 versus the Year Ended June 30, 2016
The table below sets forth, for the periods presented, certain historical financial information and the percentage that those items bear to revenues.
Years Ended June 30, | Increase (Decrease) in Net Income | ||||||||||||||||
2017 | 2016 | ||||||||||||||||
Amount | % of Revenues | Amount | % of Revenues | ||||||||||||||
Revenues | $ | 675,352 | 100 | % | $ | 658,198 | 100 | % | $ | 17,154 | |||||||
Direct operating expenses | 271,751 | 40 | % | 268,024 | 41 | % | (3,727 | ) | |||||||||
Selling, general and administrative expenses | 80,041 | 12 | % | 102,005 | 15 | % | 21,964 | ||||||||||
Depreciation and amortization | 10,296 | 2 | % | 14,583 | 2 | % | 4,287 | ||||||||||
Operating income | 313,264 | 46 | % | 273,586 | 42 | % | 39,678 | ||||||||||
Other income (expense): | |||||||||||||||||
Interest income | 2,782 | NM | 2,368 | NM | 414 | ||||||||||||
Interest expense | (40,108 | ) | (6 | )% | (31,683 | ) | (5 | )% | (8,425 | ) | |||||||
Miscellaneous expense | — | NM | (2 | ) | NM | 2 | |||||||||||
(37,326 | ) | (6 | )% | (29,317 | ) | (4 | )% | (8,009 | ) | ||||||||
Income from continuing operations before income taxes | 275,938 | 41 | % | 244,269 | 37 | % | 31,669 | ||||||||||
Income tax expense | (108,476 | ) | (16 | )% | (80,971 | ) | (12 | )% | (27,505 | ) | |||||||
Income from continuing operations | 167,462 | 25 | % | 163,298 | 25 | % | 4,164 | ||||||||||
Loss from discontinued operations, net of taxes | (120 | ) | NM | (155,664 | ) | (24 | )% | 155,544 | |||||||||
Net income | $ | 167,342 | 25 | % | $ | 7,634 | 1 | % | $ | 159,708 | |||||||
___________________________________
NM – Percentage is not meaningful
For the year ended June 30, 2016, the reported financial results of the Company reflect the fiscal 2016 first quarter results of the sports and entertainment businesses of MSG as discontinued operations. In addition, results from continuing operations for the first quarter of fiscal year 2016 include certain corporate overhead expenses that the Company did not incur during the year ended June 30, 2017 and does not expect to incur in future periods, but which did not meet the criteria for inclusion in discontinued operations.
Revenues
Revenues for the year ended June 30, 2017 increased $17,154, or 3%, to $675,352 as compared with the prior year. The net increase was attributable to the following:
Increase in affiliation fee revenue | $ | 16,745 | |
Increase in advertising revenue | 542 | ||
Other net decreases | (133 | ) | |
$ | 17,154 | ||
The increase in affiliation fee revenue was primarily due to higher affiliation rates, partially offset by the impact of a low single-digit percentage decrease in subscribers as compared with the prior year and, to a lesser extent, the absence of the impact of a favorable affiliate adjustment recorded in the prior year.
The increase in advertising revenue was primarily due to the favorable impact of a net decrease in deferred revenue related to ratings guarantees in the current year as compared with a net increase in deferred revenue in the prior year, and other net advertising increases partially offset by fewer live regular season professional sports telecasts.
25
Direct operating expenses
Direct operating expenses for the year ended June 30, 2017 increased $3,727, or 1%, to $271,751 as compared with the prior year due to higher rights fees expense of $7,599, partially offset by the positive impact of the finalization of a matter related to the sale of Fuse, and other programming-related cost decreases, totaling to $3,872.
Selling, general and administrative expenses
Selling, general and administrative expenses for the year ended June 30, 2017 decreased $21,964, or 22%, to $80,041 as compared with the prior year primarily due to the absence of certain corporate overhead expenses included in the results of the prior year period. As noted above, the fiscal year 2016 first quarter results include certain corporate expenses that the Company did not incur during the year ended June 30, 2017 and does not expect to incur in future periods. Partially offsetting this decrease are corporate costs which were incurred during fiscal year 2017 by MSG Networks Inc. as a standalone public company, including higher employee compensation and related benefits.
Depreciation and amortization
Depreciation and amortization for the year ended June 30, 2017 decreased $4,287, or 29%, to $10,296 as compared with the prior year primarily due to the absence of depreciation expense included in the fiscal year 2016 first quarter results on certain corporate property and equipment that was transferred to MSG in connection with the Distribution, but which did not meet the criteria for inclusion in discontinued operations, as well as the impact of certain property and equipment being fully depreciated during fiscal year 2016.
Operating income
Operating income for the year ended June 30, 2017 increased $39,678, or 15%, to $313,264 as compared with the prior year primarily due to (as discussed above) lower selling, general and administrative expenses (including share-based compensation expense), higher revenues and, to a lesser extent, lower depreciation and amortization, partially offset by higher direct operating expenses.
Interest expense
Interest expense for the year ended June 30, 2017 increased $8,425, or 27%, to $40,108 as compared with the prior year primarily due to higher interest expense incurred under the Company’s senior secured credit facilities with a syndicate of lenders (see “Financing Agreements — Senior Secured Credit Facilities”), which were entered into on September 28, 2015 and accordingly did not begin to accrue interest until that date, and other net increases. These other net increases primarily reflect higher interest rates in fiscal year 2017 period, partially offset by a lower average principal balance under the Term Loan Facility in fiscal year 2017 and the absence of the write-off of a portion of the deferred financing costs associated with the Company’s former credit facility recorded in the prior year.
Income taxes
Income tax expense attributable to continuing operations for the year ended June 30, 2017 of $108,476 differs from the income tax expense derived from applying the statutory federal rate to pretax income due principally to the impact of state and local income taxes (net of federal benefit) of $19,489, an increase in state tax rates used to re-measure the Company’s deferred taxes of $85, and other items of $548. These increases were partially offset by the impact of the tax benefits related to the domestic production activities deduction of $7,998, tax return to book provision adjustments in connection with the filing of the Company's federal, state and local income tax returns of $208, and a tax benefit related to uncertain tax positions of $18.
Income tax expense attributable to continuing operations for the year ended June 30, 2016 of $80,971 differs from the income tax expense derived from applying the statutory federal rate to pretax income due principally to a reduction in state tax rates used to re-measure the Company’s deferred taxes of $12,717, tax benefits of the domestic production activities deduction of $6,329, a tax benefit of $3,271 related to a tax return to book provision adjustment in connection with its anticipated tax return for the tax year ended December 31, 2015. These decreases were partially offset by state and local income taxes of $17,709 (net of federal benefit), and other items of $84.
Adjusted operating income
The Company evaluates performance based on several factors, of which the key financial measure is adjusted operating income (which we formerly referred to as adjusted operating cash flow). Although the Company has renamed this non-GAAP measure, the components of adjusted operating income are identical to the components of adjusted operating cash flow. Adjusted operating income is defined as operating income (loss) before (i) depreciation, amortization and impairments of property and equipment and intangible assets, (ii) share-based compensation expense or benefit, (iii) restructuring charges or credits and (iv)
26
gains or losses on sales or dispositions of businesses. The Company has presented the components that reconcile adjusted operating income to operating income, a GAAP measure.
Years Ended June 30, | Increase (Decrease) in Adjusted Operating Income | ||||||||||
2017 | 2016 | ||||||||||
Operating income | $ | 313,264 | $ | 273,586 | $ | 39,678 | |||||
Share-based compensation | 9,931 | 9,266 | 665 | ||||||||
Depreciation and amortization | 10,296 | 14,583 | (4,287 | ) | |||||||
Adjusted operating income | $ | 333,491 | $ | 297,435 | $ | 36,056 | |||||
Adjusted operating income for the year ended June 30, 2017 increased $36,056, or 12%, to $333,491 as compared with the prior year primarily due to (as discussed above) lower selling, general and administrative expenses (excluding share-based compensation expense) and higher revenues, partially offset by higher direct operating expenses.
27
Comparison of the Year Ended June 30, 2016 versus the Year Ended June 30, 2015
The table below sets forth, for the periods presented, certain historical financial information and the percentage that those items bear to revenues.
Years Ended June 30, | Increase (Decrease) in Net Income | ||||||||||||||||
2016 | 2015 | ||||||||||||||||
Amount | % of Revenues | Amount | % of Revenues | ||||||||||||||
Revenues | $ | 658,198 | 100 | % | $ | 631,010 | 100 | % | $ | 27,188 | |||||||
Direct operating expenses | 268,024 | 41 | % | 217,233 | 34 | % | (50,791 | ) | |||||||||
Selling, general and administrative expenses | 102,005 | 15 | % | 155,003 | 25 | % | 52,998 | ||||||||||
Depreciation and amortization | 14,583 | 2 | % | 17,641 | 3 | % | 3,058 | ||||||||||
Gain on sale of Fuse | — | NM | (186,178 | ) | (30 | )% | (186,178 | ) | |||||||||
Operating income | 273,586 | 42 | % | 427,311 | 68 | % | (153,725 | ) | |||||||||
Other income (expense): | |||||||||||||||||
Interest income | 2,368 | NM | 2,068 | NM | 300 | ||||||||||||
Interest expense | (31,683 | ) | (5 | )% | (4,040 | ) | (1 | )% | (27,643 | ) | |||||||
Miscellaneous expense | (2 | ) | NM | (4 | ) | NM | 2 | ||||||||||
(29,317 | ) | (4 | )% | (1,976 | ) | NM | (27,341 | ) | |||||||||
Income from continuing operations before income taxes | 244,269 | 37 | % | 425,335 | 67 | % | (181,066 | ) | |||||||||
Income tax expense | (80,971 | ) | (12 | )% | (176,905 | ) | (28 | )% | 95,934 | ||||||||
Income from continuing operations | 163,298 | 25 | % | 248,430 | 39 | % | (85,132 | ) | |||||||||
Income (loss) from discontinued operations, net of taxes | (155,664 | ) | (24 | )% | 6,271 | 1 | % | (161,935 | ) | ||||||||
Net income | $ | 7,634 | 1 | % | $ | 254,701 | 40 | % | $ | (247,067 | ) | ||||||
___________________________________
NM – Percentage is not meaningful
For each quarter of fiscal year 2015, as well as the first quarter of fiscal year 2016, the reported financial results of the Company reflect the results of the sports and entertainment businesses of MSG as discontinued operations. In addition, results from continuing operations for these periods include certain corporate overhead expenses that the Company did not incur in the fiscal year 2016 second, third and fourth quarters and does not expect to incur in future periods, but which did not meet the criteria for inclusion in discontinued operations. The reported financial results of the Company for the periods after the Distribution reflect the Company’s results on a standalone basis, including the Company’s actual corporate overhead.
Revenues
Revenues for the year ended June 30, 2016 increased $27,188, or 4%, to $658,198 as compared with the prior year. The net increase was attributable to the following:
Increase in affiliation fee revenue | $ | 19,736 | |
Increase in advertising revenue | 7,075 | ||
Other net increases | 377 | ||
$ | 27,188 | ||
The increase in affiliation fee revenue was primarily due to higher affiliation rates, partially offset by the impact of a low single digit percentage decrease in subscribers as compared with the prior year.
The increase in advertising revenue was primarily driven by higher average per-game sales from the telecast of live professional sports programming.
28
Other net increases were primarily attributable to the recognition of certain broadcast revenues, partially offset by the absence of a retroactive royalty payment recorded in the prior year and lower revenues associated with certain services provided to Fuse Media, Inc.
Direct operating expenses
Direct operating expenses for the year ended June 30, 2016 increased $50,791, or 23%, to $268,024 as compared with the prior year due to higher rights fees expense of approximately $52,400, partially offset by other programming-related cost decreases of $1,400. The higher rights fees expense includes a $49,000 increase related to the Company’s long-term media rights agreements with the Knicks and Rangers. In connection with the Distribution, the Company entered into media rights agreements with the Knicks and the Rangers, which provide the Company with exclusive media rights to team games in their local markets.
Selling, general and administrative expenses
Selling, general and administrative expenses for the year ended June 30, 2016 decreased $52,998, or 34%, to $102,005 as compared with the prior year primarily due to lower corporate overhead costs. The results for the first quarter of fiscal year 2016 and each quarter of fiscal year 2015 include certain corporate expenses that the Company did not incur during the second, third, and fourth quarters of fiscal year 2016 and does not expect to incur in future periods. Partially offsetting this decrease are corporate costs incurred during the second, third and fourth quarters of fiscal year 2016 by the Company as a standalone public company. Additionally, the Company's results for the second and third quarters of fiscal year 2016 reflect incremental net expenses associated with commissions incurred by the Company pursuant to an advertising sales representation agreement with MSG as compared to the historical costs of the Company’s advertising sales personnel and other associated corporate costs, that the Company no longer incurs as these personnel have been transferred to MSG.
Depreciation and amortization
Depreciation and amortization for the year ended June 30, 2016 decreased $3,058, or 17%, to $14,583 as compared with the prior year primarily driven by lower depreciation expense on certain corporate property and equipment that was transferred to MSG in connection with the Distribution, but which did not meet the criteria for inclusion in discontinued operations.
Gain on sale of Fuse
Gain on sale of Fuse for the year ended June 30, 2015 represents the Company’s gain, net of transaction costs, from the sale which was completed on July 1, 2014. See Note 5 to the consolidated financial statements included in Item 8 of this Annual Report on Form 10-K.
Operating income
Operating income for the year ended June 30, 2016 decreased $153,725, or 36%, to $273,586 as compared with the prior year primarily due to (as discussed above) the gain on sale of Fuse in fiscal year 2015 and, to a lesser extent, higher direct operating expenses. These declines were partially offset by lower selling, general and administrative expenses (including share-based compensation expense), higher revenues and, to a lesser extent, lower depreciation and amortization.
Interest expense
Interest expense for the year ended June 30, 2016 increased $27,643 to $31,683 as compared with the prior year primarily due to interest expense incurred under the Company’s senior secured credit facilities with a syndicate of lenders (see “Financing Agreements — Senior Secured Credit Facilities”).
Income taxes
Income tax expense attributable to continuing operations for the year ended June 30, 2016 of $80,971 differs from the income tax expense derived from applying the statutory federal rate to pretax income due principally to a reduction in state tax rates used to re-measure the Company’s deferred taxes of $12,717, tax benefits of the domestic production activities deduction of $6,329, a tax benefit of $3,271 related to a tax return to book provision adjustment in connection with its anticipated tax return for the tax year ended December 31, 2015. These decreases were partially offset by state and local income taxes of $17,709 (net of federal benefit), and other items of $84.
Income tax expense attributable to continuing operations for the year ended June 30, 2015 of $176,905 differs from the income tax expense derived from applying the statutory federal rate to pretax income due principally to state and local income taxes of $31,707 (net of federal benefit), an increase in state tax rates used to value deferred taxes due to the sale of Fuse of $8,122 and
29
other items of $228. These increases were partially offset by the impact of the tax benefits of the domestic production activities deduction of $11,076, a release of uncertain tax position liabilities of $894, and a tax return to book provision adjustment in connection with the filing of the Company’s federal income tax return of $49.
Adjusted operating income
The Company has presented the components that reconcile adjusted operating income, a non-GAAP measure, to operating income, a GAAP measure. The following is a reconciliation of operating income to adjusted operating income:
Years Ended June 30, | Increase (Decrease) in Adjusted Operating Income | ||||||||||
2016 | 2015 | ||||||||||
Operating income | $ | 273,586 | $ | 427,311 | $ | (153,725 | ) | ||||
Share-based compensation | 9,266 | 10,211 | (945 | ) | |||||||
Depreciation and amortization | 14,583 | 17,641 | (3,058 | ) | |||||||
Gain on sale of Fuse | — | (186,178 | ) | 186,178 | |||||||
Adjusted operating income | $ | 297,435 | $ | 268,985 | $ | 28,450 | |||||
Adjusted operating income for the year ended June 30, 2016 increased $28,450, or 11%, to $297,435 as compared with the prior year primarily due to (as discussed above) lower selling, general and administrative expenses (excluding share-based compensation expense) and higher revenues partially offset by higher direct operating expenses.
Liquidity and Capital Resources
Overview
Our primary sources of liquidity are cash and cash equivalents, cash flows from the operations of our business and available borrowing capacity under our $250,000 revolving credit facility with a syndicate of lenders which was undrawn as of June 30, 2017 (see “Financing Agreements — Senior Secured Credit Facilities” below). Our principal uses of cash include working capital-related items, capital spending, taxes and debt service. The Company’s use of its available liquidity will be based upon the ongoing review of the funding needs of the business, the optimal allocation of cash resources, and the timing of cash flow generation.
We believe we have sufficient liquidity, including approximately $141,000 in cash and cash equivalents, as of June 30, 2017, as well as the available borrowing capacity under our revolving credit facility and our anticipated operating cash flows, to fund our business operations and service our outstanding term loan (see “Financing Agreements — Senior Secured Credit Facilities” below) over the next twelve months. However, potential subscriber reductions of our Distributors, changes in the demand for our programming, advertising revenue declines, our ability to maintain or obtain content, and other factors could adversely impact our business and results of operations, which might require that we seek alternative sources of funding through the capital and credit markets that may or may not be available to us.
Financing Agreements
Former Revolving Credit Facility
On May 6, 2014, MSGN Holdings, L.P., formerly MSG Holdings, L.P., (“MSGN L.P.”) and certain of its subsidiaries entered into a credit agreement with a syndicate of lenders providing for a senior secured revolving credit facility of $500,000 with a term of five years (the “Former Revolving Credit Facility”). In connection with the Distribution, MSGN L.P. terminated the Former Revolving Credit Facility effective on September 28, 2015.
30
Senior Secured Credit Facilities
On September 28, 2015, MSGN L.P., MSGN Eden, LLC, an indirect subsidiary of the Company and the general partner of MSGN L.P., Regional MSGN Holdings LLC, a direct subsidiary of the Company and the limited partner of MSGN L.P. (collectively with MSGN Eden, LLC, the “Holdings Entities”), and certain subsidiaries of MSGN L.P. entered into a credit agreement (the “Credit Agreement”) with a syndicate of lenders.
The Credit Agreement provides MSGN L.P. with senior secured credit facilities (the “Senior Secured Credit Facilities”) consisting of: (a) an initial $1,550,000 term loan facility (the “Term Loan Facility”) and (b) a $250,000 revolving credit facility (the “Revolving Credit Facility”), each with a term of five years. In connection with the Distribution, $1,450,000 of the proceeds from the Term Loan Facility was contributed to MSG immediately following the closing of the Senior Secured Credit Facilities. The remainder of the proceeds from the Term Loan Facility were used by MSGN L.P. to pay for certain fees and expenses associated with the Distribution and the Senior Secured Credit Facilities and the balance was designated for use to fund working capital needs and other general corporate purposes of MSGN L.P. The Revolving Credit Facility was undrawn as of June 30, 2017 and is available to fund working capital needs and other general corporate purposes of MSGN L.P. Up to $35,000 of the Revolving Credit Facility is available for the issuance of letters of credit.
The Credit Agreement generally requires the Holding Entities and MSGN L.P. and its restricted subsidiaries on a consolidated basis to comply with a maximum total leverage ratio of 6.00:1.00 from the closing date until September 30, 2016 and a maximum total leverage ratio of 5.50:1.00 from and after October 1, 2016 until maturity, subject, in each case, to upward adjustment during the continuance of certain events. In addition, there is a minimum interest coverage ratio of 2.00:1.00 for the Holdings Entities and MSGN L.P. and its restricted subsidiaries on a consolidated basis. As of June 30, 2017, the Holding Entities and MSGN L.P. and its restricted subsidiaries on a consolidated basis were in compliance with the financial covenants of the Credit Agreement. All borrowings under the Credit Agreement are subject to the satisfaction of customary conditions, including absence of a default and accuracy of representations and warranties. As of June 30, 2017, there were no letters of credit issued and outstanding under the Revolving Credit Facility, which provides full borrowing capacity of $250,000. The Company has made principal payments aggregating $228,750 through June 30, 2017, including voluntary payments aggregating $100,000 made in fiscal year 2017. The Term Loan Facility amortizes quarterly in accordance with its terms through June 30, 2020 with a final maturity date on September 28, 2020.
In addition to the financial covenants discussed above, the Credit Agreement and the related security agreement contain certain customary representations and warranties, affirmative covenants and events of default. The Credit Agreement contains certain restrictions on the ability of the Holding Entities and MSGN L.P. and its restricted subsidiaries to take certain actions as provided in (and subject to various exceptions and baskets set forth in) the Credit Agreement, including the following: (i) incurring additional indebtedness and contingent liabilities; (ii) creating liens on certain assets; (iii) making investments, loans or advances in or to other persons; (iv) paying dividends and distributions or repurchasing capital stock; (v) changing their lines of business; (vi) engaging in certain transactions with affiliates; (vii) amending specified material agreements; (viii) merging or consolidating; (ix) making certain dispositions; and (x) entering into agreements that restrict the granting of liens. The Holdings Entities are also subject to customary passive holding company covenants.
See Note 8 to the consolidated financial statements included in Item 8 of this Annual Report on Form 10-K for more information on the Credit Agreement.
31
Contractual Obligations
As of June 30, 2017, future cash payments required under contracts entered into by the Company in the normal course of
business are as follows:
Payments Due by Period | |||||||||||||||||||
Total | Year 1 | Years 2-3 | Years 4-5 | More Than 5 Years | |||||||||||||||
Contractual obligations (a) | $ | 4,581,135 | $ | 243,617 | $ | 495,754 | $ | 503,129 | $ | 3,338,635 | |||||||||
Operating lease obligations (b) | 31,352 | 5,841 | 11,522 | 7,902 | 6,087 | ||||||||||||||
Debt repayment (c) | 1,321,250 | 75,000 | 189,375 | 1,056,875 | — | ||||||||||||||
Total | $ | 5,933,737 | $ | 324,458 | $ | 696,651 | $ | 1,567,906 | $ | 3,344,722 | |||||||||
(a) | Contractual obligations not reflected on the balance sheet consist primarily of obligations under our media rights agreements. |
(b) | Operating lease obligations primarily represent future minimum rental payments on various long-term, noncancelable leases for office and studio space. |
(c) | Consists of principal repayments required under the Company’s Term Loan Facility. |
Cash Flow Discussion
Operating Activities from continuing operations
Net cash provided by operating activities from continuing operations for the year ended June 30, 2017 increased by $15,310 to $197,158 as compared with the prior year. This increase was due to higher income from continuing operations before income taxes and, to lesser extent, other net increases, partially offset by higher income taxes paid by continuing operations as compared with the prior year. Net cash used in operating activities of discontinued operations for the prior year period includes approximately $120,000 of income taxes paid. See Note 17 to the consolidated financial statements included in Item 8 of this Annual Report on Form 10-K.
Net cash provided by operating activities from continuing operations for the year ended June 30, 2016 increased by $159,197 to $181,848 as compared with the prior year. The change is primarily due to lower income taxes paid by continuing operations, including income taxes paid in fiscal year 2015 related to the sale of Fuse (the cash proceeds related to the sale are included in investing activities). Net cash used in operating activities of discontinued operations for fiscal year 2016 includes approximately $120,000 of income taxes paid. See Note 17 to the consolidated financial statements included in Item 8 of this Annual Report on Form 10-K.
Investing Activities from continuing operations
Net cash used in investing activities from continuing operations for the year ended June 30, 2017 increased by $1,571 to $4,894 as compared with the prior year due to higher capital expenditures in the current year.
Net cash used in investing activities from continuing operations for the year ended June 30, 2016 was $3,323 as compared with net cash provided by investing activities from continuing operations in the prior year of $221,427. This change is primarily due to proceeds received during fiscal year 2015 from the sale of Fuse, slightly offset by lower capital expenditures in fiscal year 2016 as compared with the prior year.
32
Financing Activities from Continuing Operations
Net cash used in financing activities from continuing operations for the year ended June 30, 2017 increased by $76,228 to $169,769 as compared with the prior year. The main drivers of this change are higher principal repayments on the Company’s Term Loan Facility, including fiscal year 2017 voluntary payments of $100,000, as compared with the prior year, partially offset by the absence of the net impact of the following items which occurred in fiscal year 2016: (i) cash distributed with MSG in connection with the Distribution, (ii) cash used for repurchases of the Company’s Class A Common Stock under a share repurchase program which was terminated effective as of the Distribution Date, (iii) cash used for financing costs and (iv) the proceeds received from the Term Loan Facility.
Net cash used in financing activities from continuing operations for the year ended June 30, 2016 improved by $54,715 to $93,541 as compared with the prior year primarily due to the proceeds from the Term Loan Facility received in fiscal year 2016, largely offset by the cash distributed with MSG, as well as the Company’s principal payments on the Term Loan Facility during fiscal year 2016. This change was also impacted by less cash used in fiscal year 2016 for repurchases of the Company’s Class A Common Stock as compared with the prior year.
Recently Issued Accounting Pronouncements Not Yet Adopted and Critical Accounting Policies
Recently Issued Accounting Pronouncements Not Yet Adopted
In May 2014, the Financial Accounting Standards Board (“FASB”) issued Accounting Standards Update (“ASU”) No. 2014-09, Revenue from Contracts with Customers (Topic 606), which supersedes the revenue recognition requirements in FASB Accounting Standards Codification (“ASC”) Topic 605, Revenue Recognition. This ASU is based on the principle that revenue is recognized to depict the transfer of goods or services to customers in an amount that reflects the consideration to which the entity expects to be entitled in exchange for those goods or services. The ASU also requires additional disclosure about the nature, amount, timing and uncertainty of revenue and cash flows arising from customer contracts, including significant judgments and changes in judgments and assets recognized from costs incurred to obtain or fulfill a contract. In August 2015, the FASB issued ASU No. 2015-14, Revenue from Contracts with Customers (Topic 606): Deferral of the Effective Date, which defers the effective date of ASU No. 2014-09 for all entities by one year. In March 2016, the FASB issued ASU No. 2016-08, Revenue from Contracts with Customers (Topic 606): Principal versus Agent Considerations, which provides clarification on the implementation guidance on principal versus agent considerations outlined in ASU No. 2014-09. In April 2016, the FASB issued ASU No. 2016-10, Revenue from Contracts with Customers (Topic 606): Identifying Performance Obligations and Licensing, which finalized amendments to identifying performance obligations and accounting for licenses of intellectual property. In May 2016, the FASB issued ASU No. 2016-12, Revenue from Contracts with Customers (Topic 606): Narrow-Scope Improvements and Practical Expedients, which clarifies assessing collectibility, noncash consideration, presentation of sales taxes, completed contracts and contract modifications at transition. This standard will be effective for the Company beginning in the first quarter of fiscal year 2019 using one of two retrospective application methods. The Company is currently evaluating the impact this standard will have on its consolidated financial statements.
In February 2016, the FASB issued ASU No. 2016-02, Leases (Topic 842), which requires the recognition of lease assets and lease liabilities on the balance sheet for those leases classified as operating leases under previous GAAP. The amended guidance also requires additional quantitative and qualitative disclosures regarding the amount, timing and uncertainty of cash flows arising from leases in order to provide additional information about the nature of an organization’s leasing activities. This standard will be effective for the Company beginning in the first quarter of fiscal year 2020, with early adoption permitted. This standard will be adopted using a modified retrospective approach. The Company is currently evaluating the impact this standard will have on its consolidated financial statements.
In August 2016, the FASB issued ASU No. 2016-15, Statement of Cash Flows (Topic 230): Classification of Certain Cash Receipts and Cash Payments, which amends ASC Topic 230, Statement of Cash Flows, to eliminate the diversity in practice related to the classification of certain cash receipts and payments in the statement of cash flows by adding or clarifying guidance on eight specific cash flow issues. This standard will be effective for the Company beginning in the first quarter of fiscal year 2019, with early adoption permitted and the retrospective approach required. The adoption of this guidance is not expected to have a material impact on the Company’s consolidated financial statements.
In January 2017, the FASB issued ASU No. 2017-01, Business Combinations (Topic 805): Clarifying the Definition of a Business, which clarifies the definition of a business with the objective of adding guidance to assist entities with evaluating whether transactions should be accounted for as acquisitions (or disposals) of assets or businesses, which will effect various areas of accounting including, but not limited to, goodwill and consolidation. This standard will be effective for the Company beginning in the first quarter of fiscal year 2019, with early adoption permitted. The standard is to be applied prospectively. The adoption of this guidance is not expected to have a material impact on the Company's consolidated financial statements.
33
In January 2017, the FASB issued ASU No. 2017-04, Intangibles — Goodwill and Other (Topic 350): Simplifying the Test for Goodwill Impairment, which simplifies the measurement of goodwill impairment by eliminating the requirement of performing a hypothetical purchase price allocation. Instead, impairment will be measured using the difference between the carrying amount and fair value of the reporting unit. The amended guidance also eliminates the requirement for any reporting unit with a zero or a negative carrying amount to perform a qualitative assessment and will require disclosure of the amount of goodwill allocated to each reporting unit with a zero or a negative carrying amount of net assets. This standard will be effective for the Company beginning in the first quarter of fiscal year 2021. Early adoption is permitted for interim or annual goodwill impairment tests performed on testing dates after January 1, 2017. The standard is to be applied prospectively. Based on the Company's most recent annual goodwill impairment test completed in fiscal year 2017, the adoption of this guidance is not expected to have any initial impact on the Company's consolidated financial statements.
In March 2017, the FASB issued ASU No. 2017-07, Compensation — Retirement Benefits (Topic 715): Improving the Presentation of Net Periodic Pension Cost and Net Periodic Postretirement Benefit Cost, which requires: (i) presentation of the service cost component of net periodic benefit cost within the same line item as other compensation costs arising from services rendered by relevant employees during the period, and (ii) the non-service cost components of net periodic benefit cost to be presented separately in the income statement from the service cost component and not be included in the subtotal for operating income. In addition, only the service cost component is eligible to be capitalized into an asset. This standard will be effective for the Company beginning in the first quarter of fiscal year 2019, with early adoption permitted at the beginning of an annual period for which financial statements have not been issued. The standard is to be applied retrospectively, except for the change to the capitalization guidelines, which is to be applied prospectively. Although the Company does not expect the standard to have an impact on its consolidated net income, the Company’s net periodic benefit cost for fiscal year 2017 includes approximately $1,600 of expense that will be reclassified from operating income to a line item below operating income upon adoption.
In May 2017, the FASB issued ASU No. 2017-09, Compensation — Stock Compensation (Topic 718): Scope of Modification Accounting, which provides guidance about which changes to the terms or conditions of a share-based payment award require an entity to apply modification accounting. An entity should account for the effects of a modification unless all of the following characteristics of the modified award are the same as the original award immediately before the original award is modified: (i) the award’s fair value, (ii) the award’s vesting condition, and (iii) the award’s classification as an equity or liability instrument. This standard will be effective for the Company beginning in the first quarter of fiscal year 2019, with early adoption permitted. The standard is to be applied prospectively to an award modified on or after the adoption date. The adoption of this guidance is not expected to have a material impact on the Company's consolidated financial statements.
Critical Accounting Policies
The preparation of the Company’s consolidated financial statements in conformity with GAAP requires management to make estimates and assumptions about future events. These estimates and the underlying assumptions affect the amounts of assets and liabilities reported, disclosures about contingent assets and liabilities, and reported amounts of revenues and expenses. Management believes its use of estimates in the consolidated financial statements to be reasonable. The significant accounting policies which we believe are the most critical to aid in fully understanding and evaluating our reported financial results include the following:
Impairment of Long-Lived and Indefinite-Lived Assets
The Company’s long-lived and indefinite-lived assets accounted for approximately 59% of the Company’s consolidated total assets as of June 30, 2017 and consist of the following:
Goodwill | $ | 424,508 | |
Amortizable intangible assets, net | 40,663 | ||
Property and equipment, net | 11,828 | ||
$ | 476,999 | ||
In assessing the recoverability of the Company’s long-lived and indefinite-lived assets, the Company must make estimates and assumptions regarding future cash flows and other factors to determine the fair value of the respective assets. These estimates and assumptions could have a significant impact on whether an impairment charge is recognized and also the magnitude of any such charge. Fair value estimates are made at a specific point in time, based on relevant information. These estimates are subjective in nature and involve significant uncertainties and judgments and, therefore, cannot be determined with precision. Changes in assumptions could significantly affect the estimates. If these estimates or material related assumptions change in the future, the Company may be required to record impairment charges related to its long-lived and/or indefinite-lived assets.
34
Goodwill
Goodwill is tested annually for impairment as of August 31st and at any time upon the occurrence of certain events or substantive changes in circumstances. The Company has the option to perform a qualitative assessment to determine if an impairment is more likely than not to have occurred. If the Company can support the conclusion that it is not more likely than not that the fair value of a reporting unit is less than its carrying amount, the Company would not need to perform the two-step impairment test for that reporting unit. If the Company cannot support such a conclusion or the Company does not elect to perform the qualitative assessment then the first step of the goodwill impairment test is used to identify potential impairment by comparing the fair value of a reporting unit with its carrying amount, including goodwill. If the carrying amount of a reporting unit exceeds its fair value, the second step of the goodwill impairment test is performed to measure the amount of impairment loss, if any. The second step of the goodwill impairment test compares the implied fair value of the reporting unit’s goodwill with the carrying amount of that goodwill. If the carrying amount of the reporting unit’s goodwill exceeds the implied fair value of that goodwill, an impairment loss is recognized in an amount equal to that excess. The implied fair value of goodwill is determined in the same manner as the amount of goodwill that would be recognized in a business combination. The Company has one reporting unit for evaluating goodwill impairment. For all periods presented the Company elected to perform the qualitative assessment of impairment for the Company’s goodwill. These assessments considered factors such as:
• | Macroeconomic conditions; |
• | Industry and market considerations; |
• | Cost factors; |
• | Overall financial performance; |
• | Other relevant company-specific factors such as changes in management, strategy or customers; and |
• | Relevant specific events such as changes in the carrying amount of net assets. |
During the first quarter of fiscal year 2017, the Company performed its annual impairment test of goodwill, and there was no impairment of goodwill identified.
Other Long-Lived Assets
For other long-lived assets, including intangible assets that are amortized, the Company evaluates assets for recoverability when there is an indication of potential impairment. If the undiscounted cash flows from a group of assets being evaluated is less than the carrying value of that group of assets, the fair value of the asset group is determined and the carrying value of the asset group is written down to fair value.
As of June 30, 2017, the Company’s intangible assets subject to amortization, which were affiliate relationships, have an estimated useful life of 24 years. The useful lives for the affiliate relationships were determined based upon an estimate for renewals of existing agreements the Company had in place with its major customers in April 2005 (the time that purchase accounting was applied). The Company has renewed its major affiliation agreements and maintained customer relationships in the past and believes it will be able to renew its major affiliation agreements and maintain those customer relationships in the future. In light of these facts and circumstances, the Company has determined that its estimated useful lives are appropriate. However, it is possible that the Company will not successfully renew such agreements as they expire or that if it does, the net revenue earned may not equal or exceed the net revenue currently being earned, which could have a material negative effect on our business.
There have been periods when an existing affiliation agreement has expired and the parties have not finalized negotiations of either a renewal of that agreement or a new agreement for certain periods of time. In certain of these circumstances, Distributors may continue to carry the service(s) until the execution of definitive renewal or replacement agreements (or until we or the affiliate determine that carriage should cease). See “Part I — Item 1A. Risk Factors — The Success of Our Business Depends on Affiliation Fees We Receive Under Our Affiliation Agreements, the Loss of Which or Renewal of Which on Less Favorable Terms May Have a Material Negative Effect on Our Business and Results of Operations.”
If a Distributor ceases to carry the service on an other than temporary basis, the Company would record an impairment charge for the then remaining carrying value of the affiliate relationship intangible asset associated with that Distributor. If the Company were to renew an affiliation agreement at rates that produced materially less net revenue compared to the net revenue produced under the previous agreement, the Company would evaluate the impact on its cash flows and, if necessary, would further evaluate such indication of potential impairment by following the policy described above for the asset or asset group containing that intangible asset. The Company also would evaluate whether the remaining useful life of the affiliate relationship remained appropriate. Based on the carrying value of the affiliate relationships recorded as of June 30, 2017, if the estimated life of these affiliate relationships were shortened by 10%, the effect on amortization for the year ended June 30, 2017 would be an increase of approximately $384.
35
Defined Benefit Pension Plans and Other Postretirement Benefit Plan
The Company utilizes actuarial methods to calculate pension and other postretirement benefit obligations and the related net periodic benefit cost, which are based on actuarial assumptions. Two key assumptions, the discount rate and the expected long-term rate of return on plan assets, are important elements of the plans' expense and liability measurement and we evaluate these key assumptions annually. Other assumptions include demographic factors, such as mortality, retirement age and turnover. The actuarial assumptions used by the Company may differ materially from actual results due to various factors, including, but not limited to, changing economic and market conditions. Differences between actual and expected occurrences could significantly impact the actual amount of net periodic benefit cost and the benefit obligation recorded by the Company. Material changes in the costs of the plans may occur in the future due to changes in these assumptions, changes in the number of the plan participants, changes in the level of benefits provided, changes in asset levels and changes in legislation. Our assumptions reflect our historical experience and our best judgment regarding future expectations.
Accumulated and projected benefit obligations reflect the present value of future cash payments for benefits. We use the Willis Towers Watson U.S. Rate Link: 40-90 discount rate model (which is developed by examining the yields on selected highly rated corporate bonds) to discount these benefit payments on a plan by plan basis, to select the rates at which we believe each plan's benefits could be effectively settled. Lower discount rates increase the present value of benefit obligations and will usually increase the subsequent year's net periodic benefit cost. The weighted-average discount rates used to determine benefit obligations as of June 30, 2017 for the Company's pension plans and postretirement plan were 3.80% and 3.68%, respectively. A 25 basis point decrease in these assumed discount rates would increase the projected benefit obligations for the Company's pension plans and postretirement plan at June 30, 2017 by $1,510 and $105, respectively. The weighted-average discount rates used to determine the service cost and interest cost components of net periodic benefit cost for the year ended June 30, 2017 for the Company's pension plans were 3.73% and 3.03%, respectively. The weighted-average discount rates used to determine the service cost and interest cost components of net periodic benefit cost for the year ended June 30, 2017 for the Company's postretirement plan were 3.63% and 2.84%, respectively. A 25 basis point decrease in these assumed discount rates would increase the total net periodic benefit cost for the Company's pension plans by $100 and decrease net periodic benefit cost for the postretirement plan by $3 for the year ended June 30, 2017.
The expected long-term return on plan assets is based on a periodic review and modeling of the plans' asset allocation structures over a long-term horizon. Expectations of returns for each asset class are the most important of the assumptions used in the review and modeling, and are based on comprehensive reviews of historical data, forward-looking economic outlook, and economic/financial market theory. The expected long-term rate of return was selected from within the reasonable range of rates determined by (a) historical real returns, net of inflation, for the asset classes covered by the investment policy, and (b) projections of inflation over the long-term period during which benefits are payable to plan participants. The expected long-term rate of return on plan assets for the Company's funded pension plans was 3.38% for the year ended June 30, 2017. Performance of the capital markets affects the value of assets that are held in trust to satisfy future obligations under the Company's funded plans. Adverse market performance in the future could result in lower rates of return for these assets than projected by the Company which could increase the Company's funding requirements related to these plans, as well as negatively affect the Company's operating results by increasing the net periodic benefit cost. A 25 basis point decrease in the long-term return on pension plan assets assumption would increase net periodic pension benefit cost by $39 for the year ended June 30, 2017.
Another important assumption for our postretirement plan is healthcare cost trend rates. We developed our estimate of the healthcare cost trend rates through examination of the Company's claims experience and the results of recent healthcare trend surveys.
Assumptions for healthcare cost trend rates used to determine the benefit obligation and net periodic benefit cost for our postretirement plan as of and for the year ended June 30, 2017 are as follows:
Net Periodic Benefit Cost | Benefit Obligation | ||||
Healthcare cost trend rate assumed for next year | 7.25 | % | 7.25 | % | |
Rate to which the cost trend rate is assumed to decline (the ultimate trend rate) | 5.00 | % | 5.00 | % | |
Year that the rate reaches the ultimate trend rate | 2026 | 2027 | |||
A one percentage point change in assumed healthcare cost trend rates would have the following effects on the benefit obligation for our postretirement plan and net periodic postretirement benefit cost as of and for the year ended June 30, 2017:
36
Increase (Decrease) on Total of Service and Interest Cost Components | Increase (Decrease) on Benefit Obligation | ||||||
One percentage point increase | $ | 24 | $ | 448 | |||
One percentage point decrease | (21 | ) | (382 | ) | |||
Generally accepted accounting principles (“GAAP”) includes mechanisms that serve to limit the volatility in the Company's earnings that otherwise would result from recording changes in the value of plan assets and benefit obligations in our consolidated financial statements in the periods in which those changes occur. For example, while the expected long-term rate of return on the plans' assets should, over time, approximate the actual long-term returns, differences between the expected and actual returns could occur in any given year. These differences contribute to the deferred actuarial gains or losses, which are then amortized over time.
See Note 13 to the consolidated financial statements included in Item 8 of this Annual Report on Form 10-K for more information on our pension plans and other postretirement benefit plan.
Item 7A. Quantitative and Qualitative Disclosures About Market Risk
For sensitivity analyses and other information regarding market risks we face in connection with our pension and postretirement plans, see “Item 7. Management's Discussion and Analysis of Financial Condition and Results of Operations —Recently Issued Accounting Pronouncements Not Yet Adopted and Critical Accounting Policies — Critical Accounting Policies — Defined Benefit Pension Plans and Other Postretirement Benefit Plan,” which information is incorporated by reference herein.
Our market risk exposure to interest rate risk relates to any borrowing we may incur.
Borrowings under the credit agreement, dated September 28, 2015, among MSGN L.P., MSGN Eden, LLC, Regional MSGN Holdings LLC and certain subsidiaries of MSGN L.P. and a syndicate of lenders (the "Credit Agreement") bear interest, based on our election, at a floating rate based upon LIBOR, the New York Fed Bank Rate or the U.S. Prime Rate, plus, in each case, an additional rate which is fixed for an initial period of time and thereafter dependent upon our total leverage ratio at the time. Accordingly, we are subject to interest rate risk with respect to the tenor of any borrowings we may incur under the Credit Agreement. The effect of a hypothetical 100 basis point increase in floating interest rates prevailing at June 30, 2017 and continuing for a full year would increase interest expense related to the amount outstanding under our $1.550 billion term loan facility provided under the Credit Agreement by $12,683. If appropriate, we may seek to reduce such exposure through the use of interest rate swaps or similar instruments. See “Item 7. Management's Discussion and Analysis of Financial Condition and Results of Operations — Liquidity and Capital Resources — Financing Agreements” for more information on our Credit Agreement.
We have de minimis foreign currency risk exposure as our business operates almost entirely in U.S. Dollars. We do not have any meaningful commodity risk exposures associated with our operations.
Item 8. Financial Statements and Supplementary Data
The Financial Statements required by this Item 8 appear beginning on page F-1 of this Annual Report on Form 10-K, and are incorporated by reference herein.
Item 9. Changes in and Disagreements with Accountants on Accounting and Financial Disclosure
None.
37
Item 9A. Controls and Procedures
Evaluation of Disclosure Controls and Procedures
An evaluation was carried out under the supervision and with the participation of the Company's management, including our Chief Executive Officer and Chief Financial Officer, of the effectiveness of the design and operation of our disclosure controls and procedures (as defined in Rules 13a-15(e) and 15d-15(e) under the Exchange Act). Based upon that evaluation, the Company's Chief Executive Officer and Chief Financial Officer concluded that as of June 30, 2017 the Company's disclosure controls and procedures were effective at a reasonable level of assurance in alerting them in a timely manner to material information required to be disclosed in our periodic reports filed with the SEC.
Management's Report on Internal Control over Financial Reporting
Management is responsible for establishing and maintaining adequate internal control over financial reporting, as such term is defined in Rule 13a-15(f) under the Exchange Act. The Company's internal control over financial reporting includes those policies and procedures that: (i) pertain to the maintenance of records that, in reasonable detail, accurately and fairly reflect the transactions and dispositions of the assets of the Company; (ii) provide reasonable assurance that transactions are recorded as necessary to permit preparation of financial statements in accordance with generally accepted accounting principles, and that receipts and expenditures of the Company are being made only in accordance with authorizations of management and directors of the Company; and (iii) provide reasonable assurance regarding prevention or timely detection of unauthorized acquisition, use, or disposition of the Company's assets that could have a material effect on the financial statements.
Internal control over financial reporting is designed to provide reasonable assurance regarding the reliability of financial reporting and the preparation of financial statements prepared for external purposes in accordance with generally accepted accounting principles. Because of its inherent limitations, internal control over financial reporting may not prevent or detect misstatements. Also, projections of any evaluation of effectiveness to future periods are subject to the risk that controls may become inadequate because of changes in conditions, or that the degree of compliance with the policies or procedures may deteriorate.
Under the supervision and with the participation of management, including the Company's Chief Executive Officer and Chief Financial Officer, we conducted an evaluation of the effectiveness of our internal control over financial reporting based on the framework in Internal Control — Integrated Framework (2013) issued by the Committee of Sponsoring Organizations of the Treadway Commission. Based on the results of this evaluation, our management concluded that our internal control over financial reporting was effective as of June 30, 2017.
The effectiveness of our internal control over financial reporting as of June 30, 2017 has been audited by KPMG LLP, an independent registered public accounting firm, as stated in their report which is included herein.
Changes in Internal Controls
There were no changes in the Company’s internal control over financial reporting (as such term is defined in Rules 13a-15(f) and 15d-15(f) under the Exchange Act) during the fiscal quarter ended June 30, 2017 that have materially affected, or are reasonably likely to materially affect, the Company’s internal control over financial reporting.
Item 9B. Other Information
None.
38
PART III
Item 10. Directors, Executive Officers and Corporate Governance
Information relating to our directors, executive officers and corporate governance will be included in the proxy statement for the 2017 annual meeting of the Company's stockholders, which is expected to be filed within 120 days of our fiscal year end, and is incorporated herein by reference.
Item 11. Executive Compensation
Information relating to executive compensation will be included in the proxy statement for the 2017 annual meeting of the Company's stockholders, which is expected to be filed within 120 days of our fiscal year end, and is incorporated herein by reference.
Item 12. Security Ownership of Certain Beneficial Owners and Management and Related Stockholder Matters
Information relating to the beneficial ownership of our common stock will be included in the proxy statement for the 2017 annual meeting of the Company's stockholders, which is expected to be filed within 120 days of our fiscal year end, and is incorporated herein by reference.
Item 13. Certain Relationships and Related Transactions, and Director Independence
Information relating to certain relationships and related transactions and director independence will be included in the proxy statement for the 2017 annual meeting of the Company's stockholders, which is expected to be filed within 120 days of our fiscal year end, and is incorporated herein by reference.
Item 14. Principal Accountant Fees and Services
Information relating to principal accountant fees and services will be included in the proxy statement for the 2017 annual meeting of the Company's stockholders, which is expected to be filed within 120 days of our fiscal year end, and is incorporated herein by reference.
39
PART IV
Item 15. Exhibits and Financial Statement Schedules
Page No. | ||||
The following documents are filed as part of this report: | ||||
1. | The financial statements as indicated in the index set forth on page | |||
2. | Financial statement schedule: | |||
Schedule supporting consolidated financial statements | ||||
Schedules other than that listed above have been omitted, since they are either not applicable, not required or the information is included elsewhere herein.
3. | The Index to Exhibits is on page | |||
Item 16. Form 10-K Summary
The Company has elected not to provide a summary.
40
MSG NETWORKS INC.
SCHEDULE II
VALUATION AND QUALIFYING ACCOUNTS
(in thousands)
Balance at Beginning of Period | (Additions) Deductions Charged to Costs and Expenses | (Additions) Deductions Charged to Other Accounts | Deductions (a) | Balance at End of Period | |||||||||||||||
Year Ended June 30, 2017 Allowance for doubtful accounts | $ | (838 | ) | $ | 242 | $ | — | $ | 2 | $ | (594 | ) | |||||||
Year Ended June 30, 2016 Allowance for doubtful accounts | $ | (273 | ) | $ | (791 | ) | $ | (52 | ) | $ | 278 | $ | (838 | ) | |||||
Year Ended June 30, 2015 Allowance for doubtful accounts | $ | (146 | ) | $ | (244 | ) | $ | — | $ | 117 | $ | (273 | ) | ||||||
_____________________________
(a) Primarily reflects write-offs of uncollectible amounts.
41
SIGNATURES
Pursuant to the requirements of Section 13 or 15(d) the Securities Exchange Act of 1934, as amended, the Registrant has duly caused this report to be signed on its behalf by the undersigned, thereunto duly authorized, on the 16th day of August, 2017.
MSG Networks Inc. | ||
By: | /s/ BRET RICHTER | |
Name: | Bret Richter | |
Title: | Executive Vice President, Chief Financial Officer and Treasurer | |
POWER OF ATTORNEY
KNOW ALL MEN BY THESE PRESENTS, that each person whose signature appears below constitutes and appoints Andrea Greenberg and Bret Richter, and each of them, as such person's true and lawful attorneys-in-fact and agents, with full power of substitution and resubstitution, for such person in such person's name, place and stead, in any and all capacities, to sign this report, and file the same, with all exhibits thereto, and other documents in connection therewith, with the Securities and Exchange Commission, granting unto said attorneys-in-fact and agents, full power and authority to do and perform each and every act and thing requisite and necessary to be done as fully to all intents and purposes as he might or could do in person, hereby ratifying and confirming all that said attorneys-in-fact and agents or any of them may lawfully do or cause to be done by virtue hereof.
Pursuant to the requirements of the Securities Exchange Act of 1934, as amended, this report has been signed below by the following persons in the capacities and on the dates indicated.
Name | Title | Date | ||
/s/ ANDREA GREENBERG | President & Chief Executive Officer (Principal Executive Officer) | August 16, 2017 | ||
Andrea Greenberg | ||||
/s/ BRET RICHTER | Executive Vice President, Chief Financial Officer and Treasurer (Principal Financial Officer) | August 16, 2017 | ||
Bret Richter | ||||
/s/ DAWN DARINO-GORKSI | Senior Vice President, Controller and Principal Accounting Officer | August 16, 2017 | ||
Dawn Darino-Gorski | ||||
/s/ JAMES L. DOLAN | Executive Chairman (Director) | August 16, 2017 | ||
James L. Dolan | ||||
/s/ WILLIAM J. BELL | Director | August 16, 2017 | ||
William J. Bell | ||||
/s/ CHARLES F. DOLAN | Director | August 16, 2017 | ||
Charles F. Dolan | ||||
/s/ PAUL J. DOLAN | Director | August 16, 2017 | ||
Paul J. Dolan | ||||
/s/ QUENTIN F. DOLAN | Director | August 16, 2017 | ||
Quentin F. Dolan | ||||
/s/ THOMAS C. DOLAN | Director | August 16, 2017 | ||
Thomas C. Dolan | ||||
42
Name | Title | Date | ||
/s/ WILT HILDENBRAND | Director | August 16, 2017 | ||
Wilt Hildenbrand | ||||
/s/ JOSEPH J. LHOTA | Director | August 16, 2017 | ||
Joseph J. Lhota | ||||
/s/ JOEL M. LITVIN | Director | August 16, 2017 | ||
Joel M. Litvin | ||||
/s/ HANK J. RATNER | Director | August 16, 2017 | ||
Hank J. Ratner | ||||
/s/ BRIAN G. SWEENEY | Director | August 16, 2017 | ||
Brian G. Sweeney | ||||
/s/ JOHN L. SYKES | Director | August 16, 2017 | ||
John L. Sykes | ||||
43
INDEX TO EXHIBITS
EXHIBIT NO. | DESCRIPTION | |
2.1 | Distribution Agreement dated September 11, 2015, between MSG Networks Inc. and The Madison Square Garden Company (incorporated by reference to Exhibit 99.1 to the Company’s Current Report on Form 8-K filed September 14, 2015). | |
3.1 | Amended and Restated Certificate of Incorporation of Madison Square Garden, Inc. (incorporated by reference to Exhibit 99.1 to the Company's Current Report on Form 8-K filed on February 10, 2010). | |
3.1.A | Certificate of Ownership and Merger merging The Madison Square Garden Company with and into Madison Square Garden, Inc. (incorporated by reference to Exhibit 3.1 to the Company's Form 10-Q for the quarter ended March 31, 2011 filed on May 6, 2011). | |
3.1.B | Amendment to the Amended and Restated Certificate of Incorporation of MSG Networks Inc., (incorporated by reference to Exhibit 3.1 to the Company’s Current Report on Form 8-K filed on October 6, 2015). | |
3.2 | Amended By-Laws of MSG Networks Inc. (incorporated by reference to Exhibit 3.2 to the Company's Current Report on Form 8-K filed on October 6, 2015). | |
4.1 | Registration Rights Agreement by and among MSG Networks Inc. formerly known as The Madison Square Garden Company and the Charles F. Dolan Children Trusts (incorporated by reference to Exhibit 3.5 to Amendment No. 7 to the Company's Registration Statement on Form 10 filed on January 14, 2010). | |
4.2 | Registration Rights Agreement by and among MSG Networks Inc. formerly known as The Madison Square Garden Company and the Dolan Family Affiliates (incorporated by reference to Exhibit 3.6 to Amendment No. 7 to the Company's Registration Statement on Form 10 filed on January 14, 2010). | |
4.3 | Transfer Consent Agreement with NBA, dated February 9, 2010 (incorporated by reference to Exhibit 3.7 to Amendment No. 6 to the Company's Registration Statement on Form 10 filed on January 11, 2010). | |
4.4 | Transfer Consent Agreement with NHL, dated February 9, 2010 (incorporated by reference to Exhibit 3.8 to Amendment No. 6 to the Company's Registration Statement on Form 10 filed on January 11, 2010). | |
10.1 | Tax Disaffiliation Agreement dated September 11, 2015, between MSG Networks Inc. and The Madison Square Garden Company (incorporated by reference to Exhibit 99.4 to the Company’s Current Report on Form 8-K filed on September 14, 2015). | |
10.2 | Contribution Agreement, dated as of September 11, 2015, among MSG Networks Inc., MSGN Holdings, L.P. and The Madison Square Garden Company (incorporated by reference to Exhibit 99.2 to the Company’s Current Report on Form 8-K filed on September 14, 2015). | |
10.3 | Transition Services Agreement dated as of September 11, 2015, between MSG Networks Inc. and The Madison Square Garden Company (incorporated by reference to Exhibit 99.3 to the Company’s Current Report on Form 8-K filed on September 14, 2015). | |
10.4 | Employee Matters Agreement dated September 11, 2015, between MSG Networks Inc. and The Madison Square Garden Company (incorporated by reference to Exhibit 99.5 to the Company’s Current Report on Form 8-K filed on September 14, 2015). | |
10.5 | MSG Networks Inc. 2010 Employee Stock Plan, as amended (incorporated by reference to Annex A to the Company's DEF 14A filed on October 28, 2015).† | |
10.6 | MSG Networks Inc. 2010 Cash Incentive Plan, as amended (incorporated by reference to Annex B to the Company's DEF 14A filed on October 28, 2015).† | |
10.7 | MSG Networks Inc. 2010 Stock Plan for Non-Employee Directors, as amended (incorporated by reference to Annex C to the Company's DEF 14A filed on October 28, 2016).† | |
10.8 | Affiliation Agreement between CSC Holdings, Inc. and MSGN Holdings L.P. formerly known as MSG Holdings, L.P. (incorporated by reference to Exhibit 10.12 to Amendment No. 6 to the Company's Registration Statement on Form 10 filed on January 11, 2010). + | |
10.9 | Form of MSG Networks Inc. formerly known as The Madison Square Garden Company Rights Agreement (incorporated by reference to Exhibit 10.14 to Amendment No. 6 to the Company's Registration Statement on Form 10 filed on January 11, 2010). † | |
10.10 | Form of MSG Networks Inc. Option Agreement (incorporated by reference to Exhibit 10.1 to the Company’s Current Report on Form 8-K filed on September 15, 2016). † | |
10.11 | Form of MSG Networks Inc. Performance Option Agreement (incorporated by reference to Exhibit 10.2 to the Company’s Current Report on Form 8-K filed on September 15, 2016). † | |
10.12 | Form of MSG Networks Inc. formerly known as The Madison Square Garden Company Non-Employee Director Award Agreement (incorporated by reference to Exhibit 10.2 to the Company's Form 10-Q for the quarter ended December 31, 2012 filed on February 6, 2013). † | |
44
EXHIBIT NO. | DESCRIPTION | |
10.13 | Form of MSG Networks Inc. formerly known as The Madison Square Garden Company Restricted Stock Units Agreement (incorporated by reference to Exhibit 10.4 to the Company’s Current Report on Form 8-K filed on September 10, 2015). † | |
10.14 | Form of MSG Networks Inc. formerly known as The Madison Square Garden Company Performance Award Agreement (incorporated by reference to Exhibit 10.33 to the Company's Form 10-K for the fiscal year ended June 30, 2013 filed on August 21, 2013). † | |
10.15 | Form of MSG Networks Inc. Performance Stock Units Agreement (incorporated by reference to Exhibit 10.5 to the Company’s Current Report on Form 8-K filed on September 10, 2015). † | |
10.16 | Employment Agreement dated September 16, 2016 between MSG Networks Inc. and James L. Dolan (incorporated by reference to Exhibit 10.1 to the Company’s Form 10-Q for the quarter ended December 31, 2016, filed on February 2, 2017). † | |
10.17 | Employment Agreement dated as of September 11, 2015, between MSG Networks Inc. and Andrea Greenberg (incorporated by reference to Exhibit 10.1 to the Company’s Current Report on Form 8-K filed on September 14, 2015). † | |
10.18 | Employment Agreement dated as of September 11, 2015, between MSG Networks Inc. and Bret Richter (incorporated by reference to Exhibit 10.2 to the Company’s Current Report on Form 8-K filed on September 14, 2015). † | |
10.19 | Employment Agreement dated as of September 11, 2015, between MSG Networks Inc. and Lawrence J. Burian (incorporated by reference to Exhibit 10.3 to the Company’s Current Report on Form 8-K filed on September 14, 2015). † | |
10.20 | Employment Agreement dated September 11, 2015, between MSG Networks Inc. and Dawn Darino-Gorski (incorporated by reference to Exhibit 10.2 to the Company’s Form 10-Q for the quarter ended September 30, 2015 filed on November 5, 2015). † | |
10.21 | Credit Agreement dated as of September 28, 2015, by and among MSGN Holdings, L.P., certain subsidiaries of MSGN Holdings, L.P. identified therein, MSGN Eden, LLC, MSGN Regional Holdings LLC and JPMorgan Chase Bank, N.A., as administrative agent, collateral agent and a letter of credit issuer, and the lenders party thereto (incorporated by reference to Exhibit 10.1 to the Company’s Current Report on Form 8-K filed on September 28, 2015). | |
10.22 | Security Agreement dated as of September 28, 2015, by and among MSGN Holdings, L.P., certain subsidiaries of MSGN Holdings, L.P. identified therein, MSGN Eden, LLC, MSGN Regional Holdings LLC, and JPMorgan Chase Bank, N.A., as collateral agent thereto (incorporated by reference to Exhibit 10.2 to the Company’s Current Report on Form 8-K filed on September 28, 2015). | |
10.23 | MSG Networks Inc. Policy Concerning Certain Matters Relating to The Madison Square Garden Company and AMC Networks Inc. including Responsibilities of Overlapping Directors and Officers (incorporated by reference to Exhibit 10.1 to the Company’s Form 10-Q for the quarter ended September 30, 2015 filed on November 5, 2015). | |
10.24 | Form of Indemnification Agreement between MSG Networks Inc. formerly known as The Madison Square Garden Company and its Directors and Executive Officers (incorporated by reference to Exhibit 10.1 to the Company's Current Report on Form 8-K filed on March 21, 2015). † | |
10.25 | Summary of Office Space Arrangement between the Company and the Dolan Family Office (incorporated by reference to Exhibit 10.56 to the Company’s Form 10-K for the fiscal year ended June 30, 2016 filed on August 18, 2016). | |
21.1 | Subsidiaries of the Registrant. | |
23.1 | Consent of KPMG LLP. | |
24.1 | Powers of Attorney (included on the signature page to this Annual Report on Form 10-K). | |
31.1 | Certification by the President and Chief Executive Officer Pursuant to Section 302 of the Sarbanes-Oxley Act of 2002. | |
31.2 | Certification by the Chief Financial Officer Pursuant to Section 302 of the Sarbanes-Oxley Act of 2002. | |
32.1 | Certification by the President and Chief Executive Officer Pursuant to Section 906 of the Sarbanes-Oxley Act of 2002. | |
32.2 | Certification by the Chief Financial Officer Pursuant to Section 906 of the Sarbanes-Oxley Act of 2002. | |
101.INS | XBRL Instance Document. | |
101.SCH | XBRL Taxonomy Extension Schema. | |
45
EXHIBIT NO. | DESCRIPTION | |
101.CAL | XBRL Taxonomy Extension Calculation Linkbase. | |
101.DEF | XBRL Taxonomy Extension Definition Linkbase. | |
101.LAB | XBRL Taxonomy Extension Label Linkbase. | |
101.PRE | XBRL Taxonomy Extension Presentation Linkbase. | |
+ | Confidential treatment has been granted with respect to certain portions of this exhibit. Omitted portions have been filed separately with the SEC. |
† | This exhibit is a management contract or a compensatory plan or arrangement. |
46
INDEX TO CONSOLIDATED FINANCIAL STATEMENTS
F-1
Report of Independent Registered Public Accounting Firm on the Consolidated Financial Statements
The Board of Directors and Stockholders
MSG Networks Inc.:
We have audited the accompanying consolidated balance sheets of MSG Networks Inc. and subsidiaries as of June 30, 2017 and 2016, and the related consolidated statements of operations, comprehensive income, stockholders' equity (deficiency), and cash flows for each of the years in the three-year period ended June 30, 2017. In connection with our audits of the consolidated financial statements, we also have audited the financial statement schedule, "Schedule II — Valuation and Qualifying Accounts." These consolidated financial statements and the financial statement schedule are the responsibility of the Company's management. Our responsibility is to express an opinion on these consolidated financial statements and the financial statement schedule based on our audits.
We conducted our audits in accordance with the standards of the Public Company Accounting Oversight Board (United States). Those standards require that we plan and perform the audit to obtain reasonable assurance about whether the financial statements are free of material misstatement. An audit includes examining, on a test basis, evidence supporting the amounts and disclosures in the financial statements. An audit also includes assessing the accounting principles used and significant estimates made by management, as well as evaluating the overall financial statement presentation. We believe that our audits provide a reasonable basis for our opinion.
In our opinion, the consolidated financial statements referred to above present fairly, in all material respects, the consolidated financial position of MSG Networks Inc. and subsidiaries as of June 30, 2017 and 2016, the consolidated results of its operations and its cash flows for each of the years in the three-year period ended June 30, 2017, in conformity with U.S. generally accepted accounting principles. Also in our opinion, the related financial statement schedule, when considered in relation to the basic consolidated financial statements taken as a whole, presents fairly, in all material respects, the information set forth therein.
We also have audited, in accordance with the standards of the Public Company Accounting Oversight Board (United States), MSG Networks Inc.’s internal control over financial reporting as of June 30, 2017, based on criteria established in Internal Control - Integrated Framework (2013) issued by the Committee of Sponsoring Organizations of the Treadway Commission (COSO), and our report dated August 16, 2017, expressed an unqualified opinion on the effectiveness of the Company’s internal control over financial reporting.
/s/ KPMG LLP
New York, New York
August 16, 2017
F-2
Report of Independent Registered Public Accounting Firm on Internal Control Over Financial Reporting
The Board of Directors and Stockholders
MSG Networks Inc.:
We have audited MSG Networks Inc.’s internal control over financial reporting as of June 30, 2017, based on criteria established in Internal Control - Integrated Framework (2013) issued by the Committee of Sponsoring Organizations of the Treadway Commission (COSO). MSG Networks Inc.’s management is responsible for maintaining effective internal control over financial reporting and for its assessment of the effectiveness of internal control over financial reporting, included in the accompanying “Management’s Report on Internal Control over Financial Reporting.” Our responsibility is to express an opinion on the Company’s internal control over financial reporting based on our audit.
We conducted our audit in accordance with the standards of the Public Company Accounting Oversight Board (United States). Those standards require that we plan and perform the audit to obtain reasonable assurance about whether effective internal control over financial reporting was maintained in all material respects. Our audit included obtaining an understanding of internal control over financial reporting, assessing the risk that a material weakness exists, and testing and evaluating the design and operating effectiveness of internal control based on the assessed risk. Our audit also included performing such other procedures as we considered necessary in the circumstances. We believe that our audit provides a reasonable basis for our opinion.
A company’s internal control over financial reporting is a process designed to provide reasonable assurance regarding the reliability of financial reporting and the preparation of financial statements for external purposes in accordance with generally accepted accounting principles. A company’s internal control over financial reporting includes those policies and procedures that (1) pertain to the maintenance of records that, in reasonable detail, accurately and fairly reflect the transactions and dispositions of the assets of the company; (2) provide reasonable assurance that transactions are recorded as necessary to permit preparation of financial statements in accordance with generally accepted accounting principles, and that receipts and expenditures of the company are being made only in accordance with authorizations of management and directors of the company; and (3) provide reasonable assurance regarding prevention or timely detection of unauthorized acquisition, use, or disposition of the company’s assets that could have a material effect on the financial statements.
Because of its inherent limitations, internal control over financial reporting may not prevent or detect misstatements. Also, projections of any evaluation of effectiveness to future periods are subject to the risk that controls may become inadequate because of changes in conditions, or that the degree of compliance with the policies or procedures may deteriorate.
In our opinion, MSG Networks Inc. maintained, in all material respects, effective internal control over financial reporting as of June 30, 2017, based on criteria established in Internal Control - Integrated Framework (2013) issued by the Committee of Sponsoring Organizations of the Treadway Commission (COSO).
We also have audited, in accordance with the standards of the Public Company Accounting Oversight Board (United States), the consolidated balance sheets of MSG Networks Inc. as of June 30, 2017 and 2016, and the related consolidated statements of operations, comprehensive income, stockholders’ equity (deficiency), and cash flows for each of the years in the three-year period ended June 30, 2017, and our report dated August 16, 2017, expressed an unqualified opinion on those consolidated financial statements.
/s/ KPMG LLP
New York, New York
August 16, 2017
F-3
MSG NETWORKS INC.
CONSOLIDATED BALANCE SHEETS
(in thousands, except per share data)
June 30, | |||||||
2017 | 2016 | ||||||
ASSETS | |||||||
Current Assets: | |||||||
Cash and cash equivalents | $ | 141,087 | $ | 119,568 | |||
Accounts receivable, net | 105,030 | 101,427 | |||||
Net related party receivable | 17,153 | 15,492 | |||||
Prepaid income taxes | 14,322 | 28,384 | |||||
Prepaid expenses | 6,468 | 13,188 | |||||
Other current assets | 2,343 | 3,053 | |||||
Total current assets | 286,403 | 281,112 | |||||
Property and equipment, net | 11,828 | 14,154 | |||||
Amortizable intangible assets, net | 40,663 | 44,123 | |||||
Goodwill | 424,508 | 424,508 | |||||
Other assets | 41,642 | 42,645 | |||||
Total assets | $ | 805,044 | $ | 806,542 | |||
LIABILITIES AND STOCKHOLDERS' EQUITY (DEFICIENCY) | |||||||
Current Liabilities: | |||||||
Accounts payable | $ | 1,241 | $ | 2,043 | |||
Net related party payable | 2,963 | 4,302 | |||||
Current portion of long-term debt | 72,414 | 64,914 | |||||
Income taxes payable | 11,483 | 8,662 | |||||
Accrued liabilities: | |||||||
Employee related costs | 14,238 | 10,340 | |||||
Other accrued liabilities | 10,050 | 15,991 | |||||
Deferred revenue | 5,071 | 6,143 | |||||
Total current liabilities | 117,460 | 112,395 | |||||
Long-term debt, net of current portion | 1,240,431 | 1,412,845 | |||||
Defined benefit and other postretirement obligations | 29,979 | 31,827 | |||||
Other employee related costs | 3,930 | 5,550 | |||||
Related party payable | — | 1,710 | |||||
Other liabilities | 5,597 | 5,612 | |||||
Deferred tax liability | 351,854 | 356,561 | |||||
Total liabilities | 1,749,251 | 1,926,500 | |||||
Commitments and contingencies (see Notes 9, 10 and 11) | |||||||
Stockholders' Deficiency: | |||||||
Class A Common Stock, par value $0.01, 360,000 shares authorized; 61,497 and 61,354 shares outstanding as of June 30, 2017 and 2016, respectively | 643 | 643 | |||||
Class B Common Stock, par value $0.01, 90,000 shares authorized; 13,589 shares outstanding as of June 30, 2017 and 2016 | 136 | 136 | |||||
Preferred stock, par value $0.01, 45,000 shares authorized; none outstanding | — | — | |||||
Additional paid-in capital | 6,909 | — | |||||
Treasury stock, at cost, 2,762 and 2,905 shares as of June 30, 2017 and 2016, respectively | (198,800 | ) | (207,796 | ) | |||
Accumulated deficit | (746,539 | ) | (905,352 | ) | |||
Accumulated other comprehensive loss | (6,556 | ) | (7,589 | ) | |||
Total stockholders' deficiency | (944,207 | ) | (1,119,958 | ) | |||
Total liabilities and stockholders' deficiency | $ | 805,044 | $ | 806,542 | |||
See accompanying notes to consolidated financial statements.
F-4
MSG NETWORKS INC.
CONSOLIDATED STATEMENTS OF OPERATIONS
(in thousands, except per share data)
Years Ended June 30, | |||||||||||
2017 | 2016 | 2015 | |||||||||
Revenues (including related party revenues of $0, $162,269 and $168,261, for the years ended June 30, 2017, 2016, and 2015, respectively) | $ | 675,352 | $ | 658,198 | $ | 631,010 | |||||
Direct operating expenses (including related party expenses of $142,080, $137,857 and $85,108, for the years ended June 30, 2017, 2016, and 2015, respectively) | 271,751 | 268,024 | 217,233 | ||||||||
Selling, general and administrative expenses (including related party expenses of $21,732, $28,603 and $6,895, for the years ended June 30, 2017, 2016, and 2015, respectively) | 80,041 | 102,005 | 155,003 | ||||||||
Depreciation and amortization | 10,296 | 14,583 | 17,641 | ||||||||
Gain on sale of Fuse (see Note 5) | — | — | (186,178 | ) | |||||||
Operating income | 313,264 | 273,586 | 427,311 | ||||||||
Other income (expense): | |||||||||||
Interest income | 2,782 | 2,368 | 2,068 | ||||||||
Interest expense | (40,108 | ) | (31,683 | ) | (4,040 | ) | |||||
Miscellaneous expense | — | (2 | ) | (4 | ) | ||||||
(37,326 | ) | (29,317 | ) | (1,976 | ) | ||||||
Income from continuing operations before income taxes | 275,938 | 244,269 | 425,335 | ||||||||
Income tax expense | (108,476 | ) | (80,971 | ) | (176,905 | ) | |||||
Income from continuing operations | $ | 167,462 | $ | 163,298 | $ | 248,430 | |||||
Income (loss) from discontinued operations, net of taxes | (120 | ) | (155,664 | ) | 6,271 | ||||||
Net income | $ | 167,342 | $ | 7,634 | $ | 254,701 | |||||
Earnings (loss) per share: | |||||||||||
Basic | |||||||||||
Income from continuing operations | $ | 2.23 | $ | 2.17 | $ | 3.22 | |||||
Income (loss) from discontinued operations | — | (2.07 | ) | 0.08 | |||||||
Net income | 2.22 | 0.10 | 3.30 | ||||||||
Diluted | |||||||||||
Income from continuing operations | $ | 2.22 | $ | 2.16 | $ | 3.20 | |||||
Income (loss) from discontinued operations | — | (2.06 | ) | 0.08 | |||||||
Net income | 2.21 | 0.10 | 3.28 | ||||||||
Weighted-average number of common shares outstanding: | |||||||||||
Basic | 75,213 | 75,152 | 77,138 | ||||||||
Diluted | 75,560 | 75,527 | 77,687 | ||||||||
See accompanying notes to consolidated financial statements.
F-5
MSG NETWORKS INC.
CONSOLIDATED STATEMENTS OF COMPREHENSIVE INCOME
(in thousands)
Years Ended June 30, | ||||||||||||
2017 | 2016 | 2015 | ||||||||||
Net income | $ | 167,342 | $ | 7,634 | $ | 254,701 | ||||||
Other comprehensive income (loss), before income taxes: | ||||||||||||
Pension plans and postretirement plan: | ||||||||||||
Net unamortized gains (losses) arising during the period | $ | 1,144 | $ | (3,910 | ) | $ | (7,174 | ) | ||||
Amounts reclassified from accumulated other comprehensive loss: | ||||||||||||
Amortization of net actuarial loss included in net periodic benefit cost | 724 | 721 | 2,258 | |||||||||
Amortization of net prior service credit included in net periodic benefit cost | (24 | ) | (57 | ) | (112 | ) | ||||||
Settlement gain | (71 | ) | — | — | ||||||||
Other comprehensive income (loss), before income taxes | 1,773 | (3,246 | ) | (5,028 | ) | |||||||
Income tax benefit (expense) related to items of other comprehensive income (loss) | (740 | ) | 823 | 2,167 | ||||||||
Other comprehensive income (loss) | 1,033 | (2,423 | ) | (2,861 | ) | |||||||
Comprehensive income | $ | 168,375 | $ | 5,211 | $ | 251,840 | ||||||
See accompanying notes to consolidated financial statements.
F-6
MSG NETWORKS INC.
CONSOLIDATED STATEMENTS OF CASH FLOWS
(in thousands)
Years Ended June 30, | |||||||||||
2017 | 2016 | 2015 | |||||||||
Cash flows from operating activities from continuing operations: | |||||||||||
Net income | $ | 167,342 | $ | 7,634 | $ | 254,701 | |||||
(Income) loss from discontinued operations, net of taxes | 120 | 155,664 | (6,271 | ) | |||||||
Income from continuing operations | 167,462 | 163,298 | 248,430 | ||||||||
Adjustments to reconcile net income to net cash provided by operating activities from continuing operations: | |||||||||||
Depreciation and amortization | 10,296 | 14,583 | 17,641 | ||||||||
Amortization of deferred financing costs | 3,004 | 3,234 | 1,602 | ||||||||
Share-based compensation expense | 9,931 | 9,266 | 10,211 | ||||||||
Excess tax benefit on share-based awards | — | (4,869 | ) | (10,109 | ) | ||||||
Gain on sale of Fuse, before income taxes | — | — | (186,178 | ) | |||||||
Change in deferred income taxes related to the sale of Fuse | — | — | 6,799 | ||||||||
Provision for doubtful accounts | (242 | ) | 791 | 244 | |||||||
Change in assets and liabilities: | |||||||||||
Accounts receivable, net | (3,361 | ) | (16,608 | ) | (1,682 | ) | |||||
Net related party receivable | (1,661 | ) | 11,832 | (1,159 | ) | ||||||
Prepaid expenses and other assets | 8,015 | 8,403 | (7,474 | ) | |||||||
Accounts payable | (802 | ) | (9,316 | ) | (903 | ) | |||||
Net related party payable, including payable to MSG | (3,154 | ) | 3,796 | 420 | |||||||
Prepaid/payable for income taxes | 16,883 | 27,132 | (26,826 | ) | |||||||
Accrued and other liabilities | (2,694 | ) | (12,261 | ) | (9,056 | ) | |||||
Deferred revenue | (1,072 | ) | 1,172 | 340 | |||||||
Deferred income taxes | (5,447 | ) | (18,605 | ) | (19,649 | ) | |||||
Net cash provided by operating activities from continuing operations | 197,158 | 181,848 | 22,651 | ||||||||
Cash flows from investing activities from continuing operations: | |||||||||||
Capital expenditures | (4,894 | ) | (3,323 | ) | (6,663 | ) | |||||
Proceeds from sale of property and equipment | — | — | 27 | ||||||||
Proceeds from sale of Fuse, net of transaction costs (see Note 5) | — | — | 228,063 | ||||||||
Net cash provided by (used in) investing activities from continuing operations | (4,894 | ) | (3,323 | ) | 221,427 | ||||||
Cash flows from financing activities from continuing operations: | |||||||||||
Proceeds from Term Loan Facility (see Note 8) | — | 1,550,000 | — | ||||||||
Principal repayments on Term Loan Facility (see Note 8) | (167,500 | ) | (61,250 | ) | — | ||||||
Cash distributed with MSG | — | (1,467,093 | ) | — | |||||||
Payments for financing costs | — | (9,860 | ) | (84 | ) | ||||||
Proceeds from stock option exercises | 2 | 1,010 | 518 | ||||||||
Repurchases of common stock | — | (100,027 | ) | (140,717 | ) | ||||||
Taxes paid in lieu of shares issued for equity-based compensation | (2,271 | ) | (11,190 | ) | (18,082 | ) | |||||
Excess tax benefit on share-based awards | — | 4,869 | 10,109 | ||||||||
Net cash used in financing activities from continuing operations | (169,769 | ) | (93,541 | ) | (148,256 | ) | |||||
Net cash provided by continuing operations | 22,495 | 84,984 | 95,822 | ||||||||
Cash flows of discontinued operations | |||||||||||
Net cash provided by (used in) operating activities | (976 | ) | (113,691 | ) | 131,882 | ||||||
Net cash used in investing activities | — | (70,410 | ) | (101,270 | ) | ||||||
Net cash used in financing activities | — | — | — | ||||||||
Net cash provided by (used in) discontinued operations | (976 | ) | (184,101 | ) | 30,612 | ||||||
Net increase (decrease) in cash and cash equivalents | 21,519 | (99,117 | ) | 126,434 | |||||||
Cash and cash equivalents at beginning of period, including cash in both continuing operations and discontinued operations | 119,568 | 218,685 | 92,251 | ||||||||
Cash and cash equivalents at end of period | $ | 141,087 | $ | 119,568 | $ | 218,685 | |||||
See accompanying notes to consolidated financial statements.
F-7
MSG NETWORKS INC.
CONSOLIDATED STATEMENTS OF STOCKHOLDERS' EQUITY (DEFICIENCY)
(in thousands)
Common Stock Issued | Additional Paid-In Capital | Treasury Stock | Retained Earnings (Accumulated Deficit) | Accumulated Other Comprehensive Income (Loss) | Total | ||||||||||||||||||
Balance as of June 30, 2014 | $ | 775 | $ | 1,081,055 | $ | (7,537 | ) | $ | 552,862 | $ | (22,711 | ) | $ | 1,604,444 | |||||||||
Net income | — | — | — | 254,701 | — | 254,701 | |||||||||||||||||
Other comprehensive loss | — | — | — | — | (2,861 | ) | (2,861 | ) | |||||||||||||||
Comprehensive income | 251,840 | ||||||||||||||||||||||
Exercise of stock options | 1 | (648 | ) | 1,138 | — | — | 491 | ||||||||||||||||
Share-based compensation | — | 15,437 | — | — | — | 15,437 | |||||||||||||||||
Tax withholding associated with shares issued for equity-based compensation | — | (18,082 | ) | — | — | — | (18,082 | ) | |||||||||||||||
Shares issued upon distribution of Restricted Stock Units | 3 | (3,869 | ) | 3,866 | — | — | — | ||||||||||||||||
Repurchases of common stock | — | — | (140,717 | ) | — | — | (140,717 | ) | |||||||||||||||
Excess tax benefit on share-based awards | — | 10,109 | — | — | — | 10,109 | |||||||||||||||||
Balance as of June 30, 2015 | $ | 779 | $ | 1,084,002 | $ | (143,250 | ) | $ | 807,563 | $ | (25,572 | ) | $ | 1,723,522 | |||||||||
Net income | — | — | — | 7,634 | — | 7,634 | |||||||||||||||||
Other comprehensive loss | — | — | — | — | (2,423 | ) | (2,423 | ) | |||||||||||||||
Comprehensive income | 5,211 | ||||||||||||||||||||||
Exercise of stock options | — | (4,770 | ) | 10,345 | (4,565 | ) | — | 1,010 | |||||||||||||||
Share-based compensation | — | 10,120 | — | — | — | 10,120 | |||||||||||||||||
Tax withholding associated with shares issued for equity-based compensation | — | (11,190 | ) | — | — | — | (11,190 | ) | |||||||||||||||
Shares issued upon distribution of Restricted Stock Units | — | (18,663 | ) | 25,136 | (6,473 | ) | — | — | |||||||||||||||
Repurchases of common stock | — | — | (100,027 | ) | — | — | (100,027 | ) | |||||||||||||||
Excess tax benefit on share-based awards | — | 8,720 | — | (3,851 | ) | — | 4,869 | ||||||||||||||||
Distribution of The Madison Square Garden Company | — | (1,067,968 | ) | — | (1,705,189 | ) | 20,406 | (2,752,751 | ) | ||||||||||||||
Adjustments related to the transfer of certain liabilities as a result of the Distribution | — | (251 | ) | — | (471 | ) | — | (722 | ) | ||||||||||||||
Balance as of June 30, 2016 | $ | 779 | $ | — | $ | (207,796 | ) | $ | (905,352 | ) | $ | (7,589 | ) | $ | (1,119,958 | ) | |||||||
Net income | — | — | — | 167,342 | — | 167,342 | |||||||||||||||||
Other comprehensive income | — | — | — | — | 1,033 | 1,033 | |||||||||||||||||
Comprehensive income | 168,375 | ||||||||||||||||||||||
Exercise of stock options | — | (57 | ) | 59 | — | — | 2 | ||||||||||||||||
Share-based compensation | — | 9,931 | — | — | — | 9,931 | |||||||||||||||||
Tax withholding associated with shares issued for equity-based compensation | — | (1,921 | ) | (423 | ) | (55 | ) | — | (2,399 | ) | |||||||||||||
Shares issued upon distribution of Restricted Stock Units | — | (1,044 | ) | 9,360 | (8,316 | ) | — | — | |||||||||||||||
Adjustments related to the transfer of certain liabilities as a result of the Distribution | — | — | — | (158 | ) | — | (158 | ) | |||||||||||||||
Balance as of June 30, 2017 | $ | 779 | $ | 6,909 | $ | (198,800 | ) | $ | (746,539 | ) | $ | (6,556 | ) | $ | (944,207 | ) | |||||||
See accompanying notes to consolidated financial statements.
F-8
MSG NETWORKS INC.
NOTES TO CONSOLIDATED FINANCIAL STATEMENTS
All amounts included in the following Notes to Consolidated Financial Statements are presented in thousands, except per share data or as otherwise noted.
Note 1. Description of Business and Basis of Presentation
Description of Business
MSG Networks Inc. (together with its subsidiaries, the “Company”) owns and operates two regional sports and entertainment networks, MSG Network (“MSGN”) and MSG+, collectively the “MSG Networks.”
The Company was incorporated on July 29, 2009 as an indirect, wholly-owned subsidiary of Cablevision Systems Corporation (“Cablevision”). On February 9, 2010, Cablevision spun off the Company and the Company thereby acquired the subsidiaries of Cablevision that owned, directly and indirectly, all of the partnership interests in MSGN Holdings, L.P., formerly MSG Holdings L.P. (“MSGN L.P.”). MSGN L.P. was the indirect, wholly-owned subsidiary of Cablevision through which Cablevision held the Madison Square Garden businesses. MSGN L.P. is now a wholly-owned subsidiary of the Company, through which the Company conducts substantially all of its operations.
On September 30, 2015 (the “Distribution Date”), the Company distributed to its stockholders all of the outstanding common stock of The Madison Square Garden Company (formerly MSG Spinco, Inc., and referred to herein as “MSG”) (the “Distribution”). MSG owns, directly or indirectly, the sports and entertainment businesses previously owned and operated by the Company’s sports and entertainment segments, owns, leases or operates the arenas and other venues previously owned, leased or operated by the Company and owns the joint venture interests previously owned by the Company. In the Distribution, each holder of the Company’s Class A common stock, par value $0.01 per share (“Class A Common Stock”), of record as of the close of business, New York City time, on September 21, 2015 (the “Record Date”), received one share of MSG Class A common stock, par value $0.01 per share, for every three shares of the Company’s Class A Common Stock held on the Record Date. Each holder of the Company’s Class B common stock, par value $0.01 per share (“Class B Common Stock”), of record as of the Record Date received one share of MSG Class B common stock, par value $0.01 per share, for every three shares of the Company's Class B Common Stock held on the Record Date. Following the Distribution, the Company no longer consolidates the financial results of MSG for purposes of its own financial reporting and the historical financial results of MSG have been reflected in the Company's consolidated financial statements as discontinued operations for all periods presented through the Distribution Date. All assets and liabilities related to discontinued operations are excluded from the footnotes unless otherwise noted.
Following the Distribution, the Company operates and reports financial information in one segment. Substantially all revenues and assets of the Company are attributed to or located in the United States and are primarily concentrated in the New York City metropolitan area.
F-9
Note 2. Summary of Significant Accounting Policies
Principles of Consolidation
The consolidated financial statements of the Company include the accounts of MSG Networks Inc. and its subsidiaries. All significant intercompany transactions and balances have been eliminated in consolidation. See Note 3 for a discussion of rights fees prior to the Distribution Date recognized as revenues by MSG from the licensing of team-related programming to the Company.
Use of Estimates
The preparation of the accompanying consolidated financial statements in conformity with generally accepted accounting principles (“GAAP”) requires management to make estimates and assumptions about future events. These estimates and the underlying assumptions affect the amount of assets and liabilities reported, disclosures about contingent assets and liabilities, and reported amount of revenues and expenses. Such estimates include the valuation of accounts receivable, goodwill, intangible assets, other long-lived assets, tax accruals and other liabilities. In addition, estimates are used in revenue recognition, income tax expense, performance and share-based compensation, depreciation and amortization, litigation matters and other matters. Management believes its use of estimates in the consolidated financial statements to be reasonable.
Management evaluates its estimates on an ongoing basis using historical experience and other factors, including the general economic environment and actions it may take in the future. The Company adjusts such estimates when facts and circumstances dictate. However, these estimates may involve significant uncertainties and judgments and cannot be determined with precision. In addition, these estimates are based on management's best judgment at a point in time and as such, these estimates may ultimately differ from actual results. Changes in estimates resulting from weakness in the economic environment or other factors beyond the Company's control could be material and would be reflected in the Company's financial statements in future periods.
Revenue Recognition
The Company recognizes revenue when the following conditions are satisfied: (a) persuasive evidence of a sales arrangement exists, (b) delivery occurs or services are rendered, (c) the sales price is fixed or determinable and (d) collectability is reasonably assured.
The Company earns affiliation fee revenue from the cable, satellite, telephone and other platforms that carry our programming networks. The Company's programming networks are delivered throughout the term of the agreements and the Company recognizes this revenue in the period that the programming network is provided.
The Company also earns advertising revenue, which is typically recognized when the advertisements are aired. In certain advertising sales arrangements, the Company guarantees specified viewer ratings for its programming. For these types of transactions, a portion of such revenue is deferred if the guaranteed viewer ratings are not met and is subsequently recognized either when the Company provides the required additional advertising time, the guarantee obligation contractually expires or additional performance requirements become remote.
Gross versus Net Revenue Recognition
The Company reports revenue on a gross or net basis based on management's assessment of whether the Company acts as a principal or agent in the transaction. To the extent the Company acts as the principal, revenue is reported on a gross basis. The determination of whether the Company acts as a principal or an agent in a transaction is based on an evaluation of several qualitative factors. When the Company acts as an agent, revenue is reported on a net basis. The Company has an advertising sales representation agreement with MSG that provides for MSG to act as our advertising sales representative and includes the exclusive right and obligation to sell certain advertising availabilities on our behalf for a commission. Generally, the Company reports advertising revenue on a gross basis.
Nonmonetary Transactions
The Company enters into nonmonetary transactions that involve the exchange of goods or services, such as advertising and promotional benefits, for other goods or services. Such transactions are measured and recorded at the fair value of the goods or services surrendered unless the goods or services received have a more readily determinable fair value. In addition, the Company enters into other monetary transactions in which nonmonetary consideration is also included and the entire transaction is recorded at fair value. If the fair values cannot be determined for either the asset(s) surrendered or received within
F-10
reasonable limits, then the nonmonetary transaction is measured and recorded at the book value of the item(s) surrendered which typically is zero.
Direct Operating Expenses
Direct operating expenses primarily represent media rights fees, and other programming and production costs, such as the salaries of our on-air personalities, producers, directors, technicians, writers and other creative staff, as well as expenses associated with location costs, remote facilities and maintaining studios, origination, and transmission facilities.
The professional team media rights acquired under media rights agreements to telecast various sporting events and other programming for exhibition on our networks are typically expensed on a straight-line basis over the term of the applicable contract or license period.
Advertising Expenses
Advertising costs are typically charged to expense when incurred. Total advertising costs classified in selling, general and administrative expenses were $11,765, $10,540, and $11,010 for the years ended June 30, 2017, 2016 and 2015, respectively.
Income Taxes
The Company's provision for income taxes is based on current period income, changes in deferred tax assets and liabilities and changes in estimates with regard to uncertain tax positions. Deferred tax assets are subject to an ongoing assessment of realizability. In assessing the realizability of deferred tax assets, management considers whether it is more likely than not that some portion or all of the deferred tax asset will not be realized. The Company's ability to realize its deferred tax assets depends upon the generation of sufficient future taxable income to allow for the realization of its deductible temporary differences. If such estimates and related assumptions change in the future, the Company may be required to record valuation allowances against its deferred tax assets, resulting in additional income tax expense in the Company's consolidated statements of operations. The Company measures its deferred tax liability with regard to MSGN L.P. based on the difference between the tax basis and the carrying amount for financial reporting purposes; this is commonly referred to as the outside basis difference. Interest and penalties, if any, associated with uncertain tax positions are included in income tax expense. The Company accounts for investment tax credits using the “flow-through” method, under which the tax benefit generated from an investment tax credit is recorded in the period the credit is generated.
Share-based Compensation
The Company measures the cost of employee services received in exchange for an award of equity-based instruments based on the grant date fair value of the award. Share-based compensation cost is recognized in earnings over the period during which an employee is required to provide service in exchange for the award, except for restricted stock units (“RSUs”) granted to non-employee directors which, unless otherwise provided under the applicable award agreement, are fully vested, and are expensed at the grant date. The Company has elected to recognize share-based compensation cost for graded vesting awards with only service conditions on a straight-line basis over the requisite service period for the entire award. Effective for the first quarter of fiscal year 2017, the Company has also elected to account for forfeitures as they occur. See below for “Recently Adopted Accounting Pronouncements.”
Cash and Cash Equivalents
The Company considers the balance of its investment in funds that substantially hold highly liquid securities that mature within three months or less from the date the fund purchases these securities to be cash equivalents. The carrying amount of cash and cash equivalents either approximates fair value due to the short-term maturity of these instruments or are at fair value. Checks outstanding in excess of related book balances are included in accounts payable in the accompanying consolidated balance sheets. The Company presents the change in these book cash overdrafts as cash flows from operating activities.
Accounts Receivable
Accounts receivable is recorded at net realizable value. The Company maintains an allowance for doubtful accounts to reserve for potentially uncollectible receivables. The allowance for doubtful accounts is estimated based on the Company's analysis of receivables aging, specific identification of certain receivables that are at risk of not being paid, past collection experience and other factors. The Company's allowance for doubtful accounts was $594 and $838 as of June 30, 2017 and 2016, respectively.
F-11
Long-Lived and Indefinite-Lived Assets
The Company's long-lived and indefinite-lived assets consist of goodwill, amortizable intangible assets, and property and equipment.
Goodwill has an indefinite useful life and is not amortized. Identifiable intangible assets with finite useful lives are amortized on a straight-line basis over their respective estimated useful lives.
Property and equipment is stated at cost. Depreciation is calculated on a straight-line basis over the estimated useful lives of the assets or, with respect to leasehold improvements, amortized over the shorter of the lease term or the asset's estimated useful life. The useful lives of the Company's long-lived assets are based on estimates of the period over which the Company expects the assets to be of economic benefit to the Company. In estimating the useful lives the Company considers factors such as, but not limited to, risk of obsolescence, anticipated use, plans of the Company, and applicable laws and permit requirements.
Impairment of Long-Lived and Indefinite-Lived Assets
In assessing the recoverability of the Company's long-lived and indefinite-lived assets, the Company must make estimates and assumptions regarding future cash flows and other factors to determine the fair value of the respective assets. These estimates and assumptions could have a significant impact on whether an impairment charge is recognized and also the magnitude of any such charge. Fair value estimates are made at a specific point in time, based on relevant information. These estimates are subjective in nature and involve significant uncertainties and judgments and therefore cannot be determined with precision. Changes in assumptions could significantly affect the estimates. If these estimates or material related assumptions change in the future, the Company may be required to record impairment charges related to its long-lived and/or indefinite-lived assets.
Goodwill is tested annually for impairment as of August 31st and at any time upon the occurrence of certain events or substantive changes in circumstances. The Company has the option to perform a qualitative assessment to determine if an impairment is more likely than not to have occurred. If the Company can support the conclusion that it is not more likely than not that the fair value of a reporting unit is less than its carrying amount, the Company would not need to perform the two-step impairment test for that reporting unit. If the Company cannot support such a conclusion or the Company does not elect to perform the qualitative assessment then the first step of the goodwill impairment test is used to identify potential impairment by comparing the fair value of a reporting unit with its carrying amount, including goodwill. If the carrying amount of a reporting unit exceeds its fair value, the second step of the goodwill impairment test is performed to measure the amount of impairment loss, if any. The second step of the goodwill impairment test compares the implied fair value of the reporting unit's goodwill with the carrying amount of that goodwill. If the carrying amount of the reporting unit's goodwill exceeds the implied fair value of that goodwill, an impairment loss is recognized in an amount equal to that excess. The implied fair value of goodwill is determined in the same manner as the amount of goodwill that would be recognized in a business combination. The Company has one reporting unit for evaluating goodwill impairment.
For other long-lived assets, including intangible assets that are amortized, the Company evaluates assets for recoverability when there is an indication of potential impairment. If the undiscounted cash flows from a group of assets being evaluated is less than the carrying value of that group of assets, the fair value of the asset group is determined and the carrying value of the asset group is written down to fair value.
Contingencies
Liabilities for loss contingencies arising from claims, assessments, litigation, fines and penalties and other sources are recorded when it is probable that a liability has been incurred and the amount of the assessment can be reasonably estimated.
Defined Benefit Pension Plans and Other Postretirement Benefit Plan
As more fully described in Note 13, the Company has both funded and unfunded defined benefit plans, as well as a contributory other postretirement benefit plan, covering certain full-time employees and retirees. The expense recognized by the Company is determined using certain assumptions, including the expected long-term rate of return, discount rate and rate of compensation increases, among others. The Company recognizes the funded status of its defined benefit pension and other postretirement plans (other than multiemployer plans) as an asset or liability in the consolidated balance sheets and recognizes changes in the funded status in the year in which the changes occur through other comprehensive income (loss).
F-12
Earnings (Loss) Per Common Share
Basic earnings (loss) per common share (“EPS”) is based upon net income (loss) available to common stockholders divided by the weighted-average number of common shares outstanding during the period. Diluted EPS reflects the effect of the assumed vesting of RSUs and exercise of stock options (see Note 14) only in the periods in which such effect would have been dilutive.
Recently Adopted Accounting Pronouncements
In April 2015, the Financial Accounting Standards Board (“FASB”) issued Accounting Standards Update (“ASU”) No. 2015-05, Intangibles-Goodwill and Other-Internal-Use Software (Subtopic 350-40): Customer’s Accounting for Fees Paid in a Cloud Computing Arrangement, which provides guidance to customers about whether a cloud computing arrangement includes a software license. If a cloud computing arrangement includes a software license, the customer should account for the software license element of the arrangement consistent with the acquisition of other software licenses. If a cloud computing arrangement does not include a software license, the customer should account for the arrangement as a service contract and expense the cost as the services are received. This standard was adopted by the Company in the first quarter of fiscal year 2017 and will be applied prospectively to all arrangements entered into or materially modified after the effective date. There was no impact to the financial statements as a result of this adoption.
In March 2016, the FASB issued ASU No. 2016-09, Compensation — Stock Compensation (Topic 718): Improvements to Employee Share-Based Payment Accounting, which changes several aspects of accounting for share-based payment transactions. This standard was early adopted by the Company in the first quarter of fiscal year 2017. The adoption of this standard resulted in: (i) all excess tax benefits and tax deficiencies being recognized in the income statement, rather than additional paid-in capital, on a prospective basis (ii) excess tax benefits or tax deficiencies no longer being classified on the Consolidated Statement of Cash Flows as a financing activity, on a prospective basis (as such prior period amounts have not been adjusted) and (iii) the Company’s election to account for forfeitures as they occur, rather than estimate expected forfeitures over the course of a vesting period, on a modified retrospective basis. There was no material impact to the financial statements as a result of this adoption.
Recently Issued Accounting Pronouncements Not Yet Adopted
In May 2014, the FASB issued ASU No. 2014-09, Revenue from Contracts with Customers (Topic 606), which supersedes the revenue recognition requirements in FASB Accounting Standards Codification (“ASC”) Topic 605, Revenue Recognition. This ASU is based on the principle that revenue is recognized to depict the transfer of goods or services to customers in an amount that reflects the consideration to which the entity expects to be entitled in exchange for those goods or services. The ASU also requires additional disclosure about the nature, amount, timing and uncertainty of revenue and cash flows arising from customer contracts, including significant judgments and changes in judgments and assets recognized from costs incurred to obtain or fulfill a contract. In August 2015, the FASB issued ASU No. 2015-14, Revenue from Contracts with Customers (Topic 606): Deferral of the Effective Date, which defers the effective date of ASU No. 2014-09 for all entities by one year. In March 2016, the FASB issued ASU No. 2016-08, Revenue from Contracts with Customers (Topic 606): Principal versus Agent Considerations, which provides clarification on the implementation guidance on principal versus agent considerations outlined in ASU No. 2014-09. In April 2016, the FASB issued ASU No. 2016-10, Revenue from Contracts with Customers (Topic 606): Identifying Performance Obligations and Licensing, which finalized amendments to identifying performance obligations and accounting for licenses of intellectual property. In May 2016, the FASB issued ASU No. 2016-12, Revenue from Contracts with Customers (Topic 606): Narrow-Scope Improvements and Practical Expedients, which clarifies assessing collectibility, noncash consideration, presentation of sales taxes, completed contracts and contract modifications at transition. This standard will be effective for the Company beginning in the first quarter of fiscal year 2019 using one of two retrospective application methods. The Company is currently evaluating the impact this standard will have on its consolidated financial statements.
In February 2016, the FASB issued ASU No. 2016-02, Leases (Topic 842), which requires the recognition of lease assets and lease liabilities on the balance sheet for those leases classified as operating leases under previous GAAP. The amended guidance also requires additional quantitative and qualitative disclosures regarding the amount, timing and uncertainty of cash flows arising from leases in order to provide additional information about the nature of an organization’s leasing activities. This standard will be effective for the Company beginning in the first quarter of fiscal year 2020, with early adoption permitted. This standard will be adopted using a modified retrospective approach. The Company is currently evaluating the impact this standard will have on its consolidated financial statements.
In August 2016, the FASB issued ASU No. 2016-15, Statement of Cash Flows (Topic 230): Classification of Certain Cash Receipts and Cash Payments, which amends ASC Topic 230, Statement of Cash Flows, to eliminate the diversity in practice
F-13
related to the classification of certain cash receipts and payments in the statement of cash flows by adding or clarifying guidance on eight specific cash flow issues. This standard will be effective for the Company beginning in the first quarter of fiscal year 2019, with early adoption permitted and the retrospective approach required. The adoption of this guidance is not expected to have a material impact on the Company’s consolidated financial statements.
In January 2017, the FASB issued ASU No. 2017-01, Business Combinations (Topic 805): Clarifying the Definition of a Business, which clarifies the definition of a business with the objective of adding guidance to assist entities with evaluating whether transactions should be accounted for as acquisitions (or disposals) of assets or businesses, which will effect various areas of accounting including, but not limited to, goodwill and consolidation. This standard will be effective for the Company beginning in the first quarter of fiscal year 2019, with early adoption permitted. The standard is to be applied prospectively. The adoption of this guidance is not expected to have a material impact on the Company's consolidated financial statements.
In January 2017, the FASB issued ASU No. 2017-04, Intangibles — Goodwill and Other (Topic 350): Simplifying the Test for Goodwill Impairment, which simplifies the measurement of goodwill impairment by eliminating the requirement of performing a hypothetical purchase price allocation. Instead, impairment will be measured using the difference between the carrying amount and fair value of the reporting unit. The amended guidance also eliminates the requirement for any reporting unit with a zero or a negative carrying amount to perform a qualitative assessment and will require disclosure of the amount of goodwill allocated to each reporting unit with a zero or a negative carrying amount of net assets. This standard will be effective for the Company beginning in the first quarter of fiscal year 2021. Early adoption is permitted for interim or annual goodwill impairment tests performed on testing dates after January 1, 2017. The standard is to be applied prospectively. Based on the Company's most recent annual goodwill impairment test completed in fiscal year 2017, the adoption of this guidance is not expected to have any initial impact on the Company's consolidated financial statements.
In March 2017, the FASB issued ASU No. 2017-07, Compensation — Retirement Benefits (Topic 715): Improving the Presentation of Net Periodic Pension Cost and Net Periodic Postretirement Benefit Cost, which requires: (i) presentation of the service cost component of net periodic benefit cost within the same line item as other compensation costs arising from services rendered by relevant employees during the period, and (ii) the non-service cost components of net periodic benefit cost to be presented separately in the income statement from the service cost component and not be included in the subtotal for operating income. In addition, only the service cost component is eligible to be capitalized into an asset. This standard will be effective for the Company beginning in the first quarter of fiscal year 2019, with early adoption permitted at the beginning of an annual period for which financial statements have not been issued. The standard is to be applied retrospectively, except for the change to the capitalization guidelines, which is to be applied prospectively. Although the Company does not expect the standard to have an impact on its consolidated net income, the Company’s net periodic benefit cost for fiscal year 2017 includes approximately $1,600 of expense that will be reclassified from operating income to a line item below operating income upon adoption.
In May 2017, the FASB issued ASU No. 2017-09, Compensation — Stock Compensation (Topic 718): Scope of Modification Accounting, which provides guidance about which changes to the terms or conditions of a share-based payment award require an entity to apply modification accounting. An entity should account for the effects of a modification unless all of the following characteristics of the modified award are the same as the original award immediately before the original award is modified: (i) the award’s fair value, (ii) the award’s vesting condition, and (iii) the award’s classification as an equity or liability instrument. This standard will be effective for the Company beginning in the first quarter of fiscal year 2019, with early adoption permitted. The standard is to be applied prospectively to an award modified on or after the adoption date. The adoption of this guidance is not expected to have a material impact on the Company's consolidated financial statements.
F-14
Note 3. Discontinued Operations
As a result of the Distribution, the results of the Company’s MSG operations through the Distribution Date, as well as transaction costs related to the Distribution, have been classified in the consolidated statements of operations as discontinued operations for all periods presented. No gain or loss was recognized in connection with the Distribution. Operating results of discontinued operations for the years ended June 30, 2017, 2016 and 2015 are summarized below:
Years Ended June 30, | ||||||||||||
2017 | 2016 | 2015 | ||||||||||
Revenues (a) | $ | — | $ | 150,381 | $ | 1,071,551 | ||||||
Direct operating expenses | — | 71,320 | 725,172 | |||||||||
Selling, general and administrative expenses | 120 | 58,283 | 183,226 | |||||||||
Depreciation and amortization | — | 23,772 | 103,481 | |||||||||
Operating income (loss) | (120 | ) | (2,994 | ) | 59,672 | |||||||
Equity in earnings (loss) of equity-method investments | — | 2,679 | (40,590 | ) | ||||||||
Interest income | — | 635 | 1,886 | |||||||||
Interest expense | — | (540 | ) | (2,467 | ) | |||||||
Miscellaneous income | — | — | 2,802 | |||||||||
Income (loss) from discontinued operations before income taxes | (120 | ) | (220 | ) | 21,303 | |||||||
Income tax expense | — | (155,444 | ) | (15,032 | ) | |||||||
Income (loss) from discontinued operations, net of taxes | $ | (120 | ) | $ | (155,664 | ) | $ | 6,271 | ||||
(a) | Includes rights fees for New York Knicks (“Knicks”) and New York Rangers (“Rangers”) programming prior to the Distribution Date, which were previously eliminated in consolidation. However, the pre-Distribution Date amounts are now presented as revenues in the loss from discontinued operations line with the offsetting expense in direct operating expenses, within continuing operations, in the accompanying consolidated statements of operations for the years ended June 30, 2016 and 2015. |
Prior to the Distribution, the Company's collections for ticket sales, sponsorships and suite rentals in advance were recorded as deferred revenue and were recognized as revenues when earned for both accounting and tax purposes. In connection with the reorganization transactions related to the Distribution, the tax recognition on most of these deferred revenues was accelerated to the date of the reorganization. The impact of the acceleration of such deferred revenue is reflected in income tax expense of discontinued operations for the year ended June 30, 2016.
Amounts for the year ended June 30, 2015 presented above differ from historically reported results for the Company's sports and entertainment segments due to certain reclassifications and adjustments made to corporate overhead costs for purposes of discontinued operations reporting.
The net impact of the Distribution to the Company's stockholders' equity (deficiency) includes cash distributed with MSG of $1,467,093.
Note 4. Computation of Earnings (Loss) per Common Share
The following table presents a reconciliation of the weighted-average number of shares used in the calculations of basic and diluted EPS:
Years Ended June 30, | ||||||||
2017 | 2016 | 2015 | ||||||
Weighted-average number of shares for basic EPS | 75,213 | 75,152 | 77,138 | |||||
Dilutive effect of shares issuable under share-based compensation plans | 347 | 375 | 549 | |||||
Weighted-average number of shares for diluted EPS | 75,560 | 75,527 | 77,687 | |||||
Anti-dilutive shares | 162 | — | 4 | |||||
F-15
Note 5. Disposition
On July 1, 2014, the Company completed its sale of Fuse, a national music television network, to Fuse Media, Inc. for a cash purchase price of $231,995 and a 15% equity interest of approximately $24,000 in Fuse Media, LLC (“Fuse Media”). The Company recorded a pre-tax gain on the sale of Fuse, which is reflected in operating income in the accompanying consolidated statement of operations for the year ended June 30, 2015, of $186,178 (net of transaction costs of $3,932).
The equity interest in Fuse Media was transferred to MSG in connection with the Distribution.
Note 6. Goodwill and Intangible Assets
During the first quarter of fiscal year 2017, the Company performed its annual impairment test of goodwill, and there was no impairment of goodwill identified.
The Company's intangible assets subject to amortization are as follows:
June 30, 2017 | June 30, 2016 | |||||||
Affiliate relationships | $ | 83,044 | $ | 83,044 | ||||
Less accumulated amortization | (42,381 | ) | (38,921 | ) | ||||
$ | 40,663 | $ | 44,123 | |||||
Affiliate relationships have an estimated useful life of 24 years. Amortization expense for intangible assets for continuing operations was $3,460 for the years ended June 30, 2017, 2016 and 2015.
The Company expects its aggregate annual amortization expense for existing intangible assets subject to amortization for each fiscal year from 2018 through 2022 to be as follows:
Fiscal year ending June 30, 2018 | $ | 3,460 | |
Fiscal year ending June 30, 2019 | 3,460 | ||
Fiscal year ending June 30, 2020 | 3,460 | ||
Fiscal year ending June 30, 2021 | 3,460 | ||
Fiscal year ending June 30, 2022 | 3,460 | ||
Note 7. Property and Equipment
As of June 30, 2017 and 2016, property and equipment consisted of the following assets:
June 30, | Estimated | ||||||||
2017 | 2016 | Useful Lives | |||||||
Equipment | $ | 40,918 | $ | 44,508 | 2 to 10 years | ||||
Furniture and fixtures | 1,695 | 1,744 | 5 to 8 years | ||||||
Leasehold improvements | 19,285 | 19,561 | Shorter of term of lease or life of improvement | ||||||
Construction in progress | 565 | 966 | |||||||
62,463 | 66,779 | ||||||||
Less accumulated depreciation and amortization | (50,635 | ) | (52,625 | ) | |||||
$ | 11,828 | $ | 14,154 | ||||||
Depreciation and amortization expense on property and equipment for continuing operations was $6,836, $11,123, and $14,181 for the years ended June 30, 2017, 2016 and 2015, respectively, which for the first quarter of fiscal year 2016 and fiscal year 2015 included depreciation expense on certain corporate property and equipment that was transferred to MSG in connection with the Distribution, but which did not qualify for discontinued operations reporting.
F-16
Note 8. Debt
Former Revolving Credit Facility
On May 6, 2014, MSGN L.P. and certain of its subsidiaries entered into a credit agreement with a syndicate of lenders providing for a senior secured revolving credit facility of $500,000 with a term of five years (the “Former Revolving Credit Facility”). In connection with the Distribution, MSGN L.P. terminated the Former Revolving Credit Facility effective on September 28, 2015.
Senior Secured Credit Facilities
On September 28, 2015, MSGN L.P., MSGN Eden, LLC, an indirect subsidiary of the Company and the general partner of MSGN L.P., Regional MSGN Holdings LLC, a direct subsidiary of the Company and the limited partner of MSGN L.P. (collectively with MSGN Eden, LLC, the “Holdings Entities”), and certain subsidiaries of MSGN L.P. entered into a credit agreement (the “Credit Agreement”) with a syndicate of lenders.
The Credit Agreement provides MSGN L.P. with senior secured credit facilities (the “Senior Secured Credit Facilities”) consisting of: (a) an initial $1,550,000 term loan facility (the “Term Loan Facility”) and (b) a $250,000 revolving credit facility (the “Revolving Credit Facility”), each with a term of five years. In connection with the Distribution, $1,450,000 of the proceeds from the Term Loan Facility was contributed to MSG immediately following the closing of the Senior Secured Credit Facilities. Up to $35,000 of the Revolving Credit Facility is available for the issuance of letters of credit.
Subject to the satisfaction of certain conditions and limitations, the Credit Agreement allows for the addition of incremental term and/or revolving loan commitments and incremental term and/or revolving loans. Borrowings under the Credit Agreement bear interest at a floating rate, which at the option of MSGN L.P. may be either (a) base rate, representing the higher of: (i) the New York Fed Bank Rate plus 0.50%; (ii) the U.S. Prime Rate; or (iii) the one-month London Interbank Offered Rate, or LIBOR, plus 1.00% (the “Base Rate”), plus an additional rate ranging from 0.50% to 1.25% per annum (determined based on a total leverage ratio), or (b) a Eurodollar rate (the “Eurodollar Rate”) plus an additional rate ranging from 1.50% to 2.25% per annum (determined based on a total leverage ratio), provided that for the period until the delivery of the compliance certificate for the period ending March 31, 2016, the additional rate used in calculating both floating rates was (i) 1.00% per annum for borrowings bearing interest at the Base Rate, and (ii) 2.00% per annum for borrowings bearing interest at the Eurodollar Rate. Upon a payment default in respect of principal, interest or other amounts due and payable under the Credit Agreement or related loan documents, default interest will accrue on all overdue amounts at an additional rate of 2.00% per annum. The Credit Agreement requires MSGN L.P. pay a commitment fee of 0.30% in respect of the average daily unused commitments, as well as fronting fees, to banks that issue letters of credit pursuant to the Revolving Credit Facility.
The Credit Agreement generally requires the Holding Entities and MSGN L.P. and its restricted subsidiaries on a consolidated basis to comply with a maximum total leverage ratio of 6.00:1.00 from the closing date until September 30, 2016 and a maximum total leverage ratio of 5.50:1.00 from and after October 1, 2016 until maturity, subject, in each case, to upward adjustment during the continuance of certain events. In addition, there is a minimum interest coverage ratio of 2.00:1.00 for the Holdings Entities and MSGN L.P. and its restricted subsidiaries on a consolidated basis. As of June 30, 2017, the Holding Entities and MSGN L.P. and its restricted subsidiaries on a consolidated basis were in compliance with the financial covenants of the Credit Agreement. All borrowings under the Credit Agreement are subject to the satisfaction of customary conditions, including absence of a default and accuracy of representations and warranties. As of June 30, 2017, there were no letters of credit issued and outstanding under the Revolving Credit Facility, which provides full borrowing capacity of $250,000. The Company has made principal payments aggregating $228,750 through June 30, 2017, including voluntary payments aggregating $100,000 made in fiscal year 2017. The Term Loan Facility amortizes quarterly in accordance with its terms through June 30, 2020 with a final maturity date on September 28, 2020.
F-17
As of June 30, 2017, the principal repayments required under the Term Loan Facility are as follows:
Fiscal year ending June 30, 2018 | $ | 75,000 | ||
Fiscal year ending June 30, 2019 | 75,000 | |||
Fiscal year ending June 30, 2020 | 114,375 | |||
Fiscal year ending June 30, 2021 | 1,056,875 | |||
$ | 1,321,250 | |||
All obligations under the Credit Agreement are guaranteed by the Holdings Entities and MSGN L.P.'s existing and future direct and indirect domestic subsidiaries that are not designated as excluded subsidiaries or unrestricted subsidiaries (the “Subsidiary Guarantors,” and together with the Holdings Entities, the “Guarantors”). All obligations under the Credit Agreement, including the guarantees of those obligations, are secured by certain assets of MSGN L.P. and each Guarantor (collectively, “Collateral”), including, but not limited to, a pledge of the equity interests in MSGN L.P. held directly by the Holdings Entities and the equity interests in each Subsidiary Guarantor held directly or indirectly by MSGN L.P. Subject to customary notice and minimum amount conditions, MSGN L.P. may voluntarily prepay outstanding loans under the Credit Agreement at any time, in whole or in part, without premium or penalty (except for customary breakage costs with respect to Eurodollar loans). MSGN L.P. is required to make mandatory prepayments in certain circumstances, including without limitation from the net cash proceeds of certain sales of assets (including Collateral) or casualty insurance and/or condemnation recoveries (subject to certain reinvestment, repair or replacement rights) and the incurrence of certain indebtedness, subject to certain exceptions.
In addition to the financial covenants discussed above, the Credit Agreement and the related security agreement contain certain customary representations and warranties, affirmative covenants and events of default. The Credit Agreement contains certain restrictions on the ability of the Holding Entities and MSGN L.P. and its restricted subsidiaries to take certain actions as provided in (and subject to various exceptions and baskets set forth in) the Credit Agreement, including the following: (i) incurring additional indebtedness and contingent liabilities; (ii) creating liens on certain assets; (iii) making investments, loans or advances in or to other persons; (iv) paying dividends and distributions or repurchasing capital stock; (v) changing their lines of business; (vi) engaging in certain transactions with affiliates; (vii) amending specified material agreements; (viii) merging or consolidating; (ix) making certain dispositions; and (x) entering into agreements that restrict the granting of liens. The Holdings Entities are also subject to customary passive holding company covenants.
The Company is amortizing its deferred financing costs on a straight-line basis over the five-year term of the Senior Secured Credit Facilities which approximates the effective interest method. The following table summarizes the presentation of the Term Loan Facility and the related deferred financing costs in the accompanying consolidated balance sheets as of June 30, 2017 and June 30, 2016:
Term Loan Facility | Deferred Financing Costs | Net | ||||||||||
June 30, 2017 | ||||||||||||
Current portion of long-term debt | $ | 75,000 | $ | (2,586 | ) | $ | 72,414 | |||||
Long-term debt, net of current portion | 1,246,250 | (5,819 | ) | 1,240,431 | ||||||||
Total | $ | 1,321,250 | $ | (8,405 | ) | $ | 1,312,845 | |||||
June 30, 2016 | ||||||||||||
Current portion of long-term debt | $ | 67,500 | $ | (2,586 | ) | $ | 64,914 | |||||
Long-term debt, net of current portion | 1,421,250 | (8,405 | ) | 1,412,845 | ||||||||
Total | $ | 1,488,750 | $ | (10,991 | ) | $ | 1,477,759 | |||||
F-18
In addition, the Company has deferred financing costs related to the Revolving Credit Facility recorded in the accompanying consolidated balance sheets as summarized in the following table:
June 30, 2017 | June 30, 2016 | |||||||
Other current assets | $ | 417 | $ | 417 | ||||
Other assets | 938 | 1,356 | ||||||
The Company made interest payments under the Credit Agreement of $37,005 and $27,691 during the years ended June 30, 2017 and 2016, respectively.
Note 9. Operating Leases
The Company has various long-term noncancelable operating lease agreements, primarily for office and studio space expiring at various dates through 2024. The rent expense associated with such operating leases is recognized on a straight-line basis over the initial lease term. The difference between rent expense and rent paid is recorded as deferred rent. Rent expense under these lease agreements totaled $7,184, $10,393, and $15,177 for the years ended June 30, 2017, 2016 and 2015, respectively, which for the first quarter of fiscal year 2016 and for fiscal year 2015 included rent expense on certain operating leases that were transferred to MSG in connection with the Distribution, but which did not qualify for discontinued operations reporting.
As of June 30, 2017, future minimum rental payments under leases having noncancelable initial lease terms in excess of one year are as follows:
Fiscal year ending June 30, 2018 | $ | 5,841 | |
Fiscal year ending June 30, 2019 | 5,841 | ||
Fiscal year ending June 30, 2020 | 5,681 | ||
Fiscal year ending June 30, 2021 | 4,272 | ||
Fiscal year ending June 30, 2022 | 3,630 | ||
Thereafter | 6,087 | ||
$ | 31,352 | ||
During the years ended June 30, 2017, 2016 and 2015, the Company recorded income of $2,531, $2,638 and $2,607, respectively, related to the use of certain space of the Company by third parties.
Note 10. Commitments and Contingencies
As of June 30, 2017, future cash payments required under contracts entered into by the Company in the normal course of business are as follows:
Fiscal year ending June 30, 2018 | $ | 243,617 | |
Fiscal year ending June 30, 2019 | 245,964 | ||
Fiscal year ending June 30, 2020 | 249,790 | ||
Fiscal year ending June 30, 2021 | 254,729 | ||
Fiscal year ending June 30, 2022 | 248,400 | ||
Thereafter | 3,338,635 | ||
$ | 4,581,135 | ||
Contractual obligations above consist primarily of the Company's obligations under media rights agreements.
In addition, see Note 8 for the principal repayments required under the Company's Term Loan Facility.
F-19
Note 11. Legal Matters
The Company is a defendant in various lawsuits. Although the outcome of these matters cannot be predicted with certainty, management does not believe that resolution of these lawsuits will have a material adverse effect on the Company.
Note 12. Fair Value Measurements
The fair value hierarchy is based on inputs to valuation techniques that are used to measure fair value that are either observable or unobservable. Observable inputs are developed using market data, such as publicly available information about actual events or transactions, and reflect the assumptions that market participants would use when pricing the asset or liability. Unobservable inputs are inputs for which market data is not available and that are developed using the best information available about the assumptions that market participants would use when pricing the asset or liability. The fair value hierarchy consists of the following three levels:
• | Level I — Quoted prices for identical instruments in active markets. |
• | Level II — Quoted prices for similar instruments in active markets; quoted prices for identical or similar instruments in markets that are not active; and model-derived valuations whose inputs are observable or whose significant value drivers are observable. |
• | Level III — Instruments whose significant value drivers are unobservable. |
The following table presents for each of these hierarchy levels, the Company's assets that are measured at fair value on a recurring basis, which include cash equivalents:
Level I | Level II | Level III | Total | ||||||||||||
June 30, 2017 | |||||||||||||||
Assets: | |||||||||||||||
Money market accounts | $ | 34,128 | $ | — | $ | — | $ | 34,128 | |||||||
Time deposits | 106,482 | — | — | 106,482 | |||||||||||
Total assets measured at fair value | $ | 140,610 | $ | — | $ | — | $ | 140,610 | |||||||
June 30, 2016 | |||||||||||||||
Assets: | |||||||||||||||
Money market accounts | $ | 68,591 | $ | — | $ | — | $ | 68,591 | |||||||
Time deposits | 50,977 | — | — | 50,977 | |||||||||||
Total assets measured at fair value | $ | 119,568 | $ | — | $ | — | $ | 119,568 | |||||||
Money market accounts and time deposits are classified within Level I of the fair value hierarchy as they are valued using observable inputs that reflect quoted prices for identical assets in active markets. The carrying amount of the Company's money market accounts and time deposits approximates fair value due to their short-term maturities.
Other Financial Instruments
The fair value of the Company's long-term debt (see Note 8) was approximately $1,315,000 as of June 30, 2017. The Company's long-term debt is classified within Level II of the fair value hierarchy as it is valued using quoted prices of such securities for which fair value can be derived from inputs that are readily observable.
Note 13. Pension Plans and Other Postretirement Benefit Plan
Company Sponsored Plans
Prior to the Distribution, the Company sponsored a non-contributory qualified cash balance retirement plan covering its non-union employees (the “MSG Cash Balance Pension Plan”) and a non-contributory qualified defined benefit pension plan covering certain of its union employees (the “MSG Union Plan”). Since March 1, 2011, the MSG Cash Balance Pension Plan has also included the assets and liabilities of a frozen (as of December 31, 2007) non-contributory qualified defined pension plan covering non-union employees hired prior to January 1, 2001. The MSG Cash Balance Pension Plan was amended to freeze participation and future benefit accruals effective December 31, 2015. Existing account balances under the MSG Cash Balance Pension Plan will continue to be credited with monthly interest in accordance with the terms of the plan. The MSG Cash Balance Pension Plan and MSG Union Plan are collectively referred to as the “MSG Pension Plans.”
F-20
The Company currently sponsors (i) a non-contributory qualified defined benefit pension plan covering certain of its union employees (the “Union Plan”), (ii) an unfunded non-contributory, non-qualified excess cash balance plan covering certain employees who participated in the MSG Cash Balance Pension Plan (the "Excess Cash Balance Plan"), and (iii) an unfunded non-contributory non-qualified defined benefit pension plan for the benefit of certain employees who participated in an underlying qualified plan, which was merged into the MSG Cash Balance Pension Plan on March 1, 2011 (the “Excess Plan”). The Union Plan, Excess Cash Balance Plan and Excess Plan are collectively referred to as the “MSG Networks Plans.”
As of December 31, 2015, the Excess Cash Balance Plan was amended to freeze participation and future benefit accruals. Therefore, after December 31, 2015, no employee of the Company who was not already a participant may become a participant in the plan and no further annual pay credits will be made for any future year. Existing account balances under the plan will continue to be credited with monthly interest in accordance with the terms of the plan. As of December 31, 2007, the Excess Plan was amended to freeze all benefits earned through December 31, 2007 and to eliminate the ability of participants to earn benefits for future service under this plan. Benefits payable to retirees under the Union Plan are based upon years of service and participants’ compensation.
The Company also sponsors a contributory welfare plan which provides certain postretirement healthcare benefits to certain employees hired prior to January 1, 2001 who are eligible to commence receipt of early or normal Retirement Plan benefits under the MSG Cash Balance Pension Plan and their dependents, as well as certain union employees (“Postretirement Plan”).
As of the Distribution Date, the Company and MSG entered into an employee matters agreement (the “Employee Matters Agreement”) which determined each company’s obligations after the Distribution with regard to historic liabilities under the Company’s former pension and postretirement plans. Under the Employee Matters Agreement, the assets and liabilities of the MSG Pension Plans have been transferred to MSG. In addition, the following have been transferred to MSG: liabilities related to (i) MSG employees as of the Distribution Date who were active participants in the Excess Plan and/or the Excess Cash Balance Plan, (ii) MSG employees as of the Distribution Date who were eligible for participation in the Postretirement Plan, and (iii) former MSG employees as of the Distribution Date who were retired participants in the Postretirement Plan. The Company has retained liabilities related to (i) its current and former employees who are active participants in the Excess Plan and/or the Excess Cash Balance Plan, (ii) former MSG employees as of the Distribution Date who were active participants in the Excess Plan and/or the Excess Cash Balance Plan, (iii) its current employees who are eligible for participation in the Postretirement Plan, (iv) its former employees who are retired participants in the Postretirement Plan, and (v) the Union Plan.
The following table summarizes the projected benefit obligations, assets, funded status and the amounts recorded on the Company's consolidated balance sheets associated with the MSG Networks Plans, MSG Pension Plans and Postretirement Plan as of June 30, 2017 and 2016 based upon actuarial valuations as of those measurement dates.
F-21
Pension Plans | Postretirement Plan | ||||||||||||||
June 30, | June 30, | ||||||||||||||
2017 | 2016 | 2017 | 2016 | ||||||||||||
Change in benefit obligation: | |||||||||||||||
Benefit obligation at beginning of period | $ | 43,921 | $ | 191,064 | $ | 3,537 | $ | 8,704 | |||||||
Service cost | 532 | 1,962 | 72 | 112 | |||||||||||
Interest cost | 1,328 | 3,418 | 100 | 206 | |||||||||||
Actuarial loss (gain) | (1,567 | ) | 4,534 | (16 | ) | 425 | |||||||||
Benefits paid | (1,224 | ) | (1,906 | ) | (70 | ) | (235 | ) | |||||||
Transfer due to the Distribution | — | (155,151 | ) | — | (5,675 | ) | |||||||||
Benefit obligation at end of period | 42,990 | 43,921 | 3,623 | 3,537 | |||||||||||
Change in plan assets: | |||||||||||||||
Fair value of plan assets at beginning of period | 14,818 | 112,213 | — | — | |||||||||||
Actual return on plan assets | (24 | ) | 1,433 | — | — | ||||||||||
Employer contributions | 2,035 | 2,675 | — | — | |||||||||||
Benefits paid | (1,224 | ) | (1,906 | ) | — | — | |||||||||
Transfer due to the Distribution | — | (99,597 | ) | — | — | ||||||||||
Fair value of plan assets at end of period | 15,605 | 14,818 | — | — | |||||||||||
Funded status at end of period | $ | (27,385 | ) | $ | (29,103 | ) | $ | (3,623 | ) | $ | (3,537 | ) | |||
Amounts recognized in the consolidated balance sheets as of June 30, 2017 and 2016 consist of:
Pension Plans | Postretirement Plan | ||||||||||||||
June 30, | June 30, | ||||||||||||||
2017 | 2016 | 2017 | 2016 | ||||||||||||
Current liabilities (included in accrued employee related costs) | $ | (930 | ) | $ | (730 | ) | $ | (99 | ) | $ | (83 | ) | |||
Non-current liabilities (included in defined benefit and other postretirement obligations) | (26,455 | ) | (28,373 | ) | (3,524 | ) | (3,454 | ) | |||||||
$ | (27,385 | ) | $ | (29,103 | ) | $ | (3,623 | ) | $ | (3,537 | ) | ||||
Accumulated other comprehensive income (loss), before tax, as of June 30, 2017 and 2016 consists of the following amounts that have not yet been recognized in net periodic benefit cost:
Pension Plans | Postretirement Plan | ||||||||||||||
June 30, | June 30, | ||||||||||||||
2017 | 2016 | 2017 | 2016 | ||||||||||||
Actuarial loss | $ | (11,034 | ) | $ | (12,791 | ) | $ | (214 | ) | $ | (254 | ) | |||
Prior service credit | — | — | 24 | 48 | |||||||||||
$ | (11,034 | ) | $ | (12,791 | ) | $ | (190 | ) | $ | (206 | ) | ||||
In connection with the Distribution, the Company transferred to MSG the accumulated other comprehensive income (loss) related to the MSG Pension Plans.
Components of net periodic benefit cost for the MSG Networks Plans, MSG Pension Plans, and Postretirement Plan recognized in direct operating expenses, selling, general and administrative expenses, and income (loss) from discontinued operations in the accompanying consolidated statements of operations for the years ended June 30, 2017, 2016 and 2015 are as follows:
F-22
Pension Plans | Postretirement Plan | ||||||||||||||||||||||
Years Ended June 30, | Years Ended June 30, | ||||||||||||||||||||||
2017 | 2016 | 2015 | 2017 | 2016 | 2015 | ||||||||||||||||||
Service cost | $ | 532 | $ | 1,962 | $ | 6,943 | $ | 72 | $ | 112 | $ | 198 | |||||||||||
Interest cost | 1,328 | 3,418 | 7,915 | 100 | 206 | 331 | |||||||||||||||||
Expected return on plan assets | (424 | ) | (1,233 | ) | (3,663 | ) | — | — | — | ||||||||||||||
Recognized actuarial loss (a) | 700 | 721 | 2,258 | 24 | — | — | |||||||||||||||||
Amortization of unrecognized prior service cost (credit) (a) | — | 14 | 26 | (24 | ) | (71 | ) | (138 | ) | ||||||||||||||
Settlement gain (a) | (71 | ) | — | — | — | — | — | ||||||||||||||||
Net periodic benefit cost | $ | 2,065 | $ | 4,882 | $ | 13,479 | $ | 172 | $ | 247 | $ | 391 | |||||||||||
(a) Reflects amounts reclassified from accumulated other comprehensive loss.
Amounts presented in the table above include net periodic benefit cost related to continuing operations and discontinued operations as noted in the following table:
Years Ended June 30, | |||||||||||
2017 | 2016 | 2015 | |||||||||
Continuing operations | $ | 2,237 | $ | 3,166 | $ | 5,765 | |||||
Discontinued operations | — | 1,963 | 8,105 | ||||||||
Total Net Periodic Benefit Cost | $ | 2,237 | $ | 5,129 | $ | 13,870 | |||||
Other pre-tax changes in plan assets and benefit obligations recognized in other comprehensive income (loss) for the years ended June 30, 2017, 2016 and 2015 are as follows:
Pension Plans | Postretirement Plan | ||||||||||||||||||||||
Years Ended June 30, | Years Ended June 30, | ||||||||||||||||||||||
2017 | 2016 | 2015 | 2017 | 2016 | 2015 | ||||||||||||||||||
Actuarial gain (loss) | $ | 1,128 | $ | (3,483 | ) | $ | (8,029 | ) | $ | 16 | $ | (427 | ) | $ | 855 | ||||||||
Amounts reclassified from accumulated other comprehensive loss: | |||||||||||||||||||||||
Recognized actuarial loss | 700 | 721 | 2,258 | 24 | — | — | |||||||||||||||||
Recognized prior service (credit) cost | — | 14 | 26 | (24 | ) | (71 | ) | (138 | ) | ||||||||||||||
Settlement gain | (71 | ) | — | — | — | — | — | ||||||||||||||||
Total recognized in other comprehensive income (loss) | $ | 1,757 | $ | (2,748 | ) | $ | (5,745 | ) | $ | 16 | $ | (498 | ) | $ | 717 | ||||||||
The estimated net loss for the MSG Networks Plans expected to be amortized from accumulated other comprehensive income (loss) and recognized as a component of net periodic benefit cost over the next fiscal year is $612. The estimated prior service credit for the Postretirement Plan expected to be amortized from accumulated other comprehensive income (loss) into net periodic benefit credit over the next fiscal year is $13.
Funded Status
The accumulated benefit obligation for the MSG Networks Plans aggregated to $42,190 and $42,977 at June 30, 2017 and 2016, respectively. As of June 30, 2017 and 2016 each of the MSG Networks Plans had accumulated benefit obligations and projected benefit obligations in excess of plan assets.
F-23
Pension Plans and Postretirement Plan Assumptions
Weighted-average assumptions used to determine benefit obligations (made at the end of the period) as of June 30, 2017 and 2016 are as follows:
Pension Plans | Postretirement Plan | ||||||||||
June 30, | June 30, | ||||||||||
2017 | 2016 | 2017 | 2016 | ||||||||
Discount rate | 3.80 | % | 3.57 | % | 3.68 | % | 3.28 | % | |||
Rate of compensation increase | 2.00 | % | 2.00 | % | n/a | n/a | |||||
Healthcare cost trend rate assumed for next year | n/a | n/a | 7.25 | % | 7.25 | % | |||||
Rate to which the cost trend rate is assumed to decline (the ultimate trend rate) | n/a | n/a | 5.00 | % | 5.00 | % | |||||
Year that the rate reaches the ultimate trend rate | n/a | n/a | 2027 | 2026 | |||||||
Weighted-average assumptions used to determine net periodic benefit cost (made at the beginning of the period) for the years ended June 30, 2017, 2016 and 2015 are as follows:
Pension Plans | Postretirement Plan | ||||||||||||||||
Years Ended June 30, | Years Ended June 30, | ||||||||||||||||
2017 | 2016 | 2015 | 2017 | 2016 | 2015 | ||||||||||||
Discount rate | n/a | 4.47 | % | 4.32 | % | n/a | 4.15 | % | 4.00 | % | |||||||
Discount rate - service cost | 3.73 | % | n/a | n/a | 3.63 | % | n/a | n/a | |||||||||
Discount rate - interest cost | 3.03 | % | n/a | n/a | 2.84 | % | n/a | n/a | |||||||||
Expected long-term return on plan assets | 3.38 | % | 4.06 | % | 4.24 | % | n/a | n/a | n/a | ||||||||
Rate of compensation increase | 2.00 | % | 2.98 | % | 2.98 | % | n/a | n/a | n/a | ||||||||
Healthcare cost trend rate assumed for next year | n/a | n/a | n/a | 7.25 | % | 7.25 | % | 7.25 | % | ||||||||
Rate to which the cost trend rate is assumed to decline (the ultimate trend rate) | n/a | n/a | n/a | 5.00 | % | 5.00 | % | 5.00 | % | ||||||||
Year that the rate reaches the ultimate trend rate | n/a | n/a | n/a | 2026 | 2021 | 2020 | |||||||||||
The discount rates were determined (based on the expected duration of the benefit payments for the plans) from the Willis Towers Watson U.S. Rate Link: 40-90 Discount Rate Model as of June 30, 2017 and 2016 to select rates at which the Company
believed the plans’ benefits could be effectively settled. This model was developed by examining the yields on selected highly
rated corporate bonds. Effective in the first quarter of fiscal year 2017, the Company began to utilize a method which calculates service and interest costs by applying specific spot rates along the yield curve to the plans’ cash flows instead of using a single weighted-average discount rate.
The Company's expected long-term return on plan assets is based on a periodic review and modeling of the plans' asset allocation structures over a long-term horizon. Expectations of returns for each asset class are the most important of the assumptions used in the review and modeling and are based on comprehensive reviews of historical data, forward-looking economic outlook, and economic/financial market theory. The expected long-term rate of return was selected from within the reasonable range of rates determined by (a) historical real returns, net of inflation, for the asset classes covered by the investment policy and (b) projections of inflation over the long-term period during which benefits are payable to plan participants.
F-24
Assumed healthcare cost trend rates are also a key assumption used for the amounts reported for the Postretirement Plan. A one percentage point change in assumed healthcare cost trend rates would have the following effects:
Increase (Decrease) in Total of Service and Interest Cost Components for the | Increase (Decrease) in Benefit Obligation at | ||||||||||||||||||
Years Ended June 30, | June 30, | ||||||||||||||||||
2017 | 2016 | 2015 | 2017 | 2016 | |||||||||||||||
One percentage point increase | $ | 24 | $ | 63 | $ | 67 | $ | 448 | $ | 383 | |||||||||
One percentage point decrease | (21 | ) | (55 | ) | (58 | ) | (382 | ) | (373 | ) | |||||||||
Plan Assets and Investment Policy
The weighted-average asset allocation of the pension plan assets at June 30, 2017 and 2016 was as follows:
June 30, | |||||
Asset Classes: (a) | 2017 | 2016 | |||
Fixed income securities | 79 | % | 78 | % | |
Cash equivalents | 21 | % | 22 | % | |
100 | % | 100 | % | ||
_____________________
(a) | The Company's target allocation for pension plan assets is 80% fixed income securities and 20% cash equivalents as of June 30, 2017. |
Investment allocation decisions are formally made by the Company's Investment and Benefits Committee, which takes into account investment advice provided by the Company's external investment consultant. The investment consultant takes into account expected long-term risk, return, correlation, and other prudent investment assumptions when recommending asset classes and investment managers to the Company's Investment and Benefits Committee. The investment consultant also takes into account the plans' liabilities when making investment allocation recommendations. Those decisions are driven by asset/liability studies conducted by the external investment consultant who combines actuarial considerations and strategic investment advice. The major categories of the pension plan assets are cash equivalents and long duration bonds which are marked-to-market on a daily basis. Due to the fact that the pension plan assets are significantly made up of long duration bonds, the pension plan assets are subjected to interest-rate risk; specifically, a rising interest rate environment. However, an increase in interest rates would cause a corresponding decrease to the overall liability of the plans, thus creating a hedge against rising interest rates. Additional risks involving the asset/liability framework include earning insufficient returns to cover future liabilities and imperfect hedging of the liability. In addition, a portion of the long duration bond portfolio is invested in non-government securities which are subject to credit risk of the bond issuer defaulting on interest and/or principal payments.
F-25
Investments at Estimated Fair Value
The cumulative fair values of the individual plan assets at June 30, 2017 and 2016 by asset class are as follows:
Fair Value of Investments at June 30, 2017 | Level I | Level II | Level III | Total | |||||||||||
Fixed income securities: | |||||||||||||||
U.S. Treasury Securities | $ | 3,605 | $ | — | $ | — | $ | 3,605 | |||||||
U.S. corporate bonds | — | 7,504 | — | 7,504 | |||||||||||
Foreign issued corporate bonds | — | 1,253 | — | 1,253 | |||||||||||
Municipal bonds | — | 21 | — | 21 | |||||||||||
Money market accounts | 3,222 | — | — | 3,222 | |||||||||||
Total investments measured at fair value | $ | 6,827 | $ | 8,778 | $ | — | $ | 15,605 | |||||||
Fair Value of Investments at June 30, 2016 | |||||||||||||||
Fixed income securities: | |||||||||||||||
U.S. Treasury Securities | $ | 3,931 | $ | — | $ | — | $ | 3,931 | |||||||
U.S. corporate bonds | — | 6,349 | — | 6,349 | |||||||||||
Foreign issued corporate bonds | — | 1,278 | — | 1,278 | |||||||||||
Municipal bonds | — | 22 | — | 22 | |||||||||||
Money market accounts | 3,238 | — | — | 3,238 | |||||||||||
Total investments measured at fair value | $ | 7,169 | $ | 7,649 | $ | — | $ | 14,818 | |||||||
Contributions for Qualified Defined Benefit Pension Plan
The Company expects to contribute approximately $1,300 to the Union Plan in fiscal year 2018.
Estimated Future Benefit Payments
The following table presents estimated future fiscal year benefit payments for the MSG Networks Plans and Postretirement Plan:
Pension Plans | Postretirement Plan | ||||||
Fiscal year ending June 30, 2018 | $ | 1,470 | $ | 101 | |||
Fiscal year ending June 30, 2019 | 1,580 | 134 | |||||
Fiscal year ending June 30, 2020 | 1,830 | 168 | |||||
Fiscal year ending June 30, 2021 | 2,080 | 211 | |||||
Fiscal year ending June 30, 2022 | 2,260 | 245 | |||||
Fiscal years ending June 30, 2023 – 2027 | 12,800 | 1,428 | |||||
Savings Plans
In addition, prior to the Distribution, the Company sponsored the MSG Holdings, L.P. 401(k) Savings Plan (the "MSG Savings Plan") and the MSG Holdings, L.P. Excess Savings Plan ("Excess Savings Plan"). As a result of the Distribution, the MSG Savings Plan was amended to (i) transfer sponsorship of the plan to MSG, and (ii) become a multiple employer plan in which both MSG and the Company will continue to participate. Pursuant to the Employee Matters Agreement, liabilities relating to MSG employees as of the Distribution Date who were active participants in the Company's Excess Savings Plan have been transferred to MSG. The Excess Savings Plan has been renamed the MSGN Holdings, L.P. Excess Savings Plan (together with the MSG Savings Plan, the "Savings Plans"). Expenses related to the Savings Plans included in the accompanying consolidated statements of operations for the years ended June 30, 2017, 2016 and 2015 are as follows:
F-26
Years Ended June 30, | |||||||||||
2017 | 2016 | 2015 | |||||||||
Continuing operations | $ | 828 | $ | 863 | $ | 759 | |||||
Discontinued operations | — | 652 | 2,763 | ||||||||
Total Savings Plan Expense | $ | 828 | $ | 1,515 | $ | 3,522 | |||||
In addition, prior to the Distribution, the Company sponsored the MSG Holdings, L.P. 401(k) Union Plan (the "MSG Union Savings Plan"). As a result of the Distribution, the MSG Union Savings Plan was amended to (i) transfer sponsorship of the plan to MSG and (ii) become a multiple employer plan in which both the Company and MSG will continue to participate. For periods subsequent to the Distribution, there were no employer contributions to the MSG Union Plan. For periods prior to the Distribution, expenses related to the MSG Union Plan, which have been classified in the consolidated statements of operations as discontinued operations were $18 and $724 for the years ended June 30, 2016 and 2015, respectively.
Multiemployer Plans
The Company contributes to a number of multiemployer defined benefit pension plans, multiemployer defined contribution pension plans, and multiemployer health and welfare plans that provide benefits to retired union-represented employees under the terms of collective bargaining agreements.
The multiemployer defined benefit pension plans to which the Company contributes generally provide for retirement and death benefits for eligible union-represented employees based on specific eligibility/participant requirements, vesting periods and benefit formulas. The risks to the Company of participating in these multiemployer defined benefit pension plans are different from single-employer defined benefit pension plans in the following aspects:
• | Assets contributed to a multiemployer defined benefit pension plan by one employer may be used to provide benefits to employees of other participating employers. |
• | If a participating employer stops contributing to a multiemployer defined benefit pension plan, the unfunded obligations of the plan may be borne by the remaining participating employers. |
• | If the Company chooses to stop participating in some of these multiemployer defined benefit pension plans, the Company may be required to pay those plans an amount based on the Company's proportion of the underfunded status of the plan, referred to as a withdrawal liability. However, cessation of participation in a multiemployer defined benefit pension plan and subsequent payment of any withdrawal liability is subject to the collective bargaining process. |
The Company was not listed in any of the multiemployer plans' Form 5500's as providing more than 5 percent of the total contributions. There were no multiemployer defined benefit pension plans, to which the Company contributes, that were in the red zone (which are plans that are generally less than 65% funded) for the most recent Pension Protection Act zone status available as of June 30, 2017.
The Company contributed $1,328, $1,334, and $3,644 for the years ended June 30, 2017, 2016 and 2015, respectively, to multiemployer plans, primarily multiemployer defined benefit pension plans.
Note 14. Share-based Compensation
The Company has two share-based compensation plans (i) the MSG Networks Inc. 2010 Employee Stock Plan (the “Employee Stock Plan”), which was most recently approved by the Company's stockholders on December 15, 2016, and (ii) the MSG Networks Inc. 2010 Stock Plan for Non-Employee Directors (the “Non-Employee Director Plan”), which was most recently approved by the Company's stockholders on December 11, 2015.
Under the Employee Stock Plan, the Company is authorized to grant incentive stock options and non-qualified stock options (“options” or "stock options”), restricted shares, RSUs and other equity-based awards. The Company may grant awards for up to 12,500 (inclusive of awards granted prior to the December 15, 2016 amendment thereof) shares of the Company's Class A Common Stock (subject to certain adjustments). Options and rights under the Employee Stock Plan must be granted with an exercise price of not less than the fair market value of a share of the Company's Class A Common Stock on the date of grant and must expire no later than 10 years from the date of grant (or up to one additional year in the case of the death of a holder).
F-27
The terms and conditions of awards granted under the Employee Stock Plan, including vesting and exercisability, are determined by the Compensation Committee of the Board of Directors (“Compensation Committee”) and may include performance targets. RSUs that were awarded by the Company to its employees will settle in shares of the Company's Class A Common Stock (either from treasury or with newly issued shares), or, at the option of the Compensation Committee, in cash.
Under the Non-Employee Director Plan, the Company is authorized to grant non-qualified stock options, RSUs and other equity-based awards. The Non-Employee Director Plan provides that the Company may grant awards for up to 300 shares of the Company's Class A Common Stock (subject to certain adjustments). Non-qualified stock options under the Non-Employee Director Plan must be granted with an exercise price of not less than the fair market value of a share of the Company's Class A Common Stock on the date of grant and must expire no later than 10 years from the date of grant (or up to one additional year in the case of the death of a holder). The terms and conditions of awards granted under the Non-Employee Director Plan, including vesting and exercisability, are determined by the Compensation Committee. Unless otherwise provided in an applicable award agreement, non-qualified stock options granted under this plan will be fully vested and exercisable, and RSUs granted under this plan will be fully vested, upon the date of grant and will settle in shares of the Company's Class A Common Stock (either from treasury or with newly issued shares), or, at the option of the Compensation Committee, in cash, on the first business day after ninety days from the date the director's service on the Board of Directors ceases or, if earlier, upon the director's death.
In connection with the Distribution, each holder of an employee RSU that was granted prior to July 1, 2015 received one MSG RSU in respect of every three RSUs owned on the Record Date and continues to be entitled to a share of the Company's Class A Common Stock (or cash or other property) for each RSU in accordance with the existing award agreement. In connection with the Distribution, each employee RSU that was granted on or after July 1, 2015 was adjusted in accordance with its terms, such that (i) each holder who remained employed by the Company following the Distribution continued to hold Company RSUs, with the number of RSUs adjusted to reflect the Distribution to maintain the value of the RSUs, and (ii) each holder who MSG employed following the Distribution received MSG RSUs of the same value as the Company RSUs, and the original Company RSUs were canceled. Any holder of RSUs granted after July 1, 2015 who was employed by both MSG and the Company following the Distribution continues to hold the Company's RSUs, adjusted to reflect the Distribution, and received MSG RSUs in connection with the Distribution, so that the Company's RSUs represent 30% of the value of the original awards and MSG RSUs represent 70% of the value of the original RSU award.
Also in connection with the Distribution, one share of MSG Class A Common Stock was issued under the MSG 2015 Non-Employee Director Plan in respect of every three RSUs outstanding under the Company’s Non-Employee Director Plan.
In connection with the Distribution, each option to purchase the Company's Class A Common Stock became two options: one option to acquire MSG Class A Common Stock and one option to acquire the Company's Class A Common Stock. The existing exercise price was allocated between the existing options and the new MSG options based upon the volume-weighted average prices of the MSG Class A Common Stock and the Company's Class A Common Stock over the ten trading days immediately following the Distribution as reported by Bloomberg Business, and the underlying share amount took into account the one-to-
three distribution ratio (i.e., one share of MSG Class A Common Stock was issued for every three shares of the Company's Class A Common Stock). Other than the split of the options and the allocation of the existing exercise price, there were no additional adjustments to the existing options in connection with the Distribution and the terms of each employee’s applicable option award agreement will continue to govern the Company's options.
The Company's RSUs held by MSG employees will not be expensed by the Company; however, such RSUs do have a dilutive effect on earnings (loss) per share available to the Company's common stockholders.
Share-based Compensation Expense
Share-based compensation expense, presented within selling, general and administrative expenses and direct operating expenses, was $9,931, $9,266 and $10,211 for the years ended June 30, 2017, 2016 and 2015, respectively. Share-based compensation expense for discontinued operations during the years ended June 30, 2016 and 2015 was $808, and $4,810, respectively.
As of June 30, 2017, there was $16,342 of unrecognized compensation cost related to unvested RSUs and stock options, held by Company employees. The cost is expected to be recognized over a weighted-average period of 2 years for unvested RSUs and stock options. There were no costs related to share-based compensation that were capitalized. Tax benefits realized from tax
F-28
deductions associated with share-based compensation expense for the years ended June 30, 2017, 2016 and 2015 totaled $1,714, $12,206, and $17,552, respectively.
Stock Options Award Activity
The following table summarizes activity relating to holders of the Company's stock options for the year ended June 30, 2017:
Number of | Weighted- Average Exercise Price Per Share | Weighted- Average Remaining Contractual Term (In Years) | Aggregate Intrinsic Value | ||||||||||||
Nonperformance Based Vesting Options | Performance Based Vesting Options | ||||||||||||||
Balance as of June 30, 2016 [a] | 1 | — | $ | 2.77 | 0.28 | $ | 11 | ||||||||
Granted | 535 | 534 | 17.81 | ||||||||||||
Exercised | (1 | ) | — | 2.77 | |||||||||||
Balance as of June 30, 2017 | 535 | 534 | $ | 17.81 | 6.71 | $ | 4,960 | ||||||||
(a) See above for a discussion of the treatment of options in connection with the Distribution.
In September 2016, the Company granted 1,069 stock options, of which 50% are subject to three-year ratable vesting and the remaining 50% are subject to three-year cliff vesting and the achievement of certain Company performance criteria. These options have an expiration period of 7.5 years. The Company calculated the fair value of these options on the date of grant using the Black-Scholes option pricing model, which resulted in a grant date fair value of $4.49 per option.
The following were the key assumptions used to calculate the fair value of this award:
Risk-free interest rate | 1.24 | % | |
Expected term | 5.25 years | ||
Expected volatility | 25.1 | % | |
The Company's computation of expected term was calculated using the simplified method (the average of the vesting period and option term) as prescribed in ASC Topic 718-10-S99. The Company's computation of expected volatility was based on historical volatility of its common stock.
The aggregate intrinsic value is calculated as the difference between (i) the exercise price of the underlying award and (ii) the quoted price of the Company's Class A Common Stock for all options outstanding which were all in-the-money at June 30, 2017 and 2016, as applicable. For the years ended June 30, 2017, 2016 and 2015, the aggregate intrinsic value of the Company's stock options exercised was $14, $5,100 and $3,207, respectively, determined as of the date of option exercise.
Restricted Share Units Award Activity
The following table summarizes activity relating to holders (including Company and MSG employees) of the Company's RSUs for the year ended June 30, 2017:
Number of | Weighted-Average Fair Value Per Share At Date of Grant | ||||||||
Nonperformance Based Vesting RSUs | Performance Based Vesting RSUs | ||||||||
Unvested award balance as of June 30, 2016 | 321 | 431 | $ | 38.57 | |||||
Granted | 463 | 284 | 19.59 | ||||||
Vested | (207 | ) | (103 | ) | 39.91 | ||||
Forfeited | (33 | ) | (15 | ) | 38.07 | ||||
Unvested award balance as of June 30, 2017 | 544 | 597 | 25.79 | ||||||
F-29
See above for a discussion of the treatment of RSUs granted after July 1, 2015. Nonperformance based vesting RSUs granted during the year ended June 30, 2017 included 404 RSUs that are subject to three-year ratable vesting and 59 RSUs granted under the Non-Employee Director Plan which vested upon date of grant. Performance based vesting RSUs granted during the year ended June 30, 2017 included 94 RSUs that are subject to three-year ratable vesting, and 190 RSUs subject to three-year cliff vesting. RSUs granted under the Employee Stock Plan and Non-Employee Director Plan will settle in shares of the Company's Class A Common Stock (either from treasury or with newly issued shares), or, at the option of the Compensation Committee, in cash. RSU's granted under the Non-Employee Director Plan will settle on the first business day after ninety days from the date the director's service on the Board of Directors ceases or, if earlier, upon the director's death.
The fair value of RSUs that vested during the year ended June 30, 2017 was $5,902. Upon delivery, RSUs granted under the Employee Stock Plan were net share-settled to cover the required statutory tax withholding obligations and the remaining number of shares were issued from the Company's treasury shares. To fulfill the employees' statutory minimum tax withholding obligations for the applicable income and other employment taxes, 130 of these RSUs, with an aggregate value of $2,399 were retained by the Company and the taxes paid are reflected as a financing activity in the accompanying consolidated statement of cash flows for the year ended June 30, 2017. The fair value of RSUs that vested during the years ended June 30, 2016 and 2015, was $17,330 and $54,544, respectively.
The weighted-average fair value per share at date of grant of RSUs granted during the years ended June 30, 2016 and 2015 was $55.23 and $69.57, respectively.
Note 15. Stock Repurchase Program
On October 27, 2014, the Company's Board of Directors authorized the repurchase of up to $500,000 of the Company's Class A Common Stock. On September 11, 2015, the Company's Board of Directors terminated the repurchase authorization effective as of the Distribution Date. Under the authorization, shares of Class A Common Stock were able to be purchased from time to time in open market or private transactions in accordance with applicable insider trading and other securities laws and regulations.
For the years ended June 30, 2016 (up until the authorization was terminated) and 2015, the Company repurchased 1,336 and 1,823 shares, respectively, which are determined based on the settlement date of such trades, for a total cost of $100,027 and $140,717 (including commissions and fees), respectively. These acquired shares have been classified as treasury stock.
Note 16. Related Party Transactions
As of June 30, 2017, members of the Dolan family group, for purposes of Section 13(d) of the Securities Exchange Act of 1934, as amended, including trusts for the benefit of the Dolan family group, collectively beneficially own all of the Company's outstanding Class B Common Stock and own approximately 2.4% of the Company's outstanding Class A Common Stock. Such shares of the Company's Class A Common Stock and Class B Common Stock, collectively, represent approximately 69.6% of the aggregate voting power of the Company's outstanding common stock. Members of the Dolan family are also the controlling stockholders of MSG and AMC Networks Inc. ("AMC Networks").
On June 16, 2016, the Company entered into an arrangement with the Dolan Family Office, LLC (“DFO”), MSG and AMC Networks providing for the sharing of certain expenses associated with executive office space which is available to Charles F. Dolan (a director of the Company and MSG and the Executive Chairman and a director of AMC Networks), James L. Dolan (the Executive Chairman and a director of the Company and MSG and a director of AMC Networks), and the DFO, which is controlled by Charles F. Dolan.
Beginning in June 2016, the Company agreed to share certain executive support costs, including office space, executive assistants, security and transportation costs for (i) the Company's Executive Chairman with MSG and (ii) the Company's Vice Chairman with MSG and AMC Networks.
In connection with the Distribution, the Company entered into various agreements with MSG, including media rights agreements covering Knicks and Rangers games, an advertising sales representation agreement, a trademark license agreement, a tax disaffiliation agreement, a transition services agreement ("TSA") and certain other arrangements. The Company has entered into various agreements with AMC Networks with respect to a number of ongoing commercial relationships.
F-30
Related party transactions included in continuing operations
Rights fees
The Company's media rights agreements with the Knicks and the Rangers, effective as of July 1, 2015, provide the Company with exclusive media rights to team games in their local markets. Prior to the Distribution, these rights fees were eliminated in consolidation; however the pre-Distribution Date amounts are now presented as revenues in the loss from discontinued operations line with the offsetting expense in direct operating expenses, within continuing operations, in the accompanying consolidated statements of operations for the years ended June 30, 2016 and 2015. Rights fees included in the accompanying consolidated statements of operations for the years ended June 30, 2017, 2016 and 2015 were $135,191, $130,841, and $80,999, respectively.
Origination, master control and technical services
AMC Networks provides certain origination, master control and technical services to the Company. Amounts charged to the Company for the years ended June 30, 2017, 2016 and 2015 were $6,111, $5,872, and $5,663, respectively.
Commission
The Company's advertising sales representation agreement with MSG, which has a term through June 30, 2022, provides for MSG to act as our advertising sales representative and includes the exclusive right and obligation to sell certain advertising availabilities on our behalf for a commission. All of the Company's advertising sales personnel were transferred to MSG in connection with the Distribution. The amount charged to the Company for the years ended June 30, 2017 and 2016 were $13,585 and $13,763, respectively.
Other operating expenses
The Company and its related parties enter into transactions with each other in the ordinary course of business. In addition, pursuant to the TSA, the Company outsources certain business functions to MSG. These services include information technology, certain accounting functions, accounts payable, payroll, tax, legal, human resources, insurance and risk management, investor relations, corporate communications, benefit plan administration and reporting, and internal audit. Net amounts charged to the Company pursuant to the TSA, for expenses associated with executive office space and certain support costs, and for other related party transactions amounted to $8,925, $4,934, and $(3,766) for the years ended June 30, 2017, 2016 and 2015, respectively.
Related party transactions with Cablevision Systems Corporation
Prior to June 21, 2016, members of the Dolan family were also the controlling stockholders of Cablevision Systems Corporation ("Cablevision"). On June 21, 2016, Cablevision was acquired by a subsidiary of Altice N.V. and a change in control occurred which resulted in members of the Dolan family no longer being controlling stockholders of Cablevision (now known as Altice USA). Accordingly, Altice USA is not a related party of the Company. Revenues (primarily from the distribution of programming networks) that relate to Cablevision prior to its sale, included in continuing operations in the accompanying consolidated statements of operations for the years ended June 30, 2016 and 2015 were $161,588 and $167,648, respectively. Operating expenses that relate to Cablevision prior to its sale, included in continuing operations in the accompanying consolidated statements of operations for the years ended June 30, 2016 and 2015 were $11,050 and $9,107, respectively.
Related party transactions included in discontinued operations
Related party transactions included in income (loss) from discontinued operations in the accompanying consolidated statements of operations include the following: (i) revenues from related parties of $33,559 and $89,126 for the years ended June 30, 2016 and 2015, respectively, (ii) operating expenses charged by related parties of $1,367 and $10,194 for the years ended June 30, 2016 and 2015, respectively, (iii) interest income from nonconsolidated affiliates of $635 and $1,886 for the years ended June 30, 2016 and 2015, respectively, and (iv) equity in earnings (loss) of equity-method investments of $2,679 and $(40,590) for the years ended June 30, 2016 and 2015, respectively.
F-31
Note 17. Income Taxes
Income tax expense attributable to continuing operations is comprised of the following components:
Years Ended June 30, | |||||||||||
2017 | 2016 | 2015 | |||||||||
Current expense: | |||||||||||
Federal | $ | 81,964 | $ | 71,632 | $ | 137,455 | |||||
State and other | 31,977 | 27,977 | 53,194 | ||||||||
113,941 | 99,609 | 190,649 | |||||||||
Deferred expense (benefit): | |||||||||||
Federal | (4,120 | ) | (4,353 | ) | (16,558 | ) | |||||
State and other | (1,327 | ) | (14,252 | ) | 3,708 | ||||||
(5,447 | ) | (18,605 | ) | (12,850 | ) | ||||||
Tax benefit relating to uncertain tax positions | (18 | ) | (33 | ) | (894 | ) | |||||
Income tax expense | $ | 108,476 | $ | 80,971 | $ | 176,905 | |||||
The income tax expense attributable to continuing operations differs from the amount derived by applying the statutory federal rate to pre-tax income principally due to the effect of the following items:
Years Ended June 30, | |||||||||||
2017 | 2016 | 2015 | |||||||||
Federal tax expense at statutory federal rate | $ | 96,578 | $ | 85,495 | $ | 148,867 | |||||
State and local income taxes, net of federal benefit | 19,489 | 17,709 | 31,707 | ||||||||
Change in the estimated applicable corporate tax rate used to determine deferred taxes | 85 | (12,717 | ) | 8,122 | |||||||
Domestic production activities tax deduction | (7,998 | ) | (6,329 | ) | (11,076 | ) | |||||
Tax benefit relating to uncertain tax positions | (18 | ) | (33 | ) | (894 | ) | |||||
Tax return to book provision adjustments | (208 | ) | (3,271 | ) | (49 | ) | |||||
Nondeductible expenses and other | 548 | 117 | 228 | ||||||||
Income tax expense | $ | 108,476 | $ | 80,971 | $ | 176,905 | |||||
The tax effects of temporary differences which give rise to significant portions of the deferred tax assets and liabilities included in the accompanying consolidated balance sheets as of June 30, 2017 and 2016 are as follows:
June 30, | |||||||
2017 | 2016 | ||||||
Deferred tax asset (liability) | |||||||
Investment in MSGN L.P. | $ | (356,064 | ) | $ | (358,725 | ) | |
Compensation and benefit plans | 4,210 | 2,164 | |||||
Net noncurrent deferred tax liability | $ | (351,854 | ) | $ | (356,561 | ) | |
Deferred tax assets as of June 30, 2017 have resulted from the Company's future deductible temporary differences. At this time, based on current facts and circumstances, management believes that it is more likely than not that the Company will realize the benefit for its gross deferred tax assets.
The current state tax prepaid asset of $14,322 and $28,384 as of June 30, 2017 and 2016, respectively, and the current federal tax payable of $11,483 and $8,662 as of June 30, 2017 and 2016, respectively, are reflected in the Company's income tax prepaid and payables balances in the accompanying consolidated balance sheets.
F-32
The following is a reconciliation of the beginning and ending amount of unrecognized tax benefits associated with the Company's uncertain tax positions:
Balance as of June 30, 2016 | $ | 32 | |
Additions for tax positions related to prior years | — | ||
Decreases for tax positions related to prior years | (18 | ) | |
Balance as of June 30, 2017 | $ | 14 | |
During the year ended June 30, 2017, the Company recorded a $18 tax benefit related to uncertain tax positions (including interest and penalties) due to the expiration of the applicable statute of limitations. The expense related to uncertain tax positions taken in prior years was comprised of income taxes associated with a state filing position. The Company recognizes accrued interest and penalties on unrecognized tax positions as a component of income tax expense. The Company expects its uncertain tax position balance of $14 to be released to income within the next twelve months which will have a negligible impact on the Company's effective tax rate.
The Company made cash income tax payments (net) of $97,164, $192,315 and $217,316 for years ended June 30, 2017, 2016 and 2015, respectively. The cash income tax payments for the year ended June 30, 2016 include approximately $120,000 which is reflected in net cash used in operating activities of discontinued operations in the accompanying consolidated statement of cash flows. The income tax payments classified in net cash used in operating activities of discontinued operations primarily reflect a one-time payment related to certain historical activities of our former subsidiary, MSG, and other offsetting items. Income taxes paid by the Company during the year ended June 30, 2015 include amounts related to the sale of Fuse.
During the third quarter of fiscal year 2017, the Internal Revenue Service concluded its fieldwork on the audit of the Company’s federal income tax returns as filed for the tax year ended December 31, 2013. The Company does not expect the audit to result in material changes to the tax returns as filed.
The Company was notified during the third quarter of fiscal year 2017 that the City of New York was commencing an examination of the Company's New York City income tax returns as filed for the tax years ended December 31, 2013 and 2014. The Company does not expect the examination, when finalized, to result in material changes to the tax returns as filed.
In addition, during the fourth quarter of fiscal year 2017 the Company was notified that the City of New York was also initiating a review of the Company’s 2014 and 2015 Unincorporated Business Tax Returns. The Company does not expect the examination, when finalized, to result in material changes to the tax returns as filed.
The Company was notified during the fourth quarter of fiscal year 2017 that the State of New York was commencing an examination of the Company's New York State income tax returns as filed for the tax years ended December 31, 2013 and 2014. The Company does not expect the examination, when finalized, to result in material changes to the tax returns as filed.
The federal and state statute of limitations are currently open on the Company's 2013, 2014, 2015, and 2016 tax returns.
Note 18. Concentrations of Risk
Financial instruments that may potentially subject the Company to a concentration of credit risk consist primarily of cash and cash equivalents and accounts receivable. Cash and cash equivalents are invested in money market funds and bank time deposits. The Company monitors the financial institutions and money market funds where it invests its cash and cash equivalents with diversification among counterparties to mitigate exposure to any single financial institution. The Company's emphasis is primarily on safety of principal and liquidity and secondarily on maximizing the yield on its investments.
Accounts receivable, net on the accompanying consolidated balance sheets as of June 30, 2017 and 2016 include amounts due from the following individual non-affiliated customers, which accounted for the noted percentages of the gross balance:
June 30, | |||||
2017 | 2016 | ||||
Customer A | 26 | % | 25 | % | |
Customer B | 25 | % | 26 | % | |
Customer C | 22 | % | 22 | % | |
Customer D | 14 | % | 14 | % | |
F-33
Affiliation fee revenue constituted at least 90% of our consolidated revenues for each of the years ended June 30, 2017, 2016 and 2015.
Revenues from continuing operations in the accompanying consolidated statements of operations for the years ended June 30, 2017, 2016 and 2015 include amounts from the following individual customers, which accounted for the noted percentages of the total:
Years Ended June 30, | ||||||||
2017 | 2016 | 2015 | ||||||
Customer 1 | 25 | % | 25 | % | 27 | % | ||
Customer 2 | 24 | % | 23 | % | 22 | % | ||
Customer 3 | 20 | % | 20 | % | 20 | % | ||
Customer 4 | 11 | % | 10 | % | 11 | % | ||
The accompanying consolidated balance sheets as of June 30, 2017 and 2016 include the following approximate amounts that are recorded in connection with the Company's license agreement with the New Jersey Devils:
June 30, | |||||||
Reported in | 2017 | 2016 | |||||
Prepaid expenses | $ | 3,000 | $ | 1,000 | |||
Other current assets | 2,000 | 2,000 | |||||
Other assets | 41,000 | 41,000 | |||||
$ | 46,000 | $ | 44,000 | ||||
As of June 30, 2017, approximately 580 full-time and part-time employees, who represent approximately 74% of the Company's workforce, are subject to collective bargaining agreements (“CBAs”). As of June 30, 2017, approximately 38% of the Company's workforce that are subject to CBAs are covered by CBAs that expire within the next fiscal year.
Note 19. Interim Financial Information (Unaudited)
The following is a summary of the Company's selected quarterly financial data for the years ended June 30, 2017 and 2016:
Three Months Ended | Year Ended June 30, 2017 | ||||||||||||||||||
September 30, 2016 | December 31, 2016 | March 31, 2017 | June 30, 2017 | ||||||||||||||||
Revenues | $ | 153,578 | $ | 175,646 | $ | 183,247 | $ | 162,881 | $ | 675,352 | |||||||||
Operating expenses | 79,071 | 95,847 | 100,193 | 86,977 | 362,088 | ||||||||||||||
Operating income | $ | 74,507 | $ | 79,799 | $ | 83,054 | $ | 75,904 | $ | 313,264 | |||||||||
Income from continuing operations | $ | 40,361 | $ | 43,255 | $ | 44,155 | $ | 39,691 | $ | 167,462 | |||||||||
Loss from discontinued operations, net of taxes | (120 | ) | — | — | — | (120 | ) | ||||||||||||
Net income | $ | 40,241 | $ | 43,255 | $ | 44,155 | $ | 39,691 | $ | 167,342 | |||||||||
Earnings (loss) per share: | |||||||||||||||||||
Basic | |||||||||||||||||||
Income from continuing operations | $ | 0.54 | $ | 0.58 | $ | 0.59 | $ | 0.53 | $ | 2.23 | |||||||||
Loss from discontinued operations | — | — | — | — | — | ||||||||||||||
Net income | 0.54 | 0.58 | 0.59 | 0.53 | 2.22 | ||||||||||||||
Diluted | |||||||||||||||||||
Income from continuing operations | $ | 0.54 | $ | 0.57 | $ | 0.58 | $ | 0.52 | $ | 2.22 | |||||||||
Loss from discontinued operations | — | — | — | — | — | ||||||||||||||
Net income | 0.53 | 0.57 | 0.58 | 0.52 | 2.21 | ||||||||||||||
F-34
Three Months Ended | Year Ended June 30, 2016 | ||||||||||||||||||
September 30, 2015 | December 31, 2015 | March 31, 2016 | June 30, 2016 | ||||||||||||||||
Revenues | $ | 148,147 | $ | 169,931 | $ | 179,596 | $ | 160,524 | $ | 658,198 | |||||||||
Operating expenses | 105,899 | 97,008 | 95,509 | 86,196 | 384,612 | ||||||||||||||
Operating income | $ | 42,248 | $ | 72,923 | $ | 84,087 | $ | 74,328 | $ | 273,586 | |||||||||
Income from continuing operations | $ | 41,331 | $ | 34,050 | $ | 44,710 | $ | 43,207 | $ | 163,298 | |||||||||
Income (loss) from discontinued operations, net of taxes | (161,017 | ) | (137 | ) | (40 | ) | 5,530 | (155,664 | ) | ||||||||||
Net income (loss) | $ | (119,686 | ) | $ | 33,913 | $ | 44,670 | $ | 48,737 | $ | 7,634 | ||||||||
Earnings (loss) per share: | |||||||||||||||||||
Basic | |||||||||||||||||||
Income from continuing operations | $ | 0.55 | $ | 0.45 | $ | 0.60 | $ | 0.58 | $ | 2.17 | |||||||||
Income (loss) from discontinued operations | (2.13 | ) | — | — | 0.07 | (2.07 | ) | ||||||||||||
Net income (loss) | (1.58 | ) | 0.45 | 0.60 | 0.65 | 0.10 | |||||||||||||
Diluted | |||||||||||||||||||
Income from continuing operations | $ | 0.54 | $ | 0.45 | $ | 0.59 | $ | 0.57 | $ | 2.16 | |||||||||
Income (loss) from discontinued operations | (2.12 | ) | — | — | 0.07 | (2.06 | ) | ||||||||||||
Net income (loss) | (1.58 | ) | 0.45 | 0.59 | 0.65 | 0.10 | |||||||||||||
F-35