Attached files
| file | filename |
|---|---|
| EX-32.2 - EXHIBIT 32.2 - LAM RESEARCH CORP | exhibit322june2017.htm |
| EX-32.1 - EXHIBIT 32.1 - LAM RESEARCH CORP | exhibit321june2017.htm |
| EX-31.2 - EXHIBIT 31.2 - LAM RESEARCH CORP | exhibit312june2017.htm |
| EX-31.1 - EXHIBIT 31.1 - LAM RESEARCH CORP | exhibit311june2017.htm |
| EX-23.1 - EXHIBIT 23.1 - LAM RESEARCH CORP | exhibit231june2017.htm |
| EX-21 - EXHIBIT 21 - LAM RESEARCH CORP | exhibit21june2017.htm |
UNITED STATES
SECURITIES AND EXCHANGE COMMISSION
Washington, D.C. 20549
FORM 10-K |
(Mark One)
x | ANNUAL REPORT PURSUANT TO SECTION 13 OR 15(d) OF THE SECURITIES EXCHANGE ACT OF 1934 |
For the fiscal year ended June 25, 2017
OR
¨ | TRANSITION REPORT PURSUANT TO SECTION 13 OR 15(d) OF THE SECURITIES EXCHANGE ACT OF 1934 |
For the transition period from to .
Commission file number: 0-12933
LAM RESEARCH CORPORATION (Exact name of registrant as specified in its charter) |
Delaware | 94-2634797 | |
(State or other jurisdiction of incorporation or organization) | (I.R.S. Employer Identification No.) | |
4650 Cushing Parkway, Fremont, California | 94538 | |
(Address of principal executive offices) | (Zip code) | |
Registrant’s telephone number, including area code: (510) 572-0200
Securities registered pursuant to Section 12(b) of the Act:
Title of class | Name of exchange on which registered | |
Common Stock, Par Value $0.001 Per Share | The Nasdaq Stock Market (Nasdaq Global Select Market) | |
Securities registered pursuant to Section 12(g) of the Act:
None
(Title of class)
_________________________
Indicate by check mark if the registrant is a well-known seasoned issuer, as defined in Rule 405 of the Securities Act. Yes x No ¨
Indicate by check mark if the registrant is not required to file reports pursuant to Section 13 or Section 15(d) of the Act. Yes ¨ No x
Indicate by check mark whether the registrant (1) has filed all reports required to be filed by Section 13 or 15(d) of the Securities Exchange Act of 1934 during the preceding 12 months (or for such shorter period that the registrant was required to file such reports), and (2) has been subject to such filing requirements for the past 90 days. Yes x No ¨
Indicate by check mark whether the registrant has submitted electronically and posted on its corporate Web site, if any, every Interactive Data File required to be submitted and posted pursuant to Rule 405 of Regulation S-T during the preceding 12 months (or for such shorter period that the registrant was required to submit and post such files). Yes x No ¨
Indicate by check mark if disclosure of delinquent filers pursuant to Item 405 of Regulation S-K is not contained herein, and will not be contained, to the best of registrant’s knowledge, in definitive proxy or information statements incorporated by reference in Part III of this Form 10-K or any amendment to this Form 10-K. x
Indicate by check mark whether the registrant is a large accelerated filer, an accelerated filer, a non-accelerated filer, a smaller reporting company, or an emerging growth company. See the definitions of “large accelerated filer,” “accelerated filer”, “smaller reporting company”, and “emerging growth company” in Rule 12b-2 of the Exchange Act. (Check one):
Large accelerated filer | x | Accelerated filer | ¨ | |||
Non-accelerated filer | ¨ (Do not check if a smaller reporting company) | Smaller reporting company | ¨ | |||
Emerging growth company | ¨ | |||||
If an emerging growth company, indicate by check mark if the registrant has elected not to use the extended transition period for complying with any new or revised financial accounting standards provided pursuant to Section 13(a) of the Exchange Act. ¨
Indicate by check mark whether the registrant is a shell company (as defined in Rule 12b-2 of the Exchange Act). Yes ¨ No x
The aggregate market value of the Registrant’s Common Stock, $0.001 par value, held by non-affiliates of the Registrant, as of December 25, 2016, the last business day of the most recently completed second fiscal quarter with respect to the fiscal year covered by this Form 10-K, was $12,210,431,182. Common Stock held by each officer and director and by each person who owns 5% or more of the outstanding Common Stock has been excluded from this computation in that such persons may be deemed to be affiliates. This determination of affiliate status is not necessarily a conclusive determination of such status for other purposes.
As of August 10, 2017, the Registrant had 162,454,686 outstanding shares of Common Stock.
_________________________
Documents Incorporated by Reference
Parts of the Registrant’s Proxy Statement for the Annual Meeting of Stockholders expected to be held on or about November 8, 2017, are incorporated by reference into Part III of this Form 10-K. Except as expressly incorporated by reference herein, the Registrant’s proxy statement shall not be deemed to be part of this report.
Continues on next page
Lam Research Corporation 2017 10-K 1

LAM RESEARCH CORPORATION
2017 ANNUAL REPORT ON FORM 10-K
TABLE OF CONTENTS
Page | ||
Item 1. | ||
Item 1A. | ||
Item 1B. | ||
Item 2. | ||
Item 3. | ||
Item 4. | ||
Item 5. | ||
Item 6. | ||
Item 7. | ||
Item 7A. | ||
Item 8. | ||
Item 9. | ||
Item 9A. | ||
Item 9B. | ||
Item 10. | ||
Item 11. | ||
Item 12. | ||
Item 13. | ||
Item 14. | ||
Item 15. | ||
Continues on next page
Lam Research Corporation 2017 10-K 2
PART I
CAUTIONARY STATEMENT REGARDING FORWARD-LOOKING STATEMENTS
With the exception of historical facts, the statements contained in this discussion are forward-looking statements, which are subject to the safe harbor provisions created by the Private Securities Litigation Reform Act of 1995. Certain, but not all, of the forward-looking statements in this report are specifically identified as forward-looking, by use of phrases and words such as “believe,” “anticipate,” “expect,” “plan,” “aim,” “may,” “should,” “could,” “would,” “continue,” and other future-oriented terms. The identification of certain statements as “forward-looking” does not mean that other statements not specifically identified are not forward-looking. Forward-looking statements include but are not limited to statements that relate to: trends and opportunities in the global economic environment and the semiconductor industry; the anticipated levels of, and rates of change in, future shipments, margins, market share, capital expenditures, research and development expenditures, international sales, revenue, and operating expenses generally; management’s plans and objectives for our current and future operations and business focus; volatility in our quarterly results; customer and end user requirements and our ability to satisfy those requirements; customer capital spending and their demand for our products, and the reliability of indicators of change in customer spending and demand; the effect of variability in our customers’ business plans on demand for our equipment and services; changes in demand for our products and in our market share resulting from, among other things, increases in our customers’ proportion of capital expenditure (with respect to certain technology inflections); hedging transactions; our ability to defend our market share; and to gain new market share; our ability to obtain and qualify alternative sources of supply; factors that affect our tax rates; anticipated growth in the industry and the total market for wafer fabrication equipment and our growth relative to such growth; the success of joint development and collaboration relationships with customers, suppliers, or others; outsourced activities; the role of component suppliers in our business; our leadership and competency, and their ability to facilitate innovation; our ability to continue to, including the underlying factors that, create sustainable differentiation; the resources invested to comply with evolving standards and the impact of such efforts; the estimates we make, and the accruals we record, in order to implement our critical accounting policies (including but not limited to the adequacy of prior tax payments, future tax liabilities, and the adequacy of our accruals relating to them); our access to capital markets; our intention to pay quarterly dividends and the amounts thereof, if any; our ability and intention to repurchase our shares; our ability to manage and grow our cash position; and the sufficiency of our financial resources to support future business activities (including but not limited to operations, investments, debt service requirements, and capital expenditures). Such statements are based on current expectations and are subject to risks, uncertainties, and changes in condition, significance, value, and effect, including without limitation those discussed below under the heading “Risk Factors” within Item 1A and elsewhere in this report and other documents we file from time to time with the Securities and Exchange Commission (“SEC”), such as our quarterly reports on Form 10-Q and our current reports on Form 8-K. Such risks, uncertainties, and changes in condition, significance, value, and effect could cause our actual results to differ materially from those expressed in this report and in ways not readily foreseeable. Readers are cautioned not to place undue reliance on these forward-looking statements, which speak only as of the date hereof and are based on information currently and reasonably known to us. We do not undertake any obligation to release the results of any revisions to these forward-looking statements, which may be made to reflect events or circumstances that occur after the date of this report or to reflect the occurrence or effect of anticipated or unanticipated events.
Item 1. | Business |
Incorporated in 1980, Lam Research Corporation (“Lam Research,” “Lam,” “we,” “our,” “us,” or “the Company”) is a Delaware corporation, headquartered in Fremont, California. We maintain a network of facilities throughout Asia, Europe, and the United States in order to meet the needs of our dynamic customer base.
Additional information about Lam Research is available on our website at www.lamresearch.com. The content on any website referred to in this Form 10-K is not a part of or incorporated by reference in this Form 10-K unless expressly noted.
Continues on next page
Lam Research Corporation 2017 10-K 3
Our Annual Report on Form 10-K, Quarterly Reports on Forms 10-Q, Current Reports on Forms 8-K, Proxy Statements and all other filings we make with the SEC are available on our website as soon as reasonably practical after we file them with or furnish them to the SEC and are also available online at the SEC’s website at www.sec.gov.
The Lam Research logo, Lam Research, and all product and service names used in this report are either registered trademarks or trademarks of Lam Research Corporation or its subsidiaries in the United States and/or other countries. All other marks mentioned herein are the property of their respective holders.
We are a global supplier of innovative wafer fabrication equipment and services to the semiconductor industry. We have built a strong global presence with core competencies in areas like nanoscale applications enablement, chemistry, plasma and fluidics, advanced systems engineering and a broad range of operational disciplines. Our products and services are designed to help our customers build smaller, faster, and better performing devices that are used in a variety of electronic products, including mobile phones, personal computers, servers, wearables, automotive devices, storage devices, and networking equipment. Our vision is to realize full value from natural technology extensions of our company.
Our customer base includes leading semiconductor memory, foundry, and integrated device manufacturers (“IDMs”) that make products such as non-volatile memory (“NVM”), DRAM memory, and logic devices. We aim to increase our strategic relevance with our customers by contributing more to their continued success. Our core technical competency is integrating hardware, process, materials, software, and process control enabling results on the wafer.
Semiconductor manufacturing, our customers’ business, involves the complete fabrication of multiple dies or integrated circuits (“ICs”) on a wafer. This involves the repetition of a set of core processes and can require hundreds of individual steps. Fabricating these devices requires highly sophisticated process technologies to integrate an increasing array of new materials with precise control at the atomic scale. Along with meeting technical requirements, wafer processing equipment must deliver high productivity and be cost-effective.
Demand from cloud computing (the “Cloud”), the Internet of Things (“IoT”), and other markets is driving the need for increasingly powerful and cost-efficient semiconductors. At the same time, there are growing technical challenges with traditional two-dimensional scaling. These trends are driving significant inflections in semiconductor manufacturing, such as the increasing importance of vertical scaling strategies like three-dimensional (“3D”) architectures as well as multiple patterning to enable shrinks.
These demand and technology inflections have significantly expanded our addressable markets from about 26% of wafer fabrication equipment (“WFE”) spending in calendar year 2013 to about 34% in calendar year 2016. We believe we are in a strong position with our leadership and competency in deposition, etch, and single wafer clean to facilitate some of the most significant innovations in semiconductor device manufacturing. Several factors create opportunity for sustainable differentiation for us: (i) our focus on research and development, with several on-going programs relating to sustaining engineering, product and process development, and concept and feasibility; (ii) our ability to effectively leverage cycles of learning from our broad installed base; and (iii) our collaborative focus with semi-ecosystem partners.
We also address processes for back-end wafer-level packaging (“WLP”), which is an alternative to traditional wire bonding and can offer a smaller form factor, increased interconnect speed and bandwidth, and lower power consumption, among other benefits. In addition, our products are well-suited for related markets that rely on semiconductor processes and require production-proven manufacturing capability, such as complementary metal-oxide-semiconductor (“CMOS”) image sensors (“CIS”) and micro-electromechanical systems (“MEMS”).
Our Customer Support Business Group (“CSBG”) provides products and services to maximize installed equipment performance, predictability, and operational efficiency. We offer a broad range of services to deliver value throughout the lifecycle of our equipment, including customer service, spares, upgrades, and refurbishment of our deposition, etch, and clean products. Many of the technical advances that we introduce in our newest products are also available as upgrades, which provide customers with a cost-effective strategy for extending the performance and capabilities of their existing wafer fabrication lines. Additionally, CSBG provides new and refurbished previous-generation (legacy) equipment for those applications that do not require the most advanced wafer processing capability.
Continues on next page
Lam Research Corporation 2017 10-K 4
Products
Thin Film Deposition
In leading-edge semiconductor designs, metal deposition processes face significant scaling and integration challenges. For advanced copper interconnect structures, challenges for electrochemical deposition (“ECD”) include providing complete, void-free fill of high aspect ratio (“HAR”) structures with low defectivity and high productivity. Electroplating of copper and other metals is also used for through-silicon via (“TSV”) and WLP applications, such as forming conductive bumps and redistribution layers (“RDLs”). These applications require excellent within-wafer uniformity with high plating rates, minimal defects, and cost competitiveness. For tungsten chemical vapor deposition (“CVD”)/atomic layer deposition (“ALD”) processes, key requirements are minimizing contact resistance to meet lower power consumption requirements and achieving void-free fill for narrow nanoscale structures. In addition, good barrier step coverage at reduced thicknesses relative to physical vapor deposition (“PVD”)/CVD barrier films is also needed to improve contact fill and reduce resistivity.
In dielectric deposition, high-productivity, high-quality films are needed for a number of critical patterning and gapfill applications. For example, atomic layer deposition is required for front-end-of-line (“FEOL”) transistor structures and back-end-of-line (“BEOL”) self-aligned multiple patterning schemes to deposit highly conformal and uniform films. For NVM applications, high-quality conformal films are needed to form device isolation and ensure structural integrity. Plasma-enhanced CVD (“PECVD”) is used to deposit multiple dielectric films, including the alternating mold stack layers used in NVM memory and critical patterning layers for logic/foundry. These applications require excellent thickness uniformity, low defectivity, and stress control. For gapfill deposition, achieving defect-free fills while maintaining high throughput is essential. Preferred approaches are to use high-density plasma CVD (“HDP-CVD”) either as a complete gapfill solution or as a cap over other gapfill technologies to enhance process control and mitigate integration risks. Lastly, innovative post-deposition film treatments such as ultraviolet thermal processing (“UVTP”) are being used to improve low-k film integrity and increase strain in nitride layers for improved device performance.
Copper Metal Films — SABRE® Product Family
The SABRE ECD product family is the industry’s leading system for copper damascene manufacturing. Electrofill® technology is designed to provide high-throughput, void-free fill with superior defect density performance for advanced technology nodes. SABRE chemistry packages provide leading-edge fill performance for low defectivity, a wide process window, and high rates of bottom-up growth to fill the most challenging HAR features. System capabilities include deposition of copper directly on various liner materials, important for next-generation metallization schemes. The number of yielding ICs per wafer is optimized by increasing the usable die area through process edge exclusion engineering. Applications include copper deposition for both advanced logic and memory interconnect. We also offer the SABRE 3D system to address TSV and WLP applications, such as copper pillar, RDL, high-density fanout, underbump metallization, bumping, and microbumps used in post-TSV processing.
Tungsten Metal Films — ALTUS® Product Family
Our ALTUS systems deposit highly conformal atomic layer films for advanced tungsten metallization applications. The patented Multi-Station Sequential Deposition (“MSSD”) architecture enables a nucleation layer to be formed using Pulsed Nucleation Layer (“PNL”) technology and bulk CVD fill to be performed in the same chamber (“in situ”). PNL®, our ALD technology, is used in the deposition of tungsten nitride films to achieve high step coverage with reduced thickness relative to conventional barrier films. PNL is also used to reduce thickness and alter CVD bulk fill grain growth, lowering the overall resistivity of thin tungsten films. The advanced ExtremeFillTM CVD and LFW (low-fluorine tungsten) ALD technologies provide extendibility to fill the most challenging structures at advanced technology nodes. Applications include tungsten plug and via fill, NVM word lines, low-stress composite interconnects, and tungsten nitride barrier for via and contact metallization.
Continues on next page
Lam Research Corporation 2017 10-K 5
PECVD Dielectric Films — VECTOR® Product Family
The VECTOR family of PECVD systems delivers advanced thin film quality, wafer-to-wafer uniformity, productivity, and low cost of ownership. The MSSD architecture combines the required film performance with both sequential and parallel processing to provide flexibility for a range of applications. VECTOR products include specialized systems for logic and memory applications with multiple platform options. The Express platform offers a small footprint with four processing stations. Excel is a modular platform for advanced technology nodes where pre-and-post deposition treatments are needed. The Extreme platform accommodates up to 12 processing stations for high-throughput applications. Our Q platform accommodates up to 16 processing stations for depositing multi-stack films. Applications include deposition of oxides, nitrides, and carbides for hardmasks, multiple patterning films, anti-reflective layers, multi-layer stack films, and diffusion barriers.
ALD Dielectric Films — Striker® Product Family
The Striker family of ALD systems delivers highly conformal dielectric films for spacer-based patterning and liner applications in the most advanced memory and logic structures. The MSSD architecture combines the required film performance with both sequential and parallel processing modes to provide flexibility to deliver both precise control of critical dimensions and low cost of ownership. The unique capability to deliver tunable and high-quality films over a vast range of temperatures and process conditions allows the Striker family to deliver unique and high electrical quality films to support the most demanding logic, DRAM, NVM, and CIS applications. Striker products include specialized systems for logic and memory applications, with similar multiple platform options as are available for our VECTOR products. Applications include conformal deposition of dielectric films for spacers and liners.
Gapfill Dielectric Films — SPEED® Product Family
The SPEED HDP-CVD products are designed to provide void-free gapfill of high-quality dielectric films with superior throughput and reliability. The unique source design provides for particle performance, while the ability to customize the deposition and in situ etching profile ensures across-wafer thickness and gapfill uniformity. Together, the chamber and plasma source designs allow large batch sizes between cleans and faster cleans to deliver superior throughput. Broad process flexibility is available on the same platform, without requiring major hardware changes. Applications include shallow trench isolation (“STI”), pre-metal dielectrics, inter-layer dielectrics, inter-metal dielectrics, and passivation layers.
Film Treatment — SOLA® Product Family
The SOLA UVTP product family is used for treatment of BEOL low-k dielectric films and FEOL silicon nitride strained films. The systems incorporate a proprietary treatment process that modifies the physical characteristics of a previously deposited film through exposure to ultraviolet light, gases and vapors, and heat. The Multi-Station Sequential Processing (“MSSP”) architecture allows independent control of temperature, wavelength, and intensity at each station of the wafer path. We believe this enables delivery of best-in-class film properties, within-wafer and wafer-to-wafer uniformity, and productivity.
Plasma Etch
As the semiconductor industry continues to improve device performance and shrink critical feature sizes, plasma etch faces multiple challenges. These include processing smaller features, new materials, new transistor structures, increasingly complex film stacks, and ever higher aspect ratio structures. For conductor etch, requirements include delivering atomic-scale control for etching FinFET/3D gate transistors, multi-film stacks for high-k/metal gate structures, and multiple patterning structures. Dielectric etch processes must be able to maintain etch profiles on increasingly HAR structures such as in NVM devices, etch new multi-layer photoresist materials and amorphous carbon hardmasks, and avoid damaging fragile low-k materials. In emerging 3D ICs, TSVs are now used to provide interconnect capability for die-to-die and wafer-to-wafer stacking. Critical factors for TSV are etching a variety of materials in situ, as well as being able to use both conventional and special techniques for deep silicon etching. For all etch processes, it is important to provide excellent profile control and across-wafer uniformity while maintaining high productivity and cost efficiency.
Continues on next page
Lam Research Corporation 2017 10-K 6
Conductor Etch — Kiyo® Product Family, Versys® Metal Product Family
The Kiyo product family is designed to deliver high-performance, high-productivity, low-risk solutions for conductor etch applications. Uniformity, uniformity control, and repeatability are enabled by a symmetrical chamber design, electrostatic chuck technology, and independent tuning features. The Kiyo products deliver high productivity with low defectivity on multi-film stacks, enabled by in situ etch capability, continuous plasma, and advanced Waferless Autoclean technology. To address technology inflections in patterning, the Kiyo family offers state-of-the-art capability with our Hydra® technology, which enables extraordinary within-wafer uniformity for FEOL/BEOL process modules in NVM, DRAM and logic devices. In addition, Kiyo systems can be configured to perform atomic layer etching (“ALE”), which delivers atomic-scale variability control to enable next-generation wafer processing. Applications include FinFET gate, fin definition, STI, high-k/metal gate, and multiple patterning. The Versys Metal product family provides a flexible platform for BEOL metal etch processes. Symmetrical chamber design and independent tuning features provide critical dimension, profile uniformity, and uniformity control for metal hardmask applications. The products’ proprietary chamber cleaning technology ensures high availability, high yield, and exceptional process repeatability for BEOL processing. Applications include metal hardmask, multiple patterning, high-density aluminum line, and aluminum pad. For both Kiyo and Versys Metal families, multiple platforms options are available to address fab productivity needs; these include the 2300e4®, 2300e5®, and 2300e6® platforms.
Dielectric Etch — FlexTM Product Family
The Flex product family offers differentiated technologies and application-focused capabilities for critical dielectric etch applications. Uniformity, repeatability, and tunability are enabled by a multi-frequency, small-volume, confined plasma design. The systems deliver high productivity with low defectivity, enabled by in situ multi-step etch and continuous plasma capability. Low-risk, cost-effective upgrades provide evolutionary product transitions that extend product life and maximize return on investment. Applications include low-k and ultra low-k dual damascene, mask open, and high aspect ratio applications for DRAM capacitor cell, NVM hole, trench, and contact. In addition, Flex systems can be configured to perform ALE, which delivers atomic-scale variability control to enable next-generation wafer processing for applications such as self-aligned contacts. Multiple platforms are available - including 2300e4®, 2300e5®, 2300e6® - to address fab productivity needs.
TSV Etch — Syndion® Product Family
Based on our production-proven conductor etch products, the Syndion family provides low-risk, flexible solutions to address multiple TSV and CIS etch applications. The Syndion products provide a low cost of ownership due to high etch rates, excellent repeatability, and in situ etching of multiple materials in the TSV stack (silicon, dielectrics, conducting films). The systems support both conventional single-step etch and rapidly alternating process (“RAP”). High process flexibility, superior profile control, and excellent uniformity enable successful TSV implementation for a variety of complementary metal-oxide-semiconductor 3D IC and image sensor applications. Multiple platforms are available - including 2300e4®, 2300e5®, 2300e6® - to address fab productivity needs.
Single-Wafer Clean
Wafer cleaning is a critical function that must be repeated many times during the semiconductor manufacturing process, from device fabrication through packaging. As device geometries shrink and new materials are introduced, the number of cleaning steps continues to grow. Furthermore, each step has different selectivity and defectivity requirements that add to manufacturing complexity. For next-generation devices, fragile structures need to be cleaned without being damaged. In addition, cleaning steps that target the bevel region can help eliminate the potential source of yield-limiting defects at the wafer’s edge, thereby increasing the number of good die at the wafer’s edge and improving yield.
Wet Clean — EOS®, Da Vinci®, DV-Prime®, SP Series
Single-wafer spin technology pioneered the industry transition from batch to single-wafer wet processing. These production-proven spin wet clean systems provide the productivity and flexibility needed for both high-volume manufacturing and leading-edge development across multiple technology nodes and for all device types. The products deliver process uniformity across the wafer, wafer-to-wafer, and lot-to-lot. Proprietary technologies enhance damage-free particle removal and enable wafer drying without pattern collapse or watermarks. Offering the latest in dilute chemistry and solvent systems, the products meet defectivity and material integrity requirements. Applications include particle, polymer, and residue removal; photoresist removal; wafer backside/
Continues on next page
Lam Research Corporation 2017 10-K 7
bevel cleaning; and film removal. Our wet clean systems are also used for multiple wet etch and clean applications for WLP, including silicon substrate thinning, wafer stress relief, underbump metallization etch, and photoresist removal.
Plasma Bevel Clean — Coronus® Product Family
The Coronus plasma-based bevel clean products enhance die yield by removing particles, residues and unwanted films from the wafer’s edge that can impact the device area. The system combines the ability of plasma to selectively remove a wide variety of materials with a proprietary confinement technology that protects the die area. High system uptime and throughput, excellent process repeatability, and efficient in situ removal of multi-material film stacks and residues ensure high productivity for increased wafer output. Applications include post-etch, pre- and post-deposition, pre-lithography, and metal film removal to prevent arcing during plasma etch or deposition steps. It also provides a cost-effective bevel clean process to remove carbon-rich residues and films.
Legacy Products
For applications that do not require the most advanced wafer processing capability, semiconductor manufacturers can benefit from the proven performance of previous-generation products to increase their production capacity at a reduced economic investment. Purchasing through an original equipment manufacturer (“OEM”) like us minimizes the risks of unexpected costs and unpredictable time to production that are typically associated with the legacy equipment market. To meet semiconductor manufacturers’ needs for high-performance, maximum-predictability, and low-risk equipment, we provide new, refurbished, and legacy products to customers utilizing technology nodes at and above 28 nm. These products benefit from many of the technical advances from our newest systems, enabling extended lifetime and productivity. Our products also provide production-worthy, cost-effective solutions for MEMS, power semiconductor, radio frequency device, and light emitting diode (“LED”) markets.
Products Table
Market | Process/Application | Technology | Products | |||
Thin Film Deposition | Metal Films | ECD (Copper & Other) CVD, ALD (Tungsten) | SABRE® family ALTUS® family | |||
Dielectric Films | PECVD ALD Gapfill HDP-CVD | VECTOR® family Striker® family SPEED® family | ||||
Film Treatment | UVTP | SOLA® family | ||||
Plasma Etch | Conductor Etch | Reactive Ion Etch | Kiyo® family, Versys® Metal family | |||
Dielectric Etch | Reactive Ion Etch | FlexTM family | ||||
TSV Etch | Deep Reactive Ion Etch | Syndion® family | ||||
Single-Wafer Clean | Wafer Cleaning | Wet Clean | EOS®, DV-Prime®, Da Vinci®, SP Series | |||
Bevel Cleaning | Dry Plasma Clean | Coronus® family | ||||
Fiscal Periods Presented
All references to fiscal years apply to our fiscal years, which ended June 25, 2017, June 26, 2016, and June 28, 2015.
Research and Development
The market for semiconductor capital equipment is characterized by rapid technological change and product innovation. Our ability to achieve and maintain our competitive advantage depends in part on our continued and timely development of new products and enhancements to existing products. Accordingly, we devote a significant
Continues on next page
Lam Research Corporation 2017 10-K 8
portion of our personnel and financial resources to research and development (“R&D”) programs and seek to maintain close and responsive relationships with our customers and suppliers.
Our R&D expenses during fiscal years 2017, 2016, and 2015 were $1.0 billion, $914 million, and $825 million, respectively. The majority of R&D spending over the past three years has been targeted at deposition, etch, single-wafer clean, and other semiconductor manufacturing products. We believe current challenges for customers at various points in the semiconductor manufacturing process present opportunities for us.
We expect to continue to make substantial investments in R&D to meet our customers’ product needs, support our growth strategy, and enhance our competitive position.
Marketing, Sales, and Service
Our marketing, sales, and service efforts are focused on building long-term relationships with our customers and targeting product and service solutions designed to meet their needs. These efforts are supported by a team of product marketing and sales professionals as well as equipment and process engineers who work closely with individual customers to develop solutions for their wafer processing needs. We maintain ongoing service relationships with our customers and have an extensive network of service engineers in place throughout the United States, China, Europe, Japan, Korea, Southeast Asia, and Taiwan. We believe that comprehensive support programs and close working relationships with customers are essential to maintaining high customer satisfaction and our competitiveness in the marketplace.
We provide standard warranties for our systems. The warranty provides that systems will be free from defects in material and workmanship and will conform to agreed-upon specifications. The warranty is limited to repair of the defect or replacement with new or like-new equivalent goods and is valid when the buyer provides prompt notification within the warranty period of the claimed defect or non-conformity and also makes the items available for inspection and repair. We also offer extended warranty packages to our customers to purchase as desired.
International Sales
A significant portion of our sales and operations occur outside the United States and, therefore, may be subject to certain risks, including but not limited to tariffs and other barriers; difficulties in staffing and managing non-U.S. operations; adverse tax consequences; foreign currency exchange rate fluctuations; changes in currency controls; compliance with U.S. and international laws and regulations, including U.S. export restrictions; and economic and political conditions. Any of these factors may have a material adverse effect on our business, financial position, and results of operations and cash flows. For geographical reporting, revenue is attributed to the geographic location in which the customers’ facilities are located. Revenue by region was as follows:
Year Ended | |||||||||||
June 25, 2017 | June 26, 2016 | June 28, 2015 | |||||||||
(in thousands) | |||||||||||
Revenue: | |||||||||||
Korea | $ | 2,480,329 | $ | 1,057,331 | $ | 1,406,617 | |||||
Taiwan | 2,095,669 | 1,485,037 | 1,084,239 | ||||||||
Japan | 1,041,969 | 983,821 | 623,575 | ||||||||
China | 1,023,195 | 1,039,951 | 661,094 | ||||||||
United States | 629,937 | 495,123 | 890,891 | ||||||||
Southeast Asia | 401,877 | 605,236 | 278,350 | ||||||||
Europe | 340,644 | 219,394 | 314,546 | ||||||||
Total revenue | $ | 8,013,620 | $ | 5,885,893 | $ | 5,259,312 | |||||
Long-Lived Assets
Refer to Note 18 of our Consolidated Financial Statements, included in Item 8 of this report, for information concerning the geographic locations of long-lived assets.
Continues on next page
Lam Research Corporation 2017 10-K 9
Customers
Our customers include all of the world’s leading semiconductor manufacturers. Customers continue to establish joint ventures, alliances, and licensing arrangements which have the potential to positively or negatively impact our competitive position and market opportunities. Customers accounting for greater than 10% of total revenues in fiscal year 2017 included Micron Technology, Inc.; Samsung Electronics Company, Ltd.; SK hynix Inc.; Taiwan Semiconductor Manufacturing Company, Ltd; and Toshiba, Inc. Customers accounting for greater than 10% of total revenues in fiscal year 2016 included Micron Technology, Inc.; Samsung Electronics Company, Ltd.; SK hynix Inc.; and Taiwan Semiconductor Manufacturing Company, Ltd. Customers accounting for greater than 10% of total revenues in fiscal year 2015 included Micron Technology, Inc.; Samsung Electronics Company, Ltd.; and Taiwan Semiconductor Manufacturing Company, Ltd.
A material reduction in orders from our customers could adversely affect our results of operations and projected financial condition. Our business depends upon the expenditures of semiconductor manufacturers. Semiconductor manufacturers’ businesses, in turn, depend on many factors, including their economic capability, the current and anticipated market demand for ICs, and the availability of equipment capacity to support that demand.
Backlog
In general, we schedule production of our systems based upon our customers’ delivery requirements and forecasts. In order for a system to be included in our backlog, the following conditions must be met: (1) we have received a written customer request that has been accepted, (2) we have an agreement on prices and product specifications, and (3) there is a scheduled shipment within the next 12 months. In order for spares and services to be included in our backlog, the following conditions must be met: (1) we have received a written customer request that has been accepted and (2) delivery of products or provision of services is anticipated within the next 12 months. Where specific spare parts and customer service purchase contracts do not contain discrete delivery dates, we use volume estimates at the contract price and over the contract period, not to exceed 12 months, in calculating backlog amounts. Our policy is to revise our backlog for order cancellations and to make adjustments to reflect, among other things, changes in spares volume estimates and customer delivery date changes. As of June 25, 2017, and June 26, 2016, our backlog was $2.1 billion and $1.4 billion, respectively. Generally, orders for our products and services are subject to cancellation by our customers with limited penalties. Because some orders are received and shipped in the same quarter and because customers may change delivery dates and cancel orders, our backlog at any particular date is not necessarily indicative of business volumes or actual revenue levels for succeeding periods.
Manufacturing
Our manufacturing operations mainly consist of assembling and testing components, sub-assemblies, and modules that are then integrated into finished systems prior to shipment to or at the location of our customers. The assembly and testing of our products is conducted predominately in cleanroom environments.
We have agreements with third parties to outsource certain aspects of our manufacturing, production warehousing, and logistics functions. We believe that these outsourcing contracts provide us more flexibility to scale our operations up or down in a timely and cost-effective manner, enabling us to respond quickly to any changes in our business. We believe that we have selected reputable providers and have secured their performance on terms documented in written contracts. However, it is possible that one or more of these providers could fail to perform as we expect, and such failure could have an adverse impact on our business and have a negative effect on our operating results and financial condition. Overall, we believe we have effective mechanisms to manage risks associated with our outsourcing relationships. Refer to Note 15 of our Consolidated Financial Statements, included in Item 8 of this report, for further information concerning our outsourcing commitments.
Certain components and sub-assemblies that we include in our products may only be obtained from a single supplier. We believe that, in many cases, we could obtain and qualify alternative sources to supply these products. Nevertheless, any prolonged inability to obtain these components could have an adverse effect on our operating results and could unfavorably impact our customer relationships.
Continues on next page
Lam Research Corporation 2017 10-K 10
Environmental Matters
We are subject to a variety of governmental regulations related to the management of hazardous materials that we use in our business operations. We are currently not aware of any pending notices of violations, fines, lawsuits, or investigations arising from environmental matters that would have a material effect on our business. We believe that we are generally in compliance with these regulations and that we have obtained (or will obtain or are otherwise addressing) all necessary environmental permits to conduct our business. Nevertheless, the failure to comply with present or future regulations could result in fines being imposed on us, require us to suspend production or cease operations, or cause our customers to not accept our products. These regulations could require us to alter our current operations, to acquire significant additional equipment, or to incur substantial other expenses to comply with environmental regulations. Our failure to control the use, sale, transport, or disposal of hazardous substances could subject us to future liabilities.
Employees
As of August 10, 2017, we had approximately 9,400 regular employees globally. Although we have employment-related agreements with a number of key employees, these agreements do not guarantee continued service. Each of our employees is required to comply with our policies relating to maintaining the confidentiality of our non-public information.
In the semiconductor and semiconductor capital equipment industries, competition for highly skilled employees is intense. Our future success depends, to a significant extent, upon our continued ability to attract and retain qualified employees, particularly in the R&D and customer support functions.
Competition
The semiconductor capital equipment industry is characterized by rapid change and is highly competitive throughout the world. To compete effectively, we invest significant financial resources targeted to strengthen and enhance our product and services portfolio and to maintain customer service and support locations globally. Semiconductor manufacturers evaluate capital equipment suppliers in many areas, including but not limited to process performance, productivity, defect control, customer support, and overall cost of ownership, which can be affected by many factors such as equipment design, reliability, software advancements, and similar factors. Our ability to succeed in the marketplace depends upon our ability to maintain existing products and introduce product enhancements and new products that meet customer requirements on a timely basis. In addition, semiconductor manufacturers must make a substantial investment to qualify and integrate new capital equipment into semiconductor production lines. As a result, once a semiconductor manufacturer has selected a particular supplier’s equipment and qualified it for production, the manufacturer generally maintains that selection for that specific production application and technology node as long as the supplier’s products demonstrate performance to specification in the installed base. Accordingly, we may experience difficulty in selling to a given customer if that customer has qualified a competitor’s equipment. We must also continue to meet the expectations of our installed base of customers through the delivery of high-quality and cost-efficient spare parts in the presence of competition from third-party spare parts providers.
We face significant competition with all of our products and services. Our primary competitor in the tungsten CVD, PECVD, HDP-CVD, ECD, and PVD markets is Applied Materials, Inc. In the PECVD market, in addition to Applied Materials, Inc., we also compete against ASM International and Wonik IPS. In the etch market, our primary competitors are Applied Materials, Inc., Hitatchi, Ltd., and Tokyo Electron, Ltd., and Our primary competitors in the wet clean market are Screen Holding Co., Ltd.; Semes Co., Ltd.; and Tokyo Electron, Ltd.
We face competition from a number of established and emerging companies in the industry. We expect our competitors to continue to improve the design and performance of their current products and processes, to introduce new products and processes with enhanced price/performance characteristics, and to provide more comprehensive offerings of products. If our competitors make acquisitions or enter into strategic relationships with leading semiconductor manufacturers, or other entities, covering products similar to those we sell, our ability to sell our products to those customers could be adversely affected. Strategic investments to encourage local semiconductor manufacturing and supply chain in China could increase competition from domestic equipment manufacturers in China. There can be no assurance that we will continue to compete successfully in the future.
Continues on next page
Lam Research Corporation 2017 10-K 11
Patents and Licenses
Our policy is to seek patents on inventions relating to new or enhanced products and processes developed as part of our ongoing research, engineering, manufacturing, and support activities. We currently hold a number of U.S. and foreign patents covering various aspects of our products and processes. We believe that the duration of our patents generally exceeds the useful life of the technologies and processes disclosed and claimed in them. Our patents, which cover material aspects of our past and present core products, have current durations ranging from approximately one to twenty years. We believe that, although the patents we own and may obtain in the future will be of value, they alone will not determine our success. Our success depends principally upon our research and development, engineering, marketing, support, and delivery skills. However, in the absence of patent protection, we may be vulnerable to competitors who attempt to imitate our products, manufacturing techniques, and processes. In addition, other companies and inventors may receive patents that contain claims applicable or similar to our products and processes. The sale of products covered by patents of others could require licenses that may not be available on terms acceptable to us, or at all. For further discussion of legal matters, see Item 3, “Legal Proceedings,” of this report.
Executive Officers of the Company
As of August 10, 2017, the executive officers of Lam Research were as follows:
Name | Age | Title | ||
Martin B. Anstice | 50 | President and Chief Executive Officer | ||
Timothy M. Archer | 50 | Executive Vice President and Chief Operating Officer | ||
Douglas R. Bettinger | 50 | Executive Vice President, Chief Financial Officer, and Chief Accounting Officer | ||
Richard A. Gottscho | 65 | Executive Vice President, Corporate Chief Technology Officer | ||
Patrick J. Lord | 51 | Group Vice President, Customer Support Business Group (“CSBG”) | ||
Sarah A. O’Dowd | 67 | Senior Vice President, Chief Legal Officer and Secretary | ||
Vahid Vahedi | 51 | Group Vice President, Etch Business Unit | ||
Sesha Varadarajan | 42 | Group Vice President, Deposition Business Unit | ||
Martin B. Anstice has been our president and chief executive officer since January 2012. Mr. Anstice joined us in April 2001 as senior director, operations controller, was promoted to the position of managing director and corporate controller in May 2002, and was promoted to group vice president and chief financial officer in June 2004. He was appointed executive vice president and chief operating officer in September 2008 and president in December 2010. Prior to joining us, he held various finance positions from 1988 to 1999 at Raychem Corporation, a global materials science company. Subsequent to the acquisition of Raychem by Tyco International, a global provider of engineered electronic components, network solutions, and wireless systems, he assumed responsibility for supporting mergers and acquisitions activities of Tyco Electronics. Mr. Anstice is an Associate member of the Institute of Chartered Management Accountants in the United Kingdom.
Timothy M. Archer joined us in June 2012 as our executive vice president, chief operating officer. Prior to joining us, he spent 18 years at Novellus Systems, Inc., (“Novellus”) in various technology development and business leadership roles, including most recently as chief operating officer from January 2011 to June 2012; executive vice president of Worldwide Sales, Marketing, and Customer Satisfaction from September 2009 to January 2011; and executive vice president of the PECVD and Electrofill Business Units from November 2008 to September 2009. His tenure at Novellus also included assignments as senior director of technology for Novellus Systems Japan from 1999 to 2001 and senior director of technology for the Electrofill Business Unit from April 2001 to April 2002. He started his career in 1989 at Tektronix, where he was responsible for process development for high-speed bipolar ICs. Mr. Archer completed the Program for Management Development at the Harvard Graduate School of Business and earned a B.S. degree in applied physics from the California Institute of Technology.
Douglas R. Bettinger is our executive vice president, chief financial officer, and chief accounting officer with responsibility for finance, tax, treasury, information technology, and investor relations. Prior to joining the Company in 2013, Mr. Bettinger served as senior vice president and chief financial officer of Avago Technologies
Continues on next page
Lam Research Corporation 2017 10-K 12
from 2008 to 2013. From 2007 to 2008, he served as vice president of Finance and corporate controller at Xilinx, Inc., and from 2004 to 2007, he was chief financial officer at 24/7 Customer, a privately held company. Mr. Bettinger worked at Intel Corporation from 1993 to 2004, where he held several senior-level finance positions, including corporate planning and reporting controller and Malaysia site operations controller. Mr. Bettinger earned an M.B.A. degree in finance from the University of Michigan and a B.S. degree in economics from the University of Wisconsin in Madison.
Richard A. Gottscho is our executive vice president, corporate chief technology officer, a position he has held since May 2017. Prior to that time, he had been executive vice president, Global Products Group beginning in August 2010; and group vice president and general manager, Etch Businesses beginning in March 2007. He joined us in January 1996 and has served at various director and vice president levels in support of etch products, CVD products, and corporate research. Prior to joining us, he was a member of Bell Laboratories for 15 years, where he started his career working in plasma processing. During his tenure at Bell, he headed research departments in electronics materials, electronics packaging, and flat panel displays. He is the author of numerous papers, patents, and lectures in plasma processing and process control. He is a recipient of the American Vacuum Society’s Peter Mark Memorial Award and Plasma Science and Technology Division Prize, the Gaseous Electronics Conference Foundation Lecturer, the Dry Process Symposium Nishizawa Award, and the Tegal Thinker Award. He is a fellow of the American Physical and American Vacuum Societies, has served on numerous editorial boards of refereed technical publications and program committees for major conferences in plasma science and engineering, and was vice-chair of a National Research Council study on plasma science in the 1980s. In 2016, Dr. Gottscho was elected to the U.S. National Academy of Engineering. Dr. Gottscho earned Ph.D. and B.S. degrees in physical chemistry from the Massachusetts Institute of Technology and Pennsylvania State University, respectively.
Patrick J. Lord is our group vice president and general manager of the Customer Support Business Group, a position he has held since December 2016. Previously, Dr. Lord held the position of group vice president and deputy general manager of the Global Products Group from September 2013 to December 2016. He served as the head of the Direct Metals, GapFill, Surface Integrity Group, and Integrated Metals (“DGSI”) Business Units between June 2012 and September 2013. Prior to the acquisition of Novellus in June 2012, Dr. Lord was senior vice president and general manager of the DGSI Business Units at Novellus. Additionally, Dr. Lord held the position of senior vice president of Business Development and Strategic Planning. He joined Novellus in 2001 and held a number of other positions, including executive vice president and general manager of the CMP Business Unit, senior director of Business Development, senior director of Strategic Marketing, and acting vice president of Corporate Marketing. Before joining Novellus, Dr. Lord spent six years at KLA-Tencor Corporation (“KLA-Tencor”) in various product marketing and management roles. He earned his Ph.D., M.S., and B.S. degrees in mechanical engineering from the Massachusetts Institute of Technology.
Sarah A. O’Dowd is our senior vice president, chief legal officer and secretary. She joined us in September 2008 as group vice president and chief legal officer, responsible for general legal matters, intellectual property and ethics, and compliance. In addition to her Legal function, in April 2009 she was appointed vice president of Human Resources and served in this dual capacity through May 2012. Prior to joining us, she was vice president and general counsel for FibroGen, Inc., from February 2007 until September 2008. Until February 2007, Ms. O’Dowd was a shareholder in the law firm of Heller Ehrman LLP for more than 20 years, practicing in the areas of corporate securities, governance, and mergers and acquisitions for a variety of clients, principally publicly traded high-technology companies. She served in a variety of leadership and management roles at Heller Ehrman, including managing partner of the Silicon Valley and San Diego offices, member of the firm’s Policy Committee, and, as head of the firm’s business practice groups, a member of the firm’s Executive Committee. Ms. O’Dowd earned her J.D. and M.A. degrees in communications from Stanford Law School and Stanford University, respectively, and her B.A. degree in mathematics from Immaculata College.
Vahid Vahedi is our group vice president of the Etch Business Unit, a position he has held since March 2012. Previously, he served as vice president of Etch Business Product Management and Marketing, vice president of Dielectric Etch, vice president of Conductor and 3DIC Etch, and director of Conductor Etch Technology Development. He joined us in 1995. He earned his Ph.D., M.S., and B.S. degrees in electrical engineering and computer science from the University of California at Berkeley.
Sesha Varadarajan is our group vice president of the Deposition Business Unit, a position he has held since September 2013. Previously, he served as the head of the PECVD/Electrofill Business Unit between June 2012
Continues on next page
Lam Research Corporation 2017 10-K 13
and September 2013. Prior to joining us, Mr. Varadarajan was senior vice president and general manager of Novellus’ PECVD and Electrofill Business Units. He joined Novellus in 1999 as a process engineer with the Electrofill Business Unit and held various roles in that business unit before being appointed director of technology in 2004. Between 2006 and 2008, he worked in the PECVD Business Unit, initially as director of technology, until being promoted to product general manager. In 2009, he returned to the Electrofill Business Unit as vice president and general manager. In mid-2011, he was promoted to senior vice president and general manager, where he was also responsible for the PECVD Business Unit. Mr. Varadarajan earned an M.S. degree in manufacturing engineering and material science from Boston University and a B.S. degree in mechanical engineering from the University of Mysore.
Item 1A. | Risk Factors |
In addition to the other information in this Annual Report on Form 10-K (“2017 Form 10-K”), the following risk factors should be carefully considered in evaluating the Company and its business because such factors may significantly impact our business, operating results, and financial condition. As a result of these risk factors, as well as other risks discussed in our other SEC filings, our actual results could differ materially from those projected in any forward-looking statements. No priority or significance is intended, nor should be attached, to the order in which the risk factors appear.
The Semiconductor Capital Equipment Industry Is Subject to Variability and Periods of Rapid Growth or Decline; We Therefore Face Risks Related to Our Strategic Resource Allocation Decisions
The semiconductor capital equipment industry has historically been characterized by rapid changes in demand. The industry environment has moved toward being more characterized by variability across segments and customers accentuated by consolidation within the industry. Variability in our customers’ business plans may lead to changes in demand for our equipment and services, which could negatively impact our results. The variability in our customers’ investments during any particular period is dependent on several factors, including but not limited to electronics demand, economic conditions (both general and in the semiconductor and electronics industries), industry supply and demand, prices for semiconductors, and our customers’ ability to develop and manufacture increasingly complex and costly semiconductor devices. The changes in demand may require our management to adjust spending and other resources allocated to operating activities.
During periods of rapid growth or decline in demand for our products and services, we face significant challenges in maintaining adequate financial and business controls, management processes, information systems, and procedures for training and managing our workforce, and in appropriately sizing our supply chain infrastructure and facilities, work force, and other components of our business on a timely basis. If we do not adequately meet these challenges during periods of increasing or declining demand, our gross margins and earnings may be negatively impacted.
We continuously reassess our strategic resource allocation choices in response to the changing business environment. If we do not adequately adapt to the changing business environment, we may lack the infrastructure and resources to scale up our business to meet customer expectations and compete successfully during a period of growth, or we may expand our capacity too rapidly and/or beyond what is appropriate for the actual demand environment, resulting in excess fixed costs.
Especially during transitional periods, resource allocation decisions can have a significant impact on our future performance, particularly if we have not accurately anticipated industry changes. Our success will depend, to a significant extent, on the ability of our executive officers and other members of our senior management to identify and respond to these challenges effectively.
Continues on next page
Lam Research Corporation 2017 10-K 14
Future Declines in the Semiconductor Industry, and the Overall World Economic Conditions on Which It Is Significantly Dependent, Could Have a Material Adverse Impact on Our Results of Operations and Financial Condition
Our business depends on the capital equipment expenditures of semiconductor manufacturers, which in turn depend on the current and anticipated market demand for integrated circuits. With the consolidation of customers within the industry, the semiconductor capital equipment market may experience rapid changes in demand driven both by changes in the market generally and the plans and requirements of particular customers. The economic, political, and business conditions occurring nationally, globally, or in any of our key sales regions, which are often unpredictable, have historically impacted customer demand for our products and normal commercial relationships with our customers, suppliers, and creditors. Additionally, in times of economic uncertainty, our customers’ budgets for our products, or their ability to access credit to purchase them, could be adversely affected. This would limit their ability to purchase our products and services. As a result, changing business or economic conditions can cause material adverse changes to our results of operations and financial condition, including but not limited to:
• | a decline in demand for our products or services; |
• | an increase in reserves on accounts receivable due to our customers’ inability to pay us; |
• | an increase in reserves on inventory balances due to excess or obsolete inventory as a result of our inability to sell such inventory; |
• | valuation allowances on deferred tax assets; |
• | restructuring charges; |
• | asset impairments including the potential impairment of goodwill and other intangible assets; |
• | a decline in the value of our investments; |
• | exposure to claims from our suppliers for payment on inventory that is ordered in anticipation of customer purchases that do not come to fruition; |
• | a decline in the value of certain facilities we lease to less than our residual value guarantee with the lessor; and |
• | challenges maintaining reliable and uninterrupted sources of supply. |
Fluctuating levels of investment by semiconductor manufacturers may materially affect our aggregate shipments, revenues, operating results, and earnings. Where appropriate, we will attempt to respond to these fluctuations with cost management programs aimed at aligning our expenditures with anticipated revenue streams, which sometimes result in restructuring charges. Even during periods of reduced revenues, we must continue to invest in R&D and maintain extensive ongoing worldwide customer service and support capabilities to remain competitive, which may temporarily harm our profitability and other financial results.
Our Quarterly Revenues and Operating Results Are Variable
Our revenues and operating results may fluctuate significantly from quarter to quarter due to a number of factors, not all of which are in our control. We manage our expense levels based in part on our expectations of future revenues. Because our operating expenses are based in part on anticipated future revenues, and a certain amount of those expenses are relatively fixed, a change in the timing of recognition of revenue and/or the level of gross profit from a small number of transactions can unfavorably affect operating results in a particular quarter. Factors that may cause our financial results to fluctuate unpredictably include but are not limited to:
• | economic conditions in the electronics and semiconductor industries in general and specifically the semiconductor equipment industry; |
• | the size and timing of orders from customers; |
• | consolidation of the customer base, which may result in the investment decisions of one customer or market having a significant effect on demand for our products or services; |
• | procurement shortages; |
• | the failure of our suppliers or outsource providers to perform their obligations in a manner consistent with our expectations; |
• | manufacturing difficulties; |
• | customer cancellations or delays in shipments, installations, and/or customer acceptances; |
• | the extent that customers continue to purchase and use our products and services in their business; |
• | our customers’ reuse of existing and installed products, to the extent that such reuse decreases their need to purchase new products or services; |
Continues on next page
Lam Research Corporation 2017 10-K 15
• | changes in average selling prices, customer mix, and product mix; |
• | our ability to develop, introduce, and market new, enhanced, and competitive products in a timely manner; |
• | our competitors’ introduction of new products; |
• | legal or technical challenges to our products and technologies; |
• | transportation, communication, demand, information technology, or supply disruptions based on factors outside our control, such as strikes, acts of God, wars, terrorist activities, and natural or man-made disasters; |
• | legal, tax, accounting, or regulatory changes (including but not limited to change in import/export regulations) or changes in the interpretation or enforcement of existing requirements; |
• | changes in our estimated effective tax rate; |
• | foreign currency exchange rate fluctuations; and |
• | the dilutive impact of our Convertible Notes (as defined below) and related warrants on our earnings per share. |
We May Incur Impairments to Goodwill or Long-Lived Assets
We review our long-lived assets, including goodwill and other intangible assets, for impairment annually or whenever events or changes in circumstances indicate that the carrying amount of these assets may not be recoverable. Negative industry or economic trends, including reduced market prices of our Common Stock, reduced estimates of future cash flows, disruptions to our business, slower growth rates, or lack of growth in our relevant business units, could lead to impairment charges against our long-lived assets, including goodwill and other intangible assets. If, in any period, our stock price decreases to the point where our fair value, as determined by our market capitalization, is less than the book value of our assets, this could also indicate a potential impairment, and we may be required to record an impairment charge in that period, which could adversely affect our result of operations.
Our valuation methodology for assessing impairment requires management to make judgments and assumptions based on historical experience and to rely heavily on projections of future operating performance. We operate in a highly competitive environment and projections of future operating results and cash flows may vary significantly from actual results. Additionally, if our analysis indicates potential impairment to goodwill in one or more of our business units, we may be required to record additional charges to earnings in our financial statements, which could negatively affect our results of operations.
Our Leverage and Debt Service Obligations and Potential Note Conversion or Related Hedging Activities May Adversely Affect Our Financial Condition, Results of Operations, and Earnings per Share
We have $2.9 billion in aggregate principal amount of senior unsecured notes and convertible note instruments outstanding. Additionally, we have $750 million available to us in revolving credit arrangements, with an option for us to request an increase in the facility of up to an additional $250 million, for a potential total commitment of $1.0 billion. We may, in the future, decide to borrow amounts under the revolving credit agreement, or to enter into additional debt arrangements.
In addition, we have entered, and in the future may enter, into derivative instrument arrangements to hedge against the variability of cash flows due to changes in the benchmark interest rate of fixed rate debt. We could be exposed to losses in the event of nonperformance by the counterparties to our derivative instruments.
Our indebtedness could have adverse consequences, including:
• | risk associated with any inability to satisfy our obligations; |
• | a portion of our cash flows that may have to be dedicated to interest and principal payments and may not be available for operations, working capital, capital expenditures, expansion, acquisitions, or general corporate or other purposes; and |
• | impairing our ability to obtain additional financing in the future. |
Our ability to meet our expenses and debt obligations will depend on our future performance, which will be affected by financial, business, economic, regulatory, and other factors. Furthermore, our operations may not generate sufficient cash flows, particularly in the United States, to enable us to meet our expenses and service our debt. As a result, we may need to enter into new financing arrangements to obtain the necessary funds. If we
Continues on next page
Lam Research Corporation 2017 10-K 16
determine it is necessary to seek additional funding for any reason, we may not be able to obtain such funding or, if funding is available, obtain it on acceptable terms. If we fail to make a payment on our debt, we could be in default on such debt, and this default could cause us to be in default on our other outstanding indebtedness.
Conversion of our Convertible Notes and the exercise of the related warrants may cause dilution to our stockholders and to our earnings per share. The number of shares of our Common Stock into which the Convertible Notes are convertible and for which related warrants are exercisable for may be adjusted from time to time, including increases in such rates as a result of dividends that we pay to our stockholders. Upon conversion of any Convertible Notes, we will deliver cash in the amount of the principal amount of the Convertible Notes and, with respect to any excess conversion value greater than the principal amount of the Convertible Notes, shares of our Common Stock, which would result in dilution to our stockholders. This dilution may not be completely mitigated by the hedging transactions we entered into in connection with the sale of certain Convertible Notes or through share repurchases. Prior to the maturity of the Convertible Notes, if the price of our Common Stock exceeds the conversion price, U.S. generally accepted accounting principles require that we report an increase in diluted share count, which would result in lower reported earnings per share. The price of our Common Stock could also be affected by sales of our Common Stock by investors who view the Convertible Notes as a more attractive means of equity participation in our company and also by hedging activity that may develop involving our Common Stock by holders of the Convertible Notes.
Our Credit Agreements Contain Covenant Restrictions That May Limit Our Ability to Operate Our Business
We may be unable to respond to changes in business and economic conditions, engage in transactions that might otherwise be beneficial to us, or obtain additional financing because our debt agreements contain, and any of our other future similar agreements may contain, covenant restrictions that limit our ability to, among other things:
• | incur additional debt, assume obligations in connection with letters of credit, or issue guarantees; |
• | create liens; |
• | enter into transactions with our affiliates; |
• | sell certain assets; and |
• | merge or consolidate with any person. |
Our ability to comply with these covenants is dependent on our future performance, which will be subject to many factors, some of which are beyond our control, including prevailing economic conditions. In addition, our failure to comply with these covenants could result in a default under the Senior Notes, the Convertible Notes, or our other debt, which could permit the holders to accelerate such debt. If any of our debt is accelerated, we may not have sufficient funds available to repay such debt, which could materially and negatively affect our financial condition and results of operation.
We Have a Limited Number of Key Customers
Sales to a limited number of large customers constitute a significant portion of our overall revenue, shipments, cash flows, collections, and profitability. As a result, the actions of even one customer may subject us to variability in those areas that is difficult to predict. In addition, large customers may be able to negotiate requirements that result in decreased pricing, increased costs, and/or lower margins for us; compliance with specific environmental, social, and corporate governance standards; and limitations on our ability to share jointly developed technology with others. Similarly, significant portions of our credit risk may, at any given time, be concentrated among a limited number of customers so that the failure of even one of these key customers to pay its obligations to us could significantly impact our financial results.
Continues on next page
Lam Research Corporation 2017 10-K 17
We Depend on Creating New Products and Processes and Enhancing Existing Products and Processes for Our Success. Consequently, We Are Subject to Risks Associated with Rapid Technological Change
Rapid technological changes in semiconductor manufacturing processes subject us to increased pressure to develop technological advances that enable those processes. We believe that our future success depends in part upon our ability to develop and offer new products with improved capabilities and to continue to enhance our existing products. If new products or existing products have reliability, quality, design, or safety problems, our performance may be impacted by reduced orders, higher manufacturing costs, delays in acceptance of and payment for new products, and additional service and warranty expenses. We may be unable to develop and manufacture products successfully, or products that we introduce may fail in the marketplace. For more than 25 years, the primary driver of technology advancement in the semiconductor industry has been to shrink the lithography that prints the circuit design on semiconductor chips. That driver could be approaching its technological limit, leading semiconductor manufacturers to investigate more complex changes in multiple technologies in an effort to continue technology development. In the face of uncertainty on which technology solutions will become successful, we will need to focus our efforts on developing the technology changes that are ultimately successful in supporting our customer requirements. Our failure to develop and offer the correct technology solutions in a timely manner with productive and cost-effective products could adversely affect our business in a material way. Our failure to commercialize new products in a timely manner could result in loss of market share, unanticipated costs, and inventory obsolescence, which would adversely affect our financial results.
In order to develop new products and processes and enhance existing products and processes, we expect to continue to make significant investments in R&D, to investigate the acquisition of new products and technologies, to invest in or acquire such business or technologies, and to pursue joint development relationships with customers, suppliers, or other members of the industry. Our investments and acquisitions may not be as successful as we may expect, particularly as we seek to invest or acquire product lines and technologies that are new to us. We may find that acquisitions are not available to us, for regulatory or other reasons, and that we must therefore limit ourselves to collaboration and joint venture development activities, which do not have the same benefits as acquisitions. Pursuing development through collaboration and/or joint development activities rather than through an acquisition poses substantial challenges for management, including those related to aligning business objectives, sharing confidential information and intellectual property, sharing value with third parties, and realizing synergies that might have been available in an acquisition but are not available through a joint development project. We must manage product transitions and joint development relationships successfully, as the introduction of new products could adversely affect our sales of existing products and certain jointly developed technologies may be subject to restrictions on our ability to share that technology with other customers, which could limit our market for products incorporating those technologies. Future technologies, processes, or product developments may render our current product offerings obsolete, leaving us with non-competitive products, obsolete inventory, or both. Moreover, customers may adopt new technologies or processes to address the complex challenges associated with next-generation devices. This shift may result in a reduction in the size of our addressable markets or could increase the relative size of markets in which we either do not compete or have relatively low market share.
We Are Subject to Risks Relating to Product Concentration and Lack of Product Revenue Diversification
We derive a substantial percentage of our revenues from a limited number of products. Our products are priced up to approximately $10 million per system. As a result, the inability to recognize revenue on even a few systems can cause a significantly adverse impact on our revenues for a given quarter, and, in the longer term, the continued market acceptance of these products is critical to our future success. Our business, operating results, financial condition, and cash flows could therefore be adversely affected by:
• | a decline in demand for even a limited number of our products, |
• | a failure to achieve continued market acceptance of our key products, |
• | export restrictions or other regulatory or legislative actions that could limit our ability to sell those products to key customers or customers within certain markets, |
• | an improved version of products being offered by a competitor in the markets in which we participate, |
• | increased pressure from competitors that offer broader product lines, |
• | technological changes that we are unable to address with our products, or |
• | a failure to release new or enhanced versions of our products on a timely basis. |
Continues on next page
Lam Research Corporation 2017 10-K 18
In addition, the fact that we offer limited product lines creates the risk that our customers may view us as less important to their business than our competitors that offer additional products and/or product capabilities. This may impact our ability to maintain or expand our business with certain customers. Such product concentration may also subject us to additional risks associated with technology changes. Our business is affected by our customers’ use of our products in certain steps in their wafer fabrication processes. Should technologies change so that the manufacture of semiconductors requires fewer steps using our products, this could have a larger impact on our business than it would on the business of our less concentrated competitors.
Strategic Alliances and Customer Consolidation May Have Negative Effects on Our Business
Increasingly, semiconductor manufacturing companies are entering into strategic alliances or consolidating with one another to expedite the development of processes and other manufacturing technologies and/or achieve economies of scale. The outcomes of such an alliance can be the definition of a particular tool set for a certain function and/or the standardization of a series of process steps that use a specific set of manufacturing equipment, while the outcomes of consolidation can lead to an overall reduction in the market for semiconductor manufacturing equipment as customers’ operations achieve economies of scale and/or increased purchasing power based on their higher volumes. In certain instances, this could work to our disadvantage if a competitor’s tools or equipment become the standard equipment for such functions or processes. Additional outcomes of such consolidation may include our customers re-evaluating their future supplier relationships to consider our competitors’ products and/or gaining additional influence over the pricing of products and the control of intellectual property.
Similarly, our customers may partner with, or follow the lead of, educational or research institutions that establish processes for accomplishing various tasks or manufacturing steps. If those institutions utilize a competitor’s equipment when they establish those processes, it is likely that customers will tend to use the same equipment in setting up their own manufacturing lines. Even if they select our equipment, the institutions and the customers that follow their lead could impose conditions on acceptance of that equipment, such as adherence to standards and requirements or limitations on how we license our proprietary rights, that increase our costs or require us to take on greater risk. These actions could adversely impact our market share and financial results.
We Depend on a Limited Number of Key Suppliers and Outsource Providers, and We Run the Risk That They Might Not Perform as We Expect
Outsource providers and component suppliers have played and will continue to play a key role in our manufacturing operations, field installation and support, and many of our transactional and administrative functions, such as information technology, facilities management, and certain elements of our finance organization. These providers and suppliers might suffer financial setbacks, be acquired by third parties, become subject to exclusivity arrangements that preclude further business with us, or be unable to meet our requirements or expectation due to their independent business decisions or force majeure events that could interrupt or impair their continued ability to perform as we expect.
Although we attempt to select reputable providers and suppliers and we attempt to secure their performance on terms documented in written contracts, it is possible that one or more of these providers or suppliers could fail to perform as we expect, or fail to secure or protect intellectual property rights, and such failure could have an adverse impact on our business. In some cases, the requirements of our business mandate that we obtain certain components and sub-assemblies included in our products from a single supplier or a limited group of suppliers. Where practical, we endeavor to establish alternative sources to mitigate the risk that the failure of any single provider or supplier will adversely affect our business, but this is not feasible in all circumstances. There is therefore a risk that a prolonged inability to obtain certain components or secure key services could impair our ability to manage operations, ship products, and generate revenues, which could adversely affect our operating results and damage our customer relationships.
We Face Risks Related to the Disruption of Our Primary Manufacturing Facilities
Our manufacturing facilities are concentrated in just a few locations. These locations are subject to disruption for a variety of reasons, such as natural or man-made disasters, terrorist activities, disruptions of our information technology resources, and utility interruptions. Such disruptions may cause delays in shipping our products,
Continues on next page
Lam Research Corporation 2017 10-K 19
which could result in the loss of business or customer trust, adversely affecting our business and operating results.
Once a Semiconductor Manufacturer Commits to Purchase a Competitor’s Semiconductor Manufacturing Equipment, the Manufacturer Typically Continues to Purchase That Competitor’s Equipment, Making It More Difficult for Us to Sell Our Equipment to That Customer
Semiconductor manufacturers must make a substantial investment to qualify and integrate wafer processing equipment into a semiconductor production line. We believe that once a semiconductor manufacturer selects a particular supplier’s processing equipment, the manufacturer generally relies upon that equipment for that specific production line application for an extended period of time, especially for customers that are more focused on tool reuse. Accordingly, we expect it to be more difficult to sell our products to a given customer if that customer initially selects a competitor’s equipment for the same product line application.
We Face a Challenging and Complex Competitive Environment
We face significant competition from multiple competitors, and with increased consolidation efforts in our industry, we may face increasing competitive pressures. Other companies continue to develop systems and/or acquire businesses and products that are competitive to ours and may introduce new products and product capabilities that may affect our ability to sell our existing products. We face a greater risk if our competitors enter into strategic relationships with leading semiconductor manufacturers covering products similar to those we sell or may develop, as this could adversely affect our ability to sell products to those manufacturers.
We believe that to remain competitive we must devote significant financial resources to offer products that meet our customers’ needs, to maintain customer service and support centers worldwide, and to invest in product and process R&D. Certain of our competitors, including those that are created and financially backed by foreign governments, have substantially greater financial resources and more extensive engineering, manufacturing, marketing, and customer service and support resources than we do and therefore have the potential to offer customers a more comprehensive array of products and/or product capabilities and to therefore achieve additional relative success in the semiconductor equipment industry. These competitors may deeply discount or give away products similar to those that we sell, challenging or even exceeding our ability to make similar accommodations and threatening our ability to sell those products. We also face competition from our own customers, who in some instances have established affiliated entities that manufacture equipment similar to ours. In addition, we face competition from companies that exist in a more favorable legal or regulatory environment than we do, allowing the freedom of action in ways that we may be unable to match. In many cases speed to solution is necessary for customer satisfaction and our competitors may be better positioned to achieve these objectives. For these reasons, we may fail to continue to compete successfully worldwide.
In addition, our competitors may be able to develop products comparable or superior to those we offer or may adapt more quickly to new technologies or evolving customer requirements. In particular, while we continue to develop product enhancements that we believe will address future customer requirements, we may fail in a timely manner to complete the development or introduction of these additional product enhancements successfully, or these product enhancements may not achieve market acceptance or be competitive. Accordingly, competition may intensify, and we may be unable to continue to compete successfully in our markets, which could have a material adverse effect on our revenues, operating results, financial condition, and/or cash flows.
Our Future Success Depends Heavily on International Sales and the Management of Global Operations
Non-U.S. sales, as reflected in Part 1 Item 1. Business, accounted for approximately 92%, 92%, and 83% of total revenue in fiscal years 2017, 2016, and 2015, respectively. We expect that international sales will continue to account for a substantial majority of our total revenue in future years.
We are subject to various challenges related to international sales and the management of global operations including, but not limited to:
• | trade balance issues; |
• | tariffs and other barriers; |
• | global or national economic and political conditions; |
• | changes in currency controls; |
Continues on next page
Lam Research Corporation 2017 10-K 20
• | differences in the enforcement of intellectual property and contract rights in varying jurisdictions; |
• | our ability to respond to customer and foreign government demands for locally sourced systems, spare parts, and services and develop the necessary relationships with local suppliers; |
• | compliance with U.S. and international laws and regulations affecting foreign operations, including U.S. and international trade restrictions and sanctions, anti-bribery, anti-corruption, environmental, tax, and labor laws; |
• | fluctuations in interest and foreign currency exchange rates; |
• | our ability to repatriate cash in a tax-efficient manner; |
• | the need for technical support resources in different locations; and |
• | our ability to secure and retain qualified people, and effectively manage people, in all necessary locations for the successful operation of our business. |
Certain international sales depend on our ability to obtain export licenses from the U.S. government. Our failure or inability to obtain such licenses would substantially limit our markets and severely restrict our revenues. Many of the challenges noted above are applicable in China, which is a fast developing market for the semiconductor equipment industry and therefore an area of potential significant growth for our business. As the business volume between China and the rest of the world grows, there is inherent risk, based on the complex relationships among China, Japan, Korea, Taiwan, and the United States, that political and diplomatic influences might lead to trade disruptions. This would adversely affect our business with China, Japan, Korea, and/or Taiwan and perhaps the entire Asia Pacific region. A significant trade disruption in these areas could have a materially adverse impact on our future revenue and profits. In addition, there are risks that the Chinese government may, among other things, insist on the use of local suppliers; compel companies that do business in China to partner with local companies to design and supply equipment on a local basis, requiring the transfer of intellectual property rights and/or local manufacturing; and provide special incentives to government-backed local customers to buy from local competitors, even if their products are inferior to ours; all of which could adversely impact our revenues and margins.
We are exposed to potentially adverse movements in foreign currency exchange rates. The majority of our sales and expenses are denominated in U.S. dollars. However, we are exposed to foreign currency exchange rate fluctuations primarily related to revenues denominated in Japanese yen and expenses denominated in euro and Korean won. Currently, we hedge certain anticipated foreign currency cash flows, primarily anticipated revenues denominated in Japanese yen and expenses dominated in euro and Korean won. In addition, we enter into foreign currency hedge contracts to minimize the short-term impact of the foreign currency exchange rate fluctuations on certain foreign currency monetary assets and liabilities, primarily third-party accounts receivables, accounts payables, and intercompany receivables and payables. We believe these are our primary exposures to currency rate fluctuation. We expect to continue to enter into hedging transactions, for the purposes outlined, for the foreseeable future. However, these hedging transactions may not achieve their desired effect because differences between the actual timing of the underlying exposures and our forecasts of those exposures may leave us either over or under hedged on any given transaction. Moreover, by hedging these foreign currency denominated revenues, expenses, monetary assets, and liabilities, we may miss favorable currency trends that would have been advantageous to us but for the hedges. Additionally, we are exposed to short-term foreign currency exchange rate fluctuations on non-U.S. dollar-denominated monetary assets and liabilities (other than those currency exposures previously discussed), and currently we do not enter into foreign currency hedge contracts against these exposures. Therefore, we are subject to potential unfavorable foreign currency exchange rate fluctuations to the extent that we transact business (including intercompany transactions) in these currencies.
The magnitude of our overseas business also affects where our cash is generated. Certain uses of cash, such as share repurchases, payment of dividends, or the repayment of our notes, can usually only be made with onshore cash balances. Since the majority of our cash is generated outside of the United States, this may impact certain business decisions and adversely affect business outcomes.
Our Ability to Attract, Retain, and Motivate Key Employees Is Critical to Our Success
Our ability to compete successfully depends in large part on our ability to attract, retain, and motivate key employees with the appropriate skills, experiences and competencies. This is an ongoing challenge due to intense competition for top talent, fluctuations in industry or business economic conditions, as well as increasing geographic expansion that may require cycles of hiring activity and workforce reductions. Our success in hiring
Continues on next page
Lam Research Corporation 2017 10-K 21
depends on a variety of factors, including the attractiveness of our compensation and benefit programs, global economic or political and industry conditions, our organizational structure, global competition for talent and the availability of qualified employees, the availability of career development opportunities, the ability to obtain necessary authorizations for workers to provide services outside their home countries, and our ability to offer a challenging and rewarding work environment. We periodically evaluate our overall compensation and benefit programs and make adjustments, as appropriate, to maintain or enhance their competitiveness. If we are not able to successfully attract, retain, and motivate key employees, we may be unable to capitalize on market opportunities and our operating results may be materially and adversely affected.
We Rely upon Certain Critical Information Systems for the Operation of Our Business That Are Susceptible to Cybersecurity and Other Threats or Incidents
We maintain and rely upon certain critical information systems for the effective operation of our business. These information systems include, but are not limited to, telecommunications, the Internet, our corporate intranet, various computer hardware and software applications, network communications, and email. These information systems may be owned and maintained by us, our outsourced providers, or third parties such as vendors, contractors, and Cloud providers. Many of these information systems and outsourced service providers, including certain hosted software applications that we use for storage of confidential data and data processing (e.g., company-related, whether intellectual property or not; customer-related; supplier-related; and/or employee-related), employ Cloud technology for such storage and data processing (which refers to an information technology hosting and delivery system in which data is not stored or processed within the user’s physical infrastructure but instead is delivered to and consumed by the user as an Internet-based service). All of these information systems are subject to disruption, breach or failure from sources including but not limited to attacks, degradation, and failures resulting from potential sources, including viruses, malware, denial of service, destructive or inadequate code, power failures, and physical damage to computers, hard drives, communication lines, and networking equipment. Confidential and/or sensitive information stored on these information systems or transmitted to or from Cloud storage could be intentionally or unintentionally compromised, lost, and/or stolen. While we have implemented ISO 27001 compliant security procedures and virus protection software, intrusion prevention systems, access control, and emergency recovery processes to mitigate the outlined risks with respect to information systems that are under our control, they cannot be guaranteed to be fail-safe and may be breached. Our inability to use or access these information systems at critical points in time, or unauthorized releases of proprietary or confidential information, could unfavorably impact the timely and efficient operation of our business, including our results of operations, and our reputation.
We have experienced cyber attacks. Although past attacks have not resulted in a material adverse effect, we may incur material losses related to cyber attacks in the future. The insurance we carry may not fully compensate us for the effects of potential losses arising from a cyber-related incident. Cyber-related incidents could result in:
• | disruptions to our operations; |
• | misappropriation or theft of Company, customer, supplier, or other’s assets or resources, including intellectual property and confidential information, and costs associated therewith; |
• | litigation with, or claims of damages arising from, our employees, customers, suppliers, or other third parties which whom we collaborate; or |
• | adverse impact to our results of operations, as a result of associated remediation costs such as those related to responding to potential regulatory inquiries, to rebuild the effected information systems, and those associated with improving our security and internal control environment. |
Our Financial Results May Be Adversely Impacted by Higher than Expected Tax Rates or Exposure to Additional Tax Liabilities
As a global company, our effective tax rate is highly dependent upon the geographic composition of worldwide earnings and tax regulations governing each region. We are subject to income taxes in the United States and various foreign jurisdictions, and significant judgment is required to determine worldwide tax liabilities. Our effective tax rate could be adversely affected by changes in the split of earnings between countries with differing statutory tax rates, in the valuation allowance of deferred tax assets, in tax laws, by material audit assessments, or changes in or expirations of agreements with tax authorities. These factors could affect our profitability. In particular, the carrying value of deferred tax assets, which are predominantly in the United States, is dependent
Continues on next page
Lam Research Corporation 2017 10-K 22
on our ability to generate future taxable income in the United States. In addition, the amount of income taxes we pay is subject to ongoing audits in various jurisdictions, and a material assessment by a governing tax authority could affect our profitability.
A Failure to Comply with Environmental Regulations May Adversely Affect Our Operating Results
We are subject to a variety of domestic and international governmental regulations related to the handling, discharge, and disposal of toxic, volatile, or otherwise hazardous chemicals. Failure to comply with present or future environmental regulations could result in fines being imposed on us, require us to suspend production, and/or cease operations, or cause our customers to not accept our products. These regulations could require us to alter our current operations, acquire significant additional equipment, incur substantial other expenses to comply with environmental regulations, or take other actions. Any failure to comply with regulations governing the use, handling, sale, transport, or disposal of hazardous substances could subject us to future liabilities that may adversely affect our operating results, financial condition, and ability to operate our business.
If We Choose to Acquire or Dispose of Businesses, Product Lines, and Technologies, We May Encounter Unforeseen Costs and Difficulties That Could Impair Our Financial Performance
An important element of our management strategy is to review acquisition prospects that would complement our existing products, augment our market coverage and distribution ability, or enhance our technological capabilities. As a result, we may seek to make acquisitions of complementary companies, products, or technologies, or we may reduce or dispose of certain product lines or technologies that no longer fit our long-term strategies. For regulatory or other reasons, we may not be successful in our attempts to acquire or dispose of businesses, products, or technologies, resulting in significant financial costs, reduced or lost opportunities, and diversion of management’s attention. Managing an acquired business, disposing of product technologies, or reducing personnel entails numerous operational and financial risks, including difficulties in assimilating acquired operations and new personnel or separating existing business or product groups, diversion of management’s attention away from other business concerns, amortization of acquired intangible assets, adverse customer reaction to our decision to cease support for a product, and potential loss of key employees or customers of acquired or disposed operations. There can be no assurance that we will be able to achieve and manage successfully any such integration of potential acquisitions, disposition of product lines or technologies, or reduction in personnel or that our management, personnel, or systems will be adequate to support continued operations. Any such inabilities or inadequacies could have a material adverse effect on our business, operating results, financial condition, and/or cash flows.
In addition, any acquisition could result in changes such as potentially dilutive issuances of equity securities, the incurrence of debt and contingent liabilities, the amortization of related intangible assets, and goodwill impairment charges, any of which could materially adversely affect our business, financial condition, results of operations, cash flows, and/or the price of our Common Stock.
The Market for Our Common Stock Is Volatile, Which May Affect Our Ability to Raise Capital or Make Acquisitions or May Subject Our Business to Additional Costs
The market price for our Common Stock is volatile and has fluctuated significantly over the past years. The trading price of our Common Stock could continue to be highly volatile and fluctuate widely in response to a variety of factors, many of which are not within our control or influence. These factors include but are not limited to the following:
• | general market, semiconductor, or semiconductor equipment industry conditions; |
• | economic or political events, trends, and unexpected developments occurring nationally, globally, or in any of our key sales regions; |
• | variations in our quarterly operating results and financial condition, including our liquidity; |
• | variations in our revenues, earnings, or other business and financial metrics from forecasts by us or securities analysts or from those experienced by other companies in our industry; |
• | announcements of restructurings, reductions in force, departure of key employees, and/or consolidations of operations; |
• | government regulations; |
• | developments in, or claims relating to, patent or other proprietary rights; |
Continues on next page
Lam Research Corporation 2017 10-K 23
• | technological innovations and the introduction of new products by us or our competitors; |
• | commercial success or failure of our new and existing products; |
• | disruptions of relationships with key customers or suppliers; or |
• | dilutive impacts of our Convertible Notes and related warrants. |
In addition, the stock market experiences significant price and volume fluctuations. Historically, we have witnessed significant volatility in the price of our Common Stock due in part to the price of and markets for semiconductors. These and other factors have and may again adversely affect the price of our Common Stock, regardless of our actual operating performance. In the past, following volatile periods in the price of their stock, many companies became the object of securities class action litigation. If we are sued in a securities class action, we could incur substantial costs, and it could divert management’s attention and resources and have an unfavorable impact on our financial performance and the price for our Common Stock.
Intellectual Property, Indemnity, and Other Claims Against Us Can Be Costly and We Could Lose Significant Rights That Are Necessary to Our Continued Business and Profitability
Third parties may assert infringement, unfair competition, product liability, breach of contract, or other claims against us. From time to time, other persons send us notices alleging that our products infringe their patent or other intellectual property rights. In addition, law enforcement authorities may seek criminal charges relating to intellectual property or other issues. We also face risks of claims arising from commercial and other relationships. In addition, our bylaws and other indemnity obligations provide that we will indemnify officers and members of our Board of Directors against losses that they may incur in legal proceedings resulting from their service to us. From time to time, in the normal course of business, we indemnify third parties with whom we enter into contractual relationships, including customers and suppliers, with respect to certain matters. We have agreed, under certain conditions, to hold these third parties harmless against specified losses, such as those arising from a breach of representations or covenants, other third-party claims that our products when used for their intended purposes infringe the intellectual property rights of such other third parties, or other claims made against certain parties. In such cases, it is our policy either to defend the claims or to negotiate licenses or other settlements on commercially reasonable terms. However, we may be unable in the future to negotiate necessary licenses or reach agreement on other settlements on commercially reasonable terms, or at all, and any litigation resulting from these claims by other parties may materially adversely affect our business and financial results, and we may be subject to substantial damage awards and penalties. Moreover, although we have insurance to protect us from certain claims and cover certain losses to our property, such insurance may not cover us for the full amount of any losses, or at all, and may be subject to substantial exclusions and deductibles.
We May Fail to Protect Our Critical Proprietary Technology Rights, Which Could Affect Our Business
Our success depends in part on our proprietary technology and our ability to protect key components of that technology through patents, copyrights, and trade secret protection. Protecting our key proprietary technology helps us to achieve our goals of developing technological expertise and new products and systems that give us a competitive advantage; increasing market penetration and growth of our installed base; and providing comprehensive support and service to our customers. As part of our strategy to protect our technology, we currently hold a number of U.S. and foreign patents and pending patent applications, and we keep certain information, processes, and techniques as trade secrets. However, other parties may challenge or attempt to invalidate or circumvent any patents the U.S. or foreign governments issue to us; these governments may fail to issue patents for pending applications; or we may lose trade secret protection over valuable information due to the intentional or unintentional actions or omissions of third parties, of ours, or even of our own employees. Additionally, intellectual property litigation can be expensive and time-consuming and even when patents are issued or trade secret processes are followed, the legal systems in certain of the countries in which we do business do not enforce patents and other intellectual property rights as rigorously as the United States. The rights granted or anticipated under any of our patents, pending patent applications, or trade secrets may be narrower than we expect or, in fact, provide no competitive advantages. Moreover, because we determine the jurisdictions in which to file patents at the time of filing, we may not have adequate protection in the future based on such previous decisions. Any of these circumstances could have a material adverse impact on our business.
Continues on next page
Lam Research Corporation 2017 10-K 24
We Are Exposed to Various Risks from Our Regulatory Environment
We are subject to various risks related to (1) new, different, inconsistent, or even conflicting laws, rules, and regulations that may be enacted by legislative bodies and/or regulatory agencies in the countries that we operate; (2) disagreements or disputes between national or regional regulatory agencies related to international trade; and (3) the interpretation and application of laws, rules, and regulations. As a public company with global operations, we are subject to the laws of multiple jurisdictions and the rules and regulations of various governing bodies, including those related to financial and other disclosures, corporate governance, privacy, anti-corruption, such as the Foreign Corrupt Practices Act and other local laws prohibiting corrupt payments to governmental officials, conflict minerals or other social responsibility legislation, immigration or travel regulations, and antitrust regulations, among others. Each of these laws, rules, and regulations imposes costs on our business, including financial costs and potential diversion of our management’s attention associated with compliance, and may present risks to our business, including potential fines, restrictions on our actions, and reputational damage if we are unable to fully comply.
To maintain high standards of corporate governance and public disclosure, we intend to invest all reasonably necessary resources to comply with all evolving standards. Changes in or ambiguous interpretations of laws, regulations, and standards may create uncertainty regarding compliance matters. Efforts to comply with new and changing regulations have resulted in, and are likely to continue to result in, increased selling, general, and administrative expenses and a diversion of management’s time and attention from revenue-generating activities to compliance activities. If we are found by a court or regulatory agency not to be in compliance with the laws and regulations, our business, financial condition, and/or results of operations could be adversely affected.
There Can Be No Assurance That We Will Continue to Declare Cash Dividends or Repurchase Our Shares at All or in Any Particular Amounts
Our Board of Directors has declared quarterly dividends since April 2014. Our intent to continue to pay quarterly dividends and to repurchase our shares is subject to capital availability and, in the case of dividends, periodic determinations by our Board of Directors that cash dividends are in the best interest of our stockholders and are in compliance with all laws and agreements applicable to the declaration and payment of cash dividends by us. Future dividends and share repurchases may also be affected by, among other factors, our views on potential future capital requirements for investments in acquisitions and the funding of our research and development; legal risks; changes in federal and state income tax laws or corporate laws; contractual restrictions, such as financial or operating covenants in our debt arrangements; availability of onshore cash flow; and changes to our business model. Our dividend payments and share repurchases may change from time to time, and we cannot provide assurance that we will continue to declare dividends or repurchase shares at all or in any particular amounts. A reduction or suspension in our dividend payments could have a negative effect on the price of our Common Stock.
Item 1B. | Unresolved Staff Comments |
None.
Item 2. | Properties |
Our executive offices and principal operating and R&D facilities are located in Fremont and Livermore, California; Tualatin, Oregon; and Villach, Austria. The majority of the Fremont and Livermore facilities are held under operating leases expiring in 2020 and 2021. The Villach facilities are held under capital leases expiring in calendar year 2021. Our Fremont, Livermore, and Villach leases include options to renew or purchase the facilities. In addition, we lease or own properties for our service, technical support, and sales personnel throughout the United States, China, Europe, Japan, Korea, Southeast Asia, and Taiwan and lease or own manufacturing facilities located in Ohio, and Korea. The Company owns two properties in Fremont, as well as the Tualatin facilities. Our facilities lease obligations are subject to periodic increases. We believe that our existing facilities are well-maintained and in good operating condition.
Continues on next page
Lam Research Corporation 2017 10-K 25
Item 3. | Legal Proceedings |
While we are not currently party to any legal proceedings that we believe are material, we are either a defendant or plaintiff in various actions that have arisen from time to time in the normal course of business, including intellectual property claims. We accrue for a liability when it is both probable that a liability has been incurred and the amount of the loss can be reasonably estimated. Significant judgment is required in both the determination of probability and the determination as to whether a loss is reasonably estimable. These accruals are reviewed at least quarterly and adjusted to reflect the effects of negotiations, settlements, rulings, advice of legal counsel, and other information and events pertaining to a particular matter. To the extent there is a reasonable possibility that the losses could exceed the amounts already accrued, we believe that the amount of any such additional loss would be immaterial to our business, financial condition, and results of operations.
Item 4. | Mine Safety Disclosures |
Not applicable.
Continues on next page
Lam Research Corporation 2017 10-K 26
PART II
Item 5. | Market for the Registrant’s Common Equity, Related Stockholder Matters, and Issuer Purchases of Equity Securities |
Stock Information
Our Common Stock is traded on the Nasdaq Global Select MarketSM under the symbol “LRCX.” As of August 10, 2017, we had 440 stockholders of record. In the second fiscal quarter of 2017 we increased our stockholders quarterly dividend to $0.45 per share; previous to that quarter of fiscal year 2017 and throughout fiscal year 2016, quarterly dividends of $0.30 per share were paid. The table below sets forth the high and low prices of our Common Stock as reported by the Nasdaq Stock Market, for the period indicated:
2017 | |||||||
High | Low | ||||||
First quarter | $ | 95.77 | $ | 79.15 | |||
Second quarter | $ | 108.60 | $ | 90.56 | |||
Third quarter | $ | 129.35 | $ | 105.30 | |||
Fourth quarter | $ | 167.05 | $ | 124.91 | |||
2016 | |||||||
High | Low | ||||||
First quarter | $ | 84.13 | $ | 61.20 | |||
Second quarter | $ | 80.85 | $ | 61.65 | |||
Third quarter | $ | 81.29 | $ | 63.10 | |||
Fourth quarter | $ | 87.19 | $ | 72.00 | |||
Repurchase of Company Shares
In November 2016, the Board of Directors authorized us to repurchase up to $1.0 billion of our Common Stock, which included the remaining value available under our prior authorization. These repurchases can be conducted on the open market or as private purchases and may include the use of derivative contracts with large financial institutions, in all cases subject to compliance with applicable law. Repurchases may be funded using our onshore cash and onshore cash generation, or our available debt instruments. This repurchase program has no termination date and may be suspended or discontinued at any time. As part of our share repurchase program, we may from time to time enter into structured share repurchase arrangements with financial institutions using general corporate funds.
On April 19, 2017, we entered into two separate accelerated share repurchase agreements (collectively, the “ASR”) with two financial institutions to repurchase a total of $500 million of our Common Stock. We took an initial delivery of approximately 2,570,000 shares, which represented 70% of the prepayment amount divided by our closing stock price on April 19, 2017. The total number of shares to be received under the ASR is based upon the average daily volume weighted average price of our Common Stock during the repurchase period, less an agreed upon discount. Following our fiscal year end, the counterparties designated June 30, 2017, as the termination date, at which time we settled the ASR. Approximately 780,000 shares were received at final settlement, which represented a weighted-average share price of approximately $149.16 for the transaction period.
Continues on next page
Lam Research Corporation 2017 10-K 27
Share repurchases, including those under the repurchase program, were as follows:
Period | Total Number of Shares Repurchased (1) | Average Price Paid per Share(2) | Total Number of Shares Purchased as Part of Publicly Announced Plans or Programs | Amount Available Under Repurchase Program | |||||||||
(in thousands, except per share data) | |||||||||||||
Available balance as of June 26, 2016 | $ | 229,094 | |||||||||||
Quarter ended September 25, 2016 | 20 | $ | 90.53 | — | 229,094 | ||||||||
Board-approved increase (November 2016) | 1,000,000 | ||||||||||||
Quarter ended December 25, 2016 | 735 | $ | 103.43 | 619 | 934,986 | ||||||||
Quarter ended March 26, 2017 | 1,826 | $ | 115.12 | 1,223 | 795,226 | ||||||||
March 27, 2017 - April 23, 2017 | 2,682 | $ | 128.27 | 2,672 | 282,141 | ||||||||
April 24, 2017 - May 21, 2017 | 5 | $ | 150.58 | — | 282,141 | ||||||||
May 22, 2017 - June 25, 2017 | 55 | $ | 154.92 | — | 282,141 | ||||||||
Total | 5,323 | $ | 137.39 | 4,514 | $ | 282,141 | |||||||
__________________________________
(1) | In addition to shares repurchased under the Board-authorized repurchase program, the Company acquired 809,427 shares at a total cost of $93.8 million which we withheld through net share settlements to cover minimum tax withholding obligations upon the vesting of restricted stock unit awards granted under our equity compensation plans. The shares retained through these net share settlements are not a part of the Board-authorized repurchase program, but instead are authorized under our equity compensation plans. |
(2) | Average price paid per share excludes effect of accelerated share repurchases, see additional disclosure above regarding our accelerated share repurchase activity during the fiscal year. |
Continues on next page
Lam Research Corporation 2017 10-K 28
Cumulative Five-Year Return
The graph below compares Lam Research Corporation’s cumulative five-year total shareholder return on Common Stock with the cumulative total returns of the Nasdaq Composite index, the Standard & Poor’s (“S&P”) 500 index, and the Philadelphia Semiconductor Sector Index. The graph tracks the performance of a $100 investment in our Common Stock and in each of the indices (with the reinvestment of all dividends) from June 30, 2012, to June 30, 2017.
COMPARISON OF FIVE-YEAR CUMULATIVE TOTAL RETURN* | |||
Among Lam Research Corporation, the Nasdaq Composite Index, the S&P 500 Index, and the Philadelphia Semiconductor Index | |||
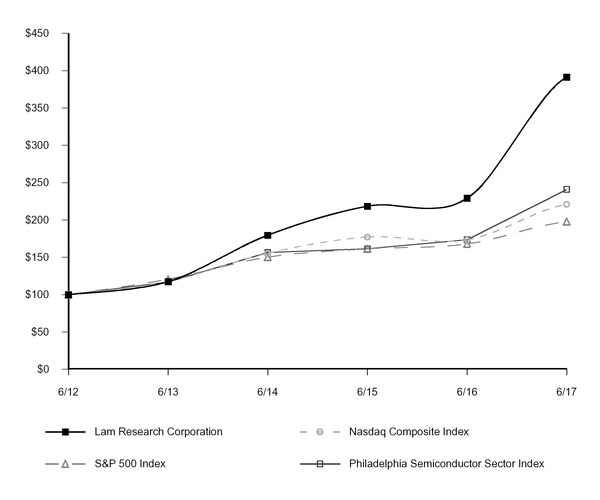
*$100 invested on 6/30/2012 in stock or index, including reinvestment of dividends. Fiscal years ending June 30.
Copyright © 2017 Standard & Poor’s, a division of S&P Global. All rights reserved.
Continues on next page
Lam Research Corporation 2017 10-K 29
6/12 | 6/13 | 6/14 | 6/15 | 6/16 | 6/17 | ||||||||||||
Lam Research Corporation | 100.00 | 117.49 | 179.56 | 218.44 | 229.31 | 391.30 | |||||||||||
Nasdaq Composite Index | 100.00 | 117.69 | 155.50 | 177.19 | 173.36 | 221.11 | |||||||||||
S&P 500 Index | 100.00 | 120.60 | 150.27 | 161.43 | 167.87 | 197.92 | |||||||||||
Philadelphia Semiconductor Sector Index | 100.00 | 116.96 | 156.62 | 161.36 | 173.61 | 241.00 | |||||||||||
Item 6. | Selected Financial Data |
Year Ended | ||||||||||||||||||||
June 25, 2017 | June 26, 2016 | June 28, 2015 | June 29, 2014 | June 30, 2013 | ||||||||||||||||
(in thousands, except per share data) | ||||||||||||||||||||
OPERATIONS: | ||||||||||||||||||||
Revenue | $ | 8,013,620 | $ | 5,885,893 | $ | 5,259,312 | $ | 4,607,309 | $ | 3,598,916 | ||||||||||
Gross margin | 3,603,359 | 2,618,922 | 2,284,336 | 2,007,481 | 1,403,059 | |||||||||||||||
Goodwill impairment (1) | — | — | 79,444 | — | — | |||||||||||||||
Restructuring charges, net | — | — | — | — | 1,813 | |||||||||||||||
Operating income | 1,902,132 | 1,074,256 | 788,039 | 677,669 | 118,071 | |||||||||||||||
Net income | 1,697,763 | 914,049 | 655,577 | 632,289 | 113,879 | |||||||||||||||
Net income per share: | ||||||||||||||||||||
Basic | $ | 10.47 | $ | 5.75 | $ | 4.11 | $ | 3.84 | $ | 0.67 | ||||||||||
Diluted | $ | 9.24 | $ | 5.22 | $ | 3.70 | $ | 3.62 | $ | 0.66 | ||||||||||
Cash dividends declared per common share | $ | 1.65 | $ | 1.20 | $ | 0.84 | $ | 0.18 | $ | — | ||||||||||
BALANCE SHEET: | ||||||||||||||||||||
Working capital | $ | 6,192,383 | $ | 6,795,109 | $ | 3,639,488 | $ | 3,201,661 | $ | 2,389,354 | ||||||||||
Total assets | 12,122,765 | 12,264,315 | (2) | 9,358,904 | (2) | 7,986,998 | (2) | 7,241,645 | (2) | |||||||||||
Long-term obligations, less current portion | 2,185,338 | 3,744,205 | (2) | 1,386,536 | (2) | 1,191,913 | (2) | 1,161,378 | (2) | |||||||||||
Current portion of long-term debt and capital leases | 908,439 | 947,733 | (2) | 1,355,705 | (2) | 518,267 | 514,655 | |||||||||||||
__________________________________
(1) | Goodwill impairment analysis during fiscal year 2015 resulted in a non-cash impairment charge to our Single-Wafer Clean reporting unit, extinguishing the goodwill ascribed to the reporting unit. |
(2) | Adjusted for effects of retrospective implementation of ASU 2015-3, see Notes 3 and 13 to the Consolidated Financial Statements contained in Part II, Item 8. |
Continues on next page
Lam Research Corporation 2017 10-K 30
Three Months Ended (1) | |||||||||||||||
June 25, 2017 | March 26, 2017 | December 25, 2016 | September 25, 2016 | ||||||||||||
unaudited (in thousands, except per share data) | |||||||||||||||
QUARTERLY FISCAL YEAR 2017: | |||||||||||||||
Revenue | $ | 2,344,907 | $ | 2,153,995 | $ | 1,882,299 | $ | 1,632,419 | |||||||
Gross margin | 1,068,961 | 971,404 | 846,797 | 716,197 | |||||||||||
Operating income | 607,939 | 538,418 | 439,828 | 315,947 | |||||||||||
Net income | 526,424 | 574,713 | 332,791 | 263,835 | |||||||||||
Net income per share | |||||||||||||||
Basic | $ | 3.25 | $ | 3.52 | $ | 2.05 | $ | 1.64 | |||||||
Diluted | $ | 2.82 | $ | 3.10 | $ | 1.81 | $ | 1.47 | |||||||
Number of shares used in per share calculations: | |||||||||||||||
Basic | 162,213 | 163,408 | 162,659 | 160,607 | |||||||||||
Diluted | 186,427 | 185,094 | 183,543 | 180,017 | |||||||||||
Three Months Ended (1) | |||||||||||||||
June 26, 2016 | March 27, 2016 | December 27, 2015 | September 27, 2015 | ||||||||||||
unaudited (in thousands, except per share data) | |||||||||||||||
QUARTERLY FISCAL YEAR 2016: | |||||||||||||||
Revenue | $ | 1,546,261 | $ | 1,314,055 | $ | 1,425,534 | $ | 1,600,043 | |||||||
Gross margin | 698,784 | 571,265 | 626,510 | 722,363 | |||||||||||
Operating income | 309,241 | 190,753 | 238,834 | 335,428 | |||||||||||
Net income | 258,939 | 143,451 | 222,980 | 288,679 | |||||||||||
Net income per share | |||||||||||||||
Basic | $ | 1.62 | $ | 0.90 | $ | 1.41 | $ | 1.82 | |||||||
Diluted | $ | 1.46 | $ | 0.82 | $ | 1.28 | $ | 1.66 | |||||||
Number of shares used in per share calculations: | |||||||||||||||
Basic | 159,862 | 159,039 | 158,424 | 158,352 | |||||||||||
Diluted | 177,649 | 174,373 | 174,242 | 174,374 | |||||||||||
__________________________________
(1) | Our reporting period is a 52/53-week fiscal year. The fiscal years ended June 25, 2017, and June 26, 2016, included 52 weeks. All quarters presented above included 13 weeks. |
Item 7. | Management’s Discussion and Analysis of Financial Condition and Results of Operations |
The following discussion of our financial condition and results of operations contains forward-looking statements, which are subject to risks, uncertainties, and changes in condition, significance, value, and effect. Our actual results could differ materially from those anticipated in the forward-looking statements as a result of certain factors, including but not limited to those discussed in “Risk Factors” and elsewhere in this 2017 Form 10-K and other documents we file from time to time with the Securities and Exchange Commission. (See “Cautionary Statement Regarding Forward-Looking Statements” in Part I of this 2017 Form 10-K.)
Management’s Discussion and Analysis of Financial Condition and Results of Operations (“MD&A”) provides a description of our results of operations and should be read in conjunction with our Consolidated Financial Statements and accompanying Notes to Consolidated Financial Statements included in this 2017 Form 10-K. MD&A consists of the following sections:
Executive Summary provides a summary of the key highlights of our results of operations and our management’s assessment of material trends and uncertainties relevant to our business.
Results of Operations provides an analysis of operating results.
Continues on next page
Lam Research Corporation 2017 10-K 31
Critical Accounting Policies and Estimates discusses accounting policies that reflect the more significant judgments and estimates used in the preparation of our Consolidated Financial Statements.
Liquidity and Capital Resources provides an analysis of cash flows, contractual obligations, and financial position.
Executive Summary
Lam Research has been an innovative supplier of wafer fabrication equipment and services to the semiconductor industry for more than 35 years. Our vision is to realize full value from natural technology extensions of our company. Our customer base includes leading semiconductor memory, foundry, and IDMs that make products such as NVM, DRAM memory, and logic devices. We aim to increase our strategic relevance with our customers by contributing more to their continued success. Our core technical competency is integrating hardware, process, materials, software, and process control enabling results on the wafer.
Our products and services are designed to help our customers build smaller, faster, and better performing devices that are used in a variety of electronic products, including mobile phones, personal computers, servers, wearables, automotive devices, storage devices, and networking equipment.
Semiconductor manufacturing, our customers’ business, involves the complete fabrication of multiple dies or integrated circuits on a wafer. This involves the repetition of a set of core processes and can require hundreds of individual steps. Fabricating these devices requires highly sophisticated process technologies to integrate an increasing array of new materials with precise control at the atomic scale. Along with meeting technical requirements, wafer processing equipment must deliver high productivity and be cost-effective.
Demand from the Cloud, IoT, and other markets is driving the need for increasingly powerful and cost-efficient semiconductors. At the same time, there are growing technical challenges with traditional two-dimensional scaling. These trends are driving significant inflections in semiconductor manufacturing, such as the increasing importance of vertical scaling strategies like 3D architectures as well as multiple patterning to enable shrinks.
We believe we are in an strong position with our leadership and competency in deposition, etch, and single-wafer clean to facilitate some of the most significant innovations in semiconductor device manufacturing. Several factors create opportunity for sustainable differentiation for us: our focus on research and development, with a breadth of programs across sustaining engineering, product and process development, and concept and feasibility; our ability to effectively leverage cycles of learning from our broad installed base; and our collaborative focus with ecosystem partners.
During the most recent fiscal year, demand for our products improved as semiconductor device manufacturers, particularly non volatile memory and foundry customers, made capacity and technology investments. Technology inflections in our industry, including NVM, multiple patterning, FinFET and advanced packaging have led to an increase in our served addressable market for our products in deposition, etch, single-wafer clean and customer service business. We believe that demand for our products and services should increase faster than overall spending on wafer fabrication equipment, as the proportion of customers’ capital expenditures rises in these technology inflection areas, and we continue to gain market share.
In October 2015, we entered into an Agreement and Plan of Merger and Reorganization with KLA-Tencor. On October 5, 2016, we announced that the parties mutually agreed to terminate that agreement.
Continues on next page
Lam Research Corporation 2017 10-K 32
The following summarizes certain key financial information for the periods indicated below:
Year Ended | |||||||||||||||||||||||||
June 25, 2017 | June 26, 2016 | June 28, 2015 | FY17 vs. FY16 | FY16 vs. FY15 | |||||||||||||||||||||
(in thousands, except per share data and percentages) | |||||||||||||||||||||||||
Revenue | $ | 8,013,620 | $ | 5,885,893 | $ | 5,259,312 | $ | 2,127,727 | 36.1 | % | $ | 626,581 | 11.9 | % | |||||||||||
Gross margin | $ | 3,603,359 | $ | 2,618,922 | $ | 2,284,336 | $ | 984,437 | 37.6 | % | $ | 334,586 | 14.6 | % | |||||||||||
Gross margin as a percent of total revenue | 45.0 | % | 44.5 | % | 43.4 | % | 0.5 | % | 1.1 | % | |||||||||||||||
Total operating expenses | $ | 1,701,227 | $ | 1,544,666 | $ | 1,496,297 | $ | 156,561 | 10.1 | % | $ | 48,369 | 3.2 | % | |||||||||||
Net income | $ | 1,697,763 | $ | 914,049 | $ | 655,577 | $ | 783,714 | 85.7 | % | $ | 258,472 | 39.4 | % | |||||||||||
Net income per diluted share | $ | 9.24 | $ | 5.22 | $ | 3.70 | $ | 4.02 | 77.0 | % | $ | 1.52 | 41.1 | % | |||||||||||
Revenues in fiscal year 2017 increased 36% compared to fiscal year 2016, and revenues in fiscal year 2016 increased 12% compared to fiscal year 2015, reflecting a continuous increase in technology and capacity investments by our customers.
The increase in gross margin as a percentage of revenue for fiscal year 2017 compared to fiscal year 2016 was primarily due to higher revenue and improved factory utilization resulting from higher production volume.
Fiscal year 2016 gross margin as a percentage of revenue compared to fiscal year 2015 improved primarily due to a more favorable customer and product mix.
Operating expenses in fiscal year 2017 increased as compared to fiscal year 2016 primarily as a result of continued investments in research and development including the effect of increased employee headcount, partially offset by a decrease in acquisition-related costs associated with the terminated agreement with KLA-Tencor.
Operating expenses in fiscal year 2016 increased as compared to fiscal year 2015 primarily as a result of continued investments in research and development and increased employee headcount. Fiscal year 2016 also included $51 million of acquisition-related costs associated with the terminated agreement with KLA-Tencor.
Our cash and cash equivalents, investments, and restricted cash and investments balances totaled approximately $6.3 billion as of June 25, 2017, compared to $7.1 billion as of June 26, 2016. Cash flow provided from operating activities was $2.0 billion for fiscal year 2017 compared to $1.4 billion for fiscal year 2016. Cash flow provided from operating activities in fiscal 2017 was primarily used for $1.7 billion of principal payments on debt instruments, $812 million in treasury stock purchases, $243 million in dividends paid to our stockholders, and $157 million of capital expenditures and are partially offset by $73 million of treasury stock reissuance and Common Stock issuance resulting from our employee equity-based compensation programs.
Results of Operations
Shipments and Backlog
Shipments for fiscal year 2017 were approximately $8.6 billion, an increase of 46% compared to fiscal year 2016. Shipments for fiscal year 2016 were approximately $5.9 billion, an increase of 8% compared to fiscal year 2015. The increase in shipments during the fiscal year 2017 as compared to the last two fiscal years is related to continued strengthening of customer demand for semiconductor equipment.
Continues on next page
Lam Research Corporation 2017 10-K 33
Year Ended | |||||||||||
June 25, 2017 | June 26, 2016 | June 28, 2015 | |||||||||
Shipments (in millions) | $ | 8,586 | $ | 5,901 | $ | 5,472 | |||||
Korea | 32 | % | 17 | % | 26 | % | |||||
Taiwan | 24 | % | 25 | % | 22 | % | |||||
Japan | 15 | % | 16 | % | 14 | % | |||||
China | 13 | % | 20 | % | 12 | % | |||||
United States | 8 | % | 8 | % | 15 | % | |||||
Southeast Asia | 4 | % | 11 | % | 5 | % | |||||
Europe | 4 | % | 3 | % | 6 | % | |||||
The percentage of total Lam semiconductor processing system shipments to each of the markets we serve were as follows for fiscal years 2017, 2016, and 2015.
Year Ended | ||||||||
June 25, 2017 | June 26, 2016 | June 28, 2015 | ||||||
Memory | 67 | % | 68 | % | 58 | % | ||
Foundry | 27 | % | 23 | % | 30 | % | ||
Logic/integrated device manufacturing | 6 | % | 9 | % | 12 | % | ||
Our shipments to memory customers during fiscal year 2017 was largely unchanged compared to fiscal year 2016. Foundry spending increased due to higher investments at leading-edge process nodes.
Unshipped orders in backlog as of June 25, 2017, were approximately $2.1 billion, an increase from approximately $1.4 billion as of June 26, 2016. Our unshipped orders backlog includes orders for systems, spares, and services. Please refer to “Backlog” in Part I Item 1, “Business” of this report for a description of our policies for adding to and adjusting backlog.
Revenue
Year Ended | |||||||||||
June 25, 2017 | June 26, 2016 | June 28, 2015 | |||||||||
Revenue (in millions) | $ | 8,014 | $ | 5,886 | $ | 5,259 | |||||
Korea | 31 | % | 18 | % | 27 | % | |||||
Taiwan | 26 | % | 25 | % | 21 | % | |||||
Japan | 13 | % | 17 | % | 12 | % | |||||
China | 13 | % | 18 | % | 12 | % | |||||
United States | 8 | % | 8 | % | 17 | % | |||||
Southeast Asia | 5 | % | 10 | % | 5 | % | |||||
Europe | 4 | % | 4 | % | 6 | % | |||||
The revenue increases in fiscal year 2017 compared to the last two fiscal years and in fiscal year 2016 compared to fiscal year 2015, reflect an increase in technology and capacity investments by our customers. Our revenue levels are generally correlated to the amount of shipments and our installation and acceptance timelines. The overall Asia region continues to account for a majority of our revenues as a substantial amount of the worldwide capacity additions for semiconductor manufacturing continues to occur in this region. Our deferred revenue balance was $966 million as of June 25, 2017, compared to $566 million as of June 26, 2016. Our deferred revenue balance does not include shipments to Japanese customers, to whom title does not transfer until customer acceptance. Shipments to Japanese customers are classified as inventory at cost until the time of customer acceptance. The anticipated future revenue value from shipments to Japanese customers was approximately $397 million as of June 25, 2017, compared to $132 million as of June 26, 2016.
Continues on next page
Lam Research Corporation 2017 10-K 34
Gross Margin
Year Ended | |||||||||||||||||||||||||
June 25, 2017 | June 26, 2016 | June 28, 2015 | FY17 vs. FY16 | FY16 vs. FY15 | |||||||||||||||||||||
(in thousands, except percentages) | |||||||||||||||||||||||||
Gross margin | $ | 3,603,359 | $ | 2,618,922 | $ | 2,284,336 | $ | 984,437 | 37.6 | % | $ | 334,586 | 14.6 | % | |||||||||||
Percent of total revenue | 45.0 | % | 44.5 | % | 43.4 | % | 0.5 | % | 1.1 | % | |||||||||||||||
The increase in gross margin as a percentage of revenue for fiscal year 2017 compared to fiscal year 2016 was primarily due to higher revenue and improved factory utilization resulting from higher production volume.
The increase in gross margin as a percentage of revenue for fiscal year 2016 compared to fiscal year 2015 was due to a more favorable customer mix and product mix. Additionally, there was a $10 million impairment charge of a long-lived asset in fiscal year 2015.
Research and Development
Year Ended | |||||||||||||||||||||||||
June 25, 2017 | June 26, 2016 | June 28, 2015 | FY17 vs. FY16 | FY16 vs. FY15 | |||||||||||||||||||||
(in thousands, except percentages) | |||||||||||||||||||||||||
Research & development | $ | 1,033,742 | $ | 913,712 | $ | 825,242 | $ | 120,030 | 13.1 | % | $ | 88,470 | 10.7 | % | |||||||||||
Percent of total revenue | 12.9 | % | 15.5 | % | 15.7 | % | (2.6 | )% | (0.2 | )% | |||||||||||||||
We continued to make significant R&D investments focused on leading-edge deposition, plasma etch, single wafer clean, and other semiconductor manufacturing requirements. The increase in R&D expense during fiscal year 2017 compared to fiscal year 2016 was primarily due to an $80 million increase in employee compensation and benefits related to increased headcount, a $20 million increase in depreciation and lab maintenance, a $9 million increase in outside services, and a $7 million increase in supplies.
The increase in R&D expense during fiscal year 2016 compared to fiscal year 2015 was primarily due to a $36 million increase in employee compensation and benefits related to increased headcount, a $14 million increase in facility and information technology related spending, a $14 million increase in supplies, a $12 million increase in depreciation and lab maintenance, and an $8 million increase in costs associated with campus consolidation.
Selling, General, and Administrative
Year Ended | |||||||||||||||||||||||||
June 25, 2017 | June 26, 2016 | June 28, 2015 | FY17 vs. FY16 | FY16 vs. FY15 | |||||||||||||||||||||
(in thousands, except percentages) | |||||||||||||||||||||||||
Selling, general, and administrative | $ | 667,485 | $ | 630,954 | $ | 591,611 | $ | 36,531 | 5.8 | % | $ | 39,343 | 6.7 | % | |||||||||||
Percent of total revenue | 8.3 | % | 10.7 | % | 11.2 | % | (2.4 | )% | (0.5 | )% | |||||||||||||||
The increase in selling, general, and administrative (“SG&A”) expense during fiscal year 2017 compared to fiscal year 2016 was primarily due to a $36 million increase in employee compensation and benefits from increased headcount, a $15 million gain from sale of assets in fiscal year 2016, and a $14 million increase in outside services, offset by a $41 million decrease in acquisition-related costs associated with the terminated agreement with KLA-Tencor.
Continues on next page
Lam Research Corporation 2017 10-K 35
The increase in SG&A expense during fiscal year 2016 compared to fiscal year 2015 was primarily due to $51 million of KLA-Tencor acquisition-related costs and a $3 million increase in restructuring charges. This increase was offset by a $15 million gain on sale of assets, net of associated exit costs.
Goodwill Impairment
Our annual goodwill impairment analysis for fiscal year 2015 resulted in a non-cash impairment charge upon our Single-Wafer Clean reporting unit of $79 million, extinguishing the goodwill ascribed to the reporting unit. Uncertainty surrounding future revenue growth in certain products resulted in the estimated discounted cash flow falling below the carrying value of the goodwill balance. There were no impairment charges in fiscal year 2017 or 2016.
Other Expense, Net
Other expense, net, consisted of the following:
Year Ended | |||||||||||||||||||||||||
June 25, 2017 | June 26, 2016 | June 28, 2015 | FY17 vs. FY16 | FY16 vs. FY15 | |||||||||||||||||||||
(in thousands) | |||||||||||||||||||||||||
Interest income | $ | 57,858 | $ | 29,512 | $ | 19,268 | $ | 28,346 | 96.0 | % | $ | 10,244 | 53.2 | % | |||||||||||
Interest expense | (117,734 | ) | (134,773 | ) | (73,682 | ) | $ | 17,039 | (12.7 | )% | $ | (61,091 | ) | 82.9 | % | ||||||||||
Gains (losses) on deferred compensation plan related assets, net | 17,880 | (3,995 | ) | 9,071 | $ | 21,875 | (547.6 | )% | $ | (13,066 | ) | (144.0 | )% | ||||||||||||
Loss on extinguishment of debt, net | (36,252 | ) | — | — | $ | (36,252 | ) | (100.0 | )% | $ | — | — | % | ||||||||||||
Foreign exchange (losses) gains, net | (569 | ) | 308 | 2,331 | $ | (877 | ) | (284.7 | )% | $ | (2,023 | ) | (86.8 | )% | |||||||||||
Other, net | (11,642 | ) | (5,191 | ) | (4,177 | ) | $ | (6,451 | ) | 125.7 | % | $ | (1,014 | ) | 24.3 | % | |||||||||
$ | (90,459 | ) | $ | (114,139 | ) | $ | (47,189 | ) | $ | 23,680 | (20.7 | )% | $ | (66,950 | ) | 141.9 | % | ||||||||
Interest income increased in fiscal year 2017 compared to fiscal years 2016 and 2015 primarily as a result of higher average cash and investment balances, as well as higher yield.
The decrease in interest expense during fiscal year 2017 compared to fiscal year 2016 was primarily due to the retirement of the 2016 Convertible Note. The increase in interest expense during fiscal year 2016 compared to fiscal year 2015 was primarily due to the $1.0 billion Senior Note issuance in March 2015, combined with the note issuance cost amortization related to the October 2015 bridge financing arrangement.
The gain on deferred compensation plan related assets, in fiscal year 2017, compared to a loss in fiscal year 2016 and gain in fiscal year 2015 was driven by a rally in the fair market value of the underlying funds at year end.
Loss on extinguishment of debt during fiscal year 2017 related to the special mandatory redemption of our 2023 and 2026 Notes, as well as the termination of the Amended and Restated Term Loan Agreement following the termination of the Agreement and Plan of Merger and Reorganization with KLA-Tencor.
Continues on next page
Lam Research Corporation 2017 10-K 36
Income Tax Expense
Year Ended | |||||||||||||||||||||||||
June 25, 2017 | June 26, 2016 | June 28, 2015 | FY17 vs. FY16 | FY16 vs. FY15 | |||||||||||||||||||||
(in thousands, except percentages) | |||||||||||||||||||||||||
Income tax expense | $ | 113,910 | $ | 46,068 | $ | 85,273 | $ | 67,842 | 147.3 | % | $ | (39,205 | ) | (46.0 | )% | ||||||||||
Effective tax rate | 6.3 | % | 4.8 | % | 11.5 | % | 1.5 | % | (6.7 | )% | |||||||||||||||
The increase in the effective tax rate in fiscal year 2017 as compared to fiscal year 2016 was primarily due to the change in the mix of income offset by the recognition of previously unrecognized tax benefits.
The decrease in the effective tax rate in fiscal year 2016 as compared to fiscal year 2015 was primarily due to the tax benefit of the Altera court ruling (discussed in more detail below), higher income in lower tax jurisdictions, and an increased federal tax benefit due to a retroactive and permanent extension of federal research and development tax credit in fiscal year 2016.
In July 2015, the U.S. Tax Court (the “Court”) issued an opinion favorable to Altera Corporation (“Altera”) with respect to Altera’s litigation with the Internal Revenue Service (“IRS”). The litigation relates to the treatment of stock-based compensation expense in an intercompany cost-sharing arrangement with Altera’s foreign subsidiary. In its opinion, the Court accepted Altera’s position of excluding stock-based compensation from its intercompany cost-sharing arrangement. However, the U.S. Department of the Treasury has not withdrawn the requirement to include stock-based compensation from its regulations. We have evaluated the opinion and as a result of such evaluation have recorded a tax benefit of $88 million related to reimbursement of cost share payments for the previously shared stock-based compensation costs. We have also recorded a tax benefit of $11 million related to stock-based compensation expense. In addition, we have recorded a tax liability of $74 million for the U.S. tax cost of potential repatriation of the associated contingent foreign earnings because at this time we cannot reasonably conclude that we have the ability and the intent to indefinitely reinvest these contingent earnings. We will continue to monitor this matter and related potential impacts to our consolidated financial statements.
International revenues account for a significant portion of our total revenues, such that a material portion of our pre-tax income is earned and taxed outside the United States at rates that are generally lower than in the United States. Please refer to Note 6 of our Consolidated Financial Statements.
Deferred Income Taxes
Deferred income taxes reflect the net tax effect of temporary differences between the carrying amounts of assets and liabilities for financial reporting purposes and the amounts used for income tax purposes, as well as the tax effect of carryforwards. Our gross deferred tax assets were $546 million and $465 million at the end of fiscal years 2017 and 2016, respectively. These gross deferred tax assets were offset by gross deferred tax liabilities of $585 million and $429 million at the end of fiscal years 2017 and 2016, respectively, and a valuation allowance of $114 million and $102 million at the end of fiscal years 2017 and 2016, respectively. The change in the gross deferred tax assets, gross deferred tax liabilities, and valuation allowance between fiscal year 2017 and 2016 is primarily due to an increase related to allowances and reserves and an increase in deferred tax liabilities related to an accrual for future tax liabilities due to the expected repatriation of foreign earnings of certain foreign subsidiaries.
As of our fiscal year end of June 25, 2017, we continue to record a valuation allowance to offset the entire California deferred tax asset balance due to the single sales factor apportionment election resulting in lower taxable income in California. We also recorded a valuation allowance on certain state tax credits and continue to record valuation allowances on certain foreign entities’ net operating losses. The valuation allowances were $114 million and $102 million at the end of fiscal years 2017 and 2016, respectively.
We evaluate if the deferred tax assets are realizable on a quarterly basis and will continue to assess the need for changes in valuation allowances, if any.
Continues on next page
Lam Research Corporation 2017 10-K 37
Uncertain Tax Positions
We re-evaluate uncertain tax positions on a quarterly basis. This evaluation is based on factors including, but not limited to, changes in facts or circumstances, changes in tax law, and effectively settled issues under audit. Such a change in recognition or measurement would result in the recognition of a tax benefit or an additional charge to the tax provision.
Critical Accounting Policies and Estimates
A critical accounting policy is defined as one that has both a material impact on our financial condition and results of operations and requires us to make difficult, complex and/or subjective judgments, often as a result of the need to make estimates about matters that are inherently uncertain. The preparation of financial statements in conformity with U.S. generally accepted accounting principles (“GAAP”) requires management to make certain judgments, estimates and assumptions that could affect the reported amounts of assets and liabilities at the date of the financial statements and the reported amounts of revenue and expenses during the reporting period. We base our estimates and assumptions on historical experience and on various other assumptions we believe to be applicable and evaluate them on an ongoing basis to ensure they remain reasonable under current conditions. Actual results could differ significantly from those estimates, which could have a material impact on our business, results of operations, and financial condition. Our critical accounting estimates include:
• | the recognition and valuation of revenue from multiple-element arrangements, which impacts revenue; |
• | the valuation of inventory, which impacts gross margin; |
• | the valuation of warranty reserves, which impacts gross margin; |
• | the valuation of equity-based compensation expense, including forfeiture estimates, which impacts both gross margin and operating expenses; |
• | the recognition and measurement of current and deferred income taxes, including the measurement of uncertain tax positions, which impact our provision for income tax expenses; and |
• | the valuation and recoverability of long-lived assets, which impacts gross margin and operating expenses when we record asset impairments or accelerate their depreciation or amortization. |
We believe that the following critical accounting policies reflect the more significant judgments and estimates used in the preparation of our consolidated financial statements regarding the critical accounting estimates indicated above. See Note 2, “Summary of Significant Accounting Policies,” of our Consolidated Financial Statements for additional information regarding our accounting policies.
Revenue Recognition: We recognize revenue when persuasive evidence of an arrangement exists, delivery has occurred and title has passed or services have been rendered, the selling price is fixed or determinable, collection of the receivable is reasonably assured, and we have received customer acceptance or are otherwise released from our customer acceptance obligations. If terms of the sale provide for a lapsing customer acceptance period, we recognize revenue upon the expiration of the lapsing acceptance period or customer acceptance, whichever occurs first. If the practices of a customer do not provide for a written acceptance or the terms of sale do not include a lapsing acceptance provision, we recognize revenue when it can be reliably demonstrated that the delivered system meets all of the agreed-to customer specifications. In situations with multiple deliverables, we recognize revenue upon the delivery of the separate elements to the customer and when we receive customer acceptance or are otherwise released from our customer acceptance obligations. We allocate revenue from multiple-element arrangements among the separate elements using their relative selling prices, based on our best estimate of selling price. Our sales arrangements do not include a general right of return. The maximum revenue recognized on a delivered element is limited to the amount that is not contingent upon the delivery of additional items. We generally recognize revenue related to sales of spare parts and system upgrade kits upon shipment. We generally recognize revenue related to services upon completion of the services requested by a customer order. We recognize revenue for extended maintenance service contracts with a fixed payment amount on a straight-line basis over the term of the contract. When goods or services have been delivered to the customer, but all conditions for revenue recognition have not been met, deferred revenue and deferred costs are recorded in deferred profit on our Consolidated Balance Sheet.
Inventory Valuation: Our policy is to assess the valuation of all inventories including manufacturing raw materials, work-in-process, finished goods, and spare parts in each reporting period. Obsolete inventory or inventory in excess of management’s estimated usage requirement is written down to its estimated market value if less than
Continues on next page
Lam Research Corporation 2017 10-K 38
cost. Estimates of market value include but are not limited to management’s forecasts related to our future manufacturing schedules, customer demand, technological and/or market obsolescence, general semiconductor market conditions, and possible alternative uses. If future customer demand or market conditions are less favorable than our projections, additional inventory write-downs may be required and would be reflected in cost of goods sold in the period in which we make the revision.
Warranty: We record a provision for estimated warranty expenses to cost of sales for each system when we recognize revenue. We periodically monitor the performance and cost of warranty activities, if actual costs incurred are different than our estimates, we may recognize adjustments to provisions in the period in which those differences arise or are identified. We do not maintain general or unspecified reserves; all warranty reserves are related to specific systems.
Equity-based Compensation: Employee Stock Purchase Plan (“ESPP”) and Employee Stock Plans: We determine the fair value of our restricted stock units (“RSUs”), excluding market-based performance RSUs, based upon the fair market value of our Common Stock at the date of grant, discounted for dividends. We estimate the fair value of our market-based performance RSUs using a Monte Carlo simulation model at the date of the grant. We estimate the fair value of our stock options and ESPP awards using a Black-Scholes option valuation model. This model requires the input of highly subjective assumptions, including expected stock price volatility and the estimated life of each award. We amortize the fair value of equity-based awards over the vesting periods of the award and we have elected to use the straight-line method of amortization. We estimate expected equity award forfeitures based on historical forfeiture rate activity and expected future employee turnover. We recognize the effect of adjustments made to the forfeiture rate, if any in the period that we change the forfeiture estimate.
Income Taxes: Deferred income taxes reflect the net tax effect of temporary differences between the carrying amount of assets and liabilities for financial reporting purposes and the amounts used for income tax purposes, as well as the tax effect of carryforwards. We record a valuation allowance to reduce our deferred tax assets to the amount that is more likely than not to be realized. Realization of our net deferred tax assets is dependent on future taxable income. We believe it is more likely than not that such assets will be realized; however, ultimate realization could be negatively impacted by market conditions and other variables not known or anticipated at this time. In the event that we determine that we would not be able to realize all or part of our net deferred tax assets, an adjustment would be charged to earnings in the period such determination is made. Likewise, if we later determine that it is more likely than not that the deferred tax assets would be realized, then the previously provided valuation allowance would be reversed.
We recognize the benefit from a tax position only if it is more likely than not that the position would be sustained upon audit based solely on the technical merits of the tax position. Our policy is to include interest and penalties related to unrecognized tax benefits as a component of income tax expense.
Long-lived assets: We review goodwill at least annually for impairment. If certain events or indicators of impairment occur between annual impairment tests, we will perform an impairment test at that date. In testing for a potential impairment of goodwill, we: (1) allocate goodwill to the reporting units to which the acquired goodwill relates; (2) estimate the fair value of our reporting units; and (3) determine the carrying value (book value) of those reporting units. Prior to this allocation of the assets to the reporting units, we assess long-lived assets for impairment. Furthermore, if the estimated fair value of a reporting unit is less than the carrying value, we must estimate the fair value of all identifiable assets and liabilities of that reporting unit, in a manner similar to a purchase price allocation for an acquired business. This can require independent valuations of certain internally generated and unrecognized intangible assets such as in-process R&D and developed technology. Only after this process is completed can the amount of goodwill impairment, if any, be determined. In our goodwill impairment process we first assess qualitative factors to determine whether it is necessary to perform a quantitative analysis. We do not calculate the fair value of a reporting unit unless we determine, based on a qualitative assessment, that it is more likely than not that the reporting unit’s fair value is less than its carrying amount.
The process of evaluating the potential impairment of goodwill is subjective and requires significant judgment at many points during the analysis. We determine the fair value of our reporting units by using an income approach. Under the income approach, we determine fair value based on estimated future cash flows of each reporting unit,
Continues on next page
Lam Research Corporation 2017 10-K 39
discounted by an estimated weighted-average cost of capital, which reflects the overall level of inherent risk of a reporting unit and the rate of return an outside investor would expect to earn.
In estimating the fair value of a reporting unit, we make estimates and judgments about the future cash flows of our reporting units, including estimated growth rates and assumptions about the economic environment. Although our cash flow forecasts are based on assumptions that are consistent with the plans and estimates we are using to manage the underlying businesses, there is significant judgment involved in determining the cash flows attributable to a reporting unit. In addition, we make certain judgments about allocating shared assets to the estimated balance sheets of our reporting units. Changes in judgment on these assumptions and estimates could result in a goodwill impairment charge.
As a result, several factors could result in an impairment of a material amount of our goodwill balance in future periods, including but not limited to: (1) weakening of the global economy, weakness in the semiconductor equipment industry, or our failure to reach internal forecasts, which could impact our ability to achieve our forecasted levels of cash flows and reduce the estimated discounted cash flow value of our reporting units; and (2) a decline in our Common Stock price and resulting market capitalization, to the extent we determine that the decline is sustained and indicates a reduction in the fair value of our reporting units below their carrying value. Further, the value assigned to intangible assets, other than goodwill, is based on estimates and judgments regarding expectations such as the success and lifecycle of products and technology acquired. If actual product acceptance differs significantly from the estimates, we may be required to record an impairment charge to write down the asset to its realizable value.
For other long-lived assets, we routinely consider whether indicators of impairment are present. If such indicators are present, we determine whether the sum of the estimated undiscounted cash flows attributable to the assets is less than their carrying value. If the sum is less, we recognize an impairment loss based on the excess of the carrying amount of the assets over their respective fair values. Fair value is determined by discounted future cash flows, appraisals or other methods. We recognize an impairment charge to the extent the present value of anticipated net cash flows attributable to the asset are less than the asset’s carrying value. The fair value of the asset then becomes the asset’s new carrying value, which we depreciate over the remaining estimated useful life of the asset. Assets to be disposed of are reported at the lower of the carrying amount or fair value.
Recent Accounting Pronouncements
For a description of recent accounting pronouncements, including the expected dates of adoption and estimated effects, if any, on our consolidated financial statements, see Note 3, “Recent Accounting Pronouncements,” of our Consolidated Financial Statements, included in Item 8 of this report.
Liquidity and Capital Resources
Total gross cash, cash equivalents, investments, and restricted cash and investments balances were $6.3 billion at the end of fiscal year 2017 compared to $7.1 billion at the end of fiscal year 2016. This decrease was primarily due to the redemption of our Senior Notes with contractual maturities in 2023 and 2026. Approximately $4.8 billion and $3.1 billion of our total cash and investments as June 25, 2017, and June 26, 2016, respectively, was held outside the United States in our foreign subsidiaries, the majority of which is held in U.S. dollars, and substantially all of which would be subject to tax at U.S. rates if it were to be repatriated. Refer to Note 6 of our Consolidated Financial Statements, included in Item 8 of this report, for information concerning the potential tax impact of repatriating earnings of certain non-U.S. subsidiaries that are permanently reinvested outside the United States.
Continues on next page
Lam Research Corporation 2017 10-K 40
Cash Flow from Operating Activities
Net cash provided by operating activities of $2.0 billion during fiscal year 2017 consisted of (in millions):
Net income | $ | 1,698 | |
Non-cash charges: | |||
Depreciation and amortization | 307 | ||
Equity-based compensation expense | 150 | ||
Deferred income taxes | 105 | ||
Loss on extinguishment of debt, net | 36 | ||
Amortization of note discounts and issuance costs | 25 | ||
Changes in operating asset and liability accounts | (311 | ) | |
Other | 19 | ||
$ | 2,029 | ||
Significant changes in operating asset and liability accounts, net of foreign exchange impact, included the following uses of cash: increases in accounts receivable of $411 million, inventories of $308 million, and prepaid expenses and other assets of $27 million, partially offset by the following sources of cash: increases in accounts payable of $127 million, deferred profit of $258 million, and accrued expenses and other liabilities of $50 million.
Cash Flow from Investing Activities
Net cash used for investing activities during fiscal year 2017 was $2.1 billion, primarily consisting of net purchases of available-for-sale securities of $1.9 billion, and capital expenditures of $157 million.
Cash Flow from Financing Activities
Net cash used by financing activities during fiscal year 2017 was $2.6 billion, primarily consisting of $1.7 billion of cash paid for debt extinguishment, $812 million in treasury stock repurchases, and $243 million of dividends paid, partially offset by $73 million of stock issuance and treasury stock reissuances associated with our employee stock-based compensation plans.
Liquidity
Given that the semiconductor industry is highly competitive and has historically experienced rapid changes in demand, we believe that maintaining sufficient liquidity reserves is important to support sustaining levels of investment in R&D and capital infrastructure. Anticipated cash flows from operations based on our current business outlook, combined with our current levels of cash, cash equivalents, and short-term investments as of June 25, 2017, are expected to be sufficient to support our anticipated levels of operations, investments, debt service requirements, capital expenditures, capital redistributions, and dividends through at least the next 12 months. However, uncertainty in the global economy and the semiconductor industry, as well as disruptions in credit markets, have in the past, and could in the future, impact customer demand for our products, as well as our ability to manage normal commercial relationships with our customers, suppliers, and creditors.
In the longer term, liquidity will depend to a great extent on our future revenues and our ability to appropriately manage our costs based on demand for our products and services. While we have substantial cash balances in
the United States and offshore, we may require additional funding and need or choose to raise the required funds through borrowings or public or private sales of debt or equity securities. We believe that, if necessary, we will be able to access the capital markets on terms and in amounts adequate to meet our objectives. However, given the possibility of changes in market conditions or other occurrences, there can be no certainty that such funding will be available in needed quantities or on terms favorable to us.
Continues on next page
Lam Research Corporation 2017 10-K 41
Off-Balance Sheet Arrangements and Contractual Obligations
We have certain obligations to make future payments under various contracts, some of which are recorded on our balance sheet and some of which are not. Obligations that are recorded on our balance sheet in accordance with GAAP include our long-term debt which is outlined in the following table. Our off-balance sheet arrangements are presented as operating leases and purchase obligations in the table. Our contractual obligations and commitments as of June 25, 2017, relating to these agreements and our guarantees are included in the following table based on their contractual maturity date. The amounts in the table below exclude $120 million of liabilities related to uncertain tax benefits as we are unable to reasonably estimate the ultimate amount or time of settlement. See Note 6 of our Consolidated Financial Statements for further discussion. The amounts in the table below also exclude $19 million associated with funding commitments related to non-marketable equity investments as we are unable to make a reasonable estimate regarding the timing of capital calls.
Total | Less than 1 Year | 1-3 Years | 3-5 Years | More than 5 years | |||||||||||||||
(in thousands) | |||||||||||||||||||
Operating leases | $ | 156,845 | $ | 50,798 | $ | 60,453 | $ | 19,639 | $ | 25,955 | |||||||||
Capital leases | 7,201 | 744 | 1,457 | 5,000 | — | ||||||||||||||
Purchase obligations | 284,804 | 274,574 | 6,942 | 3,061 | 227 | ||||||||||||||
Long-term debt and interest expense (1) | 3,518,070 | 523,401 | 634,822 | 888,114 | 1,471,733 | ||||||||||||||
Other long-term liabilities (2) | 280,186 | 3,487 | 2,728 | 10,246 | 263,725 | ||||||||||||||
Total | $ | 4,247,106 | $ | 853,004 | $ | 706,402 | $ | 926,060 | $ | 1,761,640 | |||||||||
__________________________________
(1) | The conversion period for the Convertible Notes was open as of June 25, 2017, and as such the net carrying value of the Convertible Notes is included within current liabilities on our Consolidated Balance Sheet. The principal balances of the Convertible Notes are reflected in the payment period in the table above based on the contractual maturity assuming no conversion. See Note 13 of our Consolidated Financial Statements for additional information concerning the Convertible Notes and associated conversion features. |
(2) | Certain tax-related liabilities and post-retirement benefits classified as other non-current liabilities on the consolidated balance sheet are included in the “more than five years” category due to the uncertainty in the timing and amount of future payments. Additionally, the balance excludes contractual obligations recorded in our consolidated balance sheet as current liabilities. |
Operating Leases
We lease most of our administrative, R&D, and manufacturing facilities; regional sales/service offices; and certain equipment under non-cancelable operating leases. Certain of our facility leases for buildings located in Fremont and Livermore, California, and certain other facility leases provide us with an option to extend the leases for additional periods or to purchase the facilities. Certain of our facility leases provide for periodic rent increases based on the general rate of inflation. In addition to amounts included in the table above, we have guaranteed residual values for certain of our Fremont and Livermore facility leases of up to $250 million. See Note 15 to our Consolidated Financial Statements for further discussion.
Capital Leases
Capital leases reflect building and office equipment lease obligations. The amounts in the table above include the interest portion of payment obligations.
Purchase Obligations
Purchase obligations consist of significant contractual obligations either on an annual basis or over multi-year periods related to our outsourcing activities or other material commitments, including vendor-consigned inventories. The contractual cash obligations and commitments table presented above contains our minimum obligations at June 25, 2017, under these arrangements and others. For obligations with cancellation provisions, the amounts included in the preceding table were limited to the non-cancelable portion of the agreement terms or the minimum cancellation fee. Actual expenditures will vary based on the volume of transactions and length of contractual service provided.
Continues on next page
Lam Research Corporation 2017 10-K 42
Long-Term Debt
In May 2011, we issued and sold $450.0 million in aggregate principal amount of 1.25% Convertible Senior Notes due May 2018 (the “2018 Notes”) at par. We pay cash interest on the 2018 Notes at an annual rate of 1.25%, on a semi-annual basis. Concurrently with the issuance of the 2018 Notes, we purchased convertible note hedges and sold warrants, which were structured to reduce the potential future economic dilution associated with the conversion of the 2018 Notes.
The 2018 Notes may be converted into our Common Stock, under certain circumstances, based on a conversion rate of 16.5702 shares of our Common Stock per $1,000 principal amount of Notes, which is equal to a conversion price of approximately $60.35 per share of our Common Stock. The conversion price will be subject to adjustment for certain corporate events, including dividends on our Common Stock.
In June 2012, with the acquisition of Novellus, we assumed $700 million in aggregate principal amount of 2.625% Convertible Senior Notes due May 2041 (the “2041 Notes”). We pay cash interest on the 2041 Notes at an annual rate of 2.625%, on a semi-annual basis. The 2041 Notes may be converted, under certain circumstances, into our Common Stock based on a conversion rate of 29.7371 shares of Common Stock per $1,000 principal amount of notes, which represents a conversion price of approximately $33.63 per share of Common Stock. The conversion price will be subject to adjustment for certain events, including dividends on our Common Stock.
During the quarter-ended June 25, 2017, the market value of our Common Stock was greater than or equal to 130% of the 2018 Notes and 2041 Notes conversion prices for 20 or more trading days of the 30 consecutive trading days preceding the quarter end. As a result, the 2018 Notes and the 2041 Notes are convertible at the option of the holder and are classified as current liabilities in our Consolidated Balance Sheets for fiscal year 2017.
On March 12, 2015, we completed a public offering of $500 million aggregate principal amount of Senior Notes due March 15, 2020 (the “2020 Notes”) and $500 million aggregate principal amount of Senior Notes due March 15, 2025 (the “2025 Notes”). We pay interest at an annual rate of 2.75% and 3.80%, respectively, on the 2020 Notes and 2025 Notes, on a semi-annual basis on March 15 and September 15 of each year.
We may redeem the 2020 Notes and 2025 Notes at a redemption price equal to 100% of the principal amount of such series (“par”), plus a “make whole” premium as described in the indenture in respect to the 2020 Notes and 2025 Notes and accrued and unpaid interest before February 15, 2020, for the 2020 Notes and before December 15, 2024, for the 2025 Notes. We may redeem the 2020 Notes and 2025 Notes at par, plus accrued and unpaid interest, at any time on or after February 15, 2020, for the 2020 Notes and on or after December 24, 2024, for the 2025 Notes. In addition, upon the occurrence of certain events, as described in the indenture, we will be required to make an offer to repurchase the 2020 Notes and 2025 Notes at a price equal to 101% of the principal amount of the respective note, plus accrued and unpaid interest.
On June 7, 2016, we completed a public offering of $800.0 million aggregate principal amount of Senior Notes due June 15, 2021, (the “2021 Notes”), $600.0 million aggregate principal amount of Senior Notes due June 15, 2023 (the “2023 Notes”) and $1.0 billion aggregate principal amount of Senior Notes due June 15, 2026 (the “2026 Notes”, together with the 2020 Notes, and 2021 Notes, the “Senior Notes”, and collectively with the Convertible Notes, the “Notes”). We pay interest at an annual rate of 2.80% on the 2021 Notes on a semi-annual basis on June 15 and December 15 of each year.
As a result of the October 5, 2016, termination of the Agreement and Plan of Merger and Reorganization with KLA-Tencor, the 2023 Notes and the 2026 Notes were redeemed on October 13, 2016, under the special mandatory redemption terms of the indenture governing these Notes. We were required to redeem all of the 2023 Notes and the 2026 Notes then outstanding, on October 13, 2016, at a special mandatory redemption price equal to 101% of the aggregate principal amount of such notes, plus accrued and unpaid interest from the date of initial issuance.
We may redeem the 2021 Notes at a redemption price equal to 100% of the principal amount of such series (“par”), plus a “make whole” premium as described in the respective indenture, and accrued and unpaid interest before May 15, 2021. We may redeem the 2021 Notes at par, plus accrued and unpaid interest at any time on or after May 15, 2021. In addition, upon the occurrence of certain events, as described in the indenture, we will be
Continues on next page
Lam Research Corporation 2017 10-K 43
required to make an offer to repurchase the 2021 Notes, at a price equal to 101% of the principal amount of the respective note, plus accrued and unpaid interest.
On May 13, 2016, we entered into an Amended and Restated Term Loan Agreement (the “Amended and Restated Term Loan Agreement”), which amends and restates the Term Loan Agreement we entered into on November 10, 2015, with a syndicate of lenders. The Amended and Restated Term Loan Agreement provides for a commitment of $1,530.0 million senior unsecured term loan facility composed of two tranches (the “Commitments”): (1) a $1,005.0 million tranche of three-year senior unsecured loans and (2) a $525.0 million tranche of five-year senior unsecured loans. The Commitments automatically terminated on October 5, 2016, upon termination of the Agreement and Plan of Merger and Reorganization with KLA-Tencor Corporation.
During fiscal year 2017, 2016, and 2015, we made $1.7 billion, $451 million, and $2 million, respectively, in principal payments on long-term debt and capital leases.
Revolving Credit Arrangements
On November 10, 2015, we entered into an Amendment and Restatement Agreement (as amended on April 26, 2016, by Amendment No.1 to Amended and Restated Credit Agreement and as further amended, restated, amended and restated, supplemented, or otherwise modified from time to time, the “Amended and Restated Credit Agreement”), which amends and restates our prior unsecured Credit Agreement, dated March 12, 2014 (as amended by Amendment No. 1, dated March 5, 2015). The Amended and Restated Credit Agreement provides for an increase to our revolving unsecured credit facility, from $300 million to $750 million with a syndicate of lenders. It includes an expansion option, subject to certain requirements, for us to request an increase in the facility of up to an additional $250 million, for a potential total commitment of $1.0 billion. Proceeds from the credit facility can be used for general corporate purposes. The facility matures on November 10, 2020.
Interest on amounts borrowed under the credit facility is, at our option, based on (1) a base rate, defined as the greatest of (a) prime rate, (b) Federal Funds rate plus 0.5%, or (c) one-month London Interbank Offered Rate (“LIBOR”) plus 1.0%, plus a spread of 0.0% to 0.5%, or (2) LIBOR multiplied by the statutory reserve rate, plus a spread of 0.9% to 1.5%, in each case as the applicable spread is determined based on the rating of our non-credit enhanced, senior unsecured long-term debt. Principal and any accrued and unpaid interest is due and payable upon maturity. Additionally, we will pay the lenders a quarterly commitment fee that varies based on our credit rating. The Amended and Restated Credit Agreement contains affirmative covenants, negative covenants, financial covenants, and events of default that are substantially similar to those in the Amended and Restated Term Loan Agreement. As of June 25, 2017, we had no borrowings outstanding under the credit facility and were in compliance with all financial covenants.
Other Guarantees
We have issued certain indemnifications to our lessors for taxes and general liability under some of our agreements. We have entered into certain insurance contracts that may limit our exposure to such indemnifications. As of June 25, 2017, we had not recorded any liability on our Consolidated Financial Statements in connection with these indemnifications, as we do not believe, based on information available, that it is probable that we will pay any amounts under these guarantees.
Generally, we indemnify, under pre-determined conditions and limitations, our customers for infringement of third-party intellectual property rights by our products or services. We seek to limit our liability for such indemnity to an amount not to exceed the sales price of the products or services subject to our indemnification obligations. We do not believe, based on information available, that it is probable that we will pay any material amounts under these guarantees.
We provide guarantees and standby letters of credit to certain parties as required for certain transactions initiated during the ordinary course of business. As of June 25, 2017, the maximum potential amount of future payments that we could be required to make under these arrangements and letters of credit was $16 million. We do not believe, based on historical experience and information currently available, that it is probable that any amounts will be required to be paid.
Continues on next page
Lam Research Corporation 2017 10-K 44
Item 7A. | Quantitative and Qualitative Disclosures About Market Risk |
Investments
We maintain an investment portfolio of various holdings, types, and maturities. As of June 25, 2017, our mutual funds are classified as trading securities. Investments classified as trading securities are recorded at fair value based upon quoted market prices. Any material differences between the cost and fair value of trading securities is recognized as “Other income (expense)” in our Consolidated Statement of Operations. All of our other investments are classified as available-for-sale and consequently are recorded in the Consolidated Balance Sheets at fair value with unrealized gains or losses reported as a separate component of accumulated other comprehensive income, net of tax.
Interest Rate Risk
Fixed-Income Securities
Our investments in various interest-earning securities carry a degree of market risk for changes in interest rates. At any time, a sharp rise in interest rates could have a material adverse impact on the fair value of our fixed-income investment portfolio. Conversely, declines in interest rates could have a material adverse impact on interest income for our investment portfolio. We target to maintain a conservative investment policy, which focuses on the safety and preservation of our capital by limiting default risk, market risk, reinvestment risk, and concentration risk. The following table presents the hypothetical fair values of fixed-income securities that would result from selected potential decreases and increases in interest rates. Market changes reflect immediate hypothetical parallel shifts in the yield curve of plus or minus 50 basis points (“BPS”), 100 BPS, and 150 BPS. The hypothetical fair values as of June 25, 2017,were as follows:
Valuation of Securities Given an Interest Rate Decrease of X Basis Points | Fair Value as of | Valuation of Securities Given an Interest Rate Increase of X Basis Points | |||||||||||||||||||||||||
June 25, 2017 | |||||||||||||||||||||||||||
(150 BPS) | (100 BPS) | (50 BPS) | —% | 50 BPS | 100 BPS | 150 BPS | |||||||||||||||||||||
(in thousands) | |||||||||||||||||||||||||||
Time deposit | $ | 640,666 | $ | 640,666 | $ | 640,666 | $ | 640,666 | $ | 640,666 | $ | 640,666 | $ | 640,666 | |||||||||||||
Municipal notes and bonds | 197,037 | 196,890 | 195,918 | 194,876 | 193,834 | 192,792 | 191,751 | ||||||||||||||||||||
U.S. Treasury and agencies | 821,172 | 813,220 | 804,147 | 795,049 | 785,862 | 776,677 | 767,493 | ||||||||||||||||||||
Government-sponsored enterprises | 25,355 | 25,069 | 24,783 | 24,496 | 24,210 | 23,924 | 23,638 | ||||||||||||||||||||
Foreign government bonds | 65,205 | 64,482 | 63,752 | 63,022 | 62,292 | 61,563 | 60,833 | ||||||||||||||||||||
Bank and corporate notes | 2,494,798 | 2,475,500 | 2,455,967 | 2,436,436 | 2,416,907 | 2,397,381 | 2,377,857 | ||||||||||||||||||||
Mortgage backed securities - residential | 105,825 | 104,728 | 103,543 | 102,358 | 101,171 | 99,984 | 98,797 | ||||||||||||||||||||
Mortgage backed securities - commercial | 68,710 | 67,719 | 66,729 | 65,739 | 64,750 | 63,761 | 62,773 | ||||||||||||||||||||
Total | $ | 4,418,768 | $ | 4,388,274 | $ | 4,355,505 | $ | 4,322,642 | $ | 4,289,692 | $ | 4,256,748 | $ | 4,223,808 | |||||||||||||
We mitigate default risk by investing in high credit quality securities and by positioning our portfolio to respond appropriately to a significant reduction in a credit rating of any investment issuer or guarantor. The portfolio includes only marketable securities with active secondary or resale markets to achieve portfolio liquidity and maintain a prudent amount of diversification.
Continues on next page
Lam Research Corporation 2017 10-K 45
Long-Term Debt
As of June 25, 2017, we had $2.9 billion in principal amount of fixed-rate long-term debt outstanding, with a fair value of $5.8 billion. The fair value of our Notes is subject to interest rate risk, market risk, and other factors due to the convertible feature, as applicable. Generally, the fair value of Notes will increase as interest rates fall and decrease as interest rates rise. Additionally, the fair value of the Convertible Notes will increase as our Common Stock price increases and decrease as our Common Stock price decreases. The interest and market value changes affect the fair value of our Notes but do not impact our financial position, cash flows, or results of operations due to the fixed nature of the debt obligations. We do not carry the Notes at fair value, but present the fair value of the principal amount of our Notes for disclosure purposes.
Equity Price Risk
Publicly Traded Securities
The values of our investments in publicly traded securities, including mutual funds related to our obligations under our deferred compensation plans, are subject to market price risk. The following table presents the hypothetical fair values of our publicly traded securities that would result from potential decreases and increases in the price of each security in the portfolio. Potential fluctuations in the price of each security in the portfolio of plus or minus 10%, 15%, or 25% were selected based on potential near-term changes in those security prices. The hypothetical fair values as of June 25, 2017, were as follows:
Valuation of Securities Given an X% Decrease in Stock Price | Fair Value as of | Valuation of Securities Given an X% Increase in Stock Price | ||||||||||||||||||||||||
June 25, 2017 | ||||||||||||||||||||||||||
(25)% | (15)% | (10)% | —% | 10% | 15% | 25% | ||||||||||||||||||||
(in thousands) | ||||||||||||||||||||||||||
Mutual funds | $ | 42,191 | $ | 47,816 | $ | 50,629 | 56,254 | $ | 61,879 | $ | 64,692 | $ | 70,318 | |||||||||||||
Foreign Currency Exchange (“FX”) Risk
We conduct business on a global basis in several major international currencies. As such, we are potentially exposed to adverse as well as beneficial movements in foreign currency exchange rates. The majority of our revenues and expenses are denominated in U.S. dollars. However, we are exposed to foreign currency exchange rate fluctuations primarily related to revenues denominated in Japanese yen and euro-denominated and Korean won-denominated expenses.
We enter into foreign currency forward contracts to minimize the short-term impact of exchange rate fluctuations on certain foreign currency denominated monetary assets and liabilities, primarily cash, third-party accounts receivable, accounts payable, and intercompany receivables and payables. In addition, we hedge certain anticipated foreign currency cash flows, primarily on revenues denominated in Japanese yen and expenses denominated in euro and Korean won.
To protect against the reduction in value of anticipated revenues denominated in Japanese yen and expenses denominated in euro and Korean won, we enter into foreign currency forward and option contracts that generally expire within 12 months and no later than 24 months. These foreign currency hedge contracts are designated as cash flow hedges and are carried on our balance sheet at fair value, with the effective portion of the contracts’ gains or losses included in accumulated other comprehensive income (loss) and subsequently recognized in earnings in the same period the hedged revenue and/or expense is recognized. We also enter into foreign currency forward contracts to hedge the gains and losses generated by the remeasurement of certain non-U.S.-dollar denominated monetary assets and liabilities, primarily cash, third-party accounts receivable, accounts payable, and intercompany receivables and payables. The change in fair value of these balance sheet hedge contracts is recorded into earnings as a component of other income (expense), net, and offsets the change in fair value of the foreign currency denominated monetary assets and liabilities also recorded in other income (expense), net, assuming the hedge contract fully covers the hedged items. The notional amount and unrealized gain of our outstanding forward and option contracts that are designated as cash flow hedges, as of June 25, 2017, are shown in the table below. This table also shows the change in fair value of these cash flow hedges
Continues on next page
Lam Research Corporation 2017 10-K 46
assuming a hypothetical foreign currency exchange rate movement of plus or minus 10 percent and plus or minus 15 percent.
Notional Amount | Unrealized FX Gain/(Loss) | Valuation of FX Contracts Given an X% Increase (+)/Decrease(-) in Each | |||||||||||||||
June 25, 2017 | = +/- (10%) | = +/- (15%) | |||||||||||||||
(in millions) | |||||||||||||||||
Forward contracts | |||||||||||||||||
Sell | Japanese yen | $ | 670.2 | $ | (1.4 | ) | $ | 66.4 | $ | 99.6 | |||||||
Buy | Euro | 58.9 | 2.7 | 6.1 | 9.1 | ||||||||||||
Buy | Korean won | 22.0 | — | 2.2 | 3.3 | ||||||||||||
$ | 1.3 | $ | 74.7 | $ | 112.0 | ||||||||||||
Option contracts | |||||||||||||||||
Buy put | Japanese yen | $ | 36.0 | $ | 1.0 | $ | 3.2 | $ | 4.5 | ||||||||
Buy put de-designated (1) | Japanese yen | 26.5 | 0.2 | 2.0 | 3.0 | ||||||||||||
Sell put (2) | Japanese yen | 26.5 | (0.2 | ) | 1.9 | 3.0 | |||||||||||
$ | 1.0 | $ | 7.1 | $ | 10.5 | ||||||||||||
(1) Contracts were entered into and designated as cash flow hedges under ASC 815 during the fiscal year as part of our cash flow hedge program. The contracts were subsequently de-designated during the year ended June 25, 2017. Changes in fair market value subsequent to de-designation affect current earnings.
(2) Contracts were entered into to offset the de-designated buy put contracts, and while not designated as a cash flow hedge they are considered to be part of our cash flow hedge program. Changes in fair market value effect current earnings.
The notional amount and unrealized loss of our outstanding foreign currency forward contracts that are designated as balance sheet hedges, as of June 25, 2017, are shown in the table below. This table also shows the change in fair value of these balance sheet hedges, assuming a hypothetical foreign currency exchange rate movement of plus or minus 10 percent and plus or minus 15 percent. These changes in fair values would be offset in other income (expense), net, by corresponding change in fair values of the foreign currency denominated monetary assets and liabilities, assuming the hedge contract fully covers the intercompany and trade receivable balances.
Notional Amount | Unrealized FX Gain/(Loss) | Valuation of FX Contracts Given an X% Increase (+)/Decrease(-) in Each | |||||||||||||||
June 25, 2017 | = +/- (10%) | = +/- (15%) | |||||||||||||||
(in millions) | |||||||||||||||||
Forward contracts, balance sheet hedge | |||||||||||||||||
Sell | Japanese yen | $ | 269.5 | $ | — | $ | 26.9 | $ | 40.4 | ||||||||
Sell | Korean won | 34.1 | 0.2 | 3.4 | 5.1 | ||||||||||||
Buy | Euro | 18.4 | — | 1.9 | 2.7 | ||||||||||||
Buy | Taiwan dollar | 11.2 | — | 1.1 | 1.7 | ||||||||||||
Buy | Swiss francs | 8.7 | — | 0.9 | 1.3 | ||||||||||||
Buy | Chinese renminbi | 7.2 | — | 0.7 | 1.1 | ||||||||||||
$ | 0.2 | $ | 34.9 | $ | 52.3 | ||||||||||||
Continues on next page
Lam Research Corporation 2017 10-K 47
Interest Rate Contracts
Interest rate risk is present with both fixed- and floating-rate debt. Interest rate swap agreements designated as fair value hedges are used to mitigate our exposure to changes in the fair value of fixed-rate debt resulting from fluctuations in benchmark interest rates. Accordingly, benchmark interest rate fluctuations impact the fair value of our fixed-rate debt, which are offset by corresponding changes in the fair value of the swap agreements. Interest rate swaps may also be used to adjust interest rate exposures when appropriate, based on market conditions, and for qualifying hedges, the interest differential of swaps is included in interest expense. During the fiscal year ended June 26, 2016, we entered into a series of interest rate contracts with a total notional value of $400 million where we received fixed rates and paid variable rates based on certain benchmark interest rates. Such interest rate swap arrangements were designated as fair value hedges of the fair value of the underlying debt instrument.
The following table shows the change in fair value of these fair value hedges, assuming a hypothetical benchmark interest rate movement of plus or minus 10 BPS and plus or minus 15 BPS.
Valuation of Fair Value Hedge Given an Interest Rate Increase of X Basis Points | Fair Value as of | Valuation of Fair Value Hedge Given an Interest Rate Decrease of X Basis Points | ||||||||||||||||||
June 25, 2017 | ||||||||||||||||||||
10 BPS | 15 BPS | —% | (10 BPS) | (15 BPS) | ||||||||||||||||
(in millions) | ||||||||||||||||||||
Interest Rate Contracts | $ | 7.3 | $ | 5.9 | $ | 10.1 | $ | 12.9 | $ | 14.3 | ||||||||||
Interest rate risk is also present on anticipated issuances of debt. We manage our interest rate exposure on anticipated issuances of debt through forward-starting interest rate swap agreements. Forward-starting interest rate swap agreements designated as cash flow hedges are used to mitigate our exposure to changes in future interest payments that results from fluctuations in benchmark interest rates prior to the issuance of the debt. Accordingly, benchmark interest rate fluctuations impact the interest cash flows of the Company’s anticipated debt issuances, which are offset by corresponding changes in the fair value of the forward-starting interest rate swap agreements. During the fiscal year ended June 26, 2016, we entered into and settled a series of forward-starting interest rate swap agreements with a total notional value of $600 million, associated with our June 2016 debt offering. Such forward-starting interest rate swap agreements were designated as hedges of the cash flows associated with benchmark interest rates underlying future interest payments on the June 2016 debt issuances.
Continues on next page
Lam Research Corporation 2017 10-K 48
Item 8. | Financial Statements and Supplementary Data |
Index to Consolidated Financial Statements
Page | |
Consolidated Statements of Operations — Years Ended June 25, 2017, June 26, 2016, and June 28, 2015 | |
Consolidated Statements of Comprehensive Income — Years Ended June 25, 2017, June 26, 2016, and June 28, 2015 | |
Consolidated Balance Sheets — June 25, 2017, and June 26, 2016 | |
Consolidated Statements of Cash Flows — Years Ended June 25, 2017, June 26, 2016, and June 28, 2015 | |
Consolidated Statements of Stockholders’ Equity — Years Ended June 25, 2017, June 26, 2016, and June 28, 2015 | |
Notes to Consolidated Financial Statements | |
Reports of Independent Registered Public Accounting Firm | |
Continues on next page
Lam Research Corporation 2017 10-K 49
LAM RESEARCH CORPORATION
CONSOLIDATED STATEMENTS OF OPERATIONS
(in thousands, except per share data)
Year Ended | |||||||||||
June 25, 2017 | June 26, 2016 | June 28, 2015 | |||||||||
Revenue | $ | 8,013,620 | $ | 5,885,893 | $ | 5,259,312 | |||||
Cost of goods sold | 4,410,261 | 3,266,971 | 2,974,976 | ||||||||
Gross margin | 3,603,359 | 2,618,922 | 2,284,336 | ||||||||
Research and development | 1,033,742 | 913,712 | 825,242 | ||||||||
Selling, general, and administrative | 667,485 | 630,954 | 591,611 | ||||||||
Goodwill impairment | — | — | 79,444 | ||||||||
Total operating expenses | 1,701,227 | 1,544,666 | 1,496,297 | ||||||||
Operating income | 1,902,132 | 1,074,256 | 788,039 | ||||||||
Other expense, net | (90,459 | ) | (114,139 | ) | (47,189 | ) | |||||
Income before income taxes | 1,811,673 | 960,117 | 740,850 | ||||||||
Income tax expense | (113,910 | ) | (46,068 | ) | (85,273 | ) | |||||
Net income | $ | 1,697,763 | $ | 914,049 | $ | 655,577 | |||||
Net income per share: | |||||||||||
Basic | $ | 10.47 | $ | 5.75 | $ | 4.11 | |||||
Diluted | $ | 9.24 | $ | 5.22 | $ | 3.70 | |||||
Number of shares used in per share calculations: | |||||||||||
Basic | 162,222 | 158,919 | 159,629 | ||||||||
Diluted | 183,770 | 175,159 | 177,067 | ||||||||
See Notes to Consolidated Financial Statements
Continues on next page
Lam Research Corporation 2017 10-K 50
LAM RESEARCH CORPORATION
CONSOLIDATED STATEMENTS OF COMPREHENSIVE INCOME
(in thousands)
Year Ended | |||||||||||
June 25, 2017 | June 26, 2016 | June 28, 2015 | |||||||||
Net income | $ | 1,697,763 | $ | 914,049 | $ | 655,577 | |||||
Other comprehensive income (loss), net of tax: | |||||||||||
Foreign currency translation adjustment | (2,843 | ) | (4,403 | ) | (22,139 | ) | |||||
Cash flow hedges: | |||||||||||
Net unrealized gains (losses) during the period | 5,841 | (17,725 | ) | 1,595 | |||||||
Net losses (gains) reclassified into earnings | 8,971 | 4,961 | (4,388 | ) | |||||||
14,812 | (12,764 | ) | (2,793 | ) | |||||||
Available-for-sale investments: | |||||||||||
Net unrealized (losses) gains during the period | (3,789 | ) | 9,028 | (5,389 | ) | ||||||
Net (gains) losses reclassified into earnings | (1 | ) | (371 | ) | 71 | ||||||
(3,790 | ) | 8,657 | (5,318 | ) | |||||||
Defined benefit plans, net change in unrealized component | (546 | ) | (3,027 | ) | 1,109 | ||||||
Other comprehensive income (loss), net of tax | 7,633 | (11,537 | ) | (29,141 | ) | ||||||
Comprehensive income | $ | 1,705,396 | $ | 902,512 | $ | 626,436 | |||||
See Notes to Consolidated Financial Statements
Continues on next page
Lam Research Corporation 2017 10-K 51
LAM RESEARCH CORPORATION
CONSOLIDATED BALANCE SHEETS
(in thousands, except per share data)
June 25, 2017 | June 26, 2016 | |||||||
ASSETS: | ||||||||
Cash and cash equivalents | $ | 2,377,534 | $ | 5,039,322 | ||||
Investments | 3,663,628 | 1,788,612 | ||||||
Accounts receivable, less allowance for doubtful accounts of $5,103 as of June 25, 2017 and $5,155 as of June 26, 2016 | 1,673,398 | 1,262,145 | ||||||
Inventories | 1,232,916 | 971,911 | ||||||
Prepaid expenses and other current assets | 195,022 | 151,160 | (1) | |||||
Total current assets | 9,142,498 | 9,213,150 | ||||||
Property and equipment, net | 685,595 | 639,608 | ||||||
Restricted cash and investments | 256,205 | 250,421 | ||||||
Goodwill | 1,385,673 | 1,386,276 | ||||||
Intangible assets, net | 410,995 | 564,921 | ||||||
Other assets | 241,799 | 209,939 | (1) | |||||
Total assets | $ | 12,122,765 | $ | 12,264,315 | ||||
LIABILITIES AND STOCKHOLDERS’ EQUITY: | ||||||||
Trade accounts payable | $ | 464,643 | $ | 348,199 | ||||
Accrued expenses and other current liabilities | 969,361 | 772,910 | ||||||
Deferred profit | 607,672 | 349,199 | ||||||
Current portion of convertible notes and capital leases | 908,439 | 947,733 | (1) | |||||
Total current liabilities | 2,950,115 | 2,418,041 | ||||||
Senior notes, convertible notes, and capital leases, less current portion | 1,784,974 | 3,378,129 | (1) | |||||
Income taxes payable | 120,178 | 231,514 | ||||||
Other long-term liabilities | 280,186 | 134,562 | ||||||
Total liabilities | 5,135,453 | 6,162,246 | ||||||
Commitments and contingencies | ||||||||
Temporary equity, convertible notes | 169,861 | 207,552 | ||||||
Stockholders’ equity: | ||||||||
Preferred stock, at par value of $0.001 per share; authorized - 5,000 shares, none outstanding | — | — | ||||||
Common stock, at par value of $0.001 per share; authorized - 400,000 shares; issued and outstanding 161,723 shares at June 25, 2017, and 160,201 shares at June 26, 2016 | 162 | 160 | ||||||
Additional paid-in capital | 5,845,485 | 5,572,898 | ||||||
Treasury stock, at cost, 105,569 shares at June 25, 2017, and 101,071 shares at June 26, 2016 | (5,216,187 | ) | (4,429,317 | ) | ||||
Accumulated other comprehensive loss | (61,700 | ) | (69,333 | ) | ||||
Retained earnings | 6,249,691 | 4,820,109 | ||||||
Total stockholders’ equity | 6,817,451 | 5,894,517 | ||||||
Total liabilities and stockholders’ equity | $ | 12,122,765 | $ | 12,264,315 | ||||
(1) Adjusted for effects of retrospective implementation of ASU 2015-3; see Note 3 and Note 13 for additional information.
See Notes to Consolidated Financial Statements
Continues on next page
Lam Research Corporation 2017 10-K 52
LAM RESEARCH CORPORATION
CONSOLIDATED STATEMENTS OF CASH FLOWS
(in thousands)
Year Ended | |||||||||||
June 25, 2017 | June 26, 2016 | June 28, 2015 | |||||||||
CASH FLOWS FROM OPERATING ACTIVITIES: | |||||||||||
Net income | $ | 1,697,763 | $ | 914,049 | $ | 655,577 | |||||
Adjustments to reconcile net income to net cash provided by operating activities: | |||||||||||
Depreciation and amortization | 306,905 | 291,028 | 277,920 | ||||||||
Deferred income taxes | 104,936 | (49,003 | ) | 5,551 | |||||||
Impairment of long-lived assets | — | — | 9,821 | ||||||||
Equity-based compensation expense | 149,975 | 142,348 | 135,354 | ||||||||
Income tax benefit (expense) on equity-based compensation plans | 38,747 | (1,023 | ) | 11,316 | |||||||
Excess tax (benefits) expense on equity-based compensation plans | (38,635 | ) | 1,020 | (11,398 | ) | ||||||
Loss on extinguishment of debt, net | 36,252 | — | — | ||||||||
Amortization of note discounts and issuance costs | 25,282 | 70,522 | 37,550 | ||||||||
Gain on sale of business | — | — | (7,431 | ) | |||||||
Gain on sale of assets | (163 | ) | (15,223 | ) | — | ||||||
Goodwill impairment | — | — | 79,444 | ||||||||
Other, net | 19,052 | 48,788 | 12,656 | ||||||||
Changes in operating asset and liability accounts: | |||||||||||
Accounts receivable, net of allowance | (411,287 | ) | (169,034 | ) | (294,155 | ) | |||||
Inventories | (307,875 | ) | (66,371 | ) | (207,462 | ) | |||||
Prepaid expenses and other assets | (27,269 | ) | (46,664 | ) | (52,496 | ) | |||||
Trade accounts payable | 126,819 | 41,645 | 76,617 | ||||||||
Deferred profit | 258,473 | 27,129 | 86,146 | ||||||||
Accrued expenses and other liabilities | 50,307 | 161,066 | (29,507 | ) | |||||||
Net cash provided by operating activities | 2,029,282 | 1,350,277 | 785,503 | ||||||||
CASH FLOWS FROM INVESTING ACTIVITIES: | |||||||||||
Capital expenditures and intangible assets | (157,419 | ) | (175,330 | ) | (198,265 | ) | |||||
Business acquisitions, net of cash acquired | — | — | (1,137 | ) | |||||||
Purchases of available-for-sale securities | (4,581,851 | ) | (874,998 | ) | (3,086,808 | ) | |||||
Sales and maturities of available-for-sale securities | 2,697,965 | 1,673,826 | 2,137,068 | ||||||||
Purchase of other investments | — | — | (2,500 | ) | |||||||
Proceeds from sale of assets | 1,291 | 79,730 | — | ||||||||
Proceeds from sale of business | — | — | 41,212 | ||||||||
Transfer of restricted cash and investments | (5,784 | ) | (112,381 | ) | 356 | ||||||
Other, net | (12,815 | ) | 1,636 | 3,978 | |||||||
Net cash (used by) provided by investing activities | (2,058,613 | ) | 592,483 | (1,106,096 | ) | ||||||
Continues on next page
Lam Research Corporation 2017 10-K 53
Year Ended | |||||||||||
June 25, 2017 | June 26, 2016 | June 28, 2015 | |||||||||
CASH FLOWS FROM FINANCING ACTIVITIES: | |||||||||||
Principal payments on long-term debt and capital lease obligations and payments for debt issuance costs | (1,688,313 | ) | (451,497 | ) | (1,515 | ) | |||||
Net proceeds from issuance of long-term debt | — | 2,338,144 | 992,225 | ||||||||
Excess tax benefits (expense) on equity-based compensation plans | 38,635 | (1,020 | ) | 11,398 | |||||||
Treasury stock purchases | (811,672 | ) | (158,389 | ) | (573,240 | ) | |||||
Dividends paid | (243,495 | ) | (190,402 | ) | (116,059 | ) | |||||
Reissuances of treasury stock related to employee stock purchase plan | 59,663 | 55,992 | 48,803 | ||||||||
Proceeds from issuance of common stock | 12,913 | 3,405 | 17,520 | ||||||||
Other, net | (125 | ) | (488 | ) | (660 | ) | |||||
Net cash (used for) provided by financing activities | $ | (2,632,394 | ) | $ | 1,595,745 | $ | 378,472 | ||||
Effect of exchange rate changes on cash and cash equivalents | $ | (63 | ) | $ | (722 | ) | $ | (9,017 | ) | ||
Net (decrease) increase in cash and cash equivalents | (2,661,788 | ) | 3,537,783 | 48,862 | |||||||
Cash and cash equivalents at beginning of year | 5,039,322 | 1,501,539 | 1,452,677 | ||||||||
Cash and cash equivalents at end of year | $ | 2,377,534 | $ | 5,039,322 | $ | 1,501,539 | |||||
Schedule of non-cash transactions | |||||||||||
Accrued payables for stock repurchases | $ | — | $ | — | $ | 3,255 | |||||
Accrued payables for capital expenditures | 17,285 | 27,953 | 22,436 | ||||||||
Dividends payable | 72,738 | 48,052 | 47,659 | ||||||||
Transfers of finished goods inventory to property and equipment, net | 46,855 | 37,822 | 4,547 | ||||||||
Supplemental disclosures: | |||||||||||
Cash payments for interest | $ | 104,619 | $ | 58,810 | $ | 26,393 | |||||
Cash payments for income taxes, net | 28,104 | 39,745 | 114,512 | ||||||||
See Notes to Consolidated Financial Statements
Continues on next page
Lam Research Corporation 2017 10-K 54
LAM RESEARCH CORPORATION
CONSOLIDATED STATEMENTS OF STOCKHOLDERS’ EQUITY
(in thousands)
Common Stock Shares | Common Stock | Additional Paid-in Capital | Treasury Stock | Accumulated Other Comprehensive Income(Loss) | Retained Earnings | Total | ||||||||||||||||||||
Balance at June 29, 2014 | 162,350 | $ | 162 | $ | 5,239,567 | $ | (3,757,076 | ) | $ | (28,655 | ) | $ | 3,575,737 | $ | 5,029,735 | |||||||||||
Sale of common stock | 2,876 | 4 | 17,519 | — | — | — | 17,523 | |||||||||||||||||||
Purchase of treasury stock | (7,638 | ) | (8 | ) | — | (573,096 | ) | — | — | (573,104 | ) | |||||||||||||||
Income tax benefits on equity-based compensation plans | — | — | 11,316 | — | — | — | 11,316 | |||||||||||||||||||
Reissuance of treasury stock | 943 | 1 | 21,477 | 27,325 | — | — | 48,803 | |||||||||||||||||||
Equity-based compensation expense | — | — | 135,354 | — | — | — | 135,354 | |||||||||||||||||||
Reclassification from temporary to permanent equity | — | — | (58,460 | ) | — | — | — | (58,460 | ) | |||||||||||||||||
Net income | — | — | — | — | — | 655,577 | 655,577 | |||||||||||||||||||
Other comprehensive income | — | — | — | — | (29,141 | ) | — | (29,141 | ) | |||||||||||||||||
Cash dividends declared ($0.84 per common share) | — | — | — | — | — | (134,459 | ) | (134,459 | ) | |||||||||||||||||
Balance at June 28, 2015 | 158,531 | 159 | 5,366,773 | (4,302,847 | ) | (57,796 | ) | 4,096,855 | 5,103,144 | |||||||||||||||||
Sale of common stock | 2,863 | 2 | 3,403 | — | — | — | 3,405 | |||||||||||||||||||
Purchase of treasury stock | (2,130 | ) | (2 | ) | — | (155,132 | ) | — | — | (155,134 | ) | |||||||||||||||
Income tax benefits on equity-based compensation plans | — | — | (1,023 | ) | — | — | — | (1,023 | ) | |||||||||||||||||
Reissuance of treasury stock | 937 | 1 | 27,329 | 28,662 | — | — | 55,992 | |||||||||||||||||||
Equity-based compensation expense | — | — | 142,348 | — | — | — | 142,348 | |||||||||||||||||||
Effect of conversion of convertible notes | — | — | (188 | ) | — | — | — | (188 | ) | |||||||||||||||||
Reclassification from temporary to permanent equity | — | — | 34,256 | — | — | — | 34,256 | |||||||||||||||||||
Net income | — | — | — | — | — | 914,049 | 914,049 | |||||||||||||||||||
Other comprehensive income | — | — | — | — | (11,537 | ) | — | (11,537 | ) | |||||||||||||||||
Cash dividends declared ($1.20 per common share) | — | — | — | — | — | (190,795 | ) | (190,795 | ) | |||||||||||||||||
Balance at June 26, 2016 | 160,201 | 160 | 5,572,898 | (4,429,317 | ) | (69,333 | ) | 4,820,109 | 5,894,517 | |||||||||||||||||
Sale of common stock | 2,661 | 3 | 12,910 | — | — | — | 12,913 | |||||||||||||||||||
Purchase of treasury stock | (5,322 | ) | (5 | ) | — | (811,667 | ) | — | — | (811,672 | ) | |||||||||||||||
Income tax benefits on equity-based compensation plans | — | — | 38,747 | — | — | — | 38,747 | |||||||||||||||||||
Reissuance of treasury stock | 825 | 1 | 34,865 | 24,797 | — | — | 59,663 | |||||||||||||||||||
Equity-based compensation expense | — | — | 149,975 | — | — | — | 149,975 | |||||||||||||||||||
Effect of conversion of convertible notes, net of income tax benefit | 1,388 | 1 | (1,596 | ) | — | — | — | (1,595 | ) | |||||||||||||||||
Exercise of warrants | 1,970 | 2 | (5 | ) | — | — | — | (3 | ) | |||||||||||||||||
Reclassification to temporary from permanent equity, net | — | — | 37,691 | — | — | — | 37,691 | |||||||||||||||||||
Net income | — | — | — | — | — | 1,697,763 | 1,697,763 | |||||||||||||||||||
Other comprehensive income | — | — | — | — | 7,633 | — | 7,633 | |||||||||||||||||||
Cash dividends declared ($1.65 per common share) | — | — | — | — | — | (268,181 | ) | (268,181 | ) | |||||||||||||||||
Balance at June 25, 2017 | 161,723 | $ | 162 | $ | 5,845,485 | $ | (5,216,187 | ) | $ | (61,700 | ) | $ | 6,249,691 | $ | 6,817,451 | |||||||||||
See Notes to Consolidated Financial Statements
Continues on next page
Lam Research Corporation 2017 10-K 55
NOTES TO CONSOLIDATED FINANCIAL STATEMENTS
June 25, 2017
Note 1: Company and Industry Information
The Company designs, manufactures, markets, refurbishes, and services semiconductor processing equipment used in the fabrication of integrated circuits. Semiconductor manufacturing, our customers’ business, involves the complete fabrication of multiple dies or integrated circuits on a wafer. This involves the repetition of a set of core processes and can require hundreds of individual steps. Fabricating these devices requires highly sophisticated process technologies to integrate an increasing array of new materials with precise control at the atomic scale. Along with meeting technical requirements, wafer processing equipment must deliver high productivity and be cost-effective.
The Company sells its products and services primarily to companies involved in the production of semiconductors in the United States, China, Europe, Japan, Korea, Southeast Asia, and Taiwan.
The semiconductor industry is cyclical in nature and has historically experienced periodic downturns and upturns. Today’s leading indicators of changes in customer investment patterns, such as electronics demand, memory pricing, and foundry utilization rates, may not be any more reliable than in prior years. Demand for the Company’s equipment can vary significantly from period to period as a result of various factors including, but not limited to economic conditions; supply, demand, and prices for semiconductors; customer capacity requirements; and the Company’s ability to develop and market competitive products. For these and other reasons, the Company’s results of operations for fiscal years 2017, 2016, and 2015 may not necessarily be indicative of future operating results.
Note 2: Summary of Significant Accounting Policies
The preparation of financial statements in conformity with GAAP requires management to make judgments, estimates, and assumptions that could affect the reported amounts of assets and liabilities at the date of the financial statements and the reported amounts of revenue and expenses during the reporting period. The Company bases its estimates and assumptions on historical experience and on various other assumptions it believes to be applicable and evaluates them on an ongoing basis to ensure they remain reasonable under current conditions. Actual results could differ significantly from those estimates.
Revenue Recognition: The Company recognizes revenue when persuasive evidence of an arrangement exists, delivery has occurred and title has passed or services have been rendered, the selling price is fixed or determinable, collection of the receivable is reasonably assured, and the Company has received customer acceptance or is otherwise released from its customer acceptance obligations. If terms of the sale provide for a lapsing customer acceptance period, the Company recognizes revenue upon the expiration of the lapsing acceptance period or customer acceptance, whichever occurs first. If the practices of a customer do not provide for a written acceptance or the terms of sale do not include a lapsing acceptance provision, the Company recognizes revenue when it can be reliably demonstrated that the delivered system meets all of the agreed-to customer specifications. In situations with multiple deliverables, the Company recognizes revenue upon the delivery of the separate elements to the customer and when the Company receives customer acceptance or is otherwise released from its customer acceptance obligations. The Company allocates revenue from multiple-element arrangements among the separate elements using their relative selling prices based on the Company’s best estimate of selling price. The Company’s sales arrangements do not include a general right of return. The maximum revenue recognized on a delivered element is limited to the amount that is not contingent upon the delivery of additional items. The Company generally recognizes revenue related to sales of spare parts and system upgrade kits upon shipment. The Company generally recognizes revenue related to services upon completion of the services requested by a customer order. The Company recognizes revenue for extended maintenance service contracts with a fixed payment amount on a straight-line basis over the term of the contract. When goods or services have been delivered to the customer but all conditions for revenue recognition have not been met, deferred revenue and deferred costs are recognized in deferred profit on the Consolidated Balance Sheet.
Inventory Valuation: Inventories are stated at the lower of cost or market using standard costs that approximate actual costs on a first-in, first-out basis. Finished goods are reported as inventories until the point of title transfer
Continues on next page
Lam Research Corporation 2017 10-K 56
to the customer. Unless specified in the terms of sale, title generally transfers at the physical transfer of the products to the freight carriers. Transfer of title for shipments to Japanese customers occurs at the time of customer acceptance.
Management evaluates the need to record adjustments for impairment of inventory at least quarterly. The Company’s policy is to assess the valuation of all inventories including manufacturing raw materials, work-in-process, finished goods, and spare parts in each reporting period. Obsolete inventory or inventory in excess of management’s estimated usage requirement is written down to its estimated market value if less than cost. Estimates of market value include but are not limited to management’s forecasts related to the Company’s future manufacturing schedules, customer demand, technological and/or market obsolescence, general semiconductor market conditions, and possible alternative uses. If future customer demand or market conditions are less favorable than the Company’s projections, additional inventory write-downs may be required and would be reflected in cost of goods sold in the period in which the revision is made.
Warranty: Typically, the sale of semiconductor capital equipment includes providing parts and service warranties to customers as part of the overall price of the system. The Company provides standard warranties for its systems. The Company records a provision for estimated warranty expenses to cost of sales for each system when it recognizes revenue. The Company does not maintain general or unspecified reserves; all warranty reserves are related to specific systems. All actual or estimated parts and labor costs incurred in subsequent periods are charged to those established reserves on a system-by-system basis.
While the Company periodically monitors the performance and cost of warranty activities, if actual costs incurred are different than its estimates, the Company may recognize adjustments to provisions in the period in which those differences arise or are identified. In addition to the provision of standard warranties, the Company offers customer-paid extended warranty services. Revenues for extended maintenance and warranty services with a fixed payment amount are recognized on a straight-line basis over the term of the contract. Related costs are recorded as incurred.
Equity-Based Compensation — Employee Stock Purchase Plan and Employee Stock Plans: The Company recognizes the fair value of equity-based compensation expense. The Company determines the fair value of its RSUs, excluding market-based performance RSUs, based upon the fair market value of Company’s Common Stock at the date of grant, discounted for dividends. The Company estimates the fair value of its market-based performance RSUs using a Monte Carlo simulation model at the date of the grant. The Company estimates the fair value of its stock options and ESPP awards using a Black-Scholes option valuation model. This model requires the input of highly subjective assumptions, including expected stock price volatility and the estimated life of each award. The Company amortizes the fair value of equity-based awards over the vesting periods of the award, and the Company has elected to use the straight-line method of amortization.
The Company makes quarterly assessments of the adequacy of its tax credit pool related to equity-based compensation to determine if there are any deficiencies that it is required to recognize in the Company’s Consolidated Statements of Operations. The Company will only recognize a benefit from equity-based compensation in paid-in-capital if it realizes an incremental tax benefit after all other tax attributes currently available have been utilized. In addition, the Company has elected to account for the indirect benefits of equity-based compensation on the research tax credit through the income statement rather than through paid-in-capital. The Company also elected to net deferred tax assets and the associated valuation allowance related to net operating loss and tax credit carryforwards for the accumulated stock award tax benefits for income tax footnote disclosure purposes. The Company tracks these stock award attributes separately and will only recognize these attributes through paid-in-capital.
Income Taxes: Deferred income taxes reflect the net tax effect of temporary differences between the carrying amount of assets and liabilities for financial reporting purposes and the amounts used for income tax purposes, as well as the tax effect of carryforwards. The Company records a valuation allowance to reduce its deferred tax assets to the amount that is more-likely-than-not to be realized. Realization of our net deferred tax assets is dependent on future taxable income. The Company believes it is more-likely-than-not that such assets will be realized; however, ultimate realization could be negatively impacted by market conditions and other variables not known or anticipated at this time. In the event that the Company determines that it would not be able to realize all or part of our net deferred tax assets, an adjustment would be charged to earnings in the period such determination is made. Likewise, if the Company later determines that it is more-likely-than-not that the deferred tax assets would be realized, then the previously provided valuation allowance would be reversed.
Continues on next page
Lam Research Corporation 2017 10-K 57
The Company recognizes the benefit from a tax position only if it is more-likely-than-not that the position would be sustained upon audit based solely on the technical merits of the tax position. The Company’s policy is to include interest and penalties related to unrecognized tax benefits as a component of income tax expense.
Goodwill and Intangible Assets: The valuation of intangible assets acquired in a business combination requires the use of management estimates including but not limited to estimating future expected cash flows from assets acquired and determining discount rates. Management’s estimates of fair value are based upon assumptions believed to be reasonable, but which are inherently uncertain and unpredictable, and as a result, actual results may differ from estimates. Estimates associated with the accounting for acquisitions may change as additional information becomes available.
Goodwill represents the amount by which the purchase price in each business combination exceeds the fair value of the net tangible and identifiable intangible assets acquired. Each component of the Company for which discrete financial information is available and for which management regularly reviews the results of operations is considered a reporting unit. All goodwill acquired in a business combination is assigned to one or more reporting units as of the acquisition date. Goodwill is assigned to the Company’s reporting units that are expected to benefit from the synergies of the combination. The goodwill assigned to a reporting unit is the difference between the acquisition consideration assigned to the reporting unit on a relative fair value basis and the fair value of acquired assets and liabilities that can be specifically attributed to the reporting unit. The Company tests goodwill and identifiable intangible assets with indefinite useful lives for impairment at least annually. The Company amortizes intangible assets with estimable useful lives over their respective estimated useful lives, and the Company reviews for impairment whenever events or changes in circumstances indicate that the carrying amount of the intangible asset may not be recoverable and the carrying amount exceeds its fair value.
The Company reviews goodwill at least annually for impairment. If certain events or indicators of impairment occur between annual impairment tests, the Company would perform an impairment test at that date. In testing for a potential impairment of goodwill, the Company (1) allocates goodwill to its reporting units to which the acquired goodwill relates, (2) estimates the fair value of its reporting units, and (3) determines the carrying value (book value) of those reporting units. Furthermore, if the estimated fair value of a reporting unit is less than the carrying value, the Company must estimate the fair value of all identifiable assets and liabilities of that reporting unit, in a manner similar to a purchase price allocation for an acquired business. This can require independent valuations of certain internally generated and unrecognized intangible assets such as in-process R&D and developed technology. Only after this process is completed can the amount of goodwill impairment, if any, be determined. In the Company’s goodwill impairment process, it first assesses qualitative factors to determine whether it is necessary to perform a quantitative analysis. The Company does not calculate the fair value of a reporting unit unless the Company determines, based on a qualitative assessment, that it is more-likely-than-not that its fair value is less than its carrying amount. The Company performs an annual goodwill impairment analysis as of the first day of its fourth fiscal quarter. The Company did not record impairments of goodwill during the years ended June 25, 2017, and June 26, 2016. For the year ended June 28, 2015, the Company recorded an impairment charge on its Single-Wafer Clean reporting unit of approximately $79.4 million.
The process of evaluating the potential impairment of goodwill is subjective and requires significant judgment at many points during the analysis. The Company determines the fair value of its reporting units by using an income approach. Under the income approach, the Company determines fair value based on estimated future cash flows of each reporting unit, discounted by an estimated weighted-average cost of capital, which reflects the overall level of inherent risk of a reporting unit and the rate of return an outside investor would expect to earn.
In estimating the fair value of a reporting unit, the Company makes estimates and judgments about the future cash flows of its reporting units, including estimated growth rates and assumptions about the economic environment. Although the Company’s cash flow forecasts are based on assumptions that are consistent with the plans and estimates it is using to manage the underlying businesses, there is significant judgment involved in determining the cash flows attributable to a reporting unit. In addition, the Company makes certain judgments about allocating shared assets to the estimated balance sheets of its reporting units. Changes in judgment on these assumptions and estimates could result in a goodwill impairment charge.
As a result, several factors could result in impairment of a material amount of the Company’s goodwill balance in future periods, including but not limited to: (1) weakening of the global economy, weakness in the semiconductor equipment industry, or failure of the Company to reach its internal forecasts, which could impact the Company’s ability to achieve its forecasted levels of cash flows and reduce the estimated discounted cash flow value of its
Continues on next page
Lam Research Corporation 2017 10-K 58
reporting units and (2) a decline in the Company’s stock price and resulting market capitalization and to the extent the Company determines that the decline is sustained and indicates a reduction in the fair value of the Company’s reporting units below their carrying value. Further, the value assigned to intangible assets, other than goodwill, is based on estimates and judgments regarding expectations such as the success and lifecycle of products and technology acquired. If actual product acceptance differs significantly from the estimates, the Company may be required to record an impairment charge to write down the asset to its realizable value.
The Company reviews indefinite-lived intangible assets for an impairment annually or when events or circumstances indicate the carrying value may not be recoverable. Factors that may be a change in circumstances, indicating the carrying value of intangible assets subject to amortization may not be recoverable, include a reduced future cash flow estimate and slower growth rates in the industry segment in which the Company participates. The Company determines whether the sum of the estimated undiscounted cash flows attributable to the assets is less than their carrying value. If the sum is less, the Company recognizes an impairment loss based on the excess of the carrying amount of the assets over their respective fair values. Fair value is determined by discounted future cash flows, appraisals, or other methods. The Company recognizes an impairment charge to the extent the present value of anticipated net cash flows attributable to the asset are less than the asset’s carrying value. The Company did not record any impairment charge on indefinite-lived assets during the years ended June 25, 2017, June 26, 2016, or June 28, 2015.
Impairment of Long-Lived Assets (Excluding Goodwill and Indefinite-Lived Intangibles): The Company routinely considers whether indicators of impairment of long-lived assets are present. If such indicators are present, the Company determines whether the sum of the estimated undiscounted cash flows attributable to the assets is less than their carrying value. If the sum is less, the Company recognizes an impairment loss based on the excess of the carrying amount of the assets over their respective fair values. Fair value is determined by discounted future cash flows, appraisals, or other methods. The Company recognizes an impairment charge to the extent the present value of anticipated net cash flows attributable to the asset are less than the asset’s carrying value. The fair value of the asset then becomes the asset’s new carrying value, which the Company depreciates over the remaining estimated useful life of the asset. Assets to be disposed of are reported at the lower of the carrying amount or fair value. The Company did not record an impairment loss in the years ended June 25, 2017, or June 26, 2016. The Company recorded a $9.8 million impairment loss on long-lived assets during the year ended June 28, 2015.
Fiscal Year: The Company follows a 52/53-week fiscal reporting calendar, and its fiscal year ends on the last Sunday of June each year. The Company’s most recent fiscal years ended on June 25, 2017, June 26, 2016, and June 28, 2015, and each included 52 weeks.
Principles of Consolidation: The Consolidated Financial Statements include the accounts of the Company and its wholly owned subsidiaries. All intercompany accounts and transactions have been eliminated in consolidation.
Cash Equivalents and Investments: Investments purchased with an original maturity of three months or less are considered cash equivalents. The Company also invests in certain mutual funds, which include equity and fixed- income securities, related to its obligations under its deferred compensation plan, and such investments are classified as trading securities on the consolidated balance sheets. All of the Company’s other investments are classified as available-for-sale at the respective balance sheet dates. The Company accounts for its investment portfolio at fair value. Investments classified as trading securities are recorded at fair value based upon quoted market prices. Differences between the cost and fair value of trading securities are recognized as “Other income (expense)” in the Consolidated Statement of Operations. The investments classified as available-for-sale are recorded at fair value based upon quoted market prices, and difference between the cost and fair value of available-for-sale securities is presented as a component of accumulated other comprehensive income (loss). Unrealized losses on available-for-sale securities are charged against other income (expense) when a decline in fair value is determined to be other than temporary. The Company considers several factors to determine whether a loss is other than temporary. These factors include but are not limited to (1) the extent to which the fair value is less than cost basis, (2) the financial condition and near-term prospects of the issuer, (3) the length of time a security is in an unrealized loss position, and (4) the Company’s ability to hold the security for a period of time sufficient to allow for any anticipated recovery in fair value. The Company’s ongoing consideration of these factors could result in additional impairment charges in the future, which could adversely affect its results of operation. An other-than-temporary impairment is triggered when there is an intent to sell the security, it is more-likely-than-not that the security will be required to be sold before recovery, or the security is not expected to
Continues on next page
Lam Research Corporation 2017 10-K 59
recover the entire amortized cost basis of the security. Other-than-temporary impairments attributed to credit losses are recognized in the income statement. The specific identification method is used to determine the realized gains and losses on investments.
Allowance for Doubtful Accounts: The Company evaluates its allowance for doubtful accounts based on a combination of factors. In circumstances where specific invoices are deemed to be uncollectible, the Company provides a specific allowance for bad debt against the amount due to reduce the net recognized receivable to the amount it reasonably believes will be collected. The Company also provides allowances based on its write-off history.
Property and Equipment: Property and equipment is stated at cost. Equipment is depreciated by the straight-line method over the estimated useful lives of the assets, generally three to five years. Furniture and fixtures are depreciated by the straight-line method over the estimated useful lives of the assets, generally five years. Software is amortized by the straight-line method over the estimated useful lives of the assets, generally three to five years. Buildings are depreciated by the straight-line method over the estimated useful lives of the assets, generally twenty-five years. Leasehold improvements are generally amortized by the straight-line method over the shorter of the life of the related asset or the term of the underlying lease. Amortization of capital leases is included with depreciation expense.
Derivative Financial Instruments: In the normal course of business, the Company’s financial position is routinely subjected to market risk associated with foreign currency exchange rate fluctuations. The Company’s policy is to mitigate the effect of these exchange rate fluctuations on certain foreign currency denominated business exposures. The Company has a policy that allows the use of derivative financial instruments to hedge foreign currency exchange rate fluctuations on forecasted revenue and expenses and net monetary assets or liabilities denominated in various foreign currencies. The Company carries derivative financial instruments (derivatives) on the balance sheet at their fair values. The Company does not use derivatives for trading or speculative purposes. The Company does not believe that it is exposed to more than a nominal amount of credit risk in its interest rate and foreign currency hedges, as counterparties are large, global and well-capitalized financial institutions. The Company’s exposures are in liquid currencies (Japanese yen, Swiss francs, euros, Taiwanese dollars, Chinese renminbi, Singapore dollars, and Korean won), so there is minimal risk that appropriate derivatives to maintain the Company’s hedging program would not be available in the future.
To hedge foreign currency risks, the Company uses foreign currency exchange forward and option contracts, where possible and prudent. These hedge contracts are valued using standard valuation formulas with assumptions about future foreign currency exchange rates derived from existing exchange rates, interest rates, and other market factors.
The Company considers its most current forecast in determining the level of foreign currency denominated revenue and expenses to hedge as cash flow hedges. The Company combines these forecasts with historical trends to establish the portion of its expected volume to be hedged. The revenue and expenses are hedged and designated as cash flow hedges to protect the Company from exposures to fluctuations in foreign currency exchange rates. If the underlying forecasted transaction does not occur, or it becomes probable that it will not occur, the related hedge gains and losses on the cash flow hedge are reclassified from accumulated other comprehensive income (loss) to other income (expense), net on the Consolidated Statement of Operations at that time.
Guarantees: The Company has certain operating leases that contain provisions whereby the properties subject to the operating leases may be remarketed at lease expiration. The Company has guaranteed to the lessor an amount approximating the lessor’s investment in the property. Also, the Company’s guarantees generally include certain indemnifications to its lessors under operating lease agreements for environmental matters, potential overdraft protection obligations to financial institutions related to one of the Company’s subsidiaries, indemnifications to the Company’s customers for certain infringement of third-party intellectual property rights by its products and services, and the Company’s warranty obligations under sales of its products.
Foreign Currency Translation: The Company’s non-U.S. subsidiaries that operate in a local currency environment, where that local currency is the functional currency, primarily generate and expend cash in their local currency. Accordingly, all balance sheet accounts of these local functional currency subsidiaries are translated into U.S. dollars at the fiscal period-end exchange rate, and income and expense accounts are translated into U.S. dollars using average rates in effect for the period, except for costs related to those balance
Continues on next page
Lam Research Corporation 2017 10-K 60
sheet items that are translated using historical exchange rates. The resulting translation adjustments are recorded as cumulative translation adjustments and are a component of accumulated other comprehensive income (loss). Translation adjustments are recorded in other income (expense), net, where the U.S. dollar is the functional currency.
Note 3: Recent Accounting Pronouncements
Recently Adopted
In April 2015, the Financial Accounting Standards Board (“FASB”) released Accounting Standards Update (“ASU”) 2015-3, “Interest – Imputation of Interest.” The amendment requires that debt issuance costs related to recognized debt liability be presented in the balance sheet as a direct deduction from the carrying amount of that debt liability, consistent with debt discounts. The Company adopted this standard starting in the first quarter of fiscal 2017, with retrospective application to the June 26, 2016 Consolidated Balance Sheet. The adoption did not have a material impact to the Consolidated Financial Statements.
In September 2015, the FASB released ASU 2015-16, “Business Combinations – Simplifying the Accounting for Measurement-Period Adjustments,” which eliminates the requirement to restate prior period financial statements for measurement period adjustments. Instead, the cumulative impact of measurement period adjustments, including the impact on prior periods, is required to be recognized in the reporting period in which the adjustment is identified. The Company adopted this standard in the first quarter of fiscal 2017, with no impact to the Consolidated Financial Statements.
Updates Not Yet Effective
In May 2014, the FASB released ASU 2014-9, “Revenue from Contracts with Customers,” to supersede nearly all existing revenue recognition guidance under GAAP. The FASB issued subsequent amendments to the initial guidance in August 2015, March 2016, April 2016, May 2016 and December 2016 within ASU 2015–14, ASU 2016–08, ASU 2016–10, ASU 2016–12 and ASU 2016–20, respectively.The core principle of the standard is to recognize revenues when promised goods or services are transferred to customers in an amount that reflects the consideration that is expected to be received for those goods or services. The new standard defines a five-step process to achieve this core principle and, in doing so, it is possible more judgment and estimates may be required within the revenue recognition process than required under existing GAAP, including identifying performance obligations in the contract, estimating the amount of variable consideration to include in the transaction price, and allocating the transaction price to each separate performance obligation.
The Company is required to adopt these standards starting in the first quarter of fiscal year 2019 using either of two methods: (1) retrospective to each prior reporting period presented with the option to elect certain practical expedients as defined within the standard or (2) retrospective with the cumulative effect of initially applying the standard recognized at the date of initial application and providing certain additional disclosures as defined per the standard. The Company has not yet selected a transition method. The Company is continuing its evaluation of the impact that the new standard will have on its Consolidated Financial Statements and disclosures, business processes, systems, and controls. While the Company’s evaluation of the impact of the standard on its financial statements with respect to its spare parts and service revenue has not been completed, the Company believes that the timing of revenue recognition for certain of its systems will generally be earlier than under existing revenue recognition guidance. The Company continues to evaluate the impact to our revenues related to our pending adoption of these standards and our preliminary assessments are subject to change.
In November 2015, the FASB issued ASU 2015-17, “Balance Sheet Classification of Deferred Taxes.” This ASU amends existing guidance to require that deferred income tax assets and liabilities be classified as non-current in a classified balance sheet and eliminates the prior guidance which required an entity to separate deferred tax assets and liabilities into a current amount and a non-current amount in a classified balance sheet. The amendments in this ASU are effective for the Company beginning in its first quarter of fiscal year 2018. Additionally, the new guidance may be applied either prospectively to all deferred tax assets and liabilities or retrospectively to all periods presented. The Company plans to adopt the guidance prospectively in its first quarter of fiscal year 2018 with an anticipated reclassification from current assets and liabilities to non-current assets and liabilities on its Consolidated Balance Sheet.
Continues on next page
Lam Research Corporation 2017 10-K 61
In January 2016, the FASB released ASU 2016-1, “Financial Instruments – Overall – Recognition and Measurement of Financial Assets and Financial Liabilities.” The amendment changes the accounting for and financial statement presentation of equity investments, other than those accounted for under the equity method of accounting or those that result in consolidation of the investee. The amendment provides clarity on the measurement methodology to be used for the required disclosure of fair value of financial instruments measured at amortized cost on the balance sheet and clarifies that an entity should evaluate the need for a valuation allowance on deferred tax assets related to available-for-sale securities in combination with the entity’s other deferred tax assets, among other changes. The Company is required to adopt this standard starting in the first quarter of fiscal year 2019 and does not anticipate that implementation will have a material impact on its Consolidated Financial Statements.
In January 2016, the FASB released ASU 2016-2, “Leases.” The amendment requires an entity to recognize right-of-use assets and lease liabilities on its balance sheet and disclose key information about leasing arrangements. The amendment offers specific accounting guidance for a lessee, a lessor, and sale and leaseback transactions. Lessees and lessors are required to disclose qualitative and quantitative information about leasing arrangements to enable a user of the financial statements to assess the amount, timing, and uncertainty of cash flows arising from leases. The Company is required to adopt this standard starting in the first quarter of fiscal year 2020. Early adoption is permitted. The Company is currently in the process of evaluating the impact of adoption on its Consolidated Financial Statements.
In March 2016, the FASB released ASU 2016-9, “Compensation – Stock Compensation.” Key changes in the amendment include:
• | entities will be required to recognize all excess tax benefits or deficiencies as an income tax benefit or expense in the income statement, eliminating additional paid in capital (“APIC”) pools; |
• | entities will no longer be required to delay recognition of excess tax benefits until they are realized; |
• | entities will be required to classify the excess tax benefits as an operating activity in the statement of cash flows; |
• | entities will be allowed to elect an accounting policy to either estimate the number of forfeitures or account for forfeitures as they occur; and |
• | entities can withhold up to the maximum individual statutory tax rate without classifying the awards as a liability, the cash paid to satisfy the statutory income tax withholding obligations shall be classified as a financing activity in the statement of cash flows. |
The Company is required to adopt this standard in the first quarter of fiscal year 2018. The Company expects the provisions for the change in the recognition of future excess tax benefits or deficiencies and statement of cash flow changes regarding the same measure will be adopted prospectively, and the provisions for the change in recognition of excess tax benefits for all years prior to the year of adoption will be applied using a modified retrospective approach with a cumulative adjustment to retained earnings. The Company plans to continue to estimate the number of forfeitures. The Company is currently in the process of evaluating the impact of adoption on its Consolidated Financial Statements.
In June 2016, the FASB released ASU 2016-13, “Financial Instruments – Credit Losses.” The amendment revises the impairment model to utilize an expected loss methodology in place of the currently used incurred loss methodology, which will result in more timely recognition of losses on financial instruments, including but not limited to available-for-sale debt securities and accounts receivable. The Company is required to adopt this standard starting in the first quarter of fiscal year 2021. Early adoption is permitted. The Company is currently in the process of evaluating the impact of adoption on its Consolidated Financial Statements.
In August 2016, the FASB released ASU 2016-15, “Statement of Cash Flows – Classification of Certain Cash Receipts and Cash Payments.” The amendment provides and clarifies guidance on the classification of certain cash receipts and cash payments in the statement of cash flows to eliminate diversity in practice. The Company is required to adopt the standard update in the first quarter of fiscal year 2020, with a retrospective transition method required. Early adoption is permitted. The Company is currently in the process of evaluating the impact of adoption on its Consolidated Financial Statements.
In October 2016, the FASB released ASU 2016-16, “Income Tax – Intra-Entity Transfers of Assets Other than Inventory.” This standard update improves the accounting for the income tax consequences of intra-entity
Continues on next page
Lam Research Corporation 2017 10-K 62
transfers of assets other than inventory. Early adoption is permitted. The Company is required to adopt the standard in the first quarter of fiscal year 2019. The Company is currently in the process of evaluating the impact of adoption on its Consolidated Financial Statements.
In November 2016, the FASB released ASU 2016-18, “Statement of Cash Flows – Restricted Cash.” This standard update requires that restricted cash and restricted cash equivalents be included in cash and cash equivalents when reconciling the beginning-of-period and end-of-period total amounts shown in the statement of cash flows. The Company is required to adopt this standard in the first quarter of fiscal year 2019, with a retrospective transition method required. Early adoption is permitted. The Company is currently in the process of evaluating the impact of adoption on its Consolidated Financial Statements.
Note 4: Equity-Based Compensation Plans
The Company has stock plans that provide for grants of equity-based awards to eligible participants, including stock options and restricted stock units, of the Company’s Common Stock. An option is a right to purchase Common Stock at a set price. An RSU award is an agreement to issue a set number of shares of Common Stock at the time of vesting. The Company’s options and RSU awards typically vest over a period of three years or less. The Company also has an employee stock purchase plan that allows employees to purchase its Common Stock at a discount through payroll deductions.
The Company recognized the following equity-based compensation expense and benefits in the Consolidated Statements of Operations:
Year Ended | |||||||||||
June 25, 2017 | June 26, 2016 | June 28, 2015 | |||||||||
(in thousands) | |||||||||||
Equity-based compensation expense | $ | 149,975 | $ | 142,348 | $ | 135,354 | |||||
Income tax benefit recognized related to equity-based compensation | $ | 38,381 | $ | 37,814 | $ | 23,660 | |||||
Income tax benefit realized from the exercise and vesting of options and RSUs | $ | 92,749 | $ | 67,756 | $ | 40,401 | |||||
The estimated fair value of the Company’s equity-based awards, less expected forfeitures, is amortized over the awards’ vesting terms on a straight-line basis.
Stock Options and RSUs
The Lam Research Corporation 2007 Stock Incentive Plan, as amended and restated, 2011 Stock Incentive Plan, as amended and restated, and the 2015 Stock Incentive Plan (collectively the “Stock Plans”), provide for the grant of non-qualified equity-based awards to eligible employees, consultants and advisors, and non-employee directors of the Company and its subsidiaries. The 2015 Stock Incentive Plan was approved by shareholders on November 4, 2015, and authorizes up to 18,000,000 shares available for issuance under the plan. Additionally, 1,232,068 shares that remained available for grants under the Company’s 2007 Stock Incentive Plan were added to the shares available for issuance under the 2015 Stock Incentive Plan. As of June 25, 2017, there were a total of 11,893,338 shares available for future issuance under the Stock Plans.
Continues on next page
Lam Research Corporation 2017 10-K 63
A summary of stock plan transactions is as follows:
Options Outstanding | Restricted Stock Units Outstanding | ||||||||||||
Number of Shares | Weighted-Average Exercise Price | Number of Shares | Weighted-Average Fair Market Value at Grant | ||||||||||
June 29, 2014 | 1,331,886 | $ | 32.20 | 5,635,469 | $ | 45.83 | |||||||
Granted | 76,659 | $ | 80.60 | 1,804,937 | $ | 79.74 | |||||||
Exercised | (564,558 | ) | $ | 31.05 | N/A | N/A | |||||||
Canceled | (8,155 | ) | $ | 29.32 | (174,879 | ) | $ | 50.16 | |||||
Vested restricted stock | N/A | N/A | (2,311,439 | ) | $ | 41.17 | |||||||
June 28, 2015 | 835,832 | $ | 37.44 | 4,954,088 | $ | 60.13 | |||||||
Granted | 196,167 | $ | 75.57 | 2,230,851 | $ | 71.87 | |||||||
Exercised | (123,726 | ) | $ | 24.92 | N/A | N/A | |||||||
Canceled | (862 | ) | $ | 21.43 | (110,131 | ) | $ | 69.17 | |||||
Vested restricted stock | N/A | N/A | (2,739,704 | ) | $ | 54.04 | |||||||
June 26, 2016 | 907,411 | $ | 47.41 | 4,335,104 | $ | 69.30 | |||||||
Granted | 90,128 | $ | 119.67 | 1,660,571 | $ | 113.75 | |||||||
Exercised | (389,460 | ) | $ | 33.92 | N/A | N/A | |||||||
Canceled | (14,020 | ) | $ | 69.81 | (175,975 | ) | $ | 73.31 | |||||
Vested restricted stock | N/A | N/A | (2,269,639 | ) | $ | 63.24 | |||||||
June 25, 2017 | 594,059 | $ | 66.69 | 3,550,061 | $ | 90.03 | |||||||
As of June 25, 2017, there were a total of 4,144,120 shares subject to options and RSUs issued and outstanding under the Company’s Stock Plans.
Outstanding and exercisable options presented by price range at June 25, 2017, were as follows:
Range of Exercise Prices | Options Outstanding | Options Exercisable | |||||||||||||
Number of Options Outstanding | Weighted-Average Remaining Life (Years) | Weighted-Average Exercise Price | Number of Options Exercisable | Weighted-Average Exercise Price | |||||||||||
$11.09-$23.59 | 57,020 | 3.62 | $ | 18.04 | 57,020 | $ | 18.04 | ||||||||
$28.73-$35.68 | 52,606 | 3.63 | $ | 31.18 | 52,606 | $ | 31.18 | ||||||||
$42.61-$51.76 | 150,539 | 3.37 | $ | 49.21 | 150,539 | $ | 49.21 | ||||||||
$75.57-$119.67 | 333,894 | 5.75 | $ | 88.46 | 94,399 | $ | 77.77 | ||||||||
$11.09-$119.67 | 594,059 | 4.63 | $ | 66.69 | 354,564 | $ | 49.13 | ||||||||
Stock Options
The fair value of the Company’s stock options granted during fiscal years 2017, 2016, and 2015 was estimated using a Black-Scholes option valuation model. This model requires the input of highly subjective assumptions, including expected stock price volatility and the estimated life of each award:
Year Ended | ||||||||
June 25, 2017 | June 26, 2016 | June 28, 2015 | ||||||
Expected volatility | 28.85 | % | 33.08 | % | 34.45 | % | ||
Risk-free interest rate | 1.92 | % | 1.27 | % | 1.46 | % | ||
Expected term (years) | 4.75 | 4.79 | 4.80 | |||||
Dividend yield | 1.50 | % | 1.59 | % | 0.89 | % | ||
Continues on next page
Lam Research Corporation 2017 10-K 64
The year-end intrinsic value relating to stock options for fiscal years 2017, 2016, and 2015 is presented below:
Year Ended | |||||||||||
June 25, 2017 | June 26, 2016 | June 28, 2015 | |||||||||
(in thousands) | |||||||||||
Intrinsic value - options outstanding | $ | 50,551 | $ | 31,643 | $ | 37,961 | |||||
Intrinsic value - options exercisable | $ | 36,396 | $ | 29,112 | $ | 33,360 | |||||
Intrinsic value - options exercised | $ | 29,674 | $ | 6,562 | $ | 26,806 | |||||
As of June 25, 2017, the Company had $4.7 million of total unrecognized compensation expense related to unvested stock options granted and outstanding which is expected to be recognized over a weighted-average remaining period of 2.2 years.
Restricted Stock Units
During the fiscal years 2017, 2016, and 2015, the Company issued both service-based RSUs and market-based performance RSUs (“PRSUs”).
The fair value of the Company’s service-based RSUs was calculated based on fair market value of the Company’s stock at the date of grant, discounted for dividends, using the following assumptions:
Year Ended | ||||||||
June 25, 2017 | June 26, 2016 | June 28, 2015 | ||||||
Risk-free interest rate | 1.51 | % | 0.98 | % | 0.97 | % | ||
Expected term (years) | 2.97 | 3.00 | 2.83 | |||||
Dividend yield | 1.48 | % | 1.59 | % | 0.89 | % | ||
Market-based PRSUs generally vest three years from the grant date if certain performance criteria are achieved and require continued employment. Based upon the terms of such awards, the number of shares that can be earned over the performance periods is based on the Company’s Common Stock price performance compared to the market price performance of the Philadelphia Semiconductor Sector Index (“SOX”), ranging from 0% to 150% of target. The stock price performance or market price performance is measured using the closing price for the 50-trading days prior to the dates the performance period begins and ends. The target number of shares represented by the market-based PRSUs is increased by 2% of target for each 1% that Common Stock price performance exceeds the market price performance of the SOX index. The result of the vesting formula is rounded down to the nearest whole number. Total stockholder return is a measure of stock price appreciation in this performance period. As of June 25, 2017, 862,455 of the 3,550,061 RSU’s outstanding are market-based PRSUs.
The fair value of the Company’s market-based PRSUs granted during fiscal years 2017, 2016, and 2015 was calculated using a Monte Carlo simulation model at the date of the grant. This model requires the input of highly subjective assumptions, including expected stock price volatility and the estimated life of each award:
Year Ended | ||||||||
June 25, 2017 | June 26, 2016 | June 28, 2015 | ||||||
Expected volatility | 27.48 | % | 29.81 | % | 27.93 | % | ||
Risk-free interest rate | 1.55 | % | 0.97 | % | 1.05 | % | ||
Expected term (years) | 2.92 | 2.92 | 2.98 | |||||
Dividend yield | 1.50 | % | 1.59 | % | 0.89 | % | ||
As of June 25, 2017, the Company had $245.7 million of total unrecognized compensation expense related to all unvested RSUs granted which is expected to be recognized over a weighted-average remaining period of 2.2 years.
Continues on next page
Lam Research Corporation 2017 10-K 65
ESPP
The 1999 Employee Stock Purchase Plan (the “1999 ESPP”) allows employees to designate a portion of their base compensation to be deducted and used to purchase the Company’s Common Stock at a purchase price per share of the lower of 85% of the fair market value of the Company’s Common Stock on the first or last day of the applicable purchase period. Typically, each offering period lasts fourteen months and comprises two interim purchase dates. The Plan Administrator (the Compensation Committee of the Board) is authorized to set a limit on the number of shares a plan participant can purchase on any single plan exercise date. During fiscal years 2017, 2016, and 2015, there was no increase to the number of shares of Lam Research Common Stock reserved for issuance under the 1999 ESPP.
During fiscal year 2017, a total of 825,486 shares of the Company’s Common Stock were sold to employees under the 1999 ESPP. At June 25, 2017, 5,672,571 shares were available for purchase under the 1999 ESPP.
The 1999 ESPP rights were valued using a Black-Scholes option valuation model. During fiscal years 2017, 2016, and 2015, the 1999 ESPP was valued using the following weighted-average assumptions:
Year Ended | ||||||||
June 25, 2017 | June 26, 2016 | June 28, 2015 | ||||||
Expected term (years) | 0.73 | 0.67 | 0.67 | |||||
Expected stock price volatility | 31.74 | % | 35.48 | % | 27.60 | % | ||
Risk-free interest rate | 0.41 | % | 0.29 | % | 0.07 | % | ||
Dividend yield | 1.09 | % | 1.18 | % | 0.69 | % | ||
As of June 25, 2017, the Company had $6.5 million of total unrecognized compensation cost related to the 1999 ESPP which is expected to be recognized over a remaining period of four months.
Note 5: Other Income (Expense), Net
The significant components of other income (expense), net, were as follows:
Year Ended | |||||||||||
June 25, 2017 | June 26, 2016 | June 28, 2015 | |||||||||
(in thousands) | |||||||||||
Interest income | $ | 57,858 | $ | 29,512 | $ | 19,268 | |||||
Interest expense | (117,734 | ) | (134,773 | ) | (73,682 | ) | |||||
Gains (losses) on deferred compensation plan related assets, net | 17,880 | (3,995 | ) | 9,071 | |||||||
Loss on extinguishment of debt, net | (36,252 | ) | — | — | |||||||
Foreign exchange (losses) gains, net | (569 | ) | 308 | 2,331 | |||||||
Other, net | (11,642 | ) | (5,191 | ) | (4,177 | ) | |||||
$ | (90,459 | ) | $ | (114,139 | ) | $ | (47,189 | ) | |||
Interest income in the year ended June 25, 2017, increased compared to the years ended June 26, 2016, and June 28, 2015, primarily as a result of higher average cash and investment balances and higher yield. Interest expense in the year ended June 25, 2017, decreased compared to the year ended June 26, 2016, primarily due to the retirement of the 2016 Convertible Note. Interest expense in the year ended June 26, 2016, increased compared to the year ended June 28, 2015, primarily due to interest expense associated with the $1.0 billion Senior Note issuance in March 2015 and the amortization of bridge loan financing issuance costs of approximately $31.9 million in the year ended June 26, 2016.
The gain on deferred compensation plan related assets, in fiscal year 2017, compared to a loss in fiscal year 2016 and gain in fiscal year 2015 was driven by a rally in the fair market value of the underlying funds at year end.
Continues on next page
Lam Research Corporation 2017 10-K 66
Net loss on extinguishment of debt realized in the year ended June 25, 2017, is primarily a result of the special mandatory redemption of the Senior Notes due 2023 and 2026, as well as the termination of the Term Loan Agreement (refer to Note 13 and Note 19 for additional information regarding the Company’s debt redemptions and termination).
Note 6: Income Taxes
The components of income (loss) before income taxes were as follows:
Year Ended | |||||||||||
June 25, 2017 | June 26, 2016 | June 28, 2015 | |||||||||
(in thousands) | |||||||||||
United States | $ | 7,553 | $ | (113,607 | ) | $ | 72,728 | ||||
Foreign | 1,804,120 | 1,073,724 | 668,122 | ||||||||
$ | 1,811,673 | $ | 960,117 | $ | 740,850 | ||||||
Significant components of the provision for income taxes attributable to income before income taxes were as follows:
Year Ended | |||||||||||
June 25, 2017 | June 26, 2016 | June 28, 2015 | |||||||||
(in thousands) | |||||||||||
Federal: | |||||||||||
Current | $ | (70,858 | ) | $ | 1,426 | $ | 16,795 | ||||
Deferred | 99,700 | (38,616 | ) | 12,115 | |||||||
28,842 | (37,190 | ) | 28,910 | ||||||||
State: | |||||||||||
Current | (963 | ) | 2,892 | 1,376 | |||||||
Deferred | (2,246 | ) | (7,600 | ) | 158 | ||||||
(3,209 | ) | (4,708 | ) | 1,534 | |||||||
Foreign: | |||||||||||
Current | 85,479 | 90,752 | 61,551 | ||||||||
Deferred | 2,798 | (2,786 | ) | (6,722 | ) | ||||||
88,277 | 87,966 | 54,829 | |||||||||
Total provision for income taxes | $ | 113,910 | $ | 46,068 | $ | 85,273 | |||||
Continues on next page
Lam Research Corporation 2017 10-K 67
Deferred income taxes reflect the net tax effect of temporary differences between the carrying amounts of assets and liabilities for financial reporting purposes and the amounts used for income tax purposes, as well as the tax effect of carryforwards. Significant components of the Company’s net deferred tax assets and liabilities were as follows:
June 25, 2017 | June 26, 2016 | ||||||
(in thousands) | |||||||
Deferred tax assets: | |||||||
Tax carryforwards | $ | 175,595 | $ | 176,767 | |||
Allowances and reserves | 170,752 | 128,416 | |||||
Equity-based compensation | 25,828 | 29,414 | |||||
Inventory valuation differences | 19,602 | 17,178 | |||||
Prepaid cost sharing | 133,831 | 88,522 | |||||
Other | 20,175 | 24,540 | |||||
Gross deferred tax assets | 545,783 | 464,837 | |||||
Valuation allowance | (114,011 | ) | (101,689 | ) | |||
Net deferred tax assets | 431,772 | 363,148 | |||||
Deferred tax liabilities: | |||||||
Intangible assets | (30,944 | ) | (46,774 | ) | |||
Convertible debt | (153,047 | ) | (151,483 | ) | |||
Capital assets | (72,727 | ) | (61,845 | ) | |||
Amortization of goodwill | (15,582 | ) | (14,176 | ) | |||
Unremitted earnings of foreign subsidiaries | (302,663 | ) | (146,459 | ) | |||
Other | (9,844 | ) | (8,594 | ) | |||
Gross deferred tax liabilities | (584,807 | ) | (429,331 | ) | |||
Net deferred tax liabilities | $ | (153,035 | ) | $ | (66,183 | ) | |
The change in the gross deferred tax assets, gross deferred tax liabilities, and valuation allowance between fiscal years 2017 and 2016 is primarily due to an increase related to allowances and reserves and an increase in deferred tax liabilities related to an accrual for future tax liabilities due to the expected repatriation of earnings of certain foreign subsidiaries.
Realization of the Company’s net deferred tax assets is based upon the weighting of available evidence, including such factors as the recent earnings history and expected future taxable income. The Company believes it is more-likely-than-not that such deferred tax assets will be realized with the exception of $114.0 million primarily related to California, certain state, and certain foreign deferred tax assets.
The provisions related to the tax accounting for equity-based compensation prohibit the recognition of a deferred tax asset for an excess benefit that has not yet been realized. As a result, the Company will only recognize an excess benefit from equity-based compensation in additional paid-in-capital if an incremental tax benefit is realized after all other tax attributes currently available to us have been utilized. In addition, the Company continued to elect to account for the indirect benefits of equity-based compensation such as the research and development tax credit through the Consolidated Statement of Operations.
At June 25, 2017, the Company had federal net operating loss carryforwards of approximately $109.0 million. The majority of these losses will begin to expire in fiscal year 2019, and are subject to limitations on their utilization.
At June 25, 2017, the Company had state net operating loss carryforwards of approximately $85.4 million. If not utilized, the net operating loss carryforwards will begin to expire in fiscal year 2020 and are subject to limitations on their utilization.
Continues on next page
Lam Research Corporation 2017 10-K 68
At June 25, 2017, the Company had federal tax credit carryforwards of approximately $236.2 million, of which $33.2 million of foreign tax credit will begin to expire in fiscal year 2018 and $201.2 million of research and development tax credit will begin to expire in fiscal year 2030. The remaining balance of $1.8 million of alternative minimum tax credit may be carried forward indefinitely.
At June 25, 2017, the Company had state tax credit carryforwards of approximately $296.0 million. Substantially all state tax credit carryforwards can be carried forward indefinitely.
At June 25, 2017, the Company had foreign net operating loss carryforwards of approximately $9.4 million, which will begin to expire in fiscal year 2018.
A reconciliation of income tax expense provided at the federal statutory rate (35% in fiscal years 2017, 2016, and 2015) to actual income tax expense is as follows:
Year Ended | |||||||||||
June 25, 2017 | June 26, 2016 | June 28, 2015 | |||||||||
(in thousands) | |||||||||||
Income tax expense computed at federal statutory rate | $ | 634,086 | $ | 336,041 | $ | 259,297 | |||||
State income taxes, net of federal tax benefit | (11,973 | ) | (14,070 | ) | (8,611 | ) | |||||
Foreign income taxed at different rates | (352,860 | ) | (265,123 | ) | (175,581 | ) | |||||
Settlements and reductions in uncertain tax positions | (144,519 | ) | — | — | |||||||
Tax credits | (37,713 | ) | (48,277 | ) | (24,416 | ) | |||||
State valuation allowance, net of federal tax benefit | 12,070 | 17,948 | 8,594 | ||||||||
Equity-based compensation | 13,187 | 12,366 | 28,845 | ||||||||
Other permanent differences and miscellaneous items | 1,632 | 7,183 | (2,855 | ) | |||||||
$ | 113,910 | $ | 46,068 | $ | 85,273 | ||||||
Effective from fiscal year 2014 through June 2023, the Company has a 10-year tax ruling in Switzerland for one of its foreign subsidiaries. The impact of the tax ruling decreased taxes by approximately $6.3 million, $4.3 million, and $4.8 million for fiscal years 2017, 2016, and 2015, respectively. The benefit of the tax ruling on diluted earnings per share was approximately $0.03 in fiscal year 2017, $0.02 in fiscal year 2016, and $0.03 in fiscal year 2015.
Earnings of the Company’s foreign subsidiaries included in consolidated retained earnings that are indefinitely reinvested in foreign operations aggregated to approximately $5.4 billion at June 25, 2017. If these earnings were remitted to the United States, they would be subject to U.S. and foreign withholding taxes of approximately $1.6 billion at current statutory rates. The Company’s federal income tax provision includes U.S. income taxes on certain foreign-based income.
Continues on next page
Lam Research Corporation 2017 10-K 69
As of June 25, 2017, the total gross unrecognized tax benefits were $339.4 million compared to $417.4 million as of June 26, 2016, and $363.6 million as of June 28, 2015. During fiscal year 2017, gross unrecognized tax benefits decreased by approximately $78.0 million. The amount of unrecognized tax benefits that, if recognized, would impact the effective tax rate was $247.6 million, $323.4 million, and $276.8 million, as of June 25, 2017, June 26, 2016, and June 28, 2015, respectively. The aggregate changes in the balance of gross unrecognized tax benefits were as follows:
(in thousands) | |||
Balance as of June 29, 2014 | $ | 352,112 | |
Settlements and effective settlements with tax authorities | (2,108 | ) | |
Lapse of statute of limitations | (9,376 | ) | |
Increases in balances related to tax positions taken during prior periods | 3,729 | ||
Decreases in balances related to tax positions taken during prior periods | (12,615 | ) | |
Increases in balances related to tax positions taken during current period | 31,810 | ||
Balance as of June 28, 2015 | 363,552 | ||
Lapse of statute of limitations | (10,992 | ) | |
Increases in balances related to tax positions taken during prior periods | 18,200 | ||
Decreases in balances related to tax positions taken during prior periods | (421 | ) | |
Increases in balances related to tax positions taken during current period | 47,093 | ||
Balance as of June 26, 2016 | 417,432 | ||
Settlements and effective settlements with tax authorities | (6,691 | ) | |
Lapse of statute of limitations | (113,491 | ) | |
Increases in balances related to tax positions taken during prior periods | 6,557 | ||
Decreases in balances related to tax positions taken during prior periods | (11,528 | ) | |
Increases in balances related to tax positions taken during current period | 47,168 | ||
Balance as of June 25, 2017 | $ | 339,447 | |
The Company recognizes interest expense and penalties related to the above unrecognized tax benefits within income tax expense. The Company had accrued $15.7 million, $42.4 million, and $35.5 million cumulatively for gross interest and penalties as of June 25, 2017, June 26, 2016, and June 28, 2015, respectively.
The Company is subject to audits by state and foreign tax authorities. The Company is unable to make a reasonable estimate as to when cash settlements, if any, with the relevant taxing authorities will occur.
The Company files U.S. federal, U.S. state, and foreign income tax returns. As of June 25, 2017, tax years 2004-2016 remain subject to examination in the jurisdictions where the Company operates.
The Company is in various stages of examinations in connection with all of its tax audits worldwide, and it is difficult to determine when these examinations will be settled. It is reasonably possible that over the next 12-month period the Company may experience an increase or decrease in its unrecognized tax benefits as a result of tax examinations or lapses of statute of limitations. The change in unrecognized tax benefits is not expected to be material.
Note 7: Net Income per Share
Basic net income per share is computed by dividing net income by the weighted-average number of common shares outstanding during the period. Diluted net income per share is computed using the treasury stock method, for dilutive stock options, restricted stock units, and Convertible Notes.
Continues on next page
Lam Research Corporation 2017 10-K 70
The following table reconciles the numerators and denominators of the basic and diluted computations for net income per share.
Year Ended | |||||||||||
June 25, 2017 | June 26, 2016 | June 28, 2015 | |||||||||
(in thousands, except per share data) | |||||||||||
Numerator: | |||||||||||
Net income | $ | 1,697,763 | $ | 914,049 | $ | 655,577 | |||||
Denominator: | |||||||||||
Basic average shares outstanding | 162,222 | 158,919 | 159,629 | ||||||||
Effect of potential dilutive securities: | |||||||||||
Employee stock plans | 2,058 | 2,120 | 3,193 | ||||||||
Convertible notes | 16,861 | 13,464 | 13,530 | ||||||||
Warrants | 2,629 | 656 | 715 | ||||||||
Diluted average shares outstanding | 183,770 | 175,159 | 177,067 | ||||||||
Net income per share - basic | $ | 10.47 | $ | 5.75 | $ | 4.11 | |||||
Net income per share - diluted | $ | 9.24 | $ | 5.22 | $ | 3.70 | |||||
For purposes of computing diluted net income per share, weighted-average common shares do not include potentially dilutive securities that are anti-dilutive under the treasury stock method. The following potentially dilutive securities were excluded:
Year Ended | ||||||||
June 25, 2017 | June 26, 2016 | June 28, 2015 | ||||||
(in thousands) | ||||||||
Number of options and RSUs excluded | 34 | 149 | 330 | |||||
Diluted shares outstanding do not include any effect resulting from note hedges associated with the Company’s 2018 Notes (as described in Note 13) as their impact would have been anti-dilutive.
Note 8: Financial Instruments
Fair Value
The Company defines fair value as the price that would be received from selling an asset or paid to transfer a liability in an orderly transaction between market participants at the measurement date. When determining the fair value measurements for assets and liabilities required or permitted to be recorded at fair value, the Company considers the principal or most advantageous market in which it would transact, and it considers assumptions that market participants would use when pricing the asset or liability.
A fair value hierarchy has been established that prioritizes the inputs to valuation techniques used to measure fair value. The level of an asset or liability in the hierarchy is based on the lowest level of input that is significant to the fair value measurement. Assets and liabilities carried at fair value are classified and disclosed in one of the following three categories:
Level 1: Valuations based on quoted prices in active markets for identical assets or liabilities with sufficient volume and frequency of transactions.
Level 2: Valuations based on observable inputs other than Level 1 prices such as quoted prices for similar assets or liabilities, quoted prices in markets that are not active, or model-derived valuations techniques for which all significant inputs are observable in the market or can be corroborated by observable market data for substantially the full term of the assets or liabilities.
Continues on next page
Lam Research Corporation 2017 10-K 71
Level 3: Valuations based on unobservable inputs to the valuation methodology that are significant to the measurement of fair value of assets or liabilities and based on non-binding, broker-provided price quotes and may not have been corroborated by observable market data.
The Company’s primary financial instruments include its cash, cash equivalents, investments, restricted cash and investments, long-term investments, accounts receivable, accounts payable, long-term debt and capital leases, and foreign currency related derivative instruments. The estimated fair value of cash, accounts receivable, and accounts payable approximates their carrying value due to the short period of time to their maturities. The estimated fair values of capital lease obligations approximate their carrying value as the substantial majority of these obligations have interest rates that adjust to market rates on a periodic basis. Refer to Note 13 to the Consolidated Financial Statements for additional information regarding the fair value of the Company’s Senior Notes and Convertible Notes.
Continues on next page
Lam Research Corporation 2017 10-K 72
Investments
The following table sets forth the Company’s cash, cash equivalents, investments, restricted cash and investments, and other assets measured at fair value on a recurring basis as of June 25, 2017, and June 26, 2016:
June 25, 2017 | |||||||||||||||||||||||||||||||
(Reported Within) | |||||||||||||||||||||||||||||||
Cost | Unrealized Gain | Unrealized (Loss) | Fair Value | Cash and Cash Equivalents | Investments | Restricted Cash & Investments | Other Assets | ||||||||||||||||||||||||
(in thousands) | |||||||||||||||||||||||||||||||
Cash | $ | 551,308 | $ | — | $ | — | $ | 551,308 | $ | 545,130 | $ | — | $ | 6,178 | $ | — | |||||||||||||||
Level 1: | |||||||||||||||||||||||||||||||
Time deposit | 640,666 | — | — | 640,666 | 390,639 | — | 250,027 | — | |||||||||||||||||||||||
Money market funds | 1,423,417 | — | — | 1,423,417 | 1,423,417 | — | — | — | |||||||||||||||||||||||
U.S. Treasury and agencies | 783,848 | 684 | (2,111 | ) | 782,421 | 8,297 | 774,124 | — | — | ||||||||||||||||||||||
Mutual funds | 53,247 | 3,007 | 56,254 | — | — | — | 56,254 | ||||||||||||||||||||||||
Level 1 total | 2,901,178 | 3,691 | (2,111 | ) | 2,902,758 | 1,822,353 | 774,124 | 250,027 | 56,254 | ||||||||||||||||||||||
Level 2: | |||||||||||||||||||||||||||||||
Municipal notes and bonds | 194,575 | 308 | (7 | ) | 194,876 | — | 194,876 | — | — | ||||||||||||||||||||||
U.S. Treasury and Agencies | 12,795 | — | (167 | ) | 12,628 | — | 12,628 | — | — | ||||||||||||||||||||||
Government-sponsored enterprises | 24,502 | — | (6 | ) | 24,496 | — | 24,496 | — | — | ||||||||||||||||||||||
Foreign government bonds | 62,917 | 219 | (114 | ) | 63,022 | — | 63,022 | — | — | ||||||||||||||||||||||
Corporate notes and bonds | 2,433,622 | 4,654 | (1,840 | ) | 2,436,436 | 10,051 | 2,426,385 | — | — | ||||||||||||||||||||||
Mortgage backed securities - residential | 102,760 | 87 | (489 | ) | 102,358 | — | 102,358 | — | — | ||||||||||||||||||||||
Mortgage backed securities - commercial | 65,828 | 9 | (98 | ) | 65,739 | — | 65,739 | — | — | ||||||||||||||||||||||
Level 2 total | 2,896,999 | 5,277 | (2,721 | ) | 2,899,555 | 10,051 | 2,889,504 | — | — | ||||||||||||||||||||||
Total | $ | 6,349,485 | $ | 8,968 | $ | (4,832 | ) | $ | 6,353,621 | $ | 2,377,534 | $ | 3,663,628 | $ | 256,205 | $ | 56,254 | ||||||||||||||
Continues on next page
Lam Research Corporation 2017 10-K 73
June 26, 2016 | |||||||||||||||||||||||||||||||
(Reported Within) | |||||||||||||||||||||||||||||||
Cost | Unrealized Gain | Unrealized (Loss) | Fair Value | Cash and Cash Equivalents | Investments | Restricted Cash & Investments | Other Assets | ||||||||||||||||||||||||
(in thousands) | |||||||||||||||||||||||||||||||
Cash | $ | 418,216 | $ | — | $ | — | $ | 418,216 | $ | 412,573 | $ | — | $ | 5,643 | $ | — | |||||||||||||||
Level 1: | |||||||||||||||||||||||||||||||
Time deposit | 904,243 | — | — | 904,243 | 659,465 | — | 244,778 | — | |||||||||||||||||||||||
Money market funds | 3,904,288 | — | — | 3,904,288 | 3,904,288 | — | — | — | |||||||||||||||||||||||
U.S. Treasury and agencies | 446,530 | 2,041 | (2 | ) | 448,569 | 62,996 | 385,573 | — | — | ||||||||||||||||||||||
Mutual funds | 39,318 | 1,400 | (397 | ) | 40,321 | — | — | — | 40,321 | ||||||||||||||||||||||
Level 1 total | 5,294,379 | 3,441 | (399 | ) | 5,297,421 | 4,626,749 | 385,573 | 244,778 | 40,321 | ||||||||||||||||||||||
Level 2: | |||||||||||||||||||||||||||||||
Municipal notes and bonds | 265,386 | 355 | (16 | ) | 265,725 | — | 265,725 | — | — | ||||||||||||||||||||||
U.S. Treasury and agencies | 8,068 | 151 | — | 8,219 | — | 8,219 | — | — | |||||||||||||||||||||||
Government-sponsored enterprises | 31,885 | 91 | (13 | ) | 31,963 | — | 31,963 | — | — | ||||||||||||||||||||||
Foreign government bonds | 41,440 | 76 | (4 | ) | 41,512 | — | 41,512 | — | — | ||||||||||||||||||||||
Corporate notes and bonds | 979,566 | 4,341 | (566 | ) | 983,341 | — | 983,341 | — | — | ||||||||||||||||||||||
Mortgage backed securities - residential | 17,395 | 37 | (152 | ) | 17,280 | — | 17,280 | — | — | ||||||||||||||||||||||
Mortgage backed securities - commercial | 55,129 | 30 | (160 | ) | 54,999 | — | 54,999 | — | — | ||||||||||||||||||||||
Level 2 total | 1,398,869 | 5,081 | (911 | ) | 1,403,039 | — | 1,403,039 | — | — | ||||||||||||||||||||||
Total | $ | 7,111,464 | $ | 8,522 | $ | (1,310 | ) | $ | 7,118,676 | $ | 5,039,322 | $ | 1,788,612 | $ | 250,421 | $ | 40,321 | ||||||||||||||
The Company accounts for its investment portfolio at fair value. Realized gains (losses) for investment sales are specifically identified. Management assesses the fair value of investments in debt securities that are not actively traded through consideration of interest rates and their impact on the present value of the cash flows to be received from the investments. The Company also considers whether changes in the credit ratings of the issuer could impact the assessment of fair value. The Company did not recognize any losses on investments due to other-than-temporary impairments in fiscal year 2017, 2016, or 2015. Additionally, gross realized gains/(losses) from sales of investments were $3.6 million and $(2.4) million in fiscal year 2017, $2.0 million and $(3.0) million in fiscal year 2016, and $2.8 million and $(2.1) million in fiscal year 2015.
Continues on next page
Lam Research Corporation 2017 10-K 74
The following is an analysis of the Company’s cash, cash equivalents, investments, and restricted cash and investments in unrealized loss positions:
June 25, 2017 | |||||||||||||||||||||||
Unrealized Losses Less than 12 Months | Unrealized Losses 12 Months or Greater | Total | |||||||||||||||||||||
Fair Value | Gross Unrealized Loss | Fair Value | Gross Unrealized Loss | Fair Value | Gross Unrealized Loss | ||||||||||||||||||
(in thousands) | |||||||||||||||||||||||
U.S. Treasury and agencies | $ | 539,374 | $ | (2,278 | ) | $ | — | $ | — | $ | 539,374 | $ | (2,278 | ) | |||||||||
Municipal notes and bonds | 7,905 | (7 | ) | — | — | 7,905 | (7 | ) | |||||||||||||||
Government-sponsored enterprises | 20,104 | (2 | ) | 506 | (4 | ) | 20,610 | (6 | ) | ||||||||||||||
Foreign government bonds | 26,227 | (114 | ) | — | — | 26,227 | (114 | ) | |||||||||||||||
Corporate notes and bonds | 998,793 | (1,840 | ) | 127 | — | 998,920 | (1,840 | ) | |||||||||||||||
Mortgage backed securities - residential | 86,870 | (468 | ) | 1,369 | (21 | ) | 88,239 | (489 | ) | ||||||||||||||
Mortgage backed securities - commercial | 50,014 | (94 | ) | 1,339 | (4 | ) | 51,353 | (98 | ) | ||||||||||||||
$ | 1,729,287 | $ | (4,803 | ) | $ | 3,341 | $ | (29 | ) | $ | 1,732,628 | $ | (4,832 | ) | |||||||||
The amortized cost and fair value of cash equivalents, investments, and restricted investments with contractual maturities as of June 25, 2017, are as follows:
Cost | Estimated Fair Value | ||||||
(in thousands) | |||||||
Due in one year or less | $ | 2,701,107 | $ | 2,700,908 | |||
Due after one year through five years | 2,896,063 | 2,897,363 | |||||
Due in more than five years | 147,760 | 147,788 | |||||
$ | 5,744,930 | $ | 5,746,059 | ||||
The Company has the ability, if necessary, to liquidate its investments in order to meet the Company’s liquidity needs in the next 12 months. Accordingly, those investments with contractual maturities greater than one year from the date of purchase nonetheless are classified as short-term on the accompanying Consolidated Balance Sheets.
Derivative Instruments and Hedging
The Company carries derivative financial instruments (“derivatives”) on its Consolidated Balance Sheets at their fair values. The Company enters into foreign currency forward contracts and foreign currency options with financial institutions with the primary objective of reducing volatility of earnings and cash flows related to foreign currency exchange rate fluctuations. In addition, the Company enters into interest rate swap arrangements to manage interest rate risk. The counterparties to these derivatives are large, global financial institutions that the Company believes are creditworthy, and therefore, it does not consider the risk of counterparty nonperformance to be material.
Cash Flow Hedges
The Company’s financial position is routinely subjected to market risk associated with foreign currency exchange rate fluctuations on non-U.S. dollar transactions or cash flows, primarily from Japanese yen-denominated revenues and euro-denominated and Korean won-denominated expenses. The Company’s policy is to mitigate the foreign exchange risk arising from the fluctuations in the value of these non-U.S. dollar denominated transactions or cash flows through a foreign currency cash flow hedging program, using forward contracts and
Continues on next page
Lam Research Corporation 2017 10-K 75
foreign currency options that generally expire within 12 months and no later than 24 months. These hedge contracts are designated as cash flow hedges and are carried on the Company’s balance sheet at fair value with the effective portion of the contracts’ gains or losses included in accumulated other comprehensive income (loss) and subsequently recognized in revenue/expense in the same period the hedged items are recognized.
In addition, during the year ended June 26, 2016, the Company entered into and settled forward-starting interest rate swap agreements to hedge against the variability of cash flows due to changes in certain benchmark interest rates on fixed rate debt. These instruments are designated as cash flow hedges at inception and are settled in conjunction with the issuance of debt. The effective portion of the contracts’ gains or losses is included in accumulated other comprehensive (loss) and is amortized into income as the hedged item impacts earnings.
At inception and at each quarter-end, hedges are tested prospectively and retrospectively for effectiveness using regression analysis. Changes in the fair value of the forward contracts due to changes in time value are excluded from the assessment of effectiveness and are recognized in revenue or expense in the current period. The change in time value related to these contracts was not material for all reported periods. Changes in the fair value of foreign exchange options due to changes in time value are included in the assessment of effectiveness. To qualify for hedge accounting, the hedge relationship must meet criteria relating to both the derivative instrument and the hedged item. These criteria include identification of the hedging instrument, the hedged item, the nature of the risk being hedged, and how the hedging instrument’s effectiveness in offsetting the exposure to changes in the hedged item’s fair value or cash flows will be measured. There were no material gains or losses during the fiscal year ended June 25, 2017, or June 26, 2016, associated with ineffectiveness or forecasted transactions that failed to occur.
To receive hedge accounting treatment, all hedging relationships are formally documented at the inception of the hedge, and the hedges must be tested to demonstrate an expectation of providing highly effective offsetting changes to future cash flows on hedged transactions. When derivative instruments are designated and qualify as effective cash flow hedges, the Company recognizes effective changes in the fair value of the hedging instrument within accumulated other comprehensive income (loss) until the hedged exposure is realized. Consequently, with the exception of excluded time value associated with the forward contracts and hedge ineffectiveness recognized, the Company’s results of operations are not subject to fluctuation as a result of changes in the fair value of the derivative instruments. If hedges are not highly effective or if the Company does not believe that the underlying hedged forecasted transactions will occur, the Company may not be able to account for its derivative instruments as cash flow hedges. If this were to occur, future changes in the fair values of the Company’s derivative instruments would be recognized in earnings. Additionally, related amounts previously recorded in other comprehensive income would be reclassified to income immediately. As of June 25, 2017, the Company had gains of $1.1 million accumulated in other comprehensive income, net of tax, related to foreign exchange cash flow hedges which it expects to reclassify from other comprehensive income into earnings over the next 12 months. Additionally, the Company had a net loss of $1.9 million accumulated in other comprehensive income, net of tax, related to interest rate contracts which it expects to reclassify from other comprehensive income into earnings over the next 7.7 years.
Fair Value Hedges
During the fiscal year ended June 26, 2016, the Company entered into a series of interest rate contracts with a total notional value of $400 million whereby the Company receives fixed rates and pays variable rates based on certain benchmark interest rates, resulting in a net increase or decrease to interest expense, a component of other expense, net in our Consolidated Statement of Operations. These interest rate contracts are designated as fair value hedges and hedge against changes in the fair value of our debt portfolio. The Company concluded that these interest rate contracts meet the criteria necessary to qualify for the short-cut method of hedge accounting, and as such, an assumption is made that the change in the fair value of the hedged debt, due to changes in the benchmark rate, exactly offsets the change in the fair value of the interest rate swap. Therefore, the derivative is considered to be effective at achieving offsetting changes in the fair value of the hedged liability, and no ineffectiveness is recognized.
Continues on next page
Lam Research Corporation 2017 10-K 76
Balance Sheet Hedges
The Company also enters into foreign currency forward contracts to hedge fluctuations associated with foreign currency denominated monetary assets and liabilities, primarily cash, third-party accounts receivable, accounts payable, and intercompany receivables and payables. These forward contracts are not designated for hedge accounting treatment. Therefore, the change in fair value of these derivatives is recorded as a component of other income (expense) and offsets the change in fair value of the foreign currency denominated assets and liabilities, which are also recorded in other income (expense).
As of June 25, 2017, the Company had the following outstanding foreign currency contracts that were entered into under its cash flow and balance sheet hedge program:
Notional Value | |||||||||||||||
Derivatives Designated as Hedging Instruments: | Derivatives Not Designated as Hedging Instruments: | ||||||||||||||
(in thousands) | |||||||||||||||
Foreign currency forward contracts | |||||||||||||||
Buy Contracts | Sell Contracts | Buy Contracts | Sell Contracts | ||||||||||||
Japanese yen | $ | — | $ | 670,162 | $ | — | $ | 269,518 | |||||||
Euro | 58,854 | — | 18,417 | — | |||||||||||
Korean won | 22,038 | — | — | 34,145 | |||||||||||
Taiwan dollar | — | — | 11,168 | — | |||||||||||
Swiss franc | — | — | 8,739 | — | |||||||||||
Chinese renminbi | — | — | 7,169 | — | |||||||||||
$ | 80,892 | $ | 670,162 | $ | 45,493 | $ | 303,663 | ||||||||
Foreign currency option contracts | |||||||||||||||
Buy Put | Sell Put | Buy Put (1) | Sell Put | ||||||||||||
Japanese yen | $ | 36,036 | $ | — | $ | 26,481 | $ | 26,481 | |||||||
(1) Contracts were entered into and designated as cash flow hedges under ASC 815 during the fiscal year as part of our cash flow hedge program. The contracts were subsequently de-designated during the fiscal year ended June 25, 2017; changes in fair market value subsequent to de-designation effect current earnings.
Continues on next page
Lam Research Corporation 2017 10-K 77
The fair value of derivative instruments in the Company’s Consolidated Balance Sheet as of June 25, 2017, and June 26, 2016, were as follows:
June 25, 2017 | June 26, 2016 | ||||||||||||||||||||||
Fair Value of Derivative Instruments (Level 2) | Fair Value of Derivative Instruments (Level 2) | ||||||||||||||||||||||
Asset Derivatives | Liability Derivatives | Asset Derivatives | Liability Derivatives | ||||||||||||||||||||
Balance Sheet Location | Fair Value | Balance Sheet Location | Fair Value | Balance Sheet Location | Fair Value | Balance Sheet Location | Fair Value | ||||||||||||||||
(in thousands) | |||||||||||||||||||||||
Derivatives designated as hedging instruments: | |||||||||||||||||||||||
Foreign exchange forward contracts | Prepaid expense and other assets | $ | 8,061 | Accrued expense and other current liabilities | $ | 2,916 | Prepaid expense and other assets | $ | 249 | Accrued expense and other current liabilities | $ | 16,585 | |||||||||||
Interest rate contracts, short-term | — | Accrued expense and other current liabilities | 2,833 | Prepaid expense and other assets | 50 | Accrued expense and other current liabilities | 159 | ||||||||||||||||
Interest rate contracts, long-term | — | Other long-term liabilities | 7,269 | Other assets | 8,661 | — | |||||||||||||||||
Derivatives not designated as hedging instruments: | |||||||||||||||||||||||
Foreign exchange forward contracts | Prepaid expense and other assets | 213 | Accrued expense and other current liabilities | 342 | Prepaid expense and other assets | 107 | Accrued expense and other current liabilities | 1,529 | |||||||||||||||
Total derivatives | $ | 8,274 | $ | 13,360 | $ | 9,067 | $ | 18,273 | |||||||||||||||
Under the master netting agreements with the respective counterparties to the Company’s derivative contracts, subject to applicable requirements, the Company is allowed to net settle transactions of the same currency with a single net amount payable by one party to the other. However, the Company has elected to present the derivative assets and derivative liabilities on a gross basis on its balance sheet. As of June 25, 2017, the potential effect of rights of offset associated with the above foreign exchange and interest rate contracts would be an offset to assets and liabilities by $5.9 million, resulting in a net derivative asset of $2.3 million and net derivative liability of $7.4 million. As of June 26, 2016, the potential effect of rights of offset associated with the above foreign exchange contracts would be an offset to both assets and liabilities by $6.4 million, resulting in a net derivative asset of $2.7 million and a net derivative liability of $11.9 million. The Company is not required to pledge, nor is the Company entitled to receive, cash collateral for these derivative transactions.
Continues on next page
Lam Research Corporation 2017 10-K 78
The effect of derivative instruments designated as cash flow hedges on the Company’s Consolidated Statements of Operations, including accumulated other comprehensive income (“AOCI”), was as follows:
Year Ended June 25, 2017 | Year Ended June 26, 2016 | |||||||||||||||||||||||
Location of Gain (Loss) Recognized in or Reclassified into Income | Effective Portion | Ineffective Portion and Amount Excluded from Effectiveness | Effective Portion | Ineffective Portion and Amount Excluded from Effectiveness | ||||||||||||||||||||
Derivatives Designated as Hedging Instruments | Gain (Loss) Recognized in AOCI | Gain (Loss) Reclassified from AOCI into Income | Gain (Loss) Recognized in Income | Gain (Loss) Recognized in AOCI | Gain (Loss) Reclassified from AOCI into Income | Gain (Loss) Recognized in Income | ||||||||||||||||||
(in thousands) | ||||||||||||||||||||||||
Foreign exchange contracts | Revenue | $ | 2,927 | $ | (12,000 | ) | $ | 6,982 | $ | (22,575 | ) | $ | (2,950 | ) | $ | 1,009 | ||||||||
Foreign exchange contracts | Cost of goods sold | 2,859 | 666 | (686 | ) | 81 | (2,423 | ) | (172 | ) | ||||||||||||||
Foreign exchange contracts | Selling, general, and administrative | 1,128 | 71 | (267 | ) | 188 | 5 | (69 | ) | |||||||||||||||
Foreign exchange contracts | Other expense, net | — | — | (82 | ) | — | — | (11 | ) | |||||||||||||||
Interest rate contracts | Other expense, net | — | 1,727 | — | 3,329 | (360 | ) | 96 | ||||||||||||||||
$ | 6,914 | $ | (9,536 | ) | $ | 5,947 | $ | (18,977 | ) | $ | (5,728 | ) | $ | 853 | ||||||||||
The effect of derivative instruments not designated as cash flow hedges on the Company’s Consolidated Statement of Operations was as follows:
Year Ended | ||||||||
June 25, 2017 | June 26, 2016 | |||||||
Derivatives Not Designated as Hedging Instruments: | Location of (Loss) Gain Recognized in Income | Gain Recognized in Income | Loss Recognized in Income | |||||
(in thousands) | ||||||||
Foreign exchange contracts | Other income | $ | 523 | $ | (16,208 | ) | ||
Concentrations of Credit Risk
Financial instruments that potentially subject the Company to concentrations of credit risk consist principally of cash and cash equivalents, investments, restricted cash and investments, trade accounts receivable, and derivative financial instruments used in hedging activities. Cash is placed on deposit at large, global financial institutions. Such deposits may be in excess of insured limits. Management believes that the financial institutions that hold the Company’s cash are creditworthy and, accordingly, minimal credit risk exists with respect to these balances.
The Company’s overall portfolio of available-for-sale securities must maintain an average minimum rating of “AA-” or “Aa3” as rated by Standard and Poor’s, Fitch Ratings, or Moody’s Investor Services. To ensure diversification and minimize concentration, the Company’s policy limits the amount of credit exposure with any one financial institution or commercial issuer.
The Company is exposed to credit losses in the event of nonperformance by counterparties on foreign currency and interest rate hedge contracts that are used to mitigate the effect of exchange rate and interest rate fluctuations and on contracts related to structured share repurchase arrangements. These counterparties are
Continues on next page
Lam Research Corporation 2017 10-K 79
large, global financial institutions and, to date, no such counterparty has failed to meet its financial obligations to the Company.
Credit risk evaluations, including trade references, bank references, and Dun & Bradstreet ratings, are performed on all new customers, and the Company monitors its customers’ financial condition and payment performance. In general, the Company does not require collateral on sales.
As of June 25, 2017, four customers accounted for approximately 22%, 19%, 13%, and 12% of accounts receivable. As of June 26, 2016, three customers accounted for approximately 24%, 19%, and 11% of accounts receivable. No other customers accounted for more than 10% of accounts receivable.
Note 9: Inventories
Inventories are stated at the lower of cost (first-in, first-out method) or market. System shipments to Japanese customers, for which title does not transfer until customer acceptance, are classified as finished goods inventory and carried at cost until title transfers. Inventories consist of the following:
June 25, 2017 | June 26, 2016 | ||||||
(in thousands) | |||||||
Raw materials | $ | 625,600 | $ | 536,844 | |||
Work-in-process | 213,066 | 151,406 | |||||
Finished goods | 394,250 | 283,661 | |||||
$ | 1,232,916 | $ | 971,911 | ||||
Note 10: Property and Equipment
Property and equipment, net, consist of the following:
June 25, 2017 | June 26, 2016 | ||||||
(in thousands) | |||||||
Manufacturing, engineering, and office equipment | $ | 841,284 | $ | 824,532 | |||
Computer equipment and software | 166,441 | 157,125 | |||||
Land | 46,155 | 46,047 | |||||
Buildings | 248,177 | 213,364 | |||||
Leasehold improvements | 109,904 | 96,649 | |||||
Furniture and fixtures | 30,914 | 23,609 | |||||
1,442,875 | 1,361,326 | ||||||
Less: accumulated depreciation and amortization | (757,280 | ) | (721,718 | ) | |||
$ | 685,595 | $ | 639,608 | ||||
Depreciation expense, including amortization of capital leases, during fiscal years 2017, 2016, and 2015, was $152.3 million, $134.7 million, and $120.3 million, respectively.
The Company recorded a $15.2 million gain on sale of real estate and related development rights, net of associated exit costs, in fiscal year 2016 in selling, general, and administrative expenses in the Consolidated Statement of Operations. No significant gains on sale were realized in fiscal years 2017 or 2015.
Continues on next page
Lam Research Corporation 2017 10-K 80
Note 11: Goodwill and Intangible Assets
Goodwill
The balance of Goodwill was $1.4 billion as of June 25, 2017, and June 26, 2016. As of June 25, 2017, $61.1 million of the goodwill balance is tax deductible, and the remaining balance is not tax deductible due to purchase accounting and applicable foreign law. The Company recognized a $79.4 million impairment of goodwill on the Company’s Single Wafer Clean reporting unit during the year ended June 28, 2015. No goodwill impairment was recognized in fiscal years 2017 or 2016.
Intangible Assets
The following table provides details of the Company’s intangible assets, other than goodwill, as of June 25, 2017:
Gross | Accumulated Amortization | Net | |||||||||
(in thousands) | |||||||||||
Customer relationships | $ | 615,164 | $ | (366,439 | ) | $ | 248,725 | ||||
Existing technology | 643,196 | (487,056 | ) | 156,140 | |||||||
Patents | 36,553 | (31,238 | ) | 5,315 | |||||||
Other intangible assets | 36,514 | (35,699 | ) | 815 | |||||||
Total intangible assets | $ | 1,331,427 | $ | (920,432 | ) | $ | 410,995 | ||||
The following table provides details of the Company’s intangible assets, other than goodwill, as of June 26, 2016:
Gross | Accumulated Amortization | Net | |||||||||
(in thousands) | |||||||||||
Customer relationships | $ | 615,272 | $ | (300,711 | ) | $ | 314,561 | ||||
Existing technology | 643,433 | (401,036 | ) | 242,397 | |||||||
Patents | 36,053 | (28,701 | ) | 7,352 | |||||||
Other intangible assets | 36,114 | (35,503 | ) | 611 | |||||||
Total intangible assets | $ | 1,330,872 | $ | (765,951 | ) | $ | 564,921 | ||||
The Company recognized $154.6 million, $156.3 million, and $157.7 million in intangible asset amortization expense during fiscal years 2017, 2016, and 2015, respectively. During the fiscal year 2017, the Company transferred ownership of the development rights previously recognized as a component of a real estate sale; see Note 10 for additional information regarding this transaction.
The Company recognized a $9.8 million impairment of existing technology during the fiscal year 2015, resulting from current market demand for the technology. No impairments were recognized in fiscal year 2017 or 2016.
The estimated future amortization expense of intangible assets, as of June 25, 2017, was as follows:
Fiscal Year | Amount | ||
(in thousands) | |||
2018 | $ | 153,523 | |
2019 | 115,236 | ||
2020 | 50,457 | ||
2021 | 47,773 | ||
2022 | 44,006 | ||
$ | 410,995 | ||
Continues on next page
Lam Research Corporation 2017 10-K 81
Note 12: Accrued Expenses and Other Current Liabilities
Accrued expenses and other current liabilities consist of the following:
June 25, 2017 | June 26, 2016 | ||||||
(in thousands) | |||||||
Accrued compensation | $ | 447,363 | $ | 331,528 | |||
Warranty reserves | 161,981 | 100,321 | |||||
Income and other taxes payable | 95,127 | 86,723 | |||||
Dividend payable | 72,738 | 48,052 | |||||
Other | 192,152 | 206,286 | |||||
$ | 969,361 | $ | 772,910 | ||||
Note 13: Long Term Debt and Other Borrowings
As of June 25, 2017, and June 26, 2016, the Company’s outstanding debt consisted of the following:
June 25, 2017 | June 26, 2016 | ||||||||||||
Amount (in thousands) | Effective Interest Rate | Amount (in thousands) | Effective Interest Rate | ||||||||||
Fixed-rate 1.25% Convertible Notes Due May 15, 2018 (“2018 Notes”) | 447,436 | (1) | 5.27 | % | 449,954 | (2) | 5.27 | % | |||||
Fixed-rate 2.75% Senior Notes Due March 15, 2020 (“2020 Notes”) | 500,000 | 2.88 | % | 500,000 | 2.88 | % | |||||||
Fixed-rate 2.80% Senior Notes Due June 15, 2021 (“2021 Notes”) | 800,000 | 2.95 | % | 800,000 | 2.95 | % | |||||||
Fixed-rate 3.45% Senior Notes Due June 15, 2023 (“2023 Notes”) | — | — | % | 600,000 | 3.60 | % | |||||||
Fixed-rate 3.80% Senior Notes Due March 15, 2025 (“2025 Notes”) | 500,000 | 3.87 | % | 500,000 | 3.87 | % | |||||||
Fixed-rate 3.90% Senior Notes Due June 15, 2026 (“2026 Notes”) | — | — | % | 1,000,000 | 4.01 | % | |||||||
Fixed-rate 2.625% Convertible Notes Due May 15, 2041 (“2041 Notes”) | 631,074 | (1) | 4.28 | % | 699,895 | (2) | 4.28 | % | |||||
Total debt outstanding, at par | 2,878,510 | 4,549,849 | |||||||||||
Unamortized discount | (178,589 | ) | (232,727 | ) | |||||||||
Fair value adjustment - interest rate contracts | (10,102 | ) | 8,552 | ||||||||||
Unamortized bond issuance costs | (3,161 | ) | (7,213 | ) | (3) | ||||||||
Total debt outstanding, at carrying value | $ | 2,686,658 | $ | 4,318,461 | |||||||||
Reported as: | |||||||||||||
Current portion of long-term debt | $ | 907,827 | (4) | $ | 940,537 | (4) | |||||||
Long-term debt | 1,778,831 | 3,377,924 | |||||||||||
Total debt outstanding, at carrying value | $ | 2,686,658 | $ | 4,318,461 | |||||||||
______________________________
(1) As of June 25, 2017, these notes were convertible at the option of the bondholder, as a result of the condition described in (4) below. Upon closure of the conversion period, the 2041 Notes not converted will be reclassified back into noncurrent liabilities and the temporary equity will be reclassified into permanent equity.
(2) As of June 26, 2016, these notes were convertible at the option of the bond holder, as a result of the condition described in (4) below.
Continues on next page
Lam Research Corporation 2017 10-K 82
(3) The Company adopted ASU 2015-3, regarding the simplification of the presentation of bond issuance costs, which requires that bond issuance costs related to a recognized liability be presented on the balance sheet as a direct reduction from the carrying amount of that debt liability, consistent with debt discounts. The Company applied the accounting standard update on a retrospective basis by reclassifying the presentation of bond issuance costs totaling $1.76 million which was originally included in prepaid assets and other current assets against current portion of convertible notes and capital leases, and $5.45 million which was originally included in other assets against senior notes, convertible notes and capital leases, less current portion on the Consolidated Balance Sheets for June 26, 2016. There is no impact to the Company’s Consolidated Statements of Operation, Stockholders’ Equity, or Cash Flows for the fiscal year ended June 26, 2016.
(4) As of the report date, the market value of the Company’s Common Stock was greater than 130% of the convertible notes conversion price for 20 or more of the 30 consecutive trading days preceding the quarter-end. As a result, the convertible notes were classified in current liabilities and a portion of the equity component, representing the unamortized discount, was classified in temporary equity on the Company’s Consolidated Balance Sheets.
The Company’s contractual cash obligations relating to its outstanding debt as of June 25, 2017, were as follows:
Payments Due by Fiscal Year: | Long-Term Debt | ||
(in thousands) | |||
2018 (1) | $ | 1,078,510 | |
2019 | — | ||
2020 | 500,000 | ||
2021 | 800,000 | ||
2022 | — | ||
Thereafter | 500,000 | ||
Total | $ | 2,878,510 | |
(1) As noted above, the conversion period for the 2041 Notes is open as of June 25, 2017. As there is the potential for conversion at the option of the holder, the principal balance of the 2041 Notes has been included in the one-year payment period.
Convertible Senior Notes
In May 2011, the Company issued and sold $450 million in aggregate principal amount of 1.25% Convertible Senior Notes due May 2018 (the “2018 Notes”) at par. The Company pays cash interest at an annual rate of 1.25%, on a semi-annual basis on May 15 and November 15 of each year.
In June 2012, with the acquisition of Novellus, the Company assumed $700 million in aggregate principal amount of 2.625% Convertible Senior Notes due May 2041 (the “2041 Notes,” and collectively with the 2018 Notes, the “Convertible Notes”). The Company pays cash interest at an annual rate of 2.625%, on a semi-annual basis on May 15 and November 15 of each year on the 2041 Notes. The 2041 Notes also have a contingent interest payment provision that may require the Company to pay additional interest, up to 0.60% per year, based on certain thresholds, beginning with the semi-annual interest payment on May 15, 2021, and upon the occurrence of certain events, as outlined in the indenture governing the 2041 Notes.
The Company separately accounts for the liability and equity components of the Convertible Notes. The initial debt components of the Convertible Notes were valued based on the present value of the future cash flows using the Company’s borrowing rate at the date of the issuance or assumption for similar debt instruments without the conversion feature, which equals the effective interest rate on the liability component disclosed in the table below, respectively. The equity component was initially valued equal to the principle value of the notes, less the present value of the future cash flows using the Company’s borrowing rate at the date of the issuance or assumption for similar debt instruments without a conversion feature, which equated to the initial debt discount.
Under certain circumstances, the Convertible Notes may be converted into shares of the Company’s Common Stock. The number of shares each debenture is convertible into is based on conversion rates, disclosed in the table below. Conversions in the fiscal year ended June 25, 2017, were $71.3 million principal value of Convertible Notes. During the quarter ended June 25, 2017 and in the subsequent period through August 10, 2017, the Company received notice of conversion for an additional $301.7 million principal value of Convertible Notes, which will settle in the quarter ending September 24, 2017.
Continues on next page
Lam Research Corporation 2017 10-K 83
Selected additional information regarding the Convertible Notes outstanding as of June 25, 2017, and June 26, 2016, is as follows:
June 25, 2017 | June 26, 2016 | ||||||||||||||
2018 Notes | 2041 Notes | 2018 Notes | 2041 Notes | ||||||||||||
(in thousands, except years, percentages, conversion rate, and conversion price) | |||||||||||||||
Carrying amount of permanent equity component, net of tax | $ | 89,604 | $ | 156,374 | $ | 72,992 | $ | 152,397 | |||||||
Carrying amount of temporary equity component, net of tax | $ | 15,186 | $ | 154,675 | $ | 31,894 | $ | 175,658 | |||||||
Remaining amortization period (years) | 0.8 | 23.8 | 1.9 | 24.9 | |||||||||||
Fair value of notes (Level 2) | $ | 1,125,561 | $ | 2,809,857 | |||||||||||
Conversion rate (shares of common stock per $1,000 principal amount of notes) | 16.5702 | 29.7371 | |||||||||||||
Conversion price (per share of common stock) | $ | 60.35 | $ | 33.63 | |||||||||||
If-converted value in excess of par value | $ | 677,876 | $ | 2,217,277 | |||||||||||
Estimated share dilution using average quarterly stock price of $145.28 per share | 4,334 | 14,423 | |||||||||||||
Convertible Note Hedges and Warrants
Concurrent with the issuance of the 2018 Notes and $450 million of notes that matured in May of 2016 (the “2016 Notes”), the Company purchased a convertible note hedge and sold warrants. The warrants settlement is contractually defined as net share settlement. The exercise price is adjusted for certain corporate events, including dividends on the Company’s Common Stock. During the year ended June 25, 2017, warrants associated with the 2016 Notes were exercised resulting in the issuance of approximately 2.0 million shares of the Company’s Common Stock. As of June 25, 2017, the warrants associated with the 2018 Notes had not been exercised and remained outstanding.
In conjunction with the convertible note hedge, counterparties agreed to sell to the Company shares of Common Stock equal to the number of shares issuable upon conversion of the 2018 Notes in full. The convertible note hedge transactions will be settled in net shares and will terminate upon the earlier of the maturity date or the first day none of the respective notes remain outstanding due to conversion or otherwise. Settlement of the convertible note hedge in net shares, based on the number of shares issued upon conversion of the 2018 Notes, on the expiration date would result in the Company receiving net shares equivalent to the number of shares issuable by the Company upon conversion of the 2018 Notes. The exercise price is adjusted for certain corporate events, including dividends on the Company’s Common Stock.
The following table presents the details of the warrants and convertible note hedge arrangements as of June 25, 2017:
2018 Notes | |||
(shares in thousands) | |||
Warrants: | |||
Underlying shares | 7,457 | ||
Estimated share dilution using average quarterly stock price $145.28 per share | 3,716 | ||
Exercise price | $ | 72.88 | |
Expiration date range | August 15 - October 24, 2018 | ||
Convertible note hedge: | |||
Number of shares available from counterparties | 7,414 | ||
Exercise price | $ | 60.35 | |
Senior Notes
On March 12, 2015, the Company completed a public offering of $500 million aggregate principal amount of the Company’s Senior Notes due March 2020 (the “2020 Notes”) and $500 million aggregate principal amount of the
Continues on next page
Lam Research Corporation 2017 10-K 84
Company’s Senior Notes due March 2025 (the “2025 Notes”, together with the 2020 Notes, the “Senior Notes”). The Company pays interest at an annual rate of 2.75% and 3.80% on the 2020 Notes and 2025 Notes, respectively, on a semi-annual basis on March 15 and September 15 of each year. During the year ended June 26, 2016, the Company entered into a series of interest rate contracts hedging the fair value of a portion of the 2025 Notes par value, whereby the Company receives a fixed rate and pays a variable rate based on a certain benchmark interest rate. Refer to Note 8 for additional information regarding these interest rate contracts.
The Company may redeem the Senior Notes at a redemption price equal to 100% of the principal amount of such series (“par”), plus a “make whole” premium as described in the indenture in respect of the Senior Notes and accrued and unpaid interest before February 15, 2020, for the 2020 Notes and before December 15, 2024, for the 2025 Notes. The Company may redeem the Senior Notes at par, plus accrued and unpaid interest at any time on or after February 15, 2020, for the 2020 Notes and on or after December 24, 2024, for the 2025 Notes. In addition, upon the occurrence of certain events, as described in the indenture, the Company will be required to make an offer to repurchase the Senior Notes at a price equal to 101% of the principal amount of the Senior Notes, plus accrued and unpaid interest.
On June 7, 2016, The Company completed a public offering of $800 million aggregate principal amount of Senior Notes due June 2021 (the “2021 Notes”, together with the 2020, and 2025 Notes, the “Senior Notes”), $600 million aggregate principal amount of Senior Notes due June 2023 (the “2023 Notes”) and $1,000 million aggregate principal amount of Senior Notes due June 2026 (the “2026 Notes”). The Company pays interest at an annual rate of 2.80%, 3.45%, and 3.90% on the 2021 Notes, 2023 Notes and 2026 Notes, respectively, on a semi-annual basis on June 15 and December 15 of each year.
As a result of the October 5, 2016, termination of the Agreement and Plan of Merger and Reorganization with KLA-Tencor (see Note 19 for additional information), the 2023 Notes and the 2026 Notes were redeemed on October 13, 2016, under the special mandatory redemption terms of the indenture governing these Notes. The Company was required to redeem all of the 2023 Notes and the 2026 Notes then outstanding, at a special mandatory redemption price equal to 101% of the aggregate principal amount of such notes, plus accrued and unpaid interest of approximately $21.0 million from the date of initial issuance. In addition, in conjunction with the special mandatory redemption of the 2023 Notes and the 2026 Notes in the three months ended December 25, 2016, the Company recognized approximately $2.5 million of loan issuance costs to other expense, net. The 2021 Notes are not subject to special mandatory redemption.
The Company may redeem the 2021 Notes at a redemption price equal to 100% of the principal amount of such series (“par”), plus a “make whole” premium as described in the indenture in respect to the 2021 Notes and accrued and unpaid interest before May 15, 2021. The Company may redeem the 2021 Notes at par, plus accrued and unpaid interest at any time on or after May 15, 2021. In addition, upon the occurrence of certain events, as described in the indenture, the Company will be required to make an offer to repurchase the 2021 Notes at a price equal to 101% of the principal amount of the respective note, plus accrued and unpaid interest.
Selected additional information regarding the Senior Notes outstanding as of June 25, 2017, is as follows:
Remaining Amortization period | Fair Value of Notes (Level 2) | ||||
(years) | (in thousands) | ||||
2020 Notes | 2.7 | $ | 508,035 | ||
2021 Notes | 4.0 | $ | 814,632 | ||
2025 Notes | 7.7 | $ | 516,750 | ||
Term Loan Agreement
On May 13, 2016, the Company entered into an Amended and Restated Term Loan Agreement (the “Amended and Restated Term Loan Agreement”), which amends and restates the Term Loan Agreement entered into on November 10, 2015, with a syndicate of lenders. The Amended and Restated Term Loan Agreement provides for a commitment of $1,530.0 million senior unsecured term loan facility composed of two tranches (the “Commitments”): (1) a $1,005.0 million tranche of three-year senior unsecured loans and (2) a $525.0 million tranche of five-year senior unsecured loans. The Commitments automatically terminated on October 5, 2016, upon termination of the Agreement and Plan of Merger and Reorganization with KLA-Tencor Corporation (see
Continues on next page
Lam Research Corporation 2017 10-K 85
Note 19 for additional detail). In conjunction with the termination of the Commitments, the Company released approximately $3.7 million of loan issuance costs to loss on extinguishment of debt, a component of other expense, net in the year ended June 25, 2017.
Revolving Credit Facility
On November 10, 2015, we entered into an Amendment and Restatement Agreement (as amended on April 26, 2016, by Amendment No. 1 to the Amended and Restated Credit Agreement, and as further amended, restated, supplemented, or otherwise modified from time to time, the “Amended and Restated Credit Agreement”), which amends and restates the Company’s prior unsecured Credit Agreement, dated March 12, 2014, (as amended by Amendment No. 1, dated March 5, 2015). The Amended and Restated Credit Agreement provides for an increase to our revolving unsecured credit facility, from $300.0 million to $750.0 million with a syndicate of lenders. It includes an expansion option, subject to certain requirements, for us to request an increase in the facility of up to an additional $250.0 million, for a potential total commitment of $1.0 billion. Proceeds from the credit facility can be used for general corporate purposes. The facility matures on November 10, 2020.
Interest on amounts borrowed under the credit facility is, at the Company’s option, based on (1) a base rate, defined as the greatest of (a) prime rate, (b) Federal Funds rate plus 0.5%, or (c) one-month LIBOR plus 1.0%, plus a spread of 0.0% to 0.5%, or (2) LIBOR multiplied by the statutory rate, plus a spread of 0.9% to 1.5%, in each case as the applicable spread is determined based on the rating of the Company’s non-credit enhanced, senior unsecured long-term debt. Principal and any accrued and unpaid interest is due and payable upon maturity. Additionally, the Company will pay the lenders a quarterly commitment fee that varies based on the Company’s credit rating. The Restated Credit Agreement contains affirmative covenants, negative covenants, financial covenants, and events of default that are substantially similar to those in the Amended and Restated Term Loan Agreement. As of June 25, 2017, the Company had no borrowings outstanding under the credit facility and was in compliance with all financial covenants.
Interest Cost
The following table presents the amount of interest cost recognized relating to both the contractual interest coupon and amortization of the debt discount, issuance costs, and effective portion of interest rate contracts with respect to the Convertible Notes, the Senior Notes, the term loan agreement, and the revolving credit facility during the fiscal years ended June 25, 2017, June 26, 2016, and June 28, 2015.
Year Ended | |||||||||||
June 25, 2017 | June 26, 2016 | June 28, 2015 | |||||||||
(in thousands) | |||||||||||
Contractual interest coupon | $ | 95,195 | $ | 63,053 | $ | 36,074 | |||||
Amortization of interest discount | 22,873 | 35,206 | 34,886 | ||||||||
Amortization of issuance costs | 2,414 | 35,315 | 2,435 | ||||||||
Amortization of interest rate contract | (4,756 | ) | 359 | 113 | |||||||
Total interest cost recognized | $ | 115,726 | $ | 133,933 | $ | 73,508 | |||||
The increase in interest expense during the 12 months ended June 25, 2017, is primarily the result of the issuance of $2.4 billion of Senior Notes in June 2016, $1.6 billion of which was extinguished in October 2016. The decrease in amortization of issuance costs is primarily due to the termination of the bridge loan financing. The variation in amortization of interest rate contracts is primarily related to the interest rate contracts associated with the $1.6 billion senior notes extinguished in October 2016.
The increase in interest expense during the 12 months ended June 26, 2016, is primarily the result of the issuance of $1.0 billion Senior Notes in March 2015. The increase in amortization of issuance costs during the 12 months ended June 26, 2016, is primarily due the amortization of bridge loan financing issuance costs in connection with the KLA-Tencor merger of approximately $31.9 million.
Continues on next page
Lam Research Corporation 2017 10-K 86
Note 14: Retirement and Deferred Compensation Plans
Employee Savings and Retirement Plan
The Company maintains a 401(k) retirement savings plan for its eligible employees in the United States. Each participant in the plan may elect to contribute from 1% to 75% of annual eligible earnings to the plan, subject to statutory limitations. The Company makes matching employee contributions in cash to the plan at the rate of 50% of the first 6% of earnings contributed. Employees participating in the 401(k) retirement savings plan are fully vested in the Company matching contributions, and investments are directed by participants. The Company made matching contributions of $15.2 million, $13.2 million, and $11.8 million, in fiscal years 2017, 2016, and 2015, respectively.
Deferred Compensation Arrangements
The Company has an unfunded, non-qualified deferred compensation plan whereby certain executives may defer a portion of their compensation. Participants earn a return on their deferred compensation based on their allocation of their account balance among various mutual funds. The Company controls the investment of these funds, and the participants remain general creditors of the Company. Participants are able to elect the payment of benefits on a specified date at least three years after the opening of a deferral sub-account or upon retirement. Distributions are made in the form of lump sum or annual installments over a period of up to 20 years as elected by the participant. If no alternate election has been made, a lump sum payment will be made upon termination of a participant’s employment with the Company. As of June 25, 2017, and June 26, 2016, the liability of the Company to the plan participants was $155.7 million and $122.9 million, respectively, which was recorded in accrued expenses and other current liabilities on the Consolidated Balance Sheets. As of June 25, 2017, and June 26, 2016, the Company had investments in the aggregate amount of $180.2 million and $149.8 million, respectively, which correlate to the deferred compensation obligations, which were recorded in other assets on the Consolidated Balance Sheets.
Post-Retirement Healthcare Plan
The Company maintains a post-retirement healthcare plan for certain executive and director retirees. Coverage continues through the duration of the lifetime of the retiree or the retiree’s spouse, whichever is longer. The benefit obligation was $39.9 million and $37.0 million as of June 25, 2017, and June 26, 2016, respectively.
Note 15: Commitments and Contingencies
The Company has certain obligations to make future payments under various contracts; some of these are recorded on its balance sheet and some are not. Obligations that are recorded on the Company’s balance sheet include the Company’s capital lease obligations. Obligations that are not recorded on the Company’s balance sheet include contractual relationships for operating leases, purchase obligations, and certain guarantees. The Company’s commitments relating to capital leases and off-balance sheet agreements are included in the tables below. These amounts exclude $120.2 million of liabilities related to uncertain tax benefits because the Company is unable to reasonably estimate the ultimate amount or time of settlement. See Note 6 of the Consolidated Financial Statements for further discussion.
Continues on next page
Lam Research Corporation 2017 10-K 87
Capital Leases
Capital leases reflect building and office equipment leases. The Company’s contractual cash obligations relating to its existing capital leases, including interest, as of June 25, 2017, were as follows:
Payments Due by Fiscal Year: | Capital Leases | ||
(in thousands) | |||
2018 | $ | 744 | |
2019 | 738 | ||
2020 | 719 | ||
2021 | 662 | ||
2022 | 4,338 | ||
Total | 7,201 | ||
Interest on capital leases | 446 | ||
Current portion of capital leases | 612 | ||
Long-term portion of capital leases | $ | 6,143 | |
Operating Leases and Related Guarantees
The Company leases the majority of its administrative, R&D and manufacturing facilities, regional sales/service offices, and certain equipment under non-cancelable operating leases. Certain of the Company’s facility leases for buildings located at its Fremont, California, headquarters and certain other facility leases provide the Company with options to extend the leases for additional periods or to purchase the facilities. Certain of the Company’s facility leases provide for periodic rent increases based on the general rate of inflation. The Company’s rental expense for facilities occupied during fiscal years 2017, 2016, and 2015 was $20.2 million, $16.3 million, and $15.0 million, respectively.
The Company has operating leases regarding certain improved properties in Fremont and Livermore, California (the “Operating Leases”). The Company is required to maintain cash collateral in an aggregate of approximately $250.0 million in separate interest-bearing accounts as security for the Company’s obligations. These amounts are recorded with other restricted cash and investments in the Company’s Consolidated Balance Sheet as of June 25, 2017.
During the term of the Operating Leases and when the terms of the Operating Leases expire, the property subject to those Operating Leases may be re-marketed. The Company has guaranteed to the lessor that each property will have a certain minimum residual value. The aggregate guarantee made by the Company under the Operating Leases is generally no more than $220.4 million; however, under certain default circumstances, the guarantee with regard to an Operating Lease may be 100% of the lessor’s aggregate investment in the applicable property, which in no case will exceed $250.0 million, in the aggregate.
The Company’s contractual cash obligations with respect to operating leases, excluding the residual value guarantees discussed above, as of June 25, 2017, were as follows:
Payments Due by Fiscal Year: | Operating Leases | ||
(in thousands) | |||
2018 | $ | 50,798 | |
2019 | 44,227 | ||
2020 | 16,226 | ||
2021 | 12,131 | ||
2022 | 7,508 | ||
Thereafter | 25,955 | ||
Total | $ | 156,845 | |
Continues on next page
Lam Research Corporation 2017 10-K 88
Other Guarantees
The Company has issued certain indemnifications to its lessors for taxes and general liability under some of its agreements. The Company has entered into insurance contracts that are intended to limit its exposure to such indemnifications. As of June 25, 2017, the Company had not recorded any liability on its Consolidated Financial Statements in connection with these indemnifications, as it does not believe that it is probable that any amounts will be paid under these guarantees.
Generally, the Company indemnifies, under pre-determined conditions and limitations, its customers for infringement of third-party intellectual property rights by the Company’s products or services. The Company seeks to limit its liability for such indemnity to an amount not to exceed the sales price of the products or services subject to its indemnification obligations. The Company does not believe that it is probable that any material amounts will be paid under these guarantees.
The Company provides guarantees and standby letters of credit to certain parties as required for certain transactions initiated during the ordinary course of business. As of June 25, 2017, the maximum potential amount of future payments that the Company could be required to make under these arrangements and letters of credit was $15.7 million. The Company does not believe, based on historical experience and information currently available, that it is probable that any amounts will be required to be paid.
Purchase Obligations
Purchase obligations consist of non-cancelable significant contractual obligations either on an annual basis or over multi-year periods. The contractual cash obligations and commitments table presented below contains the Company’s minimum obligations at June 25, 2017, under these arrangements and others. For obligations with cancellation provisions, the amounts included in the following table were limited to the non-cancelable portion of the agreement terms or the minimum cancellation fee. Actual expenditures will vary based on the volume of transactions and length of contractual service provided.
The Company’s commitments related to these agreements as of June 25, 2017, were as follows:
Payments Due by Fiscal Year: | Purchase Obligations | ||
(in thousands) | |||
2018 | $ | 274,574 | |
2019 | 3,471 | ||
2020 | 3,471 | ||
2021 | 1,622 | ||
2022 | 1,439 | ||
Thereafter | 227 | ||
Total | $ | 284,804 | |
Warranties
The Company provides standard warranties on its systems. The liability amount is based on actual historical warranty spending activity by type of system, customer, and geographic region, modified for any known differences such as the impact of system reliability improvements.
Continues on next page
Lam Research Corporation 2017 10-K 89
Changes in the Company’s product warranty reserves were as follows:
Year Ended | |||||||
June 25, 2017 | June 26, 2016 | ||||||
(in thousands) | |||||||
Balance at beginning of period | $ | 100,321 | $ | 93,209 | |||
Warranties issued during the period | 188,813 | 124,582 | |||||
Settlements made during the period | (135,213 | ) | (114,008 | ) | |||
Changes in liability for pre-existing warranties | 8,060 | (3,462 | ) | ||||
Balance at end of period | $ | 161,981 | $ | 100,321 | |||
Legal Proceedings
While the Company is not currently a party to any legal proceedings that it believes material, the Company is either a defendant or plaintiff in various actions that have arisen from time to time in the normal course of business, including intellectual property claims. The Company accrues for a liability when it is both probable that a liability has been incurred and the amount of the loss can be reasonably estimated. Significant judgment is required in both the determination of probability and the determination as to whether a loss is reasonably estimable. Based on current information, the Company does not believe that a material loss from known matters is probable and therefore has not recorded an accrual for litigation or other contingencies related to existing legal proceedings.
Note 16: Stock Repurchase Program
In November 2016, the Board Directors authorized the repurchase of up to $1 billion of Common Stock. These repurchases can be conducted on the open market or as private purchases and may include the use of derivative contracts with large financial institutions, in all cases subject to compliance with applicable law. Repurchases are funded using the Company’s onshore cash and onshore cash generation. This repurchase program has no termination date and may be suspended or discontinued at any time.
Repurchases under the repurchase program were as follows during the periods indicated:
Period | Total Number of Shares Repurchased | Total Cost of Repurchase | Average Price Paid per Share(1) | Amount Available Under Repurchase Program | ||||||||||
(in thousands, except per share data) | ||||||||||||||
Available balance as of June 26, 2016 | $ | 229,094 | ||||||||||||
Quarter ended September 25, 2016 | — | $ | — | $ | — | $ | 229,094 | |||||||
Board authorization, November 2016 | $ | 1,000,000 | ||||||||||||
Quarter ended December 25, 2016 | 619 | $ | 65,014 | $ | 105.01 | $ | 934,986 | |||||||
Quarter ended March 26, 2017 | 1,223 | $ | 139,760 | $ | 114.30 | $ | 795,226 | |||||||
Quarter ended June 25, 2017 | 2,672 | $ | 513,085 | $ | 128.29 | $ | 282,141 | |||||||
(1) Average price paid per share excludes effect of accelerated share repurchases, see additional disclosure below regarding our accelerated share repurchase activity during the fiscal year.
In addition to shares repurchased under the Board-authorized repurchase program shown above, the Company acquired 809,427 shares at a total cost of $93.8 million during the 12 months ended June 25, 2017, which the Company withheld through net share settlements to cover minimum tax withholding obligations upon the vesting of restricted stock unit awards granted under the Company’s equity compensation plans. The shares retained by the Company through these net share settlements are not a part of the Board-authorized repurchase program but instead are authorized under the Company’s equity compensation plans.
On April 19, 2017, the Company entered into two separate accelerated share repurchase agreements (collectively, the “ASR”) with two financial institutions to repurchase a total of $500 million of Common Stock. The
Continues on next page
Lam Research Corporation 2017 10-K 90
Company took an initial delivery of approximately 2,570,000 shares, which represented 70% of the prepayment amount divided by the Company’s closing stock price on April 19, 2017. The total number of shares to be received under the ASR is based upon the average daily volume weighted average price of our Common Stock during the repurchase period, less an agreed upon discount. Following the fiscal year end, the counterparties designated June 30, 2017, as the termination date, at which time the Company settled the ASR. Approximately 780,000 shares were received at final settlement, which resulted in a weighted-average share price of approximately $149.16 for the transaction period.
Note 17: Comprehensive Income (Loss)
The components of accumulated other comprehensive loss, net of tax at the end of the period, as well as the activity during the period, were as follows:
Accumulated Foreign Currency Translation Adjustment | Accumulated Unrealized Holding Gain (Loss) on Cash Flow Hedges | Accumulated Unrealized Holding Gain (Loss) on Available-For-Sale Investments | Accumulated Unrealized Components of Defined Benefit Plans | Total | |||||||||||||||
(in thousands) | |||||||||||||||||||
Balance as of June 26, 2016 | $ | (39,528 | ) | $ | (15,623 | ) | $ | 4,896 | $ | (19,078 | ) | $ | (69,333 | ) | |||||
Other comprehensive (loss) income before reclassifications | (3,091 | ) | 5,841 | (3,789 | ) | (546 | ) | (1,585 | ) | ||||||||||
Losses (gains) reclassified from accumulated other comprehensive income (loss) to net income | 248 | (2) | 8,971 | (1) | (1 | ) | (2) | — | 9,218 | ||||||||||
Net current-period other comprehensive (loss) income | (2,843 | ) | 14,812 | (3,790 | ) | (546 | ) | 7,633 | |||||||||||
Balance as of June 25, 2017 | $ | (42,371 | ) | $ | (811 | ) | $ | 1,106 | $ | (19,624 | ) | $ | (61,700 | ) | |||||
__________________________________
(1) | Amount of after-tax gain reclassified from accumulated other comprehensive income into net income located in revenue: $10,668 loss; cost of goods sold: $540 gain; selling, general, and administrative expenses: $56 gain; and other income and expense: $1,101 gain. |
(2) | Amount of after-tax gain reclassified from accumulated other comprehensive income into net income located in other expense, net. |
Tax related to other comprehensive income, and the components there to, for the years ended June 25, 2017, June 26, 2016 and June 28, 2015 were not material.
Note 18: Segment, Geographic Information, and Major Customers
The Company operates in one reportable business segment: manufacturing and servicing of wafer processing semiconductor manufacturing equipment. The Company’s material operating segments qualify for aggregation due to their customer base and similarities in economic characteristics, nature of products and services, and processes for procurement, manufacturing, and distribution.
The Company operates in seven geographic regions: United States, China, Europe, Japan, Korea, Southeast Asia, and Taiwan. For geographical reporting, revenue is attributed to the geographic location in which the customers’ facilities are located, while long-lived assets are attributed to the geographic locations in which the assets are located.
Continues on next page
Lam Research Corporation 2017 10-K 91
Revenues and long-lived assets by geographic region were as follows:
Year Ended | |||||||||||
June 25, 2017 | June 26, 2016 | June 28, 2015 | |||||||||
(in thousands) | |||||||||||
Revenue: | |||||||||||
Korea | $ | 2,480,329 | $ | 1,057,331 | $ | 1,406,617 | |||||
Taiwan | 2,095,669 | 1,485,037 | 1,084,239 | ||||||||
Japan | 1,041,969 | 983,821 | 623,575 | ||||||||
China | 1,023,195 | 1,039,951 | 661,094 | ||||||||
United States | 629,937 | 495,123 | 890,891 | ||||||||
Southeast Asia | 401,877 | 605,236 | 278,350 | ||||||||
Europe | 340,644 | 219,394 | 314,546 | ||||||||
Total revenue | $ | 8,013,620 | $ | 5,885,893 | $ | 5,259,312 | |||||
June 25, 2017 | June 26, 2016 | June 28, 2015 | |||||||||
(in thousands) | |||||||||||
Long-lived assets: | |||||||||||
United States | $ | 575,264 | $ | 529,316 | $ | 505,814 | |||||
Europe | 77,211 | 81,377 | 86,779 | ||||||||
Korea | 19,982 | 17,281 | 18,230 | ||||||||
Taiwan | 7,970 | 8,647 | 8,908 | ||||||||
Southeast Asia | 2,179 | 668 | 349 | ||||||||
China | 1,906 | 1,339 | 960 | ||||||||
Japan | 1,083 | 980 | 378 | ||||||||
$ | 685,595 | $ | 639,608 | $ | 621,418 | ||||||
In fiscal year 2017, five customers accounted for approximately 23%, 16%, 12%, 11%, and 10% of total revenues. In fiscal year 2016, four customers accounted for approximately 17%, 16%, 12%, and 10% of total revenues. In fiscal year 2015, three customers accounted for approximately 28%, 12%, and 11% of total revenues. No other customers accounted for more than 10% of total revenues.
Note 19: Business Combinations
On October 20, 2015, the Company entered into an Agreement and Plan of Merger and Reorganization with KLA-Tencor Corporation. On October 5, 2016, the Company and KLA-Tencor announced that they had mutually agreed to terminate their previously announced Agreement and Plan of Merger and Reorganization. No termination fee was incurred by either the Company or KLA-Tencor.
During the years ended June 25, 2017, and June 26, 2016, the Company expensed as incurred acquisition-related costs of $9.8 million and $51.0 million, respectively, within selling, general, and administrative expense in the Consolidated Statement of Operations.
Continues on next page
Lam Research Corporation 2017 10-K 92
Report of Independent Registered Public Accounting Firm
The Board of Directors and Stockholders of Lam Research Corporation
We have audited the accompanying consolidated balance sheets of Lam Research Corporation as of June 25, 2017, and June 26, 2016, and the related consolidated statements of operations, comprehensive income, cash flows, and stockholders' equity for each of the three years in the period ended June 25, 2017. Our audits also included the financial statement schedule listed in the Index at Item 15(a)(2). These financial statements and schedule are the responsibility of the Company's management. Our responsibility is to express an opinion on these financial statements and schedule based on our audits.
We conducted our audits in accordance with the standards of the Public Company Accounting Oversight Board (United States). Those standards require that we plan and perform the audit to obtain reasonable assurance about whether the financial statements are free of material misstatement. An audit includes examining, on a test basis, evidence supporting the amounts and disclosures in the financial statements. An audit also includes assessing the accounting principles used and significant estimates made by management, as well as evaluating the overall financial statement presentation. We believe that our audits provide a reasonable basis for our opinion.
In our opinion, the financial statements referred to above present fairly, in all material respects, the consolidated financial position of Lam Research Corporation at June 25, 2017 and June 26, 2016, and the consolidated results of its operations and its cash flows for each of the three years in the period ended June 25, 2017, in conformity with U.S. generally accepted accounting principles. Also, in our opinion, the related financial statement schedule, when considered in relation to the basic financial statements taken as a whole, presents fairly in all material respects the information set forth therein.
We also have audited, in accordance with the standards of the Public Company Accounting Oversight Board (United States), Lam Research Corporation's internal control over financial reporting as of June 25, 2017, based on criteria established in Internal Control-Integrated Framework issued by the Committee of Sponsoring Organizations of the Treadway Commission (2013 framework) and our report dated August 15, 2017 expressed an unqualified opinion thereon.
/s/ Ernst & Young LLP
San Jose, California
August 15, 2017
Continues on next page
Lam Research Corporation 2017 10-K 93
Report of Independent Registered Public Accounting Firm
The Board of Directors and Stockholders of Lam Research Corporation
We have audited Lam Research Corporation’s internal control over financial reporting as of June 25, 2017, based on criteria established in Internal Control-Integrated Framework issued by the Committee of Sponsoring Organizations of the Treadway Commission (2013 framework), (the COSO criteria). Lam Research Corporation’s management is responsible for maintaining effective internal control over financial reporting, and for its assessment of the effectiveness of internal control over financial reporting included in the accompanying Management’s Report on Internal Control Over Financial Reporting. Our responsibility is to express an opinion on the company’s internal control over financial reporting based on our audit.
We conducted our audit in accordance with the standards of the Public Company Accounting Oversight Board (United States). Those standards require that we plan and perform the audit to obtain reasonable assurance about whether effective internal control over financial reporting was maintained in all material respects. Our audit included obtaining an understanding of internal control over financial reporting, assessing the risk that a material weakness exists, testing and evaluating the design and operating effectiveness of internal control based on the assessed risk, and performing such other procedures as we considered necessary in the circumstances. We believe that our audit provides a reasonable basis for our opinion.
A company’s internal control over financial reporting is a process designed to provide reasonable assurance regarding the reliability of financial reporting and the preparation of financial statements for external purposes in accordance with generally accepted accounting principles. A company’s internal control over financial reporting includes those policies and procedures that (1) pertain to the maintenance of records that, in reasonable detail, accurately and fairly reflect the transactions and dispositions of the assets of the company; (2) provide reasonable assurance that transactions are recorded as necessary to permit preparation of financial statements in accordance with generally accepted accounting principles, and that receipts and expenditures of the company are being made only in accordance with authorizations of management and directors of the company; and (3) provide reasonable assurance regarding prevention or timely detection of unauthorized acquisition, use, or disposition of the company’s assets that could have a material effect on the financial statements.
Because of its inherent limitations, internal control over financial reporting may not prevent or detect misstatements. Also, projections of any evaluation of effectiveness to future periods are subject to the risk that controls may become inadequate because of changes in conditions, or that the degree of compliance with the policies or procedures may deteriorate.
In our opinion, Lam Research Corporation maintained, in all material respects, effective internal control over financial reporting as of June 25, 2017, based on the COSO criteria.
We also have audited, in accordance with the standards of the Public Company Accounting Oversight Board (United States), the 2017 consolidated financial statements of Lam Research Corporation and our report dated August 15, 2017 expressed an unqualified opinion thereon.
/s/ Ernst & Young LLP
San Jose, California
August 15, 2017
Continues on next page
Lam Research Corporation 2017 10-K 94
Item 9. | Changes in and Disagreements with Accountants on Accounting and Financial Disclosure |
None.
Item 9A. Controls and Procedures
Design of Disclosure Controls and Procedures and Internal Control over Financial Reporting
We maintain disclosure controls and procedures and internal control over final reporting that are designed to comply with Rule 13a-15 of the Exchange Act. In designing and evaluating the controls and procedures associated with each, management recognizes that any controls and procedures, no matter how well designed and operated, can provide only reasonable assurance of achieving the desired control objectives and that the effectiveness of controls cannot be absolute because the cost to design and implement a control to identify errors or mitigate the risk of errors occurring should not outweigh the potential loss caused by the errors that would likely be detected by the control. Moreover, we believe that a control system cannot be guaranteed to be 100% effective all of the time. Accordingly, a control system, no matter how well designed and operated, can provide only reasonable, not absolute, assurance that the control system’s objectives will be met.
Disclosure Controls and Procedures
As required by Rule 13a-15(b) under the Securities Exchange Act of 1934, as amended (the “Exchange Act”), as of June 25, 2017, we carried out an evaluation, under the supervision and with the participation of our management, including our Chief Executive Officer and our Chief Financial Officer, of the effectiveness of the design and operation of our disclosure controls and procedures as defined in Rule 13a-15(e). Based upon that evaluation, our Chief Executive Officer and our Chief Financial Officer each concluded that our disclosure controls and procedures are effective, as of June 25, 2017, at the reasonable assurance level.
We intend to review and evaluate the design and effectiveness of our disclosure controls and procedures on an ongoing basis and to correct any material deficiencies that we may discover. Our goal is to ensure that our senior management has timely access to material information that could affect our business.
Changes in Internal Control over Financial Reporting
There has been no change in our internal control over financial reporting during our most recent fiscal quarter that has materially affected, or is reasonably likely to materially affect, our internal control over financial reporting.
Management’s Report on Internal Control over Financial Reporting
Management is responsible for establishing and maintaining adequate “internal control over financial reporting”, as that term is defined in Exchange Act Rules 13a-15(f) and 15d-15(f). Management conducted an evaluation of the effectiveness of internal control over financial reporting based on the framework in Internal Controls — Integrated Framework used by the Committee of Sponsoring Organizations of the Treadway Commission (2013 Framework). Based on that evaluation, management has concluded that the Company’s internal control over financial reporting was effective as of June 25, 2017, at providing reasonable assurance regarding the reliability of financial reporting and the preparation of financial statements for external purposes in accordance with GAAP.
Ernst & Young LLP, an independent registered public accounting firm, has audited the Company’s internal control over financial reporting, as stated in their report, which is included in Part II, Item 8 of this 2017 Form 10-K.
Effectiveness of Controls
While we believe the present design of our disclosure controls and procedures and internal control over financial reporting is effective at the reasonable assurance level, future events affecting our business may cause us to modify our disclosure controls and procedures or internal controls over financial reporting.
Item 9B. | Other Information |
None.
Continues on next page
Lam Research Corporation 2017 10-K 95
PART III
We have omitted from this 2017 Form 10-K certain information required by Part III because we, as the Registrant, will file a definitive proxy statement with the SEC within 120 days after the end of our fiscal year, pursuant to Regulation 14A, as promulgated by the SEC, for our Annual Meeting of Stockholders expected to be held on or about November 8, 2017, (the “Proxy Statement”), and certain information included in the Proxy Statement is incorporated into this report by reference.
Item 10. | Directors, Executive Officers, and Corporate Governance |
For information regarding our executive officers, see Part I, Item 1 of this 2017 Form 10-K under the caption “Executive Officers of the Company,” which information is incorporated into Part III by reference.
The information concerning our directors required by this Item is incorporated by reference to our Proxy Statement under the heading “Voting Proposals — Proposal No. 1: Election of Directors — 2017 Nominees for Director.”
The information concerning our audit committee and audit committee financial experts required by this Item is incorporated by reference to our Proxy Statement under the heading “Governance Matters — Corporate Governance — Board Committees” and “Governance Matters — Corporate Governance — Board Committees — Audit Committee.”
The information concerning compliance by our officers, directors and 10% shareholders with Section 16 of the Exchange Act required by this Item is incorporated by reference to our Proxy Statement under the heading “Stock Ownership – Section 16(a) Beneficial Ownership Reporting Compliance.”
The Company has adopted a Corporate Code of Ethics that applies to all employees, officers, and directors of the Company. Our Code of Ethics is publicly available on the Investor Relations page of our website at investor.lamresearch.com. To the extent required by law, any amendments to, or waivers from, any provision of the Code of Ethics will promptly be disclosed to the public. To the extent permitted by applicable legal requirements, we intend to make any required public disclosure by posting the relevant material on our website in accordance with SEC rules.
Item 11. | Executive Compensation |
The information required by this Item is incorporated by reference to our Proxy Statement under the heading “Compensation Matters — Executive Compensation and Other Information.”
Item 12. | Security Ownership of Certain Beneficial Owners and Management and Related Stockholder Matters |
The information required by this Item is incorporated by reference to our Proxy Statement under the headings “Stock Ownership — Security Ownership of Certain Beneficial Owners and Management” and “Compensation Matters — Securities Authorized for Issuance Under Equity Compensation Plans.”
Item 13. | Certain Relationships and Related Transactions, and Director Independence |
The information required by this Item is incorporated by reference to our Proxy Statement under the headings “Audit Matters — Certain Relationships and Related Transactions” and “Governance Matters — Corporate Governance — Director Independence Policies.”
Item 14. | Principal Accounting Fees and Services |
The information required by this Item is incorporated by reference to our Proxy Statement under the heading “Audit Matters — Relationship with Independent Registered Public Accounting Firm –– Fees Billed by EY” and “Audit Matters –– Relationship with Independent Registered Public Accounting Firm –– Policy on Audit Committee Pre-Approval of Audit and Non-Audit Services.”
Continues on next page
Lam Research Corporation 2017 10-K 96
PART IV
Item 15. | Exhibits, Financial Statement Schedules |
(a) | The following documents are filed as part of this Annual Report on Form 10-K. |
Page | |
1. Index to Financial Statements | |
Consolidated Statements of Operations — Years Ended June 25, 2017, June 26, 2017, and June 28, 2015 | |
Consolidated Statements of Comprehensive Income — Years Ended June 25, 2017, June 26, 2017, and June 28, 2015 | |
Consolidated Balance Sheets — June 25, 2017 and June 26, 2016 | |
Consolidated Statements of Cash Flows — Years Ended June 25, 2017, June 26, 2017, and June 28, 2015 | |
Consolidated Statements of Stockholders’ Equity — Years Ended June 25, 2017, June 26, 2017, and June 28, 2015 | |
Notes to Consolidated Financial Statements | |
Reports of Independent Registered Public Accounting Firm | |
2. Index to Financial Statement Schedules | |
Schedule II — Valuation and Qualifying Accounts | |
Schedules, other than those listed above, have been omitted since they are not applicable/not required or the information is included elsewhere herein. | |
3. See (b) of this Item 15, which is incorporated herein by reference. | |
(b) | The list of Exhibits follows page 100 of this 2017 Annual Report on Form 10-K and is incorporated herein by this reference. |
Continues on next page
Lam Research Corporation 2017 10-K 97
SIGNATURES
Pursuant to the requirements of Section 13 or 15(d) of the Securities Exchange Act of 1934, as amended, the Registrant has duly caused this Report to be signed on its behalf by the undersigned, thereunto duly authorized.
Date: | August 15, 2017 | LAM RESEARCH CORPORATION (Registrant) | |
By: | /s/ Martin B. Anstice | ||
Martin B. Anstice | |||
President and Chief Executive Officer | |||
Continues on next page
Lam Research Corporation 2017 10-K 98
POWER OF ATTORNEY AND SIGNATURES
By signing this Annual Report on Form 10-K below, I hereby appoint each of Martin B. Anstice and Douglas R. Bettinger, jointly and severally, as my attorney-in-fact to sign all amendments to this Form 10-K on my behalf and to file this Form 10-K (including all exhibits and other related documents) with the Securities and Exchange Commission. I authorize each of my attorneys-in-fact to (1) appoint a substitute attorney-in-fact for himself and (2) perform any actions that he believes are necessary or appropriate to carry out the intention and purpose of this Power of Attorney. I ratify and confirm all lawful actions taken directly or indirectly by my attorneys-in-fact and by any properly appointed substitute attorneys-in-fact.
Pursuant to the requirements of the Securities Exchange Act of 1934, as amended, this Report has been signed below by the following persons on behalf of the Registrant and in the capacities and on the dates indicated.
Signatures | Title | Date | ||
Principal Executive Officer | ||||
/s/ Martin B. Anstice | President, Chief Executive Officer, and Director | August 15, 2017 | ||
Martin B. Anstice | ||||
Principal Financial Officer and Principal Accounting Officer | ||||
/s/ Douglas R. Bettinger | Executive Vice President, Chief Financial Officer, and Chief Accounting Officer | August 15, 2017 | ||
Douglas R. Bettinger | ||||
Other Directors | ||||
/s/ Stephen G. Newberry | Chairman | August 15, 2017 | ||
Stephen G. Newberry | ||||
/s/ Erik K. Brandt | Director | August 15, 2017 | ||
Eric K. Brandt | ||||
/s/ Michael R. Cannon | Director | August 15, 2017 | ||
Michael R. Cannon | ||||
/a/ Youssef A. El-Mansy | Director | August 15, 2017 | ||
Youssef A. El-Mansy | ||||
/s/ Christine Heckart | Director | August 15, 2017 | ||
Christine Heckart | ||||
/s/ Young Bum Koh | Director | August 15, 2017 | ||
Young Bum (YB) Koh | ||||
/s/ Catherine P. Lego | Director | August 15, 2017 | ||
Catherine P. Lego | ||||
/s/ Abhi Talwalkar | Director | August 15, 2017 | ||
Abhi Talwalkar | ||||
/s/ Lih Shyng Tsai | Director | August 15, 2017 | ||
Lih Shyng (Rick L.) Tsai | ||||
Continues on next page
Lam Research Corporation 2017 10-K 99
LAM RESEARCH CORPORATION
SCHEDULE II — VALUATION AND QUALIFYING ACCOUNTS
(in thousands)
Additions | ||||||||||||||||
Description | Balance at Beginning of Period | Charged to Costs and Expenses | Write-offs, Net of Recoveries | Balance at End of Period | ||||||||||||
YEAR ENDED JUNE 25, 2017 | ||||||||||||||||
Deducted from asset accounts: | ||||||||||||||||
Allowance for doubtful accounts | $ | 5,155 | $ | 2,000 | $ | (2,052 | ) | $ | 5,103 | |||||||
YEAR ENDED JUNE 26, 2016 | ||||||||||||||||
Deducted from asset accounts: | ||||||||||||||||
Allowance for doubtful accounts | $ | 4,890 | $ | — | $ | 265 | $ | 5,155 | ||||||||
YEAR ENDED JUNE 28, 2015 | ||||||||||||||||
Deducted from asset accounts: | ||||||||||||||||
Allowance for doubtful accounts | $ | 4,962 | $ | 8 | $ | (80 | ) | $ | 4,890 | |||||||
Continues on next page
Lam Research Corporation 2017 10-K 100
LAM RESEARCH CORPORATION
ANNUAL REPORT ON FORM 10-K
FOR THE FISCAL YEAR ENDED JUNE 25, 2017
EXHIBIT INDEX
Exhibit | Description | |
2.1(23) | Agreement and Plan of Merger and Reorganization, dated as of October 20, 2015, by and among Lam Research Corporation, Topeka Merger Sub 1, Inc., Topeka Merger Sub 2, Inc., and KLA-Tencor Corporation. | |
2.2 (30) | Termination Agreement dated as of October 5, 2016 by and between Lam Research Corporation and KLA-Tencor Corporation. | |
3.1(32) | Restated Certificate of Incorporation of the Registrant, (including Certificate and Designation, Preferences and Rights of Series A Junior Participating Preferred Stock), dated November 22, 2016. | |
3.2(33) | Bylaws of the Registrant, as amended and restated, dated February 8, 2017. | |
4.2(5) | Indenture (including Form of Notes), dated as of May 11, 2011, by and between Lam Research Corporation, and The Bank of New York Mellon Trust Company, N.A, as trustee, with respect to the 2018 Notes. | |
4.15(22)* | Lam Research Corporation 2007 Stock Incentive Plan, as amended. | |
4.16(6)* | Lam Research Corporation Elective Deferred Compensation Plan. | |
4.17(6)* | Lam Research Corporation Elective Deferred Compensation Plan II. | |
4.18(7) | Indenture between Novellus Systems, Inc. as Issuer and The Bank of New York Mellon Trust Company, N.A. as Trustee, dated as of May 10, 2011, including the form of 2.625% Senior Convertible Notes due 2041. | |
4.19(4) | Supplemental Indenture among the Registrant, as Guarantor, Novellus Systems, Inc. as Issuer and The Bank of New York Mellon Trust Company, N.A. as Trustee, dated as of June 4, 2012. | |
4.20(13) | Lam Research Corporation 1999 Employee Stock Purchase Plan, as amended. | |
4.21(19) | Indenture (including Form of Notes), dated as of February 13, 2015, between Registrant and The Bank of New York Mellon Trust Company, N.A. | |
4.22(20) | First Supplemental Indenture, dated as of March 12, 2015, by and between Lam Research Corporation and The Bank of New York Mellon Trust Company, N.A., as trustee | |
4.23(28) | Second Supplemental Indenture, dated as of June 7, 2016, by and between Lam Research Corporation and The Bank of New York Mellon Trust Company, N.A., as trustee. | |
4.24(24)* | 2004 Executive Incentive Plan, as Amended and Restated. | |
4.25(24)* | 2015 Stock Incentive Plan. | |
10.3(1)* | Form of Indemnification Agreement. | |
10.107(2) | Form of Restricted Stock Unit Award Agreement—Outside Directors (U.S. Agreement) — Lam Research Corporation 2007 Stock Incentive Plan. | |
10.108(2) | Form of Restricted Stock Unit Award Agreement—Outside Directors (non-U.S. Agreement) — Lam Research Corporation 2007 Stock Incentive Plan. | |
10.148(3)* | Form of Indemnification Agreement. | |
10.151(4)* | Form of Indemnification Agreement. | |
10.162(8)* | Form of Novellus Directors and Officers Indemnification Agreement. | |
10.168(9) | Lease Guaranty between Novellus and Phoenix Industrial Investment Partners, L.P. dated January 21, 2003. | |
10.169(10) | Binding Memorandum of Understanding between Novellus, and Applied Materials, Inc., effective as of September 3, 2004. Portions of this exhibit have been omitted pursuant to a request for confidential treatment. | |
10.170(11)* | Novellus Amended Executive Voluntary Deferred Compensation Plan, as amended. | |
Continues on next page
Lam Research Corporation 2017 10-K 101
Exhibit | Description | |
10.171(12)* | Novellus Accelerated Stock Vesting Retirement Plan Summary. | |
10.172(14)* | Novellus Systems, Inc. 2011 Stock Incentive Plan, as amended July 18, 2012. | |
10.181(15)* | Form of Restricted Stock Unit Award Agreement (U.S. Participants) — Lam Research Corporation 2007 Stock Incentive Plan. | |
10.182(15)* | Form of Restricted Stock Unit Award Agreement (International Participants) — Lam Research Corporation 2007 Stock Incentive Plan. | |
10.183(15)* | Form of Nonstatutory Stock Option Award Agreement (U.S. Participants) — Lam Research Corporation 2007 Stock Incentive Plan. | |
10.184(15)* | Form of Nonstatutory Stock Option Award Agreement (International Participants) — Lam Research Corporation 2007 Stock Incentive Plan. | |
10.187(15)* | Form of Restricted Stock Unit Award Agreement (U.S. Participants) — Lam Research Corporation (Novellus Systems, Inc.) 2011 Stock Incentive Plan (As Amended) | |
10.188(15)* | Form of Restricted Stock Unit Award Agreement (International Participants) — Lam Research Corporation (Novellus Systems, Inc.) 2011 Stock Incentive Plan (As Amended) | |
10.189(15)* | Form of Nonstatutory Stock Option Award Agreement (U.S. Participants) — Lam Research Corporation (Novellus Systems, Inc.) 2011 Stock Incentive Plan (As Amended). | |
10.191(15)* | Form of Nonstatutory Stock Option Award Agreement (International Participants) — Lam Research Corporation (Novellus Systems, Inc.) 2011 Stock Incentive Plan (As Amended). | |
10.211(16)* | Form of Market-Based Performance Restricted Stock Unit Award Agreement (U.S. Participants) — Lam Research Corporation 2007 Stock Incentive Plan. | |
10.212(16)* | Form of Market-Based Performance Restricted Stock Unit Award Agreement (International Participants)—Lam Research Corporation 2007 Stock Incentive Plan | |
10.213(16)* | Form of Market-Based Performance Restricted Stock Unit Award Agreement (U.S. Participants) — Lam Research Corporation (Novellus Systems, Inc.) 2011 Stock Incentive Plan (As Amended). | |
10.214(16)* | Form of Market-Based Performance Restricted Stock Unit Award Agreement (International Participants) — Lam Research Corporation (Novellus Systems, Inc.) 2011 Stock Incentive Plan (As Amended). | |
10.231(17)* | Employment Agreement with Martin B. Anstice, dated January 13, 2015. | |
10.232(17)* | Employment Agreement with Timothy M. Archer, dated January 13, 2015. | |
10.233(17)* | Employment Agreement with Douglas R. Bettinger, dated January 13, 2015. | |
10.234(17)* | Employment Agreement with Richard A. Gottscho, dated January 13, 2015. | |
10.235(17)* | Form of Change in Control Agreement. | |
10.236(26) | Chairman’s Agreement with Stephen G. Newberry, dated December 14, 2015 | |
10.237(18) | Form of Confidentiality Agreement. | |
10.243(23) | Commitment Letter, dated October 20, 2015, by and among Lam Research Corporation, Goldman Sachs Bank USA and Goldman Sachs Lending Partners LLC. | |
10.244(24)* | Form of Restricted Stock Unit Award Agreement (U.S. Participants) - 2015 Stock Incentive Plan. | |
10.245(24)* | Form of Restricted Stock Unit Award Agreement (International Participants) - 2015 Stock Incentive Plan. | |
10.246(24)* | Form of Restricted Stock Unit Award Agreement (Outside Directors) - 2015 Stock Incentive Plan. | |
10.247(24)* | Form of Option Award Agreement (U.S. Participants) - 2015 Stock Incentive Plan. | |
10.248(24)* | Form of Option Award Agreement (International Participants) - 2015 Stock Incentive Plan. | |
10.249(24)* | Form of Market-Based Performance Restricted Stock Unit Award Agreement (U.S. Participants) - 2015 Stock Incentive Plan. | |
10.250(24)* | Form of Market-Based Performance Restricted Stock Unit Award Agreement (International Participants) - 2015 Stock Incentive Plan. | |
Continues on next page
Lam Research Corporation 2017 10-K 102
Exhibit | Description | |
10.251(25) | Amendment and Restatement Agreement, dated November 10, 2015 among Lam Research Corporation, JPMorgan Chase Bank, N.A., as administrative agent, and the other agents and lenders listed therein, and all exhibits and schedules attached thereto. | |
10.252(25) | Joinder Agreement, dated as of November 10, 2015, among Lam Research Corporation and the other agents and lenders listed therein, and the schedules attached thereto. | |
10.253(27) | Amended and Restated Term Loan Agreement, dated May 13, 2016, among Lam Research Corporation, the lenders party thereto and JPMorgan Chase Bank, N.A., as administrative agent. | |
10.254 (29) | Amendment No. 1 to the Amended and Restated Credit Agreement, dated April 26, 2016 among Lam Research Corporation, JPMorgan Chase Bank, N.A., as administrative agent, and the other agents and lenders listed therein, and all exhibits and schedules attached thereto. | |
10.255(31)* | Form of Market-Based Performance Restricted Stock Unit Award Agreement (U.S. Participants) - 2015 Stock Incentive Plan. | |
10.256(31)* | Form of Market-Based Performance Restricted Stock Unit Award Agreement (International Participants) - 2015 Stock Incentive Plan. | |
10.257 (35)* | Form of Indemnification Agreement. | |
10.258 (35) | Chairman’s Agreement with Stephen G. Newberry, dated December 14, 2016. | |
20.1(34) | Notices of Adjustment of Conversion Rate pursuant to the Indentures dated May 11, 2011, by and between Lam Research Corporation and The Bank of New York Mellon Trust Company, N.A. as Trustee with respect to the 1.250% Senior Convertible Notes Due 2018, and Notice of Adjustment of Conversion Rate pursuant to the indenture dated May 10, 2011, by and between Novellus Systems Incorporated and The Bank of New York Mellon Trust company, N.A. as Trustee with respect to the 2.625% Senior Convertible Notes Due 2041. | |
21 | Subsidiaries of the Registrant. | |
23.1 | Consent of Independent Registered Public Accounting Firm. | |
24 | Power of Attorney (See Signature page) | |
31.1 | Rule 13a — 14(a) / 15d — 14(a) Certification (Principal Executive Officer) | |
31.2 | Rule 13a — 14(a) / 15d — 14(a) Certification (Principal Financial Officer) | |
32.1 | Section 1350 Certification — (Principal Executive Officer) | |
32.2 | Section 1350 Certification — (Principal Financial Officer) | |
101.INS | XBRL Instance Document | |
101.SCH | XBRL Taxonomy Extension Schema Document | |
101.CAL | XBRL Taxonomy Extension Calculation Linkbase Document | |
101.DEF | XBRL Taxonomy Extension Definition Linkbase Document | |
101.LAB | XBRL Taxonomy Extension Label Linkbase Document | |
101.PRE | XBRL Taxonomy Extension Presentation Linkbase Document | |
__________________________________
(1) | Incorporated by reference to the Registrant’s Quarterly Report on Form 10-Q for the quarter ended April 3, 1988 (SEC File No. 000-12933). |
(2) | Incorporated by reference to Registrant’s Quarterly Report on Form 10-Q filed on April 30, 2007 (SEC File No. 000-12933). |
(3) | Incorporated by reference to Registrant’s Current Report on Form 8-K filed on November 13, 2008 (SEC File No. 000-12933). |
(4) | Incorporated by reference to Registrant’s Current Report on Form 8-K filed on June 4, 2012 (SEC File No. 000-12933). |
(5) | Incorporated by reference to Registrant’s Current Report on Form 8-K filed on May 11, 2011 (SEC File No. 000-12933). |
(6) | Incorporated by reference to Registrant’s Annual Report on Form 10-K filed on August 19, 2011 (SEC File No. 000-12933) |
Continues on next page
Lam Research Corporation 2017 10-K 103
(7) | Incorporated by reference to Novellus’ Current Report on Form 8-K filed on May 10, 2011 (SEC File No. 000-17157). |
(8) | Incorporated by reference to Novellus’ Current Report on Form 10-Q filed on August 13, 2002 (SEC File No. 000-17157). |
(9) | Incorporated by reference to Novellus’ Annual Report on Form 10-K filed on March 5, 2003 (SEC File No. 000-17157). |
(10) | Incorporated by reference to Novellus’ Current Report on Form 8-K filed on September 24, 2004 (SEC File No. 000-17157). |
(11) | Incorporated by reference to Novellus’ Quarterly Report on Form 10-Q filed on November 5, 2008 (SEC File No. 000-17157). |
(12) | Incorporated by reference to Novellus’ Quarterly Report on Form 10-Q filed on November 2, 2010 (SEC File No. 000-17157). |
(13) | Incorporated by reference to Registrant’s Quarterly Report on Form 10-Q filed on January 31, 2013 (SEC File No. 000-12933). |
(14) | Incorporated by reference to Registrant’s Annual Report on Form 10-K filed on August 22, 2012 (SEC File No. 000-12933). |
(15) | Incorporated by reference to Registrant’s Quarterly Report on Form 10-Q filed on February 6, 2014 (SEC File No. 000-12933). |
(16) | Incorporated by reference to the Registrant’s Current Report on Form 8-K filed on February 18, 2014 (SEC File No. 000-12933). |
(17) | Incorporated by reference to the Registrant’s Current Report on Form 8-K filed on January 16, 2015 (SEC File No. 000-12933). |
(18) | Incorporated by reference to the Registrant’s Quarterly Report on Form 10-Q filed on February 3, 2015 (SEC File No. 000-12933). |
(19) | Incorporated by reference to the Registrant’s Registration Statement on Form S-3 filed on February 13, 2015 (SEC File No. 333-202110). |
(20) | Incorporated by reference to the Registrant’s Current Report on Form 8-K filed on March 12, 2015 (SEC File No. 000-12933). |
(21) | Incorporated by reference to the Registrant’s Current Report on Form 8-K filed on June 16, 2015 (SEC File No. 000-12933). |
(22) | Incorporated by reference to Registrant’s Annual Report on Form 10-K filed on August 27, 2013 (SEC File No. 000-12933). |
(23) | Incorporated by reference to the Registrant’s Current Report on Form 8-K filed on October 21, 2015 (SEC File No. 000-12933). |
(24) | Incorporated by reference to the Registrant’s Current Report on Form 8-K filed on November 5, 2015 (SEC File No. 000-12933). |
(25) | Incorporated by reference to the Registrant’s Current Report on Form 8-K filed on November 12, 2015 (SEC File No. 000-12933). |
(26) | Incorporated by reference to the Registrant’s Quarterly Report on Form 10-Q filed on February 3, 2016 (SEC File No. 000-12933). |
(27) | Incorporated by reference to the Registrant’s Current Report on Form 8-K filed on May 13, 2016 (SEC File No. 000-12933). |
(28) | Incorporated by reference to the Registrant’s Current Report on Form 8-K filed on June 7, 2016 (SEC File No. 000-12933). |
(29) | Incorporated by reference to the Registrant’s Annual Report on Form 10-K filed on August 17, 2016 (SEC File No. 000-12933). |
(30) | Incorporated by reference to the Registrant’s Current Report on Form 8-K filed on October 6, 2016 (SEC File No. 000-12933). |
(31) | Incorporated by reference to the Registrant’s Quarterly Report on Form 10-Q filed on October 25, 2016 (SEC File No. 000-12933). |
(32) | Incorporated by reference to the Registrant’s Quarterly Report on Form 10-Q filed on January 30, 2017 (SEC File No. 000-12933). |
(33) | Incorporated by reference to the Registrant’s Current Report on Form 8-K filed on February 14, 2017 (SEC File No. 000-12933). |
(34) | Incorporated by reference to the Registrant’s Current Report on Form 8-K filed on June 9, 2017 (SEC File No. 000-12933). |
(35) | Incorporated by reference to the Registrant’s Quarterly Report on Form 10-Q filed on April 24, 2017 (SEC File No. 000-12933). |
Continues on next page
Lam Research Corporation 2017 10-K 104
* | Indicates management contract or compensatory plan or arrangement in which executive officers of the Company are eligible to participate. |
Continues on next page
Lam Research Corporation 2017 10-K 105