Attached files
| file | filename |
|---|---|
| 8-K - FORM 8-K - KLONDEX MINES LTD | form8k.htm |
NOTICE TO READER
The technical report titled “Technical Report and Pre-Feasibility Study for the Hollister Underground Mine, Elko County, Nevada” (the “Technical Report”) was originally filed on SEDAR on August 4, 2017. The Technical Report is being re-filed in order to correct certain typographical errors in Section 1.6 (Page 6), Table 1-4 (page 7), Figure 1-2 (page 7), Section 22.1 (page 169), and Table 22-2 (page 170). The change to Section 1.6 was made to correct a typographical error in stating the Net Present Value and Internal Rate of Return. The changes to Table 1-4 and Table 22-2 were made in order to correct the Internal Rate of Return to 110% rather than 1074%, as reflected in the attached Technical Report. Also the change on Section 22.1 was to include the assumption that the “Financial analysis have not been adjusted for acquisition cost”. Other than the changes made to the tables and figures noted above, the Technical Report remains the same in all respects.
![]()
Technical Report and Pre-Feasibility Study for the
Hollister Underground Mine
ELKO COUNTY
NEVADA
Latitude 41°06' N
Longitude 116°31' W
Prepared for:
Klondex Mines Ltd.
![]()
Qualified Persons
Brian Morris
Robert Thomason
John Rust
Mark Odell
Sarah Bull
Effective Date: May 31, 2017
Amended Report Date: August 9, 2017
|
|
Technical Report and Pre - Feasibility Study for the Hollister
Underground Mine | Title May 31, 2017 | Effective Date August 9, 2017 | Report Date |

| Title | Technical Report and Pre-Feasibility Study for the Hollister Underground Mine | ||
| Revision | 1.0 | ||
| Effective Date | May 31, 2017 | ||
| Report Date | August 9, 2017 | ||
| Originator | Brian Morris | ||
| Designation | Senior Vice President Klondex Mines Ltd. | ||
| Signature | |||
| Date | |||
| Authored by | Robert Thomason | ||
| Designation | Corporate Senior Geologist | ||
| Signature | |||
| Date | |||
| Peer Reviewed by | Mark Odell | ||
| Designation | President, Practical Mining, LLC. | ||
| Signature | |||
| Date | |||
| Amendments | Date | Notes | |
| Revision 02 | - | - | |
| Revision 03 | - | - | |
| ii | P a g e |
|
|
Technical Report and Pre - Feasibility Study for the Hollister
Underground Mine | Title May 31, 2017 | Effective Date August 9, 2017 | Report Date |
Table of Content
| Abbreviations and Acronyms | xi | ||
| 1 | Summary | 1 | |
| 1.1 | Property Description | 1 | |
| 1.2 | Geology | 2 | |
| 1.3 | History | 3 | |
| 1.4 | Underground Mineral Resource Estimate | 4 | |
| 1.5 | Underground Mineral Reserve Estimate | 6 | |
| 1.6 | Cash Flow Analysis and Economics | 6 | |
| 1.7 | Conclusions | 8 | |
| 2 | Introduction | 9 | |
| 2.1 | Terms of Reference and Purpose of this Technical Report | 9 | |
| 2.2 | Qualification of the Authors | 9 | |
| 2.3 | Sources of Information | 11 | |
| 2.4 | Units of Measure | 11 | |
| 3 | Reliance on Other Experts | 12 | |
| 4 | Property Description and Location | 13 | |
| 4.1 | Mineral Tenure | 13 | |
| 4.2 | Permits and Authorization | 19 | |
| 4.3 | Environmental Considerations | 20 | |
| 5 | Accessibility, Climate, Local Resources, Infrastructure and Physiography | 21 | |
| 5.1 | Topography, Elevation, and Vegetation | 21 | |
| 5.2 | Accessibility | 21 | |
| 5.3 | Population Centers and the Nature of Transport | 23 | |
| 5.4 | Climate and the Length of the Operating Season | 23 | |
| 5.5 |
Surface Rights for Mining Operations, the Availability and Sources of Power, Water, Mining Personnel, Potential Tailings Storage Areas, Potential Waste Disposal Areas, Heap Leach Pad Areas, and Potential Processing Locations |
23 | |
| 6 | History | 25 | |
| 6.1 | Ownership History | 25 | |
| 6.2 | Historical Exploration | 27 | |
| 6.3 | Historical Resource Estimation | 32 | |
| 6.4 | Historical Production | 33 | |
| 7 | Geological Setting and Mineralization | 35 | |
| 7.1 | Regional Overview | 35 | |
| 7.2 | Local Geology | 37 | |
| 7.3 | Property Geology | 38 | |
| 7.4 | Structural Setting | 40 | |
| 7.5 | Alteration Lithology | 42 | |
| 7.6 | Mineralization | 43 | |
| 8 | Deposit Types | 47 | |
| 8.1 | Epithermal Low Sulfidation | 47 | |
| 8.2 | Carlin-type | 48 | |
| 9 | Exploration | 50 | |
| 9.1 | Hatter Graben Vein System | 51 | |
| iii | P a g e |
|
|
Technical Report and Pre - Feasibility Study for the Hollister
Underground Mine | Title May 31, 2017 | Effective Date August 9, 2017 | Report Date |
| 10 | Drilling | 53 | |
| 10.1 | Drilling Procedure | 56 | |
| 10.2 | Core Recovery | 57 | |
| 10.3 | Logging Protocol | 57 | |
| 10.4 | Results of drilling conducted by or on behalf of Klondex | 58 | |
| 11 | Sample Preparation, Analyses and Security | 61 | |
| 11.1 | Sample Collection Methods | 61 | |
| 11.2 | Samples Preparation, Assaying, and Analytical Procedures | 63 | |
| 11.3 | Quality Assurance and Quality Control | 67 | |
| 11.4 | Comments | 85 | |
| 12 | Data Verification | 87 | |
| 12.1 | Database Description | 87 | |
| 12.2 | Data Verification Procedures | 87 | |
| 12.3 | Drill Data File Review | 87 | |
| 12.4 | Channel Data File Review | 88 | |
| 13 | Mineral Processing and Metallurgical Testing | 90 | |
| 13.1 | Preliminary Test work | 90 | |
| 13.2 | Metallurgical Process Evaluation | 93 | |
| 13.3 | Recent Test Work for Processing Ore at the Midas Mill | 95 | |
| 13.4 | Conclusions from Recent Test Work | 96 | |
| 13.5 | Recommendations for Additional Test Work | 96 | |
| 14 | Mineral Resource Estimates | 97 | |
| 14.1 | Introduction | 97 | |
| 14.2 | Database and Compositing | 97 | |
| 14.3 | Geology and Vein Modeling | 101 | |
| 14.4 | Density | 108 | |
| 14.5 | Statistics | 109 | |
| 14.6 | Grade Capping | 114 | |
| 14.7 | Variography | 118 | |
| 14.8 | Block Model | 121 | |
| 14.9 | Grade Estimation | 123 | |
| 14.10 | Mined Depletion and Sterilization | 128 | |
| 14.11 | Model Validation | 130 | |
| 14.12 | Mineral Resource | 142 | |
| 15 | Mineral Reserve Estimates | 144 | |
| 15.1 | Methodology | 144 | |
| 15.2 | Statement of Reserves | 148 | |
| 16 | Mining Methods | 149 | |
| 16.1 | Access Development | 149 | |
| 16.2 | Ground Support | 149 | |
| 16.3 | Ventilation and Secondary Egress | 149 | |
| 16.4 | Mining Methods | 150 | |
| 16.5 | Underground Labor and Equipment | 153 | |
| 16.6 | Mine Plan | 153 | |
| 17 | Recovery | 156 | |
| 17.1 | Aurora Facility | 156 | |
| 17.2 | Midas Mill Facility | 158 | |
| 17.3 | Conclusions and Recommendations | 160 | |
| iv | P a g e |
|
|
Technical Report and Pre - Feasibility Study for the Hollister
Underground Mine | Title May 31, 2017 | Effective Date August 9, 2017 | Report Date |
| 18 | Project Infrastructure | 162 | |
| 18.1 | Road Access | 162 | |
| 18.2 | Power and Electrical Infrastructure | 162 | |
| 18.3 | Water Management and Water Treatment | 162 | |
| 18.4 | Communication Infrastructure | 163 | |
| 18.5 | Site Infrastructure | 163 | |
| 19 | Market Studies and Contracts | 165 | |
| 19.1 | Market Studies | 165 | |
| 19.2 | Contracts | 166 | |
| 20 | Environmental Studies, Permitting and Social or Community Impact | 167 | |
| 20.1 | Water Management | 167 | |
| 20.2 | Environmental Studies, Permitting and Social or Community Impact | 167 | |
| 20.3 | Environmental Compliance and Monitoring | 168 | |
| 20.4 | Other Environmental Issues | 168 | |
| 20.5 | Reclamation Bond Estimate | 168 | |
| 21 | Capital and Operating Costs | 169 | |
| 21.1 | Capital Costs | 169 | |
| 21.2 | Operating Costs and Cutoff Grade | 169 | |
| 22 | Economic Analysis | 170 | |
| 22.1 | Assumptions | 170 | |
| 22.2 | Results | 171 | |
| 22.3 | Sensitivity Analysis | 171 | |
| 22.4 | Potential Improvements to Life of Mine Plan | 173 | |
| 23 | Adjacent Properties | 174 | |
| 23.1 | Silver Cloud Property | 174 | |
| 23.2 | Baxter | 174 | |
| 24 | Other Relevant Data and Information | 175 | |
| 25 | Interpretation and Conclusions | 176 | |
| 26 | Recommendations | 177 | |
| 27 | References | 178 | |
| Appendix A – QAQC Graphs | 181 | ||
| Appendix B – Unpatented Claim List | 191 | ||
| Appendix C – Certification of Authors and Consent Forms | 210 | ||
| v | P a g e |
|
|
Technical Report and Pre - Feasibility Study for the Hollister
Underground Mine | Title May 31, 2017 | Effective Date August 9, 2017 | Report Date |
Table of Figures
| Figure 1-1: | Regional Location Map of the Hollister Property Outline, North Central Nevada | 2 |
| Figure 1-2: | Spider Chart on Key Metrix | 8 |
| Figure 4-1: | Regional Location Map of the Hollister Property Outline, North-Central Nevada | 13 |
| Figure 4-2: | The Hollister Mine Claim Map Underlying Agreements | 15 |
| Figure 5-1: | General View of the Terrain Surrounding the Hollister Mine (Looking East) | 21 |
| Figure 5-2: | Location Map of the Hollister Mine | 22 |
| Figure 5-3: | Road and Feature Map Showing Location of Hollister Mine and Midas Mine | 22 |
| Figure 5-4: | Mine Infrastructure at Hollister Mine Looking East | 24 |
| Figure 6-1: | Hillcrest Mining Company’s Original 45 Unpatented Claims at Hollister | 26 |
| Figure 6-2: | Surface Geochemistry Coverage of the Mine by Sample Type1F | 30 |
| Figure 6-3: | Example of Mine Magnetic Data: PRJ Airborne Magnetics Reduced-to- Pole2F | 31 |
| Figure 6-4: | Underground Workings Completed Plan View | 34 |
| Figure 7-1: | Plan Map of the NNR Province3F | 37 |
| Figure 7-2: | Geology of the Mine Area4F | 38 |
| Figure 7-3: | Geologic Map of the Mine and Near Mine Area. | 39 |
| Figure 7-4: | Geologic Map Units | 40 |
| Figure 7-5: | Mine Area Stratigraphy Variations from West to East (Source: Calloway, 2011a) | 40 |
| Figure 7-6: | Idealized Structural Setting of the Mine Epithermal Vein Systems | 41 |
| Figure 7-7: | Idealized Hollister Alteration / Mineralization Model Cross-Section. | 43 |
| Figure 7-8: | Plan View - Distribution of the Principal Veins in the Mine | 45 |
| Figure 8-1: | Geologic Map, Section and Stratigraphic Column of the Midas Deposit5F | 47 |
| Figure 8-2: | Locations of Carlin Type Gold Deposits in Northern Nevada | 49 |
| Figure 10-1: | Drill Hole Collar Map of Mine Area | 54 |
| Figure 10-2: | Drill Hole Collar Map of Mine - UG Workings & Gloria Vein System Area | 54 |
| Figure 10-3: | Drill Hole Collar & Trace Map of a Portion of Mine - UG Workings & Gloria Vein System | 55 |
| Figure 10-4: | Significant Assay Intervals Encountered Drilling the Gloria Vein System Plan Views & Cross Sections | 56 |
| Figure 11-1: | Analytical Flow Chart for 2013 to 2015 Tertiary Drilling Program | 65 |
| Figure 11-2: | Results from GBG and Carlin 2006-2014 Underground Drilling Blank Samples | 68 |
| Figure 11-3: | Results from Carlin 2015 Surface Drilling Blank Samples | 70 |
| Figure 11-4: | Results from Carlin 2015 Underground Drilling Blank Samples | 70 |
| Figure 11-5: | Results from GBG Underground Channel Sampling Blanks (2011-2013) | 73 |
| Figure 11-6: | Results from Klondex’s Underground Drilling Blanks (2017) for Gold | 75 |
| Figure 11-7: | Results from Klondex’s Underground Drilling Blanks (2017) for Silver | 75 |
| Figure 11-8: | Results from Klondex Underground Drilling (2017) Certified Standards CDN-GS-1M for Gold | 76 |
| Figure 11-9: | Results from Klondex Underground Drilling (2017) Certified Standards CDN-GS-P4E for Gold | 77 |
| Figure 11-10: | Results from Klondex Underground Drilling (2017) Certified Standards CDN-GS-3M for Silver | 77 |
| Figure 11-11: | RMA Regression Analysis of Klondex Underground Drilling (2017) Duplicate Assay for Gold | 78 |
| Figure 11-12: | RMA Regression Analysis of Klondex Underground Drilling (2017) Duplicate Assay for Silver | 79 |
| Figure 11-13: | Underground Drilling (2017) Duplicate Assays for Silver Values less than 100ppm only | 80 |
| Figure 11-14: | Results from Klondex’s UG Channel Sampling Blanks (2016 to 2017) for Gold | 81 |
| Figure 11-15: | Results from Klondex’s UG Channel Samples Blanks (2016 to 2017) for Silver | 82 |
| Figure 11-16: | Results from Klondex UG Channel Samples (2016 to 2017) Standard CDN-GS-P4E for Gold | 83 |
| Figure 11-17: | RMA Regression Analysis of Klondex UG Channel (2017) Duplicate Assay for Gold | 84 |
| Figure 11-18: | RMA Regression Analysis of Klondex UG Channels (2017) Duplicate Assays for Silver | 85 |
| vi | P a g e |
|
|
Technical Report and Pre - Feasibility Study for the Hollister
Underground Mine | Title May 31, 2017 | Effective Date August 9, 2017 | Report Date |
| Figure 14-1: | Drill Hole and Vein Location | 98 |
| Figure 14-2: | Channel Sample Locations Relative to the Mine Workings | 99 |
| Figure 14-3: | Long Section Showing Location of Unconformity Contact Relative to Mine Workings | 101 |
| Figure 14-4: | Unconformity Surface Colored by Elevation in Relation to Modeled Veins | 102 |
| Figure 14-5: | Strain Ellipse and Mapped Lineaments Supporting Structural Framework | 103 |
| Figure 14-6: | Vein Framework and Naming | 104 |
| Figure 14-7: | Vein Modeling Workflow | 105 |
| Figure 14-8: | HW (red) and FW (yellow) Data Points Extracted from Sample and Survey Data Sets | 106 |
| Figure 14-9: | Triangulated HW and FW Surfaces | 107 |
| Figure 14-10: | HW and FW Surfaces are Combined to Generate a Valid Solid Triangulation | 107 |
| Figure 14-11: | Gold (opt) Boxplot for Vein Drill Hole Composites | 112 |
| Figure 14-12: | Gold (opt) Boxplot for Vein Channel Sample Composites | 113 |
| Figure 14-13: | Silver (opt) Boxplot for Vein Drill Hole Composites | 113 |
| Figure 14-14: | Silver (opt) Boxplot for Vein Channel Sample Composites | 114 |
| Figure 14-15: | Ore Shoot Indicator Model on the Clementine Vein (V181A) | 115 |
| Figure 14-16: | V231A Vein Gold Grade Distribution Curve – Channels and Drill Holes | 117 |
| Figure 14-17: | V231A Vein Gold Grade Distribution Curve – Drill Holes Only | 117 |
| Figure 14-18: | V231A Silver Grade Distribution Curve – Channels and Drill Holes | 118 |
| Figure 14-19: | V231A Vein Silver Grade Distribution Curve – Drill Holes Only | 118 |
| Figure 14-20: | Clementine Vein Major Experimental Variogram and Modeled Variogram for Gold Grade | 119 |
| Figure 14-21: | Gwenivere Major Experimental Variogram and Modeled Variograms for Gold Grade | 120 |
| Figure 14-22: | V231A Major Experimental Variogram and Modeled Variograms for Gold Grade | 121 |
| Figure 14-23: | Mineability Code Overview | 125 |
| Figure 14-24: | Mineability Index Legend for Gold and Silver Grade | 126 |
| Figure 14-25: | Vein V203A Assigned Mineability Index | 126 |
| Figure 14-26: | Vein V02A Assigned Mineability Index | 127 |
| Figure 14-27: | Vein V232B Assigned Mineability Index | 127 |
| Figure 14-28: | Clementine Vein (V181A) Mining Extent | 128 |
| Figure 14-29: | V231A Vein (Gloria Vein Set) Mining Extent | 129 |
| Figure 14-30: | V232B Vein (Gloria Vein Set) Mining Extent | 129 |
| Figure 14-31: | Legend Gold (opt) and Silver (opt) Gold Respectively | 131 |
| Figure 14-32: | Clementine Vein Comparison of Composite and Estimate Block Gold Grades | 132 |
| Figure 14-33: | Clementine Vein Comparison of Composite and Estimate Block Silver Grades | 132 |
| Figure 14-34: | Vein V232B Comparison of Composite and Estimate Block Gold Grades | 133 |
| Figure 14-35: | Vein V232B Comparison of Composite and Estimated Block Silver Grades | 133 |
| Figure 14-36: | Vein V231A Comparison of Composite and Estimate Block Gold Grades | 134 |
| Figure 14-37: | Vein V231A Comparison of Composite and Estimated Block Silver Grades | 134 |
| Figure 14-38: | Gold Swath Plot of Clementine Vein Along the East Axis | 135 |
| Figure 14-39: | Gold Swath Plot of the Clementine Vein Along the Z Axis | 135 |
| Figure 14-40: | Silver Swath Plot of the Clementine Vein Along the East Axis | 136 |
| Figure 14-41: | Silver Swath Plot of the Clementine Vein Along the Z Axis | 136 |
| Figure 14-42: | Gold Swath Plot of the V232B Vein Along the East Axis | 137 |
| Figure 14-43: | Gold Swath Plot of the V232B Vein Along the Z Axis | 137 |
| Figure 14-44: | Silver Swath Plot of the V232B Vein Along the East Axis | 138 |
| Figure 14-45: | Silver Swath Plot of the V232B Vein Along the Z Axis | 138 |
| Figure 14-46: | Gold Swath Plot of the V231A Vein Along the East Axis | 139 |
| Figure 14-47: | Gold Swath Plot of the V231A Vein Along the Z Axis | 139 |
| vii | P a g e |
|
|
Technical Report and Pre - Feasibility Study for the Hollister
Underground Mine | Title May 31, 2017 | Effective Date August 9, 2017 | Report Date |
| Figure 14-48: | Silver Swath Plot of the V231A Vein Along the East Axis | 140 |
| Figure 14-49: | Silver Swath Plot of the V231A Vein Along the Z Axis | 140 |
| Figure 14-50: | Smoothing Checks for the Clementine Vein | 141 |
| Figure 14-51: | Smoothing Checks for the V231A Vein | 142 |
| Figure 15-1: | Gloria Final Reserves Plan by Year Mined | 145 |
| Figure 15-2: | 4930 Level Final Reserves Plan by Year Mined | 145 |
| Figure 15-3: | 5050 Level Final Reserves Plan by Year Mined | 146 |
| Figure 15-4: | 5190 Level Final Reserves Plan by Year Mined | 146 |
| Figure 15-5: | 5278 Level Final Reserves Plan by Year Mined | 147 |
| Figure 15-6: | 5460 Level Final Reserves Plan by Year Mined | 147 |
| Figure 16-1: | Existing Development and Vein Traces at the 5050 Level of the Gloria Zone | 149 |
| Figure 16-2: | Hollister Primary Airflow | 150 |
| Figure 16-3: | Long Section looking North of West end of Gloria Longhole Stoping Arrangement | 151 |
| Figure 16-4: | Section View of Previously Developed Timbered Raise on V08 | 152 |
| Figure 17-1: | Current Aurora Plant Flowsheet | 158 |
| Figure 17-2: | Midas Mil Flow Sheet before CIL retrofit | 159 |
| Figure 17-3: | Midas Mill Flow Sheet with CIL Retrofit Installed | 160 |
| Figure 18-1: | Site Plan View | 163 |
| Figure 19-1: | Historical Spot Gold Price: 90- and 180-day Trailing Averages | 165 |
| Figure 19-2: | Historical Spot Silver Prices; 90- and 180-days Trailing Averages | 165 |
| Figure 19-3: | Gold Index vs DJI vs EURO/USD Conversion Rate | 166 |
| viii | P a g e |
|
|
Technical Report and Pre - Feasibility Study for the Hollister
Underground Mine | Title May 31, 2017 | Effective Date August 9, 2017 | Report Date |
Table of Tables
| Table 1-1: | Historic Gold Production | 4 |
| Table 1-2: | Hollister Mineral Resource Estimate | 4 |
| Table 1-3: | Underground Mineral Reserves as of May 31, 2017 | 6 |
| Table 1-4: | Summary of Economic Results | 7 |
| Table 1-5: | Sensitivities | 7 |
| Table 2-1: | Technical Report Qualified Persons | 9 |
| Table 2-2: | Units of Measure | 11 |
| Table 4-1: | A Summary of the Hollister Mine Claims Controlled by Klondex. | 13 |
| Table 4-2: | A Summary of the Royalties and Payments Due in Respect of the Hollister Mine Claims | 18 |
| Table 6-1: | Trial Mining Production by GBG | 33 |
| Table 6-2: | Trial Mining Production by Carlin | 33 |
| Table 10-1: | Drilling Summary by Company | 53 |
| Table 10-2: | Drilling Highlights (2016 and 2017) | 58 |
| Table 11-1 : | Summary of Klondex Drilling Assay Methods | 66 |
| Table 11-2: | Summary of Underground Drilling QAQC from 2006 through 2014 | 67 |
| Table 11-3: | Standards for GBG and Carlin 2006-2014 Underground Drilling | 69 |
| Table 11-4: | Summary of Carlin Surface Drilling QAQC from 2015 | 69 |
| Table 11-5: | Summary of Carlin Underground Drilling QAQC from 2015 | 69 |
| Table 11-6: | Standards for Carlin 2015 Surface Drilling | 71 |
| Table 11-7: | Standards for Carlin 2015 Surface Drilling | 71 |
| Table 11-8: | Summary of GBG Channel Sampling QAQC from 2011 to 2013 | 71 |
| Table 11-9: | Gold and Silver Blanks for GBG Channel Samples from 2011 to 2013 | 72 |
| Table 11-10: | Certified Standards for GBG Channel Samples Taken from 2011 to 2013 | 73 |
| Table 11-11: | Internal Standards for GBG Channel Samples Taken from 2011 to 2013 | 73 |
| Table 11-12: | Summary of Klondex Underground Drilling QAQC from 2016 to 2017 | 74 |
| Table 11-13: | Gold and Silver Blanks Klondex Underground Drilling Samples Taken from 2016 to 2017 | 74 |
| Table 11-14: | Certified Gold Standards for Klondex Underground Drilling 2017 | 76 |
| Table 11-15: | Summary of Gold Duplicate Results from Klondex Underground Drilling (2017) | 78 |
| Table 11-16: | Summary of Silver Duplicate Results from Klondex Underground Drilling (2017) | 79 |
| Table 11-17: | Summary of Silver Duplicate Results less than 100ppm from Klondex Underground Drilling (2017) | 79 |
| Table 11-18: | Summary of Klondex Underground Channel Sample QAQC from 2016 to 2017 | 80 |
| Table 11-19: | Gold and Silver Blanks Klondex Underground Channel Samples Taken from 2016 to 2017 | 81 |
| Table 11-20: | Certified Gold Standards for Klondex UG Channel Samples from 2016 to 2017 | 82 |
| Table 11-21: | Summary of Gold Duplicate Results from Klondex UG Channels (2017) | 83 |
| Table 11-22: | Summary of Silver Duplicate Results from Klondex Underground Channel (2017) | 84 |
| Table 12-1: | Drill Holes Reviewed | 87 |
| Table 12-2: | Channel Sample Files Reviewed | 88 |
| Table 13-1: | Summary of Head Grade Analyses | 91 |
| Table 13-2: | Summary of Gravity Concentration Tests (1.0 kilogram samples) | 91 |
| Table 13-3: | Summary of Cyanide Leach Tests (0.5 kilogram samples, four day leach period) | 91 |
| Table 13-4: | Summary of the Average Head Grades of the Four Composite Drill Core Samples | 93 |
| Table 13-5: | Summary of Test Work Results | 93 |
| Table 13-6: | Summary of the Bulk Samples and Processing Results for Material | 94 |
| Table 13-7: | Summary of Bottle Roll Tests 80%-75μm Feed Size 6F | 95 |
| ix | P a g e |
|
|
Technical Report and Pre - Feasibility Study for the Hollister
Underground Mine | Title May 31, 2017 | Effective Date August 9, 2017 | Report Date |
| Table 14-1: | Summary of Drill Hole and Channel Samples | 98 |
| Table 14-2: | Lithology Codes | 99 |
| Table 14-3: | Vein Orientation and Clipping Priorities | 108 |
| Table 14-4: | Density Results for Whole Rock Samples from Mine | 109 |
| Table 14-5: | Vein Gold (opt) Drill Hole Composite Statistics | 109 |
| Table 14-6: | Vein Gold (opt) Channel Composite Statistics | 110 |
| Table 14-7: | Vein Silver (opt) Drill Hole Composite Statistics | 111 |
| Table 14-8: | Vein Silver (opt) Channel Composite Statistics | 111 |
| Table 14-9: | Capping Methods | 115 |
| Table 14-10: | Grade Capping Values for Ore Shoots | 116 |
| Table 14-11: | Geometry of Block Models | 121 |
| Table 14-12: | Block Model Variables | 122 |
| Table 14-13: | Estimation Search Parameters by Resource Category | 124 |
| Table 14-14: | Estimate Comparison for Gold Versus a Nearest Neighbor at Zero opt Cutoff | 130 |
| Table 14-15: | Estimate Comparison for Silver Versus a Nearest Neighbor at Zero opt Cutoff | 130 |
| Table 14-16: | Mineral Resource | 142 |
| Table 15-1: | Mineral Reserves Cut Off Grade Calculation | 144 |
| Table 15-2: | Mineral Reserves as of May 31, 2017 | 148 |
| Table 16-1: | Hollister Active Main and Booster Fans | 150 |
| Table 16-2: | Underground Labor | 153 |
| Table 16-3: | Underground Equipment | 153 |
| Table 16-4: | Productivity Rates | 153 |
| Table 16-5: | Annual Production and Development Plan | 154 |
| Table 17-1: | Mill Operation Data from 2009 thru 2011 | 158 |
| Table 19-1: | Metal Price Assumptions for the Economic Evaluation | 166 |
| Table 20-1: | Current Operational Permits for Mine | 167 |
| Table 21-1: | Capital and Pre-Production Costs | 169 |
| Table 21-2: | Underground Development Unit Costs | 169 |
| Table 21-3: | Operating Costs | 169 |
| Table 22-1: | Key Financial Modeling Assumptions | 170 |
| Table 22-2: | Gloria and Main Deposits Economic Modeling Results | 171 |
| Table 22-3: | Economic Analysis | 172 |
| Table 22-4: | Sensitivities | 172 |
| Table 25-1: | Significant Risks Identified by the Authors | 176 |
| x | P a g e |
|
|
Technical Report and Pre - Feasibility Study for the Hollister
Underground Mine | Title May 31, 2017 | Effective Date August 9, 2017 | Report Date |
| Abbreviations and Acronyms | GEO – Gold Equivalent Ounce | |
| gpm – Gallons per Minute | ||
| GBG – Great Basin Gold Limited | ||
| Below is an alphabetical list of acronyms of bodies | ||
| and terms that appear in this document, unless | H | |
| individually noted elsewhere: | HDB – Hollister Development Block | |
| Hecla – Hecla Mining Company | ||
| Unless inconsistent with the context, an expression | Hillcrest – Hillcrest Mining Company | |
| that denotes any gender includes the other gender | Hi-Tech – Hi-Tech Exploration Ltd. | |
| and the singular includes the plural. | HP – Historic Properties | |
| A | I | |
| AAG – Aagrad Group | ID3 – Inverse Distance cubed | |
| AAL – American Assay Laboratories | ||
| ACHP – Advisory Council on Historic Properties | J | |
| Ag – Sliver | JBR – JBR Environmental Consulting, Inc. | |
| ALS – ALS Chemex Laboratories, Reno unless | Jerritt Lab – Jerritt Canyon Gold LLC. | |
| otherwise specified | JV – Joint Venture | |
| AMT – American Mining & Tunneling LLC. | ||
| Au – Gold | K | |
| AuEq – Equivalent Gold Ounces | KCA – Kappes Cassidy & Associates | |
| Auric – Auric Metals Company | kg – kilogram | |
| Klondex – Klondex Mines Ltd. | ||
| B | ||
| Barrick – Barrick Gold Corporation | L | |
| BLM – Bureau of Land Management | LHD – Load, Haul, Dump | |
| LOM – Life of Mine | ||
| C | ||
| Carlin – Carlin Resources, LLC. | M | |
| CCD – Countercurrent Decantation | MCI – McClelland Laboratories Inc. | |
| CIL – Carbon in Leach | Midas Lab – Midas Laboratory, owned and | |
| CIM – Canadian Institute of Mining, Metallurgy and | operated by Klondex | |
| Petroleum | Mine – Hollister Underground Mine | |
| CIP – Carbon in Pulp | Mn – Manganese | |
| Cornucopia – Cornucopia Resources Ltd. | ||
| CRF – Cement Rock Fill | N | |
| CSAMT – Controlled Source Audio Magnetotelluric | NDEP – Nevada Division of Environmental | |
| CTGD – Carlin-type Gold Deposit | Protection | |
| Newmont – Newmont Mining Company | ||
| D | NI 43-101 – National Instrument 43-101 | |
| Diff. - Difference | NN – Nearest Neighbor | |
| NNR – Northern Nevada Rift | ||
| E | NPV – net present value | |
| EIS – Environmental Impact Statement | NSR – Net Smelter Royalty | |
| Eq – Equivalent | ||
| O | ||
| F | Oz – Ounce/s | |
| Fe – Iron | Opt – ounces per ton | |
| Finley – Finley River Co., LLC. | ||
| Franco Nevada – Franco Nevada US Corporation | P | |
| PA – Programmatic Agreement | ||
| G | Pinnacle – Pinnacle Analytical Laboratory | |
| g – grams | PM – Practical Mining LLC. | |
| g/t – grams per ton | ppm – Parts per million | |
| Galactic – Galatic Resources | psi – Pounds per Square Inch |
| xi | P a g e |
|
|
Technical Report and Pre - Feasibility Study for the Hollister
Underground Mine | Title May 31, 2017 | Effective Date August 9, 2017 | Report Date |
| Pty – Geologix Mineral Resource Consultants, Ltd. | |
| Q | |
| QA – Quality Assurance | |
| QAQC – Quality Assurance and Quality Control | |
| QP – Qualified Person | |
| R | |
| RCE – Reclamation Cost Estimate | |
| RCGI – Rodeo Creek Gold Inc. | |
| RIB – Rapid Infiltration Basin | |
| S | |
| Sanburnite – Sanburnite Corp. | |
| Std. – Standard | |
| SOP – Standard Operating Procedure | |
| T | |
| t – ton/s | |
| tpd – tons per day | |
| tpm – toms per month | |
| TR – Technical Report | |
| U | |
| Ucs – Unconfined Compressive Strength | |
| UG – Underground | |
| US – United States | |
| US Steel – United States Steel Corporation |
| xii | P a g e |
|
|
Technical Report and Pre - Feasibility Study for the Hollister
Underground Mine | Title May 31, 2017 | Effective Date August 9, 2017 | Report Date |
| 1 |
Summary |
The purpose of this Technical Report (TR) on the Hollister Underground Mine (Mine) is to support the Mineral Resources and Mineral Reserves estimates disclosed by Klondex Mines Ltd. (Klondex) in its news releases of June 21, 2017 and July 13, 2017. This Technical Report was prepared by Klondex Mines Ltd. in accordance with the requirements of National Instrument 43-101 (NI 43-101). Reserves have been prepared in accordance with both NI 43-101 and the US Security and Exchange Commission’s (SEC) Industry Guide 7. This TR, dated August 9, 2017, with an effective date of May 31, 2017, updates the previous mineral resource and mineral reserve estimates effective January 1, 2011 (Oelofse et al. 2011) and focuses solely on underground mining.
Underground Resources and Reserves specified in this TR are exclusive of open pit resources defined in the 2016 Carlin Resources TR. The lineage of technical reports on the Hollister property as is continued in this TR includes:
| 1. |
2007 NI 43-101 Technical Report: Wober, G., and Stone, D., 2007, Technical Report – Update on the Exploration Activities on the Hollister Gold Project, 125 p. | |
| 2. |
2008 NI 43-101 Technical Report: Oelofse, J.G., and, Van Heerden, D.J., 2008, Technical Report on the Resource Update for the Hollister Development Block Gold Project, 180 p. | |
| 3. |
2009 NI 43-101 Technical Report: Godden, S. J., Oelofse, J. G., and Bentley, P. N., 2009, Technical Report on the June 2009 Update of the Mineral Resource Estimate for Hollister Gold Mine, 256 p. | |
| 4. |
2011 NI 43-101 Technical Report: Oelofse, J.G., Bentley, P.N., Van Heerden, D.J., 2011, Technical Report on the update of the mineral resource and mineral reserve estimates for the Hollister gold mine, Elko County, Nevada, USA, 371 p. | |
| 5. |
2016 NI 43-101 Technical Report: Nowak, M. and Yuhasz, C., 2016, Independent Technical Report for the Hollister Gold Project, Nevada, USA: 43-101 technical report on behalf of Carlin Resources, LLC, 176 p. |
| 1.1 |
Property Description |
The Mine is located in the Ivanhoe Mining District in western Elko County, Nevada, at latitude 41°06’ North, longitude 116°31’ West. The Mine consists of 1,016 unpatented mining claims in Townships 37 and 38 North, Range 48 East. The Mine is located approximately 61.5 miles east-northeast of the town of Winnemucca (Figure 4-1), 14 miles southeast of the town of Midas, 50 miles northwest of the city of Elko, and 200 miles northeast of the city of Reno, Nevada.
| 1 | P a g e |
|
|
Technical Report and Pre - Feasibility Study for the Hollister
Underground Mine | Title May 31, 2017 | Effective Date August 9, 2017 | Report Date |
![]()
Figure 1-1: Regional Location Map of the Hollister Property Outline,North Central Nevada
The Mine consists of 1,005 unpatented lode claims and 11 unpatented mill site claims which cover an area in excess of 17,960 acres.
| 1.2 |
Geology |
The Mine is located along the Northern Nevada Rift (NNR). The Northern Nevada Rift is a major, north-northwest to south-southeast trending structural feature that extends for at least 298 miles, from south-central Nevada to the Oregon-Nevada border. This is on trend with the north-western end of the Carlin Trend, which is approximately five miles wide and approximately 40 miles long.
The gold mineralization found at the Mine has been dated to15.23 +/- 0.05 Ma, based on 40/39 argon adularia ages, related to the Miocene period of magmatic activity associated with the Northern Nevada Rift (Leavitt et al., 2000).
Tertiary volcanic rocks cover most of the Mine area. Ordovician Vinini Formation rocks are exposed in the eastern part of the historic mine area and in the open pits. All older rocks may be overlain by Pliocene and younger alluvium and colluvium.
Ordovician siliclastic rocks of the Vinini Formation host the epithermal gold veins found at the Mine. Tertiary volcanic rocks unconformably overlie the Vinini Formation. The Tertiary sequence hosted the disseminated gold deposit extracted by historic open pit workings (1990-1992).
A group of near-vertical faults and fissures that trend west-northwest to east-west host the epithermal gold veins found at the Mine. The amount of displacement across these faults is small, and their strike continuity varies between one hundred to several thousand feet.
The primary lithologies have locally been strongly affected by hydrothermal hot spring fluids generated by the Miocene volcanic activity. A series of resistant chalcedonic ledges cover large areas of the Mine with chalcedonic replacement and opaline sinter bodies occupying at least three stratigraphic positions.
In the district, exploration and mining were focused on three types of mineralization:
| 2 | P a g e |
|
|
Technical Report and Pre - Feasibility Study for the Hollister
Underground Mine | Title May 31, 2017 | Effective Date August 9, 2017 | Report Date |
| • | Mercury in laterally extensive near-surface replacement silica zones and more localized sinter deposits, principally in the middle tuff unit; | |
| • | Disseminated gold in the middle and lower tuff units, andesite, and the Ordovician, Vinini Formation beneath the hot spring mercury deposits; and | |
| • | Deeper high-grade gold-silver quartz-adularia veins and fracture zones in the Vinini Formation. |
Veins at Hollister Mine contain the bulk of the high-grade (greater than 0.29 2 ounces per ton [opt] gold [Au]) mineralization known within the property. The principal veins, Clementine and Gwenivere, comprise semi-continuous vein systems with internal ore shoots, and local echelon steps or splays. The veins in mineralized areas typically range from 0.5 to 2.0 feet in width, but locally can be more than five feet in width. The veins are almost entirely hosted below the Tertiary-Ordovician contact. Veins trend west-northwest with steep dips, and define a vein system with a strike length of more than 2,000 feet.
Most of the high grade vein intercepts are characterized by banded textures produced by alternating silica and clay minerals, by alternating gray and black bands related to varying sulfide or selenide content, by varying silica grain sizes and textures, or by various combinations of the above. Visible electrum, where present, is concentrated in specific bands. Major banded veins also commonly include silicified fault gouge and breccia, suspended wall rock inclusions and medial zones of bladed quartz after calcite.
Vein style is typical of low sulfidation epithermal veins, and is closely comparable in mineralogy and texture to vein systems developed at the Midas deposit to the north, as well as other Miocene aged epithermal vein system in the NNR.
| 1.3 |
History |
The Mine is located within the Ivanhoe Mining District. A large area of mid-Miocene epithermal hot springs deposits with associated mercury mineralization was prospected in the early 1900s. For approximately 8,000 years prior, the district was an important source of opalite silica (obsidian) which Native Americans quarried for tools and weapons in the Tosawihi Quarry. A summary of historic activities follows:
| • | Western Shoshone quarried sinter deposits for tools as early as 8,000 years ago; | |
| • | Mercury discovered in 1915 in what is now known as the Ivanhoe Mining District. Mined as late as 1973; | |
| • | The district explored for gold, mercury, uranium, and molybdenum by Noranda Mining Company, Homestake Mining Company, Placer Dome Inc., Bear Creek Mining Corporation, and United States Steel Corporation (US Steel); | |
| • | US Steel delineated 11M tons @ 0.048 Au ounces per ton ([opt] 1.65 g/t) by end of 1986; | |
| • | In 1987, Galactic Resources Inc. (Galactic) acquired the asset (Ivanhoe Project) and began open pit mining (1990-1992), which produced 115,696 oz Au from 3.27 million tons of heap leachable ore; | |
| • | In 1992, Newmont Mining Company (Newmont) acquired 75% of the Ivanhoe Project, to operate the open pit mine and continue a drill program in the district; | |
| • | In 1999, Great Basin Gold Limited (GBG) acquired Newmont’s 75% and Galactic’s 25% interest; | |
| • | GBG shifted focus from bulk mineable targets to high-grade vein targets; |
| 3 | P a g e |
|
|
Technical Report and Pre - Feasibility Study for the Hollister
Underground Mine | Title May 31, 2017 | Effective Date August 9, 2017 | Report Date |
| • | Underground development commenced in late 2004 to evaluate the Clementine and Gwenivere vein systems; | |
| • | During 2005, Hecla Mining Company (Hecla) entered into a joint venture (JV) with GBG to develop an underground mineable orebody. GBG purchased the Hecla interests in 2007; | |
| • | GBG continued to develop the mine until Carlin Resources, LLC. (Carlin) acquired the Hollister property out of bankruptcy in May 2013; and | |
| • | Klondex acquired the Hollister property in October 20016 and has been drilling and developing the Gloria vein system resource, as well as looking at remnant mining opportunities adjacent to the current underground workings. |
Table 1-1: Historic Gold Production
|
Period |
Operator | Method | AuEq oz | tons |
| 1990 to 1992 | Galactic Resources Inc. | Open Pit | 115,696 | 3,271,954 |
| 2009 | Great Basin Gold Limited | Underground | 175,050 | 123,901 |
| 2010 | Great Basin Gold Limited | Underground | 81,123 | 97,141 |
| 2011 | Great Basin Gold Limited | Underground | 79,042 | 103,697 |
| 2012 | Great Basin Gold Limited | Underground | 57,576 | 98,034 |
| January 2013 through May 2013 | Great Basin Gold Limited | Underground | 14,755 | 34,505 |
| May 2013 through November 2013 | Carlin Resources, LLC. | Underground | 17,736 | 34,976 |
| 2014 | Carlin Resources, LLC. | Underground | 2,346 | * |
| Total | 543,324 |
* Gold sold in 2014 was from stockpile remaining after mining seased
| 1.4 |
Underground Mineral Resource Estimate |
This TR updates the underground Mine mineral resource estimate and mineral reserves estimate. The TR incorporates the technical information available through May 31, 2017, which is the effective date of the TR.
The Hollister Mine mineral resource was estimated in accordance with The Canadian Institute of Mining, Metallurgy and Petroleum’s (CIM) Definitions Standards for Mineral Resources and Mineral Reserves, adopted by CIM Council on May 10, 2014 (CIM 2014). This estimate is only inclusive of the resources hosted by the Ordovician rocks in the historical Hollister Mine area and of the Gloria vein sets. This estimate and depletion is effective May 31, 2017.
Table 1-2: Hollister Mineral Resource Estimate
| Category | Tons (k) |
Au (opt) |
Au (g/t) |
Ag (opt) |
Ag (g/t) |
AuEq (opt) |
AuEq (g/t) |
Au (koz) |
Ag (koz) |
AuEq (koz) |
| Measured | 114.3 | 0.537 | 18.4 | 3.05 | 104.7 | 0.565 | 19.4 | 61.4 | 349.0 | 64.6 |
| Indicated | 314.3 | 0.465 | 15.9 | 2.35 | 80.5 | 0.487 | 16.7 | 146.1 | 737.9 | 152.9 |
| Total M&I | 428.6 | 0.484 | 16.6 | 2.54 | 86.9 | 0.507 | 17.4 | 207.5 | 1,086.9 | 217.5 |
| Inferred | 176.0 | 0.420 | 14.4 | 2.71 | 92.9 | 0.445 | 15.3 | 73.9 | 476.9 | 78.3 |
Notes:
| 1. |
Mineral resources are calculated at a gold price of US$1,400 per ounce and a silver price of US$19.83 per ounce. |
| 4 | P a g e |
|
|
Technical Report and Pre - Feasibility Study for the Hollister
Underground Mine | Title May 31, 2017 | Effective Date August 9, 2017 | Report Date |
| 2. |
Metallurgical recoveries for gold and silver are 92% and 60%, respectively. | |
|
| ||
| 3. |
One ounce of gold is equivalent to 108.24 ounces of silver. | |
|
| ||
| 4. |
Mineral Resources include resource dilution to a minimum mining width of four feet or the vein width plus two feet, whichever is greater. | |
|
|
||
| 5. |
Cut off grades for the Mineral Resources are 0.227 opt AuEq. | |
|
| ||
| 6. |
The effective date for the Mineral Resource is May 31, 2017. | |
|
| ||
| 7. |
Mineral Resources which are not Mineral Reserves have not yet demonstrated economic viability. The estimate of mineral resources may be materially affected by environmental, permitting, legal, title, taxation, sociopolitical, marketing, or other relevant issues. |
This analysis included 2,863 surface and underground drill holes and 9,346 channel sample sets. The composites of all flagged assays were used for statistical analysis and estimation. No channels were eliminated for any reason.
The vein solid models were interpreted from core photo rev view, assay data, underground mapping, and lithology logging of drilling and channel samples. No strict grade cutoff was honored, but care was taken to ensure that only vein material was modeled regardless of the grade.
Unlike nearby epithermal vein deposits such as Midas Mine and Fire Creek Mine, that are hosted in Tertiary volcanic sequences, the Hollister Mine epithermal veins are hosted by the older Ordovician quartzite and argillite sequences. There is an unconformable contact between the two sequences of rocks, and the mineralized epithermal system cuts both units. The style of mineralization however does change across this contact.
The Hollister Mine underground resource is calculated only for mineralization below the unconformity in epithermal veins hosted by the Ordovician sequences. Previous operators mined some resources above the unconformity.
Thirty-two veins were modeled, generally trending westerly. Vein mineralization is characterized by a sharp natural contact (grade break) between the veins and the surrounding host rock. The vein system was formed at shallow depths below an active hot spring system. Conditions of the epithermal system varied temporally and spatially, resulting in an episodic nature of mineralization.
Grade capping of gold and silver was determined individually for all veins using grade distribution curves and spatial configuration of high grades within the vein. The effectiveness of grade capping is measured through the monthly reconciliation program.
Individual block models were constructed for each vein. A five-foot by five-foot parent block size was used on the vein along strike and down dip, with sub-blocking across the vein so the block size would match the vein thickness.
Gold and silver values were estimated using the ID3 method. The ID3 method was applied in multiple passes defining the extents of the measured, indicated, and inferred classifications. The channel composites were only used for the measured pass, which has a search ellipsoid of 40 feet by 40 feet by 20 feet. The vein block models were depleted by creating simplified as-built surveys of the existing underground workings. Blocks within the survey were flagged as “mined”.
As part of the model validation, the mean gold grades for each vein were compared against a nearest neighbor. On a local scale, model validation was confirmed by the visual comparison of block grades to composite grades. Model validations indicate good agreement of block grade estimates with composite grades.
| 5 | P a g e |
|
|
Technical Report and Pre - Feasibility Study for the Hollister
Underground Mine | Title May 31, 2017 | Effective Date August 9, 2017 | Report Date |
| 1.5 |
Underground Mineral Reserve Estimate |
Hollister underground and stockpile Mineral Reserves have been prepared in accordance with both NI 43-101 and the US Security and Exchange Commission’s (SEC) Industry Guide 7 and are summarized in Table 1-3.
Table 1-3: Underground Mineral Reserves as of May 31, 2017
| Category | Tons (000’s) |
Au (opt) |
Ag (opt) |
AuEq (opt) |
Au Ounces (000’s) |
Ag Ounces (000’s) |
AuEq Ounces (000’s) |
| Proven Reserves | 50.8 | 0.553 | 2.905 | 0.580 | 28.1 | 147.5 | 29.5 |
| Probable Reserves | 148.8 | 0.552 | 3.201 | 0.582 | 82.2 | 476.2 | 86.6 |
| Proven and Probable Reserves | 199.5 | 0.553 | 3.125 | 0.582 | 110.3 | 623.7 | 116.1 |
| 1. |
Mineral Reserves have been estimated with a gold price of $1,200/ounce and a silver price of $17.14/ounce; | |
| 2. |
Metallurgical recoveries for gold and silver are 92% and 60% respectively; | |
| 3. |
Gold equivalent ounces are calculated on the basis of one ounce of gold being equivalent to 108.24 ounces of silver, and; | |
| 4. |
Mineral Reserves are estimated at a cutoff grade of 0.310 AuEq opt and an incremental cutoff of 0.052 AuEq opt. | |
| 5. |
Mine losses of 5% and unplanned mining dilution of 10% have been applied to the designed mine excavations. |
The following three mining methods were evaluated:
| • | Cut-and-fill Mining: Minimum geometries of 3.5 feet wide and six feet high drifts along strike of the vein are used, with level accesses designed in waste to the bottom of the multi-compartment timbered raise; | |
| • | End Slice Stoping (long hole stoping): Level developments are planned at a minimum five feet wide by 10 feet high and long hole stopes between the levels are designed to be the greater of vein width plus one foot of dilution on the hanging wall and one foot of dilution on the footwall, or a minimum of four feet wide. Height of the long hole stope is determined by distance between sublevels, but does not exceed 30 feet from the back of the bottom cut and the sill of the top cut; and | |
| • | Shrinkage Stoping: Accessed initially by a conventional timbered raise with the same drift dimensions as the cut-and-fill. The shrinkage stope requires more waste development, however, due to the need for multiple draw-points on the bottom level. |
For each mining zone, reserves were estimated using the most applicable mining method, with underground designs trimmed to the May 31, 2017 surveyed as-builts. Mining losses of 5% and unplanned dilution of 10%, in addition to the planned internal dilution, were applied to all mining methods.
| 1.6 |
Cash Flow Analysis and Economics |
The first phase of production from the Hollister mine is economically viable with an after-tax internal rate of return and Net Present Value (NPV7%, US$1,200 Au) of 110% and US$657,000 respectively. Assumptions used in the cash flow model include the following:
| • | US$1,200/oz Au, US$17/oz Ag; | |
| • | Recoveries of 92% Au and 60% Ag; |
| 6 | P a g e |
|
|
Technical Report and Pre - Feasibility Study for the Hollister
Underground Mine | Title May 31, 2017 | Effective Date August 9, 2017 | Report Date |
| • | Discount rate of 7%; | |
| • | No closure costs are included because the evaluation represents a portion of the deposit to be mined from the claims acquired; | |
| • | No cost inflation was applied; | |
| • | No salvage was assumed at the end of mine life; | |
| • | All 2016 sunk costs were excluded (i.e. rehabilitation and access costs); | |
| • | Royalty payment of 5%; and | |
| • | Effective Tax rate of 25% is function of Nevada net proceeds tax of 5%, depletion adjustment of 15% and federal tax rate of 35%. |
Table 1-4: Summary of Economic Results
| Discount rate | % | 7% |
| NPV | $k | $8,781 |
| IRR | % | 110% |
| Discounted Payback | Years | 1.5 |
| Cash cost | $/oz | $746 |
| AISC | $/oz | $1,086 |
A sensitivity analysis was performed on the Mine value drivers and found to be most sensitive to gold price, direct mining costs, and average grade. Table 1-5 and Figure 1-2 show the sensitivities of the various metrics to the Net Present Value (NPV).
Table 1-5: Sensitivities
| -30% | -20% | -10% | 0% | 10% | 20% | 30% | |
| Gold price | (25,994) | (17,242) | (8,620) | - | 8,617 | 17,114 | 24,835 |
| Underground Mining costs | 7,236 | 4,824 | 2,412 | - | (2,412) | (4,824) | (7,236) |
| Sustaining capital | 3,622 | 2,415 | 1,207 | - | (1,208) | (2,415) | (3,622) |
| Average gold grade | (26,142) | (17,336) | (8,667) | - | 8,666 | 17,251 | 25,043 |
| 7 | P a g e |
|
|
Technical Report and Pre - Feasibility Study for the Hollister
Underground Mine | Title May 31, 2017 | Effective Date August 9, 2017 | Report Date |
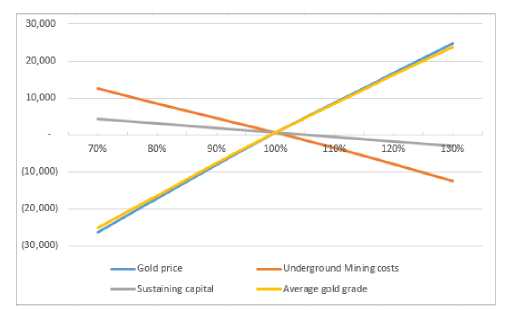
Figure 1-2: Spider Chart on Key Metrix
| 1.7 |
Conclusions |
The following conclusions from this study can be drawn:
| • |
The reserves at the Mine have been estimated with CIM definitions as of May 10, 2014; | |
| • |
The Mine plan reported herein is an indication of Klondex’ efforts to extract the ore from underground and a reflection of the global reserves of the listed deposits at the current level of knowledge of the deposit and sampling; and | |
| • |
Additional drilling to the west of Gloria deposit has the potential of impacting the identified mineral resource and impacting the mine plan. |
| 8 | P a g e |
|
|
Technical Report and Pre - Feasibility Study for the Hollister
Underground Mine | Title May 31, 2017 | Effective Date August 9, 2017 | Report Date |
| 2 |
Introduction |
| 2.1 |
Terms of Reference and Purpose of this Technical Report |
This TR provides a statement of Mineral Resources and Mineral Reserves for the Mine as of May 31, 2017. This evaluation includes measured, indicated, and inferred mineral resources, as well as proven and probable mineral reserves. This TR was prepared in accordance with the requirements of NI 43-101 and Form 43-101F1 (43-101F1) for technical reports.
Mineral resource and mineral reserve definitions are set forth in this TR in accordance with the companion policy to NI 43-101 of the Canadian Securities Administrators and Canadian Institute of Mining, Metallurgy and Petroleum(CIM) – Definition Standards for Mineral Resources and Mineral Reserves adopted by CIM Council on May 10, 2014.
This TR documents the status of the Mine and related infrastructure based on drilling and sampling completed by Klondex and by previous operators.
| 2.2 |
Qualification of the Authors |
The individuals who have provided input to the current TR are cited as ‘authors’ and are listed below. These authors have extensive experience in the mining industry and are members in good standing of appropriate professional institutions.
This TR was prepared by Qualified Persons (QP) employed by Klondex. The following Table presents each of the Qualified Persons and their responsibilities for this TR.
Table 2-1: Technical Report Qualified Persons
|
Technical Report Section |
Qualified Person | |
| 1 | Summary | All QPs |
| 2 | Introduction | |
| 3 | Reliance on Other Experts | |
| 4 | Property Description and Location | Robert Thomason
|
| 5 | Accessibility, Climate, Local Resources, Infrastructure and Physiography | |
| 6 | History | |
| 7 | Geological Setting and Mineralization | |
| 8 | Deposit Types | |
| 9 | Exploration | |
| 10 | Drilling | |
| 11 | Sample Preparation, Analyses and Security | |
| 12 | Data Verification | |
| 13 | Mineral Processing and Metallurgical Testing | John Rust |
| 14 | Mineral Resource Estimates | Brian Morris |
| 15 | Mineral Reserve Estimates | Mark Odell Sarah Bull |
| 16 | Mining Methods | |
| 17 | Recovery Methods | John Rust |
| 18 | Project Infrastructure | Mark Odell |
| 19 | Market Studies and Contracts | Brian Morris |
| 9 | P a g e |
|
|
Technical Report and Pre - Feasibility Study for the Hollister
Underground Mine | Title May 31, 2017 | Effective Date August 9, 2017 | Report Date |
| Technical Report Section | Qualified Person | |
| 20 | Environmental Studies, Permitting and Social or Community Impact | |
| 21 | Capital and Operating Costs | Mark Odell |
| 22 | Economic Analysis | |
| 23 | Adjacent Properties | Robert Thomason |
| 24 | Other Relevant Data and Information | |
| 25 | Interpretation and Conclusions | Brian Morris |
| 26 | Recommendations | |
| 27 | References | All QPs |
The author, Mr. Robert E. Thomason, holds a M.Sc., Economic Geology, is a Licensed Geologist in the State of Washington (#1880) and a registered member of Society for Mining, Metallurgy & Exploration ([SME] #4224163RM). Mr. Thomason has over 38 years of experience in the mining industry including: mineral exploration, mine development, reserve estimation, economic evaluation and modeling. Mr. Thomason has extensive experience in Nevada where the Hollister Mine is located. From August 2016 to date, Mr. Thomason has been the Hollister Exploration Manager for Klondex Mines, by extension, he has conducted personal inspections of the Property on a number of occasions. Previously, he held a similar position from April 2008 to August 2011 for GBG. He has directed and facilitated exploration on the Project including; technical advisement, budgeting, contract negotiations, and designed and implemented drilling programs to define mineralization in project area. During this time, he has had numerous conversations with individuals involved in the data collection and interpretations contained herein.
The author, Mr. John Rust, holds a Bachelor of Science in Metallurgical Engineering and is a registered member of SME, #02796650. Mr. Rust has over 27 years of mineral processing industry experience. His experience includes various operational and technical positions with operating mining companies, served as a consultant in the evaluation of mineral processing facilities, completed feasibility studies of gold processing facilities, completed precious metal testing programs, and was process engineering manager for detailed design of several gold processing plants. He visited the Esmeralda mill as a consultant in 2009 while GBG was processing Hollister ore.
The author, Mr. Brian Morris, has over 28 years of experience in the mining industry. His previous experience encompasses senior positions in geology, exploration and underground production for several North American companies and their subsidiaries, including Hecla, Barrick Gold Corporation (Barrick) and Newmont. Mr. Morris’ tenure at the Midas Mine was from 2002 — 2007 and was involved in district exploration, underground near mine resource expansion and production. With GBG, Mr. Morris was Chief Geologist until being promoted to VP of Geology and Business Development. Most recently, Mr. Morris served as President of American Mining and Tunneling LLC. (AMT) until joining Klondex January 2015 as Senior Vice President Exploration. He is considered to be an expert in both epithermal vein systems and Carlin style deposits, and has a substantial understanding of Klondex’s four existing underground operations in Nevada. Mr. Morris holds a Bachelor’s degree in Geology from Humboldt State University in California and is a Qualified Person certified by the AIPG (CPG-11786).
For the past 12 years, the author, Mr. Mark Odell, has owned and managed Practical Mining, LLC. (PM), a geological and engineering consulting business. Mr. Odell has over 32 years’ mining industry experience and is a registered professional engineer in the State of Nevada. Prior to founding PM he held the positions of Mine Manager, Technical Services Manager, Chief Engineer, and Mine Superintendent at open pit and underground precious metal mines.
| 10 | P a g e |
|
|
Technical Report and Pre - Feasibility Study for the Hollister
Underground Mine | Title May 31, 2017 | Effective Date August 9, 2017 | Report Date |
The author, Ms. Sarah Bull, is Senior Mining Engineer for PM. She has over 10 years of engineering experience at underground narrow vein precious metal mines. She previously worked at the Midas Mine as Mine Engineer. Ms. Bull is a registered professional engineer in the State of Nevada.
| 2.3 |
Sources of Information |
This TR is based on professional opinions, published, and unpublished material available to the authors. The sources of information include data and reports supplied by Klondex staff.
Additional information included in the TR is based on discussions with Klondex staff as it relates to their field of expertise at the Mine. The required financial data and operating statistics were also provided by Klondex staff. The authors believe the information provided by Klondex staff to be accurate based on their work at the Mine. A list of the references utilized in the preparation of this TR is provided in Section 27. Additional reports, opinions, and statements by advisors, legal counsel, and other experts are discussed in Section 3.
| 2.4 |
Units of Measure |
The units of measure used in this TR are shown in Table 2-2 below. U.S. Imperial units of measure are used throughout this document unless otherwise noted.
Table 2-2: Units of Measure
| Type | Unit | Unit Abbreviation | Si Conversion* |
| area | acre | acre | 4,046.86m2 |
| area | acre | ha | 10,000m2 |
| concentration | grams per metric ton | g/t | 1 part per million |
| concentration | troy ounces per short ton | opt | 34.28552 g/t |
| length | foot | ft | 0.3048 m |
| length | meter | m | Si base unit |
| length | kilometer | km | Si base unit |
| length | centimeter | cm | Si base unit |
| length | mile | mi | 1,609.34 km |
| length | yard | yd | 0.9144m |
| mass | gram | g | Si base unit |
| mass | kilogram | kg | Si base unit |
| mass | pound | lb | 0.453592 kg |
| mass | troy ounce | oz | 31.10348 g |
| mass | metric ton | t, tonne | 1,000 kg |
| mass | short ton | T, ton | 2,000 lb |
| time | million years | Ma | Million years |
| volume | cubic yards | Cu yd | 0.7626 m3 |
| temperature | degrees Celsius | °C | Degrees Celsius** |
| temperature | degrees Fahrenheit | °F | °F = °C x 9 / 5 + 32 |
Notes:
*Si refers to International System of
Units.
** Degrees Celsius is not an Si unit, but is the
standard measurement for temperature.
Abbreviations and acronyms are listed in the Abbreviations and Acronyms section on Page X of this report.
| 11 | P a g e |
|
|
Technical Report and Pre - Feasibility Study for the Hollister
Underground Mine | Title May 31, 2017 | Effective Date August 9, 2017 | Report Date |
| 3 |
Reliance on Other Experts |
Additional Resources referenced in this TR includes:
| • |
A review of the Property Description, Location, History and Adjacent Properties was provided by Randy Vance, Klondex Senior Corporate Geologist; | |
| • |
Information concerning Sample Preparation, Analyses, Security and Data Verification was provided by Jesse Gauthier, Klondex Database Administrator; | |
| • |
The mineral resource estimate was performed by Anthony Bottrill, Corporate Resource Manager for Klondex; | |
| • |
The mineral reserve estimate was performed by Paul Schmiesing, Chief Engineer Hollister Mine for Klondex; | |
| • |
Information concerning Mining Methods, Project Infrastructure, Capital and Operating Costs, Interpretation and Conclusions and Recommendations were provided by Ian McMullan, Klondex Director of Mining and Engineering; | |
| • |
Information on Market Studies and Contracts was provided by John Antwi, Klondex Senior VP of Strategic Planning; and | |
| • |
The status of Environmental Studies, Permitting and Social or Community Impact was provided by Lucy Hill, Klondex Director of Environmental Services & Community Relations. |
These contributions were reviewed by the Authors and are accurate portrayals of the Mine at the time of writing this TR.
Observations made at the Mine by the authors encompass all aspects of mining activities including: underground core drilling, labeling core boxes, moving core, splitting core, safety procedures, haulage and equipment maintenance, water treatment, security, road maintenance, general geology, and character of mineralization.
The authors reviewed land tenure to verify the nature of the good standing with regulatory authorities and the Bureau of Land Management (BLM) status of Klondex’s unpatented lode mining claims. The technical status for the claims and land holdings, as described in Item 4, is reliant on information provided by Klondex’s legal counsel (Harris, Thompson & Faillers). It is considered that the claims were located and maintained in accordance with state and federal mining law, and the title condition is good.
Portions of the Technical Report were reviewed by PM with final editing by the authors.
| 12 | P a g e |
|
|
Technical Report and Pre - Feasibility Study for the Hollister
Underground Mine | Title May 31, 2017 | Effective Date August 9, 2017 | Report Date |
| 4 |
Property Description and Location |
The Hollister property is located in the Ivanhoe Mining District in western Elko County, Nevada, at latitude 41°06’ North, longitude 116°31’ West. The Mine consists of 1,016 unpatented mining claims in Townships 37 and 38 North, Range 48 East. The Mine is approximately 61.5 miles east-northeast of the town of Winnemucca (Figure 4-1), 14 miles southeast of the town of Midas, 50 miles northwest of the city of Elko, and 200 miles northeast of the city of Reno, Nevada.
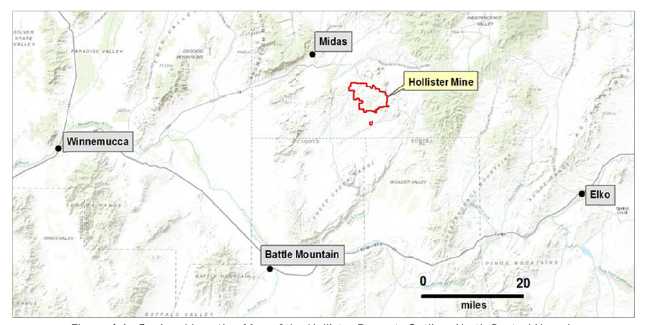
Figure 4-1: Regional Location Map of the Hollister Property Outline, North-Central Nevada
| 4.1 |
Mineral Tenure |
The property consists of 1,005 unpatented lode claims and 11 unpatented mill site claims that cover an area in excess of 17,960 acres. Klondex is the owner of 796 lode claims and 11 mill site claims by virtue of their purchase of Carlin. An additional 209 lode claims are controlled by Klondex through other agreements described in this TR. Table 4-1 summarizes the various blocks of lode and mill site claims that Klondex Hollister either owns or controls. Due to the long Mine history and multiple ownership transactions, the claims are held under various claimant names on LR2000 (the BLM’s claims website), such as Hillcrest Mining Company (Hillcrest), Hi Tech Exploration Ltd. (Hi-Tech), Ivanhoe Gold Corp. (Ivanhoe), Newmont, GBG, and Carlin.
Table 4-1: A Summary of the Hollister Mine Claims Controlled by Klondex.
| Claim Group Name | Number |
Ownership1 |
Controlled through |
| Lode Claims | |||
| Ivanhoe | 402 |
100% Klondex Hollister |
Ownership |
| Reclaim Area | 57 |
Newmont USA Limited |
Purchase Agreement |
1The term Ownership means that the claim holder has the possessory right to mine all veins of lode minerals whose apexes lie within the boundaries of the claims. Legal title remains vested in the United States (US)
| 13 | P a g e |
|
|
Technical Report and Pre - Feasibility Study for the Hollister
Underground Mine | Title May 31, 2017 | Effective Date August 9, 2017 | Report Date |
| Claim Group Name |
Number |
Ownership1 |
Controlled through |
| Hillcrest | 45 | Hillcrest Mining Company | Lease agreement |
| Robbie | 107 | Hi-Tech Exploration Limited | Sub-lease agreement |
| Aagaard | 109 | 100% Klondex | Ownership |
| Ho | 139 | 100% Klondex | Ownership |
| Jo | 13 | 100% Klondex | Ownership |
| Sheep Corral (or SC) | 65 | 100% Klondex | Ownership |
| RIB | 13 | 100% Klondex | Ownership |
| HDH | 55 | 100% Klondex | Ownership |
| Total | 1,005 | - | - |
| Mill Site Claims | |||
| MS | 8 | 100% Klondex | Ownership |
| HMS | 3 | 100% Klondex | Ownership |
| Total | 11 | - | - |
Figure 4-2 is a map showing individual claim outlines (yellow shapes are private surface). A complete list of the individual lode and mill site claims is presented in Appendix A. Only a portion of the claim boundaries have been legally surveyed.
| 14 | P a g e |
|
|
Technical Report and Pre - Feasibility Study for the Hollister
Underground Mine | Title May 31, 2017 | Effective Date August 9, 2017 | Report Date |
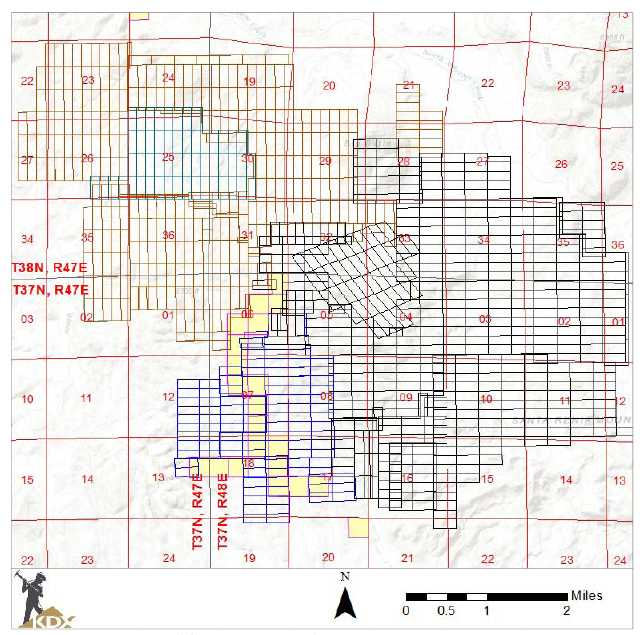
Figure 4-2: The Hollister Mine Claim Map Underlying Agreements
| 4.1.1 |
Hollister Purchase Agreement |
On February 25, 2013, Rodeo Creek Gold, Inc. (RCGI), Touchstone and certain of their other affiliates entered Chapter 11 of the US (United States) Bankruptcy Code restructuring proceedings through which RCGI, Touchstone, and their affiliates sought to auction their assets and operations including the Hollister property. On May 3, 2013, the US Bankruptcy Court for the District of Nevada entered an order approving the sale (the 2013 Bankruptcy Sale) of the Hollister property to Carlin free and clear of all liens, claims, interests, encumbrances, rights, remedies, restrictions, liabilities, and contractual commitments other than encumbrances such as royalties. The acquisition closed on May 20, 2013.
| 15 | P a g e |
|
|
Technical Report and Pre - Feasibility Study for the Hollister
Underground Mine | Title May 31, 2017 | Effective Date August 9, 2017 | Report Date |
The 504 lode claims that were subject to the Hollister Purchase Agreement (as defined below) may conveniently be split into three distinct blocks: the Ivanhoe Claim Block comprising 402 unpatented lode claims; the Reclaim Area comprising 57 unpatented lode claims; and the Hillcrest Claim Block comprising 45 unpatented lode claims.
Ivanhoe Claim Block – The Ivanhoe Claim Block, now owned by Klondex by way of the 2016 purchase from Carlin, consists of 325 claims (Ivanhoe Royalty Claims) that are subject to a 5% net smelter royalty (NSR) in respect of gold production, which was originally reserved by US Steel and ultimately conveyed to Franco-Nevada U.S. Corporation (Franco). Seventy-seven Ivanhoe claims are excluded from the Franco royalty.
Prior to Klondex’s purchase, Carlin acknowledged and confirmed the Franco royalty in an Amended and Restated Royalty Agreement (Franco Royalty Agreement) dated February 12, 2014 by and between Franco and Carlin and recorded in Elko County. As a result of a legal settlement, Carlin granted Franco an additional sliding scale NSR (2013 Additional Royalty) which applies in respect of all minerals produced from the Ivanhoe Royalty Claims when the gold price per ounce exceeds US$1,700. The 2013 Additional Royalty is equal to 1% when the gold price per ounce is between US$1,700 and US$1,849.99, 1.5% when the gold price per ounce is between US$1,850 and US$1,999.99 and 3% when the gold price per ounce exceeds US$2,000. The 2013 Additional Royalty is only payable in calendar quarters where production from the Ivanhoe Royalty Claims, the Hillcrest Claims, and the Reclaim Royalty Claims exceeds 13,750 ounces of gold or gold equivalent. The obligation to make payments under the 2013 Additional Royalty shall cease once Franco has been paid in the aggregate US$3,550,000 in 2013 Additional Royalty payments.
Reclaim Area - In conjunction with the purchase agreement dated August 13, 1997, amongst GBG, Newmont Exploration Limited (Newmont Exploration), Cornucopia Resources Limited (Cornucopia) and Touchstone (a wholly owned subsidiary of Cornucopia) in which GBG acquired Newmont Exploration’s then-current 75 % interest in the Hollister Mine (which comprised a total of 504 lode claims at that stage), excluding the 57 Reclaim claims, Touchstone executed a Quitclaim Deed and Assignment that conveyed its undivided 25% interest in the Reclaim Area to Newmont USA Limited. The Quitclaim Deed and Assignment were recorded in Elko County on September 11, 1997, and were filed with the BLM Nevada State office on October 6, 1997.
Newmont USA Limited owns the 57 Reclaim Area claims and will retain their ownership until such time as reclamation of the historical workings is complete. Klondex will have the option, but not the obligation, to accept conveyance of the claims comprising the Reclaim Area. Newmont USA Limited currently pays the federal claim maintenance fees. A 5% NSR is payable to Franco, in respect of 55 of the 57 Reclaim Area claims (Reclaim Royalty Claims). The 2013 Additional Royalty is also applicable to the Reclaim Royalty Claims.
Hillcrest Claim Block - The Hillcrest claim block, consisting of 45 unpatented claims, is owned by Hillcrest Mining Company (Hillcrest) of Lakewood, Colorado. The claim block is currently controlled by Klondex subject to a sub-lease from the Hillcrest/Finley River partnership, the term of which extends to 2061.
The Hillcrest claims were originally subject to an 80-year Mineral Lease dated October 23, 1981 between Hillcrest as lessor and Auric Metals Corporation ([Auric] a Utah corporation) as lessee. The purpose of the sublease was to explore the claims and find a third company with adequate capital to develop the property. A sublease, dated December 10, 1981, was subsequently granted by Auric to US Steel. The sub-lease was later assigned by US Steel to Touchstone and then further assigned to the Ivanhoe Joint Venture by a Quitclaim Deed and Assignment dated August 24, 1990. RCG was assigned the sub-lease by way of a “Venture Agreement Assignment” dated July 31, 1998. Carlin acquired RCG’s interest through the 2013 Bankruptcy Sale, and Klondex acquired the Hillcrest interest in 2016 through its purchase of Hollister Mine from Carlin.
On October 27, 2000, Auric executed an Assignment of Interest conveying Auric’s interest in the Mining Lease and Auric’s interest in the sub-lease to Finley River Company, L.L.C. (Finley). The Assignment was recorded in Elko County on December 1, 2000.
| 16 | P a g e |
|
|
Technical Report and Pre - Feasibility Study for the Hollister
Underground Mine | Title May 31, 2017 | Effective Date August 9, 2017 | Report Date |
There are two gold royalties associated with the Hillcrest Claims:
| • | A 2% gold NSR reserved to Auric, which Auric subsequently assigned one half of its royalty (1%) to Hillcrest in an “Amendment to the Auric-Hillcrest Mineral lease and Assignment of Interest” (dated March 19, 1987) and the other one-half gold NSR (1%) assigned to Finley, as part of the Assignment of Interest; and | |
| • | A 3% gold NSR in favor of US Steel that was conveyed to Newmont, and ultimately to Franco. The 2013 Additional Royalty is also applicable to the Hillcrest Claims. |
The Hillcrest claim block is also subject to the annual maintenance payments to the BLM and Elko County, and annual property payments to Hillcrest and Finley River separate from the production NSR royalties.
Robbie Claim Block Agreement-The Robbie group of 107 contiguous unpatented claims, covering approximately 1,980 acres (800 hectares), was located by Hi-Tech, a Colorado corporation, between May 21, 1993 and June 9, 1993. Certificates of Location were recorded in Elko County on August 10, 1993, and the claims were filed with the BLM Nevada State Office on August 13, 1993. The claims were leased to Newmont in 1993.
On April 28, 1995, Newmont and Touchstone executed a Quitclaim Deed relinquishing their interest in the Robbie claims back to Hi-Tech. The deed was recorded in Elko County on July 27, 1995. GBG leased the Robbie claim group on June 8, 1999 (Original Lease Agreement) by an agreement between GBG and the lessors (Hi-Tech, Auric, James F. Fouts, and Hillcrest). The Original Lease Agreement was replaced by a lease agreement dated May 2, 2012 (Current Lease Agreement) between Hi-Tech, Hillcrest, Finley, and RCGI. Carlin acquired RCGI’s interest by the 2013 Bankruptcy Sale purchase. The Current Lease Agreement extends to May 31, 2030. It renews automatically upon satisfaction of certain terms. Klondex must maintain the claims in good standing with the BLM and Elko County. A 2% NSR is reserved by Hi-Tech, Hillcrest, and Finley.
Other Claim Blocks
The Aagaard, Ho, Jo, Lay, Ant, Hol, Joe, SC, HDH, RIB, and mill site claim groups are wholly owned by Klondex through the purchase of Hollister Mine from Carlin. All the claim blocks outlined below are subject to the annual maintenance payments to the BLM and Elko County.
Aagaard Group - The 109 contiguous claims that comprise the Aagaard group (AAG and BMA claims) were originally located by Newmont, and acquired by GBG in October 1997. Ownership was conveyed through purchase, by means of a Special Warranty Deed and Termination of Mining Lease from the Aagaard Family, as recorded in Elko County on December 13, 1999. There are no royalties on the Aagaard claims.
Ho Group - The Ho 1 to 132 claims were located by GBG in January 1998. Certificates of Location were recorded in Elko County on February 18, 1998, and the claims were filed with the BLM Nevada State Office on March 10, 1998. The remaining seven Ho claims (Ho 133 to 139) were located by GBG on April 20, 1998 and April 21, 1998. Certificates of Location were recorded in Elko County on May 19, 1988, and the claims were filed with the BLM Nevada State Office on June 10, 1998. There are no royalties on the Ho claims.
Jo Group - GBG located the Jo 1 to 13 lode claims in April, 2004. Certificates of Location were recorded in Elko County on July 6, 2004 and the claims were filed with the BLM Nevada State Office on June 18, 2004. There are no royalties on the Jo claims.
Sheep Corral Group - The 65 unpatented lode claims that comprise the Sheep Corral (SC) group were located by Sanburnite Corp., a Nevada corporation (Sanburnite), in September 1998. Certificates of Location were recorded in Elko County on December 3, 1998, and the claims were filed with the BLM Nevada State Office on December 4, 1998. On March 9, 1999, Sanburnite filed an Amendment to its Articles of Incorporation, changing its name to Pacific Spar Corp. The Amendment was filed with the BLM Nevada State Office on July 28, 1999.
| 17 | P a g e |
|
|
Technical Report and Pre - Feasibility Study for the Hollister
Underground Mine | Title May 31, 2017 | Effective Date August 9, 2017 | Report Date |
On July 13, 2001, Pacific Spar Corp. executed a Purchase Agreement whereby it sold the SC claims to GBG and RCG. The related Quitclaim Deed was recorded in Elko County on July 16, 2001 and filed with the BLM Nevada State Office on July 13, 2001. There are no royalties on the SC claims.
RIB and Mill Site Claims - The 13 unpatented RIB lode claims and 11 unpatented MS and HMS mill site claims were located by Hecla. The 13 RIB lode claims were located on August 6, 2003; the eight MS mill site claims were located on October 21, 2003, and the three HMS mill site claims were located on September 17, 2004. Certificates of Location were recorded in Elko County, and the RIB claims were filed with the BLM Nevada State Office on November 3, 2003 (RIB 1 to 13). The MS claims were filed on January 8, 2004 and January 9, 2004, respectively (MS 1 to 8). The HMS claims were filed on September 30, 2004 and October 14, 2004, respectively (HMS 1 to 3). There are no royalties on the RIB, MS, and HMS claims.
HDH Group - The 55 unpatented lode claims that comprise the HDH group were located by Carlin on July 9, 2014. Certificates of Location were recorded in Elko County on September 29, 2014, and the claims were filed with the BLM Nevada State Office on September 25, 2014. There are no royalties on the HDH claims.
| 4.1.2 |
Taxes, Royalties, and Payments |
Table 4-2 summarizes the current royalties and payments due with respect to the Hollister Mine claim blocks described above. No other back-in rights, payments or other agreements and encumbrances exist.
Table 4-2: A Summary of the Royalties and Payments Due in Respect of the Hollister Mine Claims
| Claim Group
|
Number
of Claims |
Net
Smelter Royalty |
Paid to
|
Annual Fees (US$) | |
| BLM | Elko County | ||||
| Ivanhoe | 325 | 5% Au* | Franco | 50,375 | 3,412 |
| 77 | None | - | 11,935 | 808 | |
| Reclaim Area | 55 | 5%* | Franco | 8,525** | 577 |
| 2 | None | - | 310** | 21 | |
| Hillcrest | 45 | 1% Au | Hillcrest Mining Corporation | 6,975 | 472 |
| - | 1% Au | Finley | - | 0 | |
| - | 3% Au* | Franco | - | 0 | |
| Robbie | 107 | 2% Au | Hi-Tech, Hillcrest and Finley | 16,585 | 1,123 |
| Aagaard | 109 | None | - | 16,895 | 1,144 |
| Ho | 139 | None | - | 21,545 | 1,459 |
| Jo | 13 | None | - | 2,015 | 136 |
| Sheep Corral | 65 | None | - | 10,075 | 682 |
| RIB | 13 | None | - | 2,015 | 136 |
| MS | 8 | None | - | 1,240 | 84 |
| HMS | 3 | None | - | 465 | 31 |
| HDH | 55 | None | 8,525 | 577 | |
| Totals | 1,016 | - | - | 157,480 | 10,668 |
*Note: Subject to the 2013 Additional Royalty.
**Note: Claim maintenance fees for the unpatented claims located in the Reclaim Area are paid by Newmont until such claims are transferred to Klondex. The associated 5% royalty will only be payable by Klondex after it has accepted the transfer.
| 18 | P a g e |
|
|
Technical Report and Pre - Feasibility Study for the Hollister
Underground Mine | Title May 31, 2017 | Effective Date August 9, 2017 | Report Date |
| 4.1.3 |
Hollister Development Block |
Within the boundaries of the Hollister property is a defined area formerly called the Hollister Development Block (HDB) that comprised approximately 5% of the total area. The HDB was subject to a historical earn-in agreement between GBG and Hecla to jointly explore and eventually develop the mineral resources within the HDB. The agreement, dated August 2, 2002, made Hecla the operator and funder of the HDB through exploration, engineering, and the delivery of a bankable feasibility study. Upon delivery of a positive feasibility study, as well as other pre-development requirements, Hecla could have earned a 50% stake in the mineral resources contained within the HDB by funding a US$21.8 million two-stage program. Hecla commenced physical work on the HDB in October 2004, and the decline reached the first vein system in October 2005.
However, on February 20, 2007, GBG entered into a share purchase agreement to buy all the outstanding shares of Hecla’s ownership vehicle, Hecla (later renamed Hollister Venture Corporation), for US$60 million (cash and common shares). GBG closed the acquisition on April 19, 2007, thereby effectively regaining a 100% working interest in the HDB. One result of this transaction was acquisition by GBG of the 13 RIB lode claims. Hecla had expended US$32 million on exploration and development work at HDB since 2002.
| 4.2 |
Permits and Authorization |
| 4.2.1 |
Surface Rights |
The surface management area of mining law, as it applies in the State of Nevada, concerns the authorization and permitting of mineral exploration, mining and reclamation actions on the public lands administered by the BLM. It is mandated by Section 302(b) of FLPMA (43 USC 1732[b] and 603[c]; 43 CFR 3802 and 43 CFR 3809). All operations of any nature that disturb the public surface of the earth require authorization through the relevant BLM Field Office (the BLM District Field Office in Elko, Nevada, in the case of the Hollister Mine). The BLM mining regulations establish three levels of authorization:
| • |
Casual Use that involves minor activity with hand tools, but no explosives or mechanized earth moving equipment, for which no permit is required; | |
| • |
Notice Level that involves the use of explosives and/or earth moving equipment (the total surface disturbance must not exceed five acres); and | |
| • |
The Mine has an approved Plan of Operations ([POO] NVN-076802). |
| 4.2.2 |
Use and Occupancy |
The BLM Surface Use and Occupancy Regulations controls the proper occupation of public surface lands (residency or seasonal occupation of mining claims by mining claimants). The relevant legislation (Surface Resources Act of 1955 [30 USC 611-615; 43 CFR 3715]) does not apply in the case of the Mine because all of Klondex’s employees, contractors, and consultants live off-site and commute to and from the Mine.
| 4.2.3 |
Hollister Mine |
The only constraint or encumbrance concerning surface access to any part of the Hollister Mine relates to access to the Reclaim Area and restrained access from protected cultural resources. More than 95% of the Hollister Mine is located on public land administered by the BLM.
| 19 | P a g e |
|
|
Technical Report and Pre - Feasibility Study for the Hollister
Underground Mine | Title May 31, 2017 | Effective Date August 9, 2017 | Report Date |
| 4.2.4 |
Limitations |
Activities at the Mine must operate within the limits set out in the current approved Plan of Operations (NVN-076802), 2013 Environmental Impact Statement (EIS), Record of Decision (ROD), and state permits issued by the Nevada Division of Environmental Protection (NDEP). All permits required for underground mining are current and listed in Section 18.
| 4.3 |
Environmental Considerations |
| 4.3.1 |
Underground Mining at the Hollister Mine |
On June 1, 2012, the BLM published a notice of availability of the draft Environment Impact Statement (EIS) in the Federal Register. The draft EIS addressed the direct, indirect, and cumulative environmental impacts of the Proposed Amendment. The final EIS approving the Proposed Amendment was published by the BLM, and the notice of availability was published for the final EIS in the Federal Register on July 5, 2013 (2013 EIS). On March 31, 2014, the BLM issued the ROD for the 2013 EIS.
Under the current Proposed Amendment approved by BLM through the ROD, the Mine transitioned from an underground exploration, development and test mining operation to a full-scale underground producing mine. Outcomes of the 2013 EIS and ROD include:
| • | Total surface disturbance of approximately 222 acres; | |
| • | Twenty-five additional acres of surface exploration, for a total of fifty acres; | |
| • | Approved rights-of-ways for the construction of 11.6 miles of overhead 24.9 kilovolt (kV) electric power transmission, distribution lines, and a new substation; and | |
| • | The continued use of federal access roads. |
| 4.3.2 |
Liabilities |
The Hollister Mine is not subject to any known environmental liabilities or mitigation measures other than those associated with the normal course of mining operations and eventual remediation and closure.
With the exception of the areas covered by the current Plan of Operations boundary, all pre-existing liabilities related to previous mining activities (West Pit, the leach pads, waste rock dumps, surface, and groundwater quality) remain the responsibility of Newmont. Under the terms of the Hollister Purchase Agreement, GBG agreed to share Newmont’s future reclamation costs for past mining (i.e. in the Reclaim Area) on the basis of one third of such expenditures over US$4.5 million but less than US$6.0 million and 25% of expenditures over US$6.0 million (US$500,000 maximum).
Upon release by the BLM and NDEP of Newmont’s reclamation bond over the Reclaim Area, Klondex will receive an option to acquire ownership of the Reclaim Area (57 unpatented claims) for no additional consideration.
Klondex currently holds bonds in the amount of US$9,192,255 under the Plan of Operations (NVN-076802) and US$440,851 for the power line (NVN-091723).
| 20 | P a g e |
|
|
Technical Report and Pre - Feasibility Study for the Hollister
Underground Mine | Title May 31, 2017 | Effective Date August 9, 2017 | Report Date |
| 5 |
Accessibility, Climate, Local Resources, Infrastructure and Physiography |
| 5.1 |
Topography, Elevation, and Vegetation |
The Mine is located in the Great Basin physiographic province of the Western United States. The Great Basin is characterized by Basin and Range topography. Low rolling hills typify the property’s landscape, with elevations ranging from 5,380 to 6,000 feet. Drainage patterns in the immediate area predominantly trend northeast to north-south. The head of Little Antelope Creek bisects the Mine in a north-south direction and joins Antelope Creek approximately 3.5 miles south of the Mine boundary. Though most of the region’s streams are seasonal, water flows in Antelope Creek and Willow Creek for most of the year.
Vegetation consists of the high desert sagebrush and bunch grasses common to the Great Basin. This flora supports both indigenous fauna (i.e. antelope, deer, badgers, coyotes, etc.) as well as seasonal cattle grazing.
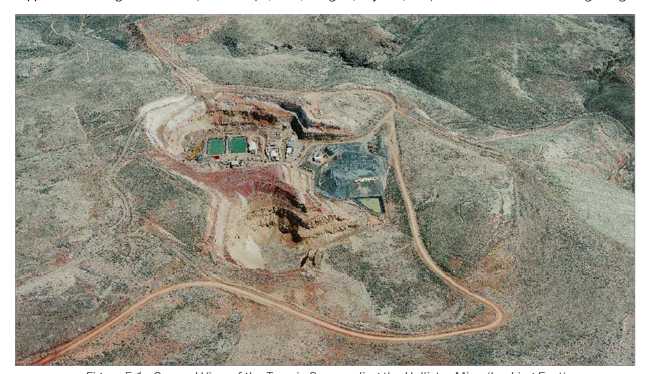
Figure 5-1: General View of the Terrain Surrounding the Hollister Mine (Looking East)
| 5.2 |
Accessibility |
The Hollister Mine area is accessed from the town of Winnemucca, Nevada (the largest local community). The distance by road is approximately 75 miles, and it takes approximately 1.5 hours by vehicle. The route from Winnemucca starts on the paved Interstate 80 freeway that runs east to Golconda, Nevada. From the Golconda freeway exit, the route follows the Midas Road (Route 789) that is initially a paved and then a well-graded and maintained dirt road. From the Midas town site intersection, the primary access to the property is via an 11-mile, all-weather road that was constructed in the early 1990s. The road spurs to the south off the Midas-Tuscarora Road, Nevada State Route 18, east of the town of Midas.
| 21 | P a g e |
|
|
Technical Report and Pre - Feasibility Study for the Hollister
Underground Mine | Title May 31, 2017 | Effective Date August 9, 2017 | Report Date |
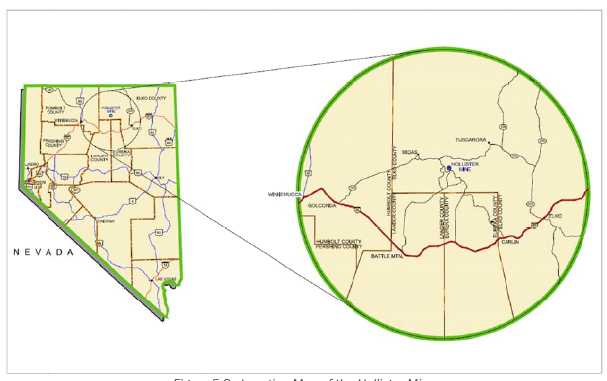
Figure 5-2: Location Map of the Hollister Mine
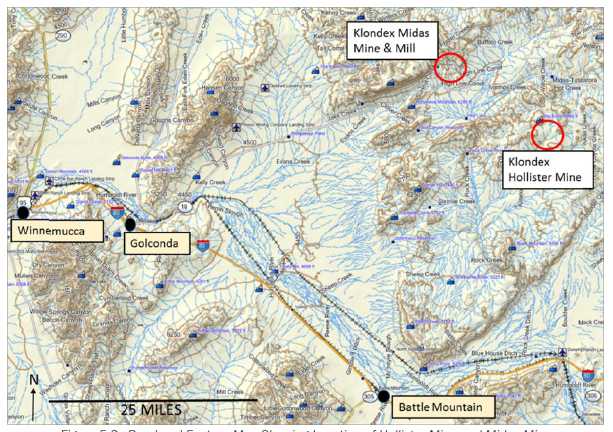
Figure 5-3: Road and Feature Map Showing Location of Hollister Mine and Midas Mine
| 22 | P a g e |
|
|
Technical Report and Pre - Feasibility Study for the Hollister
Underground Mine | Title May 31, 2017 | Effective Date August 9, 2017 | Report Date |
| 5.3 |
Population Centers and the Nature of Transport |
Winnemucca is the county seat of Humboldt County, Nevada. It has a population of between 7,000 and 8,000 (source of population statistics: www.city-data.com). Elko, which is some 46 miles to the southeast of the Hollister Mine (straight line distance), is the county seat of Elko County and has a population of approximately 20,000 people. Both Winnemucca and Elko offer a variety of community and public services to residents and visitors, including housing for purchase and rental.
Elko has a well-developed transport network (air, rail, and road). The nearest international airport is in Reno, Nevada, approximately 204 miles southwest of the Hollister Mine (straight line distance).
The nearest town to the Mine is the town of Midas, approximately 15 miles to the northwest of the Hollister Mine (straight line distance). It has an estimated population of 20 to 50 residents depending on the season. The town of Tuscarora is approximately 15 miles to the northeast of the Mine (straight line distances). It is similar in size to the town of Midas.
| 5.4 |
Climate and the Length of the Operating Season |
The climate of Northern Nevada is semi-arid. Summer days tend to be hot, but the temperature drops significantly at night. Winters are cold with generally light snow, with approximately 20 inches total falling during a typical year. According to the Western Regional Climate Center (WRCC), the average maximum temperature at Midas, which is located approximately 15 miles northwest, is 88.5 degrees Fahrenheit (°F) in August, and the average minimum temperature is 3.9 °F in January. The average annual precipitation is approximately 9.32 inches and tends to peak in December and January in the form of snow (WRCC, 2017).
The Mine operates year round and is generally unaffected or only slightly affected by extremes in temperature. Precipitation generally does not affect operating conditions but may increase travel time to and from the Mine. Only short-term breaks in operations may be anticipated during irregular severe weather conditions.
| 5.5 |
Surface Rights for Mining Operations, the Availability and Sources of Power, Water, Mining Personnel, Potential Tailings Storage Areas, Potential Waste Disposal Areas, Heap Leach Pad Areas, and Potential Processing Locations |
The surface rights at the Mine are public lands administered by BLM. All areas at the Mine are located on unpatented mining claims controlled by Klondex. The Mine is fully permitted under the 2013 EIS, ROD, and accompanying state permits for full-scale underground mining and surface exploration.
Major power transmission lines, owned by NV Energy Corp, that service the local communities and mines are south of the Mine. Power is provided by a 120 kV transmission line with a 24.9 kV distribution line.
Klondex controls numerous water rights that allow for water extraction sufficient for mining operations. Willow Creek Reservoir, the major local source of piped service water, is located approximately 5.5 miles north of the Mine.
Mining personnel are available from several northern Nevada towns, such as Winnemucca, Battle Mountain, Carlin, and Elko.
| 23 | P a g e |
|
|
Technical Report and Pre - Feasibility Study for the Hollister
Underground Mine | Title May 31, 2017 | Effective Date August 9, 2017 | Report Date |
Pre-existing development at the Mine includes two open pits, waste rock dumps, water treatment facilities and ponds, administration buildings, a significant amount of underground workings, a reclaimed leach pad, and ancillary roads. It is anticipated that ore produced at the Mine will be processed at the Midas mill located approximately 14 miles to the northwest of the Mine (straight line distances). The existing waste disposal areas and water treatment facilities are sufficient to accommodate planned production.
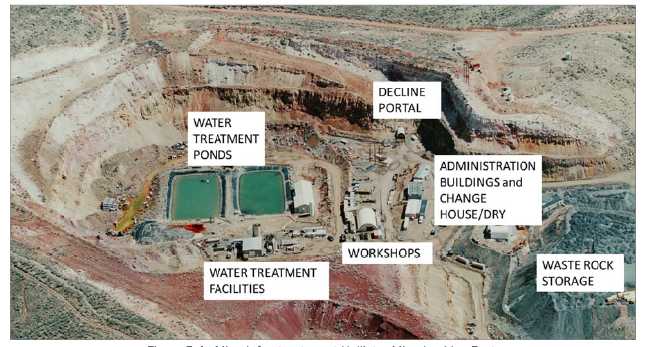
Figure 5-4: Mine Infrastructure at Hollister Mine Looking East
| 24 | P a g e |
|
|
Technical Report and Pre - Feasibility Study for the Hollister
Underground Mine | Title May 31, 2017 | Effective Date August 9, 2017 | Report Date |
| 6 |
History |
The Mine is located within the Ivanhoe Mining District. A large area of mid-Miocene epithermal hot springs deposits with associated mercury mineralization was prospected in the early 1900s. For approximately 8,000 years prior to this, the district was an important source of opalite silica (obsidian) which Native Americans quarried for tools and weapons in the Tosawihi Quarry. Mercury mining commenced in 1915, and as many as 150 flasks of mercury were produced by 1917. Mining from 1929 through 1943 produced greater than 2,000 additional flasks, about half coming from the Butte #1 and Butte #2 mines and the Velvet and Clementine mines, near the former USX East and West open pits. No significant mercury production occurred after the end of World War II.
| 6.1 |
Ownership History |
In the Ivanhoe Mining District, unpatented claims were located on public lands administered by the BLM from the early 1900s. From 1915 to 1943, the district was explored and mined for mercury. None of the claims in the Ivanhoe Mining District were patented.
Hillcrest located 45 unpatented claims over the current Mine workings, including the Car 1-5, Billy 6-7, Pickup 1-2, Gapfiller, Gapfiller 1, Jerry 1-21, 23-25, and 28-31, and Harolds Club 1A-58, 8A (Fig 5.1) . This block of claims was leased to Auric in 1981. Hillcrest and Auric defined a 6% royalty for mercury and a 2% royalty for gold and all other minerals, which was to be split 50/50. In 1987, an amendment and assignment of interest confirmed a 50% interest held by Auric, and a later amendment added the Jerry 24, 28, and 29 claims to the lease.
In the 1970s, several companies reportedly carried out exploration including Apco Oil, Noranda Inc., and Homestake Mining Company. In the 1980s, Placer Dome Inc. and Bear Creek (Kennecott) owned and explored portions of the larger property.
From 1980 to 1986, the US Steel owned unpatented claims across a large portion of the central and southeast portion of the district. US Steel assumed the Auric-Hillcrest lease on December 10, 1981, for an initial term of two years. US Steel could extend the lease for a maximum of 20 years by making escalating advance royalty payments. US Steel changed their name to USX on July 9, 1986. In early 1987, USX optioned their claims to Touchstone, and later quitclaimed the holdings to Touchstone while retaining a 5% NSR royalty. This became known as the US Steel royalty, and it applies to most of the claims north, northeast, east, southeast, south, and southwest of the Mine workings.
In 1990, Touchstone formed a 50/50 mining venture with Ivanhoe Gold Co., and assigned the claims to the Ivanhoe Joint Venture. The Ivanhoe JV (known as Cornucopia) constructed an open-pit heap-leach mine at the USX East and West pits, centered on the Tertiary-hosted disseminated gold mineralization.
After mining ended and while leaching continued in 1992, Newmont Exploration entered into a 75/25 joint venture with Cornucopia/Touchstone, after purchasing Ivanhoe’s interest in the Mine. Newmont explored the Mine and Ivanhoe Mining District until 1995.
In 1997, Newmont’s 75% interest in the Mine was acquired by Consolidated North Coast Industries Ltd., which subsequently merged with Pacific Sentinel Gold Corporation to form GBG. On August 13, 1994, GBG purchased Touchstone’s remaining 25% interest in the Ivanhoe JV to increase its Hollister ownership to 100%. The Hillcrest lease was amended on December 10, 1997 to allow for up to four 20-year lease extensions. In 1998, GBG assigned all of its Hollister interests to its wholly owned subsidiary, RCGI.
| 25 | P a g e |
|
|
Technical Report and Pre - Feasibility Study for the Hollister
Underground Mine | Title May 31, 2017 | Effective Date August 9, 2017 | Report Date |
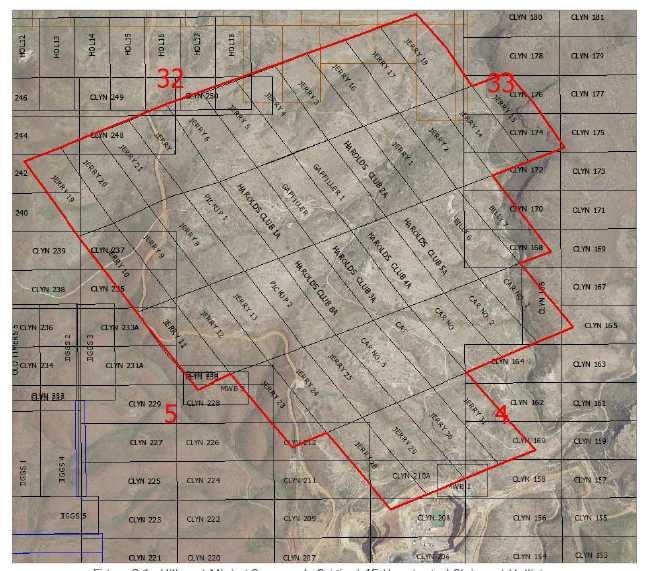
Figure 6-1: Hillcrest Mining Company’s Original 45Unpatented Claims at Hollister
Auric assigned its 50% interest in the Hillcrest lease to Finley on October 27, 2000.
In August 2002, GBG entered into an earn-in and joint operating agreement with Hecla, whereby Hecla had the option to earn a 50% working interest in the HDB funding a US$21.8 million advanced exploration and development program that led to commercial production. On February 20, 2007, Hecla entered into an agreement whereby GBG purchased Hecla’s earned-in-to-date interest in the HDB. The purchase totaled US$60 million, with US$45 million payable in cash and US$15 million in ordinary shares. The agreement closed on April 19, 2007, thereby giving GBG an effective 100% ownership of the Hollister property. GBG operated under the RCGI subsidiary.
On February 25, 2013, RCGI declared Chapter 11 bankruptcy in the US.
On May 20, 2013, Carlin, a subsidiary of Waterton Global Mining Co., acquired the RCGI property assets through an auction process supervised by the US bankruptcy court.
| 26 | P a g e |
|
|
Technical Report and Pre - Feasibility Study for the Hollister
Underground Mine | Title May 31, 2017 | Effective Date August 9, 2017 | Report Date |
On July 25, 2016, Klondex purchased the RCGI property assets from Waterton Nevada Splitter, LLC and Waterton Precious Metals Fund II Cayman, LP for US$63 million cash, a US$17 million promissory note, issuance of 5 million warrants, and issuance of 2.6 million common shares. The assets, operating under the Carlin unit, included the Hollister underground mine and surface facilities, 1,005 unpatented lode claims and 11 mill site claims, mineral leases, rapid infiltration basins (RIB), and a power line and substation. At the Esmeralda (Aurora) mine and ore milling complex, the assets consisted of 448 unpatented claims, 92 patented mining claims, 7 fee parcels totaling approximately 944 acres, and a mill and tailings facility. The transaction closed on October 3, 2016.
| 6.2 |
Historical Exploration |
| 6.2.1 |
Early Mining Activity |
In 1915, exploration and mining commenced on mercury prospects in the Ivanhoe Mining District. According to available records, there has been no significant mercury production since 1943.
| 6.2.2 |
1960s and 1970s Exploration Activity |
Exploration for mercury and other metals resumed in the early 1960s. Auric drilled 100 rotary holes for mercury around the Velvet Mine in the late 1960s. Later in the 1970s, several companies carried out exploration including Apco Oil, who drilled a porphyry molybdenum target, Noranda Inc. who drilled a uranium target, and Homestake Mining Company who explored the district for McLaughlin-type (hot springs model) gold deposits.
| 6.2.3 |
1980s Exploration Activity |
In the 1980s, Placer Dome Inc. drilled several holes for mercury, silver, and gold, and Bear Creek (Kennecott) drilled a number of holes targeting gold. Reported results from these programs failed to encounter sufficient mineralization to warrant mine development.
From 1980 to 1986, US Steel carried out exploration and drilling on the property, but only limited information is available on their activities. US Steel conducted district-wide geological mapping at a scale of 1:12,000, collected rock chip samples on a 600-foot by 750-foot grid, collected 732 soil samples on a 300-foot by 300-foot grid, and completed north-south Induced Polarization (IP) lines, Self-Potential, magnetic, seismic, and electromagnetic ground geophysical surveys in the main deposit area (USX Pits).
| 6.2.4 |
Touchstone-Galactic Joint Venture (1987-1991) |
In 1987, Cornucopia purchased the property through Touchstone subsidiary and formed a 50/50 JV with Galactic to develop and mine the USX East and West deposits as the Mine, an open pit/heap-leach operation. The Mine and district-wide exploration consisted of surface geologic mapping, rock-chip sampling, and numerous geophysical surveys (IP, TDEM, E-Scan, controlled source audio magneto-telluric and an airborne magnetic survey). The work coincided with resource and definition drilling focused around the USX West and USX East deposits. These data were reviewed later by Newmont, but original datasets are not available.
| 27 | P a g e |
|
|
Technical Report and Pre - Feasibility Study for the Hollister
Underground Mine | Title May 31, 2017 | Effective Date August 9, 2017 | Report Date |
| 6.2.5 |
Newmont Exploration Limited (1992-1995) |
In 1992, Newmont entered the district via a 75/25 joint venture with Cornucopia after buying Galactic’s interest in the Mine. Their land position was enlarged, and more drilling was undertaken, including pursuit of high-grade vein intersections made earlier by the Touchstone JV. By this time, there were around 900 drill holes (mainly rotary), most of them in Tertiary units above the unconformity with the Ordovician Valmy Formation (also known as Vinini Formation) which is the main host for the vein mineralization. Newmont opted out of the project in 1995, and in 1997, its interests were acquired by Consolidated North Coast Industries Ltd. which subsequently merged with Pacific Sentinel Gold Corp. to form GBG. Touchstone’s 25% interest was acquired by GBG in 1999.
Between 1992 and 1993, Newmont carried out property-wide exploration to expand the Hollister resource and identify additional gold and silver resources similar to the low-grade oxide resource at the USX West pit and USX East pit. Newmont compiled and reviewed data from the Touchstone-Galactic operation, completed a re-logging campaign to correct inaccurate or incomplete data with new geologic knowledge, and mapped the 125-square-mile property at various scales, e.g. 1:2,400 for 6 square miles, 1:6,000 for 78 square miles, 1:24,000 for 41 square miles, and 1:600 over the USX West and USX East pits. Newmont also collected extensive surface geochemical samples across the district with over 2,000 rock-chip samples, about 2,325 soil samples, 1,570 ridge and spur soil samples, 136 bulk leach extractible gold (BLEG) samples, and around 287 stream-sediment samples. These data provided a foundation of property-wide surface geochemistry (Figure 6-2).
Newmont also conducted extensive geophysical surveys that consisted of regional gravity and airborne radiometric/magnetic surveys (165-foot and 650-foot line spacing), detailed ground magnetic surveys over the Mine area, detailed gravity over the regional area, and three IP lines. Density and magnetic susceptibility data were collected on all rock units from drill hole data to constrain geophysical modeling.
| 6.2.6 |
Great Basin Gold Limited Joint Venture (1997-2013) |
| 6.2.6.1 |
Great Basin Gold Limited 1997-2001 |
GBG explored the Mine area between August 1997 and late 2001. The majority of the exploration activities completed by GBG during this period was directed towards delineation of the Clementine and Gwenivere vein systems through surface core drilling. A property-wide lithology and alteration mapping program was also completed. Additional work included structural mapping and a spectrographic alteration study (Thompson and Gale, 2001).
| 6.2.6.2 |
Hecla Mining Company-Great Basin Gold Limited Joint Venture (2002-2007) |
In 2002, B. Peppard completed a petrographic alteration study for Hecla as part of an M.S. thesis. In 2006, regional airborne magnetic data was acquired from Pearson, Roberts and Johnson Inc. ([PRJ] Figure 6-3). The data covered four 1:24,000 scale quadrants: Rock Creek Ranch, Squaw Valley Ranch, Willow Creek Reservoir, and Willow Creek Reservoir SE. Also in 2006, J.L. Wright Geophysics was contracted to design a controlled source audio magneto-telluric (CSAMT) survey over a portion of the Mine area from the Hatter Area west towards the Jackson-Old Timer mercury mines (about 5.6 miles east-west and 1.2 miles north-south). The survey was completed by Zonge Geosciences with 165-foot dipole spacing. The survey included 36 lines totaling 48 line-miles, oriented 045 degrees.
| 28 | P a g e |
|
|
Technical Report and Pre - Feasibility Study for the Hollister
Underground Mine | Title May 31, 2017 | Effective Date August 9, 2017 | Report Date |
J.L. Wright Geophysics also reviewed all available historic airborne magnetic, airborne radiometric, ground magnetic, gravity, and IP surveys. Most of the data were collected by Newmont with lesser data from Touchstone and US Steel.
Exploration efforts were concentrated within the HDB where more than 2,750 feet of underground development was completed during delineation of the Clementine and Gwenivere veins, and a total of 175 resource definition holes were drilled from underground drill platforms. Hecla elected to withdraw from the JV due to concerns over the potential size of an underground operation and its ability to sustain the JV agreement.
| 6.2.6.3 |
Great Basin Gold 2007-2013 |
GBG owned the Mine and operated under a wholly owned subsidiary named RCGI. GBG completed a ground gravity survey at the Mine in 2009. J.L. Wright Geophysics designed the survey, and Magee Geophysical Services LLC in Reno, Nevada executed the data acquisition. The survey consisted of 1,137 stations collected at 650-foot by 650-foot spacing. The data were merged with 423 gravity stations previously acquired by Newmont over the Tertiary volcanic field. Also completed during this period were lithologic mapping within the HDB, as well as regional lineament and structural mapping from satellite imagery (Calloway, 2011). This work defined several targets near the Hollister vein system, including the Gloria target located 500 feet to the northwest and the Hatter Area target located 5,000 feet to the east.
| 29 | P a g e |
|
|
Technical Report and Pre - Feasibility Study for the Hollister
Underground Mine | Title May 31, 2017 | Effective Date August 9, 2017 | Report Date |
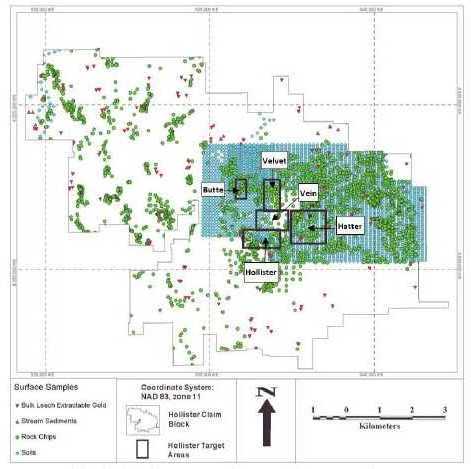
Figure6-2: Surface Geochemistry Coverage of the Mine by Sample Type2
____________________
2Source: Carlin Resources, 2016
| 30 | P a g e |
|
|
Technical Report and Pre - Feasibility Study for the Hollister
Underground Mine | Title May 31, 2017 | Effective Date August 9, 2017 | Report Date |
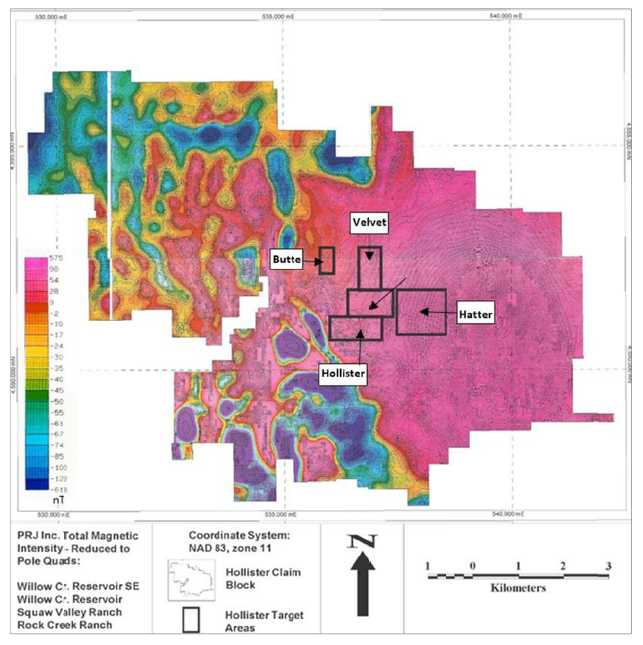
Figure 6-3: Example of Mine Magnetic Data: PRJ Airborne Magnetics Reduced-to- Pole3
Figure 6-3 shows the influence of the strongly magnetic Hatter Area stock is seen on the right side of the image.
____________________
3Source: PRJ, 2006
| 31 | P a g e |
|
|
Technical Report and Pre - Feasibility Study for the Hollister
Underground Mine | Title May 31, 2017 | Effective Date August 9, 2017 | Report Date |
| 6.3 |
Historical Resource Estimation |
| 6.3.1 |
United States Steel Corporation |
The US Steel undertook comprehensive exploration of the Hollister district between 1980 and 1986, employing geological, geochemical, and geophysical techniques, along with considerable drilling (details unavailable). Disseminated and oxidized gold mineralization hosted in Miocene-aged volcanic rock was delineated, and a historical non-NI 43-101 compliant mineral resource of approximately 11 million tons grading 0.048 opt gold (10 million tonnes grading 1.65 g/t for 0.5 million ounces of gold) was outlined within what became known as the USX East pit and USX West pit. Details of US Steel’s resource estimate are not available.
| 6.3.2 |
Touchstone-Galactic Joint Venture |
By 1990, the Touchstone–Galactic JV produced a feasibility study based on 879 drill holes (328,000 feet of diamond and rotary drilling). It defined a mainly oxide reserve (non-NI 43-101 compliant reserve) of 18.5 million tons grading 0.035 opt gold (16.8 million tonnes at 1.2 g/t), within a broader mixed sulfide-oxide resource of 84 million tons grading 0.034 opt (76 million tonnes at 1.16 g/t), or 2.8 million ounces of gold. Details of the resource estimates are not available.
The original plan was to mine the reserve with four separate pits at an overall strip ratio of 3.4:1 with a projected gold recovery of 77%. The Hollister open-pit mine began production in 1990, and mining continued until 1992 when Galactic declared bankruptcy as a result of problems at the Summitville Mine in Colorado.
| 6.3.3 |
Great Basin Gold Limited - Underground Trial Mining |
After obtaining 100% ownership of the Mine from Hecla in 2007, GBG continued drilling from underground. The following resource estimates were made during this period:
| • | A preliminary resource estimate by GBG that was independently reviewed by Behre Dolbear & Company of Vancouver, B.C., in October 2001; | |
| • |
A 2007 mineral resource update by GeoLogix Mineral Resource Consultants (Pty) Ltd. of Potachestroom, South Africa (GeoLogix), as stated in GBG’s news release dated May 23, 2007; | |
| • |
A 2008 mineral resource update by GeoLogix as stated in GBG’s news release dated June 18, 2008; | |
| • |
A 2009 mineral resource update by GBG, as stated in Company’s news release dated June 17, 2009; | |
| • |
A 2011 mineral resource update by GBG, as stated in Company’s news release dated February 2, 2011; | |
| • |
A 2012 mineral resource update by GBG, as stated in Company’s news release dated September 4, 2012; and | |
| • |
A 2012 revised mineral resource update by GBG, as stated in Company’s news release dated December 24, 2012. |
The revised NI 43-101compliant 2012 mineral resource estimate reported Measured and Indicated resources of 0.49 Mt grading 0.918 opt Au and 5.7 opt Ag for 545,000 ozs AuEq. Inferred resources were reported at 254,000 ozs AuEq. All resources were reported above a 0.15 opt AuEq cut-off grade based on the undiluted insitu vein. This led to a reported NI 43-101-compliant reserve of 0.29 Mt grading 0.590 opt Au and 2.7 opt Ag for 187,000 ozs AuEq. RCGI (the US based subsidiary or GBG) filed for US bankruptcy protection before the amended 2012 NI 43-101 report was filed on SEDAR.
| 32 | P a g e |
|
|
Technical Report and Pre - Feasibility Study for the Hollister
Underground Mine | Title May 31, 2017 | Effective Date August 9, 2017 | Report Date |
| 6.4 |
Historical Production |
In 1915, mining activity commenced on mercury deposits where as many as 150 flasks were reportedly produced through to 1917. Notable mining recommenced in 1929 through 1943 where than 2,000 additional flasks were produced with the majority of ore extracted from Butte #1 and Butte #2 Mines, as well as the Velvet and Clementine Mines (Bartlett et al, 1991).
| 6.4.1 |
Touchstone-Galactic Joint Venture |
The Hollister open-pit mine commenced production in 1990 and continued until 1992 when Galactic declared bankruptcy as a result of problems at the Summitville Mine in Colorado. The total Hollister production at that time was approximately 116,000 gold ounces contained in 3.3 million tons (0.035 opt gold recovered). Residual leaching of the heap was completed until 1996 under Newmont’s tenure.
| 6.4.2 |
Great Basin Gold Limited - Underground Trial Mining |
GBG commenced underground trial mining in 2008 and continued until May 20, 2013. The Gwenivere and Clementine veins were mined using conventional cut-and-fill and longhole stoping methods. As shown in Table 6-1, a total of 407,546 gold equivalent ounces were sold during this time.
Table 6-1: Trial Mining Production by GBG
| Year | Tons Produced | AuEq Oz Sold |
| Jan. 1 to Dec. 31, 2008 | 62,382 | -* |
| Jan. 1 to Dec. 31, 2009 | 61,519 | 175,050 |
| 2010 | 97,141 | 81,123 |
| 2011 | 103,697 | 79,042 |
| 2012 | 98,034 | 57,576 |
| Jan 1 to May 19, 2013 | 34,505 | 14,755 |
| Total | 457,278 | 407,546 |
*Gold production from 2008 was sold in 2009 and therefore is included in the 2009 total.
| 6.4.3 |
Carlin Resources |
On May 20, 2013, Waterton Global Mining Company, operating under Carlin, successfully acquired the Mine through the bankruptcy court procedures. After the acquisition, additional drilling and trial mining continued from the Gwenivere, Clementine, and Gloria veins, until mining ceased on November 25, 2013. A total of 20,078 gold equivalent ounces were produced during this period (Table 6-2). Figure 6-4 shows the extent of the Mine workings developed by Hecla/GBG and Carlin, respectively (Hecla/GBG in blue and Carlin in red).
Table 6-2: Trial Mining Production by Carlin
| Year | Tons Produced | AuEq Oz Sold |
| May 20 to November 25, 2013 | 34,976 | 17,736 |
| 33 | P a g e |
|
|
Technical Report and Pre - Feasibility Study for the Hollister
Underground Mine | Title May 31, 2017 | Effective Date August 9, 2017 | Report Date |
| Year | Tons Produced | AuEq Oz Sold |
| 2014 | * | 2,342 |
| Total | 34,976 | 20,078 |
* Gold sold in 2014 was from the mill stockpile remaining after mining ceased.
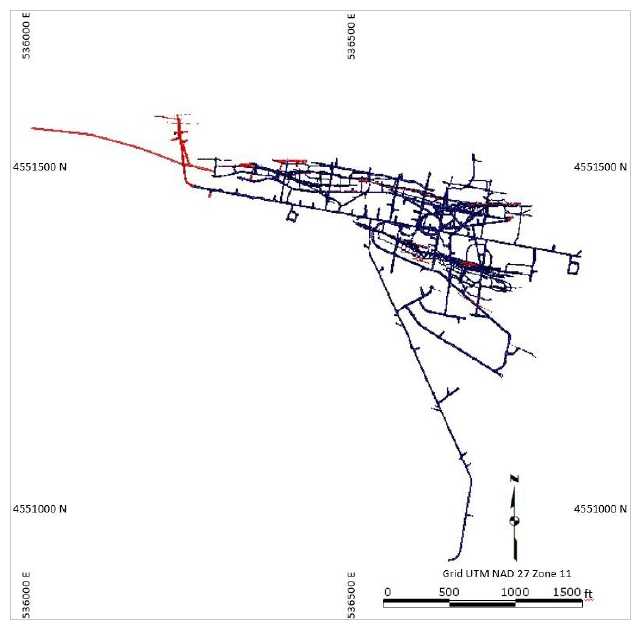
Figure 6-4: Underground Workings Completed Plan View
| 34 | P a g e |
|
|
Technical Report and Pre - Feasibility Study for the Hollister
Underground Mine | Title May 31, 2017 | Effective Date August 9, 2017 | Report Date |
| 7 | Geological Setting and Mineralization |
Portions of this section are drawn largely from the TR on the Update of the Mineral Resource and Mineral Reserve Estimates for the Hollister Gold Mine (Oelofse, et al., 2011).
| 7.1 | Regional Overview |
Northeast Nevada has a complex history of sedimentation, volcanic and igneous activity, as well as structural deformation dating from the early Cambrian to the Cenozoic. The region’s rock units can be divided into four broad periods: Cambrian through Devonian (miogeoclinal and eugeoclinal sedimentary rocks); Mississippian through Permian (foreland basin sedimentary rocks); Late Triassic through Cretaceous (intrusive units comprised of intermediate composition stocks, sills and dikes); and Tertiary mafic to felsic intrusive and volcanic rocks.
Compressional tectonism associated with the Late Devonian to Early Mississippian Antler Orogeny resulted in large-scale, eastward thrusting of western-facies eugeoclinal rocks (siliclastic) over eastern facies miogeoclinal units (shelf carbonates) along the Roberts Mountains thrust fault system. The leading edge of the over-riding thrust plate formed the emergent Antler Highland, from which coarse, siliclastic erosional sediments, from the upper plate, were shed eastwards into the adjacent foreland basin during the Middle Mississippian to Early Pennsylvanian period. This was followed by deposition of shelf carbonate and clastic sequences during the Late Pennsylvanian to Permian period, which deposits overlay both eastern and western facies rocks with angular discordance.
Regional terminology refers to the three lithotectonic sequences outlined as lower plate, upper plate and overlap assemblages. Gold deposits occur in all three assemblages, but approximately 90% of the region’s gold production and resources are hosted in lower plate, silty carbonate units, as depicted in Figure 7.1. The high-grade veins of the Mine are hosted in upper plate siliclastic rocks.
Regional-scale plutonic activity occurred across the entire Great Basin of Nevada from the Late Triassic to the Cretaceous. Most of the intrusive bodies are intermediate in composition and tend to be stock size, although dikes and sills of this age are also common. Many of the intrusive bodies have a strong spatial, if not genetic, relationship to several of the region’s precious metal districts and deposits.
The Tertiary was a period of emerging extensional tectonism with extensive igneous activity and high crustal heat flow. Widespread volcanic activity began in the region at approximately 43 to 41 Ma, during the late Eocene epoch, when ash flow tuffs and lacustrine deposits were laid down on the Paleozoic and Mesozoic basement. Tertiary intrusive activity in the region resulted in the emplacement of dikes, sills and stocks of intermediate to mafic composition, with ages that cluster around 38 to 43 Ma (late Eocene/early Oligocene epoch) and 14 to 17 Ma (Miocene epoch). For the Hollister region in general, the most prominent period of volcanic activity is interpreted to have started around 17 Ma (i.e. during the Miocene epoch), when mafic-dominated flows and lesser felsic pyroclastics erupted. Later eruptions produced more felsic-dominated, bimodal volcanic rocks. Disseminated, low grade mineralization styles developed in the Miocene tuff sequence at the Mine and was mined in open pits.
The NNR represents a period of erosion or non-deposition that is probably associated with extension caused by the accretion of an allocthonous (foreign) tectonic crustal block and the North American Plate, during the Antler Orogeny, as earlier outlined. The event is interpreted to have induced higher crustal temperatures and pressures that produced numerous hot springs along the suture zone. Several episodes of post-collision, sub-surface magmatism are known to also have occurred, during which hot springs activity brought dissolved minerals towards surface. Minerals, including gold and silver, were precipitated along open fissures and shear zones that today are recognized as epithermal gold veins and disseminated gold mineralization.
| 35 | P a g e |
|
|
Technical Report and Pre - Feasibility Study for the Hollister
Underground Mine | Title May 31, 2017 | Effective Date August 9, 2017 | Report Date |
The Midas Mine epithermal vein deposit lies 14 miles northwest of the Mine on this same trend. The high-grade portion of this low-sulfidation deposit is of similar style to the Hollister veins. The Midas Mine is hosted by Tertiary rhyolitic flows and pyroclastic units of similar age to the Tertiary rhyolites at the Mine (15.0-15.5 Ma), although the Valmy Formation basement is over 2,000 feet deep beneath the Midas veins. Broadly speaking, the mineralization style that occurs in veins and disseminations at Hollister is typical of other epithermal deposits in north-central Nevada. The style was defined by John (2001) as type 2 low-sulfidation, with most of these deposits forming at 14 to 16 Ma. Other examples of this style are the high-grade deposits of Midas and Sleeper, as well as Mule Canyon and Buckskin-National. Both Midas and Buckskin have average grades over 1 opt gold, and the other two deposits locally contain similar grades. Gold:Silver ratios are high, from 1:1 to 1:10, and base-metal contents are low. The quartz veins show colloform banding. Gold is typically associated with Ag selenides and adularia plus bladed calcite. The bladed calcite is commonly psuedomorphed latter to quartz. The deposits within the NNR, including Hollister, all formed over an even narrower interval of 15.0 to 15.5 Ma, closely related in time to the eruption of their volcanic host rocks, although Hollister is the only deposit currently known with significant veins within the prevolcanic basement rocks (Hedenquist, 2014).
Error! Reference source not found. is a plan map of the NNR province showing the position of Miocene epithermal gold deposits in relation to northerly trending rift strands (thick blue lines), and the position of calderas to the north that define the trace of the Yellowstone hotspot. Double arrows are extensional directions implied by vein geometries and kinematic indicators at epithermal deposits in the region.
| 36 | P a g e |
|
|
Technical Report and Pre - Feasibility Study for the Hollister
Underground Mine | Title May 31, 2017 | Effective Date August 9, 2017 | Report Date |
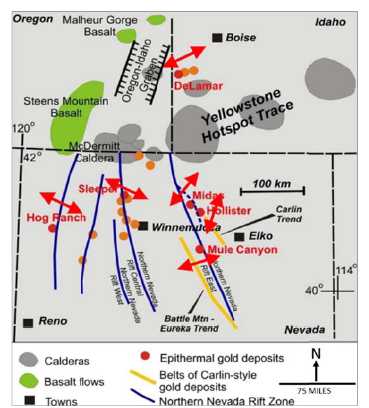
Figure 7-1: Plan Map of the NNR Province4
| 7.2 |
Local Geology |
The Mine is located along the NNR, a major, north-northwest to south-southeast trending structural feature that extends for at least 298 miles, from south-central Nevada to the Oregon-Nevada border. The Mine is on trend with the north-western end of the Carlin Trend, which is approximately five miles wide and 40 miles long.
The gold mineralization found at the Mine has been dated to 15.23 +/- 0.05 Ma, based on 40/39 argon adularia ages, related to the Miocene period of magmatic activity associated with the Northern Nevada Rift (Leavitt et al., 2000). The main pulse of gold mineralization on the Carlin Trend has been dated at about 38 Ma, which is coeval with late Eocene/early Oligocene magmatism.
Tertiary volcanic rocks cover most of the Mine area as shown in Figure 7-2. Ordovician Vinini Formation rocks are exposed in the eastern part of the area and in the open pits. All older rocks may be overlain by Pliocene and younger alluvium and colluvium.

____________________
4Source: Rhys, 2014
| 37 | P a g e |
|
|
Technical Report and Pre - Feasibility Study for the Hollister
Underground Mine | Title May 31, 2017 | Effective Date August 9, 2017 | Report Date |
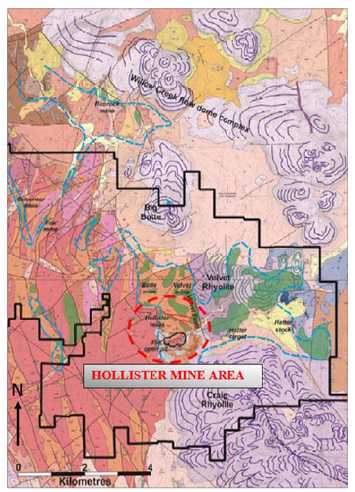
Figure 7-2: Geology of the Mine Area5
| 7.3 |
Property Geology |
Ordovician siliclastic rocks of the Vinini Formation host the epithermal gold veins found at the Mine. Tertiary volcanic rocks unconformably overlie the Vinini Formation. The Tertiary sequence hosted the disseminated gold deposit extracted by historic open pit workings (1990-1992).
The Tertiary sequence may be divided into two major groups. The Upper Group comprises a heterolithic series of tuffs, breccias and epiclastic sediments overlain by rhyolite flows. Tuffs and flows of intermediate to mafic composition define the lower limit of the Upper Group. The Lower Group is a more tuffaceous unit. Felsic ash fall tuffs occur locally at the base of the Lower Group. The base of the Lower Group is in an angular unconformity between the Tertiary sequence and the Vinini Formation.
At the base of the Lower Group, above the angular unconformity,, more felsic ash fall tuffs locally occur.
The Vinini Formation represents the oldest rocks that are exposed on Mine property. In the Mine area, the formation comprises repeating, coarsening-upwards sequences of orthoquartzite, muddy quartzite, siltite, and bedded to laminated argillite. Minor calcareous siltstones and sandstones comprise some of the fine grained facies. The sequence also includes more than 49 feet thick units of massive orthoquartzite, interbedded with thick sequences of alternating, relatively thinly bedded siltite and argillite, although occurrences of thinly interbedded quartzite, siltite and argillite are also common. The Vinini Formation may be weakly metamorphosed to sub-greenschist, prehnite-pumpellyite facies. Only the most incompetent and clay-rich sedimentary rocks develop a weak, bedding-parallel foliation surface. Most of the lithologies lack a significant penetrative fabric.
____________________
5Annotated from Wallace (2003)
| 38 | P a g e |
|
|
Technical Report and Pre - Feasibility Study for the Hollister
Underground Mine | Title May 31, 2017 | Effective Date August 9, 2017 | Report Date |
A geology map of the Mine area is shown in Figure 7-3, while Figure 7-4 and Figure 7-5 respectively reference geologic map units and stratigraphy.
|
|
| Figure 7-3: Geologic Map of the Mine and Near Mine Area. |
|
Intrusive rocks seldom crop-out on the Hollister property. The majority of the information about the type and distribution of the known intrusions (Hatter Stock and discordant dikes and sills) has been derived from reverse circulation drill cuttings or diamond drill core (Oelofse, et al., 2011). |
|
The Hatter Stock is a sub-cropping, intrusive body with estimated sub-surface dimensions of approximately 6,000 feet in the north-south direction and 3,500 feet in the east-west direction. At depth, it appears to plunge to the south and west at approximately 70 degrees. It has been potassium-argon dated at approximately 43 Ma. Two intrusive phases have been observed in drill core. The unaltered intrusive phases are: |
| 39 | P a g e |
|
|
Technical Report and Pre - Feasibility Study for the Hollister
Underground Mine | Title May 31, 2017 | Effective Date August 9, 2017 | Report Date |
| • |
A quartz-feldspar-biotite porphyry, which is granodioritic in composition and forms the bulk of the Hatter stock (quartz, biotite and plagioclase are the principal identifiable phenocryst phases, hornblende is present, but subordinate, and the groundmass is typically pale grey to pink and may contain significant primary potassium feldspar); and |
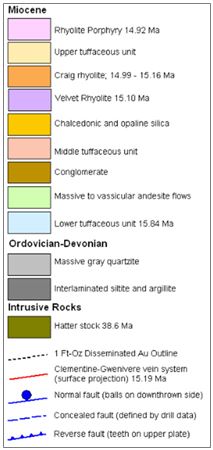 Figure 7-4: Geologic Map Units |
|
| • |
A melano-phase of quartz-feldspar-biotite porphyry, expressions of which are most commonly present near the stock margins (variations in the percentage of biotite and hornblende introduce a color shift too darker green-black intrusive phases and the contacts between melano and more leucocratic phases are often gradational). |
||
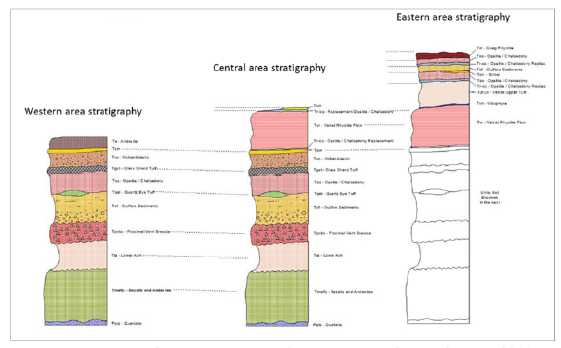
Figure 7-5: Mine Area Stratigraphy Variations from West to East (Source: Calloway, 2011a)
| 7.4 |
Structural Setting |
The Vinini Formation is affected by folding and thrusting that is pre-Tertiary in age. Three types of fold have been identified:
| • |
Intra-formational folds are developed where incompetent argillite beds are intercalated between competent quartzite units (they probably developed in a deep-sea environment, near the time of deposition); | |
| • |
Northwest-southeast trending and southwest verging, overturned folds that are traceable in the outcropping Ordovician rocks in the extreme east central portions of the property (cross-section data suggests that they are also intra-formational); and |
| 40 | P a g e |
|
|
Technical Report and Pre - Feasibility Study for the Hollister
Underground Mine | Title May 31, 2017 | Effective Date August 9, 2017 | Report Date |
| • |
An apparent anticlinal arch with an axis that trends north-northeast to south-southwest (the Hollister Arch) that may have developed primarily from erosional processes prior to volcanism, thereby establishing a pre-Eocene topographic high. |
As shown in Figure 7-6, a group of near-vertical faults and fissures that trend west-northwest to east-west host the epithermal gold veins found at the Mine. The amount of displacement across these faults is small, and their strike continuity varies between one hundred to several thousand feet. While these structures might penetrate the lower section of Tertiary volcanic rocks, it appears that most of the structures are pre-Tertiary in age (the Eocene rocks at the Mine have experienced extremely limited extensional or compressional tectonic histories, delineation of this very weak structural history is further complicated, or obscured, by the presence of two on-lapping unconformable stratigraphic relations).
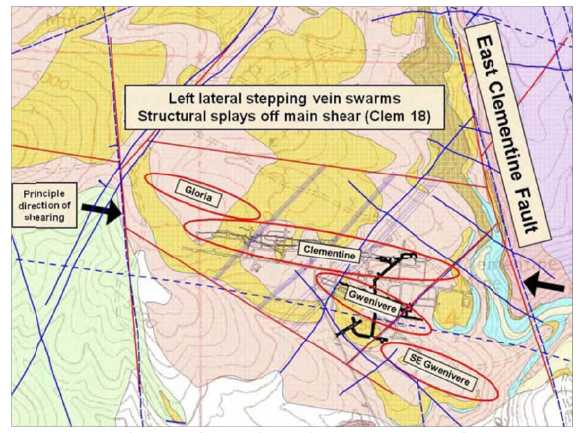
Figure 7-6: Idealized Structural Setting of the Mine Epithermal Vein Systems
A second set of faults that trend northwest to southeast and intersect the Tertiary volcanic rocks. They also appear to intersect the mineralized veins, at depth. A third group of faults, which trends north-northwest to south-southeast, outcrops elsewhere in Hollister District, but they are not well-exposed in the local Mine area. The third group of faults might be related to a regional trend.
The youngest set of faults trend northeast to southwest and are exposed in the mine area. Recent underground mapping has indicated formation of these structures (or at least reactivation) during the gold mineralizing period. The maximum offsets along these faults are approximately 150 to 200 feet with downthrows to the northwest and possibly left-lateral movements.
| 41 | P a g e |
|
|
Technical Report and Pre - Feasibility Study for the Hollister
Underground Mine | Title May 31, 2017 | Effective Date August 9, 2017 | Report Date |
| 7.5 |
Alteration Lithology |
The primary lithologies outlined have strongly been affected locally by hydrothermal hot spring fluids generated by the Miocene volcanic activity: a series of resistant chalcedonic ledges cover large areas of Mine area; and chalcedonic replacement and opaline sinter bodies occupy at least three stratigraphic positions (they are most likely stratigraphically controlled replacement bodies with lesser sinter deposits that have formed at or near the surface at the base of the vadose zone).
As depicted in Figure 7-7, the distribution of these rocks is interpreted as, in large part, a function of the distribution of permissive, host stratigraphy and the position of the paleo-water table. The silica bodies in the property area may be grouped as follows:
| • |
Massive, sucrosic chalcedonic silica - light cream to off-white siliceous ledges show little internal textures or evidence of a protolith; | |
|
| ||
| • |
Lamellar banded chalcedonic/opaline silica bodies; | |
|
| ||
| • |
Vuggy open space breccias, chalcedonic silica lined with minor clay cavities that may represent the locus of a primary hydrothermal explosion breccia; | |
|
| ||
| • |
Silicified conglomerates - a sequence of rocks with multiple clast types and pervasive matrix silicification directly on-laps the Ordovician Vinini Formation in the eastern map area; and | |
|
| ||
| • |
Chalcedonic bodies with residual quartz eyes: silicified quartz porphyritic tuffaceous rocks occur across the eastern map area. |
| 42 | P a g e |
|
|
Technical Report and Pre - Feasibility Study for the Hollister
Underground Mine | Title May 31, 2017 | Effective Date August 9, 2017 | Report Date |
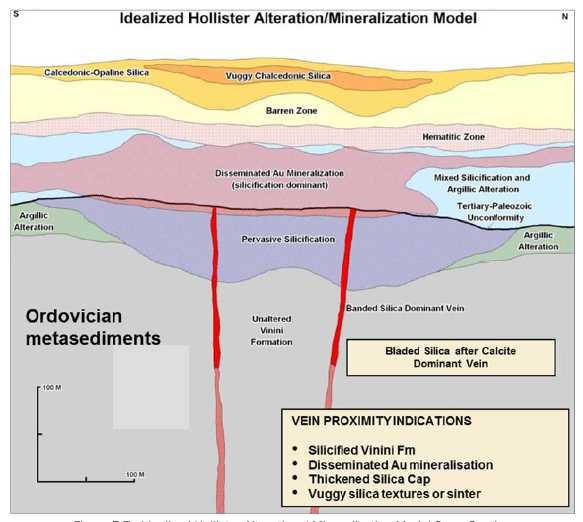
Figure 7-7: Idealized Hollister Alteration / Mineralization Model Cross-Section.
| 7.6 |
Mineralization |
In the Mine area, exploration and mining has been focused on three types of mineralization:
| • |
Mercury in laterally extensive near-surface replacement silica zones and more localized sinter deposits, principally in the middle tuff unit; | |
|
| ||
| • |
Disseminated gold in the middle and lower tuff units, andesite, and the Ordovician Vinini Formation beneath the hot spring mercury deposits; and | |
|
| ||
| • |
Deeper high-grade gold-silver quartz-adularia veins and fracture zones in the Vinini Formation. |
The near-surface mercury and disseminated gold deposits are connected vertically, and oxygen isotope data suggest that the veins represent feeders for at least part of the near-surface mineralization. Other similar low-sulfidation epithermal deposits in the region include Midas, Fire Creek, Buckhorn, and Mule Canyon.
| 43 | P a g e |
|
|
Technical Report and Pre - Feasibility Study for the Hollister
Underground Mine | Title May 31, 2017 | Effective Date August 9, 2017 | Report Date |
| 7.6.1 |
Near-surface Mercury and Silica Deposits |
Hot spring-related silicification produced surface sinters, silicified bodies beneath the sinters, and widespread, generally bedding-parallel, silicification in volcanic and sedimentary rocks. Cinnabar is the only ore mineral in these silica-rich deposits, and it is intergrown with chalcedony and opal (Wallace, 2003). All of the principal areas of known gold mineralization in the Mine area are associated with these silicified areas, occurring beneath them in underlying Tertiary or Paleozoic rocks at various depths below the principal silicified horizons.
Sinters are exposed at several mercury mines and prospects, such as the Butte #1 mine and a small prospect approximately 0.6 miles northwest of the Mine. The sinters grade downward into massive to vuggy silicified tuffs that contain hypogene kaolinite, jarosite, apatite, and alunite (Bartlett et al., 1991).
| 7.6.2 |
Disseminated gold deposits |
Gold in the Mine orebody and in gold-bearing zones beneath the nearby Velvet and Clementine mercury mines is disseminated in the middle and lower tuff units and in an andesite. The lower tuff unit beneath the andesite is the main host rock at Hollister for disseminated mineralization. The deposit also occurs at a major facies interface, where lobes of basaltic andesite that extend from the southwest interbed with tuffs to the east, tapering north-easterly in the area of the deposit, and likely exerting a combination of both permeability-porosity control and chemical control on the position of mineralization (Rhys, 2014). Within the open pits, structural control to mineralization is secondary to stratigraphic control.
The open pit at the Mine exposes both oxidized and supergene parts of the orebody. Most of the tuffaceous rocks have been oxidized, and primary sulfides are preserved in parts of the andesite, the lower tuff unit, and in the Vinini Formation. Drill-core samples from the sulfide zone show that electrum and pyrite are the primary ore minerals, and adularia, quartz, and chalcedony are the major gangue minerals (Deng, 1991). Quartz veins in the Miocene rocks are uncommon and usually small.
| 7.6.3 |
High-grade vein deposits |
Veins at the Mine contain the bulk of the high-grade (greater than 0.3 opt Au) mineralization known within the property. The principal veins, Clementine and Gwenivere, comprise semi-continuous vein systems with internal ore shoots, and local echelon steps or splays. The veins in mineralized areas typically range from 0.5 to 2.0 feet in width, but locally can be more than 5.0 feet in width. The veins are almost entirely hosted below the Tertiary-Ordovician contact. Veins trend west-northwest with steep dips and define a vein system over a strike length of more than 2,000 feet. Overall Ag:Au ratios vary within the vein system, generally increase downward, as is common in many epithermal districts.
Most of the high grade vein intercepts are characterized by banded textures produced by alternating silica and clay minerals, by alternating gray and black bands related to varying sulfide or selenide content, by varying silica grain sizes and textures, or by various combinations of the above. Visible electrum, where present, is concentrated in specific bands. Major banded veins also commonly include silicified fault gouge and breccia, suspended wall rock inclusions and medial zones of bladed quartz after calcite.
The Hollister veins are narrow but long in strike length with ore in shallow plunging oreshoots which developed between 300 and 500 feet below the Ordovician-Miocene unconformity. The veins are dominantly extensional in character and show no significant displacement of the host stratigraphy across them. Miocene extensional west-northwest trending faults in the Vinini Formation are the primary control on vein mineralization.
| 44 | P a g e |
|
|
Technical Report and Pre - Feasibility Study for the Hollister
Underground Mine | Title May 31, 2017 | Effective Date August 9, 2017 | Report Date |
Vein style is typical of low sulphidation epithermal veins and is closely comparable in mineralogy and texture to vein systems developed at the Midas deposit to the north, as well as other Miocene aged epithermal vein system in the NNR (Rhys, 2014). Metallic species in the veins include pyrite, marcasite, Ag-selenides and minor base metal sulphides (including chalcopyrite, sphalerite). Ag-bearing phases, as determined by petrographic studies by Larson (1998) and Peppard (2002), are dominated by naumannite, with lesser acanthite, aguilarite, tetrahedrite, jalpaite, stromeyerite, cerargyrite, cervellite, native silver and uytenbogaardtite in decreasing abundance. Au is present mainly in electrum (Larson, 1998). Late Fe-Mn carbonate, barite and fluorite are locally present, the former two often in late voids and vugs.
The Clementine vein, the most continuous and longest vein, was the source of approximately half of the gold produced during underground mining to-date. The Gwenivere vein system contributed approximately 35% to gold production. Other veins that mainly surround the eastern Gwenivere vein, and parts of the Gloria vein in western portions of the mine, contributed the remaining portions of the Au-Ag mineralization. Oreshoots in the principal veins are developed for up to 600 feet below the Tertiary-Ordovician contact principally within the Paleozoic sequence. The Gwenivere Vein has been defined for roughly 700 feet along strike, 300 feet down dip, and is typically 0.5 to 2.0 feet wide, with local segments reaching 5.0 feet wide. The Clementine Vein has been defined roughly 500 feet along strike, 600 feet down dip, and is typically 0.5 to 2.0 feet wide. The Gloria Vein has been defined roughly 200 feet along strike, 100 feet down dip, and is typically 0.5 to 2.0 feet wide. Veins generally have a moderate degree of continuity, with the best grades occurring in ore shoots.
Figure 7-8 is a plan view map showing distribution of the principal veins in the Hollister underground mine. The plan highlights in red, vein distribution on 5050 Level. Underground workings are shown in colors black for 5050 Level, green for 5190 Level, and blue for 5278 Level.
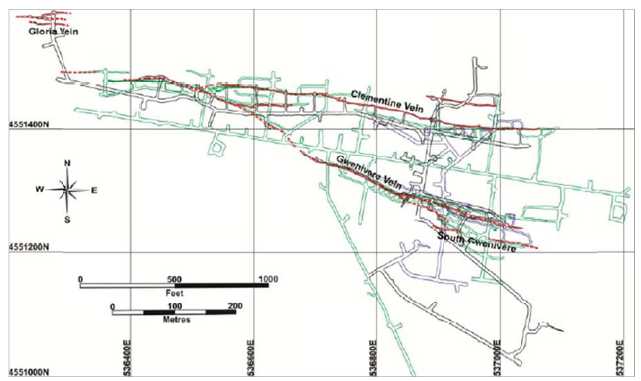
Figure 7-8: Plan View - Distribution of the Principal Veins in the Mine
Within the individual veins, patterns in overall style, structure, texture and mineralogy define variations in structural style, zonation with respect to oreshoots and character of individual veins.
| 45 | P a g e |
|
|
Technical Report and Pre - Feasibility Study for the Hollister
Underground Mine | Title May 31, 2017 | Effective Date August 9, 2017 | Report Date |
While veins are largely confined to the Paleozoic sequence, in eastern parts of the Clementine vein and in parts of the eastern Gwenivere vein, mineralization extended locally as chalcedonic veinlets and disseminated styles into the overlying Tertiary sequence. This mineralization was initially termed "blanket style" in reference to its potential to extend as stratabound zones along the contact area, but mining and definition drilling indicates that it may also be partly structurally controlled as planar or lenticular zones at the upward extensions of the eastern parts of the vein systems. Mineralization in this zone was typically oxidized, comprising a tabular, steeply dipping, and west-northwest trending zone of silicification of the tuff sequence with elevated disseminated Fe-oxide content probably after pyrite.
| 46 | P a g e |
|
|
Technical Report and Pre - Feasibility Study for the Hollister
Underground Mine | Title May 31, 2017 | Effective Date August 9, 2017 | Report Date |
| 8 |
Deposit Types |
Northern Nevada has a large number of very significant gold deposits. These are primarily related to the Carlin, Getchell, Battle Mountain – Cortez, and Northern Nevada Rift (NNR) trends. Two of these trends may be projected through or adjacent to the Mine area. The styles of mineralization relating to these trends include the Epithermal Low Sulfidation mineralization along the NNR and the Carlin-type mineralization.
| 8.1 |
Epithermal Low Sulfidation |
An example is the Midas Mine which is located approximately 14 miles to the northwest of the Mine. Midas Mine is located along the eastern part of the north-northwest trending NNR and also along the northwestern projection of the Carlin Trend (Ponce and Glen, 2002).

Figure 8-1: Geologic Map, Section and Stratigraphic Column of the Midas Deposit6
____________________
6Modified from Goldstrand and Schmidt (2000).
| 47 | P a g e |
|
|
Technical Report and Pre - Feasibility Study for the Hollister
Underground Mine | Title May 31, 2017 | Effective Date August 9, 2017 | Report Date |
Host rocks at Midas are a mid-Miocene age bimodal sequence of felsic ashflow tuffites, volcaniclastic sediments, and mafic dikes and sills. The gold-silver veins in the Midas District were age dated at 15.4 Ma (Leavitt, et. al., 2004). These quartz-adularia-electrum-naumannite veins in the Midas Mine were deposited in fault zones that trend NNW (Colorado Grande Vein, the largest at Midas) and also NW-SE (Gold Crown vein system), reflecting the influence of both structural regimes. The Midas vein systems exhibit propylitic and argillic wallrock alteration, along with silicification associated with the ore veining. Siliceous sinters have been reported throughout the Ivanhoe and Silver Cloud Districts, overlying the main mineralized structures, and these bodies are nearly devoid of pathfinder geochemical anomalies, except for anomalous mercury. Argillized, oxidized rock is found at the surface above the Midas veins, along the trace of the controlling fault structures. The mineralization is associated with crustiform and colloform banded quartz veins, some of which show very high gold grades. Geochemistry of these veins is unusual and distinctive. Ag:Au ratios are commonly 10:15 and are highly enriched in selenium, with the mineral naumannite (a silver selenide) which occurs along with electrum and other gold, silver, and lead selenide minerals. This suggests selenium may be the best pathfinder element with which to recognize epithermal low sulfidation gold-silver deposits. Fluorine, copper, tellurium, arsenic, lead, and mercury are other useful pathfinder elements for these deposits, per Goldstrand and Schmidt (2000) and Redfern and Abbott (2002).
Fluid inclusion studies indicate that the veins formed at a vertical depth of approximately 1,300 feet below the paleosurface. Gold mineralization is tightly confined to high-angle fault zones at Midas. The gold-silica vein systems at Midas extend for approximately 1,600 feet below the general level of paleo-“boiling”.
| 8.2 |
Carlin-type |
Carlin-type gold deposits (CTGDs) in northern Nevada collectively constitute the second largest concentration of gold in the world, with over 6,000 tons of gold defined to date.
The deposits account for approximately 6% of annual worldwide production, making the United States the fourth largest producer of gold. CTGDs are hydrothermal replacement bodies hosted primarily by lower Palaeozoic miogeoclinal carbonate rocks, in which gold occurs in solid solution or as sub-micrometer particles in pyrite. The large Carlin-type deposits in northern Nevada (Figure 8-2), which are Eocene in age, share many common geologic and hydrothermal features and ore controls that lead to exploration criteria tied to processes critical for ore formation (Muntean et al., 2011).
Common geologic and hydrothermal features of large CTGDs in Nevada:
| • |
Occur in clusters centered on structural culminations along long-lived fault zones likely linked to underlying basement rift structures, preferentially hosted by carbonate-bearing rocks within or adjacent to structures in the lower plate of a regional thrust; | |
| • |
Similar hydrothermal alteration and ore paragenesis: dissolution and silicification of carbonate, sulfidation of Fe in the rock, formation of Au-bearing arsenian pyrite, and late open-space deposition of orpiment, realgar, and stibnite. Ore-stage veins are lacking; | |
| • |
Ore signature is Au-Tl-As-Hg-Sb-(Te), with low Ag and base metals; | |
| • |
Ore-fluids that ranged from ~356 to 464°F, of low salinity (mostly ≤6 wt% NaCl eq.) and CO2-bearing (less than 4 mol %); illite and local kaolinite indicate acidic fluids; and | |
| • |
Formation depths mainly less than 1.2 miles. Lack of mineral or elemental zoning at the scale of less than 1.3-2.6 miles laterally and less than 1.2 miles vertically suggests minor temperature gradients. No known coeval porphyry copper, skarn or distal Ag-Pb-Zn mineralization in the clusters of CTGDs. |
| 48 | P a g e |
|
|
Technical Report and Pre - Feasibility Study for the Hollister
Underground Mine | Title May 31, 2017 | Effective Date August 9, 2017 | Report Date |
![]()
Figure 8-2: Locations of Carlin Type Gold Deposits in Northern Nevada
| 49 | P a g e |
|
|
Technical Report and Pre - Feasibility Study for the Hollister
Underground Mine | Title May 31, 2017 | Effective Date August 9, 2017 | Report Date |
| 9 |
Exploration |
The Mine and region has had varied exploration work by many individuals and groups over the years. Predominately the interest has been in opalite, mercury, gold, and silver. Historically, the general area has been an important source of opalite, which Native Americans quarried for tools and weapons. The following exploration history is largely summarized from the 2011 NI 43-101 by Oelofse et al.
The presence of gold mineralization was recognized early-on, but it was not considered to be economically viable due to the limitations of the then-available extraction technologies and the prevailing gold prices. Exploration and mining activity was instead first directed at mercury, starting in 1915. According to the available records, there has been no local mercury production since 1943.
Exploration for mercury and other metals resumed in the early 1960s. Few details are available on exploration in the 1960s and into the 1990s. Geological, geochemical and geophysical exploration techniques along with considerable drilling reportedly have been employed.
The inventory of geophysical data over the property is extensive. As part of Newmont’s exploration program, gravity data for 426 stations was acquired from 1990 to 1993. Mafic surface flows along the western edge of the survey produce elevated values, as well as Paleozoic outcrops on the east side. Airborne instruments measured magnetic data in a survey flown in 1992 with Newmont’s in-house system using 650-foot spaced east-west lines and an instrument height of 230 feet. Airborne radiometric data were acquired in the same survey. Newmont also collected extensive surface geochemical samples throughout the property and district.
GBG pursued a program of geophysical, geochemical and geological surveys over a large part of Mine from 1997 to 2002. Various remote sensing technologies, including ground and airborne magnetics, induced polarization, seismic and three-dimensional resistivity surveys were carried out. The results at the time were found not to be directly usable to delineate the gold veins. The results of soil and rock chip geochemistry also showed no trends that directly reflect the distribution of veins in the Ordovician rocks.
Hecla carried out engineering and permitting work in furtherance of an underground exploration program from 2002 to 2007. This included the start of a decline and underground development to access the high-grade gold/silver Clementine and Gwenivere vein systems for purposes of underground exploration drilling and obtaining a bulk sample of mineralized material for metallurgical processing. High-grade gold and silver values, over substantial widths, were reported from sampling of the vein material encountered during the underground development.
An extensive controlled source audio magneto-telluric (CSAMT) survey was completed over the central portion of the Hollister Property in 2006. The known vein systems within the Paleozoic basement are manifested in the CSAMT data as high resistivity zones in the over lying volcanic rock package. These higher resistivities are likely the results of silica being injected into the volcanic rocks from below. In addition, the resistivity zones are elongate along the vein trend, which is inferred to be controlled by large scale deep seated structures.
In 2007, GBG regained full control of the Mine. At this time, an additional underground infill diamond drilling was planned and started along with mine development. The main focus of GBG’s exploration activity was in support of underground exploration, development and trial mining at the Mine. Surface exploration work and drilling was started again in 2007. This included drilling of the Hatter Graben Vein System.
The Hatter Graben Vein System is composed of numerous subparallel mineralized veins, vein stockworks and breccia zones over a drilled area of greater than 1,600 feet. The drilled vertical extent of mineralization (greater than 0.1 opt gold) is over 1,300 feet. The overall extent of the vein system is undefined by current drilling.
| 50 | P a g e |
|
|
Technical Report and Pre - Feasibility Study for the Hollister
Underground Mine | Title May 31, 2017 | Effective Date August 9, 2017 | Report Date |
| 9.1 |
Hatter Graben Vein System |
The Hatter vein system is approximately 2,500 feet east of the Mine’s underground development. The Hatter vein zone is down dropped approximately 800 feet lower than the current Mine resource.
Gold and silver mineralization is dominantly in the Ordovician quartzites, siltites and argillites. Higher grades are associated with banded quartz veins from inches to feet in width. Extensive zones of quartz vein stockworks and quartz matrix breccias also contain significant mineralization. Gold and silver bearing veins and stockworks have also been drilled in overlying felsic rocks.
Rock conditions for potential underground mining appear favorable. There is a hornfelsed alteration halo relating to intrusive rocks encountered in drilling. The quartzitic sedimentary rock has been subject to recrystallization and fracture development. Physically the rocks tend to be harder and more competent than what was originally mined in the main Hollister Mine.
A historic drilling program was conducted in 2008.Klondex intends to infill the widely spaced drill holes from the surface to develop a Mineral Resource estimate (October 11, 2016 Klondex press release - Klondex Provides Exploration Update at Hollister Reports Promising Intercepts at the Gloria Zone).
Hatter Graben Historical Drilling Highlights:
| • | H8-264: 0.54 opt Au over 7.8 feet, (est. true width of 5.5 feet) | |
| • | H8-269: 1.77 opt Au over 2.1 feet (est. true width of 1.5 feet) | |
| • | H8-274: 7.8 opt Au over 1.4 feet (est. true width of 1.0 feet) | |
| • | H8-281: 1.4 opt Au over 2.3 feet (est. true width of 1.3 feet) | |
| • | H8-285: 0.47 opt Au over 12.5 feet (est. true width of 8.8 feet) |
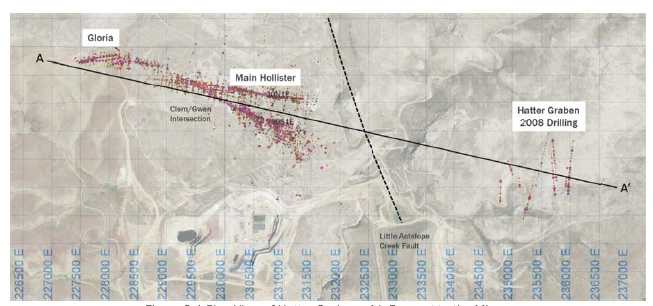
Figure 9.1 Plan View of Hatter Graben with Respect to the Mine
| 51 | P a g e |
|
|
Technical Report and Pre - Feasibility Study for the Hollister
Underground Mine | Title May 31, 2017 | Effective Date August 9, 2017 | Report Date |
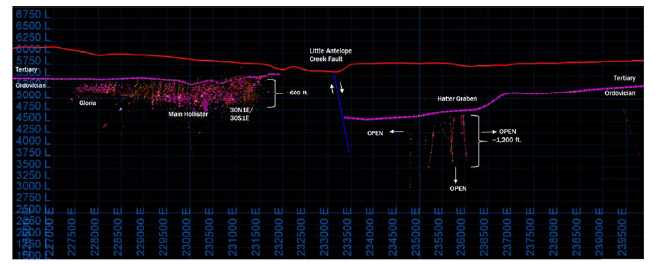
Figure 9.2 A to A’ Long Section View
GBG initiated an extensive gravity survey that was completed over the central portion of the Mine in 2009. The objective was to delineate structures, lithologies and alteration related to veining in the Paleozoic basement. The correlation of gravity with basement topography was noted. Geophysical interpretations developed the concept of an elevated hornfels rim around intrusive rocks. This was later demonstrated by drilling. The lowest basement elevations beneath the interpreted intrusion correlate with the lowest gravity.
GBG’s exploration from April 2009 to June 2010 largely focused on underground drilling of vein extensions along strike and at depth, as well as new targets.
Carlin did extensive data compilation starting in 2013. Property-wide mapping and a structural review was completed in 2014. Vein characterization and spectroscopy alteration was completed for the different Ordovician hosted veins and the Tertiary volcanic units above vein zones. Mercury data was leveled for regional soils and used with regional and local structural interpretations.
| 52 | P a g e |
|
|
Technical Report and Pre - Feasibility Study for the Hollister
Underground Mine | Title May 31, 2017 | Effective Date August 9, 2017 | Report Date |
| 10 |
Drilling |
Klondex completed thirty nine (39) underground core holes totaling 14,656 feet which are included in the current mineral resource estimate. Records from previous operators in the Mine area indicate that 2,863 drill holes were completed totaling over 1.4 million feet of drilling.
Table 10-1: Drilling Summary by Company
| Company | Period | Number of Drill Holes | Total Footage |
| US Steel | 1981 - 1985 | 224 | 75,332 |
| Touchstone/Galactic | 1987 - 1992 | 812 | 426,944 |
| Newmont | 1992 - 1995 | 75 | 60,740 |
| GBG | 9/1997 - 7/2002 | 219 | 214,800 |
| Hecla | 9/2002 - 4/2007 | 212 | 114,403 |
| GBG | 5/2007 - 3/2009 | 183 | 129,213 |
| GBG | 4/2009 - 5/2013 | 905 | 349,309 |
| Carlin | 5/2013 - 11/2014 | 138 | 36,230 |
| Carlin | 11/2014 - 11/2015 | 56 | 27,941 |
| Klondex | 11/2016 – 3/2017 | 39 | 14,941 |
| Total | 1981 – 3/2017 | 2,863 | 1,449,568 |
The distribution of drill holes throughout the Mine area is shown in the following figures:
| • |
Figure 10-1: Drill Hole Collar Map of Mine Area. Color and shape coded are surface collars, pre- Klondex underground collars and Klondex underground collars; | |
| • |
Figure 10-2: Drill Hole Collar Map of Mine - UG Workings & Gloria Vein System. Color and shape coded are surface collars, pre-Klondex underground collars and Klondex underground collars; and | |
| • |
Figure 10-3: Drill Hole Collar & Trace Map of a Portion of Mine - UG Workings & Gloria Vein System. Color and shape coded are surface collars, Carlin underground collars and Klondex underground collars that are included in the resource calculation. |
| 53 | P a g e |
|
|
Technical Report and Pre - Feasibility Study for the Hollister
Underground Mine | Title May 31, 2017 | Effective Date August 9, 2017 | Report Date |

Figure 10-2: Drill Hole Collar Map of Mine - UG Workings & Gloria Vein System Area
| 54 | P a g e |
|
|
Technical Report and Pre - Feasibility Study for the Hollister
Underground Mine | Title May 31, 2017 | Effective Date August 9, 2017 | Report Date |
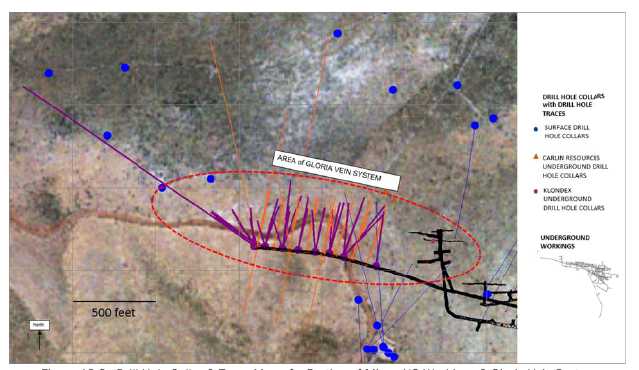
Figure 10-3: Drill Hole Collar & Trace Map of a Portion of Mine - UG Workings & Gloria Vein System
| 55 | P a g e |
|
|
Technical Report and Pre - Feasibility Study for the Hollister
Underground Mine | Title May 31, 2017 | Effective Date August 9, 2017 | Report Date |
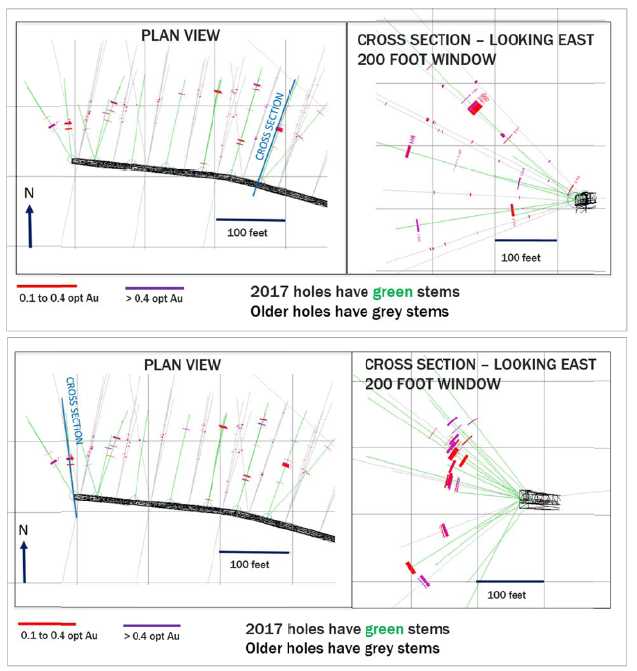
Figure 10-4: Significant Assay Intervals Encountered Drilling the Gloria Vein System Plan Views & Cross Sections
| 10.1 |
Drilling Procedure |
For information on drilling programs pre-2016, the reader is referred to the technical report authored by Nowak and Yuhasz (2016).
| 56 | P a g e |
|
|
Technical Report and Pre - Feasibility Study for the Hollister
Underground Mine | Title May 31, 2017 | Effective Date August 9, 2017 | Report Date |
| 10.1.1 |
Klondex Drilling 2016 - 2017 |
Klondex completed 39 underground core holes totaling 14,656 feet from the Gloria West underground development in 2016 and 2017. HQ (2.5 -inch diameter) core holes were drilled from eight drill stations within the development drift. Results from these holes are included in the current mineral resource estimate. The holes were drilled by American Drilling Corporation using a Diamec U-8 and a Hagby drill rig.
Collar locations were established by a Klondex surveyor. The orientations of the drill holes were set using a Reflex TN14 north-seeking gyro azimuth alignment system. The down hole orientation was measured using a Reflex EZ-Trac multi-shot instrument. Commonly, drill holes orientations were surveyed at 50-foot intervals.
The core was placed in core boxes at the drill rig by drilling personnel. All box markings and core run blocks were placed on and in the core box by drilling personnel. Core was transported to the surface by drilling personnel. Klondex employees transported the core from the mine to a secure office and core logging facility in Winnemucca where the geotechnical, geological logging, core photographing and sampling was completed.
| 10.2 |
Core Recovery |
Core recovery was typically very good throughout the Klondex program. The average recovery for Klondex underground drilling was 96%. The percent core recovery has been calculated by measuring the material between blocks per drilled interval, dividing the measured recovery by the run footage and multiplying that value by one hundred.
| 10.3 |
Logging Protocol |
Core is logged at a secure core logging facility in Winnemucca, Nevada. Once received, it is placed on conveyor rollers and inspected to insure all boxes are present and checked for correct labelling.
The core is washed and processed, and detailed log data is entered into an acQuire4 (acQuire) data software system using standardized interpretive codes to record data such as lithology, alteration, and structure. The interpretive codes used are part of a standardized system developed by Klondex.
Geotechnical data including recovery and rock quality data (RQD) is logged. Geological data is logged. Sample breaks are recorded and marked using plastic core chocks for indicating measured intervals in core boxes. The core is photographed. The core is positioned so that sample break markings, geologic features and vein/structure orientations are optimally captured in the photograph.
After completion of all logging activities, the core is sampled. For veins, stockworks or any potential mineralized interval, the whole-core is sampled and placed into bags with a labeled sample number and a matching numbered tag. The core boxes (with remaining core) are palletized, covered and moved to the secured core storage area at the Winnemucca facility.
The sampled (bagged) core is prepared for shipment to the assay lab. Quality Assurance Quality Control (QAQC) sample insertion points are selected by the geologist at a rate of approximately one standard or blank every ten samples. The sample bags and QAQC inserts are labeled with the sample IDs and stored until they can be transferred to the assay lab.
The samples are transferred to the possession of the assay lab for geochemical analysis.
| 57 | P a g e |
|
|
Technical Report and Pre - Feasibility Study for the Hollister
Underground Mine | Title May 31, 2017 | Effective Date August 9, 2017 | Report Date |
| 10.4 |
Results of drilling conducted by or on behalf of Klondex |
Table 10-2 shows Gloria Vein System underground drilling highlights for holes drilled in 2016 and 2017. Intercepts shown are not true widths. The orientation of the vein system is generally striking approximately azimuth 080 and dipping vertical to 80 degrees to the north.
Table 10-2: Drilling Highlights (2016 and 2017)
|
Hole ID |
Azi | Incl | TD | From (ft) |
To (ft) | Length (ft) | Au Grade (opt) |
Ag Grade (opt) |
| G16-001 | 8 | 48 | 500 | No Significant Intercept | ||||
| G16-009 | 5 | 50 | 500 | 201.0 | 203.5 | 2.5 | 0.328 | 9.80 |
| and | 298.5 | 299.5 | 1.0 | 0.233 | 2.75 | |||
| G16-010 | 20 | 42 | 447 | 218.0 | 222.2 | 4.2 | 0.592 | 11.40 |
| and | 236.0 | 237.0 | 1.0 | 0.140 | 0.84 | |||
| and | 314.4 | 315.7 | 1.3 | 0.136 | 1.33 | |||
| G16-011 | 20 | 26 | 429 | 186.7 | 187.5 | 0.8 | 0.319 | 3.10 |
| and | 187.5 | 189.0 | 1.5 | 0.642 | 2.00 | |||
| and | 274.0 | 275.0 | 1.0 | 0.319 | 4.20 | |||
| G16-013 | 12 | 38 | 402 | 332.5 | 333.5 | 1.0 | 0.185 | 2.30 |
| and | 95.5 | 97.0 | 1.5 | 0.264 | 0.70 | |||
| and | 222.7 | 227.6 | 4.9 | 1.521 | 1.62 | |||
| and | 343.2 | 344.7 | 1.5 | 1.896 | 9.00 | |||
| G16-014 | 16 | 16 | 330 | 93.0 | 95.6 | 2.6 | 0.924 | 0.67 |
| and | 199.0 | 199.5 | 0.5 | 0.428 | 0.62 | |||
| and | 276.0 | 277.0 | 1.0 | 0.856 | 2.06 | |||
| and | 277.0 | 279.0 | 2.0 | 0.128 | 0.95 | |||
| and | 279.0 | 281.0 | 2.0 | 0.478 | 3.20 | |||
| G16-015 | 16 | -8 | 290 | 101.0 | 105.0 | 4.0 | 0.183 | 0.29 |
| and | 254.5 | 257.5 | 3.0 | 0.830 | 1.90 | |||
| G16-016 | 5 | -36 | 334 | No Significant Intercept | ||||
| G16-017 | 355 | 53 | 437 | No Significant Intercept | ||||
| G16-018 | 11 | 30 | 310 | 25.0 | 26.4 | 1.4 | 0.132 | 0.38 |
| and | 260.3 | 263.0 | 2.7 | 0.146 | 0.67 | |||
| and | 269.0 | 273.3 | 4.3 | 1.173 | 12.70 | |||
| G16-019 | 12 | 14 | 283 | 234.5 | 238.5 | 4.0 | 0.159 | 0.96 |
| G16-020 | 11 | -13 | 273 | 236.5 | 238.7 | 2.2 | 0.193 | 0.26 |
| and | 238.7 | 240.6 | 1.9 | 0.589 | 1.78 | |||
| G16-021 | 13 | 33 | 304 | 158.8 | 160.0 | 1.2 | 0.196 | 1.47 |
| and | 253.6 | 255.2 | 1.6 | 2.174 | 28.40 | |||
| and | 262.5 | 262.8 | 0.3 | 1.349 | 1.65 | |||
| and | 265.3 | 265.7 | 0.4 | 8.377 | 33.90 | |||
| G16-022 | 11 | 23 | 350 | No Significant Intercept |
| 58 | P a g e |
|
|
Technical Report and Pre - Feasibility Study for the Hollister
Underground Mine | Title May 31, 2017 | Effective Date August 9, 2017 | Report Date |
| Hole ID | Azi | Incl | TD | From (ft) |
To (ft) | Length (ft) | Au Grade (opt) |
Ag Grade (opt) |
| G16-023 | 11 | 12 | 262 | 217.0 | 219.0 | 2.0 | 0.564 | 11.40 |
| G16-024 | 342 | 54 | 352 | 100.0 | 102.5 | 2.5 | 0.293 | 0.11 |
| and | 201.4 | 202.3 | 0.9 | 0.233 | 0.76 | |||
| and | 252.3 | 253.5 | 1.2 | 0.298 | 24.50 | |||
| G16-025 | 9 | 35 | 312 | 201.7 | 202.5 | 0.8 | 1.062 | 20.50 |
| G16-026 | 9 | 5 | 420 | 157.0 | 158.5 | 1.5 | 0.110 | 0.24 |
| G16-027 | 9 | -13 | 229 | 183.0 | 185.3 | 2.3 | 0.698 | 2.07 |
| G16-028 | 9 | -13 | 252 | No Significant Intercept | ||||
| G16-029 | 19 | -14 | 478 | No Significant Intercept | ||||
| G16-030 | 344 | 52 | 270 | 146.8 | 148.0 | 1.2 | 1.692 | 1.44 |
| G16-031 | 13 | 40 | 232 | 178.5 | 181.0 | 2.5 | 1.659 | 15.20 |
| G16-032 | 18 | 21 | 272 | 124.0 | 125.0 | 1.0 | 0.194 | 0.30 |
| and | 155.0 | 157.0 | 2.0 | 2.049 | 3.50 | |||
| G16-033 | 18 | -23 | 240 | 183.5 | 185.8 | 2.3 | 0.231 | 0.76 |
| and | 185.8 | 189.0 | 3.2 | 0.548 | 1.82 | |||
| G16-034 | 14 | -47 | 450 | No Significant Intercept | ||||
| G16-035 | 344 | 46 | 202 | 118.7 | 120.2 | 1.5 | 0.354 | 0.42 |
| and | 141.7 | 142.5 | 0.8 | 0.447 | 52.70 | |||
| G16-036 | 344 | -31 | 200 | 194.0 | 200.0 | 6.0 | 0.239 | 0.38 |
| G16-037 | 320 | 46 | 251 | 161.5 | 164.3 | 2.8 | 2.368 | 53.50 |
| G16-038 | 320 | -31 | 400 | No Significant Intercept | ||||
| G16-039 | 320 | -55 | 450 | No Significant Intercept | ||||
| G16-040 | 300 | 5 | 1700 | No Significant Intercept | ||||
| G17-041 | 330 | 15 | 250 | 113.0 | 116.7 | 3.7 | 0.144 | 0.34 |
| and | 116.7 | 118.0 | 1.3 | 12.557 | 22.10 | |||
| G17-042 | 309 | 21 | 351 | 135.5 | 138.5 | 3.0 | 0.250 | 0.58 |
| and | 138.5 | 140.2 | 1.7 | 3.301 | 8.70 | |||
| G17-043 | 354 | 33 | 277 | 101.7 | 106.0 | 4.3 | 0.100 | 0.32 |
| and | 119.0 | 125.0 | 6.0 | 0.246 | 7.00 | |||
| and | 125.0 | 126.0 | 1.0 | 2.973 | 20.10 | |||
| G17-044 | 320 | 35 | 320 | 119.5 | 120.0 | 0.5 | 0.440 | 0.55 |
| and | 131.5 | 135.5 | 4.0 | 3.704 | 34.30 | |||
| and | 169.6 | 170.2 | 0.6 | 0.274 | 0.39 | |||
| G17-045 | 309 | 36 | 351 | 152.5 | 156.5 | 4.0 | 2.016 | 110.60 |
| G17-046 | 39 | 27 | 448 | 188.9 | 190.5 | 1.6 | 0.132 | 0.15 |
| and | 290.0 | 291.0 | 1.0 | 0.354 | 4.70 |
| 59 | P a g e |
|
|
Technical Report and Pre - Feasibility Study for the Hollister
Underground Mine | Title May 31, 2017 | Effective Date August 9, 2017 | Report Date |
| Hole ID | Azi | Incl | TD | From (ft) |
To (ft) | Length (ft) | Au Grade (opt) | Ag Grade (opt) |
| G17-047 | 42 | 42 | 498 | No Significant Intercept |
| 60 | P a g e |
|
|
Technical Report and Pre - Feasibility Study for the Hollister
Underground Mine | Title May 31, 2017 | Effective Date August 9, 2017 | Report Date |
| 11 |
Sample Preparation, Analyses and Security |
This update to the resource estimation at Hollister follows from GBG 2011 technical report on the previous update to the Mine’s resource and reserve (Oelofse et al., 2011) and incorporates new assay data from samples collected since January, 2011. Much of the information relevant to historic collection methods, sample analysis, and QAQC for samples collected between the previous update and May 2016 are provided in SRK Consulting’s 2016 Independent Technical Report for the Hollister Gold Project (Nowak and Yuhasu, 2016).
Of the three sample types incorporated into the current update to the resource—surface drilling, underground drilling, and channel samples, Nowak and Yuhasu, 2016 address underground and surface drilling in detail, but not channel sampling. Therefore, regarding samples collected up to May 2016, the following section of this report only provides new information pertaining to channel samples and references Nowak and Yuhasz, 2016 for information pertaining to drilling samples. No surface drilling has been done by Klondex (May 2016 to present), but Klondex-era underground drilling and channel sampling are addressed in full.
| 11.1 |
Sample Collection Methods |
| 11.1.1 |
Pre-Klondex (2001 to 2016) |
| 11.1.1.1 |
Great Basin Gold Limited Underground Drilling (2011 to 2013) |
Historical sampling methodology of underground and surface drilling done at Hollister under the ownership of GBG was previously documented by Nowak and Yuhasz, 2016, and is listed below:
| • | Drill core logging, sampling and data compilation work was performed by the GBG geologists; | |
| • | During sample mark-up, sample bags were tagged with sample tags corresponding to the relevant intervals; | |
| • | The core was split using a mechanical splitter along the core axis for each marked sample interval and placed into the labelled canvas sample bag; | |
| • | The remaining half was placed in the core box. Whole core was sampled only where significant visual vein mineralization was observed; | |
| • | Sample information was marked on the core boxes with sample tags and flagging tape detailing relevant depths and numbers; | |
| • | Sample logs were generated and stored at the GBG Battle Mountain facility and later the Winnemucca facility; | |
| • | Drill core sampling procedure included five-foot samples throughout the Tertiary units, selectively sampled based on geologically defined intervals below the Tertiary-Ordovician contact; and | |
| • | All drilling, logging and sampling were supervised by either the GBG geological or engineering staff members. |
Between 2007 and 2013, the samples were transported by the GBG personnel to the secure facility at Winnemucca. Individual sample bags were placed into wooden boxes for transport and stored in a locked enclosure prior to being transported either by a GBG truck or by the laboratory’s truck for delivery to laboratory’s sample preparation facility.
| 61 | P a g e |
|
|
Technical Report and Pre - Feasibility Study for the Hollister
Underground Mine | Title May 31, 2017 | Effective Date August 9, 2017 | Report Date |
| 11.1.1.2 |
Carlin Underground and Surface Drilling |
Historical sampling methodology of all drilling conducted at Hollister during ownership by Carlin was previously documented (Nowak and Yuhasz, 2016), and is listed below:
| • | For underground diamond drilling, the same procedures were used as those established by GBG between 2002 and 2013 (outlined above); | |
| • | For surface diamond drilling, all core was placed in a core box at the drill rig by drilling personnel. All box markings and core run blocks were placed on and in the core box by drilling personnel; | |
| • | Core was transported by Carlin employees from the rig to the Winnemucca facility where the geotechnical and geological logging was completed. Sample intervals and core cutting lines along core axis were marked. Sample intervals were typically five-foot long but were sometimes adjusted for lithological or redox boundaries; | |
| • | Once the core was logged for geological and geotechnical data, it was photographed and marked for sampling, the core was boxed up and numerically stacked on pallets. The pallets were picked up by American Assay Laboratories (AAL) personnel who signed chain of custody and submittal forms before leaving the logging facility; | |
| • | AAL completed all sample preparation, assaying and specific gravity analyses. A digital copy of the sample sheet was sent to AAL via e-mail to assist with sample bag labelling and to alleviate any errors; | |
| • | One side of the core was sampled into a labelled bag and the other half remained in the box; | |
| • | Labeled specific gravity samples were removed from the sample before cutting core along the axis; | |
| • | Pre-determined Carlin quality controls samples were inserted into the sample stream at the AAL cutting facility. Visits to the lab were frequently/periodically carried out to ensure correct cutting and sampling procedures were completed; and | |
| • | After cutting and bagging, the samples were delivered to the laboratory’s preparation and analytical area and treated as described for the 2002 to 2013 methods. |
| 11.1.1.3 |
Great Basin Gold Limited Channel Sampling (20111 to 2013) |
The methods for channel sampling used by GBG during this time period were the same as those described by Oelofse et al., 2011, which is listed below:
| • | The sample protocols in terms of size, quality, control from any contamination, dispatch are in line with industry standards; and | |
| • | Drift channel face samples were collected by sampling from left to right, starting with the hanging wall/foot wall, vein material and then hanging wall/foot wall material to the right of the sampled vein. Sample sizes were up to a maximum of 11 pounds. Grade control channel samples at stope faces and backs are chipped across the width of a vein of interest and/or a waste portion of a face, rib or back. The sampler collects between a minimum of five pounds and a maximum of 15 pounds of material. |
| 62 | P a g e |
|
|
Technical Report and Pre - Feasibility Study for the Hollister
Underground Mine | Title May 31, 2017 | Effective Date August 9, 2017 | Report Date |
| 11.1.2 |
Klondex (2016 – present) |
| 11.1.2.1 |
Klondex Underground Drilling Samples |
After completion of all logging activities, the core is sampled. For veins, stockworks, or any potential mineralized interval, the whole-core is sampled and placed into bags with a labeled sample number and a matching numbered tag. The core boxes (with remaining core) were palletized, covered and moved to the secured core storage area at the Winnemucca facility.
The sampled core is prepared for shipment to the assay lab. QAQC sample insertion points are selected by the geologist at a rate of approximately one standard or blank every ten samples. The sample bags and QAQC inserts were labeled with the sample IDs and stored until they could be transferred to the assay lab.
The samples are picked up from the secure Winnemucca facility by and transferred to the possession of the assay lab.
| 11.1.2.2 |
Klondex Channel Samples |
Daily underground channel sampling is performed and managed by ore control geologists under the supervision of the Senior Mine Geologist. Samples are chipped across the width of the vein and waste portion of a face, rib or back. Channel samples are regularly collected for all rounds taken on day-shift; whereas ribs and back samples are only taken as ore control geologists saw fit. The geologist collected at least five pounds, but no more than 15 pounds of material per sample. Cloth sample bags are marked with sample numbers clearly written on the exterior of the bag. Sample tags were torn from pages in sample booklets with corresponding ID numbers and inserted in each sample bag. All sample data (location details, date, QA/QC insertions) were recorded in the sample tag booklet for each sample collected and that information was summarized in sample record books kept on surface. In all cases, standards and blanks were randomly inserted into the sample stream at a frequency of no less than one per every 20 samples, as well as following potentially high-grade samples as determined by the geologist on-duty. The ratio of QAQC insertions had been 1:40, but Klondex changed its policy to 1:20 shortly after the Mine acquisition in January of 2017.
| 11.2 |
Samples Preparation, Assaying, and Analytical Procedures |
| 11.2.1 |
Pre-Klondex (2011 to 2013) |
| 11.2.1.1 |
Great Basin Gold Limited Underground and Surface Drilling Samples (2011 to 2013) |
Historic assay methods were previously documented by Nowak and Yuhasz, 2016. The QAQC verifications from that document, referenced in section 3.1 of this report, group the drilling from this time period with drilling done since 2006. Therefore, the following selected references regarding analytical procedures (Nowak and Yuhasz, 2016) encompass the same timeframe, which overlaps in part with information provided by Oelofse et al., 2011:
Several analytical laboratories were used during the 1997 to 2013 period. The labs include:
| • | ALS Chemex’s (ALS) laboratory in Sparks, Nevada (ISO 9001-2000 accredited) carried out sample preparation and gold and silver assays between 1997 and 2001, and between 2008 and 2009, and in 2013; |
| 63 | P a g e |
|
|
Technical Report and Pre - Feasibility Study for the Hollister
Underground Mine | Title May 31, 2017 | Effective Date August 9, 2017 | Report Date |
| • |
Oelofse et al., 2011 also state that a proportion of underground samples prepared by ALS Elko were sent to ALS North Vancouver between 2007 and 2011: “From April 2007 the Company’s underground diamond drill hole samples, as well as all channel samples, were prepared at ALS Chemex’s laboratory at Elko, NV (ISO 9001-2000 accredited). Pulverized assay samples were transported by truck from Elko to ALS Chemex’s laboratory at Unit 7, 994 Glendale Avenue, Sparks, NV (ISO 9001-2000 accredited), from where all the regular/mainstream samples were forwarded by air express to ALS Chemexs main laboratory at 212 Brooksbank Avenue, North Vancouver, B.C. (ISO 17025 [Standards Council of Canada] and ISO 9001-2000 accredited) for assay analysis.” | |
| • |
AAL in Sparks, Nevada (ISO/IEC 17025 accredited) completed standard reference sample homogenization, splitting and round-robin; | |
| • |
Pinnacle Analytical Laboratory (Pinnacle) Lovelock, Nevada, prepared and analyzed several exploration and development underground drill holes, as well as underground channel samples between 2009 and 2013; and | |
| • |
BSI Inspectorate Sparks, NV, (ISO 9001: 2000 accredited) prepared and analyzed samples for gold, silver and metallic assays, between 2006 and 2014, and multi-element analyzes in 2007 and 2008. |
| 11.2.1.2 |
Carlin Underground and Surface Drilling Samples (2013 to 2016) |
Historical assay methods were previously documented (Nowak and Yuhasz, 2016), and are summarized in Figure 11-1 below:
| 64 | P a g e |
|
|
Technical Report and Pre - Feasibility Study for the Hollister
Underground Mine | Title May 31, 2017 | Effective Date August 9, 2017 | Report Date |

Figure 11-1: Analytical Flow Chart for 2013 to 2015 Tertiary Drilling Program
All samples were processed at the American Assay Lab (AAL) of Reno, Nevada. (Nowak and Yuhasz, 2016).
| 11.2.1.3 |
Great Basin Gold Limited Channel Samples (2011 to 2013) |
As stated above, GBG underground channel samples were performed by Pinnacle in Lovelock, Nevada. Sample preparation consisted of drying and jaw-crushing the entire sample to 90% passing 10-mesh and then pulverizing a 300-gram sub-sample to 90% passing 150-mesh using a large capacity ring and puck pulverizer. A 30-gram charge was fire assayed, and all metal determinations were by gravimetric finish. Vein samples analyzed by standard fire assay were re-assayed using metallic screen procedures if precious metal content was determined to be elevated.
| 65 | P a g e |
|
|
Technical Report and Pre - Feasibility Study for the Hollister
Underground Mine | Title May 31, 2017 | Effective Date August 9, 2017 | Report Date |
| 11.2.2 |
Klondex (2016 – current) |
| 11.2.2.1 |
Klondex Underground Drilling Samples |
AAL laboratory carried out sample preparation and gold and silver assays. ISO/IEC 17025:2005 specifies the general requirements for the competence to carry out tests and/or calibrations, including sampling. It covers testing and calibration performed using standard methods, non-standard methods, and laboratory-developed methods.
ALS laboratory (ISO/IEC 17025:2005 accredited) performed check assays on select sample pulps that were delivered to them directly from AAL.
If needed, samples are dried for 6 to 12 hours at 310°F depending upon the condition of the sample. Samples are crushed using a Jaw crusher to 90% passing at 6-mesh followed by crushing using a roll crusher to 90% passing at 10-mesh. A Jones riffle splitter is used to collect sample splits of between approximately 500- to 1,000-gram. Sample splits are pulverized in ring/disk pulverizers to 90% passing at 150-mesh size in diameter, homogenized, and packaged for analysis. A 30-gram aliquot of sample is analyzed for Au using the FA-PB30-ICP method and for Ag using the two acid D2A method (2A=HCL/HN03). If Au is greater than 5.0 parts per million (ppm) or Ag is greater than 200 ppm, a 30-gram aliquot of the sample is re-assayed with a gravimetric finish.
Table 11-1: Summary of Klondex Drilling Assay Methods
| Element | Au | Au | Ag | Ag |
| Method | FA-PB30-ICP | GRAVAu30 | Two Acid, D2A | GravAg30 |
| Units | Ounce per Ton | Ounce per Ton | Ounce per Ton | Ounce per Ton |
| Detection Lower | 0.0001 | 0.003 | 0.006 | 0.2 |
| Detection Upper | 2.9167 | 2.9167 | 2.9167 | 2.9167 |
| Gravity if over limits | GRAVAu30 greater than 5 ppm Au | GRAVAu30 greater than 200 ppm Au |
| 11.2.2.2 |
Klondex Channel Samples |
Mine channel samples are sent to the nearby Midas Mine to be prepped and assayed by Klondex’s internal assay lab (Midas Lab). Once received, all samples are scanned into the Laboratory Information Management System (LIMS). Sample preparation for fire assay consisted of drying samples at 250 ºF and jaw-crushing the entire sample to 80% passing 10-mesh. Samples are blended and split through a Jones riffle splitter to 250 grams and pulverized to 85% passing 200-mesh. Coarse rejects are bagged and stored. For Au and Ag fire assays, 30-gram samples underwent a custom flux for oxide/sulfide matrix and received a gravimetric finish for metal determination. Lab QC CRM, blank, and analytical duplicates are inserted with each sample batch.
ALS also performed check assays on select sample pulps delivered from the Midas Lab.
| 66 | P a g e |
|
|
Technical Report and Pre - Feasibility Study for the Hollister
Underground Mine | Title May 31, 2017 | Effective Date August 9, 2017 | Report Date |
| 11.3 |
Quality Assurance and Quality Control |
| 11.3.1 |
Pre-Klondex (2006 to 2016) |
| 11.3.1.1 |
Great Basin Gold Limited and Carlin Underground Drilling (2006 to 2014) |
Nowak and Yuhasz, 2016 provide a summary of QAQC procedures and results with regard to all underground and surface drilling done at the Mine before its purchase by Klondex. The following summary describes a QAQC program that began with GBG from 2006 to May 2013 and was continued by Carlin from June 2013 through the end of 2014. These results overlap in part with the previous 2011 Hollister Technical Report (Oelofse et al., 2011).
There are a total of 27 different standards used over this period. Blanks and standards were inserted at approximately one for every 10 assays. There are no field duplicates. Pulp duplicates inserted by the labs were not considered QAQC data as they are not blind samples.
Table 11-2: Summary of Underground Drilling QAQC from 2006 through 2014
| Sampling Program | 2006 - 2014 | % |
| Sample Count | 23,809 | |
| Field Blanks | 1,584 | 7% |
| QC Standard Samples | 1,183 | 5% |
| Total QC Samples | 2,767 | 12.0% |
(Nowak and Yuhasz, 2016)
| 11.3.1.1.1 |
Blanks |
From Nowak and Yuhasz, 2016:
GBG considered a blank a failure if the result was greater than twice the detection limit whenever the blank did not follow a high grade vein sample. When the blank followed a high grade sample, it was considered a failure if the results exceeded 5-10% of the previous sample or twice the detection limit. When a blank failed, the 10 samples previous, and the 10 samples after the blank, were included in the assay rerun.
Carlin considered a blank a failure if the result was greater than five times the detection limit (0.015 g/t Au).
A total of 6% of the blanks failed for all the labs combined. ALS Van performed poorly for these analyses. Considering that there are so few samples from ALS Van, the failures are not considered relevant. All other labs performed acceptably. SRK Consulting, Inc. (SRK) established two thresholds for blank sample failures, 0.025 and 0.10 g/t for Au, depending on the lab detection limit.
| 67 | P a g e |
|
|
Technical Report and Pre - Feasibility Study for the Hollister
Underground Mine | Title May 31, 2017 | Effective Date August 9, 2017 | Report Date |
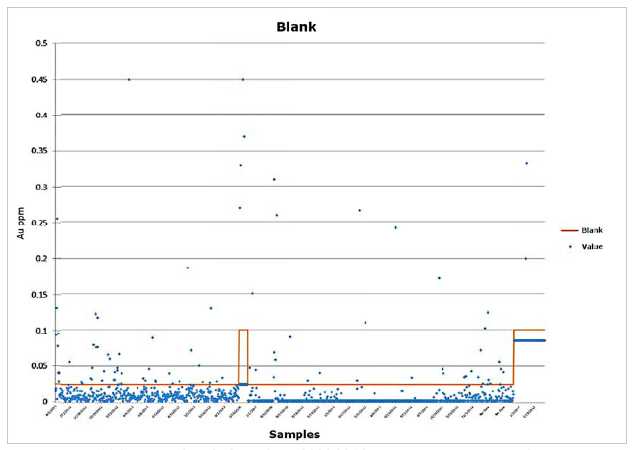
Figure 11-2: Results from GBG and Carlin 2006-2014 Underground Drilling Blank Samples
(Nowak and Yuhasz, 2016)
| 11.3.1.1.2 |
Standards |
From Nowak and Yuhasz, 2016:
Of the 27 standards, only seven have 50 or more samples. Only these seven standards are discussed here. QAQC samples from GBG and Carlin are presented together as there was no hiatus in the underground drilling program.
GBG considered a standard as a failure when the sample exceeded two standard deviations. When a standard failed, the 10 samples previous and the 10 samples after the failed standard, were included in the assay rerun.
Carlin considered a standard as a failure when the result was greater than three standard deviations, or when two consecutive standards were outside of two standard deviations. Samples surrounding the failed QAQC samples had limited reruns. Both the original and the rerun samples have been included in the QAQC analysis.
Overall, for three standards the percentage of assays outside ±3 standard deviations is quite low (CND-GS-4A, CND-GS-5C, CND-GS-5H). On the other hand, for the other four standards the percentage of failed assays is higher (CDN-CGS-15, CDN-GS-1D, CDN-GS-2B, and CDN-GS-5J).
| 68 | P a g e |
|
|
Technical Report and Pre - Feasibility Study for the Hollister
Underground Mine | Title May 31, 2017 | Effective Date August 9, 2017 | Report Date |
Table 11-3: Standards for GBG and Carlin 2006-2014 Underground Drilling
CDN Au Standards |
n |
n less
than -3σ |
n less
than -2σ |
n
greater than +2σ |
n
greater than +3σ |
n ⊄ 2σ (%) |
n ⊄ 3σ (%) |
| CDN-GS-15 | 199 | 5 | 12 | 32 | 15 | 22% | 10% |
| CDN-GS-1D | 169 | 5 | 10 | 35 | 16 | 27% | 12% |
| CDN-GS-2B | 199 | 15 | 26 | 26 | 14 | 26% | 15% |
| CDN-GS-4A | 131 | 3 | 9 | 7 | 3 | 12% | 5% |
| CDN-GS-5C | 56 | 1 | 8 | 2 | 1 | 18% | 4% |
| CDN-GS-5H | 62 | 5 | 12 | 1 | 0 | 21% | 8% |
| CDN-GS-5J | 50 | 2 | 5 | 5 | 4 | 20% | 12% |
| CDN Au Total | 866 | 36 | 34 | 108 | 53 | 22.0% | 10.0% |
(Nowak and Yuhasz, 2016)
| 11.3.1.2 |
Carlin Surface and Underground Drilling (2015) |
SRK reviewed Carlin QAQC results for the 2015 surface and underground drilling. A total of 2,701 samples were taken from 22 surface drill holes and 2,212 samples from 34 underground drill holes. The samples were sent to AAL for analysis. QAQC blanks, standards, and duplicate samples were introduced into the sample stream at approximately one in every ten samples for surface holes and one in 20 for underground holes.
Table 11-4: Summary of Carlin Surface Drilling QAQC from 2015
| Sampling Program | 2015 | % |
| Sample Count | 2,701 | |
| Field Blanks | 95 | 4% |
| QC Samples | 105 | 4% |
| CDN-GS-1M | 42 | |
| CDN-GS-3M | 13 | |
| CDN-GS-P4E | 50 | |
| Field Duplicates | 92 | 3% |
| Total QC Samples | 292 | 11.0% |
(Nowak and Yuhasz, 2016)
Table 11-5: Summary of Carlin Underground Drilling QAQC from 2015
| Sampling Program | 2015 | % |
| Sample Count | 2,212 | |
| Field Blanks | 274 | 12% |
| QC Samples | 169 | 7% |
| CDN-GS-22 | 81 | |
| CDN-GS-2Q | 24 | |
| CDN-GS-5H | 29 | |
| CDN-GS-6D | 21 | |
| Total QC Samples | 598 | 19.0% |
(Nowak and Yuhasz, 2016)
| 11.3.1.2.1 |
Blanks |
In 2015, Carlin submitted 95 blanks for surface drilling samples and 274 blanks for underground drilling samples for analysis. The blanks were a coarse landscaping marble and were inserted into the drill core sampling stream at the core logging facility. Blanks were considered failed when the result was greater than 0.025 g/t for gold, or five times greater than the analytical detection limit. No failed blanks were reported with surface drilling samples, but 7% of blanks assayed with underground drilling samples failed ((Nowak and Yuhasz, 2016).
| 69 | P a g e |
|
|
Technical Report and Pre - Feasibility Study for the Hollister
Underground Mine | Title May 31, 2017 | Effective Date August 9, 2017 | Report Date |
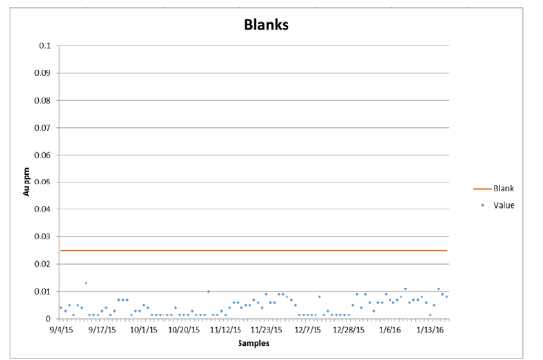
Figure 11-3: Results from Carlin 2015 Surface Drilling Blank Samples
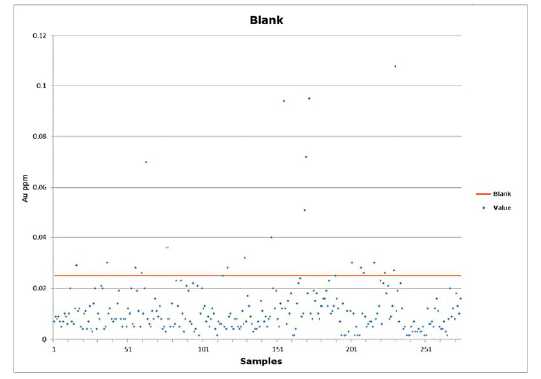
Figure11-4: Results from Carlin 2015 Underground Drilling Blank Samples
| 70 | P a g e |
|
Technical Report and Pre - Feasibility Study for the Hollister
Underground Mine | Title May 31, 2017 | Effective Date August 9, 2017 | Report Date |
| 11.3.1.2.2 | Standards |
In the Carlin 2015 surface drilling campaign, a total of four standards failed. All failed batches were rerun. The rerun assays supersede the original assays in the database.
Table 11-6: Standards for Carlin 2015 Surface Drilling
CDN Standards |
n |
n less
than - 3σ |
n less
than - 2σ |
n
greater than +2σ |
n
greater than +3σ |
n ⊄ 2σ (%) |
n ⊄ 3σ (%) |
| CDN-GS-1M | 42 | 0 | 0 | 3 | 0 | 7% | 0% |
| CDN-GS-3M | 13 | 0 | 0 | 3 | 0 | 23% | 0% |
| CDN-GS-P4E | 50 | 0 | 0 | 1 | 0 | 2% | 0% |
| Total | 105 | 0 | 0 | 7 | 0 | 7.0% | 0.0% |
(Nowak and Yuhasz, 2016)
Standards CDN-GS-2Q and CDN-GS-6D have no samples outside of three standard deviations from the expected value and perform well. Standard CDN-GS-22 preforms well and fails for 5% of the samples. Standard CDN-GS-6D failed for 14% of the samples and does not perform well but is considered acceptable. Overall, the standards’ performance were acceptable.
Table 11-7: Standards for Carlin 2015 Surface Drilling
CDN Standards |
n |
n less than -3σ |
n less than -2σ |
n
greater than +2σ |
n
greater than +3σ |
n ⊄ 2σ (%) |
n ⊄ 3σ (%) |
| CDN-GS-22 | 81 | 1 | 2 | 5 | 3 | 9% | 5% |
| CDN-GS-2Q | 24 | 0 | 1 | 2 | 0 | 13% | 0% |
| CDN-GS-5H | 29 | 0 | 1 | 0 | 0 | 3% | 0% |
| CDN-GS-6D | 21 | 2 | 4 | 1 | 1 | 24% | 14% |
| Total | 155 | 3 | 8 | 8 | 4 | 10.0% | 5.0% |
(Nowak and Yuhasz, 2016)
| 11.3.1.3 | Great Basin Gold Limited Channel Samples (2011 to 2013) |
Laboratory QAQC was monitored using coarse reject blanks and assay standards, as well as Pinnacle’s internal standards and blanks. Coarse blanks (barren rhyolite or landscape marble) and assay standards are inserted into the sample sequence as blind samples prior to submitting the samples to the laboratory.
For submittals that contained more than 10 samples, standards and blanks were alternated on every 10 samples, whereas for submittals that contained less than 10 samples, one QAQC sample of the sampler’s choosing was included somewhere in the submittal. Blank samples included enough material to be of a similar size to the previous sample. The type of standard was chosen by the sampler at random. Regularly spaced blind duplicates were included for every 100 samples submitted. If more than 25% of the QAQC samples failed within one submittal, the entire submittal was re-assayed.
Table 11-8: Summary of GBG Channel Sampling QAQC from 2011 to 2013
| Sampling Program | 2011 - 2013 | % |
| Sample Count | 14,898 | |
| Field Blanks | 595 | 3.99% |
| Internal Standards | 529 | 3.55% |
| HVS1 | 457 | 3.07% |
| HVS2 | 72 | 0.48% |
| Certified Standards | 273 | 1.83% |
| CDN-GS-11A | 1 | 0.01% |
| CDN-GS-14A | 7 | 0.05% |
| 71 | P a g e |
|
Technical Report and Pre - Feasibility Study for the Hollister
Underground Mine | Title May 31, 2017 | Effective Date August 9, 2017 | Report Date |
| Sampling Program | 2011 - 2013 | % |
| CDN-GS-15A | 33 | 0.22% |
| CDN-GS-20A | 9 | 0.06% |
| CDN-GS-30A | 26 | 0.17% |
| CDN-GS-4A | 2 | 0.01% |
| CDN-GS-5H | 50 | 0.34% |
| CDN-GS-5J | 45 | 0.30% |
| CDN-GS-7A | 42 | 0.28% |
| CDN-GS-7E | 58 | 0.39% |
| Total QC Samples | 1,397 | 9.38% |
(Nowak and Yuhasz, 2016)
| 11.3.1.3.1 | Blanks |
As with the drilling samples, GBG determined blank failures in one of two ways.
| • | For blanks not following a high grade vein sample, values greater than twice the detection limit for the assay method was considered failing; and | |
| • | For blanks that were inserted after a high grade vein sample, values that exceeded 5% of the previous sample or twice the detection limit, whichever was higher, were considered failures. |
With blank failures, the 10 samples previous and the 10 samples after the failed standard from the original submittal were included in the assay rerun. Re-assay samples were re-prepped from the coarse rejects and assayed using the same methods.
Table 11-9: Gold and Silver Blanks for GBG Channel Samples from 2011 to 2013
GBG Channels |
n |
n
greater than 2DL |
n
greater than 3DL |
% ⊄ 2DL |
% ⊄ 3DL |
| Au Blanks | 595 | 10 | 9 | 1.7% | 1.5% |
| Ag Blanks | 596 | 9 | 8 | 1.5% | 1.3% |
| 72 | P a g e |
|
Technical Report and Pre - Feasibility Study for the Hollister
Underground Mine | Title May 31, 2017 | Effective Date August 9, 2017 | Report Date |
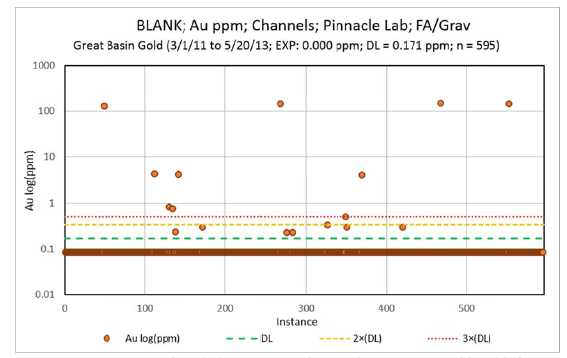
Figure 11-5: Results from GBG Underground Channel Sampling Blanks (2011-2013)
| 11.3.1.3. 2 | Standards |
As with the drilling samples, GBG considered a standard as a failure when the sample exceeded two standard deviations. As with blank failures, when a standard failed, the 10 samples previous and the 10 samples after the failed standard on the original submittal, were included in the assay rerun. These samples were re-assayed from the pulps using the same methods.
Table 11-10: Certified Standards for GBG Channel Samples Taken from 2011 to 2013
CDN Au Standards |
n |
n less
than - 3σ |
n less
than - 2σ |
n
greater than +2σ |
n
greater than +3σ |
n ⊄ 2σ (%) |
n ⊄ 3σ (%) |
| CDN-GS-11A | 1 | 0 | 0 | 0 | 0 | 0.0% | 0.0% |
| CDN-GS-4A | 2 | 0 | 1 | 0 | 0 | 50.0% | 0.0% |
| CDN-GS-14A | 7 | 0 | 1 | 0 | 0 | 14.3% | 0.0% |
| CDN-GS-20A | 9 | 1 | 1 | 1 | 0 | 22.2% | 11.1% |
| CDN-GS-30A | 26 | 1 | 4 | 2 | 2 | 23.1% | 11.5% |
| CDN-GS-15A | 33 | 4 | 13 | 3 | 1 | 48.5% | 15.2% |
| CDN-GS-5J | 45 | 4 | 6 | 5 | 2 | 24.4% | 13.3% |
| CDN-GS-7A | 42 | 0 | 1 | 5 | 0 | 14.3% | 0.0% |
| CDN-GS-5H | 50 | 3 | 4 | 3 | 0 | 14.0% | 6.0% |
| CDN-GS-7E | 58 | 2 | 3 | 3 | 1 | 10.3% | 5.2% |
| CDN Au Total | 273 | 15 | 34 | 22 | 6 | 20.5% | 7.7% |
Table 11-11: Internal Standards for GBG Channel Samples Taken from 2011 to 2013
GBG Au Standards |
n |
n less
than - 3σ |
n less
than - 2σ |
n
greater than +2σ |
n
greater than +3σ |
n ⊄ 2σ (%) |
n ⊄ 3σ (%) |
| HVS1 | 457 | 2 | 3 | 214 | 73 | 47.5% | 16.4% |
| 73 | P a g e |
|
Technical Report and Pre - Feasibility Study for the Hollister
Underground Mine | Title May 31, 2017 | Effective Date August 9, 2017 | Report Date |
GBG Au Standards |
n |
n less
than - 3σ |
n less
than - 2σ |
n
greater than +2σ |
n
greater than +3σ |
n ⊄ 2σ (%) |
n ⊄ 3σ (%) |
| HVS2 | 72 | 0 | 0 | 1 | 0 | 1.4% | 0.0% |
| GBG Au Total | 529 | 2 | 3 | 215 | 73 | 41.2% | 14.2% |
| 11.3.2 | Klondex (2016 to 2017) |
| 11.3.2.1 | Underground Drilling |
Klondex’s QAQC for underground drilling included 9.5% QC samples in the total sample population of 1,696. Blanks were an internally-sourced crushed homogenous blank material with Au and Ag values verified to be under detection limits of their respective assay methods before use as QC samples. All QC standards were certified reference material from CDN Laboratories (CDN Labs) in Delta, British Columbia. 5.2% of samples, 88 in total, were CDN Labs reference standards.
Table 11-12: Summary of Klondex Underground Drilling QAQC from 2016 to 2017
| Sampling Program | 2016 - 2017 | % |
| Sample Count | 1,696 | |
| Field Blanks | 73 | 4.3% |
| Certified Standards | 88 | 5.2% |
| Total QC Samples | 161 | 9.5% |
| 11.3.2.1.1 | Blanks |
Klondex QAQC protocol enforced hard failure limits for blank samples at greater than three times the detection limits for the assay method used for both Au and Ag, with the exception of samples immediately following high grade vein samples with Au concentrations exceeding 5.0 opt, in which case the blank hard failure was considered to be 0.01 Au opt.
Table 11-13: Gold and Silver Blanks Klondex Underground Drilling Samples Taken from 2016 to 2017
KDX Drilling |
n |
n
greater than 2DL |
n
greater than 3DL |
% ⊄ 2DL |
% ⊄ 3DL |
| Au Blanks | 72 | 26 | 8 | 36.1% | 11.1% |
| Ag Blanks | 73 | 4 | 1 | 5.5% | 1.4% |
Of the 73 blanks inserted into the sample population, eight blanks exceeded three times Au detection limits. There was one less than three times the detection limit Ag failure (Table 11-13). Figure 11-6 and Figure 11-7 show the results of all Au and Ag blank assay results, respectively.
| 74 | P a g e |
|
Technical Report and Pre - Feasibility Study for the Hollister
Underground Mine | Title May 31, 2017 | Effective Date August 9, 2017 | Report Date |
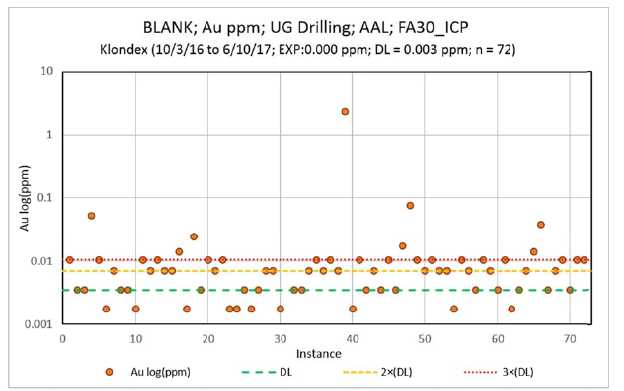
Figure 11-6: Results from Klondex’s Underground Drilling Blanks (2017) for Gold
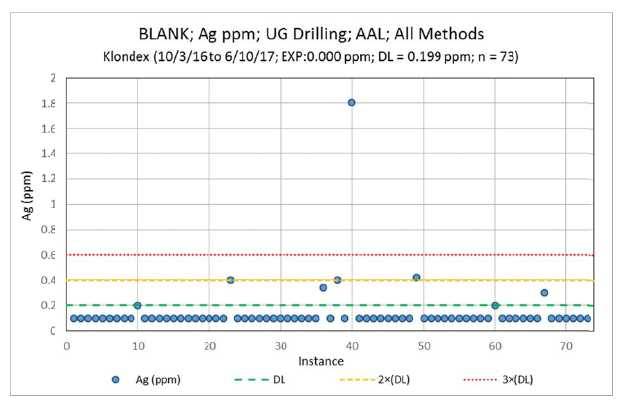
Figure 11-7: Results from Klondex’s Underground Drilling Blanks (2017) for Silver
| 75 | P a g e |
|
Technical Report and Pre - Feasibility Study for the Hollister
Underground Mine | Title May 31, 2017 | Effective Date August 9, 2017 | Report Date |
| 11.3.2.1. 2 | Standards |
Six certified reference standards and 88 samples in total were utilized in the QAQC procedures for Au assays.
A summary of all results is shown in Table 11-14. Of these samples, only two assay values, CDN-GS-1M and CDN-GS-P4E, were outside of ±3 standard deviations hard failure limit. Results for these standards are shown in Figure 11-8 and Figure 11-9. All other standards had zero hard failures. Results can be found in the Appendix A (Figures A16 & A17).
Table 11-14: Certified Gold Standards for Klondex Underground Drilling 2017
CDN Au Standards |
n |
n less than -3σ |
n less than -2σ |
n
greater than +2σ |
n
greater than +3σ |
n ⊄ 2σ (%) |
n ⊄ 3σ (%) |
| CDN-GS-5H | 3 | 0 | 0 | 1 | 0 | 33.3% | 0.0% |
| CDN-GS-2B | 4 | 0 | 0 | 0 | 0 | 0.0% | 0.0% |
| CDN-GS-3M | 11 | 0 | 0 | 0 | 0 | 0.0% | 0.0% |
| CDN-GS-P4E | 22 | 0 | 1 | 2 | 1 | 13.6% | 4.5% |
| CDN-GS-1M | 22 | 0 | 0 | 6 | 1 | 27.3% | 4.5% |
| CDN-GS-1P5D | 26 | 0 | 1 | 1 | 0 | 7.7% | 0.0% |
| CDN Au Totals | 88 | 0 | 2 | 10 | 2 | 13.6% | 2.3% |
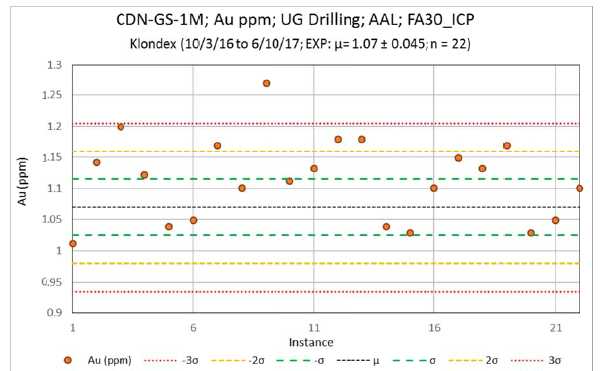
Figure 11-8: Results from Klondex Underground Drilling (2017) Certified Standards CDN-GS-1M for Gold
| 76 | P a g e |
|
Technical Report and Pre - Feasibility Study for the Hollister
Underground Mine | Title May 31, 2017 | Effective Date August 9, 2017 | Report Date |
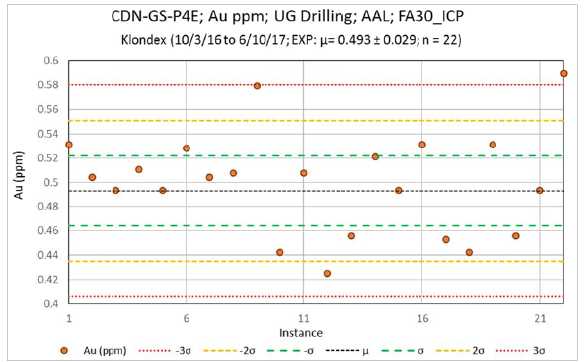
Figure 11-9: Results from Klondex Underground Drilling (2017) Certified Standards CDN-GS-P4E for Gold
CDN-GS-3M was used as a certified reference standard for Ag assays. No CDN-GS-3M assays fell outside of the ±3 standard deviations hard failure limit, however it was only used 11 times. Figure 11-10 shows Ag assay results for CDN-GS-3M.
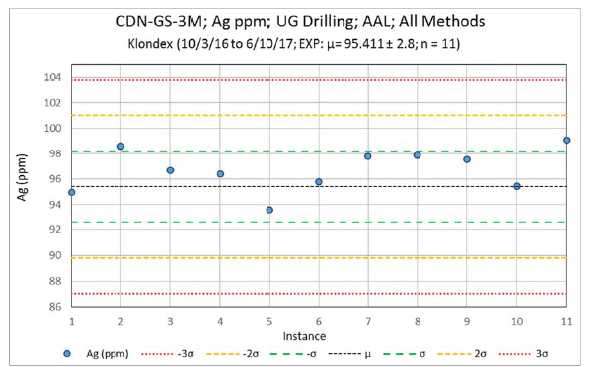
Figure 11-10: Results from Klondex Underground Drilling (2017) Certified Standards CDN-GS-3M for Silver
| 77 | P a g e |
|
Technical Report and Pre - Feasibility Study for the Hollister
Underground Mine | Title May 31, 2017 | Effective Date August 9, 2017 | Report Date |
| 11.3.2.1. 3 | Duplicates |
A total of 49 duplicate samples from Klondex’s underground drilling campaign were re-assayed by ALS as blind duplicates. This sample set represents 2.9% of the original sample population.
Table 11-15: Summary of Gold Duplicate Results from Klondex Underground Drilling (2017)
| x1 | x2 | x1-x2 | r2 | 0.9612 | ||
| n | 49 | 49 | 49 | p (T-test) | 0.08 | |
| µ | 3.87 | 3.89 | -0.03 | (+) 95% CI | 0.11 | |
| σ | 2.33 | 2.30 | 0.46 | (-) 95% CI | -0.16 |
Table 11-15 and Figure 11-11 show the results of the Au duplicate assays. A paired T-test showed a statistically significant difference between data sets (p = 0.08) , especially in the range of two to six ppm Au. However, any lack of correlation was minor (r2 = 0.96) and unbiased (95% CI: -0.16 – 0.11 ).
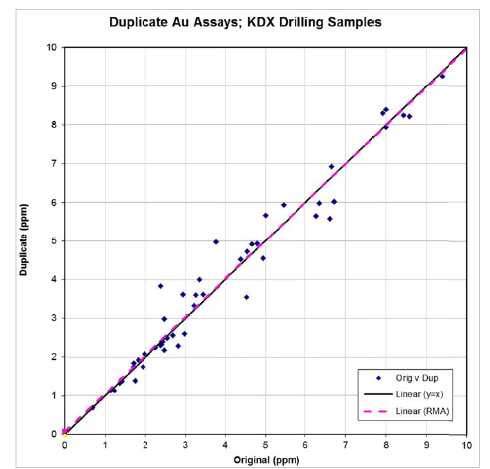
Figure 11-11: RMA Regression Analysis of Klondex Underground Drilling (2017) Duplicate Assay for Gold
Table 11-16 and Figure 11-12 show the results of the Ag duplicate assays. A paired T-test showed a statistically significant difference between data sets (p = 0.28) and minor lack of correlation (r2 = 0.93), especially in the range of values greater than 100 ppm Ag. However, if results are limited to values less than 100 ppm Ag (Table 11-17; Figure 11-13), there was a high correlation between data sets (r2 = 0.99) and no statistically significant difference between data sets (p = -0.18) . The added variation in data related to higher grade assays may be due to the notably greater error associated with assaying high grade Ag samples.
| 78 | P a g e |
|
Technical Report and Pre - Feasibility Study for the Hollister
Underground Mine | Title May 31, 2017 | Effective Date August 9, 2017 | Report Date |
Table 11-16: Summary of Silver Duplicate Results from Klondex Underground Drilling (2017)
| x1 | x2 | x1-x2 | r2 | 0.9254 | ||
| n | 49 | 49 | 49 | p (T-test) | 0.28 | |
| µ | 46.83 | 50.51 | -3.68 | (+) 95% CI | 3.51 | |
| σ | 85.56 | 91.67 | 25.18 | (-) 95% CI | -10.88 |
Table 11-17: Summary of Silver Duplicate Results less than 100ppm from Klondex Underground Drilling (2017)
| x1 | x2 | x1-x2 | r2 | 0.9874 | ||
| n | 44 | 44 | 44 | p (T-test) | -0.18 | |
| µ | 25.32 | 24.73 | 0.59 | (+) 95% CI | 1.34 | |
| σ | 22.15 | 21.99 | 2.49 | (-) 95% CI | -0.16 |
![]()
Figure 11-12: RMA Regression Analysis of Klondex Underground Drilling (2017) Duplicate Assay for Silver
| 79 | P a g e |
|
Technical Report and Pre - Feasibility Study for the Hollister
Underground Mine | Title May 31, 2017 | Effective Date August 9, 2017 | Report Date |
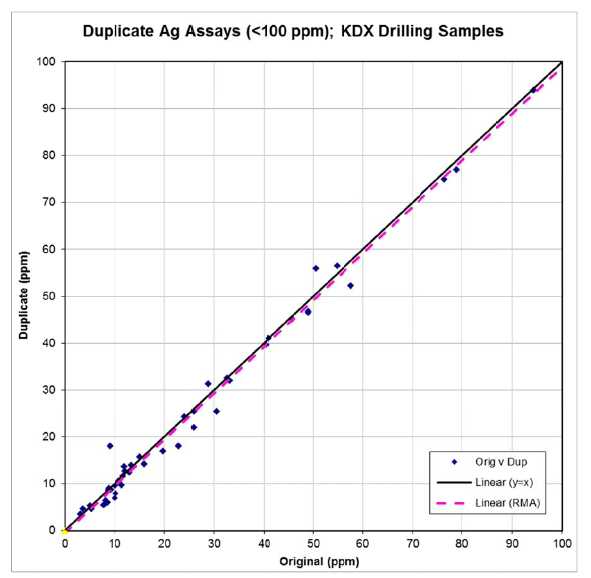
Figure 11-13: Underground Drilling (2017) Duplicate Assays for Silver Values less than 100ppm only
| 11.3.2.2 | Underground Channel Samples |
Klondex’s underground channel samples QAQC included 16.9% QC samples in the total sample population of 1,366. As with drilling, blanks were an internally-sourced crushed homogenous blank material with Au and Ag values verified to be under detection limits of their respective assay methods before use as QC samples. All QC standards were certified reference material from CDN Labs. A total of 2.9% of samples, 39 in total, were CDN Labs reference standards.
Table 11-18: Summary of Klondex Underground Channel Sample QAQC from 2016 to 2017
| Sampling Program | 2016 - 2017 | % |
| Sample Count | 1,366 | |
| Field Blanks | 192 | 14.06% |
| Certified Standards | 39 | 2.86% |
| CDN-GS-P4E | 15 | 1.10% |
| 80 | P a g e |
|
Technical Report and Pre - Feasibility Study for the Hollister
Underground Mine | Title May 31, 2017 | Effective Date August 9, 2017 | Report Date |
| Sampling Program | 2016 - 2017 | % |
| CDN-GS-1M | 14 | 1.02% |
| CDN-GS-1P5D | 9 | 0.66% |
| CDN-GS-2Q | 1 | 0.07% |
| Total QC Samples | 231 | 16.9% |
| 11.3.2.2.1 | Blanks |
For Au and Ag blanks, failure limits were less than three times the detection limits for the fire assay with gravimetric finish used at Midas Lab.
Of the 192 blanks inserted into the sample population, only one blank exceeded three times Ag detection limits. There were no Au failures (Table 11-19). Figure 11-14 and Figure 11-15 show all Au and Ag blank assay results, respectively.
Table 11-19: Gold and Silver Blanks Klondex Underground Channel Samples Taken from 2016 to 2017
KDX Channels |
n |
n
greater than 2DL |
n
greater than 3DL |
% ⊄ 2DL |
% ⊄ 3DL |
| Au Blanks | 192 | 0 | 0 | 0.0% | 0.0% |
| Ag Blanks | 192 | 1 | 1 | 0.5% | 0.5% |
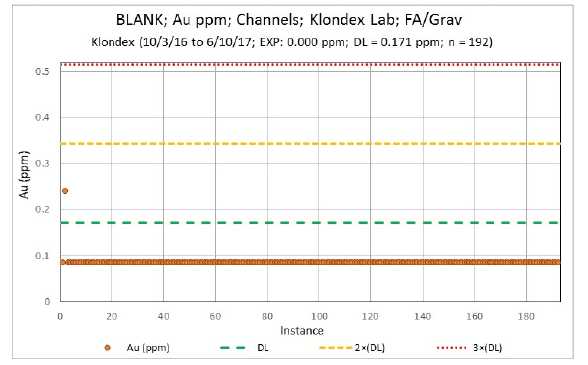
Figure 11-14: Results from Klondex’s UG Channel Sampling Blanks (2016 to 2017) for Gold
| 81 | P a g e |
|
Technical Report and Pre - Feasibility Study for the Hollister
Underground Mine | Title May 31, 2017 | Effective Date August 9, 2017 | Report Date |
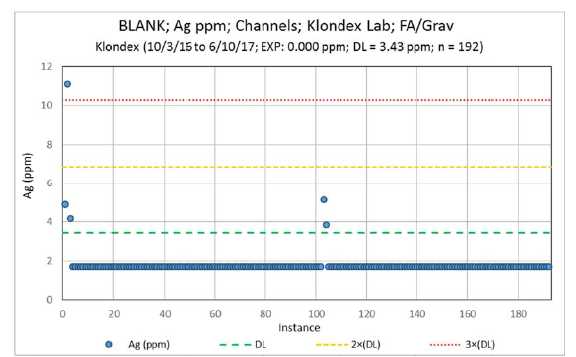
Figure 11-15: Results from Klondex’s UG Channel Samples Blanks (2016 to 2017) for Silver
| 11.3.2.2.2 | Standards |
Under Klondex, four certified reference standards for a total of 39 samples have been utilized in the QAQC procedures for Au assays in underground channel sampling. A summary of all results is shown in Table 11-20. Of these samples, nine assays are outside of the ±3 standard deviations hard failure limit. CDN-GS-P4E and CDN-GS-1M have shown poor results, with 40% and 21% failure rates, respectively, although CDN-GS-1P5D and CDN-GS-2Q have had zero failures. Results from CDN-GS-P4E are shown in Figure 11-16. Figures showing the results of CDN-GS-1P5D and CDN-GS-1M can be found in the Appendix A (Figures A18 & A19).
Table 11-20: Certified Gold Standards for Klondex UG Channel Samples from 2016 to 2017
CDN Standards |
n |
n less
than -3σ |
n less
than -2σ |
n
greater than +2σ |
n
greater than +3σ |
n ⊄ 2σ (%) |
n ⊄ 3σ (%) |
| CDN-GS-1M | 14 | 2 | 2 | 3 | 1 | 35.7% | 21.4% |
| CDN-GS-1P5D | 9 | 0 | 0 | 0 | 0 | 0.0% | 0.0% |
| CDN-GS-2Q | 1 | 0 | 0 | 0 | 0 | 0.0% | 0.0% |
| CDN-GS-P4E | 15 | 0 | 0 | 6 | 6 | 40.0% | 40.0% |
| CDN Au Total | 39 | 2 | 2 | 9 | 7 | 28.2% | 23.1% |
| 82 | P a g e |
|
Technical Report and Pre - Feasibility Study for the Hollister
Underground Mine | Title May 31, 2017 | Effective Date August 9, 2017 | Report Date |
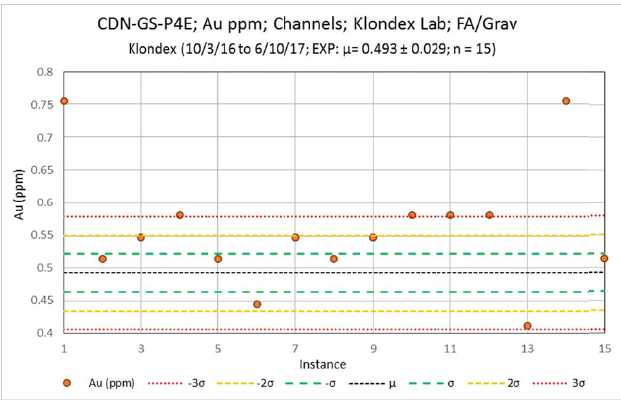
Figure 11-16: Results from Klondex’s UG Channel Samples (2016 to 2017) Standard CDN-GS-P4E for Gold
Though the failure rate for CDN-GS-P4E is high, the sample set is limited and the majority of failures are right on the upper limit.
| 11.3.2.2.3 | Duplicates |
A total of 33 duplicate samples from Klondex’s underground channel sampling campaign were re-assayed by ALS as blind duplicates. This sample set represents 2.4% of the original sample population.
Table 11-21 and Figure 11-17 show the results of the Au duplicate assays for Klondex channels. The two data sets had a very high correlation (r2 = 0.99), and a paired T-test showed no statistically significant difference between the sample populations (p = -0.05) . However, the Midas Lab assays did show a minor positive bias toward overall higher Au values (95% CI: 0.05 – 0.69).
Table 11-21: Summary of Gold Duplicate Results from Klondex UG Channels (2017)
| x1 | x2 | x1-x2 | r2 | 0.9997 | ||
| n | 33 | 33 | 33 | p (T-test) | -0.05 | |
| µ | 12.72 | 12.35 | 0.37 | (+) 95% CI | 0.69 | |
| σ | 43.24 | 42.73 | 0.93 | (-) 95% CI | 0.05 |
| 83 | P a g e |
|
Technical Report and Pre - Feasibility Study for the Hollister
Underground Mine | Title May 31, 2017 | Effective Date August 9, 2017 | Report Date |

Figure 11-17: RMA Regression Analysis of Klondex UG Channel(2017) Duplicate Assay for Gold
Table 11-22 and Figure 11-18 show the results of the Ag duplicate assays for Klondex channels. The two data sets also had a very high correlation (r2 = 0.99), and a paired T-test showed no statistically significant difference between the sample populations (p = -0.02) . Furthermore, 95% confidence intervals indicated no bias between Ag assay sample populations (95% CI: -1.56 – 4.2 2).
Table 11-22: Summary of Silver Duplicate Results from Klondex Underground Channel (2017)
| x1 | x2 | x1-x2 | r2 | 0.9997 | ||
| n | 33 | 33 | 33 | p (T-test) | -0.02 | |
| µ | 145.39 | 144.06 | 1.33 | (+) 95% CI | 4.22 | |
| σ | 457.15 | 460.86 | 8.30 | (-) 95% CI | -1.56 |
| 84 | P a g e |
|
Technical Report and Pre - Feasibility Study for the Hollister
Underground Mine | Title May 31, 2017 | Effective Date August 9, 2017 | Report Date |
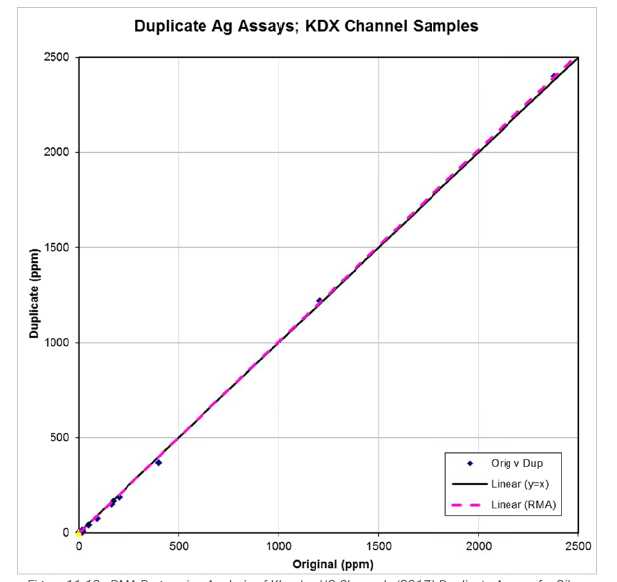
Figure 11‑18 : RMA Regression Analysis of Klondex UG Channels (2017) Duplicate Assays for Silver
| 11.4 | Comments |
| 11.4.1 | Pre-Klondex (2011 to 2016) |
Based on verification of blank and standard analyses, the author is of the opinion that all historic drill core and channel sample data are of adequate quality and commensurate with industry standards for the purpose of this mineral resource estimation.
| • | With regard to QA, the insertion rate and overall percentage of blank and standard samples taken was above industry standards; | |
| • | Performance of blanks and standards was adequate but could be improved through more consistent, long-term use of the same laboratory facilities allowing for more comprehensive and effective QC; and |
| 85 | P a g e |
|
Technical Report and Pre - Feasibility Study for the Hollister
Underground Mine | Title May 31, 2017 | Effective Date August 9, 2017 | Report Date |
| • | Analyses of blind duplicates for Carlin-era surface drilling are discussed in Nowak and Yuhasz (2016) and shown to be adequate. However, similar data for underground drilling and channel sample campaigns has not been published since the 2011 Technical Report (Oelofse et al., 2011) and was not included in the historic database. |
| 11.4.2 | Klondex (2016 to 2017) |
QAQC analysis of sampling data collected since Klondex’s purchase of the Mine is also commensurate with industry standards and of adequate quality for the purpose of mineral resource estimation. Klondex’s QAQC data set at the Mine is limited.
| 86 | P a g e |
|
Technical Report and Pre - Feasibility Study for the Hollister
Underground Mine | Title May 31, 2017 | Effective Date August 9, 2017 | Report Date |
| 12 | Data Verification |
| 12.1 | Database Description |
Klondex was provided with a copy of the drill hole database from Charlie Davies, Resource Manager at Waterton Global Mining Company, in DataShed - SQL Server 2014 format. This contained all source and coding data from the various operational eras at the Mine (1981-2016) ) for underground and surface holes, as well as production channel sampling. The technical reports from 2011 and 2016 (unpublished) provide the procedures used in its creation and notes on the original database formatting. The DataShed drill hole database was imported into the Klondex AcQuire database. Current Klondex logging data is directly captured in the AcQuire database. Certificates of all assay and survey comma separated value files (CSV) are programmatically imported. For use in the resource estimation database, records must be signed off from the data manager or designate, signaling it has been reviewed and approved.
| 12.2 | Data Verification Procedures |
The technical reports (Godden et al. 2009, Oelofse et al. 2011, and Nowak and Yuhasz, 2016) and memos from previous operators regarding treatment of the data were reviewed. Their practices appear to be industry standard, and in cases where programmatic data imports were not performed, certificates and logs were visually verified by internal audits.
Klondex validation underwent three major phases – database migration, export comparison and data file review. During the DataShed to AcQuire migration validation phase, coding data was examined to ensure logging, analysis methods and survey types were appropriately assigned. Once mapped, records were tested against database constraints. Some of these include: overlapping sample interval checks, geology or sample intervals greater than total depth, assays reported within detection limit ranges, and negative values checks.
CSV exports of collar, survey, assay, lithology, alteration, redox, and specific gravity tables of resource quality data were also provided by Carlin for use in modeling. The exports from AcQuire were compared against these CSV exports during the second phase of data validation. This check was to ensure there were no significant differences in what was previously modeled upon, and to validate preference lists used by previous operators. This check was run against 2,863 drill holes. A similar dataset was provided for the underground channels. That check was run against 8,965 channels.
| 12.3 | Drill Data File Review |
Certificates from Inspectorate, ALS and AAL were procured. Copies of survey files and geology strip logs were provided by Carlin, from previous drilling. The dataset provided for resource modeling contained 2,863 collars. These were broken into three datasets for file review, with Gloria area drilling as the emphasis. A total of 182 hole collars, survey certificates, assay certificates and geology logs were reviewed.
Table 12-1 summarizes the numbers and percentage of drill hole files reviewed for this TR:
Table 12-1: Drill Holes Reviewed
Datasets |
Total Drill Holes |
Holes: Collar Survey |
Holes: Downhole Surveys |
Holes: Geology |
Holes: Assay Certificates |
| Core/RC Exploration and Production | 2,826 | 107 | 107 | 107 | 107 |
| 87 | P a g e |
|
Technical Report and Pre - Feasibility Study for the Hollister
Underground Mine | Title May 31, 2017 | Effective Date August 9, 2017 | Report Date |
Datasets |
Total
Drill Holes |
Holes: Collar Survey |
Holes: Downhole Surveys |
Holes: Geology |
Holes: Assay Certificates |
| Carlin – Gloria UG | 36 | 36 | 36 | 36 | 36 |
| Klondex – Gloria UG | 39 | 39 | 39 | 39 | 39 |
| Totals | 2,863 | 182 | 182 | 182 | 182 |
| Percent of Population | 6.3% | 6.3% | 6.3% | 6.3% |
| 12.3.1 | Issues |
During the migration and verification from DataShed into acQuire, a lack of coding data from the earlier Fusion hosted database was discovered. Certificate work order numbers and other descriptive information was not available and require further scrutiny.
As noted in a previous technical report, assay results had been converted to ppm from opt and back again. This has resulted in very small differences (usually 0.001 ppm) from the original documents.
Several holes in the 2013-era were found to be missing assay certificates.
| 12.3.2 | Corrective Actions |
The missing 2013 assay certificates were imported into acQuire from the certificates supplied directly by the assay labs.
Many of the g/t to opt conversion errors had been previously addressed by Carlin. All other results were not changed. Work continues on restoring lost coding data, but this is considered a low risk. The data is currently considered historic and has a lower extraction priority and confidence.
| 12.4 | Channel Data File Review |
Copies of drift maps, sample dispatches/sampler’s logs, assay certificates and face sheets were procured from Carlin, as well as Klondex’s current operations. The dataset provided for resource modeling contained 9,346 channels. These were broken into two datasets for file review, with current operations as the emphasis. A total of 829 channels were reviewed.
Table 12-2 summarizes the numbers and percent of channel sample files reviewed for this TR:
Table 12-2: Channel Sample Files Reviewed
Datasets |
Total Channels |
Channels: Location Measurements |
Channels: Geology |
Channels: Assay Certificates |
| Pre Klondex Channels | 8,965 | 448 | 448 | 448 |
| Klondex - Channels | 381 | 381 | 381 | 381 |
| Totals | 9,346 | 829 | 829 | 829 |
| Percent of Population | 8.9% | 8.9% | 8.9% |
| 88 | P a g e |
|
Technical Report and Pre - Feasibility Study for the Hollister
Underground Mine | Title May 31, 2017 | Effective Date August 9, 2017 | Report Date |
| 12.4.1 | Issues |
Mine operators prior to Klondex employed sample technicians for most of the channel sampling, while the geologists compiled the drift maps. The samplers used all-weather field books to record samples. When samplers returned from the underground, they marked their sample locations on drift outlines in MapInfo software and recorded the coordinates. The samplers also captured every sample into a spreadsheet tracker. This made validation more difficult, but did not appear to bias the data.
Inconsistent naming convention of channels was noted. When attempts were made to locate points, most could only be reconstructed to locations for sampling beginning around 2010.
| 12.4.2 | Corrective Actions |
Current Klondex procedures designate both sampling and mapping duties to geologists, who then record all data pertaining to a face on its own face sheet. This has greatly eased performing audits.
The resource dataset has been limited to channels created after 2010 to ensure accurate placement.
The results of the analysis of files and acQuire exports were found to be an accurate representation of the raw files. The analysis of data from the Fusion dataset found the rounding issue to add no significant bias. The authors have determined that the dataset is adequate and within industry standards.
| 89 | P a g e |
|
Technical Report and Pre - Feasibility Study for the Hollister
Underground Mine | Title May 31, 2017 | Effective Date August 9, 2017 | Report Date |
| 13 | Mineral Processing and Metallurgical Testing |
The text contained in the following sub-sections is supported by information contained in the consultancy reports from Kappes Cassiday & Associates (KCA), McClelland Laboratories Inc. (MCI), and Jerritt Canyon Gold LLC. Laboratory (Jerritt Lab), Carlin Metallurgical Laboratory, Hanlon Engineering & Architecture Inc. (HEA) and JBR Environmental Consultants, Inc. (JBR).
Jerritt Lab is located at the Jerritt Canyon Gold Mine in Elko County, Nevada, previously owned and operated by Queenstake Mining Company, and currently owned and operated by Jerritt Canyon Gold LLC. Carlin Metallurgical Laboratory was owned by Homestake Mining Company which merged with Barrick in 2002. HEA of Tucson, Arizona, and JBR carried out preliminary engineering, environmental, and permitting due diligence audits of the Esmeralda Property.
| 13.1 | Preliminary Test work |
Preliminary metallurgical test work was carried out in 2000, 2005, and 2006 with the objective of identifying and delineating different types of mineralized material for subsequent optimization testing, as well as to identify appropriate testing methods:
| • | In December 2000, KCA carried out preliminary gravity recovery, direct cyanide leaching, and carbon- in-leach (CIL) bench-scale studies on three composite samples; |
|
| • | During 2005, two groups of cyanide soluble assays were performed by AAL on stored pulp rejects from individual drill hole sample intervals from 1998 through 2000 drilling programs (the results of which prompted a short program of bottle roll tests); and |
|
| • | In January 2006, Barrick and Jerritt Lab carried out preliminary roast/leach and autoclave/leach simulation testing on a channel sample composite from exposures of Gwenivere vein. |
It was concluded from the results summarized in the following sub-sections that:
| • | Future composites for metallurgical testing should be based on the logical sequence and grade rather than delineated types of mineralized materials; |
|
| • | Because of the presence of preg-robbing components, conventional CIL and roast/leach CIL were appropriate process technologies for final testing; and |
|
| • | Mineralized material that was likely to be mined could be processed to commercially acceptable metal recoveries. |
| 13.1.1 | Kappes Cassiday & Associates |
In July 2000, KCA performed preliminary metallurgical test work on samples of mineralized material intersected during a surface exploration drilling program. The results of this work are presented in KCA’s consultancy report dated December 20, 2000, as well as in the April 2007 Technical Report and are summarized in this section.
Three composites were compiled from drill core intersections: banded quartz adularia illite with gold and silver in quartzite (Sample No. 29228); kaolinite mineralization with cryptic gold (Sample No. 29229); and banded quartz adularia illite vein with gold and silver in argillite (Sample No. 29230). Table 13-1 summarizes the results of KCA’s head grade analyses for these samples, which may be reasonably described as representative of the mineralized vein material that had, at the time, been intersected by surface drilling in the HDB. Details of the locations of the samples are presented. Table 13-1 provides a summary of head grade analyses.
| 90 | P a g e |
|
Technical Report and Pre - Feasibility Study for the Hollister
Underground Mine | Title May 31, 2017 | Effective Date August 9, 2017 | Report Date |
Table 13-1: Summary of Head Grade Analyses
| Sample No. |
Gold (g/t) | Silver (g/t) | ||||||
| Head 1 | Head 2 | Head 3 | Average | Head 1 | Head 2 | Head 3 | Average | |
| 29228 | 99.88 | 102.22 | - | 101.05 | 445.7 | 439 | - | 442.4 |
| 29229 | 29.11 | 27.07 | - | 28.08 | 15.6 | 23.7 | - | 18.7 |
| 29230 | 40.32 | 28.61 | 27.5 | 32.14 | 200.3 | 285.4 | 295.2 | 293.6 |
The following bench-scale tests and analyses were carried out t: head analyses, including as-received screen analyses with assays by size fraction; gravity recovery and cyanide leaching; grind time versus size analysis; grind size versus recovery test work; and grind size versus sodium cyanide concentration. The major findings of the program were:
| • | 14% to 28% recovery of gold concentrate was achieved in a gravity recovery circuit utilizing a 75-millimeter diameter Knelson bowl, with a mass pull of some 7.5% (Table 13-2); |
|
| • | 96% to 98% gold recovery was achieved in the bottle roll tests, after a 96-hour leach time at a nominal grind size of 80 to 85% passing 75 microns in a CIL circuit (Table 13.3, both gold and silver recoveries in the CIL tests versus direct cyanidation indicating the material tends to be preg-robbing; organic carbon contents were measure at 0.26% to 0.44%); and |
|
| • | Cyanide consumption rate of 2.6 to 8.4 kilograms per tonne and a corresponding lime consumption rate of 2.0 to 5.0 kilograms per tonne (Table 13-3). |
Table 13-2: Summary of Gravity Concentration Tests (1.0 kilogram samples)
| Sample No. | Fraction | Weight (%) | Gold Assay (g/t) | Weight Gold (%) |
| 1 | concentrate | 7.37 | 188.2 | 14.8 |
| 2 | concentrate | 7.40 | 106.84 | 28.3 |
| 3 | concentrate | 7.40 | 114.55 | 27.8 |
Table 13-3: Summary of Cyanide Leach Tests (0.5 kilogram samples, four day leach period)
| Sample No. |
Test Type |
NaCN (g/l) |
Target Size (mm) |
Target passing (%) |
Calculated Head (g/t) |
Recovery % | NaCN (kg/t) |
Ca(OH)2 (kg/t) |
||
| Au | Ag | Au | Ag | |||||||
| 29228 | Direct | 1.0 | 1.70 | 82 | 97.81 | 432.2 | 56 | 45 | 0.69 | 2.00 |
| Direct | 1.0 | 0.60 | 77 | 98.00 | 420.2 | 69 | 49 | 0.78 | 2.00 | |
| Direct | 1.0 | 0.212 | 83 | 98.61 | 409.2 | 80 | 52 | 1.23 | 2.00 | |
| Direct | 1.0 | 0.075 | 74 | 95.45 | 421.4 | 86 | 55 | 1.93 | 2.00 | |
| Direct | 1.0 | 0.075 | 85 | 69.59 | 414.0 | 90 | 57 | 2.66 | 2.00 | |
| Direct | 5.0 | 0.075 | 89 | 93.88 | 440.4 | 94 | 82 | 5.23 | 2.00 | |
| CIL | 1.0 | 0.075 | 85 | 96.62 | 430.7 | 96 | 91 | 8.36 | 3.33 | |
| 29229 | Direct | 1.0 | 1.70 | 80 | 20.36 | 17.8 | 62 | 64 | 0.32 | 2.20 |
| Direct | 1.0 | 0.60 | 81 | 35.00 | 26.0 | 67 | 66 | 0.48 | 2.00 | |
| Direct | 1.0 | 0.212 | 88 | 18.55 | 17.9 | 81 | 72 | 0.51 | 3.00 | |
| Direct | 1.0 | 0.075 | 81 | 24.44 | 18.8 | 86 | 81 | 0.92 | 4.00 | |
| Direct | 5.0 | 0.075 | 80 | 17.51 | 20.4 | 91 | 81 | 2.38 | 3.00 | |
| CIL | 1.0 | 0.075 | 80 | 18.91 | 19.5 | 97 | 93 | 8.03 | 3.33 | |
| 91 | P a g e |
|
Technical Report and Pre - Feasibility Study for the Hollister
Underground Mine | Title May 31, 2017 | Effective Date August 9, 2017 | Report Date |
| Sample No. |
Test Type |
NaCN (g/l) |
Target Size |
Target passing |
Calculated Head (g/t) |
Recovery % |
NaCN (kg/t) |
Ca(OH)2 (kg/t) |
||
| CIL | 0.25 | 0.075 | 80 | 21.35 | 21.4 | 98 | 82 | 1.90 | 4.00 | |
| CIL | 2.50 | 0.075 | 80 | 19.96 | 18.8 | 98 | 89 | 2.57 | 4.00 | |
| 29230 | Direct | 1.0 | 1.70 | 82 | 30.28 | 303.9 | 48 | 45 | 0.63 | 3.00 |
| Direct | 1.0 | 0.60 | 74 | 40.98 | 292.5 | 58 | 50 | 0.69 | 3.00 | |
| Direct | 1.0 | 0.212 | 84 | 31.33 | 283.1 | 67 | 56 | 0.76 | 4.00 | |
| Direct | 1.0 | 0.075 | 82 | 33.57 | 200.0 | 75 | 62 | 0.88 | 4.00 | |
| Direct | 5.0 | 0.075 | 82 | 27.98 | 303.2 | 82 | 89 | 2.08 | 3.00 | |
| CIL | 1.0 | 0.075 | 82 | 33.82 | 285.1 | 96 | 95 | 8.78 | 5.00 | |
| CIL | 2.50 | 0.075 | 82 | 31.45 | 305.7 | 96 | 95 | 5.29 | 5.00 | |
| 13.1.2 | American Assay Laboratories |
The results of AAL cyanide solubility tests on stored pulp samples for previous drill core samples from a surface drilling program (grades not known, but cross-reference of the samples suggests that they were representative of HDB mineralized vein material), that are summarized in the April 2007 TR showed that:
| • | The tested material tends to be preg-robbing, owing to a relatively high organic carbon content; | |
| • | The degree of preg-robbing varies according to the rock types, although it is thought to be pervasive throughout the deposit; | |
| • | 72-hour batch CIL recoveries showed 93% to 97% recovery of gold and 82% to 93% recovery of silver; | |
| • | Batch testing showed gold recovery to be essentially complete after 24 hours; and | |
| • | High lime consumption of up to 40 kg/t was required, although it was suspected that the numbers are artificially high due to oxidation and decomposition of the sulfides during the more than five years of storage of the pulps. |
| 13.1.3 | Queenstake Resources Ltd. & Barrick Gold Corp. |
A channel sample was recovered from the Gwenivere vein in the Mine lateral vein drifts that assayed 13.06 g/t gold, with 2.33% sulfur and 0.12% total carbon. The sample, that had lower organic carbon, but higher sulfur content than typical roaster mineralized material, was sent to Jerritt Lab processing facility for roaster evaluation tests. The results showed that:
| • | The samples achieved an average cyanide leach gold recovery of 66%, prior to roasting; and |
|
| • | After two hours of roasting at 554°C, the samples achieved an average cyanide leach gold recovery of 95.73%. |
Little information is available concerning the channel sample supplied to Barrick, but it is known that it assayed 10.525 g/t gold and that an average cyanide leach recovery rate of less than 95% was achieved after roasting.
| 92 | P a g e |
|
Technical Report and Pre - Feasibility Study for the Hollister
Underground Mine | Title May 31, 2017 | Effective Date August 9, 2017 | Report Date |
| 13.2 | Metallurgical Process Evaluation |
McClelland Laboratories Inc. (MCI) carried out metallurgical process evaluation work between October 16, 2006 and March 1, 2007. Details of MCI’s program are presented in their report dated February 5, 2007 and summarized in the section. The main objectives of the evaluation program were to:
| • | Confirm the amenability of the mineralized material from the HDB to conventional CIL processing and/or a roast CIL process; |
|
| • | Determine the effectiveness of high lime pre-treatment/passivation (which can render the organic carbon mineral surfaces un-reactive); |
|
| • | Determine the effectiveness of lead nitrate addition for improving gold and silver recovery and to confirm the amenability of roasting followed by calcine CIL cyanidation; and |
|
| • | Confirm that the composites are not amenable to direct cyanidation (no CIL, high lime pre-treatment or lead nitrate). |
A total of four, representative drill core composites of vein material intersected in HDB drill holes, with different average grades, were prepared for evaluation during MCI’s metallurgical testing program (Table 13-4). Each of the composites can be traced in the MCI work to multiple sampling locations, including the Gwenivere, South Clementine, and Central Clementine veins. The relatively uniform metallurgical response between composites suggests that sample representation does not bias the gold recovery in a significant manner.
Table 13-4: Summary of the Average Head Grades of the Four Composite Drill Core Samples
| Sample ID |
Gold Grade | Sulphur Content (%) |
Total
Carbon Content % |
|
| g/t | opt | |||
| Low Grade | 10.63 | 0.31 | 1.40 | 0.50 |
| Average Grade | 98.4 | 2.87 | 1.25 | 0.33 |
| High-Grade | 40.114 | 1.17 | 1.50 | 0.35 |
| High Carbon | 25.371 | 0.74 | 1.56 | 0.62 |
Table 13-5 summarizes MCI’s test work results. In summary, the results show that:
| • | The mineralized material is suitable for both conventional CIL cyanidation and roast/CIL cyanidation – recoveries of up to 96.5% for both gold and silver were achieved; |
|
| • | High lime pretreatment would not be required for direct CIL cyanidation processing, but would be required for roast/CIL cyanidation processing; |
|
| • | Lead nitrate addition is likely required, regardless of the commercial processing technology that might eventually be selected; |
|
| • | A grind size of 80% minus 200-mesh appears near optimum for the composites evaluated in analysis; and |
|
| • | The gold and silver recoveries indicate close correlation between recovery and head grade (subsequent regression analysis reported correlation coefficients of 0.998 and 0.9986 for gold and silver, respectively). |
| 93 | P a g e |
|
Technical Report and Pre - Feasibility Study for the Hollister
Underground Mine | Title May 31, 2017 | Effective Date August 9, 2017 | Report Date |
Table 13-5: Summary of Test Work Results
| Composite and Test Type |
Composite Grade (g/t) |
Tail Assays (g/t) |
Calculated Head (g/t) |
Recovery % |
Reagents (kg/t) |
|||||
| Au | Ag | Au | Ag | Au | Ag | Au | Ag | NaCN | Lime | |
| High-grade | ||||||||||
| Sacrificial CIL | 34.4 | 210 | 1.6 | 30 | 36 | 240 | 96 | 88 | 1.68 | 4 |
| Validation CIL | 33.7 | 195 | 1.8 | 30.3 | 35.5 | 226 | 95 | 87 | 1.71 | 4 |
| HC/HG, Validation CIL | 19.2 | 116 | 1.3 | 19.7 | 20.6 | 136 | 94 | 86 | 1.64 | 4.2 |
| HC/HG, Roast/CIL | 24.7 | 68.8 | 1.2 | 109 | 25.9 | 174 | 95 | 37 | 0.59 | 18.7 |
| Cyanide Solution | 30.6 | 218 | 2.5 | 8 | 33.1 | 226 | 92 | 97 | N/A | N/A |
| Cyanide Sol. HC/HG | 13.2 | 180 | 3.9 | 9 | 17.1 | 189 | 77 | 95 | N/A | N/A |
| Average Grade | ||||||||||
| Sacrificial CIL | 13.4 | 67.3 | 0.8 | 9 | 17.1 | 76.3 | 96 | 88 | 1.34 | 2.9 |
| Validation CIL | 16.1 | 81.4 | 1 | 9.3 | 17 | 90.7 | 94 | 90 | 1.27 | 2.8 |
| Direct Cyanidation | 12 | 57.5 | 5.8 | 19.3 | 17.7 | 76.8 | 68 | 75 | 0.53 | 2.7 |
| Roast/CIL | 22.2 | 48.3 | 0.8 | 48.7 | 23 | 96.9 | 97 | 50 | 0.67 | 16 |
| CN Solution | 12 | 75 | 2 | 3 | 14 | 78 | 96 | 96 | N/A | N/A |
| Low Grade | ||||||||||
| Validation CIL | 8.9 | 69.2 | 0.8 | 9.3 | 9.7 | 78.6 | 92 | 88 | 1.29 | 3.3 |
| CIL, w/o High CaO | 8.72 | 64.1 | 0.8 | 9 | 9.55 | 73.1 | 92 | 88 | 1.36 | 2.4 |
| CIL w/o High Lime or | ||||||||||
| Pb(NO3)2 | 9.31 | 61 | 1.3 | 14.3 | 10.6 | 75.3 | 88 | 81 | 1.49 | 2.5 |
| Direct Cyanidation | 5.49 | 54.5 | 4.3 | 22.3 | 9.81 | 76.8 | 56 | 71 | 0.59 | 2.3 |
| Cyanide Solution | 6.84 | 56.6 | 2 | 3 | 8.87 | 59.6 | 77 | 95 | N/A | N/A |
| 13.2.1 | Midas Facility Bulk Sample Processing |
During 2008 and into 2009 and 2010, various agreements with Newmont were completed for toll-processing bulk samples from Mine (Table 13-6) at the Midas Mill (purchased by Klondex in early 2014). The Midas Mill flow sheet consists of a standard two-stage crushing / grinding circuit. The ground product is thickened and leached with the leached slurry reporting to a series of five counter current decant (CCD) thickeners. Precious metal is recovered from the pregnant solution using zinc precipitation. The results from processing the bulk samples sent to Midas Mill, from the Mine are shown in Table 13-6.
Table 13-6: Summary of the Bulk Samples and Processing Results for Material
Date Sent |
Head Grades | Amount (dry tonnes/tons) |
Recoveries (%) |
|||||
| Gold | Silver | |||||||
| g/t | oz/t | g/t | oz/t | t | T | Gold | Silver | |
| May 2008 | 39.43 | 1.15 | 326.7 | 9.53 | 4,297 | 4,737 | 84.7 | 94.3 |
| June 2008 | 25.71 | 0.75 | 332.6 | 9.70 | 3,543 | 3,906 | 88.2 | 92.6 |
| September 2008 | 48.96 | 1.42 | 398.1 | 11.61 | 9,895 | 10,907 | 88.1 | 91.1 |
| November 2008 | 69.26 | 2.02 | 555.4 | 16.20 | 10,954 | 12,075 | 88.0 | 90.0 |
| January 2009 | 92.23 | 2.69 | 555.8 | 16.21 | 2,752 | 3,034 | 83.0 | 80.0 |
| March - April 2009 | 36.69 | 1.07 | 372.7 | 10.87 | 17,947 | 19,784 | 84.0 | 81.0 |
| May 2009 | 20.57 | 0.60 | 226.6 | 6.61 | 7,327 | 8,076 | 84.0 | 81.0 |
| May - August 2010 | 24.26 | 0.78 | 154.6 | 4.97 | 29,238 | 34,005 | 76.3 | 90.5 |
| 94 | P a g e |
|
Technical Report and Pre - Feasibility Study for the Hollister
Underground Mine | Title May 31, 2017 | Effective Date August 9, 2017 | Report Date |
| 13.3 | Recent Test Work for Processing Ore at the Midas Mill |
Klondex completed test work in 2016 looking at the feasibility of processing the Mine ore at its Midas Mill. The results from the processing of the bulk samples completed previously show the preg-robbing nature of the Mine would lead to reduced precious metal recovery when processed through the existing Midas Mill flow sheet. Several blinding agents were tested to understand whether blinding the organic carbon could be successful in achieving similar metal recoveries as are possible using a CIL circuit.
A composite sample (labeled UG Ore in Table 13-7) from the Gloria vein was put together from sill material being generated during the initial mining in 2016. Several blinding agents were tried along with a direct leach (cyanide leach with no activated carbon added) and CIL tests (cyanide leach with 25 gpl activated carbon added) to understand the potential of blinding the organic carbon. Results from these tests are shown in Table 13-7.
Two additional composite samples were generated from the Gloria vein: one sample with an unusually high organic carbon content (determined visually and labeled V21) and one sample with an unusually high sulfide content (determined visually and labeled V23). Results from these tests also appear in Table 13-7.
Table 13-7: Summary of Bottle Roll Tests 80%-75μm Feed Size 7
| Sample No. |
Test Type |
Calculated Head (g/t) |
Recovery
(%) |
Reagents
(kg/t) |
|||
| Au | Ag | Au | Ag | NcCN | Ca(OH)2 | ||
| UG Ore | Direct | 8.74 | 16.1 | 42.9 | 77.6 | 2.38 | 5 |
| Direct with 1 kg/mt pine oil | 9.26 | 18.6 | 43.1 | 78.5 | 2.55 | 5.5 | |
| Direct with 1 kg/mt ethylene glycol | 9.09 | 18.2 | 40.4 | 77.5 | 3.01 | 6.4 | |
| Direct with 1 kg/mt sodium laurel sulfate | 9.47 | 17.7 | 57 | 79.7 | 2.49 | 6.5 | |
| Direct with 5 kg/mt sodium laurel sulfate | 10.26 | 18.7 | 46.9 | 75.9 | 12.68 | 8.4 | |
| Direct with 10 kg/mt sodium laurel sulfate | 10.77 | 19.8 | 46.1 | 75.3 | 3.25 | 7.9 | |
| Direct with 5 kg/mt sodium laurel sulfate in grind | 10.97 | 18.5 | 42.2 | 64.9 | 1.57 | 6 | |
| Direct with 0.5 kg/mt kerosene | 12.11 | 18 | 58.3 | 65 | 3.61 | 10 | |
| Direct with 1 kg/mt kerosene | 10.24 | 14.7 | 50.8 | 74.1 | 2.57 | 6.4 | |
| Direct with 5 kg/mt kerosene | 12.67 | 17.8 | 67 | 67.4 | 3.45 | 10.1 | |
| Direct with 1 kg/mt molasses in grind | 9.88 | 9.9 | 36.8 | 78.3 | 4.22 | 7.7 | |
| Direct with CIL, 24 HR (25gpL carbon) | 9.28 | 14.3 | 89.9 | 69.9 | 4.15 | 7.4 | |
| Direct with CIL, 96 HR (25gpL carbon) | 11.66 | 16 | 96.5 | 85 | 3.67 | 5.9 | |
| Direct with 5 kg/mt sodium laurel sulfate (80/20) | 8.77 | 611 | 95 | 78.4 | 1.15 | 1.6 | |
| Direct with 5 kg/mt kerosene (40/40/20) | 10.97 | 325 | 93.2 | 93.2 | 0.46 | 6.7 | |
| Direct with 5 kg/mt kerosene (33/33/33) | 9.79 | 275 | 91.4 | 90.2 | 0.5 | 6.7 | |
| V21 | CIL (40/30/30) | 10.62 | 57 | 69.3 | 66.7 | 0.87 | 0.8 |
| 3 kg/mt kerosene (40/30/30) | 10.57 | 62 | 23.4 | 79 | 0.59 | 1 | |
| 3 kg/mt kerosene (20/40/40) | 11.09 | 84 | 56.5 | 84.5 | 0.74 | 0.8 | |
| V23 | CIL (40/30/30) | 11.73 | 175 | 91.8 | 49.1 | 0.95 | 0.6 |
_________________
7McClelland 2016
| 95 | P a g e |
|
Technical Report and Pre - Feasibility Study for the Hollister
Underground Mine | Title May 31, 2017 | Effective Date August 9, 2017 | Report Date |
| Sample No |
Test
Type |
Calculated Head (g/t) |
Recovery (%) | Reagents (kg/t) |
|||
| 3 kg/mt kerosene (40/30/30) | 16.27 | 220 | 94.3 | 70 | 0.69 | 0.6 | |
| 3 kg/mt kerosene (20/40/40) | 19.62 | 162 | 97 | 80.9 | 0.82 | 0.7 | |
*Blend of 20% Hollister and 80% Midas mine
**Blend of 40% Hollister, 30% Midas and 30% Fire Creek
***Blend of 33% Hollister, 33% Midas and 33% Fire Creek
****Blend of 20% Hollister, 40% Midas and 40% Fire Creek
| 13.4 | Conclusions from Recent Test Work |
Conclusions from the most recent test work include
| • | The preg-robbing nature of Hollister ore is somewhat variable and related to the quantity of visible organic carbon; |
|
| • | Increased sulfide content does not appear to affect precious metal recovery; |
|
| • | The Hollister ore has to be blended down with non-preg-robbing ore to successfully blind the organic carbon; |
|
| • | Leaching with 25 gpl activated carbon present appears to effectively manage the preg-robbing potential; and |
|
| • | Leach recovery of 92% for gold and 60% for silver can be expected when processing ore with a gold head grade of 0.5 opt or higher and a silver grade of 6.0 opt or higher. These recovery predictions require a minimum leach retention time of 24 hours and highly active carbon present. |
| 13.5 | Recommendations for Additional Test Work |
Develop a database with laboratory generated preg-robbing results correlated to bottle roll results to better understand the preg-robbing potential. Review the preg-robbing potential with the organic carbon content in the feed material.
| 96 | P a g e |
|
Technical Report and Pre - Feasibility Study for the Hollister
Underground Mine | Title May 31, 2017 | Effective Date August 9, 2017 | Report Date |
| 14 | Mineral Resource Estimates |
| 14.1 | Introduction |
The Mineral resource was estimated in accordance with CIM’s Definitions Standards for Mineral Resources and Mineral Reserves, adopted by CIM Council on May 10, 2014 (CIM 2014). This estimate is only inclusive of the resources hosted by the Ordovician rocks in the historical Mine area and the Gloria vein sets. This estimate and depletion is effective May 31, 2017.
All data coordinates are presented and measured in a Mine Grid coordinate system. This represents a modified North American Datum 1927 (NAD27) feet coordinate system which is converted from NAD27 by using a scale factor of 1.0002527174 and subtracting 2,000,000 from the northing. All quantities are given in imperial units unless indicated otherwise.
The gold and silver mineralization at the Mine was estimated using Vulcan modeling software. The estimate was performed by Anthony Bottrill, Corporate Resource Manager for Klondex and reviewed by the authors of this TR. The vein solid models were interpreted from core photo review, assay data, underground mapping, and lithology logging of drilling and channel samples. No strict grade cutoff was honored, but care was taken to ensure that only vein material was modeled regardless of the grade.
Vulcan Version 10.0.4 software was used in all aspects of the modeling process. The ID3 estimation method was used, with validations making use of the Nearest Neighbor (polygonal) method and Discrete Gaussian change of support method for comparison purposes.
| 14.2 | Database and Compositing |
In 2017, Klondex migrated the drill hole and channel data from the previous owner’s Datashed database into an acQuire database. All drill holes and channels acquired by Klondex since taking ownership are entered directly into the acQuire database. CSV format files were exported from the acQuire database for collar, survey, lithology, and assay tables. These were imported into a Vulcan ISIS database using a LAVA script. The LAVA script ensured the database was loaded consistently each time. The gold and silver assays are converted from g/t to opt in the acQuire database by dividing with a factor of 34.2857.
Assay intervals were flagged to their interpreted vein using a coding system in the assay table. These vein codes were used in both building the initial vein solid and in subsequent grade estimation. Samples were composited into a single weighted average value spanning the width of the vein or ten feet, whichever was less. Ten-foot composites were generally only created when a drill hole was drilled sub-parallel to the vein orientation. Where possible, holes are drilled perpendicular to the vein orientation.
| 14.2.1 | Assays |
This analysis used 2,863 surface and underground drill holes and 9,346 channel sample sets. The composites of all flagged assays were used for statistical analysis and estimation. No channels were eliminated for any reason. In the historical underground Mine area, almost all surface drill holes were removed as they were replaced by subsequent underground infill drilling. Drill hole intercepts were only ignored in the case where a drill hole intersecting a vein proximal to subsequent silled channel samples was shown to be inaccurate. In this case, the vein coding of the drill hole sample was preceded by the code “IG_” so that the vein intercept was acknowledged as existing, but designated to be ignored due to replacement by underground channel data (for example V181 would become IG_V181). Table 14-1 summarizes the overall quantity of data available by type and the quantity flagged that could be used in the estimation.
| 97 | P a g e |
|
Technical Report and Pre - Feasibility Study for the Hollister
Underground Mine | Title May 31, 2017 | Effective Date August 9, 2017 | Report Date |
Table 14-1: Summary of Drill Hole and Channel Samples
| Type | Totals | Modeled Veins | ||||
No. Holes |
Length Drilled |
No. Samples |
Length Sampled |
No. Samples |
Length Sampled |
|
| Drill | 2,863 | 1,449,568 | 264,210 | 1,137,425 | 6,522 | 10,829.2 |
| Channel | 9,346 | 40,278.8 | 14,821 | 34,853.64 | 6,150 | 10,103.6 |
Drill hole and channel sample locations relative to the vein models are shown in Figure 14-1 and Figure 14-2.
![]()
Figure 14-1: Drill Hole and Vein Location
| 98 | P a g e |
|
Technical Report and Pre - Feasibility Study for the Hollister
Underground Mine | Title May 31, 2017 | Effective Date August 9, 2017 | Report Date |
![]()
Figure 14-2: Channel Sample Locations Relative to the Mine Workings
| 14.2.2 | Lithology |
The rock types identified in the lithology logging are shown in Table 14-2. In addition to core photos, intervals logged as vein or structure along with assay values were used to identify veins.
Table 14-2: Lithology Codes
| Value | Description | Value | Description |
| and | Andesite | lt | lithic tuff |
| aq | Arg with quartzite interbeds | mdf | Mine Dump Fill |
| arg | Argillite | MI | Mafic Intrusion |
| 99 | P a g e |
|
Technical Report and Pre - Feasibility Study for the Hollister
Underground Mine | Title May 31, 2017 | Effective Date August 9, 2017 | Report Date |
| Value | Description | Value | Description |
| as | Arg with siltite interbeds | osi | Opaline Silica |
| at | ash tuff | qa | quartzite with arg interbeds |
| bf | back fill | qs | quartzite with siltite interbeds |
| bf | Breccia Fill | qtzt | Quartzite |
| cc | Calcite | qv | quartz vein |
| cgl | conglomerate | rhy | Rhyolite |
| CYS | Claystone | sa | siltite with arg interbeds |
| cyv | clay vein | silt | siltite |
| ecr | Epiclastic rocks | sq | siltite with quartzite interbeds |
| em | Mafic Extrusive | stwk | Stockwork |
| fi | Felsic Intrusion | suv | sulfide vein |
| flt | fault gouge | TB | tectonic breccia |
| gvl | Gravel | tft | Tuff Felsic |
| HB | hydrothermal breccia | ti | Intermediate Tuff |
| hbx | Gangue healed breccia | vbx | quartz breccia |
| ii | Intermediate Intrusion | vsed | Volcaniclastic Sediments |
Unlike nearby epithermal vein deposits such as Midas Mine and Fire Creek Mine that are hosted in Tertiary volcanic sequences, the Hollister epithermal veins are hosted by the older Ordovician quartzite and argillite sequences. There is an unconformable contact between the two rock units; the mineralized epithermal system cuts both. The style of mineralization however does change across this contact.
The Mine underground resource is calculated only for mineralization below the unconformity in epithermal veins hosted by the Ordovician sequences. Previous operators mined some resources above the unconformity. Above the unconformity, the continuation of the discrete banded veins encountered in the Ordovician changes character to become multiple thin structures with zones of disseminated mineralization into the host rocks. On the eastern side of the historical Mine area, the Tertiary rocks are oxidized and host economic gold mineralization. On the western side of the historical Main area, and above the Gloria vein sets, the Tertiary rocks are altered to chloritic clays and appear to have been impermeable and/or a poor host to mineralization. Figure 14-3 is a long section through the deposit showing the unconformity and main lithologic packages relative to the mine workings.
| 100 | P a g e |
|
Technical Report and Pre - Feasibility Study for the Hollister
Underground Mine | Title May 31, 2017 | Effective Date August 9, 2017 | Report Date |
![]()
Figure 14-3: Long Section Showing Location of Unconformity Contact Relative to Mine Workings
| 14.2.3 | Composting |
The assays were composited on 10-foot downhole interval lengths honoring the vein intersections. Therefore, the assays within the veins were separated from the lower grade or un-mineralized values outside of the veins. In most cases, this compositing method calculated a single composite across the vein interval as most vein intercepts are less than 10 feet in length. Where the interval within the vein was longer than 10 feet, more than one composite was created.
| 14.3 | Geology and Vein Modeling |
The unconformity contact was modeled. This formed a clipping surface for the upper extents of the vein models. The surface was modeled by extracting contact points that represent the top of the logged Ordovician sequences in the drilling. These points were modeled using grid modeling techniques with the final triangulation snapped to the original input data. Figure 14-4 shows the unconformity surface colored by elevation and plotted in relationship to modeled veins. Cooler colors indicate lower elevation, hotter colors represent higher elevations of the unconformity. Displacement of the unconformity contact may indicate faulting, both pre- and post-mineralization, which may help in understanding local geology and guiding exploration.
| 101 | P a g e |
|
Technical Report and Pre - Feasibility Study for the Hollister
Underground Mine | Title May 31, 2017 | Effective Date August 9, 2017 | Report Date |
![]()
Figure 14-4: Unconformity Surface Colored by Elevation in Relation to Modeled Veins
Thirty-two veins were modeled, generally trending westerly. Figure 14-5 shows the strain ellipse for the Mine area (Calloway, 2011). These orientations and the overall structural setting guide the vein interpretations and understanding of controls on ore shoot formation. The main vein orientations recognized include:
| • | 090° type structures, which define the main ore shoots on veins V161, V181, and V232B; |
|
| • | 110° type structures, which define the primary wrench fault orientation of veins V05 and V08; and |
|
| • | 060° type structures, which define the antithetic left lateral orientation encountered on vein V22 in the Gloria area. |
This structural fabric represents fractals that are seen on all scales from the mining face, to mine site, to regional structures. Mining and channel sampling has occurred on many veins in the historical Mine area, including V161, V181, V203, V061, and V08, and in the Gloria area on vein sets V211, V231, V22, and V232.
| 102 | P a g e |
|
Technical Report and Pre - Feasibility Study for the Hollister
Underground Mine | Title May 31, 2017 | Effective Date August 9, 2017 | Report Date |
![]()
Figure 14-5: Strain Ellipse and Mapped Lineaments Supporting Structural Framework
| 103 | P a g e |
|
Technical Report and Pre - Feasibility Study for the Hollister
Underground Mine | Title May 31, 2017 | Effective Date August 9, 2017 | Report Date |
The vein framework and naming is identified in Figure 14-6. Vein mineralization is characterized by a sharp natural contact (grade break) between the veins and the surrounding host rock. The vein system was formed at shallow depths below an active hot spring system. Conditions of the epithermal system varied temporally and spatially, resulting in an episodic nature of mineralization. This is most evident today in the varied textures and banding of veins. Host rock competency and competency contrasts between lithologies can also play a role in vein development and local structural orientations encountered.
![]()
Figure 14-6: Vein Framework and Naming
| 104 | P a g e |
|
Technical Report and Pre - Feasibility Study for the Hollister
Underground Mine | Title May 31, 2017 | Effective Date August 9, 2017 | Report Date |
A LAVA scripted grid modeling workflow was used to model the vein sets. Grid modeling is applicable to modeling narrow, continuous geological features such as precious metal veins and coal seams. Grid modeling creates a surface by interpolating a regular grid of points over a modeling area. These grid points are combined with the input intercepts to create output triangulation models that represent the vein hanging wall and footwall contacts. The contacts are combined to create a valid solid triangulation for use in building the resource block model. Figure 14-7 outlines the vein modeling process.
![]()
Figure 14-7: Vein Modeling Workflow
The data processing steps automated by the scripted process can be summarized as follows:
| 1. | Set the vein to be modeled, its overall dip and dip direction, and the drill hole and channel databases to be used; |
| 2. | Extract the hanging wall (HW) and footwall (FW) vein intercepts from the drill hole and channel databases; |
| 3. | Combine interpreted or surveyed HW and FW points to control the vein model interpretation where required. Figure 14-8 shows HW points in red and FW points in yellow; |
| 105 | P a g e |
|
Technical Report and Pre - Feasibility Study for the Hollister
Underground Mine | Title May 31, 2017 | Effective Date August 9, 2017 | Report Date |
![]()
Figure 14-8: HW (red) and FW (yellow) Data Points Extracted from Sample and Survey Data Sets
| 4. | Use the dip and dip direction settings to rotate the intercepts to a semi-flat plane (grid modeling works in plan view); |
| 5. | Use inverse distance to model HW and FW grid surfaces from the input data and perform grid mathematics to ensure HW grid points are always above FW grid points (i.e. there are no overlaps); |
| 6. | Create a triangulation of the HW contact that combines the grid model points with the input intercepts to ensure the final surface is snapped to the input data. Repeat this process for the FW contact. Modeling specific settings are attached as attributes to the triangulations and also written to a text file for future auditing. Figure 14-9 shows the triangulated HW and FW surfaces; |
| 106 | P a g e |
|
Technical Report and Pre - Feasibility Study for the Hollister
Underground Mine | Title May 31, 2017 | Effective Date August 9, 2017 | Report Date |
![]()
Figure14-9: Triangulated HW and FW Surfaces
| 7. | Produce boundary polygons of the vein contact surfaces to create a boundary triangulation that can then be appended to the vein contacts to create a valid solid triangulation. In Figure 14-10, the surfaces have been combined to form a solid; |
![]()
Figure 14-10: HW and FW Surfaces are Combined to Generate a Valid Solid Triangulation
| 8. | Un-rotate the triangulations and intercepts back to their true spatial location; and |
| 9. | Clip the solid vein triangulation to the unconformity and other vein surfaces as required. |
| 107 | P a g e |
|
Technical Report and Pre - Feasibility Study for the Hollister
Underground Mine | Title May 31, 2017 | Effective Date August 9, 2017 | Report Date |
Clipping priorities and overall orientations for all veins are listed in Table 14-3.
Table 14-3: Vein Orientation and Clipping Priorities
Vein Name |
Vein Code |
Orientation | Clipping Surfaces |
|
| Dip Direction | Dip | |||
| V01A | V01/A | 5 | 85 | UC+V02A.FW+V05A.HW |
| V02A | V02/A | 15 | 84 | UC+V05A.HW |
| V03A | V03/A | 15 | 84 | UC+V05A.HW |
| V05A | V05/A | 200 | 80 | UC |
| V05B | V05/B | 200 | 80 | UC+V08A.HW |
| V061A | V061/A | 190 | 88 | UC+V05B.FW |
| Gwenivere | V08/A | 200 | 85 | UC |
| V08B | V08/B | 200 | 85 | UC |
| V141A | V141/A | 188 | 88 | UC+V08B.FW+V151A.FW |
| V151A | V151/A | 5 | 90 | UC+V08B.FW |
| V161A | V161/A | 180 | 88 | UC+V08B.FW+V181A.FW |
| V162A | V162/A | 355 | 88 | UC+V08A.HW |
| V163A | V163/A | 10 | 80 | UC+V181.FW |
| V163B | V163/B | 10 | 80 | UC+V181.FW |
| Clementine | V181/A | 360 | 85 | UC+V08B.FW |
| V182A | V182/A | 360 | 85 | UC+V08.HW+V162A.HW |
| V201A | V201/A | 15 | 85 | UC+V181.HW+V08.FW |
| V203A | V203/A | 15 | 85 | UC+V181.HW |
| V211A (Gloria) | V211/A | 172 | 86 | UC+V231.HW+V22A.FW+V08B.FW |
| V211B (Gloria) | V211/B | 172 | 86 | UC+V231.HW+V22A.FW+V08B.FW |
| V213A | V213/A | 200 | 88 | UC+V181.HW+V08.FW |
| V22A (Gloria) | V22/A | 330 | 80 | UC |
| V231A (Gloria) | V231/A | 172 | 86 | UC+V22A.FW+V08B.FW |
| V231B (Gloria) | V231/A | 172 | 86 | UC+V22A.FW+V08B.FW |
| V232A (Gloria) | V232/B | 172 | 86 | UC+V22A.HW |
| V232B (Gloria) | V232/B | 172 | 86 | UC+V22A.HW |
| V232F (Gloria) | V23F | 172 | 86 | UC+V232B.HW |
| V243A | V24/A | 0 | 90 | UC |
| V253A | V25/A | 190 | 85 | UC |
| V52A | V52/A | 5 | 85 | UC |
| V52B | V52/B | 5 | 85 | UC |
| V58A | V58/A | 15 | 88 | UC |
Where channel samples are present, channel samples may replace drill hole samples in generating the vein model as drill hole intercepts may be found to be locally inaccurate. Drill holes to be ignored are designated with an “IG_” prefix; in this way, channel samples will take precedence over drilling.
| 14.4 | Density |
A density value of 0.0775 tons per cubic foot was assigned to all vein mineralization (2.49 g/cm3 or 12.9ft³/T). This comes from whole rock sample data collected by GBG and summarized in Table 14-4. Density sampling will be routinely taken as part of ongoing mining activities, future updates will incorporate this additional density data for determining the representative densities to be applied to the model.
| 108 | P a g e |
|
Technical Report and Pre - Feasibility Study for the Hollister
Underground Mine | Title May 31, 2017 | Effective Date August 9, 2017 | Report Date |
Table 14-4: Density Results for Whole Rock Samples from Mine
| Sample # | Location | Rock Type | Density (g/cm3) |
ft3/T | T/ft3 |
| 298075 | East Gwen GV5 + 64 | Vein Quartz | 2.60 | 12.3 | 0.0813 |
| 298076 | 4550 WSC | Vein Quartz | 2.58 | 12.4 | 0.0806 |
| 298077 | 4550 WSC | Quartz Vein | 2.44 | 13.1 | 0.0763 |
| 298079 | 4550 ECC 16-22 | Vein Quartz | 2.56 | 12.5 | 0.0800 |
| 298081 | 4550 WCC 0-5 | Quartz Vein | 2.35 | 13.6 | 0.0735 |
| 298083 | East Gwen GV5 + 103 | Quartz Vein | 2.51 | 12.8 | 0.0781 |
| 298084 | 4200 ecc | Vein Quartz | 2.61 | 12.3 | 0.0813 |
| 209089 | 4550 esc 45-3 + 20 | Vein Quartz | 2.61 | 12.3 | 0.0813 |
| 298090 | 4550 wsc 45-3 + 40 | Vein Quartz | 2.59 | 12.4 | 0.0806 |
| 298101 | East Gwen GV7 + 92.5 | Quartz Vein | 2.50 | 12.8 | 0.0781 |
| 298102 | 4550 WSC 45-8 + 63 | Quartz Vein | 2.38 | 13.5 | 0.0741 |
| 298103 | 4200 WCC 42-10 + 52 | Quartz Vein | 2.37 | 13.5 | 0.0741 |
| 198104 | 4200 ECC 42-9 + 63 | Quartz Vein | 2.46 | 13.0 | 0.0769 |
| 298105 | 4200 ESC 42-11 + 30 | Quartz stockwork | 2.43 | 13.2 | 0.0758 |
| 298106 | 4200 WSC 42-8 + 95 | Quartz Vein | 2.33 | 13.7 | 0.0730 |
| 298107 | East Gwen GV-7 + 110 | Quartz Vein | 2.57 | 12.5 | 0.0800 |
| Average | - | - | 2.49 | 12.9 | 0.0775 |
| 14.5 | Statistics |
Drill hole and channel composite samples were grouped accord ding to vein and univariate statistics calculated for each sample type and group. The summary statistics are shown in Table 14-5 through Table 14-8. Boxplots are shown in Figure 14-11 through Figure 14-14.
Table 14-5: Vein Gold (opt) Drill Hole Composite Statistics
| Vein | Min | Q1 | Median | Q3 | Max | Mean | Standard Dev. |
Num Samples |
| V01A | 0.001 | 0.001 | 0.004 | 0.095 | 9.130 | 0.295 | 0.784 | 128 |
| V02A | 0.001 | 0.001 | 0.006 | 0.200 | 7.068 | 0.377 | 0.909 | 151 |
| V03A | 0.001 | 0.001 | 0.009 | 0.148 | 7.887 | 0.188 | 0.479 | 157 |
| V05A | 0.000 | 0.001 | 0.002 | 0.107 | 2.891 | 0.176 | 0.433 | 249 |
| V05B | 0.001 | 0.001 | 0.001 | 0.083 | 51.245 | 0.651 | 4.565 | 211 |
| V061A | 0.001 | 0.001 | 0.003 | 0.093 | 3.986 | 0.223 | 0.757 | 106 |
| V08A | 0.000 | 0.002 | 0.017 | 0.166 | 84.913 | 0.531 | 2.776 | 620 |
| V08B | 0.000 | 0.001 | 0.005 | 0.055 | 1.726 | 0.098 | 0.268 | 161 |
| V141A | 0.001 | 0.006 | 0.049 | 0.230 | 8.007 | 0.272 | 0.846 | 99 |
| V151A | 0.000 | 0.001 | 0.008 | 0.179 | 98.863 | 0.628 | 5.418 | 141 |
| V161A | 0.001 | 0.003 | 0.040 | 0.227 | 12.925 | 0.213 | 0.474 | 152 |
| V162A | 0.001 | 0.003 | 0.048 | 0.180 | 6.180 | 0.253 | 0.745 | 106 |
| V163A | 0.000 | 0.001 | 0.001 | 0.008 | 13.336 | 0.199 | 0.875 | 328 |
| V163B | 0.000 | 0.001 | 0.001 | 0.006 | 14.922 | 0.338 | 2.076 | 159 |
| 109 | P a g e |
|
Technical Report and Pre - Feasibility Study for the Hollister
Underground Mine | Title May 31, 2017 | Effective Date August 9, 2017 | Report Date |
| Vein | Min | Q1 | Median | Q3 | Max | Mean | Standard Dev. |
Num Samples |
| V181A | 0.000 | 0.002 | 0.044 | 0.365 | 23.774 | 0.509 | 1.917 | 470 |
| V182A | 0.001 | 0.003 | 0.021 | 0.088 | 50.172 | 0.265 | 2.598 | 85 |
| V201A | 0.001 | 0.001 | 0.004 | 0.220 | 6.863 | 0.289 | 0.815 | 88 |
| V203A | 0.000 | 0.001 | 0.001 | 0.044 | 15.000 | 0.295 | 1.432 | 132 |
| V211A | 0.000 | 0.001 | 0.004 | 0.051 | 1.907 | 0.107 | 0.309 | 102 |
| V211B | 0.001 | 0.003 | 0.015 | 0.124 | 8.071 | 0.314 | 1.031 | 56 |
| V213A | 0.001 | 0.001 | 0.008 | 0.561 | 7.547 | 0.764 | 1.805 | 36 |
| V22A | 0.001 | 0.001 | 0.110 | 0.491 | 3.542 | 0.629 | 1.112 | 30 |
| V231A | 0.000 | 0.001 | 0.010 | 0.252 | 13.797 | 0.339 | 1.028 | 104 |
| V231B | 0.001 | 0.001 | 0.003 | 0.077 | 66.400 | 0.566 | 5.507 | 29 |
| V232A | 0.001 | 0.009 | 0.077 | 0.312 | 2.164 | 0.277 | 0.438 | 66 |
| V232B | 0.001 | 0.042 | 0.429 | 1.421 | 17.990 | 1.414 | 3.303 | 61 |
| V232F | 0.002 | 0.023 | 0.064 | 0.001 | 0.087 | 0.064 | 0.035 | 5 |
| V243A | 0.001 | 0.081 | 0.575 | 1.054 | 3.626 | 0.906 | 1.185 | 9 |
| V253A | 0.001 | 0.001 | 0.001 | 0.491 | 3.416 | 0.406 | 0.805 | 15 |
| V52A | 0.000 | 0.001 | 0.002 | 0.099 | 8.197 | 0.273 | 0.694 | 128 |
| V52B | 0.000 | 0.001 | 0.001 | 0.050 | 9.226 | 0.318 | 1.213 | 89 |
| V58A | 0.000 | 0.001 | 0.004 | 0.152 | 18.924 | 0.478 | 1.806 | 53 |
Table 14-6: Vein Gold (opt) Channel Composite Statistics
| Vein |
Min |
Q1 |
Median |
Q3 |
Max |
Mean |
Standard Dev. |
Num Samples |
| V01A | 0.019 | 0.058 | 0.212 | 0.695 | 1.086 | 0.398 | 0.371 | 12 |
| V05A | 0.023 | 0.171 | 0.410 | 1.732 | 118.871 | 3.730 | 12.889 | 62 |
| V05B | 0.001 | 0.009 | 0.027 | 0.032 | 0.224 | 0.040 | 0.060 | 11 |
| V061A | 0.002 | 0.879 | 1.476 | 2.972 | 34.709 | 2.467 | 2.944 | 251 |
| V08A | 0.001 | 0.054 | 0.277 | 1.058 | 230.981 | 1.771 | 7.120 | 1730 |
| V08B | 0.001 | 0.001 | 0.010 | 0.100 | 2.736 | 0.172 | 0.463 | 122 |
| V161A | 0.001 | 0.112 | 0.489 | 2.007 | 46.846 | 1.916 | 4.064 | 375 |
| V181A | 0.001 | 0.215 | 0.929 | 2.842 | 119.158 | 3.524 | 9.472 | 1821 |
| V182A | 0.001 | 0.271 | 0.926 | 2.849 | 46.619 | 2.529 | 5.043 | 190 |
| V203A | 0.001 | 0.325 | 1.752 | 3.919 | 37.217 | 3.114 | 4.019 | 620 |
| V211A | 0.001 | 0.012 | 0.035 | 0.210 | 2.163 | 0.194 | 0.345 | 40 |
| V211B | 0.002 | 0.012 | 0.072 | 0.230 | 6.474 | 0.478 | 1.382 | 43 |
| V22A | 0.002 | 0.490 | 1.220 | 2.266 | 4.536 | 1.460 | 1.137 | 54 |
| V231A | 0.002 | 0.177 | 0.948 | 1.848 | 26.694 | 1.542 | 2.583 | 145 |
| V231B | 0.002 | 0.038 | 0.210 | 0.647 | 3.433 | 0.525 | 0.847 | 30 |
| V232A | 0.002 | 0.002 | 0.248 | 0.549 | 1.856 | 0.456 | 0.589 | 17 |
| V232B | 0.002 | 0.059 | 0.218 | 1.059 | 12.765 | 1.098 | 2.077 | 51 |
| V232F | 0.018 | 1.110 | 1.807 | 3.984 | 9.547 | 2.657 | 2.421 | 14 |
| V58A | 0.002 | 0.023 | 0.079 | 0.504 | 7.773 | 0.423 | 0.793 | 137 |
| 110 | P a g e |
|
Technical Report and Pre - Feasibility Study for the Hollister
Underground Mine | Title May 31, 2017 | Effective Date August 9, 2017 | Report Date |
Table 14-7: Vein Silver (opt) Drill Hole Composite Statistics
| Vein | Min | Q1 | Median | Q3 | Max | Mean | Standard Dev. |
Num Samples |
| V01A | 0.001 | 0.001 | 0.023 | 0.285 | 21.297 | 0.911 | 3.229 | 128 |
| V02A | 0.001 | 0.001 | 0.036 | 0.398 | 37.380 | 1.504 | 4.486 | 151 |
| V03A | 0.001 | 0.001 | 0.038 | 0.282 | 29.899 | 0.589 | 1.864 | 157 |
| V05A | 0.001 | 0.001 | 0.009 | 0.224 | 176.744 | 2.090 | 14.774 | 249 |
| V05B | 0.001 | 0.001 | 0.011 | 0.203 | 380.111 | 1.892 | 14.790 | 211 |
| V061A | 0.001 | 0.001 | 0.018 | 0.248 | 21.892 | 0.366 | 0.828 | 106 |
| V08A | 0.001 | 0.029 | 0.211 | 1.242 | 810.144 | 4.282 | 27.412 | 620 |
| V08B | 0.001 | 0.001 | 0.033 | 0.203 | 13.552 | 0.571 | 1.559 | 161 |
| V141A | 0.001 | 0.055 | 0.435 | 1.091 | 55.750 | 2.627 | 7.786 | 99 |
| V151A | 0.001 | 0.001 | 0.077 | 0.679 | 428.358 | 3.135 | 24.044 | 141 |
| V161A | 0.001 | 0.034 | 0.283 | 1.353 | 72.537 | 1.328 | 3.248 | 152 |
| V162A | 0.001 | 0.053 | 0.203 | 1.362 | 36.693 | 1.891 | 5.849 | 106 |
| V163A | 0.001 | 0.001 | 0.017 | 0.102 | 25.320 | 0.262 | 1.442 | 328 |
| V163B | 0.001 | 0.001 | 0.001 | 0.058 | 7.494 | 0.249 | 1.109 | 159 |
| V181A | 0.001 | 0.020 | 0.281 | 2.065 | 541.000 | 4.140 | 19.899 | 470 |
| V182A | 0.001 | 0.053 | 0.154 | 0.577 | 135.057 | 1.102 | 7.208 | 85 |
| V201A | 0.001 | 0.001 | 0.086 | 1.699 | 28.024 | 2.355 | 4.946 | 88 |
| V203A | 0.001 | 0.001 | 0.020 | 0.213 | 21.029 | 0.396 | 1.131 | 132 |
| V211A | 0.001 | 0.007 | 0.202 | 1.818 | 21.294 | 1.522 | 3.373 | 102 |
| V211B | 0.001 | 0.047 | 0.323 | 2.678 | 61.199 | 3.684 | 9.252 | 56 |
| V213A | 0.001 | 0.007 | 0.109 | 1.573 | 29.573 | 5.305 | 10.402 | 36 |
| V22A | 0.001 | 0.045 | 0.546 | 3.811 | 20.273 | 2.683 | 4.239 | 30 |
| V231A | 0.001 | 0.014 | 0.303 | 1.562 | 412.085 | 2.995 | 19.600 | 104 |
| V231B | 0.001 | 0.002 | 0.050 | 0.231 | 6.855 | 0.629 | 1.465 | 29 |
| V232A | 0.001 | 0.147 | 0.455 | 1.556 | 16.989 | 1.689 | 3.205 | 66 |
| V232B | 0.001 | 0.410 | 3.495 | 22.918 | 147.075 | 13.596 | 23.097 | 61 |
| V232F | 0.041 | 0.133 | 0.251 | 0.305 | 0.323 | 0.239 | 0.099 | 5 |
| V243A | 0.001 | 0.142 | 0.700 | 9.673 | 12.628 | 3.702 | 5.078 | 9 |
| V253A | 0.001 | 0.001 | 0.026 | 0.408 | 5.630 | 0.728 | 1.626 | 15 |
| V52A | 0.001 | 0.001 | 0.019 | 0.268 | 9.565 | 0.694 | 1.780 | 128 |
| V52B | 0.001 | 0.001 | 0.015 | 0.073 | 25.442 | 0.885 | 3.737 | 89 |
| V58A | 0.001 | 0.001 | 0.025 | 0.485 | 6.479 | 0.345 | 0.675 | 53 |
Table 14-8: Vein Silver (opt) Channel Composite Statistics
| Vein | Min | Q1 | Median | Q3 | Max | Mean | Standard Dev. |
Num Samples |
| V01A | 0.050 | 0.163 | 1.526 | 2.940 | 7.526 | 2.094 | 2.144 | 12 |
| V05A | 0.050 | 0.344 | 0.888 | 8.212 | 453.328 | 24.994 | 63.972 | 62 |
| V05B | 0.001 | 0.050 | 0.056 | 0.393 | 0.543 | 0.216 | 0.198 | 11 |
| V061A | 0.050 | 2.088 | 3.616 | 7.696 | 88.171 | 6.155 | 8.056 | 251 |
| V08A | 0.001 | 0.741 | 3.215 | 9.394 | 576.014 | 13.095 | 32.789 | 1730 |
| V08B | 0.001 | 0.001 | 0.050 | 0.816 | 85.686 | 5.302 | 16.619 | 122 |
| V161A | 0.001 | 0.634 | 2.780 | 10.314 | 409.364 | 11.990 | 28.552 | 375 |
| 111 | P a g e |
|
Technical Report and Pre - Feasibility Study for the Hollister
Underground Mine | Title May 31, 2017 | Effective Date August 9, 2017 | Report Date |
| Vein | Min | Q1 | Median | Q3 | Max | Mean | Standard Dev. |
Num Samples |
| V181A | 0.001 | 1.988 | 8.099 | 24.160 | 1083.449 | 26.340 | 70.410 | 1821 |
| V182A | 0.001 | 1.737 | 6.905 | 15.521 | 141.568 | 14.058 | 22.068 | 190 |
| V203A | 0.001 | 1.951 | 9.488 | 20.462 | 388.419 | 16.570 | 24.249 | 620 |
| V211A | 0.001 | 0.162 | 0.458 | 1.916 | 36.933 | 2.244 | 5.097 | 40 |
| V211B | 0.050 | 0.198 | 2.665 | 9.701 | 23.927 | 5.684 | 6.656 | 43 |
| V22A | 0.050 | 1.882 | 4.095 | 18.799 | 111.237 | 15.737 | 21.779 | 54 |
| V231A | 0.050 | 1.176 | 3.041 | 11.761 | 164.905 | 10.799 | 20.888 | 145 |
| V231B | 0.050 | 0.319 | 0.705 | 1.491 | 5.965 | 1.283 | 1.517 | 30 |
| V232A | 0.050 | 0.223 | 0.502 | 1.030 | 2.015 | 0.679 | 0.614 | 17 |
| V232B | 0.050 | 1.171 | 3.587 | 7.434 | 71.572 | 6.080 | 9.439 | 51 |
| V232F | 0.050 | 1.668 | 2.850 | 4.813 | 22.042 | 5.039 | 6.050 | 14 |
| V58A | 0.050 | 0.050 | 0.177 | 0.543 | 13.121 | 0.549 | 1.141 | 137 |
![]()
Figure 14-11: Gold (opt) Boxplot for Vein Drill Hole Composites
| 112 | P a g e |
|
Technical Report and Pre - Feasibility Study for the Hollister
Underground Mine | Title May 31, 2017 | Effective Date August 9, 2017 | Report Date |
![]()
Figure 14-12: Gold (opt) Boxplot for Vein Channel Sample Composites
![]()
Figure 14-13: Silver (opt) Boxplot for Vein Drill Hole Composites
| 113 | P a g e |
|
Technical Report and Pre - Feasibility Study for the Hollister
Underground Mine | Title May 31, 2017 | Effective Date August 9, 2017 | Report Date |
![]()
Figure 14-14: Silver (opt) Boxplot for Vein Channel Sample Composites
| 14.6 | Grade Capping |
Grade capping of gold and silver was determined individually for all veins using grade distribution curves and spatial configuration of high grades within the vein. The effectiveness of grade capping is measured through the monthly reconciliation program.
Grade capping was applied through two methods, dependent on the data spacing and type of sample being used in the estimate. The methods, high yield and top cut, are listed in Table 14-9.
| • | With Measured spacing, both drill hole and channel composites were used in the estimation. A combination of both the high yield and the top cut method were used. Composites that had a grade above a specified threshold were only used in the estimation if they were within a restricted distance of the block to be estimated. If that grade was above a subsequent higher threshold (applicable to the channels grade population), the grade was capped at that level. This maintains the grade profile locally (typically in silled areas), but restricts the potential of smearing of metal away from the local area and limits unreasonable metal coming from isolated grade outliers; and |
|
| • | With Indicated and Inferred spacing, only drill hole composites were used in the estimation. The capping method applied was the topcut method. The topcut was determined as applicable to the drill hole grade population. If composites had a grade above a specified threshold, they were capped at that threshold but used in estimation to the full extents of the search ellipse. This removes metal from the grade profile locally but enables the use of that sample in wider spaced drilling to represent the metal of the broader ore shoot. The local metal profile will be refined as infill drilling and eventual silling are undertaken. |
| 114 | P a g e |
|
Technical Report and Pre - Feasibility Study for the Hollister
Underground Mine | Title May 31, 2017 | Effective Date August 9, 2017 | Report Date |
Table 14-9: Capping Methods
| Estimation Pass | Data Used | Capping Method | Extent of Influence |
| Measured | Drill holes + Channels | High Yield + Top Cut | 25x25 |
| Indicated | Drill holes Only | Top Cut | Search Ellipse |
| Inferred | Drill holes Only | Top Cut | Search Ellipse |
In addition to grade capping, the influence of high grades was restricted by the identification of ore shoots on the vein prior to estimation (using on-vein domains). Within the vein, high grade ore shoots often have sharp structurally controlled contacts with adjacent poorly mineralized parts of the vein. An indicator estimation method was used to assign the ore shoot extents to the block model so that these could be estimated separately from the poorly mineralized parts of the vein. In Figure 14-15, the Clementine (V181A) Vein is shown color coded according to its ore shoot indicator estimation. Blocks defined by the estimation as part of an ore shoot are colored red, un-mineralized areas are colored blue. The estimation is based on composite grades which are displayed as dots on Figure 14-15 for reference. Composites are colored red if their gold value is above 0.08 opt, blue if their value is below.
![]()
Figure 14-15: Ore Shoot Indicator Model on the Clementine Vein (V181A)
Ore shoots on the Clementine Vein (as defined by the ore shoot indicator estimation method) are shown in red, weakly mineralized areas of the vein are shown in blue. Black lies above the unconformity surface.
The ore shoot indicator method was assigned to the block model as follows:
| 1. | For gold, a mineralized composite for underground mining purposes was defined as a sample having a grade greater than 0.08 opt. The threshold for silver was set at 0.08 opt; |
|
| 2. | Each vein composite was assigned a “1” if its grade was above the specified threshold, or a “0” if its grade was below; |
|
| 3. | These one and zero values were estimated into the vein blocks, resulting in an estimated value between “0” and “1” being assigned to the block – this value represents the probability that the block is part of an ore shoot; |
| 115 | P a g e |
|
Technical Report and Pre - Feasibility Study for the Hollister
Underground Mine | Title May 31, 2017 | Effective Date August 9, 2017 | Report Date |
| 4. | If a block had a probability of greater than 40% (or 0.4), it was determined to be part of an ore shoot. If the value was less than 0.4, the block was assigned as an un-mineralized block; and |
|
| 5. | Blocks defined as part of the ore shoot were estimated for grade separately from blocks defined as un-mineralized, using a separate set of composites (the ore shoot estimate may use any sample within the vein, the un-mineralized estimate may only use samples within the un-mineralized zone). This ensured high grades from an ore shoot could not be used to estimate adjacent un-mineralized areas. |
The use of an ore shoot indicator complements the capping thresholds used in the grade estimation since high grades are only used to estimate mineralized ore shoot areas of the vein.
Grade capping values used for the grade estimates of the ore shoots are outlined below in Table 14-10.
Table 14-10: Grade Capping Values for Ore Shoots
| Vein |
Gold Thresholds (opt) | Silver Thresholds (opt) | ||||
| High Yield | Channel Top Cut | Drill
hole Top Cut |
High Yield | Channel Top Cut | Drill
hole Top Cut |
|
| V01A | 2 | 4 | 4 | 5 | 12.5 | 12.5 |
| V02A | 4 | 4 | 4 | 20 | 20 | 20 |
| V03A | 3 | 3 | 3 | 10 | 10 | 10 |
| V05A | 7.5 | 20 | 2 | 35 | 75 | 15 |
| V05B | 4 | 4 | 4 | 30 | 30 | 30 |
| V061A | 5 | 10 | 2.5 | 15 | 30 | 10 |
| V08A | 15 | 25 | 15 | 50 | 100 | 75 |
| V08B | 1 | 2 | 2 | 10 | 15 | 5 |
| V141A | 2 | 4 | 3 | 10 | 20 | 20 |
| V151A | 5 | 5 | 5 | 20 | 20 | 20 |
| V161A | 7.5 | 15 | 2 | 50 | 100 | 17.5 |
| V162A | 3 | 3 | 3 | 15 | 15 | 15 |
| V163A | 6 | 6 | 6 | 7.5 | 7.5 | 7.5 |
| V163B | 5 | 5 | 5 | 5 | 5 | 5 |
| V181A | 15 | 25 | 15 | 50 | 100 | 75 |
| V182A | 7.5 | 15 | 5 | 25 | 45 | 10 |
| V201A | 2 | 2 | 2 | 17.5 | 17.5 | 17.5 |
| V203A | 10 | 15 | 4 | 50 | 100 | 7.5 |
| V211A | 2 | 2 | 2 | 7.5 | 12 | 10 |
| V211B | 3 | 3 | 3 | 15 | 20 | 15 |
| V213A | 2 | 2 | 2 | 15 | 15 | 15 |
| V22A | 2 | 3.5 | 2.5 | 15 | 20 | 10 |
| V231A | 4 | 6 | 3 | 30 | 50 | 30 |
| V231B | 2 | 3 | 2 | 3 | 6 | 6 |
| V232A | 2.5 | 2.5 | 2.5 | 5 | 5 | 5 |
| V232B | 4 | 6 | 4 | 20 | 40 | 25 |
| V232F | 4 | 4 | 4 | 5 | 10 | 10 |
| V243A | 2 | 2 | 2 | 7.5 | 7.5 | 7.5 |
| V253A | 2 | 2 | 2 | 5 | 5 | 5 |
| 116 | P a g e |
|
Technical Report and Pre - Feasibility Study for the Hollister
Underground Mine | Title May 31, 2017 | Effective Date August 9, 2017 | Report Date |
| Vein | Gold Thresholds (opt) | Silver Thresholds (opt) | ||||
| V52A | 3 | 3 | 3 | 6 | 6 | 6 |
| V52B | 4 | 4 | 4 | 5 | 5 | 5 |
| V58A | 2 | 6 | 6 | 4 | 6 | 3 |
Figure 14-16 through Figure 14-19 are example grade distribution curves for the V231A Vein as an example of the capping thresholds chosen.
![]()
Figure 14-16: V231A Vein Gold Grade Distribution Curve – Channels and Drill Holes
![]()
Figure14-17: V231A Vein Gold Grade Distribution Curve – Drill Holes Only
| 117 | P a g e |
|
Technical Report and Pre - Feasibility Study for the Hollister
Underground Mine | Title May 31, 2017 | Effective Date August 9, 2017 | Report Date |
![]()
Figure 14-18: V231A Silver Grade Distribution Curve – Channels and Drill Holes
![]()
Figure14-19: V231A Vein Silver Grade Distribution Curve – Drill Holes Only
| 14.7 | Variography |
Variograms were calculated using Vulcan software for the gold composites within each of the Clementine, V231A, and Gwenivere veins. Both Clementine and Gwenivere contain closely spaced underground channel samples throughout the veins whilst V231A is mostly drilled to 50-foot spacing. The variogram gives an indication of the continuity of grade seen for a vein. On each vein, the major and semi-major directions were modeled as along the strike and down the dip of the veins. The minor direction was across the thickness of the vein where one composite exists and therefore is not displayed.
| 118 | P a g e |
|
Technical Report and Pre - Feasibility Study for the Hollister
Underground Mine | Title May 31, 2017 | Effective Date August 9, 2017 | Report Date |
The Clementine variogram indicates greater continuity than the Gwenivere and V231A variograms. Whilst having a higher nugget, the Clementine vein variogram at 50 feet is at ~80% of the sill and reaches its full range at ~200 feet. In contrast, the Gwenivere vein is at 95% of the sill at 50 feet and reaches its full range at ~100 feet. This is consistent with the results of mining seen to date. The Clementine vein ore shoots were more continuous along strike for high grade mineralization. The Gwenivere vein showed higher variability of grade rapidly changing between high and low grades. The V231A variogram is dominated by drilling and hence reaches its first structure around 50 feet (in line with the infill drill spacing), the characteristics of the variogram to date are more consistent with the Clementine vein variogram.
![]()
Figure14-20: Clementine Vein Major Experimental Variogram and Modeled Variogram for Gold Grade
| 119 | P a g e |
|
Technical Report and Pre - Feasibility Study for the Hollister
Underground Mine | Title May 31, 2017 | Effective Date August 9, 2017 | Report Date |
![]()
Figure 14-21: Gwenivere Major Experimental Variogram and Modeled Variograms for Gold Grade
| 120 | P a g e |
|
Technical Report and Pre - Feasibility Study for the Hollister
Underground Mine | Title May 31, 2017 | Effective Date August 9, 2017 | Report Date |
![]()
Figure 14-22: V231A Major Experimental Variogram and Modeled Variograms for Gold Grade
| 14.8 | Block Model |
Individual block models were constructed for each vein. A five-foot by five-foot parent block size was used on the vein along strike and down dip, with sub-blocking across the vein so the block size would match the vein thickness. A minimum thickness of either 0.1 or 0.001 feet was used dependent on the method used to build the block model. The block model is rotated such that the thickness of the vein represents the Z direction. Therefore, the block width across the vein is within 0.001 or 0.1 feet of the actual width of the vein solid. Table 14-11 lists the geometry of each model.
During creation of each block model, the dip direction and dip relative to the vein hanging wall and footwall contacts was assigned to each vein block.
Table 14-11: Geometry of Block Models
| Vein | Origin X | Origin Y | Origin Z | Bearing | Dip | Plunge | X Length | Y Length | Z Length | Parent X | Parent Y | Min Z |
| V01A | 231461.6435 | 318230.0896 | 4951.328142 | 275 | -85 | 0 | 1105 | 705 | 214.645 | 5 | 5 | 0.001 |
| V02A | 231549.7403 | 318174.5989 | 4879.990781 | 285 | -84 | 0 | 1205 | 755 | 185.521 | 5 | 5 | 0.001 |
| V03A | 231331.0609 | 318343.7209 | 4861.046551 | 285 | -84 | 0 | 1255 | 805 | 105.374 | 5 | 5 | 0.001 |
| V05A | 230014.9658 | 318975.7022 | 4810.343896 | 110 | -80 | 0 | 1650 | 950 | 419.8 | 5 | 5 | 0.1 |
| V05B | 230014.9658 | 318975.7022 | 4810.343896 | 110 | -80 | 0 | 1650 | 950 | 419.8 | 5 | 5 | 0.1 |
| V061A | 230714.2783 | 318591.169 | 4895.107343 | 100 | -88 | 0 | 1005 | 755 | 86.416 | 5 | 5 | 0.001 |
| V08A | 228742.9167 | 320071.1489 | 4547.851072 | 110 | -85 | 0 | 3100 | 1150 | 3000 | 5 | 5 | 0.1 |
| V08B | 228742.9167 | 320071.1489 | 4547.851072 | 110 | -85 | 0 | 3100 | 1150 | 3000 | 5 | 5 | 0.1 |
| 121 | P a g e |
|
Technical Report and Pre - Feasibility Study for the Hollister
Underground Mine | Title May 31, 2017 | Effective Date August 9, 2017 | Report Date |
| Vein | Origin X | Origin Y | Origin Z | Bearing | Dip | Plunge | X Length | Y Length | Z Length | Parent X | Parent Y | Min Z |
| V141A | 229599.9279 | 319210.008 | 4758.04259 | 98 | -88 | 0 | 755 | 705 | 51.192 | 5 | 5 | 0.001 |
| V151A | 230454.6181 | 319111.3471 | 4712.5 | 275 | -90 | 0 | 855 | 755 | 77.023 | 5 | 5 | 0.001 |
| V161A | 229494.5 | 319249.2559 | 4671.583155 | 90 | -88 | 0 | 1105 | 805 | 95.007 | 5 | 5 | 0.001 |
| V162A | 229653.5 | 319245.0461 | 4703.15832 | 270 | -85 | 0 | 1205 | 805 | 176.85 | 5 | 5 | 0.001 |
| V163A | 231616.2152 | 318969.7188 | 4764.870378 | 280 | -80 | 0 | 1050 | 800 | 66.5 | 5 | 5 | 0.1 |
| V163B | 231616.2152 | 318969.7188 | 4764.870378 | 280 | -80 | 0 | 1050 | 800 | 66.5 | 5 | 5 | 0.1 |
| V181A | 231874.5 | 319090.8552 | 4412.614089 | 270 | -85 | 0 | 255 | 1205 | 317.873 | 5 | 5 | 0.001 |
| V182A | 229521.5 | 319356.5424 | 4746.039037 | 270 | -85 | 0 | 955 | 805 | 99.091 | 5 | 5 | 0.001 |
| V201A | 229853.1137 | 319233.9668 | 4795.630205 | 285 | -85 | 0 | 705 | 705 | 128.512 | 5 | 5 | 0.001 |
| V203A | 231591.9124 | 319023.5904 | 4570.285019 | 285 | -85 | 0 | 1355 | 1155 | 207.387 | 5 | 5 | 0.001 |
| V211A | 228042.0592 | 319716.6603 | 4585.952616 | 82 | -86 | 0 | 1400 | 950 | 602 | 5 | 5 | 0.1 |
| V211B | 228042.0592 | 319716.6603 | 4585.952616 | 82 | -86 | 0 | 1400 | 950 | 602 | 5 | 5 | 0.1 |
| V213A | 229371.5679 | 319621.5813 | 4816.929853 | 110 | -88 | 0 | 955 | 605 | 262.783 | 5 | 5 | 0.001 |
| V22A | 228527.4633 | 320007.5476 | 4716.931116 | 240 | -80 | 0 | 855 | 755 | 56.436 | 5 | 5 | 0.001 |
| V231A | 227872.207 | 319646.2392 | 4593.185796 | 82 | -86 | 0 | 1450 | 950 | 430.8 | 5 | 5 | 0.1 |
| V231B | 227872.207 | 319646.2392 | 4593.185796 | 82 | -86 | 0 | 1450 | 950 | 430.8 | 5 | 5 | 0.1 |
| V232A | 227237.2883 | 319788.0747 | 4773.66384 | 82 | -86 | 0 | 1350 | 800 | 245.6 | 5 | 5 | 0.1 |
| V232B | 227237.2883 | 319788.0747 | 4773.66384 | 82 | -86 | 0 | 1350 | 800 | 245.6 | 5 | 5 | 0.1 |
| V232F | 227894.5155 | 319828.8069 | 5034.365721 | 82 | -86 | 0 | 205 | 155 | 35.302 | 5 | 5 | 0.001 |
| V243A | 231473.5 | 319470.3279 | 5193.5 | 270 | -90 | 0 | 555 | 505 | 45.926 | 5 | 5 | 0.001 |
| V253A | 230865.4804 | 319615.6832 | 4729.635025 | 100 | -85 | 0 | 605 | 855 | 79.076 | 5 | 5 | 0.001 |
| V52A | 231644.4445 | 318145.2459 | 4909.691804 | 275 | -85 | 0 | 1150 | 650 | 199 | 5 | 5 | 0.1 |
| V52B | 231644.4445 | 318145.2459 | 4909.691804 | 275 | -85 | 0 | 1150 | 650 | 199 | 5 | 5 | 0.1 |
| V58A | 231641.1892 | 317897.6986 | 4997.050239 | 285 | -88 | 0 | 705 | 505 | 95.132 | 5 | 5 | 0.001 |
Each unique vein name is assigned to a block variable called “structure”. The block model variables are defined in Table 14-12.
Table 14-12: Block Model Variables
| Variables | Default | Type | Description |
| structure | none | name | structure name |
| thickness | 0 | float | thickness |
| density | 0 | float | density |
| dip_direction | -99 | float | Dip Direction of vein (0 to 360) |
| dip | -99 | float | Dip of vein (0 to -90) |
| plunge | -99 | float | Plunge of vein (0) |
| au_opt | -99 | float | Gold - Grade Estimate (Ounces per Ton) |
| au_flag | 0 | byte | Gold - Estimation Flag |
| au_ndh | 0 | byte | Gold - Number Drill Holes |
| au_dist | 0 | float | Gold - Average Distance to Samples |
| au_ns | 0 | byte | Gold - Number of Samples |
| au_opt_nn | -99 | float | Gold - Nearest Neighbor (Ounces per Ton) |
| au_nn_dist | 0 | float | Distance to nearest sample |
| ag_opt | -99 | float | Silver - Grade Estimate (Ounces per Ton) |
| ag_flag | 0 | byte | Silver - Estimation Flag |
| ag_ndh | 0 | byte | Silver - Number Drill Holes |
| ag_dist | 0 | float | Silver - Average Distance to Samples |
| ag_ns | 0 | byte | Silver - Number of Samples |
| ag_opt_nn | -99 | float | Silver - Nearest Neighbor (Ounces per Ton) |
| ag_nn_dist | 0 | float | Distance to nearest sample |
| aueq | -99 | double | Gold Equivalence (Ounces per Ton) |
| agau | -99 | double | Silver:Gold Ratio |
| au_ind | -99 | float | Gold Indicator (Probability) |
| au_ind_flag | 0 | byte | Gold Indicator - Estimation Flag |
| 122 | P a g e |
|
Technical Report and Pre - Feasibility Study for the Hollister
Underground Mine | Title May 31, 2017 | Effective Date August 9, 2017 | Report Date |
| Variables | Default | Type | Description |
| au_ore shoot | waste | name | Gold Ore shoot (ore/waste) |
| ag_ind | -99 | float | Silver Indicator (Probability) |
| ag_ind_flag | 0 | byte | Silver Indicator - Estimation Flag |
| ag_ore shoot | waste | name | Silver Ore shoot (ore/waste) |
| mindex | -99 | float | Minability Index (3,2,1,0) |
| void_pct | -99 | float | Estimated Percentage of Void (0-100%) |
| density_void_adj | -99 | float | Density Adjusted for Voids |
| mined | insitu | name | Block Status (insitu, sterile, mined) |
| aueqgt | -99 | float | AuEq Grade Thickness (opt per ft) |
| classname | none | name | Classification (meas, ind, inf) |
| aueng | 0 | float | Au Engineering |
| ageng | 0 | float | Ag Engineering |
| aueqeng | 0 | float | AuEq Engineering |
| plan_dil | 0 | float | Planned Dilution |
| thick | 0 | float | Vein Thickness |
| mine_thick | 0 | float | Mining Thickness |
| gradethick | 0 | float | Grade Thickness |
| mine_tons | 0 | float | Mined Tons |
| aueq_dil | 0 | float | Diluted AuEq |
| matl | none | name | Material Type |
| depth | 0 | float | Depth from Topography Surface (ft) |
| volume | - | predefined | |
| xlength | - | predefined | |
| ylength | - | predefined | |
| zlength | - | predefined | |
| xcentre | - | predefined | |
| ycentre | - | predefined | |
| zcentre | - | predefined | |
| xworld | - | predefined | |
| yworld | - | predefined | |
| zworld | - | predefined |
| 14.9 | Grade Estimation |
Gold and silver values were estimated using the ID3 method. The ID3 method was applied in multiple passes defining the extents of the measured, indicated, and inferred classifications.
The channel composites were only used for the measured pass, which has a search ellipsoid of 40 feet by 40 feet by 20 feet. This was done to ensure that high grade was not extended further than is supported by the data. In addition, cell de-clustering was run on the composites, and this weighting was used in the estimate so that individual closely spaced channel data would be weighted lower relative to individual drill hole intercepts that supported larger adjacent volumes. These techniques, along with the capping strategy, limit the range of influence of the high grade channel sample composites.
Anisotropic search parameters for gold were aligned to the local dip direction and dip of each vein block as assigned during the creation of the block model. Search distances were tailored to the expected spacing of sample composites intercepting the vein models for each estimation pass. The vein’s gold and silver grades were estimated only using composites from within the vein.
| 123 | P a g e |
|
Technical Report and Pre - Feasibility Study for the Hollister
Underground Mine | Title May 31, 2017 | Effective Date August 9, 2017 | Report Date |
The estimation search parameters are shown in Table 14-13. The search ellipse orientations were orientated to the vein orientations outlined in Table 14-3.
Table 14-13: Estimation Search Parameters by Resource Category
| Pass |
Parent | Major (ft) |
Semi (ft) |
Minor (ft) |
Min Samp |
Max Samp |
Sample
Spacing |
||
| X | Y | Z | |||||||
| Measured | 10 | 5 | 25 | 40 | 40 | 20 | 4 | 9 | Underground channels typically 10’ x 6’ |
| Indicated | 25 | 25 | 25 | 100 | 100 | 50 | 3 | 7 | Infill Drilling typically 50’ x 50’ |
| Inferred | 50 | 50 | 25 | 300 | 300 | 150 | 2 | 7 | Exploration Drilling typically 150’ x 150’ |
Significant parameters used in the gold and silver estimations included:
| 1. | Assigning of parent block values to sub-blocks. This ensures the grade tonnage curve of the material estimated matches the support of the drill spacing informing the estimate; |
|
| 2. | Only composites with a value greater or equal to zero were used; |
|
| 3. | A minimum of four and maximum of nine samples were used to estimate measured blocks, a minimum of three and maximum of seven to estimate indicated blocks, and minimum of two and maximum of seven to estimate inferred blocks; |
|
| 4. | Composites were selected using anisotropic distances oriented to the local dip and dip direction of the vein; |
|
| 5. | Due to the use of ID, composites were additionally weighted using a de-clustering field in the composite database; |
|
| 6. | Only composites within the veins were used to estimate blocks within the veins. Estimation of ore shoot identified blocks could use samples on the vein both within the ore shoot and outside of the ore shoot (soft boundary). Estimation of the blocks identified as being outside an ore shoot could only use samples identified as outside the ore shoot (hard boundary); |
|
| 7. | Grades were capped using a combined high yield search restriction and top cut method for measured material; |
|
| 8. | Grades were capped with a top cut for indicated and inferred material; and |
|
| 9. | Gold and silver for blocks outside vein solids were not estimated. |
| 14.9.1 | Void Percentage |
No significant voids have been encountered in veins mined to date at the Mine. As such, no void percentages have been assigned to the modeled veins to account for losses of vein tons and metal to voids.
| 14.9.2 | Mineability Index |
To aid mine grade control, a “mineability index” was assigned to vein intercepts in core holes. The mineability index represents a vein quality designation to identify better quality vein intersections that represent reduced risk for mining. The actual grade of the intercepts do not impact the assignment of the mineability index value, only vein quality as determined from the core photos impact it. No mineability index was assigned to channel samples. Quality ranks between “0” and “3”, with a 3 being the highest quality designation as shown in Figure 14-23.
| 124 | P a g e |
|
Technical Report and Pre - Feasibility Study for the Hollister
Underground Mine | Title May 31, 2017 | Effective Date August 9, 2017 | Report Date |
In addition to these designations, the code “-99” represents core holes for which no core photos exist or the assignment has not been undertaken to date. In this situation, no mineability index was definable. Future updates will include a code of “RC” for reverse circulation intercepts where no core photos exist. The mineability index was assigned for each vein to the block model through a simple nearest neighbor designation.
![]()
Figure 14-23: Mineability Code Overview
Where mineability indices are similar, the drill holes indicate that most likely the vein development is consistent. Where the mineability indices vary between holes, the drill holes indicate that the vein thickness most likely varies significantly along strike and ore shoot development may be highly variable.
The mineability indices for select veins are shown in Figure 14-24 through Figure 14-27. The V203A vein dominantly displays index values of 1 and 2. The mineability index indicates a vein thickness that is typically narrow but continuous. This matches mining that occurred on the vein historically; V203A was a narrow but continuous and high grade vein in which narrow mining techniques were required to maximize the grade mined. Vein V02A typically displays index values between one and three. The vein thickness varies significantly and rapidly along the vein length. This indicates a vein that is expected to vary in width and quality considerably within short distances. V232B represents the best developed vein within the Gloria vein set with index values typically between two and three. This is consistent with mining to date where the vein has generally been ~2 feet wide, well developed, and continuous.
![]()
Figure 14-24: Mineability Index Legend for Gold and Silver Grade
|
Technical Report and Pre - Feasibility Study for the Hollister
Underground Mine | Title May 31, 2017 | Effective Date August 9, 2017 | Report Date |
![]()
Figure 14-25: Vein V203A Assigned Mineability Index
| 126 | P a g e |
|
Technical Report and Pre - Feasibility Study for the Hollister
Underground Mine | Title May 31, 2017 | Effective Date August 9, 2017 | Report Date |
![]()
Figure 14-26: Vein V02A Assigned Mineability Index
![]()
Figure 14-27: Vein V232B Assigned Mineability Index
| 127 | P a g e |
|
Technical Report and Pre - Feasibility Study for the Hollister
Underground Mine | Title May 31, 2017 | Effective Date August 9, 2017 | Report Date |
| 14.10 | Mined Depletion and Sterilization |
The vein block models were depleted by creating simplified as-built surveys of the existing underground workings. Blocks within the survey were flagged as “mined”. The grades and the density within the flagged blocks remain intact in order to reconcile with mining. Blocks within 100 feet of the topography surface were deemed sterilized for underground mining purposes and were flagged as “sterile”. Blocks below the 4850 Level in the historical Mine and Gloria areas were deemed too deep to contain economic mineralization due to the nature of the local epithermal controls and were therefore flagged as “sterile”.
In Figure 14-28 through Figure 14-30, the estimated grade blocks are shown in blue, depleted blocks are shown in red, and sterilized blocks are shown in orange for select veins to show the depletion results.
![]()
Figure 14-28: Clementine Vein (V181A) Mining Extent
| 128 | P a g e |
|
Technical Report and Pre - Feasibility Study for the Hollister
Underground Mine | Title May 31, 2017 | Effective Date August 9, 2017 | Report Date |
![]()
Figure 14-29: V231A Vein (Gloria Vein Set) Mining Extent
![]()
Figure 14-30: V232B Vein (Gloria Vein Set) Mining Extent
| 129 | P a g e |
|
Technical Report and Pre - Feasibility Study for the Hollister
Underground Mine | Title May 31, 2017 | Effective Date August 9, 2017 | Report Date |
| 14.11 | Model Validation |
The mean gold grades for each vein were compared against a nearest neighbor (representing de-clustered composites) in Table 14-14. Individual vein comparisons vary depending on sample support and grade variability. Globally, the vein estimates are 8.1% lower in grade than the nearest neighbor at 0.292 opt vs 0.318 opt. This lower overall grade is expected due to grade capping and the effect of the sample sharing at the ore shoot contacts. Table 14-15 represents the same data for silver which shows the same general relationships with a combined 6.3% lower overall grade at 1.922 opt vs 2.052 opt.
Table 14-14: Estimate Comparison for Gold Versus a Nearest Neighbor at Zero opt Cutoff
| Nearest Neighbor (opt) | Estimates (opt) | Mean
Diff. |
|||||||||||||
| Min |
Q1 |
Q3 |
Max |
Mean |
Std. Dev. |
Min |
Q1 |
Q3 |
Max |
Mean |
Std. Dev. |
||||
| V58A | 0.001 | 0.001 | 0.003 | 0.453 | 6.000 | 0.436 | 1.237 | 0.001 | 0.005 | 0.018 | 0.327 | 5.890 | 0.389 | 0.957 | -10.8% |
| V52B | 0.001 | 0.001 | 0.001 | 0.014 | 4.000 | 0.181 | 0.695 | 0.001 | 0.002 | 0.012 | 0.070 | 3.994 | 0.187 | 0.557 | 3.5% |
| V52A | 0.001 | 0.001 | 0.002 | 0.068 | 3.000 | 0.189 | 0.431 | 0.001 | 0.002 | 0.008 | 0.243 | 2.656 | 0.169 | 0.319 | -10.2% |
| V253A | 0.001 | 0.001 | 0.002 | 0.744 | 2.000 | 0.459 | 0.712 | 0.001 | 0.001 | 0.001 | 0.646 | 1.979 | 0.340 | 0.496 | -25.8% |
| V243A | 0.001 | 0.004 | 0.236 | 0.786 | 2.000 | 0.371 | 0.495 | 0.001 | 0.253 | 0.400 | 0.646 | 1.944 | 0.462 | 0.393 | 24.7% |
| V232F | 0.002 | 0.008 | 0.012 | 0.087 | 4.000 | 0.495 | 1.070 | 0.002 | 0.024 | 0.031 | 0.143 | 2.799 | 0.418 | 0.764 | -15.6% |
| V232B | 0.001 | 0.003 | 0.132 | 1.206 | 6.000 | 0.763 | 1.136 | 0.001 | 0.016 | 0.490 | 1.241 | 5.112 | 0.762 | 0.881 | 0.0% |
| V232A | 0.001 | 0.007 | 0.055 | 0.239 | 2.164 | 0.256 | 0.447 | 0.001 | 0.014 | 0.060 | 0.319 | 1.995 | 0.217 | 0.299 | -15.4% |
| V231B | 0.001 | 0.001 | 0.007 | 0.031 | 3.000 | 0.089 | 0.327 | 0.001 | 0.004 | 0.007 | 0.028 | 2.504 | 0.073 | 0.216 | -17.6% |
| V231A | 0.001 | 0.001 | 0.002 | 0.200 | 6.000 | 0.293 | 0.713 | 0.001 | 0.001 | 0.008 | 0.270 | 5.002 | 0.283 | 0.557 | -3.3% |
| V22A | 0.001 | 0.001 | 0.003 | 0.328 | 3.500 | 0.315 | 0.670 | 0.001 | 0.003 | 0.019 | 0.425 | 3.296 | 0.331 | 0.534 | 4.8% |
| V213A | 0.001 | 0.001 | 0.005 | 0.374 | 2.000 | 0.305 | 0.613 | 0.001 | 0.003 | 0.011 | 0.419 | 1.995 | 0.277 | 0.461 | -9.3% |
| V211B | 0.001 | 0.003 | 0.005 | 0.101 | 3.000 | 0.173 | 0.476 | 0.001 | 0.006 | 0.018 | 0.105 | 2.994 | 0.169 | 0.428 | -2.1% |
| V211A | 0.001 | 0.001 | 0.002 | 0.039 | 2.000 | 0.076 | 0.250 | 0.001 | 0.003 | 0.011 | 0.041 | 1.905 | 0.070 | 0.200 | -8.1% |
| V203A | 0.001 | 0.001 | 0.004 | 0.030 | 15.000 | 0.309 | 1.147 | 0.001 | 0.001 | 0.008 | 0.063 | 13.980 | 0.303 | 0.947 | -1.9% |
| V201A | 0.001 | 0.001 | 0.004 | 0.039 | 2.000 | 0.170 | 0.419 | 0.001 | 0.002 | 0.007 | 0.093 | 1.850 | 0.150 | 0.328 | -11.6% |
| V182A | 0.001 | 0.001 | 0.006 | 0.071 | 15.000 | 0.318 | 1.303 | 0.001 | 0.006 | 0.019 | 0.082 | 12.259 | 0.272 | 0.855 | -14.2% |
| V181A | 0.001 | 0.001 | 0.025 | 0.376 | 25.000 | 0.708 | 2.459 | 0.001 | 0.004 | 0.033 | 0.433 | 25.000 | 0.632 | 1.812 | -10.7% |
| V163B | 0.001 | 0.001 | 0.001 | 0.006 | 5.000 | 0.072 | 0.501 | 0.001 | 0.001 | 0.003 | 0.008 | 4.741 | 0.086 | 0.449 | 20.1% |
| V163A | 0.001 | 0.001 | 0.001 | 0.007 | 6.000 | 0.120 | 0.531 | 0.001 | 0.001 | 0.002 | 0.008 | 4.835 | 0.099 | 0.354 | -17.3% |
| V162A | 0.001 | 0.008 | 0.140 | 0.152 | 3.000 | 0.170 | 0.363 | 0.001 | 0.010 | 0.083 | 0.133 | 2.899 | 0.157 | 0.302 | -7.6% |
| V161A | 0.001 | 0.006 | 0.059 | 0.270 | 15.000 | 0.382 | 1.176 | 0.001 | 0.016 | 0.134 | 0.357 | 11.641 | 0.360 | 0.806 | -5.6% |
| V151A | 0.001 | 0.001 | 0.006 | 0.098 | 5.000 | 0.321 | 0.906 | 0.001 | 0.003 | 0.014 | 0.136 | 4.997 | 0.290 | 0.735 | -9.5% |
| V141A | 0.001 | 0.007 | 0.087 | 0.288 | 4.000 | 0.238 | 0.529 | 0.001 | 0.020 | 0.085 | 0.198 | 3.170 | 0.204 | 0.365 | -14.4% |
| V08B | 0.001 | 0.001 | 0.002 | 0.033 | 2.000 | 0.113 | 0.308 | 0.001 | 0.001 | 0.007 | 0.052 | 1.710 | 0.094 | 0.210 | -16.8% |
| V08A | 0.001 | 0.001 | 0.015 | 0.144 | 25.000 | 0.491 | 2.059 | 0.001 | 0.008 | 0.024 | 0.228 | 25.000 | 0.444 | 1.502 | -9.5% |
| V061A | 0.001 | 0.001 | 0.001 | 0.111 | 10.000 | 0.352 | 0.937 | 0.001 | 0.001 | 0.004 | 0.123 | 6.773 | 0.340 | 0.769 | -3.2% |
| V05B | 0.001 | 0.001 | 0.001 | 0.015 | 4.000 | 0.197 | 0.616 | 0.001 | 0.001 | 0.003 | 0.042 | 3.943 | 0.188 | 0.476 | -4.4% |
| V05A | 0.001 | 0.001 | 0.001 | 0.046 | 20.000 | 0.199 | 0.932 | 0.001 | 0.001 | 0.004 | 0.120 | 18.299 | 0.181 | 0.580 | -8.7% |
| V03A | 0.001 | 0.001 | 0.001 | 0.034 | 3.000 | 0.139 | 0.390 | 0.001 | 0.002 | 0.009 | 0.060 | 2.505 | 0.115 | 0.253 | -17.2% |
| V02A | 0.001 | 0.001 | 0.003 | 0.059 | 4.000 | 0.265 | 0.722 | 0.001 | 0.003 | 0.010 | 0.056 | 3.870 | 0.233 | 0.538 | -11.9% |
| V01A | 0.001 | 0.001 | 0.004 | 0.101 | 4.000 | 0.228 | 0.640 | 0.001 | 0.003 | 0.017 | 0.183 | 3.705 | 0.230 | 0.466 | 1.0% |
Table 14-15: Estimate Comparison for Silver Versus a Nearest Neighbor at Zero opt Cutoff
| Vein | Nearest Neighbor (opt) | Estimates (opt) | Mean
Diff. |
||||||||||||
| Min |
Q1 |
Q3 |
Max |
Mean |
Std. Dev. |
Min |
Q1 |
Q3 |
Max |
Mean |
Std. Dev. |
||||
| V58A | 0.001 | 0.001 | 0.023 | 0.528 | 6.000 | 0.455 | 0.827 | 0.001 | 0.002 | 0.024 | 0.520 | 5.605 | 0.347 | 0.543 | -23.6% |
| V52B | 0.001 | 0.001 | 0.006 | 0.045 | 5.000 | 0.276 | 0.973 | 0.001 | 0.008 | 0.019 | 0.046 | 4.980 | 0.264 | 0.795 | -4.3% |
| V52A | 0.001 | 0.001 | 0.018 | 0.073 | 6.000 | 0.378 | 1.124 | 0.001 | 0.008 | 0.029 | 0.310 | 5.995 | 0.379 | 0.943 | 0.2% |
| V253A | 0.001 | 0.001 | 0.044 | 0.680 | 5.000 | 0.870 | 1.675 | 0.001 | 0.004 | 0.030 | 0.679 | 4.927 | 0.700 | 1.338 | -19.5% |
| V243A | 0.001 | 0.038 | 0.350 | 0.744 | 7.500 | 1.064 | 1.963 | 0.001 | 0.428 | 1.171 | 1.567 | 7.500 | 1.459 | 1.664 | 37.1% |
| V232F | 0.041 | 0.056 | 0.113 | 0.323 | 10.000 | 0.937 | 2.020 | 0.041 | 0.056 | 0.232 | 0.405 | 7.303 | 0.836 | 1.493 | -10.7% |
| V232B | 0.001 | 0.233 | 3.121 | 24.500 | 40.000 | 9.316 | 10.427 | 0.001 | 0.528 | 5.497 | 19.901 | 25.000 | 9.512 | 9.397 | 2.1% |
| V232A | 0.001 | 0.101 | 0.427 | 1.671 | 5.000 | 0.949 | 1.193 | 0.002 | 0.306 | 0.729 | 1.283 | 4.944 | 0.971 | 0.992 | 2.3% |
| 130 | P a g e |
|
Technical Report and Pre - Feasibility Study for the Hollister
Underground Mine | Title May 31, 2017 | Effective Date August 9, 2017 | Report Date |
| Vein | Nearest Neighbor (opt) | Estimates (opt) | Mean Diff. | ||||||||||||
| V231B | 0.001 | 0.012 | 0.175 | 0.187 | 6.000 | 0.868 | 1.781 | 0.001 | 0.049 | 0.423 | 0.875 | 5.755 | 0.685 | 0.887 | -21.1% |
| V231A | 0.001 | 0.001 | 0.096 | 1.141 | 50.000 | 1.961 | 5.185 | 0.001 | 0.015 | 0.421 | 1.519 | 44.751 | 1.788 | 3.782 | -8.8% |
| V22A | 0.001 | 0.001 | 0.120 | 1.884 | 20.000 | 1.922 | 3.696 | 0.001 | 0.067 | 0.484 | 2.160 | 20.000 | 1.802 | 2.956 | -6.2% |
| V213A | 0.001 | 0.007 | 0.111 | 0.791 | 15.000 | 2.202 | 4.879 | 0.001 | 0.023 | 1.260 | 3.637 | 14.958 | 2.543 | 3.455 | 15.5% |
| V211B | 0.001 | 0.050 | 0.295 | 2.491 | 20.000 | 2.151 | 3.825 | 0.001 | 0.063 | 0.673 | 2.671 | 19.017 | 2.145 | 3.297 | -0.3% |
| V211A | 0.001 | 0.001 | 0.090 | 0.756 | 12.000 | 0.957 | 1.982 | 0.001 | 0.017 | 0.191 | 1.322 | 11.178 | 0.949 | 1.640 | -0.9% |
| V203A | 0.001 | 0.001 | 0.047 | 0.263 | 100.00 | 1.254 | 6.046 | 0.001 | 0.006 | 0.041 | 0.463 | 84.606 | 1.266 | 5.135 | 0.9% |
| V201A | 0.001 | 0.001 | 0.102 | 1.021 | 17.500 | 1.830 | 4.155 | 0.001 | 0.014 | 0.148 | 1.626 | 17.244 | 1.660 | 3.111 | -9.3% |
| V182A | 0.001 | 0.012 | 0.088 | 0.554 | 45.000 | 1.494 | 5.135 | 0.001 | 0.027 | 0.107 | 0.708 | 40.816 | 1.306 | 3.764 | -12.6% |
| V181A | 0.001 | 0.020 | 0.283 | 2.761 | 100.00 | 5.844 | 16.483 | 0.001 | 0.033 | 0.831 | 3.526 | 100.00 | 5.169 | 12.03 | -11.6% |
| V163B | 0.001 | 0.001 | 0.001 | 0.047 | 5.000 | 0.116 | 0.554 | 0.001 | 0.003 | 0.011 | 0.044 | 4.750 | 0.120 | 0.465 | 3.1% |
| V163A | 0.001 | 0.001 | 0.001 | 0.061 | 7.500 | 0.152 | 0.604 | 0.001 | 0.002 | 0.015 | 0.059 | 7.283 | 0.131 | 0.428 | -14.2% |
| V162A | 0.001 | 0.055 | 0.158 | 1.391 | 15.000 | 1.067 | 2.418 | 0.001 | 0.066 | 0.156 | 0.884 | 14.980 | 0.917 | 2.045 | -14.0% |
| V161A | 0.001 | 0.053 | 0.653 | 1.663 | 100.00 | 2.416 | 8.166 | 0.001 | 0.072 | 0.822 | 1.941 | 89.469 | 2.386 | 5.714 | -1.2% |
| V151A | 0.001 | 0.001 | 0.060 | 0.502 | 20.000 | 1.555 | 4.118 | 0.001 | 0.017 | 0.139 | 1.083 | 19.988 | 1.383 | 3.058 | -11.0% |
| V141A | 0.001 | 0.035 | 0.322 | 0.780 | 20.000 | 1.881 | 4.664 | 0.001 | 0.054 | 0.370 | 0.923 | 19.595 | 1.650 | 3.329 | -12.3% |
| V08B | 0.001 | 0.001 | 0.023 | 0.166 | 15.000 | 0.405 | 0.981 | 0.001 | 0.001 | 0.037 | 0.582 | 14.369 | 0.408 | 0.761 | 0.6% |
| V08A | 0.001 | 0.020 | 0.219 | 1.561 | 100.00 | 3.521 | 11.645 | 0.001 | 0.044 | 0.436 | 1.962 | 99.432 | 3.234 | 8.846 | -8.1% |
| V061A | 0.001 | 0.001 | 0.001 | 0.350 | 30.000 | 0.713 | 2.176 | 0.001 | 0.001 | 0.016 | 0.641 | 22.740 | 0.708 | 1.756 | -0.8% |
| V05B | 0.001 | 0.001 | 0.001 | 0.111 | 30.000 | 1.049 | 4.371 | 0.001 | 0.001 | 0.017 | 0.260 | 29.920 | 1.077 | 3.405 | 2.7% |
| V05A | 0.001 | 0.001 | 0.004 | 0.198 | 75.000 | 1.233 | 5.162 | 0.001 | 0.003 | 0.019 | 0.399 | 70.283 | 1.071 | 3.506 | -13.2% |
| V03A | 0.001 | 0.003 | 0.031 | 0.195 | 9.232 | 0.337 | 0.889 | 0.001 | 0.003 | 0.031 | 0.195 | 9.232 | 0.337 | 0.889 | 0.0% |
| V02A | 0.001 | 0.001 | 0.018 | 0.198 | 20.000 | 0.987 | 3.235 | 0.001 | 0.008 | 0.028 | 0.442 | 19.298 | 0.929 | 2.478 | -5.9% |
| V01A | 0.001 | 0.001 | 0.055 | 0.193 | 12.500 | 0.524 | 1.920 | 0.001 | 0.011 | 0.067 | 0.373 | 12.473 | 0.593 | 1.559 | 13.1% |
On a local scale, model validation can be confirmed by visual comparison of block grades to composite grades. A long section of each main vein showing composites, superimposed as dots on block grades, is shown in Figure 14-32 through Figure 14-37. The color legends of Figure 14-31 are applied to all block and composite grade values for comparative purposes for gold and silver, respectively. Examination indicates good agreement of block grade estimates with the composite grades.
![]()
Figure 14-31: Legend Gold (opt) and Silver (opt) Gold Respectively
| 131 | P a g e |
|
Technical Report and Pre - Feasibility Study for the Hollister
Underground Mine | Title May 31, 2017 | Effective Date August 9, 2017 | Report Date |
![]()
Figure 14-32: Clementine Vein Comparison of Composite and Estimate Block Gold Grades
![]()
Figure 14-33: Clementine Vein Comparison of Composite and Estimate Block Silver Grades
| 132 | P a g e |
|
Technical Report and Pre - Feasibility Study for the Hollister
Underground Mine | Title May 31, 2017 | Effective Date August 9, 2017 | Report Date |
![]()
Figure 14-34: Vein V232B Comparison of Composite and Estimate Block Gold Grades
![]()
Figure 14-35: Vein V232B Comparison of Composite and Estimated Block Silver Grades
| 133 | P a g e |
|
Technical Report and Pre - Feasibility Study for the Hollister
Underground Mine | Title May 31, 2017 | Effective Date August 9, 2017 | Report Date |
![]()
Figure 14-36: Vein V231A Comparison of Composite and Estimate Block Gold Grades
![]()
Figure 14-37: Vein V231A Comparison of Composite and Estimated Block Silver Grades
| 134 | P a g e |
|
Technical Report and Pre - Feasibility Study for the Hollister
Underground Mine | Title May 31, 2017 | Effective Date August 9, 2017 | Report Date |
Further spatial model validation is provided by the swath plots of individual veins. Clementine, V232B, and V231A swath plots are presented in Figure 14-38 through Figure 14-49. These plots compare the average grade from ID3 estimates to the nearest neighbor (nn) from within regularly spaced swaths or slices through the vein (both along strike and down dip). Examination of the swath plots shows a good agreement among the gold and silver estimated values.
![]()
Figure 14-38: Gold Swath Plot of Clementine Vein Along the East Axis
![]()
Figure 14-39: Gold Swath Plot of the Clementine Vein Along the Z Axis
| 135 | P a g e |
|
Technical Report and Pre - Feasibility Study for the Hollister
Underground Mine | Title May 31, 2017 | Effective Date August 9, 2017 | Report Date |
![]()
Figure 14-40: Silver Swath Plot of the Clementine Vein Along the East Axis
![]()
Figure 14-41: Silver Swath Plot of the Clementine Vein Along the Z Axis
| 136 | P a g e |
|
Technical Report and Pre - Feasibility Study for the Hollister
Underground Mine | Title May 31, 2017 | Effective Date August 9, 2017 | Report Date |
![]()
Figure 14-42: Gold Swath Plot of the V232B Vein Along the East Axis
![]()
Figure 14-43: Gold Swath Plot of the V232B Vein Along the Z Axis
| 137 | P a g e |
|
Technical Report and Pre - Feasibility Study for the Hollister
Underground Mine | Title May 31, 2017 | Effective Date August 9, 2017 | Report Date |
![]()
Figure 14-44: Silver Swath Plot of the V232B Vein Along the East Axis
![]()
Figure 14-45: Silver Swath Plot of the V232B Vein Along the Z Axis
| 138 | P a g e |
|
Technical Report and Pre - Feasibility Study for the Hollister
Underground Mine | Title May 31, 2017 | Effective Date August 9, 2017 | Report Date |
![]()
Figure 14-46: Gold Swath Plot of the V231A Vein Along the East Axis
![]()
Figure 14-47: Gold Swath Plot of the V231A Vein Along the Z Axis
| 139 | P a g e |
|
Technical Report and Pre - Feasibility Study for the Hollister
Underground Mine | Title May 31, 2017 | Effective Date August 9, 2017 | Report Date |
![]()
Figure 14-48: Silver Swath Plot of the V231A Vein Along the East Axis
![]()
Figure 14-49: Silver Swath Plot of the V231A Vein Along the Z Axis
| 140 | P a g e |
|
Technical Report and Pre - Feasibility Study for the Hollister
Underground Mine | Title May 31, 2017 | Effective Date August 9, 2017 | Report Date |
The validations discussed above represent comparisons at a zero opt grade cutoff. In reality, mining occurs above a cutoff. The grade tonnage curve is used to describe the tons and grade that may be present above a cutoff for mining. Smoothing in the estimate, the spacing of the informing samples, and the continuity of grades within the vein all affect the shape of the estimated grade tonnage curve. The validations presented below in Figure 14-50 through Figure 14-51 represent smoothing checks to understand how the estimates compare to a theoretical global estimate of the grade tonnage curve (grade tonnage curves are applied to the undiluted insitu vein grades). Note that the theoretical estimates are aspatial in nature and hence the estimates and theoretical are not expected to match exactly; significant differences may indicate where under or over smoothing is present. The Discrete Gaussian change of support method was used in conjunction with variograms and the nearest neighbor data to derive the theoretical grade tonnage curves.
The Clementine and V231A veins show similar tons and grades to the theoretical estimates above cutoffs of interest to narrow vein underground mining (greater than 0.2 opt Au vein grade). All vein estimates display a consistent grade tonnage curve shape with respect to the theoretical estimates. Clementine contains similar grades with lower tons, V231A contains similar tons with higher grade. These differences are to be expected as Clementine has had significant historical cut and fill mining which will constrain the tons further due to the closely spaced data. The differences in tonnage at the 0.05 opt cutoff is related to the use of a hard contact at the oreshoot indicator. This is well below economic vein grades with respect to narrow vein underground mining.
![]()
Figure 14-50: Smoothing Checks for the Clementine Vein
| 141 | P a g e |
|
Technical Report and Pre - Feasibility Study for the Hollister
Underground Mine | Title May 31, 2017 | Effective Date August 9, 2017 | Report Date |
![]()
Figure 14-51: Smoothing Checks for the V231A Vein
| 14.12 | Mineral Resource |
Table 14-16: Mineral Resource
| Category | Tons (k) |
Au opt |
Au g/t |
Ag opt |
Ag g/t |
AuEq opt |
AuEq g/t |
Au koz |
Ag koz |
AuEq koz |
| Measured | 114.3 | 0.537 | 18.4 | 3.05 | 104.7 | 0.565 | 19.4 | 61.4 | 349.0 | 64.6 |
| Indicated | 314.3 | 0.465 | 15.9 | 2.35 | 80.5 | 0.487 | 16.7 | 146.1 | 737.9 | 152.9 |
| Total M&I | 428.6 | 0.484 | 16.6 | 2.54 | 86.9 | 0.507 | 17.4 | 207.5 | 1,086.9 | 217.5 |
| Inferred | 176.0 | 0.420 | 14.4 | 2.71 | 92.9 | 0.445 | 15.3 | 73.9 | 476.9 | 78.3 |
| 1. | Mineral resources are calculated at a gold price of US$1,400 per ounce and a silver price of US$19.83 per ounce; |
|
| 2. | Metallurgical recoveries for gold and silver are 92% and 60%, respectively; |
|
| 3. | Based on metallurgical recovery, one ounce of gold is equivalent to 108.24 ounces of silver; |
|
| 4. | Mineral Resources include resource dilution to a minimum mining width of four feet or the vein width plus two feet, whichever is greater; |
|
| 5. | Cut off grades for the Mineral Resources are 0.227 opt AuEq; |
|
| 6. | The effective date for the Mineral Resource is May 31, 2017; |
| 142 | P a g e |
|
Technical Report and Pre - Feasibility Study for the Hollister
Underground Mine | Title May 31, 2017 | Effective Date August 9, 2017 | Report Date |
| 7. | Mineral Resources which are not Mineral Reserves have not yet demonstrated economic viability. The estimate of mineral resources may be materially affected by environmental, permitting, legal, title, taxation, sociopolitical, marketing, or other relevant issues; |
| 8. | The quantity and grade of reported Inferred Resources in this estimation are uncertain in nature and there has been insufficient exploration to define these Inferred Resources as an Indicated or Measured Mineral Resource, and it is uncertain if further exploration will result in upgrading them to an Indicated or Measured Mineral Resource category; and |
| 9. | The Mineral Resources in this press release were estimated using the CIM Standards on Mineral Resources and Reserves, Definitions and Guidelines prepared by the CIM Standing Committee on Reserve Definitions and adopted by CIM Council. |
| 143 | P a g e |
|
Technical Report and Pre - Feasibility Study for the Hollister
Underground Mine | Title May 31, 2017 | Effective Date August 9, 2017 | Report Date |
| 15 | Mineral Reserve Estimates |
| 15.1 | Methodology |
| 15.1.1 | Underground Reserves |
Excavation designs for stopes, stope development drifting, and access development were created using Vulcan software. Stope designs were aided by the Vulcan Stope Optimizer Module. The stope optimizer produces the stope cross section which maximizes value within given geometric, mining, and economic constraints.
The following three mining methods were evaluated:
| • | Cut-and-fill Mining: Minimum geometries of 3.5 feet wide and six feet high drifts along strike of the vein are used, with level accesses designed in waste to the bottom of the multi-compartment timbered raise; |
|
| • | End Slice Stoping (long hole stoping): Level developments are planned at a minimum five feet wide by 10 feet high and long hole stopes between the levels are designed to be the greater of vein width plus one foot of dilution on the hanging wall and one foot of dilution on the footwall, or a minimum of four feet wide. Height of the long hole stope is determined by distance between sublevels, but does not exceed 30 feet from the back of the bottom cut and the sill of the top cut; and |
|
| • | Shrinkage Stoping: Accessed initially by a conventional timbered raise with the same drift dimensions as the cut-and-fill. The shrinkage stope requires more waste development, however, due to the need for multiple draw-points on the bottom level. |
For each mining zone, reserves were estimated using the most applicable mining method, with underground designs trimmed to the May 31, 2017 surveyed as-builts. Mining losses of 5% and unplanned dilution of 10%, in addition to the planned internal dilution, were applied to all mining methods.
Development, production mining, and backfill tasks were created from all designed excavations. These tasks were assigned costs and productivities specific to the excavation or backfill task type. Additionally, the undiscounted cash flow for each task was calculated. All tasks were then ordered in the correct sequence for mining and backfilling. Any task sequence or subsequence that did not achieve a positive cumulative undiscounted cash flow was removed from consideration for mineral reserves. Stope development excavations necessary to the extraction of ore grade stopes and exceeding the incremental cutoff grade shown in Table 15-1, are also included in mineral reserves.
Table 15-1: Mineral Reserves Cut Off Grade Calculation
| unit | Gold | Silver | |
| Sales Price | $/Ounce | $1,200 | $17.00 |
| Refining and Sales Expense | $/Ounce | Included in Milling | |
| Royalty | 0% | ||
| Metallurgical Recovery | 92% | 60% | |
| Operating Costs | |||
| Surface Operations | $/ton | $10.00 | |
| Direct Processing | $/ton | $47.00 | |
| Administration and Overhead | $/ton | $73.00 | |
| Mining | $/ton | $196.00 | |
| 144 | P a g e |
|
Technical Report and Pre - Feasibility Study for the Hollister
Underground Mine | Title May 31, 2017 | Effective Date August 9, 2017 | Report Date |
| unit | Gold | Silver | |
| Total | $/ton | $326.00 | |
| Gold Equivalent | 1 | 108.24 | |
| Unplanned Dilution | 10% | ||
| Incremental Cut Off Grade | 0.052 | ||
| Cut-off Grade | Eq. opt | 0.310 | |
| Minimum Mining Width | feet | 4 | |
| Grade Thickness cut-off | Eq. opt-ft. | 1.24 | |
![]()
Figure 15-1: Gloria Final Reserves Plan by Year Mined
![]()
Figure 15-2: 4930 Level Final Reserves Plan by Year Mined
| 145 | P a g e |
|
Technical Report and Pre - Feasibility Study for the Hollister
Underground Mine | Title May 31, 2017 | Effective Date August 9, 2017 | Report Date |
![]()
Figure 15-3: 5050 Level Final Reserves Plan by Year Mined
![]()
Figure 15-4: 5190 Level Final Reserves Plan by Year Mined
| 146 | P a g e |
|
Technical Report and Pre - Feasibility Study for the Hollister
Underground Mine | Title May 31, 2017 | Effective Date August 9, 2017 | Report Date |
![]()
Figure 15-5: 5278 Level Final Reserves Plan by Year Mined
![]()
Figure 15-6: 5460 Level Final Reserves Plan by Year Mined
| 15.1.2 | Stockpile Reserves |
Material mined prior to May 2017, and not yet milled, is included in this reserve estimate. Grades were determined by assaying channel samples from the face of the ore development. Tons were determined by surveying the openings of the ore development or stopes. Total ounces stockpiled at the time of the reserve estimation are calculated using those two measured components.
| 147 | P a g e |
|
Technical Report and Pre - Feasibility Study for the Hollister
Underground Mine | Title May 31, 2017 | Effective Date August 9, 2017 | Report Date |
| 15.2 | Statement of Reserves |
Hollister underground and stockpile Mineral Reserves are summarized in Table 15-2. These reserves have been estimated using the methodology described above in Section 15.1 and in accordance with both NI 43-101 and the US Security and Exchange Commission’s (SEC) Industry Guide 7.
Table 15-2: Mineral Reserves as of May 31, 2017
| Tons (000’s) |
Au opt | Ag opt | AuEq opt |
Au Ounces (000’s) |
Ag Ounces (000’s) |
AuEq Ounces (000’s) |
|
| Proven Reserves | 50.8 | 0.553 | 2.905 | 0.580 | 28.1 | 147.5 | 29.5 |
| Probable Reserves | 148.8 | 0.552 | 3.201 | 0.582 | 82.2 | 476.2 | 86.6 |
| Proven and Probable Reserves | 199.5 | 0.553 | 3.125 | 0.582 | 110.3 | 623.7 | 116.1 |
Notes:
| 1. | Mineral Reserves have been estimated with a gold price of US$1,2000 per ounce and a silver price of US$17 per ounce; |
|
| 2. | Metallurgical recoveries for gold and silver are 92% and 60%, respectively; |
|
| 3. | Gold equivalent ounces are calculated on the basis of one ounce of gold being equivalent to 108.24 ounces of silver; and |
|
| 4. | Mineral Reserves are estimated at a cutoff grade of 0.310 AuEq opt and an incremental cutoff of 0.052 AuEq opt; and |
|
| 5. | Mine losses of 5% and unplanned mining dilution of 10% have been applied to the designed mine excavations. |
Mineral reserves could be materially affected by economic, geotechnical, permitting, metallurgical, or other relevant factors. Mining and processing costs are sensitive to production rates. A decline in the production rate can cause an increase in costs and cutoff grades resulting in a reduction in mineral reserves. Geotechnical conditions requiring additional ground support or more expensive mining methods will also result in higher cutoff grades and reduced mineral reserves.
The Mine has the necessary permits to continue exploration, current and future mining operations.
| 148 | P a g e |
|
Technical Report and Pre - Feasibility Study for the Hollister
Underground Mine | Title May 31, 2017 | Effective Date August 9, 2017 | Report Date |
| 16 |
Mining Methods |
| 16.1 | Access Development |
Access to the mining areas will be from haulage drifts; up to 15 feet wide and between 15 feet to 17 feet high. Drift gradients vary from ±15% to reach the desired elevation. Figure 16-1 shows existing development and vein traces at the 5050 Level of the Gloria zone.
![]()
Figure 16-1: Existing Development and Vein Traces at the 5050 Level of the Gloria Zone
| 16.2 | Ground Support |
Ground conditions at the Mine are typical of the northern Nevada extensional tectonic environment. Joint spacing varies from a few inches to a foot or more. To date, split sets and Swellex rock bolts along with welded wire mesh are successfully employed to control all conditions encountered during decline development and stoping. Shotcrete is applied to prevent long-term deterioration of the rock mass.
All major access drifts require a minimum of wire mesh and rock bolts for support. Under more extreme conditions, resin anchor bolts, cable bolts, and shotcrete can be used to supplement the primary support. Steel sets and spiling may also be used to support areas with the most severe ground conditions.
| 16.3 | Ventilation and Secondary Egress |
Underground mining relies heavily on diesel equipment to extract the mineralized material and waste rock, and to transport backfill to the stopes. Diesel combustion emissions require large amounts of fresh ventilation air to remove the diesel exhaust and maintain a healthy working environment. A combination of main access drifts, portal, and vertical raise to surface are arranged in a manner to provide a complete ventilation circuit. The Mine portal can be used as either an intake or an exhaust, but is designed as the primary intake, with a nominal 300,000 cubic feet per minute of fresh air entering the Mine, as shown in Figure 16-2. Secondary air movement is facilitated by ventilation fans placed in strategic locations. Small auxiliary fans and ducting draw primary ventilation air directly into the working faces.
| 149 | P a g e |
|
Technical Report and Pre - Feasibility Study for the Hollister
Underground Mine | Title May 31, 2017 | Effective Date August 9, 2017 | Report Date |
The ventilation raise connecting the Mine to the surface is approximately 800 feet in length, fully supported with rock bolts and mesh, and is entirely lined with shotcrete. Since the vertical extent of the raise exceeds the maximum 300 feet permitted for a continuous ladder way, it has been equipped with a personnel hoist for evacuating the Mine in the event of an emergency.
![]()
Figure 16-2: Hollister Primary Airflow
Table 16-1: Hollister Active Main and Booster Fans
| Level | Type | Location | Brake Fan (HP) |
Diameter (inches) |
Speed (RPM) |
Flow rate (CFM) |
| 5190 | Main | East Alimak | 150 | 72 | 1,200 | 160,000 |
| 5190 | Main | East Alimak | 150 | 72 | 1,200 | 160,000 |
| 5278 | Auxiliary | 5278 Access | 25 | |||
| 5190 | Auxiliary | 5190/5050 Raise | 200 | 49.5 | 1,780 | 75,000 |
| 5190 | Booster | 5190 West Lateral | 100 | 29 | 3,600 | 24,000 |
| 5050 | Auxiliary | 5050 West Lateral | 100 | 45 | 1,800 | 69,000 |
| 16.4 | Mining Methods |
Mining methods used are longhole stoping, cut and fill stoping, or shrink stoping. The final choice of mining method will depend upon the geometry of the stope block, proximity to main access ramps, ventilation and escape routes, the relative strength or weakness of the mineralized material and adjacent wall rock, and finally the value or grade of the mineralized material. The choice of mining method will not be made until after the stope delineation and definition drilling is completed. Each method will be discussed briefly in the following paragraphs.
| 150 | P a g e |
|
Technical Report and Pre - Feasibility Study for the Hollister
Underground Mine | Title May 31, 2017 | Effective Date August 9, 2017 | Report Date |
| 16.4.1 | Longhole Stoping |
Longhole stoping has the highest degree of mechanization of the three expected mining methods at the Mine and is the lowest cost method. This method requires the greatest amount of waste development and can be mined to a minimum width of three feet. The potential for unplanned wall dilution with this method is the greatest.
A typical longhole stoping arrangement at the Mine is presented in Figure 16-3. Stope development drifting is planned at nominal five feet wide and 10 feet high to accommodate the production drill and load haul dump (LHD) scoops. Levels are located at 38-foot vertical intervals to control dilution and may be increased as experience is gained in mining the Gloria veins. Stope widths are designed to a 3.5 -feet minimum mining width or the vein width plus 1 foot of dilution.
To prepare an area for longhole stoping, access for the mobile equipment must be developed to each level. Mine utilities for communication, water, electrical power, and compressed air must also be provided through the access development. The minimum pillar height achievable with this method is 28 feet and is limited by the stability of the intervening pillar between levels and planned mining width. Mining will progress upwards from the lowest level of the stope block. Drilling and blasting will be carried out from the drift above the active stope while the broken mineralized material will be removed from the bottom drift. The loader used for excavation is equipped with line of sight remote control to allow the removal of all blasted rock without exposing the operator to the open stope and the potential risk of ground falls.
Once a stope is emptied and laser scan surveyed, cemented rock fill (CRF) which consists of mine waste, cement, and selectively, fly ash, will be mixed on the surface and transported underground in the same trucks used to haul blasted rock to the surface. CRF will be placed to create an artificial pillar where additional mining is planned adjacent to or underneath the stope being filled. Normal backfill unconfined compressive strengths (UCS) of 300 to 500 pounds per square inch (psi) will be achieved by blending a mixture containing up to 4% cement and fly ash. When mining is anticipated to occur below the backfilled stope, the UCS of the fill will be increased up to 1,000 psi by adding up to 8% cement binder.
![]()
Figure 16-3: Long Section looking North of West end of Gloria Longhole Stoping Arrangement
| 151 | P a g e |
|
Technical Report and Pre - Feasibility Study for the Hollister
Underground Mine | Title May 31, 2017 | Effective Date August 9, 2017 | Report Date |
| 16.4.2 | Cut and Fill Stoping |
Cut and fill stoping was the preferred method used by previous owners of Mine. A cut and fill stope is initiated by driving a waste crosscut from the access ramp to the vein. The access is then prepared for a timbered raise to advance upward on the vein. The raise consists of segmented compartments housing an ore chute, a manway with ladders, and a small hoist for supplying the stope with necessary supplies. Cut dimensions are nominal 3.5 feet in width and 6.0 feet high. The width can be increased to accommodate wider sections of the vein. As the cuts are developed, the ore is slushed back to the timbered raise and loaded into trucks at the bottom of the ore chute. Cellular grout is pumped up the raise for backfill prior to breasting down the next cut.
One major advantage of the cut-and-fill method is the reduced need for waste development to access every vertical sublevel. Instead, ladderways can be driven up to 300 feet vertically without additional level accesses. One major drawback, however, is the cost of cellular fill and timber, as well as slower ore production compared to longhole stoping. As many of the previously developed stopes have already begun with the timbered raise accesses, the Mine can easily continue the cut-and-fill stopes until the remaining ore is extracted. The authors personally inspected existing timber raises and found them to be in excellent condition.
Figure 16-4 shows a section view of previously developed timbered raise on V08 that can be modified to access new cuts of ore with minimal additional development.
![]()
Figure 16-4: Section View of Previously Developed Timbered Raise on V08
| 16.4.3 | Shrinkage Stoping |
In the rare instances where not backfilling one stope will not affect any adjacent ore, it is possible to employ shrinkage stoping. Shrinkage stopes will likely be accessed from the same timbered raises as the cut-and-fill stopes, but rather than slushing all the ore back to the ore chute during the development of each cut, a minimal amount of swell will be slushed off and the broken ore will be used as a platform to breast down the next cut. Once every cut of the shrinkage stope is developed, the entire stope is mucked out from drawpoints on the access level, leaving a void that is not backfilled.
| 152 | P a g e |
|
Technical Report and Pre - Feasibility Study for the Hollister
Underground Mine | Title May 31, 2017 | Effective Date August 9, 2017 | Report Date |
Cost savings with shrinkage stoping are significant over cut and fill, however, the majority of production is delayed until the entire stope is developed.
The reserve plan considered blending all three mining methods and a reasonable overall production rate was attained.
All stope sections, whether longhole or cut and fill, were calculated using Vulcan stope optimizer software, and scheduled using Deswik scheduling software.
| 16.5 | Underground Labor and Equipment |
Peak underground labor and equipment requirements for the Mine are presented in Table 16-2 and Table 16-3, respectively. This estimate was prepared using productivity rates typical for small-scale mechanized mining in North America. The Mine will operate 24 hours per day seven days per week.
Table 16-2: Underground Labor
| Job Classification | Count |
| Miners | 60 |
| Mechanics | 10 |
| Supervision | 6 |
| Technical Staff | 3 |
| Manager | 1 |
| Total | 80 |
Table 16-3: Underground Equipment
| Equipment | Count |
| Single Boom Jumbo | 2 |
| Bolter | 1 |
| 6-Yard Loader | 2 |
| 4-Yard Loader | 2 |
| 2-Yard Loader | 4 |
| 30-Ton Truck | 3 |
| Stope Ring Drill | 3 |
| Jacklegs | 10 |
| Utility Vehicle | 2 |
| Shotcrete Remix Truck | 3 |
| Shotcrete Spray Truck | 1 |
| Total | 30 |
| 16.6 | Mine Plan |
The productivities of Table 16-3 represent typical values achieved in northern Nevada for the type and size of excavations planned at the Mine. These productivities were used to develop the production plan shown in Table 16-4 and Table 16-5.
Table 16-4: Productivity Rates
| HEADING TYPE | units | daily rate |
| Capital Development Drift | Feet/Day | 30 |
| 153 | P a g e |
|
Technical Report and Pre - Feasibility Study for the Hollister
Underground Mine | Title May 31, 2017 | Effective Date August 9, 2017 | Report Date |
| HEADING TYPE | units | daily rate |
| Drop Raise | Feet/Day | 16 |
| Conventional Raise | Feet/Day | 6 |
| Stope Development (6x10) | Feet/Day | 30 |
| Longhole Stoping | Ton/Day | 50 |
| Cut and Fill Stoping | Ton/Day | 30 |
| Shrinkage Stoping | Ton/Day | 17 |
| Cellular Grout Backfill | Ton/Day | 18 |
| Stope Backfill | Ton/Day | 150 |
Table 16-5: Annual Production and Development Plan
| Statistic | 2017 | 2018 | 2019 | Total |
| Reserves Mined | ||||
| Proven Ore Mined (000’s Tons) | 11.8 | 17.7 | 4.2 | 33.7 |
| Au Grade (Ounce/Ton) | 0.592 | 0.676 | 0.595 | 0.636 |
| Contained Au (000’s Oz) | 7.0 | 12.0 | 2.5 | 21.4 |
| Ag Grade (Ounce/Ton) | 2.30 | 3.78 | 3.75 | 3.26 |
| Contained Ag (000’s Oz) | 27.1 | 67.0 | 15.7 | 109.8 |
| AuEq Grade (Ounce/Ton) | 0.613 | 0.710 | 0.630 | 0.666 |
| Contained AuEq (000’s Oz) | 7.2 | 12.6 | 2.6 | 22.4 |
| Probable Ore Mined (000’s Tons) | 54.2 | 84.9 | 9.7 | 148.8 |
| Au Grade (Ounce/Ton) | 0.486 | 0.602 | 0.491 | 0.552 |
| Contained Au (000’s Oz) | 26.3 | 51.1 | 4.7 | 82.2 |
| Ag Grade (Ounce/Ton) | 2.71 | 3.51 | 3.22 | 3.20 |
| Contained Ag (000’s Oz) | 146.7 | 298.4 | 31.0 | 476.2 |
| AuEq Grade (Ounce/Ton) | 0.511 | 0.634 | 0.520 | 0.582 |
| Contained AuEq (000’s Oz) | 27.7 | 53.9 | 5.0 | 86.7 |
| Total Ore Mined (000’s Tons) | 66.0 | 102.6 | 13.8 | 182.5 |
| Au Grade (Ounce/Ton) | 0.505 | 0.615 | 0.522 | 0.568 |
| Contained Au (000’s Oz) | 33.3 | 63.1 | 7.2 | 103.6 |
| Ag Grade (Ounce/Ton) | 2.63 | 3.56 | 3.38 | 3.21 |
| Contained Ag (000’s Oz) | 173.8 | 365.4 | 46.7 | 586.0 |
| AuEq Grade (Ounce/Ton) | 0.529 | 0.648 | 0.553 | 0.598 |
| Contained AuEq (000’s Oz) | 34.9 | 66.5 | 7.7 | 109.0 |
| Production Mining | ||||
| Ore and Incremental Development Mining (000’s Tons) | 30.6 | 47.8 | 9.5 | 87.9 |
| Longhole Stope Mining (000’s Tons) | 35.4 | 54.8 | 4.4 | 94.6 |
| Reserves Mined (000’s Tons) | 66.0 | 102.8 | 13.8 | 182.5 |
| Backfill | ||||
| Longhole Stope Backfill (000’s Tons) | 44.1 | 45.1 | 5.9 | 95.1 |
| Cellular Grout Backfill (000’s Tons) | 0.5 | 9.4 | 0.9 | 10.7 |
| Total Backfill (000’s Tons) | 44.6 | 54.5 | 6.7 | 105.8 |
| Waste Mining | ||||
| Expensed Waste Drifting including Waste Sills (Feet) | 2,459 | 2,137 | 51 | 4,647 |
| 154 | P a g e |
|
Technical Report and Pre - Feasibility Study for the Hollister
Underground Mine | Title May 31, 2017 | Effective Date August 9, 2017 | Report Date |
| Statistic | 2017 | 2018 | 2019 | Total |
| Expensed Waste (000’s Tons) | 12.6 | 10.9 | 0.3 | 23.8 |
| Primary Capital Drifting (Feet) | 1,262 | - | - | 1,262 |
| Capital Raising (Feet) | 22 | - | - | 22 |
| Capitalized Mining (000’s Tons) | 21.2 | - | - | 21.2 |
| Total Tons Mined (000’s Tons) | 99.8 | 113.7 | 14.1 | 227.6 |
| 1. | The mine plan for 2017 includes only projections for the period from June 1, 2017 to December 31, 2017. |
|
| 2. | The above mine production plan does not include stockpile reserves of 17,089 Tons at 0.411 opt AuEq and 7,017 oz AuEq which will be processed in 2017. |
| 155 | P a g e |
|
Technical Report and Pre - Feasibility Study for the Hollister
Underground Mine | Title May 31, 2017 | Effective Date August 9, 2017 | Report Date |
| 17 |
Recovery |
| 17.1 | Aurora Facility |
From 2009 through 2012, GBG processed ore from the Mine at the Aurora mill (formally Esmeralda mill) located approximately 21 miles, straight line distance southwest of the town of Hawthorne, near the historic mining town of Aurora. The mill is approximately 290 miles by road from the Mine, with 80 percent of which is on paved interstate roads. As configured, the plant could process up to approximately 350 tpd, through a CIL process, with tailings deposition into an adjacent impoundment.
Significant circuit upgrades were completed on the Aurora mill during the initial operation to optimize metal recovery and operational costs.
| 17.1.1 | Plant Refurbishments & Upgrades |
After completion of the upgrades the mill was capable of;
| • | Processing 350 tpd of mineralized material with average grades of up to 1.0 opt gold and 6.0 opt silver; and | |
| • | Produce doré bars on site. |
| 17.1.2 | Process Design |
The Aurora mill infrastructure and process was reviewed and analyzed with the view of retrofitting main unit processes required to treat the Hollister ore at acceptable efficiencies and cost. The mill had previously operated as a conventional crushing/milling/leach/CIP plant and was fed with ore from the open cast and underground ore at a rate of approximately 350 tpd. The grade was low at around 0.15-0.25 opt gold and similar values of silver. The mill was stopped during 1998 and again commissioned during 2004 but only operated for a short period. The mill was largely neglected and very little or no capital was spent on renewal of equipment during that period.
The mill was well suited for the low grade ore and had adequate leaching and elution capacity (one 2.5 -ton column with electro-winning cell) to recover up to 95% of the gold. The Mine ore had a grade of approximately 1.0 opt gold and between 5 and 7 opt silver. The combined grades of the two precious metals far exceeded the capacity of both the leaching, CIL, and elution circuits mainly due to the leaching, elution, and metal deposition constraints. The design of the mill was therefore altered to meet the processing requirements of the Mine ore. The crushing and milling circuit however had a capacity which fit the tonnage profile of the Mine at around 350 tpd or 10,000 tons per month (tpm).
The existing mill was refurbished to make the necessary changes required to effectively treat the higher grade ore. In addition to the initial refurbishment, several flow-sheet adjustments and process optimization efforts were completed between January and December 2010.
The sequence of events and the overall strategy followed from the beginning of 2010 are summarized as follows;
| • | The cone crusher that was initially removed was re-installed to ensure adequate product size reduction for optimum mill operation; |
| 156 | P a g e |
|
Technical Report and Pre - Feasibility Study for the Hollister
Underground Mine | Title May 31, 2017 | Effective Date August 9, 2017 | Report Date |
| • | The Falcon gravity concentrator was removed to allow for adequate operation of the elution circuit which was considered critical for the recovery of gold; |
|
| • | The CIP circuit was converted to CIL and commissioned in conjunction with the existing electrowinning (EW) cell and operated long enough to generate cathode sludge which was assayed and dispatched for refining off site. The settlement of cathode sludge at the bottom of the cell caused the cathode/anode pairs to short circuit which in turn damaged the electrical circuits. There was an alternative of replacing the damaged cells with Gekko EW cells which were on site, but this required a new mercury permit and as such would further delay the production of doré. Consequently, a Merrill Crowe zinc precipitation system was installed along with the refurbished diesel fired furnace to smelt the gold/silver/zinc precipitate for which an operating permit already exists; |
|
| • | During the early stages of 2010, it became apparent that the elution circuit as it stands did not have the capacity to treat the high gold and silver grades in the ore from the Mine which at time exceeded 1 opt of gold and 6.0 opt of silver; |
|
| • | Initially one elution vessel was operated to recover gold and silver, but a turnaround of shorter than 24 hours, which includes filling and draining, was difficult to achieve. A second column with a capacity of 2.5 tons was installed. From the operating data reviewed, two elutions of 2.5 tons each can be completed in a 24-hour cycle, but this was not always the case as there are some delays, and completion of the elution is not always possible in the time available. The best elution rates were recorded during August 2010 where an average of 1.2 elutions (3.0 tons of carbon) were eluted daily. A second elution vessel was installed, and the stripping increased in December 2010 to 4.4 tons per day with an efficiency of 84% for gold and 89% for silver; and |
|
| • | Three leach tanks were converted to CIL tanks, and the flow reversed in order to gravity feed the first leach tank rather than pumping to the original CIL tanks. Although this did not change the leach retention time, it increased the number of CIL stages which improved the leach and adsorption kinetics. Three screen boxes similar to the other CIL tanks were installed. Additional test work was required to establish the actual residence time in the current condition and the retention time required to achieve in excess of 90% and 80% leaching efficiency for gold and silver, respectively. |
The mill flowsheet in Figure 17-1 is as it appeared when the optimization efforts were completed.
| 157 | P a g e |
|
Technical Report and Pre - Feasibility Study for the Hollister
Underground Mine | Title May 31, 2017 | Effective Date August 9, 2017 | Report Date |
![]()
Figure 17-1: Current Aurora Plant Flowsheet
The flow sheet above provided a circuit that was capable of grinding the Mine ore to 80% passing 200-mesh and provided a total leach retention time of approximately 36 hours with an ore feed rate of 350 tpd.
Mill production data from 2009 through 2011 is shown in Table 17-1 below. A significant improvement in mill tonnage and metal recovery can be seen from the beginning of 2009 until 2011.
Table 17-1: Mill Operation Data from2009 thru 2011
| Physical | 2009 | 2010 | 2011 |
| Mill Feed Tons | 40,559 | 84,999 | 108,071 |
| Au Feed Grade (opt) | 1.031 | 0.935 | 0.812 |
| Ag Feed Grade (opt) | 9.01 | 5.77 | 6.59 |
| Au Recovery % | 76.9% | 81.4% | 91.6% |
| Ag Recovery % | 66.5% | 59.0% | 71.9% |
| Au Recovered oz | 31,174 | 64,664 | 80,453 |
| Ag Recovered oz | 243,148 | 289,136 | 512,434 |
| 17.2 | Midas Mill Facility |
Klondex will process all of the ore from the Mine at the Midas mill located 18 miles from the mine, saving significant money in ore transport costs. Mine ore was processed at Midas in 2008 and early 2009. The average gold and silver recoveries during that time period was 84.5% and 77.6%, respectively (see Table 13-6) in Section 13 - Mineral Processing and Metallurgical Testing. The ore was processed during this time period using the original Midas mill flow sheet (Figure 17-1).
| 158 | P a g e |
|
Technical Report and Pre - Feasibility Study for the Hollister
Underground Mine | Title May 31, 2017 | Effective Date August 9, 2017 | Report Date |
This flow sheet has no allowances for the processing of preg-robbing ore. Recent test work (Section 13.3) indicates blending Mine ore with non-preg-robbing ore and a blinding agent will improve the gold recovery from 84.5% to above 90%. Based on the test work, the Mine component of the mill blend will be limited to a maximum of 40%.
To maximize the Mine component of the total mill tonnage, it was decided to retrofit the Midas mill to include a CIL circuit. This will allow the Midas mill to process 100% Hollister ore instead of limiting the tonnage to only 40% of the total feed. The mill flow sheet changes include;
| • | Retrofitting 4 leach tanks with carbon retention screens; | |
| • | The addition of carbon advance pumps in each of the 4 tanks; and | |
| • | The addition of a carbon safety screen and loaded carbon screen. |
Using the adjusted flow sheet, incoming ore will be ground and thickened according to the existing flow sheet. The slurry will be leached in the four leach tanks with the carbon present and pumped directly to cyanide detoxification, bypassing the CCD and zinc precipitation circuits. Loaded carbon will be pumped from the first CIL tank to storage bags and transported to the Aurora mill for stripping and regeneration. The regenerated carbon will be shipped back to the Midas mill for reuse. The leach circuit is capable of either leaching preg-robbing ore (using the four refurbished tanks) or leaching non-preg-robbing ore by removing the carbon in the CIL tanks and using all eight existing leach tanks with the CCD circuit. Figure 17-2 depicts the leach circuit before any retrofit efforts, and Figure 3 shows the leach circuit with the CIL retrofits.
![]()
Figure 17-2: Midas Mil Flow Sheet before CIL retrofit
| 159 | P a g e |
|
Technical Report and Pre - Feasibility Study for the Hollister
Underground Mine | Title May 31, 2017 | Effective Date August 9, 2017 | Report Date |
![]()
Figure 17-3: Midas Mill Flow Sheet with CIL Retrofit Installed
The CIL circuit capability at Midas will allow the mill to achieve very similar operating conditions as were present at the Aurora mill during 2011 when the gold and silver recoveries were 91.6% and 71.9%, respectively.
| 17.3 | Conclusions and Recommendations |
Processing conclusions are listed below:
| • | The Aurora mill processed Mine material very effectively after circuit optimizations were completed. | |
| • | Processing material from the Mine without using a CIL circuit or a blinding agent will result in disappointing metal recoveries. |
Two practical processing options are recommended for processing mineralized material through the Midas mill:
| • | Blend Mine material with other ores proven to not be pre-robbing and add a blinding agent | |
| • | Run 100% Mine ore through the new CIL flow sheet |
The cyanide consumption will be about 3.5 kg/ton and lime consumption about 6 kg/ton, similar to the reagent addition rates at the current operating mill.
The retrofitted flow sheet will provide a grind size of approximately 75% passing 200 mesh using an ore blend of 15% Midas mine ore and 85% Mine ore. The CIL retention time will be approximately 30 hours at 1100 tpd feed rate and a slurry density of 45%.
| 160 | P a g e |
|
Technical Report and Pre - Feasibility Study for the Hollister
Underground Mine | Title May 31, 2017 | Effective Date August 9, 2017 | Report Date |
The existing cyanide detoxification circuit at the Midas mill will not see significant change as the slurry chemistry will be similar to what the detoxification circuit is currently successfully treating.
| 161 | P a g e |
|
Technical Report and Pre - Feasibility Study for the Hollister
Underground Mine | Title May 31, 2017 | Effective Date August 9, 2017 | Report Date |
| 18 |
Project Infrastructure |
| 18.1 | Road Access |
The Mine is easily accessible from paved state highways as well as a graded gravel mine access road d. The gravel road can be occasionally impeded by mud in wet or snowy weather. The state and county roads are well maintained in order to service area ranches and mines. Klondex provides some road maintenance assistance to both Humboldt and Elko counties.
| 18.2 | Power and Electrical Infrastructure |
An electrical transmission line and substation were constructed in 2016 to service the Mine, eliminating the need to use generators to supply power for mine operation.
Power distribution from the main substation is stepped down to 4160 volts from the incoming voltage of 13,800 volts. From the main substation, power is carried by underground cable to the portal and hence underground to the mobile load centers (MLC). It is estimated that the Mine will have up to eight MLC’s operating when full production is attained.
| 18.3 | Water Management and Water Treatment |
Klondex manages surface and underground water using a pond system, drainage ditches, and a water treatment plant (WTP). Surface water from precipitation events will be diverted away from the Mine infrastructure with a series of drainage ditches. Surface water within the disturbance areas will be diverted to one of two ponds: the Stormwater Pond and the Dewatering Storage Pond. The ponds have a combined volume of approximately 4.7 million gallons (Figure 18-1).
Water from underground mining operations that does not meet NDEP Profile I standards (Profile I) is pumped to the Dewatering Storage Pond, which holds approximately 2.8 million gallons. This water is treated through the WTP to meet the Profile I requirement. Brine reject solution from the WTP is stored in the Stormwater Pond, where it is evaporated or shipped off-site for disposal.
Treated water from the WTP and water from underground that meets the Profile I standard can be managed in several ways:
| • | As dust suppression on roads and during construction events; | |
| • | Infiltrated in the RIBs; or | |
| • | Used underground for mining activities. |
A fire water tank is located above the facilities and gravity flows to hydrants located near the Mine buildings.
| 162 | P a g e |
|
Technical Report and Pre - Feasibility Study for the Hollister
Underground Mine | Title May 31, 2017 | Effective Date August 9, 2017 | Report Date |
![]()
Figure 18-1: Site Plan View
| 18.4 | Communication Infrastructure |
Internet connectivity is provided by CommNet, via 11GHz licensed Microwave frequency, with a 20Mbps Direct Internet Access (DIA) connection. Cell phone coverage is provided by Verizon Wireless, and the signal is boosted by a Klondex provided network extender.
| 18.5 | Site Infrastructure |
Project infrastructure is comprised of one large tent structure, heavy equipment parking areas, several Conex mobile containers, and lay-down areas. The tented structure is used for maintenance of the mobile fleet and other production related equipment. Several Conex containers and outbuildings are used for storing parts and tools near the maintenance building. The electric storage area and diesel storage area are also located near the maintenance building.
| 163 | P a g e |
|
Technical Report and Pre - Feasibility Study for the Hollister
Underground Mine | Title May 31, 2017 | Effective Date August 9, 2017 | Report Date |
The engineering and geology offices, security, and staff dry area are in mobile office units with light vehicle parking areas in front. These buildings are connected to non-potable water pipelines and septic system.
In addition to the offices, there are areas designated for the west waste rock storage facility, sediment control ditches, and ore storage.
| 164 | P a g e |
|
Technical Report and Pre - Feasibility Study for the Hollister
Underground Mine | Title May 31, 2017 | Effective Date August 9, 2017 | Report Date |
| 19 |
Market Studies and Contracts |
| 19.1 | Market Studies |
The gold and silver that is mined will be processed at the Midas Mill and refined to a doré bar quality. The doré will be sent to a refinery via secure transportation and further refined, after which the refinery will credit a Klondex account for the refined gold and silver, at which time it becomes available for sale.
Precious metal markets are mature with on-going sales throughout the world. The 90 and 180-day trailing averages of gold and silver prices to the spot prices show consistency with the trend of the spot price and reflective of long term consistency in the overall trend of these metals Figure 19-1 and Figure19-2 demonstrate 10-year historic charts of the price performance of both gold and silver.
![]()
Figure19-1: Historical Spot Gold Price: 90- and 180-day Trailing Averages
![]()
Figure 19-2: Historical Spot Silver Prices; 90- and 180-days Trailing Averages
| 165 | P a g e |
|
Technical Report and Pre - Feasibility Study for the Hollister
Underground Mine | Title May 31, 2017 | Effective Date August 9, 2017 | Report Date |
The metals also play a unique role in the investing markets, as the “hedge” investment to the traditional financial markets. However, the gold market tends to be cyclical and historically largely impacted by movements in the US Dollar and other macro-economic and political factors. Figure 19-3 is a 10-year view of the gold market as compared to the Dow Jones Industrial Index (DJI) and the US Dollar (USD), represented by the USD to Euro (EUR) exchange rate. While 10 years is a relatively short time in the historic movement of the gold market, there is a clear negative correlation between the Philadelphia Gold Exchange index (XAU) and the DJI, and to a lesser extent, an inverse correlation with the USD.
![]()
Figure 19-3: Gold Index vs DJI vs EURO/USD Conversion Rate
The Mine is scheduled to be positive cash flow under most gold price environments. Table 19-1 outlines the metal price assumptions used in the economic analysis. A price sensitivity analysis was completed as part of the economic evaluation in Section 22 and will provide additional insight to the merits of the project.
Table 19-1: Metal Price Assumptions for the Economic Evaluation
![]()
| 19.2 | Contracts |
As part of normal mining activities, Klondex has entered into contracts with several mining industry suppliers and contractors. The terms of these agreements are customary for mines in Nevada and the Industry.
| 166 | P a g e |
|
Technical Report and Pre - Feasibility Study for the Hollister
Underground Mine | Title May 31, 2017 | Effective Date August 9, 2017 | Report Date |
| 20 |
Environmental Studies, Permitting and Social or Community Impact |
| 20.1 | Water Management |
Klondex manages surface and underground water using a pond system, drainage ditches, and a water treatment plant (WTP). Surface water from precipitation events is diverted away from the Project infrastructure with a series of drainage ditches. Surface water within the disturbance areas is diverted to one of two ponds. The ponds have a combined volume of approximately 2.8 million gallons. Klondex also has two operational RIBs, which are included in the water management system.
| 20.2 | Environmental Studies, Permitting and Social or Community Impact |
Per Table 20-1, the Mine is fully permitted. Klondex conducts mining activities in compliance with all applicable environmental protection legislation. Mine operations are fully permitted, and additional infrastructure needed for the Hatter area is also permitted. Klondex is working closely with both state and federal regulators to ensure that the permitting and compliance strategies are acceptable and will not cause delays in production or mine development. Klondex has a strong cultural resource preservation program which allows a third party archeologist time to review potential areas of new disturbance. At this time, there are no community or social impact issues regarding work being completed.
Table 20-1: Current Operational Permits for Mine
| Permit | Permit Number | Agency | Permit Type and Explanation |
| Plan of Operations and Rights-of-Way |
NVN-076802 NVN-091723 NVN-091724 |
BLM | Plan of Operations and Rights-of-Way are issued for all exploration and mining activities in excess of five acres. BLM approves the plan and ROW and determines the required environmental studies based on the National Environmental Policy Act. |
| Record of Decision | BLM/NV/EK/EIS12- 4+1793 BLM/NV/EK/EIS13- 9+1793 |
BLM | A Record of Decision (ROD) is the formal document outlining the approval of the Plan and ROW. |
| Water Pollution Control Permit (Mine Operations) |
NEV2003107 | NDEP, BMRR |
Mines operating in the State of Nevada are required to meet a zero discharge and have a Water Pollution Control Permit (WPCP). Separate WPCPs are issued for specific mining and water management activities. |
| Water Pollution Control Permit (Rapid Infiltration Basins [RIB]) |
NEV2003114 | NDEP, BMRR |
WPCP for infiltration of dewatering water. |
| Water Rights | 52751, 52754, 69732, 71734, 71735, 74011, 80714, 77127, and 77128 | NDWR | Water rights are issued by the Nevada Division of Water Resources based on Nevada water law. Permits are issued based on prior appropriation and beneficial use. |
Reclamation Permit |
0227 | NDEP, BMRR |
Outlines reclamation activities and determines associated costs for any disturbance more than five acres. |
| Air Quality Permit | AP1041-3127 | NDEP, | Class II air operating permit for facilities that |
| 167 | P a g e |
|
Technical Report and Pre - Feasibility Study for the Hollister
Underground Mine | Title May 31, 2017 | Effective Date August 9, 2017 | Report Date |
| Permit | Permit Number | Agency | Permit Type and Explanation |
| BAPC | emit less than 100 tons per year for any one regulated pollutant and emit less than 25 tons per year total hazardous air pollutant (HAP) and less than 10 tons per year of any one HAP. |
||
| Stormwater Permit | NVR300000 | NDEP, BWPC |
General stormwater discharges associated with activities from metal mining. |
| 20.3 | Environmental Compliance and Monitoring |
As required by the environmental operational permits, Klondex prepares quarterly and annual reports which are submitted to regulators. Compliance information included in these reports is based primarily on permit requirements and limitations. Permit limits and associated monitoring requirements are specified as part of each permit. Bonding and closure requirements are current and updated regularly as required. Waste rock facilities are located within the current Mine east open pit. An additional waste rock facility is permitted, as part of the 2014 EIS, in the West Hollister open pit. Klondex is currently working with local stakeholders, the NDEP, and BMRR to finalize the new waste rock storage facility. There will be no processing activities and no tailings impoundment at the Mine.
| 20.4 | Other Environmental Issues |
The Mine is located within the Tosawihi Quarries which is within a Traditional Cultural Property and the Historic Property Tosawihi Quarries Archeological District. The Programmatic Agreement (PA) developed for the Project defines the manner in which Historic Properties (HP) and Traditional Cultural Properties (TCPs) will be managed. It is an agreement between the BLM, State Historic Preservation Officer (SHPO), and the Advisory Council on Historic Preservation (ACHP) for addressing impacts to Historic Properties.
Klondex is working closely with northern Nevada Tribal and Band governments to ensure limited effects on HPs which were not fully determined prior to the issuance of the ROD. The BLM acknowledges that certain impacts cannot be fully mitigated to the satisfaction of the Western Shoshone Tribes. However, the PA is written to focus on the protection of tangible items, which indirectly can provide protection to intangible items by preventing further damage to HPs. The PA also can provide a means or avenue to allow for various ways of monitoring and mitigation to occur other than routine practices.
| 20.5 | Reclamation Bond Estimate |
Reclamation Cost Estimate (RCE) costs for reclamation currently include the following categories: roads; exploration roads and drill pads; waste rock repository; RIBs; ponds; electrical infrastructure; building and equipment; adit and vent raise plugging; re-vegetation; and contractor management. The total RCE was approved by BLM and NDEP for a total cost to construct of approximately US$1.7 million dollars.
| 168 | P a g e |
|
Technical Report and Pre - Feasibility Study for the Hollister
Underground Mine | Title May 31, 2017 | Effective Date August 9, 2017 | Report Date |
| 21 |
Capital and Operating Costs |
| 21.1 | Capital Costs |
Life of Mine (LOM) constant dollar capital expenditures are detailed in Table 21-1. Of the total capital requirements, project development comprises 62%, exploration 28%, and environmental projects 6%. Owner operated mine development unit costs, for similarly sized excavations in north Nevada, are shown in Table 21-2.
Table 21-1: Capital and Pre-Production Costs
| Cost (000’s) | 2017 | 2018 | 2019 | Total |
| Mine Development | 6,922 | 4,899 | 11,821 | |
| Environment | 614 | 350 | 200 | 1,164 |
| Site Facilities | 23 | 300 | 323 | |
| Exploration Drilling | 2,400 | 3,000 | 5,400 | |
| Mining Equipment | 400 | 400 | ||
| Total | 10,359 | 8,549 | 200 | 19,108 |
Table 21-2: Underground Development Unit Costs
| Width (ft) | height (ft) | $/ft | |
| Primary Capital Development | 14 - 15 | 15 - 17 | 1,400 |
| Secondary Capital Development | 14 | 14 | 1,350 |
| Raising | 10 | 10 | 2,000 |
| 21.2 | Operating Costs and Cutoff Grade |
LOM operating costs are presented in Table 21-3 below. Unit costs are based on historical Mine production, like mining techniques at Midas and Hollister, and actual costs incurred at Hollister through June 2017. Haulage costs to Midas are based on actual costs incurred by the Company and as quoted by a local contractor.
Table 21-3: Operating Costs
| Description | $/ft |
| Site Administration | 47 |
| Engineering & Geology | 26 |
| Surface Operations and Haulage to Midas Mill | 10 |
| Mining | 196 |
| Processing | 47 |
| TOTAL | 326 |
| 169 | P a g e |
|
Technical Report and Pre - Feasibility Study for the Hollister
Underground Mine | Title May 31, 2017 | Effective Date August 9, 2017 | Report Date |
| 22 |
Economic Analysis |
An after-tax economic model was developed to estimate annual cash flows, present value of these cash flows, and sensitivities of the valuation to metal prices and cost changes.
Please note that this TR contains forward-looking information regarding projected mine production rates and resulting cash flows as part of this study. The head grades are based on sufficient sampling that is reasonably expected to be representative of the realized grades from actual mining operations.
The estimates of capital and operating costs are based on Q1, 2017 (US$) and have been developed specifically for this mine. They are summarized in Section 21 of this report. Also, the economic analysis is not inflation adjusted for the costs; however, the metal price is adjusted based on consensus long term metal price assumption.
| 22.1 | Assumptions |
All costs and economic results are reported in US$ unless otherwise noted. Table 22-1 outlines basic operating statistics of the mine.
Table 22-1: Key Financial Modeling Assumptions
![]()
Other economic factors used in the economic analysis include the following:
| • | US$1,200/oz Au, US$17/oz Ag; | |
| • | Recoveries of 92% Au and 60% Ag; | |
| • | Discount rate of 7%; | |
| • | No closure costs are included because the evaluation represents a portion of the deposit to the mined from the claims acquired; | |
| • | No cost inflation was applied; | |
| • | No salvage was assumed at the end of mine life; | |
| • | All 2016 sunk costs were excluded (i.e. rehabilitation and access costs); | |
| • | Royalty payment of 5%; | |
| • | Effective tax rate of 25% is a function of Nevada net proceeds tax of 5%, depletion adjustment of 15% and federal tax rate of 35%; and | |
| • | Financial analysis have not been adjusted for acquisition cost. |
| 170 | P a g e |
|
Technical Report and Pre - Feasibility Study for the Hollister
Underground Mine | Title May 31, 2017 | Effective Date August 9, 2017 | Report Date |
| 22.2 | Results |
Klondex conducted an economic analysis based on the June 2017 reserves from Gloria and remnant areas of the main deposits. The analysis, summarized in Table 22-2, only reflects three years of mining from these areas. Exclusive of the ramp-up year of 2017 (after the acquisition was closed in August 2016), positive cash flow is achieved.
Table 22-2: Gloria and Main Deposits Economic Modeling Results
| 2017 | 2018 | 2019 | ||||
| Total Ore tons | 188 | 71 | 103 | 14 | ||
| Au grade | opt | 0.48 | 0.60 | 0.51 | ||
| Ag grade | opt | 2.79 | 3.40 | 2.90 | ||
| GEO contained ounces | kozs | 111 | 37 | 67 | 8 | |
| GE Recovered ounces | kozs | 100 | 33 | 60 | 7 | |
| Net Revenue | $K | 119,745 | 39,600 | 71,937 | 8,208 | |
| Underground Mining | $/t | 284 | (55,845) | (22,659) | (29,272) | (3,914) |
| Mill Processing | $/t | 42 | (7,760) | (2,798) | (4,376) | (585) |
| Transport to Process facility | $/t | 10 | (1,877) | (707) | (1,032) | (138) |
| Allocated G&A | % | 5% | (2,947) | (1,177) | (1,561) | (209) |
| Royalties | % | 5% | (5,987) | (1,980) | (3,597) | (410) |
| Total CAS | $k | (74,415) | (29,322) | (39,838) | (5,256) | |
| Exploration & Advanced Projects | $k | - | (10,666) | (10,666) | - | - |
| EBITDA | $k | 34,663 | (388) | 32,099 | 2,952 | |
| DD&A | (19,002) | (6,284) | (11,416) | (1,302) | ||
| EBIT | $k | $15,661 | (6,672) | 20,684 | 1,649 | |
| Taxes | rate | 25% | (5,583) | - | (5,171) | (412) |
| Net Income | $k | $10,077 | (6,672) | 15,513 | 1,237 | |
| DD&A (Add Back) | 19,002 | 6,284 | 11,416 | 1,302 | ||
| Operating Cash Flow | 29,080 | (388) | 26,928 | 2,540 | ||
| Sustaining Capital | $/t | 70 | (14,998) | (6,807) | (7,225) | (966) |
| Capital Drilling | $/oz | 40 | (2,671) | - | (2,398) | (274) |
| Development Capital | $k | - | (1,333) | (1,333) | - | - |
| Free Cash Flow | 10,077 | (8,528) | 17,305 | 1,300 |
| Discount rate | % | 7% |
| NPV | $k | $8,781 |
| IRR | % | 110% |
| Discounted Payback | Years | 1.5 |
| Cash cost | $/oz | $746 |
| AISC | $/oz | $1,086 |
| 22.3 | Sensitivity Analysis |
Sensitivity analysis was performed on the LOM after-tax NPV for various discount rates, production rates, and direct mining costs versus changing average gold price. Table 22-3 show the economic analysis.
| 171 | P a g e |
|
Technical Report and Pre - Feasibility Study for the Hollister
Underground Mine | Title May 31, 2017 | Effective Date August 9, 2017 | Report Date |
Table 22-3: Economic Analysis
| NPV ($k) | $8,781 | 1100 | 1200 | 1300 | 1400 | 1500 | 1600 | Average LOM Gold price |
| Discount rate | 0% | 2,570 | 10,077 | 17,583 | 25,088 | 32,026 | 38,784 | |
| 3% | 2,136 | 9,499 | 16,860 | 24,219 | 31,012 | 37,626 | ||
| 6% | 1,729 | 8,955 | 16,180 | 23,403 | 30,060 | 36,537 | ||
| 9% | 1,345 | 8,443 | 15,539 | 22,635 | 29,164 | 35,513 | ||
| 12% | 982 | 7,960 | 14,936 | 21,911 | 28,319 | 34,548 | ||
| 15% | 640 | 7,503 | 14,366 | 21,227 | 27,521 | 33,637 | ||
| NPV ($k) | $8,781 | 89% | 90% | 91% | 92% | 93% | 94% | Au Recovery |
| Tons per day | 200.00 | (426) | 329 | 1,083 | 1,838 | 2,592 | 3,347 | |
| 220.00 | 2,835 | 3,660 | 4,484 | 5,309 | 6,134 | 6,959 | ||
| 240.00 | 6,095 | 6,990 | 7,886 | 8,781 | 9,676 | 10,571 | ||
| 260.00 | 9,356 | 10,321 | 11,287 | 12,252 | 13,218 | 14,183 | ||
| 280.00 | 12,257 | 13,274 | 14,291 | 15,308 | 16,325 | 17,342 | ||
| 300.00 | 14,148 | 15,179 | 16,209 | 17,239 | 18,176 | 19,094 | ||
| NPV ($k) | $8,781 | 1100 | 1200 | 1300 | 1400 | 1500 | 1600 | Average LOM Gold price |
| UG Mining Cost | 260 | 3,605 | 10,788 | 17,969 | 25,149 | 31,762 | 38,196 | |
| 270 | 2,755 | 9,937 | 17,119 | 24,299 | 30,912 | 37,346 | ||
| 280 | 1,904 | 9,087 | 16,268 | 23,448 | 30,061 | 36,495 | ||
| 290 | 1,054 | 8,236 | 15,418 | 22,598 | 29,211 | 35,645 | ||
| 300 | 203 | 7,386 | 14,567 | 21,747 | 28,360 | 34,794 | ||
| 310 | (647) | 6,535 | 13,717 | 20,897 | 27,510 | 33,944 | ||
| NPV ($k) | $8,781 | 76% | 80% | 84% | 88% | 92% | 96% | Au Recovery |
| Average Grade | 0.50 | (12,104) | (8,827) | (5,589) | (2,351) | 887 | 4,125 | |
| 0.55 | (5,913) | (2,351) | 1,211 | 4,773 | 8,334 | 11,895 | ||
| 0.60 | 240 | 4,125 | 8,010 | 11,895 | 15,780 | 19,665 | ||
| 0.65 | 5,983 | 10,093 | 14,203 | 18,313 | 22,423 | 26,320 | ||
| 0.70 | 10,543 | 14,729 | 18,915 | 23,027 | 26,755 | 30,483 | ||
| 0.75 | 14,085 | 18,309 | 22,247 | 25,980 | 29,713 | 33,446 |
Following this analysis, sensitivities on Gold Price, Underground Mining costs, Sustaining Capital, and Average Gold Grade were compiled in Table 22-4. The economic analysis of the Gloria and Main zones are most sensitive to gold price and operating expenditures, including direct mining and process costs, ore transport, and royalty payments.
Table 22-4: Sensitivities
| -30% | -20% | -10% | 0% | 10% | 20% | 30% | |
| Gold price | (25,994) | (17,242) | (8,620) | - | 8,617 | 17,114 | 24,835 |
| Underground Mining costs | 7,236 | 4,824 | 2,412 | - | (2,412) | (4,824) | (7,236) |
| Sustaining capital | 3,622 | 2,415 | 1,207 | - | (1,208) | (2,415) | (3,622) |
| Average gold grade | (26,142) | (17,336) | (8,667) | - | 8,666 | 17,251 | 25,043 |
| 172 | P a g e |
|
Technical Report and Pre - Feasibility Study for the Hollister
Underground Mine | Title May 31, 2017 | Effective Date August 9, 2017 | Report Date |
Figure 22-1 Spider Chart on Key Metrics
![]()
| 22.4 | Potential Improvements to Life of Mine Plan |
The project economics at Hollister would be further improved with a number of opportunities including further extension of the Gloria deposit to the west and the exploration and development of the Hatter Graben deposit that is currently open in all directions and potentially higher grade than the current estimated mineral resource and reserves at Gloria and the Main deposits. These opportunities are discussed in Section 25.
| 173 | P a g e |
|
Technical Report and Pre - Feasibility Study for the Hollister
Underground Mine | Title May 31, 2017 | Effective Date August 9, 2017 | Report Date |
| 23 |
Adjacent Properties |
Although the information below was publicly disclosed by previous operators of the adjacent properties, the QP is unable to verify the information on the adjacent properties, and therefore cannot state that the information is necessarily indicative of the mineralization being similar to that of the Hollister Project.
| 23.1 | Silver Cloud Property |
The Silver Cloud Property is located six miles southwest of the Mine. The property consists of 552 unpatented mining claims owned by Carl Pescio of Elko, Nevada. Silver Cloud is underlain by a large hydrothermal alteration zone in the same volcanic rocks as those occurring at the Mine. Previous drilling on the property intersected low-sulfidation gold-silver mineralization beneath mercury-bearing hotspring silica deposits. Reported drill results from separate target areas include 4.92 feet grading 4.58 opt gold at a depth of 1,043 feet, and 40 feet grading 0.16 opt gold at a depth of 682.4 feet (Loptien, 2006). The adjoining West Silver Cloud, controlled by Rimrock Gold, consists of 38 unpatented claims.
Further information on the properties and exploration results can be found on Rimrock Gold’s website (http://www.rimrockgold.com/our-properties/silver-cloud/).
| 23.2 | Baxter |
The Baxter property, located a few miles east of the Hollister property, has been tested for Carlin-type gold mineralization by a number of companies. The most recent of these was Anglo Gold Corporation, which drilled a single deep hole. This hole was abandoned in excess of 5,000 feet without intersecting Devonian “lower plate” carbonate rocks.
| 174 | P a g e |
|
Technical Report and Pre - Feasibility Study for the Hollister
Underground Mine | Title May 31, 2017 | Effective Date August 9, 2017 | Report Date |
| 24 |
Other Relevant Data and Information |
The authors are not aware of any other relevant data and information having bearing on the Mine mineral resource estimate or ongoing exploration or operations.
| 175 | P a g e |
|
Technical Report and Pre - Feasibility Study for the Hollister
Underground Mine | Title May 31, 2017 | Effective Date August 9, 2017 | Report Date |
| 25 |
Interpretation and Conclusions |
The Mine is a modern, mechanized narrow vein mine. The Gloria mineralized veins and the historic remnant areas accessible from main development have been defined to a sufficient level of detail to declare reserves. Additional potential exists to extend reserves as underground access is developed. As the footprint of the Mine grows and the number of available mining areas grows with it, it is expected that the mining rate can be increased, and that cost reductions can be realized through economies of scale.
The conventional Merrill Crowe mill facility at Midas is an efficient, well-maintained, modern mineral processing plant capable of processing 1,200 tpd. The mill is capable of operating with a minimum crew compliment resulting in cost reductions when operated at capacity. The underutilized capacity can accept the additional production from the Mine as well as third party processing agreements.
Capital and pre-development requirements for the Mine are in line with that expected for startup and operation. Ongoing mine development comprises the majority of capital costs and the ability to access multiple veins from common development greatly reduces the unit cost per ounce.
Table 25-1 lists significant risks identified by the authors. Based on the assumptions described herein, and in the opinion of the authors of this TR, the high grade reserves in the Mine plan are expected to provide a return on investment and sustain profitable operations.
Table 25-1: Significant Risks Identified by the Authors
| Risk | Potential Impact | Mitigating Measures | Opportunities |
Mine and/or Mill |
Lower cashflow |
Convert Inferred Mineral Resource to Measured or Indicated Mineral Resources near planned or historic mining areas |
Additional work areas allow an increase in production rate and achieves economies of scale |
Mill recoveries lower |
Lower cashflow, |
Investigate alternate means of processing |
Improve recoveries |
Longhole stope dilution |
Production cost |
Employ alternative and known narrow mining methods and/or increase cutoff grade |
Dilution can contain mineralization and could aid in obtaining economies of scale |
| 176 | P a g e |
|
Technical Report and Pre - Feasibility Study for the Hollister
Underground Mine | Title May 31, 2017 | Effective Date August 9, 2017 | Report Date |
| 26 |
Recommendations |
| 1. | Surface Exploration: Conduct surface exploration program to follow-up on historic Hatter drilling results too define a NI 43-101-compliant resource. |
|
| 2. | Underground Exploration: Underground drilling should continue in the veins identified near the current development workings to increase the level of confidence in these veins to an indicated classification. Historic workings should be examined, and where confidence exists, re-accessed and drilled. |
|
| 3. | Stope Planning: Continue with the primary longhole stoping method in the Gloria zone, maintaining panel heights no more than 28 feet to ensure accuracy and recovery. Where possible, extend this method to historic areas. |
|
| 4. | QAQC: Klondex has generated a detailed standard operating procedure (SOP) for QAQC sampling. Management should periodically review QAQC results to ensure that timely follow-up of QAQC assay deviations and re-assay requests. |
|
| 5. | Metallurgy: Continue On-going Metallurgical Studies to improve the understanding of grade/recovery relationships. |
| 177 | P a g e |
|
Technical Report and Pre - Feasibility Study for the Hollister
Underground Mine | Title May 31, 2017 | Effective Date August 9, 2017 | Report Date |
| 27 |
References |
Bailey and Phoenix, 1944, Quicksilver deposits of Nevada: Univ. Nevada Bull., v. 38, no. 5, 138 p.
Bartlett, M.W., Enders, M.S., and Hruska, D.C., 1991, Geology of the Hollister gold deposit, Ivanhoe district, Elko County, Nevada, in Raines, G.L., Lisle, R.E., Schafer, R.W., and Wilkinson, W.H., eds., Geology and Ore Deposits of the Great Basin: Geological Society of Nevada Symposium, Reno,
1990, Proceedings, p. 957–978.
Calloway, V. R., 2011a, 2011 Final Report Hollister Geology, unpublished (in-house) geological report for Great Basin Gold, Inc.
Calloway, V. R., 2011, Summary of 2011 Geologic Mapping Mine Area, Northern Nevada, unpublished (in-house) geological report for Great Basin Gold, Inc.
Calloway, V. R., 2014, Geology and Structure of the Mine Area, Elko County,, Nevada, unpublished (in-house) geological report for Waterton Global Mining Company
Calloway, V. R. and Wrede, D., 2014, Geology and Structure Map of the Mine Area, Elko County, Nevada, unpublished (in-house) geological map for Waterton Global Mining Company
CIM, 2014 (citation from Item 14 Mineral Resource Estimate)
Cline J.S., 2001, Timing of gold and arsenic sulfide mineral deposition at the Getchell Carlin-type gold deposit, north-central Nevada. Economic Geology 96:75-90
Cline, J.S., Hofstra, A.H., and Muntean, J.L., 2005, Carlin-type gold deposits in Nevada: critical geologic characteristics and viable models: Economic Geology 100th Anniversary Volume, p. 451-484.
Deng, Q., 1991, Geology and trace element geochemistry of the Hollister gold deposit, Ivanhoe district, Elko County, Nevada: Unpublished Ph.D. dissertation, El Paso, University of Texas, 313 p.
Goldstrand, P. M., and Schmidt, K.W., 2000, Geology, mineralization, and ore controls at the Ken Snyder gold-silver mine, Elko County, Nevada in Cluer, J.K., Price, J.G., Struhsacker, E.M., Hardyman, R.F., and Morris, C.L., eds., Geology and Ore Deposits 2000: The Great Basin and Beyond: Geol. Soc. Of Nevada Symposium Proceedings, May 15-18, 2000, Reno-Sparks, Nevada, p. 265-287.
Godden, S. J., Oelofse, J. G., and Bentley, P. N., 2009, Technical Report on the June 2009 Update of the Mineral Resource Estimate for Hollister Gold Mine, 256 p.
Hedenquist, J.W., 2014, Observations on the epithermal gold veins of the Hollister deposit, Ivanhoe property, northern Nevada. Unpublished report for Great Basin Gold Ltd. 12 pgs.
Hollister, V., Hruska, D., and Moore, R., 1992, A mine-exposed hot spring deposit and related epithermal gold resource: Economic Geology, v. 32, p. 761-764.
John, D.A., 2001, Miocene and early Pliocene epithermal gold-silver deposits in the northern Great Basin, western United States: Characteristics, distribution, and relationship to Magmatism: Economic Geology, v. 96, p. 1827-1853.
Larson, L., 1998: Petrographic and scanning electron microscope studies, Ivanhoe project. Four reports.
Leavitt, E.D., Arehart, G.B., and Goldstrand, P.M., 2000, Hydrothermal alteration associated with the Colorado Grande vein, Ken Snyder mine, Elko County, Nevada [abs.]: Geol. Soc. Amer. Abstracts with Programs, v. 32, no. 7, p. 251.
| 178 | P a g e |
|
Technical Report and Pre - Feasibility Study for the Hollister
Underground Mine | Title May 31, 2017 | Effective Date August 9, 2017 | Report Date |
Leavitt, E. D., Spell, T. L., Goldstrand, P.M., and Arehart, G.B., 2004, Geochronology of the Midas Low-Sulfidation Epithermal Gold Silver Deposit, Elko County, Nevada: Economic Geology, Vol. 99, p. 1665-1686.
Loptien, G., 2006, Technical report on the Silver Cloud property, Elko County, Nevada: Technical Report for Geologix Explorations Inc., dated 10/20/2006, 51 p., 7 Appendices.
Muntean, J.L., Cline, J.S., Simon, A.C., and Longo, A.A., 2011, Magmatic–hydrothermal origin of Nevada’s Carlin-type gold deposits: Nature Geoscience 4, p. 122-127. Published online: 23 January 2011.
Nevada Bureau of Mines and Geology, 2013, Special Publication MI-2013, The Nevada Mineral Industry 2013.
Nowak, M. and Yuhasz, C., 2016, Independent Technical Report for the Hollister Gold Project,
Nevada, USA: 43-101 technical report on behalf of Carlin Resources, 176 p.
Oelofse, J.G., and, Van Heerden, D.J., 2008, Technical Report on the Resource Update for the Hollister Development Block Gold Project, 180 p.
Oelofse, J.G., Bentley, P.N., Van Heerden, D.J., 2011, Technical Report on the update of the mineral resource and mineral reserve estimates for the Hollister gold mine, Elko County, Nevada, USA, 371 p.
Peppard, B., 2002, Geology and geochemistry of the Ivanhoe vein system, Elko County, Nevada: unpublished M.Sc. thesis, Ann Arbor, University of Michigan, 49 p.
Ponce, D.A., and Glen, J.M.G., 2002, Relationship of epithermal gold deposits to large-scale fractures in northern Nevada: Economic Geology, v. 97, p. 3-9.
Price, S., 2001, High grade gold at Ivanhoe: Geological Society of Nevada Newsletter, v. 15, p. 3-4.
Price, S., 2005, Geology of the Hollister epithermal gold-silver system, Ivanhoe district, northern Nevada: Geol. Soc. Of Nevada Symposium, Field Trip Guidebook #5, Low-sulfidation vein systems in the NNR, Nevada, p. 125-140.
Redfern, R.R. and Abbott, E.W., 2002, Technical report on the Rock Creek - South Silver Cloud gold-silver property, Argenta Mining District, Lander and Eureka Counties, Nevada, USA, 37 p.
Rhys, D.A., 2014, Hollister Project: Geology, Structural Controls and Exploration Targeting. In-house report prepared for Waterton Global Resource Management Inc. 86 pgs.
Saunders, J. A., Vikre, P., Unger, D.L., and Beasley, L., 2011, Colloidal and physical transport textures exhibited by electrum and naumannite in bonanza epithermal veins from western USA, and their significance, in Steininger, R., and Pennell, W., eds., Great Basin evolution and metallogeny: Geol. Soc. of Nevada 2010 Symposium, May 14-22, 2010, p. 825-832.
Tewalt, N. A., 1998, Subtle surface expression of high grade veins at the Ivanhoe project: Fall 1998 Field Trip Guidebook: Geol. Soc. of Nevada Special Publication 28, p. 149-161.
Thomason, R. E., 2010, Hollister geology and new discoveries in GSN Field Trip Guidebook 2, Epithermal deposits of northern Nevada: GSN Great Basin evolution and metallogeny symposium, 2010, Reno, p. 93-102.
Thompson and Gale, 2001, spectrographic alteration study, in-house Great Basin Gold Ltd.
Unger, D.L., 2008, Geochronology and geochemistry of mid-Miocene bonanza low-sulfidation epithermal ores of the northern Great Basin, USA: unp. M. S. thesis, Auburn University, 97 p., 2 appendices.
Wallace, A.R., 2003a, Geology of the Ivanhoe Hg-Au District, Northern Nevada: Influence of Miocene volcanism, lakes and active faulting on epithermal mineralization: Economic Geology, v. 98, p. 409-424.
| 179 | P a g e |
|
Technical Report and Pre - Feasibility Study for the Hollister
Underground Mine | Title May 31, 2017 | Effective Date August 9, 2017 | Report Date |
Wallace, A.R., 2003b, Geological map of the Willow Creek Reservoir SE quadrangle, Elko, Eureka, and Lander Counties: Nevada Bureau of Mines and Geology Map 136, scale 1:24,000.
Wallace, A.R., 2003c, Geological map of the Willow Creek Reservoir quadrangle, Elko County: Nevada Bureau of Mines and Geology Map 135, scale 1:24,000.
Wober, G., and Stone, D., 2007, Technical Report – Update on the Exploration Activities on the Hollister Gold Project, 125 p.
WRCC, 2017, Western Regional Climate Center. 2017. Midas Nevada, Nevada Period of Record Monthly Climate Summary
| 180 | P a g e |
|
Technical Report and Pre - Feasibility Study for the Hollister
Underground Mine | Title May 31, 2017 | Effective Date August 9, 2017 | Report Date |
| Appendix A – QAQC Graphs |
![]()
Figure A-1: Ag assay results from field blanks used in Great
Basin Gold’s channel sampling from 2011– 2013.
Results below analytical
detection limits are plotted at one half of the detection limit.
![]()
Figure A-2: Au assay results from certified reference
material, CDN-GS-7E, used in Great Basin Gold’s channel
sampling from 2011 –
2013.
| 181 | P a g e |
|
Technical Report and Pre - Feasibility Study for the Hollister
Underground Mine | Title May 31, 2017 | Effective Date August 9, 2017 | Report Date |
![]()
Figure A-3: Au assay results from certified reference
material, CDN-GS-5H, used in Great Basin Gold’s channel
sampling from 2011 –
2013.
![]()
Figure A-4: Au assay results from certified reference
material, CDN-GS-5J, used in Great Basin Gold’s
channel
sampling from 2011 – 2013.
| 182 | P a g e |
|
Technical Report and Pre - Feasibility Study for the Hollister
Underground Mine | Title May 31, 2017 | Effective Date August 9, 2017 | Report Date |
![]()
Figure A-5: Au assay results from certified reference
material, CDN-GS-7A, used in Great Basin Gold’s channel
sampling from
2011 – 2013.
![]()
Figure A-6: Au assay results from certified reference
material, CDN-GS-15A, used in Great Basin Gold’s
channel
sampling from 20111 – 2013.
| 183 | P a g e |
|
Technical Report and Pre - Feasibility Study for the Hollister
Underground Mine | Title May 31, 2017 | Effective Date August 9, 2017 | Report Date |
![]()
Figure A-7: Au assay results from certified reference material,
CDN-GS-30A, used in Great Basin Gold’s
channel sampling from
20111 – 2013.
![]()
Figure A-8: Au assay results from certified reference
material, CDN-GS-20A, used in Great Basin Gold’s
channel
sampling from 20111 – 2013.
| 184 | P a g e |
|
Technical Report and Pre - Feasibility Study for the Hollister
Underground Mine | Title May 31, 2017 | Effective Date August 9, 2017 | Report Date |
![]()
Figure A-9: Au assay results from certified reference material,
CDN-GS-14A, used in Great Basin Gold’s
channel sampling from
20111 – 2013.
![]()
Figure A-10: Au assay results from internal reference
material, HVS1, used in Great Basin Gold’s
channel sampling from 2011 –
2013.
| 185 | P a g e |
|
Technical Report and Pre - Feasibility Study for the Hollister
Underground Mine | Title May 31, 2017 | Effective Date August 9, 2017 | Report Date |
![]()
Figure A-11: Au assay results from internal reference
material, HVS2, used in Great Basin Gold’s channel
sampling from 2011 –
2013.
![]()
Figure A-12: Ag assay results from certified reference
material, CDN-GS-5H, used in Great Basin Gold’s
channel
sampling from 20111 – 2013.
| 186 | P a g e |
|
Technical Report and Pre - Feasibility Study for the Hollister
Underground Mine | Title May 31, 2017 | Effective Date August 9, 2017 | Report Date |
![]()
Figure A-13: Ag assay results from certified reference
material, CDN-GS-5J, used in Great Basin Gold’s
channel
sampling from 20111 – 2013.
![]()
Figure A-14: Ag assay results from internal reference
material, HVS1, used in Great Basin Gold’s channel
sampling from
2011 – 2013.
| 187 | P a g e |
|
Technical Report and Pre - Feasibility Study for the Hollister
Underground Mine | Title May 31, 2017 | Effective Date August 9, 2017 | Report Date |

Figure A-15: Ag assay results from internal reference
material, HVS2, used in Great Basin Gold’s channel
sampling from 2011 –
2013.
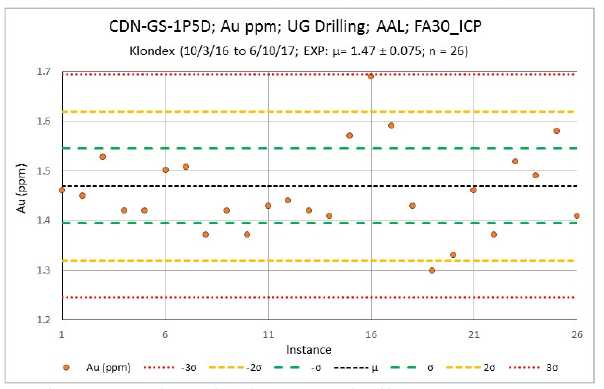
Figure A-16: Au assay results from certified reference
material, CDN-GS-1P5D, used in Klondex’s underground
drilling
campaign from 2016– 2017.
| 188 | P a g e |
|
Technical Report and Pre - Feasibility Study for the Hollister
Underground Mine | Title May 31, 2017 | Effective Date August 9, 2017 | Report Date |
![]()
Figure A-17: Au assay results from certified reference
material,CDN-GS-3M, used in Klondex’s underground
drilling campaign from
2016– 2017.
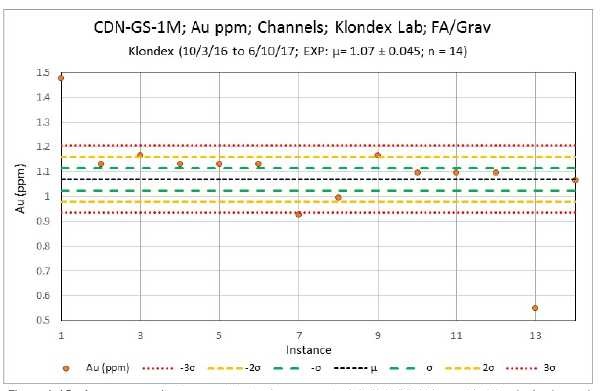
Figure A-18: Au assay results from certified reference
material, CDN-GS-1M, used in Klondex’s channel
sampling from 2016 –
2017
| 189 | P a g e |
|
Technical Report and Pre - Feasibility Study for the Hollister
Underground Mine | Title May 31, 2017 | Effective Date August 9, 2017 | Report Date |
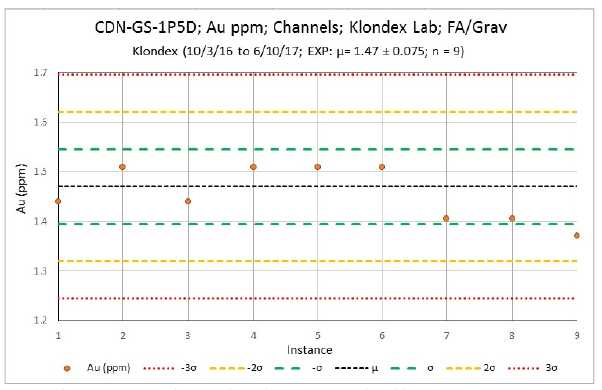
Figure A-19: Au assay results from certified reference
material, CDN-GS-1P5D, used in Klondex’s channel
sampling from 2016 –
2017.
| 190 | P a g e |
|
Technical Report and Pre - Feasibility Study for the Hollister
Underground Mine | Title May 31, 2017 | Effective Date August 9, 2017 | Report Date |
| Appendix B – Unpatented Claim List |
Mine, Elko County, Nevada
807 Unpatented Mining Claims, owned by Klondex
| # | BLM Serial Number | Claim Name | County | State |
| 1 | NMC1104386 | HDH 1 | Elko | Nevada |
| 2 | NMC1104387 | HDH 2 | Elko | Nevada |
| 3 | NMC1104388 | HDH 3 | Elko | Nevada |
| 4 | NMC1104389 | HDH 4 | Elko | Nevada |
| 5 | NMC1104390 | HDH 5 | Elko | Nevada |
| 6 | NMC1104391 | HDH 6 | Elko | Nevada |
| 7 | NMC1104392 | HDH 7 | Elko | Nevada |
| 8 | NMC1104393 | HDH 8 | Elko | Nevada |
| 9 | NMC1104394 | HDH 9 | Elko | Nevada |
| 10 | NMC1104395 | HDH 10 | Elko | Nevada |
| 11 | NMC1104396 | HDH 11 | Elko | Nevada |
| 12 | NMC1104397 | HDH 12 | Elko | Nevada |
| 13 | NMC1104398 | HDH 13 | Elko | Nevada |
| 14 | NMC1104399 | HDH 14 | Elko | Nevada |
| 15 | NMC1104400 | HDH 15 | Elko | Nevada |
| 16 | NMC1104401 | HDH 16 | Elko | Nevada |
| 17 | NMC1104402 | HDH 17 | Elko | Nevada |
| 18 | NMC1104403 | HDH 18 | Elko | Nevada |
| 19 | NMC1104404 | HDH 19 | Elko | Nevada |
| 20 | NMC1104405 | HDH 20 | Elko | Nevada |
| 21 | NMC1104406 | HDH 21 | Elko | Nevada |
| 22 | NMC1104407 | HDH 22 | Elko | Nevada |
| 23 | NMC1104408 | HDH 23 | Elko | Nevada |
| 24 | NMC1104409 | HDH 24 | Elko | Nevada |
| 25 | NMC1104410 | HDH 25 | Elko | Nevada |
| 26 | NMC1104411 | HDH 26 | Elko | Nevada |
| 27 | NMC1104412 | HDH 27 | Elko | Nevada |
| 28 | NMC1104413 | HDH 28 | Elko | Nevada |
| 29 | NMC1104414 | HDH 29 | Elko | Nevada |
| 30 | NMC1104415 | HDH 30 | Elko | Nevada |
| 31 | NMC1104416 | HDH 31 | Elko | Nevada |
| 32 | NMC1104417 | HDH 32 | Elko | Nevada |
| 33 | NMC1104418 | HDH 33 | Elko | Nevada |
| 34 | NMC1104419 | HDH 34 | Elko | Nevada |
| 35 | NMC1104420 | HDH 35 | Elko | Nevada |
| 36 | NMC1104421 | HDH 36 | Elko | Nevada |
| 37 | NMC1104422 | HDH 37 | Elko | Nevada |
| 38 | NMC1104423 | HDH 38 | Elko | Nevada |
| 39 | NMC1104424 | HDH 39 | Elko | Nevada |
| 40 | NMC1104425 | HDH 40 | Elko | Nevada |
| 191 | P a g e |
|
Technical Report and Pre - Feasibility Study for the Hollister
Underground Mine | Title May 31, 2017 | Effective Date August 9, 2017 | Report Date |
| # | BLM Serial Number | Claim Name | County | State |
| 41 | NMC1104426 | HDH 41 | Elko | Nevada |
| 42 | NMC1104427 | HDH 42 | Elko | Nevada |
| 43 | NMC1104428 | HDH 43 | Elko | Nevada |
| 44 | NMC1104429 | HDH 44 | Elko | Nevada |
| 45 | NMC1104430 | HDH 45 | Elko | Nevada |
| 46 | NMC1104431 | HDH 46 | Elko | Nevada |
| 47 | NMC1104432 | HDH 47 | Elko | Nevada |
| 48 | NMC1104433 | HDH 48 | Elko | Nevada |
| 49 | NMC1104434 | HDH 49 | Elko | Nevada |
| 50 | NMC1104435 | HDH 50 | Elko | Nevada |
| 51 | NMC1104436 | HDH 51 | Elko | Nevada |
| 52 | NMC1104437 | HDH 52 | Elko | Nevada |
| 53 | NMC1104438 | HDH 53 | Elko | Nevada |
| 54 | NMC1104439 | HDH 54 | Elko | Nevada |
| 55 | NMC1104440 | HDH 55 | Elko | Nevada |
| 56 | NMC1111879 | JOE 1R | Elko | Nevada |
| 57 | NMC1111880 | JOE 2R | Elko | Nevada |
| 58 | NMC1111881 | JOE 3R | Elko | Nevada |
| 59 | NMC1111882 | JOE 4R | Elko | Nevada |
| 60 | NMC1111883 | JOE 5R | Elko | Nevada |
| 61 | NMC1111884 | JOE 6R | Elko | Nevada |
| 62 | NMC1111885 | JOE 7R | Elko | Nevada |
| 63 | NMC1111886 | JOE 8R | Elko | Nevada |
| 64 | NMC1111887 | JOE 9R | Elko | Nevada |
| 65 | NMC1111888 | JOE 10R | Elko | Nevada |
| 66 | NMC1111889 | JOE 11R | Elko | Nevada |
| 67 | NMC1111890 | JOE 12R | Elko | Nevada |
| 68 | NMC1111891 | JOE 13R | Elko | Nevada |
| 69 | NMC1111892 | JOE 14R | Elko | Nevada |
| 70 | NMC1111893 | JOE 15R | Elko | Nevada |
| 71 | NMC1111894 | JOE 16R | Elko | Nevada |
| 72 | NMC395837 | WDF # 3 | Elko | Nevada |
| 73 | NMC395838 | WDF # 4 | Elko | Nevada |
| 74 | NMC395839 | WDF # 5 | Elko | Nevada |
| 75 | NMC395840 | WDF # 6 | Elko | Nevada |
| 76 | NMC395841 | WDF # 7 | Elko | Nevada |
| 77 | NMC395842 | WDF # 8 | Elko | Nevada |
| 78 | NMC395843 | WDF # 9 | Elko | Nevada |
| 79 | NMC395844 | WDF # 10 | Elko | Nevada |
| 80 | NMC395845 | WDF # 11 | Elko | Nevada |
| 81 | NMC395846 | WDF # 12 | Elko | Nevada |
| 82 | NMC395847 | WDF # 13 | Elko | Nevada |
| 83 | NMC395848 | WDF # 14 | Elko | Nevada |
| 84 | NMC395849 | WDF # 15 | Elko | Nevada |
| 85 | NMC395850 | WDF # 16 | Elko | Nevada |
| 192 | P a g e |
|
Technical Report and Pre - Feasibility Study for the Hollister
Underground Mine | Title May 31, 2017 | Effective Date August 9, 2017 | Report Date |
| # | BLM Serial Number | Claim Name | County | State |
| 86 | NMC395851 | WDF # 17 | Elko | Nevada |
| 87 | NMC395852 | WDF # 18 | Elko | Nevada |
| 88 | NMC395853 | WDF # 19 | Elko | Nevada |
| 89 | NMC395859 | WDF # 25 | Elko | Nevada |
| 90 | NMC395860 | WDF # 26 | Elko | Nevada |
| 91 | NMC395861 | WDF # 27 | Elko | Nevada |
| 92 | NMC395862 | WDF # 28 | Elko | Nevada |
| 93 | NMC395863 | WDF # 29 | Elko | Nevada |
| 94 | NMC395864 | WDF # 30 | Elko | Nevada |
| 95 | NMC395865 | WDF # 31 | Elko | Nevada |
| 96 | NMC395866 | WDF # 32 | Elko | Nevada |
| 97 | NMC395867 | WDF # 33 | Elko | Nevada |
| 98 | NMC395868 | WDF # 34 | Elko | Nevada |
| 99 | NMC395869 | WDF # 35 | Elko | Nevada |
| 100 | NMC395870 | WDF # 36 | Elko | Nevada |
| 101 | NMC395873 | WDF # 39 | Elko | Nevada |
| 102 | NMC395874 | WDF # 40 | Elko | Nevada |
| 103 | NMC395875 | WDF # 41 | Elko | Nevada |
| 104 | NMC395876 | WDF # 42 | Elko | Nevada |
| 105 | NMC395877 | WDF # 43 | Elko | Nevada |
| 106 | NMC395878 | WDF # 44 | Elko | Nevada |
| 107 | NMC395879 | WDF # 45 | Elko | Nevada |
| 108 | NMC395880 | WDF # 46 | Elko | Nevada |
| 109 | NMC395881 | WDF # 47 | Elko | Nevada |
| 110 | NMC395882 | WDF # 48 | Elko | Nevada |
| 111 | NMC395883 | WDF # 49 | Elko | Nevada |
| 112 | NMC395884 | WDF # 50 | Elko | Nevada |
| 113 | NMC395901 | WDF # 67 | Elko | Nevada |
| 114 | NMC395902 | WDF # 68 | Elko | Nevada |
| 115 | NMC395903 | WDF # 69 | Elko | Nevada |
| 116 | NMC395904 | WDF # 70 | Elko | Nevada |
| 117 | NMC395905 | WDF # 71 | Elko | Nevada |
| 118 | NMC395906 | WDF # 72 | Elko | Nevada |
| 119 | NMC395907 | WDF # 73 | Elko | Nevada |
| 120 | NMC395908 | WDF # 74 | Elko | Nevada |
| 121 | NMC395909 | WDF # 75 | Elko | Nevada |
| 122 | NMC395910 | WDF # 76 | Elko | Nevada |
| 123 | NMC395911 | WDF # 77 | Elko | Nevada |
| 124 | NMC395912 | WDF # 78 | Elko | Nevada |
| 125 | NMC395913 | WDF # 79 | Elko | Nevada |
| 126 | NMC395914 | WDF # 80 | Elko | Nevada |
| 127 | NMC395915 | WDF # 81 | Elko | Nevada |
| 128 | NMC395916 | WDF # 82 | Elko | Nevada |
| 129 | NMC395917 | WDF # 83 | Elko | Nevada |
| 130 | NMC395918 | WDF # 84 | Elko | Nevada |
| 193 | P a g e |
|
Technical Report and Pre - Feasibility Study for the Hollister
Underground Mine | Title May 31, 2017 | Effective Date August 9, 2017 | Report Date |
| # | BLM Serial Number | Claim Name | County | State |
| 131 | NMC395919 | WDF # 85 | Elko | Nevada |
| 132 | NMC395920 | WDF # 86 | Elko | Nevada |
| 133 | NMC395939 | WDF #105 | Elko | Nevada |
| 134 | NMC395940 | WDF #106 | Elko | Nevada |
| 135 | NMC395941 | WDF #107 | Elko | Nevada |
| 136 | NMC395942 | WDF #108 | Elko | Nevada |
| 137 | NMC395943 | WDF #109 | Elko | Nevada |
| 138 | NMC395944 | WDF #110 | Elko | Nevada |
| 139 | NMC395945 | WDF #111 | Elko | Nevada |
| 140 | NMC395946 | WDF #112 | Elko | Nevada |
| 141 | NMC395947 | WDF #113 | Elko | Nevada |
| 142 | NMC395948 | WDF #114 | Elko | Nevada |
| 143 | NMC395949 | WDF #115 | Elko | Nevada |
| 144 | NMC395950 | WDF #116 | Elko | Nevada |
| 145 | NMC395951 | WDF #117 | Elko | Nevada |
| 146 | NMC395952 | WDF #118 | Elko | Nevada |
| 147 | NMC395953 | WDF #119 | Elko | Nevada |
| 148 | NMC395954 | WDF #120 | Elko | Nevada |
| 149 | NMC395955 | WDF #121 | Elko | Nevada |
| 150 | NMC395976 | WDF #157 | Elko | Nevada |
| 151 | NMC395977 | WDF #158 | Elko | Nevada |
| 152 | NMC395978 | WDF #159 | Elko | Nevada |
| 153 | NMC395979 | WDF #160 | Elko | Nevada |
| 154 | NMC395980 | WDF #161 | Elko | Nevada |
| 155 | NMC395981 | WDF #162 | Elko | Nevada |
| 156 | NMC395982 | WDF #163 | Elko | Nevada |
| 157 | NMC395983 | WDF #164 | Elko | Nevada |
| 158 | NMC395984 | WDF #165 | Elko | Nevada |
| 159 | NMC396020 | WDF #216 | Elko | Nevada |
| 160 | NMC402863 | LAY # 11 | Elko | Nevada |
| 161 | NMC402864 | LAY # 12 | Elko | Nevada |
| 162 | NMC402865 | LAY # 13 | Elko | Nevada |
| 163 | NMC402866 | LAY # 14 | Elko | Nevada |
| 164 | NMC402867 | LAY # 15 | Elko | Nevada |
| 165 | NMC402868 | LAY # 16 | Elko | Nevada |
| 166 | NMC402869 | LAY # 17 | Elko | Nevada |
| 167 | NMC402870 | LAY # 18 | Elko | Nevada |
| 168 | NMC402871 | LAY # 19 | Elko | Nevada |
| 169 | NMC402872 | LAY # 20 | Elko | Nevada |
| 170 | NMC402873 | LAY # 21 | Elko | Nevada |
| 171 | NMC402874 | LAY # 22 | Elko | Nevada |
| 172 | NMC402875 | LAY # 23 | Elko | Nevada |
| 173 | NMC402876 | LAY # 24 | Elko | Nevada |
| 174 | NMC402901 | LAY # 49 | Elko | Nevada |
| 175 | NMC402902 | LAY # 50 | Elko | Nevada |
| 194 | P a g e |
|
Technical Report and Pre - Feasibility Study for the Hollister
Underground Mine | Title May 31, 2017 | Effective Date August 9, 2017 | Report Date |
| # | BLM Serial Number | Claim Name | County | State |
| 176 | NMC402903 | LAY # 51 | Elko | Nevada |
| 177 | NMC402904 | LAY # 52 | Elko | Nevada |
| 178 | NMC402905 | LAY # 53 | Elko | Nevada |
| 179 | NMC402906 | LAY # 54 | Elko | Nevada |
| 180 | NMC402907 | LAY # 55 | Elko | Nevada |
| 181 | NMC402908 | LAY # 56 | Elko | Nevada |
| 182 | NMC402909 | LAY # 57 | Elko | Nevada |
| 183 | NMC402910 | LAY # 58 | Elko | Nevada |
| 184 | NMC402959 | LAY #107 | Elko | Nevada |
| 185 | NMC402961 | LAY #109 | Elko | Nevada |
| 186 | NMC402963 | LAY #111 | Elko | Nevada |
| 187 | NMC402965 | LAY #113 | Elko | Nevada |
| 188 | NMC402967 | LAY #115 | Elko | Nevada |
| 189 | NMC405029 | ANT # 8 | Elko | Nevada |
| 190 | NMC405030 | ANT # 9 | Elko | Nevada |
| 191 | NMC405031 | ANT # 10 | Elko | Nevada |
| 192 | NMC405032 | ANT # 11 | Elko | Nevada |
| 193 | NMC405033 | ANT # 12 | Elko | Nevada |
| 194 | NMC405034 | ANT # 13 | Elko | Nevada |
| 195 | NMC405035 | ANT # 14 | Elko | Nevada |
| 196 | NMC405036 | ANT # 15 | Elko | Nevada |
| 197 | NMC405037 | ANT # 16 | Elko | Nevada |
| 198 | NMC405038 | ANT # 17 | Elko | Nevada |
| 199 | NMC405039 | ANT # 18 | Elko | Nevada |
| 200 | NMC405040 | ANT # 19 | Elko | Nevada |
| 201 | NMC405041 | ANT # 20 | Elko | Nevada |
| 202 | NMC405042 | ANT # 21 | Elko | Nevada |
| 203 | NMC405043 | ANT # 22 | Elko | Nevada |
| 204 | NMC405044 | ANT # 23 | Elko | Nevada |
| 205 | NMC405045 | ANT # 24 | Elko | Nevada |
| 206 | NMC405048 | ANT # 27 | Elko | Nevada |
| 207 | NMC405049 | ANT # 28 | Elko | Nevada |
| 208 | NMC405050 | ANT # 29 | Elko | Nevada |
| 209 | NMC405051 | ANT # 30 | Elko | Nevada |
| 210 | NMC500485 | HOL # 10 | Elko | Nevada |
| 211 | NMC500486 | HOL # 11 | Elko | Nevada |
| 212 | NMC500487 | HOL # 12 | Elko | Nevada |
| 213 | NMC500488 | HOL # 13 | Elko | Nevada |
| 214 | NMC500489 | HOL # 14 | Elko | Nevada |
| 215 | NMC500490 | HOL # 15 | Elko | Nevada |
| 216 | NMC500491 | HOL # 16 | Elko | Nevada |
| 217 | NMC500492 | HOL # 17 | Elko | Nevada |
| 218 | NMC500493 | HOL # 18 | Elko | Nevada |
| 219 | NMC500504 | HOL # 29 | Elko | Nevada |
| 220 | NMC500505 | HOL # 30 | Elko | Nevada |
| 195 | P a g e |
|
Technical Report and Pre - Feasibility Study for the Hollister
Underground Mine | Title May 31, 2017 | Effective Date August 9, 2017 | Report Date |
| # | BLM Serial Number | Claim Name | County | State |
| 221 | NMC515541 | MWB # 2 | Elko | Nevada |
| 222 | NMC679459 | CLYN 1 | Elko | Nevada |
| 223 | NMC679460 | CLYN 2 | Elko | Nevada |
| 224 | NMC679461 | CLYN 3 | Elko | Nevada |
| 225 | NMC679462 | CLYN 4 | Elko | Nevada |
| 226 | NMC679463 | CLYN 5 | Elko | Nevada |
| 227 | NMC679464 | CLYN 6 | Elko | Nevada |
| 228 | NMC679465 | CLYN 7 | Elko | Nevada |
| 229 | NMC679466 | CLYN 8 | Elko | Nevada |
| 230 | NMC679467 | CLYN 9 | Elko | Nevada |
| 231 | NMC679468 | CLYN 10 | Elko | Nevada |
| 232 | NMC679469 | CLYN 11 | Elko | Nevada |
| 233 | NMC679470 | CLYN 12 | Elko | Nevada |
| 234 | NMC679471 | CLYN 13 | Elko | Nevada |
| 235 | NMC679472 | CLYN 14 | Elko | Nevada |
| 236 | NMC679473 | CLYN 15 | Elko | Nevada |
| 237 | NMC679474 | CLYN 16 | Elko | Nevada |
| 238 | NMC679475 | CLYN 17 | Elko | Nevada |
| 239 | NMC679476 | CLYN 18 | Elko | Nevada |
| 240 | NMC679477 | CLYN 19 | Elko | Nevada |
| 241 | NMC679478 | CLYN 20 | Elko | Nevada |
| 242 | NMC679479 | CLYN 21 | Elko | Nevada |
| 243 | NMC679480 | CLYN 22 | Elko | Nevada |
| 244 | NMC679481 | CLYN 23 | Elko | Nevada |
| 245 | NMC679482 | CLYN 24 | Elko | Nevada |
| 246 | NMC679483 | CLYN 25 | Elko | Nevada |
| 247 | NMC679484 | CLYN 26 | Elko | Nevada |
| 248 | NMC679485 | CLYN 27 | Elko | Nevada |
| 249 | NMC679486 | CLYN 28 | Elko | Nevada |
| 250 | NMC679487 | CLYN 29 | Elko | Nevada |
| 251 | NMC679488 | CLYN 30 | Elko | Nevada |
| 252 | NMC679489 | CLYN 31 | Elko | Nevada |
| 253 | NMC679490 | CLYN 32 | Elko | Nevada |
| 254 | NMC679491 | CLYN 33 | Elko | Nevada |
| 255 | NMC679492 | CLYN 34 | Elko | Nevada |
| 256 | NMC679493 | CLYN 35 | Elko | Nevada |
| 257 | NMC679494 | CLYN 36 | Elko | Nevada |
| 258 | NMC679495 | CLYN 37 | Elko | Nevada |
| 259 | NMC679496 | CLYN 38 | Elko | Nevada |
| 260 | NMC679497 | CLYN 39 | Elko | Nevada |
| 261 | NMC679498 | CLYN 40 | Elko | Nevada |
| 262 | NMC679499 | CLYN 41 | Elko | Nevada |
| 263 | NMC679500 | CLYN 42 | Elko | Nevada |
| 264 | NMC679501 | CLYN 43 | Elko | Nevada |
| 265 | NMC679502 | CLYN 44 | Elko | Nevada |
| 196 | P a g e |
|
Technical Report and Pre - Feasibility Study for the Hollister
Underground Mine | Title May 31, 2017 | Effective Date August 9, 2017 | Report Date |
| # | BLM Serial Number | Claim Name | County | State |
| 266 | NMC679503 | CLYN 45 | Elko | Nevada |
| 267 | NMC679504 | CLYN 46 | Elko | Nevada |
| 268 | NMC679505 | CLYN 47 | Elko | Nevada |
| 269 | NMC679506 | CLYN 48 | Elko | Nevada |
| 270 | NMC679507 | CLYN 49 | Elko | Nevada |
| 271 | NMC679508 | CLYN 50 | Elko | Nevada |
| 272 | NMC679509 | CLYN 51 | Elko | Nevada |
| 273 | NMC679510 | CLYN 52 | Elko | Nevada |
| 274 | NMC679511 | CLYN 53 | Elko | Nevada |
| 275 | NMC679512 | CLYN 54 | Elko | Nevada |
| 276 | NMC679513 | CLYN 55 | Elko | Nevada |
| 277 | NMC679514 | CLYN 56 | Elko | Nevada |
| 278 | NMC679515 | CLYN 57 | Elko | Nevada |
| 279 | NMC679516 | CLYN 58 | Elko | Nevada |
| 280 | NMC679517 | CLYN 59 | Elko | Nevada |
| 281 | NMC679518 | CLYN 60 | Elko | Nevada |
| 282 | NMC679519 | CLYN 61 | Elko | Nevada |
| 283 | NMC679520 | CLYN 62 | Elko | Nevada |
| 284 | NMC679521 | CLYN 63 | Elko | Nevada |
| 285 | NMC679522 | CLYN 64 | Elko | Nevada |
| 286 | NMC679523 | CLYN 65 | Elko | Nevada |
| 287 | NMC679524 | CLYN 66 | Elko | Nevada |
| 288 | NMC679525 | CLYN 67 | Elko | Nevada |
| 289 | NMC679526 | CLYN 68 | Elko | Nevada |
| 290 | NMC679527 | CLYN 69 | Elko | Nevada |
| 291 | NMC679528 | CLYN 70 | Elko | Nevada |
| 292 | NMC679529 | CLYN 71 | Elko | Nevada |
| 293 | NMC679530 | CLYN 72 | Elko | Nevada |
| 294 | NMC679531 | CLYN 73 | Elko | Nevada |
| 295 | NMC679532 | CLYN 74 | Elko | Nevada |
| 296 | NMC679533 | CLYN 75 | Elko | Nevada |
| 297 | NMC679534 | CLYN 76 | Elko | Nevada |
| 298 | NMC679535 | CLYN 77 | Elko | Nevada |
| 299 | NMC679536 | CLYN 78 | Elko | Nevada |
| 300 | NMC679537 | CLYN 79 | Elko | Nevada |
| 301 | NMC679538 | CLYN 80 | Elko | Nevada |
| 302 | NMC679539 | CLYN 81 | Elko | Nevada |
| 303 | NMC679540 | CLYN 82 | Elko | Nevada |
| 304 | NMC679541 | CLYN 83 | Elko | Nevada |
| 305 | NMC679542 | CLYN 84 | Elko | Nevada |
| 306 | NMC679543 | CLYN 85 | Elko | Nevada |
| 307 | NMC679544 | CLYN 86 | Elko | Nevada |
| 308 | NMC679545 | CLYN 87 | Elko | Nevada |
| 309 | NMC679546 | CLYN 88 | Elko | Nevada |
| 310 | NMC679547 | CLYN 89 | Elko | Nevada |
| 197 | P a g e |
|
Technical Report and Pre - Feasibility Study for the Hollister
Underground Mine | Title May 31, 2017 | Effective Date August 9, 2017 | Report Date |
| # | BLM Serial Number | Claim Name | County | State |
| 311 | NMC679548 | CLYN 90 | Elko | Nevada |
| 312 | NMC679549 | CLYN 91 | Elko | Nevada |
| 313 | NMC679550 | CLYN 92 | Elko | Nevada |
| 314 | NMC679551 | CLYN 93 | Elko | Nevada |
| 315 | NMC679552 | CLYN 94 | Elko | Nevada |
| 316 | NMC679553 | CLYN 95 | Elko | Nevada |
| 317 | NMC679560 | CLYN 102 | Elko | Nevada |
| 318 | NMC679561 | CLYN 103 | Elko | Nevada |
| 319 | NMC679562 | CLYN 104 | Elko | Nevada |
| 320 | NMC679563 | CLYN 105 | Elko | Nevada |
| 321 | NMC679564 | CLYN 106 | Elko | Nevada |
| 322 | NMC679565 | CLYN 107 | Elko | Nevada |
| 323 | NMC679566 | CLYN 108 | Elko | Nevada |
| 324 | NMC679567 | CLYN 109 | Elko | Nevada |
| 325 | NMC679568 | CLYN 110 | Elko | Nevada |
| 326 | NMC679569 | CLYN 111 | Elko | Nevada |
| 327 | NMC679570 | CLYN 112 | Elko | Nevada |
| 328 | NMC679571 | CLYN 113 | Elko | Nevada |
| 329 | NMC679572 | CLYN 114 | Elko | Nevada |
| 330 | NMC679573 | CLYN 115 | Elko | Nevada |
| 331 | NMC679574 | CLYN 116 | Elko | Nevada |
| 332 | NMC679575 | CLYN 117 | Elko | Nevada |
| 333 | NMC679576 | CLYN 118 | Elko | Nevada |
| 334 | NMC679577 | CLYN 119 | Elko | Nevada |
| 335 | NMC679578 | CLYN 120 | Elko | Nevada |
| 336 | NMC679579 | CLYN 121 | Elko | Nevada |
| 337 | NMC679580 | CLYN 122 | Elko | Nevada |
| 338 | NMC679581 | CLYN 123 | Elko | Nevada |
| 339 | NMC679582 | CLYN 124 | Elko | Nevada |
| 340 | NMC679583 | CLYN 125 | Elko | Nevada |
| 341 | NMC679584 | CLYN 126 | Elko | Nevada |
| 342 | NMC679585 | CLYN 127 | Elko | Nevada |
| 343 | NMC679586 | CLYN 128 | Elko | Nevada |
| 344 | NMC679587 | CLYN 129 | Elko | Nevada |
| 345 | NMC679588 | CLYN 130 | Elko | Nevada |
| 346 | NMC679589 | CLYN 131 | Elko | Nevada |
| 347 | NMC679590 | CLYN 132 | Elko | Nevada |
| 348 | NMC679591 | CLYN 133 | Elko | Nevada |
| 349 | NMC679592 | CLYN 134 | Elko | Nevada |
| 350 | NMC679593 | CLYN 135 | Elko | Nevada |
| 351 | NMC679594 | CLYN 136 | Elko | Nevada |
| 352 | NMC679595 | CLYN 137 | Elko | Nevada |
| 353 | NMC679596 | CLYN 138 | Elko | Nevada |
| 354 | NMC679597 | CLYN 139 | Elko | Nevada |
| 355 | NMC679599 | CLYN 141 | Elko | Nevada |
| 198 | P a g e |
|
Technical Report and Pre - Feasibility Study for the Hollister
Underground Mine | Title May 31, 2017 | Effective Date August 9, 2017 | Report Date |
| # | BLM Serial Number | Claim Name | County | State |
| 356 | NMC679602 | CLYN 144 | Elko | Nevada |
| 357 | NMC679619 | CLYN 161 | Elko | Nevada |
| 358 | NMC679620 | CLYN 162 | Elko | Nevada |
| 359 | NMC679621 | CLYN 163 | Elko | Nevada |
| 360 | NMC679622 | CLYN 164 | Elko | Nevada |
| 361 | NMC679623 | CLYN 165 | Elko | Nevada |
| 362 | NMC679624 | CLYN 166 | Elko | Nevada |
| 363 | NMC679625 | CLYN 167 | Elko | Nevada |
| 364 | NMC679626 | CLYN 168 | Elko | Nevada |
| 365 | NMC679627 | CLYN 169 | Elko | Nevada |
| 366 | NMC679628 | CLYN 170 | Elko | Nevada |
| 367 | NMC679629 | CLYN 171 | Elko | Nevada |
| 368 | NMC679630 | CLYN 172 | Elko | Nevada |
| 369 | NMC679631 | CLYN 173 | Elko | Nevada |
| 370 | NMC679632 | CLYN 174 | Elko | Nevada |
| 371 | NMC679633 | CLYN 175 | Elko | Nevada |
| 372 | NMC679634 | CLYN 176 | Elko | Nevada |
| 373 | NMC679635 | CLYN 177 | Elko | Nevada |
| 374 | NMC679636 | CLYN 178 | Elko | Nevada |
| 375 | NMC679637 | CLYN 179 | Elko | Nevada |
| 376 | NMC679638 | CLYN 180 | Elko | Nevada |
| 377 | NMC679639 | CLYN 181 | Elko | Nevada |
| 378 | NMC679640 | CLYN 182 | Elko | Nevada |
| 379 | NMC679641 | CLYN 183 | Elko | Nevada |
| 380 | NMC679642 | CLYN 184 | Elko | Nevada |
| 381 | NMC679643 | CLYN 185 | Elko | Nevada |
| 382 | NMC679644 | CLYN 186 | Elko | Nevada |
| 383 | NMC679645 | CLYN 187 | Elko | Nevada |
| 384 | NMC679646 | CLYN 188 | Elko | Nevada |
| 385 | NMC679647 | CLYN 189 | Elko | Nevada |
| 386 | NMC679648 | CLYN 190 | Elko | Nevada |
| 387 | NMC679649 | CLYN 191 | Elko | Nevada |
| 388 | NMC679650 | CLYN 192 | Elko | Nevada |
| 389 | NMC679651 | CLYN 193 | Elko | Nevada |
| 390 | NMC679652 | CLYN 194 | Elko | Nevada |
| 391 | NMC679653 | CLYN 195 | Elko | Nevada |
| 392 | NMC679671 | CLYN 213 | Elko | Nevada |
| 393 | NMC679672 | CLYN 214 | Elko | Nevada |
| 394 | NMC679673 | CLYN 215 | Elko | Nevada |
| 395 | NMC679674 | CLYN 216 | Elko | Nevada |
| 396 | NMC679679 | CLYN 221 | Elko | Nevada |
| 397 | NMC679681 | CLYN 223 | Elko | Nevada |
| 398 | NMC679683 | CLYN 225 | Elko | Nevada |
| 399 | NMC679685 | CLYN 227 | Elko | Nevada |
| 400 | NMC679687 | CLYN 229 | Elko | Nevada |
| 199 | P a g e |
|
Technical Report and Pre - Feasibility Study for the Hollister
Underground Mine | Title May 31, 2017 | Effective Date August 9, 2017 | Report Date |
| # | BLM Serial Number | Claim Name | County | State |
| 401 | NMC679688 | CLYN 230 | Elko | Nevada |
| 402 | NMC679690 | CLYN 232 | Elko | Nevada |
| 403 | NMC679692 | CLYN 234 | Elko | Nevada |
| 404 | NMC679693 | CLYN 235 | Elko | Nevada |
| 405 | NMC679694 | CLYN 236 | Elko | Nevada |
| 406 | NMC679695 | CLYN 237 | Elko | Nevada |
| 407 | NMC679696 | CLYN 238 | Elko | Nevada |
| 408 | NMC679697 | CLYN 239 | Elko | Nevada |
| 409 | NMC679698 | CLYN 240 | Elko | Nevada |
| 410 | NMC679699 | CLYN 241 | Elko | Nevada |
| 411 | NMC679700 | CLYN 242 | Elko | Nevada |
| 412 | NMC679701 | CLYN 243 | Elko | Nevada |
| 413 | NMC679702 | CLYN 244 | Elko | Nevada |
| 414 | NMC679703 | CLYN 245 | Elko | Nevada |
| 415 | NMC679704 | CLYN 246 | Elko | Nevada |
| 416 | NMC679705 | CLYN 247 | Elko | Nevada |
| 417 | NMC679706 | CLYN 248 | Elko | Nevada |
| 418 | NMC679707 | CLYN 249 | Elko | Nevada |
| 419 | NMC679708 | CLYN 250 | Elko | Nevada |
| 420 | NMC679709 | CLYN 251 | Elko | Nevada |
| 421 | NMC679710 | CLYN 252 | Elko | Nevada |
| 422 | NMC679711 | CLYN 253 | Elko | Nevada |
| 423 | NMC679712 | CLYN 254 | Elko | Nevada |
| 424 | NMC679713 | CLYN 255 | Elko | Nevada |
| 425 | NMC679714 | CLYN 256 | Elko | Nevada |
| 426 | NMC679715 | CLYN 257 | Elko | Nevada |
| 427 | NMC679716 | CLYN 258 | Elko | Nevada |
| 428 | NMC679717 | CLYN 259 | Elko | Nevada |
| 429 | NMC679718 | CLYN 260 | Elko | Nevada |
| 430 | NMC685077 | CLYN 261 | Elko | Nevada |
| 431 | NMC685130 | ROSIE 53A | Elko | Nevada |
| 432 | NMC685131 | ROSIE 54A | Elko | Nevada |
| 433 | NMC685132 | ROSIE 55A | Elko | Nevada |
| 434 | NMC685133 | ROSIE 56A | Elko | Nevada |
| 435 | NMC685134 | ROSIE 57A | Elko | Nevada |
| 436 | NMC685135 | ROSIE 58A | Elko | Nevada |
| 437 | NMC685136 | ROSIE 59A | Elko | Nevada |
| 438 | NMC685137 | ROSIE 60A | Elko | Nevada |
| 439 | NMC685138 | ROSIE 61A | Elko | Nevada |
| 440 | NMC685139 | ROSIE 62A | Elko | Nevada |
| 441 | NMC685140 | ROSIE 63A | Elko | Nevada |
| 442 | NMC685141 | ROSIE 64A | Elko | Nevada |
| 443 | NMC685142 | ROSIE 65A | Elko | Nevada |
| 444 | NMC685143 | ROSIE 66A | Elko | Nevada |
| 445 | NMC685144 | ROSIE 67A | Elko | Nevada |
| 200 | P a g e |
|
Technical Report and Pre - Feasibility Study for the Hollister
Underground Mine | Title May 31, 2017 | Effective Date August 9, 2017 | Report Date |
| # | BLM Serial Number | Claim Name | County | State |
| 446 | NMC750315 | BMA 31B | Elko | Nevada |
| 447 | NMC750316 | BMA 32B | Elko | Nevada |
| 448 | NMC750317 | BMA 33B | Elko | Nevada |
| 449 | NMC750318 | AAG 1A | Elko | Nevada |
| 450 | NMC750319 | AAG 2A | Elko | Nevada |
| 451 | NMC750320 | AAG 3A | Elko | Nevada |
| 452 | NMC750321 | AAG 4A | Elko | Nevada |
| 453 | NMC750322 | AAG 5A | Elko | Nevada |
| 454 | NMC750323 | AAG 6A | Elko | Nevada |
| 455 | NMC750324 | AAG 7A | Elko | Nevada |
| 456 | NMC750325 | AAG 8A | Elko | Nevada |
| 457 | NMC750326 | AAG 9A | Elko | Nevada |
| 458 | NMC750327 | AAG 10A | Elko | Nevada |
| 459 | NMC750328 | AAG 11A | Elko | Nevada |
| 460 | NMC750329 | AAG 12A | Elko | Nevada |
| 461 | NMC750330 | AAG 13A | Elko | Nevada |
| 462 | NMC750331 | AAG 14A | Elko | Nevada |
| 463 | NMC750332 | AAG 15A | Elko | Nevada |
| 464 | NMC750333 | AAG 16A | Elko | Nevada |
| 465 | NMC750334 | AAG 17A | Elko | Nevada |
| 466 | NMC750335 | AAG 18A | Elko | Nevada |
| 467 | NMC750336 | AAG 19A | Elko | Nevada |
| 468 | NMC750337 | AAG 20A | Elko | Nevada |
| 469 | NMC750338 | AAG 21A | Elko | Nevada |
| 470 | NMC750339 | AAG 22A | Elko | Nevada |
| 471 | NMC750340 | AAG 23A | Elko | Nevada |
| 472 | NMC750341 | AAG 24A | Elko | Nevada |
| 473 | NMC750342 | AAG 25A | Elko | Nevada |
| 474 | NMC750343 | AAG 26A | Elko | Nevada |
| 475 | NMC750344 | AAG 27A | Elko | Nevada |
| 476 | NMC750345 | AAG 28A | Elko | Nevada |
| 477 | NMC750346 | AAG 29A | Elko | Nevada |
| 478 | NMC750347 | AAG 30A | Elko | Nevada |
| 479 | NMC750348 | AAG 31A | Elko | Nevada |
| 480 | NMC750349 | AAG 32A | Elko | Nevada |
| 481 | NMC750350 | AAG 33A | Elko | Nevada |
| 482 | NMC750351 | AAG 34A | Elko | Nevada |
| 483 | NMC750352 | AAG 35A | Elko | Nevada |
| 484 | NMC750353 | AAG 36A | Elko | Nevada |
| 485 | NMC750354 | AAG 37A | Elko | Nevada |
| 486 | NMC750355 | AAG 38A | Elko | Nevada |
| 487 | NMC750356 | AAG 39A | Elko | Nevada |
| 488 | NMC750357 | AAG 40A | Elko | Nevada |
| 489 | NMC750358 | AAG 41A | Elko | Nevada |
| 490 | NMC750359 | AAG 43A | Elko | Nevada |
| 201 | P a g e |
|
Technical Report and Pre - Feasibility Study for the Hollister
Underground Mine | Title May 31, 2017 | Effective Date August 9, 2017 | Report Date |
| # | BLM Serial Number | Claim Name | County | State |
| 491 | NMC750360 | AAG 44A | Elko | Nevada |
| 492 | NMC750361 | AAG 45A | Elko | Nevada |
| 493 | NMC750362 | AAG 46A | Elko | Nevada |
| 494 | NMC750363 | AAG 47A | Elko | Nevada |
| 495 | NMC750364 | AAG 48A | Elko | Nevada |
| 496 | NMC750365 | AAG 49A | Elko | Nevada |
| 497 | NMC750366 | AAG 50A | Elko | Nevada |
| 498 | NMC750367 | AAG 51A | Elko | Nevada |
| 499 | NMC750368 | AAG 52A | Elko | Nevada |
| 500 | NMC750369 | AAG 53A | Elko | Nevada |
| 501 | NMC750370 | AAG 54A | Elko | Nevada |
| 502 | NMC750371 | AAG 55A | Elko | Nevada |
| 503 | NMC750372 | AAG 56A | Elko | Nevada |
| 504 | NMC750373 | AAG 57A | Elko | Nevada |
| 505 | NMC750374 | AAG 58A | Elko | Nevada |
| 506 | NMC750375 | AAG 59A | Elko | Nevada |
| 507 | NMC750376 | AAG 60A | Elko | Nevada |
| 508 | NMC750377 | AAG 61A | Elko | Nevada |
| 509 | NMC750378 | AAG 62A | Elko | Nevada |
| 510 | NMC750379 | AAG 63A | Elko | Nevada |
| 511 | NMC750380 | AAG 64A | Elko | Nevada |
| 512 | NMC750381 | AAG 65A | Elko | Nevada |
| 513 | NMC750382 | AAG 66A | Elko | Nevada |
| 514 | NMC750383 | AAG 67A | Elko | Nevada |
| 515 | NMC750384 | AAG 68A | Elko | Nevada |
| 516 | NMC750385 | AAG 69A | Elko | Nevada |
| 517 | NMC750386 | AAG 70A | Elko | Nevada |
| 518 | NMC750387 | AAG 71A | Elko | Nevada |
| 519 | NMC750388 | AAG 72A | Elko | Nevada |
| 520 | NMC750389 | AAG 73A | Elko | Nevada |
| 521 | NMC750390 | AAG 74A | Elko | Nevada |
| 522 | NMC750391 | AAG 75A | Elko | Nevada |
| 523 | NMC750392 | AAG 76A | Elko | Nevada |
| 524 | NMC750393 | AAG 77A | Elko | Nevada |
| 525 | NMC750394 | AAG 78A | Elko | Nevada |
| 526 | NMC750395 | AAG 79A | Elko | Nevada |
| 527 | NMC750396 | AAG 80A | Elko | Nevada |
| 528 | NMC750397 | AAG 81A | Elko | Nevada |
| 529 | NMC750398 | AAG 82A | Elko | Nevada |
| 530 | NMC750399 | AAG 83A | Elko | Nevada |
| 531 | NMC750400 | AAG 84A | Elko | Nevada |
| 532 | NMC750401 | AAG 85A | Elko | Nevada |
| 533 | NMC750402 | AAG 86A | Elko | Nevada |
| 534 | NMC750403 | AAG 87A | Elko | Nevada |
| 535 | NMC750404 | AAG 88A | Elko | Nevada |
| 202 | P a g e |
|
Technical Report and Pre - Feasibility Study for the Hollister
Underground Mine | Title May 31, 2017 | Effective Date August 9, 2017 | Report Date |
| # | BLM Serial Number | Claim Name | County | State |
| 536 | NMC750405 | AAG 89A | Elko | Nevada |
| 537 | NMC750406 | AAG 90A | Elko | Nevada |
| 538 | NMC750407 | AAG 91A | Elko | Nevada |
| 539 | NMC750408 | AAG 92A | Elko | Nevada |
| 540 | NMC750409 | AAG 93A | Elko | Nevada |
| 541 | NMC750410 | AAG 94A | Elko | Nevada |
| 542 | NMC750411 | AAG 95A | Elko | Nevada |
| 543 | NMC750412 | AAG 96A | Elko | Nevada |
| 544 | NMC750413 | AAG 97A | Elko | Nevada |
| 545 | NMC750414 | AAG 98A | Elko | Nevada |
| 546 | NMC750415 | AAG 99A | Elko | Nevada |
| 547 | NMC750416 | AAG 100A | Elko | Nevada |
| 548 | NMC750417 | AAG 101A | Elko | Nevada |
| 549 | NMC750418 | AAG 102A | Elko | Nevada |
| 550 | NMC750419 | AAG 103A | Elko | Nevada |
| 551 | NMC750420 | AAG 104A | Elko | Nevada |
| 552 | NMC750421 | AAG 105A | Elko | Nevada |
| 553 | NMC750422 | AAG 106A | Elko | Nevada |
| 554 | NMC750423 | AAG 107A | Elko | Nevada |
| 555 | NMC788817 | HO 1 | Elko | Nevada |
| 556 | NMC788818 | HO 2 | Elko | Nevada |
| 557 | NMC788819 | HO 3 | Elko | Nevada |
| 558 | NMC788820 | HO 4 | Elko | Nevada |
| 559 | NMC788821 | HO 5 | Elko | Nevada |
| 560 | NMC788822 | HO 6 | Elko | Nevada |
| 561 | NMC788823 | HO 7 | Elko | Nevada |
| 562 | NMC788824 | HO 8 | Elko | Nevada |
| 563 | NMC788825 | HO 9 | Elko | Nevada |
| 564 | NMC788826 | HO 10 | Elko | Nevada |
| 565 | NMC788827 | HO 11 | Elko | Nevada |
| 566 | NMC788828 | HO 12 | Elko | Nevada |
| 567 | NMC788829 | HO 13 | Elko | Nevada |
| 568 | NMC788830 | HO 14 | Elko | Nevada |
| 569 | NMC788831 | HO 15 | Elko | Nevada |
| 570 | NMC788832 | HO 16 | Elko | Nevada |
| 571 | NMC788833 | HO 17 | Elko | Nevada |
| 572 | NMC788834 | HO 18 | Elko | Nevada |
| 573 | NMC788835 | HO 19 | Elko | Nevada |
| 574 | NMC788836 | HO 20 | Elko | Nevada |
| 575 | NMC788837 | HO 21 | Elko | Nevada |
| 576 | NMC788838 | HO 22 | Elko | Nevada |
| 577 | NMC788839 | HO 23 | Elko | Nevada |
| 578 | NMC788840 | HO 24 | Elko | Nevada |
| 579 | NMC788841 | HO 25 | Elko | Nevada |
| 580 | NMC788842 | HO 26 | Elko | Nevada |
| 203 | P a g e |
|
Technical Report and Pre - Feasibility Study for the Hollister
Underground Mine | Title May 31, 2017 | Effective Date August 9, 2017 | Report Date |
| # | BLM Serial Number | Claim Name | County | State |
| 581 | NMC788843 | HO 27 | Elko | Nevada |
| 582 | NMC788844 | HO 28 | Elko | Nevada |
| 583 | NMC788845 | HO 29 | Elko | Nevada |
| 584 | NMC788846 | HO 30 | Elko | Nevada |
| 585 | NMC788847 | HO 31 | Elko | Nevada |
| 586 | NMC788848 | HO 32 | Elko | Nevada |
| 587 | NMC788849 | HO 33 | Elko | Nevada |
| 588 | NMC788850 | HO 34 | Elko | Nevada |
| 589 | NMC788851 | HO 35 | Elko | Nevada |
| 590 | NMC788852 | HO 36 | Elko | Nevada |
| 591 | NMC788853 | HO 37 | Elko | Nevada |
| 592 | NMC788854 | HO 38 | Elko | Nevada |
| 593 | NMC788855 | HO 39 | Elko | Nevada |
| 594 | NMC788856 | HO 40 | Elko | Nevada |
| 595 | NMC788857 | HO 41 | Elko | Nevada |
| 596 | NMC788858 | HO 42 | Elko | Nevada |
| 597 | NMC788859 | HO 43 | Elko | Nevada |
| 598 | NMC788860 | HO 44 | Elko | Nevada |
| 599 | NMC788861 | HO 45 | Elko | Nevada |
| 600 | NMC788862 | HO 46 | Elko | Nevada |
| 601 | NMC788863 | HO 47 | Elko | Nevada |
| 602 | NMC788864 | HO 48 | Elko | Nevada |
| 603 | NMC788865 | HO 49 | Elko | Nevada |
| 604 | NMC788866 | HO 50 | Elko | Nevada |
| 605 | NMC788867 | HO 51 | Elko | Nevada |
| 606 | NMC788868 | HO 52 | Elko | Nevada |
| 607 | NMC788869 | HO 53 | Elko | Nevada |
| 608 | NMC788870 | HO 54 | Elko | Nevada |
| 609 | NMC788871 | HO 55 | Elko | Nevada |
| 610 | NMC788872 | HO 56 | Elko | Nevada |
| 611 | NMC788873 | HO 57 | Elko | Nevada |
| 612 | NMC788874 | HO 58 | Elko | Nevada |
| 613 | NMC788875 | HO 59 | Elko | Nevada |
| 614 | NMC788876 | HO 60 | Elko | Nevada |
| 615 | NMC788877 | HO 61 | Elko | Nevada |
| 616 | NMC788878 | HO 62 | Elko | Nevada |
| 617 | NMC788879 | HO 63 | Elko | Nevada |
| 618 | NMC788880 | HO 64 | Elko | Nevada |
| 619 | NMC788881 | HO 65 | Elko | Nevada |
| 620 | NMC788882 | HO 66 | Elko | Nevada |
| 621 | NMC788883 | HO 67 | Elko | Nevada |
| 622 | NMC788884 | HO 68 | Elko | Nevada |
| 623 | NMC788885 | HO 69 | Elko | Nevada |
| 624 | NMC788886 | HO 70 | Elko | Nevada |
| 625 | NMC788887 | HO 71 | Elko | Nevada |
| 204 | P a g e |
|
Technical Report and Pre - Feasibility Study for the Hollister
Underground Mine | Title May 31, 2017 | Effective Date August 9, 2017 | Report Date |
| # | BLM Serial Number | Claim Name | County | State |
| 626 | NMC788888 | HO 72 | Elko | Nevada |
| 627 | NMC788889 | HO 73 | Elko | Nevada |
| 628 | NMC788890 | HO 74 | Elko | Nevada |
| 629 | NMC788891 | HO 75 | Elko | Nevada |
| 630 | NMC788892 | HO 76 | Elko | Nevada |
| 631 | NMC788893 | HO 77 | Elko | Nevada |
| 632 | NMC788894 | HO 78 | Elko | Nevada |
| 633 | NMC788895 | HO 79 | Elko | Nevada |
| 634 | NMC788896 | HO 80 | Elko | Nevada |
| 635 | NMC788897 | HO 81 | Elko | Nevada |
| 636 | NMC788898 | HO 82 | Elko | Nevada |
| 637 | NMC788899 | HO 83 | Elko | Nevada |
| 638 | NMC788900 | HO 84 | Elko | Nevada |
| 639 | NMC788901 | HO 85 | Elko | Nevada |
| 640 | NMC788902 | HO 86 | Elko | Nevada |
| 641 | NMC788903 | HO 87 | Elko | Nevada |
| 642 | NMC788904 | HO 88 | Elko | Nevada |
| 643 | NMC788905 | HO 89 | Elko | Nevada |
| 644 | NMC788906 | HO 90 | Elko | Nevada |
| 645 | NMC788907 | HO 91 | Elko | Nevada |
| 646 | NMC788908 | HO 92 | Elko | Nevada |
| 647 | NMC788909 | HO 93 | Elko | Nevada |
| 648 | NMC788910 | HO 94 | Elko | Nevada |
| 649 | NMC788911 | HO 95 | Elko | Nevada |
| 650 | NMC788912 | HO 96 | Elko | Nevada |
| 651 | NMC788913 | HO 97 | Elko | Nevada |
| 652 | NMC788914 | HO 98 | Elko | Nevada |
| 653 | NMC788915 | HO 99 | Elko | Nevada |
| 654 | NMC788916 | HO 100 | Elko | Nevada |
| 655 | NMC788917 | HO 101 | Elko | Nevada |
| 656 | NMC788918 | HO 102 | Elko | Nevada |
| 657 | NMC788919 | HO 103 | Elko | Nevada |
| 658 | NMC788920 | HO 104 | Elko | Nevada |
| 659 | NMC788921 | HO 105 | Elko | Nevada |
| 660 | NMC788922 | HO 106 | Elko | Nevada |
| 661 | NMC788923 | HO 107 | Elko | Nevada |
| 662 | NMC788924 | HO 108 | Elko | Nevada |
| 663 | NMC788925 | HO 109 | Elko | Nevada |
| 664 | NMC788926 | HO 110 | Elko | Nevada |
| 665 | NMC788927 | HO 111 | Elko | Nevada |
| 666 | NMC788928 | HO 112 | Elko | Nevada |
| 667 | NMC788929 | HO 113 | Elko | Nevada |
| 668 | NMC788930 | HO 114 | Elko | Nevada |
| 669 | NMC788931 | HO 115 | Elko | Nevada |
| 670 | NMC788932 | HO 116 | Elko | Nevada |
| 205 | P a g e |
|
Technical Report and Pre - Feasibility Study for the Hollister
Underground Mine | Title May 31, 2017 | Effective Date August 9, 2017 | Report Date |
| # | BLM Serial Number | Claim Name | County | State |
| 671 | NMC788933 | HO 117 | Elko | Nevada |
| 672 | NMC788934 | HO 118 | Elko | Nevada |
| 673 | NMC788935 | HO 119 | Elko | Nevada |
| 674 | NMC788936 | HO 120 | Elko | Nevada |
| 675 | NMC788937 | HO 121 | Elko | Nevada |
| 676 | NMC788938 | HO 122 | Elko | Nevada |
| 677 | NMC788939 | HO 123 | Elko | Nevada |
| 678 | NMC788940 | HO 124 | Elko | Nevada |
| 679 | NMC788941 | HO 125 | Elko | Nevada |
| 680 | NMC788942 | HO 126 | Elko | Nevada |
| 681 | NMC788943 | HO 127 | Elko | Nevada |
| 682 | NMC788944 | HO 128 | Elko | Nevada |
| 683 | NMC788945 | HO 129 | Elko | Nevada |
| 684 | NMC788946 | HO 130 | Elko | Nevada |
| 685 | NMC788947 | HO 131 | Elko | Nevada |
| 686 | NMC788948 | HO 132 | Elko | Nevada |
| 687 | NMC790311 | HO 133 | Elko | Nevada |
| 688 | NMC790312 | HO 134 | Elko | Nevada |
| 689 | NMC790313 | HO 135 | Elko | Nevada |
| 690 | NMC790314 | HO 136 | Elko | Nevada |
| 691 | NMC790315 | HO 137 | Elko | Nevada |
| 692 | NMC790316 | HO 138 | Elko | Nevada |
| 693 | NMC790317 | HO 139 | Elko | Nevada |
| 694 | NMC796330 | SC1 | Elko | Nevada |
| 695 | NMC796331 | SC2 | Elko | Nevada |
| 696 | NMC796332 | SC3 | Elko | Nevada |
| 697 | NMC796333 | SC4 | Elko | Nevada |
| 698 | NMC796334 | SC5 | Elko | Nevada |
| 699 | NMC796335 | SC6 | Elko | Nevada |
| 700 | NMC796336 | SC7 | Elko | Nevada |
| 701 | NMC796337 | SC8 | Elko | Nevada |
| 702 | NMC796338 | SC9 | Elko | Nevada |
| 703 | NMC796339 | SC10 | Elko | Nevada |
| 704 | NMC796340 | SC11 | Elko | Nevada |
| 705 | NMC796341 | SC12 | Elko | Nevada |
| 706 | NMC796342 | SC13 | Elko | Nevada |
| 707 | NMC796343 | SC14 | Elko | Nevada |
| 708 | NMC796344 | SC15 | Elko | Nevada |
| 709 | NMC796345 | SC16 | Elko | Nevada |
| 710 | NMC796346 | SC17 | Elko | Nevada |
| 711 | NMC796347 | SC18 | Elko | Nevada |
| 712 | NMC796348 | SC19 | Elko | Nevada |
| 713 | NMC796349 | SC20 | Elko | Nevada |
| 714 | NMC796350 | SC21 | Elko | Nevada |
| 715 | NMC796351 | SC22 | Elko | Nevada |
| 206 | P a g e |
|
Technical Report and Pre - Feasibility Study for the Hollister
Underground Mine | Title May 31, 2017 | Effective Date August 9, 2017 | Report Date |
| # | BLM Serial Number | Claim Name | County | State |
| 716 | NMC796352 | SC23 | Elko | Nevada |
| 717 | NMC796353 | SC24 | Elko | Nevada |
| 718 | NMC796354 | SC25 | Elko | Nevada |
| 719 | NMC796355 | SC26 | Elko | Nevada |
| 720 | NMC796356 | SC27 | Elko | Nevada |
| 721 | NMC796357 | SC28 | Elko | Nevada |
| 722 | NMC796358 | SC29 | Elko | Nevada |
| 723 | NMC796359 | SC30 | Elko | Nevada |
| 724 | NMC796360 | SC31 | Elko | Nevada |
| 725 | NMC796361 | SC32 | Elko | Nevada |
| 726 | NMC796362 | SC33 | Elko | Nevada |
| 727 | NMC796363 | SC34 | Elko | Nevada |
| 728 | NMC796364 | SC35 | Elko | Nevada |
| 729 | NMC796365 | SC36 | Elko | Nevada |
| 730 | NMC796366 | SC37 | Elko | Nevada |
| 731 | NMC796367 | SC38 | Elko | Nevada |
| 732 | NMC796368 | SC39 | Elko | Nevada |
| 733 | NMC796369 | SC40 | Elko | Nevada |
| 734 | NMC796370 | SC41 | Elko | Nevada |
| 735 | NMC796371 | SC42 | Elko | Nevada |
| 736 | NMC796372 | SC43 | Elko | Nevada |
| 737 | NMC796373 | SC44 | Elko | Nevada |
| 738 | NMC796374 | SC45 | Elko | Nevada |
| 739 | NMC796375 | SC46 | Elko | Nevada |
| 740 | NMC796376 | SC47 | Elko | Nevada |
| 741 | NMC796377 | SC48 | Elko | Nevada |
| 742 | NMC796378 | SC49 | Elko | Nevada |
| 743 | NMC796379 | SC50 | Elko | Nevada |
| 744 | NMC796380 | SC51 | Elko | Nevada |
| 745 | NMC796381 | SC52 | Elko | Nevada |
| 746 | NMC796382 | SC53 | Elko | Nevada |
| 747 | NMC796383 | SC54 | Elko | Nevada |
| 748 | NMC796384 | SC55 | Elko | Nevada |
| 749 | NMC796385 | SC56 | Elko | Nevada |
| 750 | NMC796386 | SC57 | Elko | Nevada |
| 751 | NMC796387 | SC58 | Elko | Nevada |
| 752 | NMC796388 | SC59 | Elko | Nevada |
| 753 | NMC796389 | SC60 | Elko | Nevada |
| 754 | NMC796390 | SC61 | Elko | Nevada |
| 755 | NMC796391 | SC62 | Elko | Nevada |
| 756 | NMC796392 | SC63 | Elko | Nevada |
| 757 | NMC796393 | SC64 | Elko | Nevada |
| 758 | NMC796394 | SC65 | Elko | Nevada |
| 759 | NMC843122 | CLYN 231A | Elko | Nevada |
| 760 | NMC843123 | CLYN 233A | Elko | Nevada |
| 207 | P a g e |
|
Technical Report and Pre - Feasibility Study for the Hollister
Underground Mine | Title May 31, 2017 | Effective Date August 9, 2017 | Report Date |
| # | BLM Serial Number | Claim Name | County | State |
| 761 | NMC853444 | RIB 1 | Elko | Nevada |
| 762 | NMC853445 | RIB 2 | Elko | Nevada |
| 763 | NMC853446 | RIB 3 | Elko | Nevada |
| 764 | NMC853447 | RIB 4 | Elko | Nevada |
| 765 | NMC853448 | RIB 5 | Elko | Nevada |
| 766 | NMC853449 | RIB 6 | Elko | Nevada |
| 767 | NMC853450 | RIB 7 | Elko | Nevada |
| 768 | NMC853451 | RIB 8 | Elko | Nevada |
| 769 | NMC853452 | RIB 9 | Elko | Nevada |
| 770 | NMC853453 | RIB 10 | Elko | Nevada |
| 771 | NMC853454 | RIB 11 | Elko | Nevada |
| 772 | NMC853455 | RIB 12 | Elko | Nevada |
| 773 | NMC853456 | RIB 13 | Elko | Nevada |
| 774 | NMC858756 | MS 1 | Elko | Nevada |
| 775 | NMC858757 | MS 2 | Elko | Nevada |
| 776 | NMC858758 | MS 3 | Elko | Nevada |
| 777 | NMC858759 | MS 4 | Elko | Nevada |
| 778 | NMC858760 | MS 5 | Elko | Nevada |
| 779 | NMC858761 | MS 6 | Elko | Nevada |
| 780 | NMC858762 | MS 7 | Elko | Nevada |
| 781 | NMC858763 | MS 8 | Elko | Nevada |
| 782 | NMC870750 | JO 1 | Elko | Nevada |
| 783 | NMC870751 | JO 2 | Elko | Nevada |
| 784 | NMC870752 | JO 3 | Elko | Nevada |
| 785 | NMC870753 | JO 4 | Elko | Nevada |
| 786 | NMC870754 | JO 5 | Elko | Nevada |
| 787 | NMC870755 | JO 6 | Elko | Nevada |
| 788 | NMC870756 | JO 7 | Elko | Nevada |
| 789 | NMC870757 | JO 8 | Elko | Nevada |
| 790 | NMC870758 | JO 9 | Elko | Nevada |
| 791 | NMC870759 | JO 10 | Elko | Nevada |
| 792 | NMC870760 | JO 11 | Elko | Nevada |
| 793 | NMC870761 | JO 12 | Elko | Nevada |
| 794 | NMC870762 | JO 13 | Elko | Nevada |
| 795 | NMC87306 | OLD TIMERS # 5 | Elko | Nevada |
| 796 | NMC87307 | OLD TIMERS # 6 | Elko | Nevada |
| 797 | NMC87308 | OLD TIMERS # 7 | Elko | Nevada |
| 798 | NMC87309 | OLD TIMERS # 8 | Elko | Nevada |
| 799 | NMC87310 | OLD TIMERS # 9 | Elko | Nevada |
| 800 | NMC87311 | JIGGS # 1 | Elko | Nevada |
| 801 | NMC87312 | JIGGS # 2 | Elko | Nevada |
| 802 | NMC87313 | JIGGS # 3 | Elko | Nevada |
| 803 | NMC87314 | JIGGS # 4 | Elko | Nevada |
| 804 | NMC87315 | JIGGS # 5 | Elko | Nevada |
| 805 | NMC879655 | HMS 1 | Elko | Nevada |
| 208 | P a g e |
|
Technical Report and Pre - Feasibility Study for the Hollister
Underground Mine | Title May 31, 2017 | Effective Date August 9, 2017 | Report Date |
| # | BLM Serial Number | Claim Name | County | State |
| 806 | NMC879656 | HMS 2 | Elko | Nevada |
| 807 | NMC879657 | HMS 3 | Elko | Nevada |
| 209 | P a g e |
|
Technical Report and Pre - Feasibility Study for the Hollister
Underground Mine | Title May 31, 2017 | Effective Date August 9, 2017 | Report Date |
| Appendix C – Certification of Authors and Consent Forms |
| 210 | P a g e |
|
Technical Report and Pre - Feasibility Study for the Hollister
Underground Mine | Title May 31, 2017 | Effective Date August 9, 2017 | Report Date |
CERTIFICATE of QUALIFIED PERSON
Re: Technical Report and Pre-Feasibility Study for the Hollister Underground Mine, dated the 9th day of August, with an effective date of May 31, 2017 (the "Technical Report"):
I, Brian W. Morris, CPG, do hereby certify that:
| As of August 9, 2017, I am Senior Vice President, Exploration at: |
| Klondex Mines Ltd. |
| 6110 Plumas Street Suite A |
| Reno, Nevada 89519 |
| 775-284-5757 |
1) I am a Certified Professional Geologist (#11786) by the American Institute of Professional Geologists.
2) I graduated from California State University Humboldt with a Bachelor of Arts Degree in Geology in 1990.
3) I have over 28 years of experience in the mining industry. My previous experience encompasses senior positions in geology, exploration and underground production for several North American companies and their subsidiaries, including Hecla, Barrick and Newmont. My tenure at the Midas Mine was from 2002 — 2007 and was involved in district exploration, underground near mine resource expansion and production. At Hollister, I was Chief Geologist until being promoted to VP of Geology and Business Development. Most recently, I served as President of American Mining and Tunneling until joining Klondex in January 2015 as Senior Vice President Exploration. I have extensive experience in both epithermal vein systems and Carlin style deposits, and have a substantial understanding of Klondex’s three existing underground operations in Nevada as well as the Manitoba, Canada operation.
4) I have read the definition of "qualified person" set out in National Instrument 43-101 ("NI 43-101") and certify that by reason of my experience and qualifications and good standing with proper designation within a recognized professional organization, I fully meet the criteria as a Qualified Person as defined under NI 43-101.
5) I am responsible for preparation of the following sections of the Technical Report: Summary, Introduction, Reliance on Other Experts, Mineral Resource, Market Studies and Contracts, Environmental Studies, Permitting and Social or Community Impacts, Interpretations and Conclusions, Recommendations and References.
6) I am not independent of the Issuer within the meaning of Section 1.5 of NI 43-101.
7) I have read NI 43-101 and Form 43-101F1, and the sections of the Technical Report for which I am responsible have been prepared in accordance with that instrument and form.
8) I consent to the filing of the Technical Report with any stock exchange and other regulatory authority and any publication by them for regulatory purposes, including electronic publication in the public company files on their websites accessible by the public, of the Technical Report.
| 211 | P a g e |
|
Technical Report and Pre - Feasibility Study for the Hollister
Underground Mine | Title May 31, 2017 | Effective Date August 9, 2017 | Report Date |
9) As at the effective date of the Technical Report, to the best of my knowledge, information and belief, the Technical Report contains all the scientific and technical information that is required to be disclosed to make the Technical Report not misleading.
10) I last visited the Hollister Mine on July 18, 2017
Dated this 9th day of August, 2017.
| “Signed” Brian W. Morris |
| Brian W. Morris, CPG |
| Klondex Mines Ltd. |
| bmorris@klondexmines.com |
| 212 | P a g e |
|
Technical Report and Pre - Feasibility Study for the Hollister
Underground Mine | Title May 31, 2017 | Effective Date August 9, 2017 | Report Date |
CERTIFICATE of QUALIFIED PERSON
Re: Technical Report and Pre-Feasibility Study for the Hollister Underground Mine, dated the 9th day of August, with an effective date of May 31, 2017 (the "Technical Report"):
I, John C. Rust, SME, do hereby certify that:
| As of August 9, 2017, I am Directory of Metallurgy at: | |
| Klondex Mines Ltd. | |
| 6110 Plumas Street Suite A | |
| Reno, Nevada 89519 | |
| 775-284-5757 |
1) I am registered member of SME, number 02796650
2) I am a graduate of the South Dakota School of Mines and Technology in 1984 with a Bachelor of Science degree in Metallurgical Engineering.
3) I have worked as a metallurgical engineer for a total of 27 years since my graduation. My relevant experience for the purpose of the Technical Report is:
| • | Various operational and technical positions with operating mining companies. | |
| • | Served as a consultant in the evaluation of mineral processing facilities. | |
| • | Completed feasibility studies of gold processing facilities. | |
| • | Process engineer for detailed design of a gold processing plants. |
4) I have read the definition of "qualified person" set out in National Instrument 43-101 ("NI43-101") and certify that by reason of my education, affiliation with a professional association (as defined in NI43-101) and past relevant work experience, I fulfill the requirements to be a "qualified person" for the purposes of NI43-101.
5) I am responsible for preparation of the following sections of the Technical Report: Summary, Introduction, Reliance on Other Experts, Mineral Processing and Metallurgical Testing, Recovery Methods, and References.
6) I am not independent of the Issuer applying the test set out in Section 1.4 of National Instrument 43-101.
7) I have read National Instrument 43-101, and the portions of the Technical Report I am responsible for have been prepared in compliance with National Instrument 43-101 and Form 43-101F1.
8) I consent to the filing of the Technical Report with any stock exchange and other regulatory authority and any publication by them for regulatory purposes, including electronic publication in the public company files on their websites accessible by the public, of the Technical Report.
| 213 | P a g e |
|
Technical Report and Pre - Feasibility Study for the Hollister
Underground Mine | Title May 31, 2017 | Effective Date August 9, 2017 | Report Date |
9) As at the effective date of the Technical Report, to the best of my knowledge, information and belief, the Technical Report contains all the scientific and technical information that is required to be disclosed to make the Technical Report not misleading.
10) I last visited the Hollister Mine on June 5, 2017.
Dated this 9th day of August, 2017.
| “Signed” John C. Rust | |
| John C. Rust, SME | |
| Klondex Mines Ltd. | |
| jrust@klondexmines.com |
| 214 | P a g e |
|
Technical Report and Pre - Feasibility Study for the Hollister
Underground Mine | Title May 31, 2017 | Effective Date August 9, 2017 | Report Date |
CERTIFICATE of QUALIFIED PERSON
Re: Technical Report and Pre-Feasibility Study on the Hollister Underground Mine dated the 9th day of August, with an effective date of May 31, 2017 (the "Technical Report"):
I, Robert E. Thomason, SME, do hereby certify that:
| As of August 9, 2017, I am a Senior Corporate Geologist at: |
| Klondex Mines Ltd. |
| 4000 West Winnemucca Blvd. |
| Winnemucca, Nevada 89445 |
| 775-621-5348 |
1) I am a Registered Member (#4224163) of the Society for Mining, Metallurgy and Exploration (SME) and am a Licensed Geologist in the State of Washington (#1880).
2) I graduated from California State University Chico with a Bachelor of Arts Degree in Geology in 1977 and received a M.Sc., in Economic Geology from Oregon State University in 1983.
3) I have over 38 years’ experience in the mining industry including: mineral exploration, mine development, reserve estimation, economic evaluation and modeling. This includes extensive experience in Nevada where the Hollister Mine is located. From August 2016 to date I have been the Hollister Exploration Manager for Klondex Mines, by extension, I has conducted personal inspections of the Property on a number of occasions. Previously I held a similar position from April 2008 to August 2011 for Great Basin Gold. I have directed and facilitated exploration on the Project including; technical advisement, budgeting, contract negotiations and designed and implemented drilling programs to define mineralization in project area.
4) I have read the definition of "qualified person" set out in National Instrument 43-101 ("NI 43-101") and certify that by reason of my experience and qualifications and good standing with proper designation within a recognized professional organization, I fully meet the criteria as a Qualified Person as defined under NI 43-101.
5) I am responsible for preparation of the following sections of the Technical Report: Summary, Introduction, Reliance on Other Experts, Property Description and Location, Accessibility, Climate, Local Resources, Infrastructure and Physiography, History, Geological Setting and Mineralization, Deposit Types, Exploration, Drilling, Sample Preparation, Analyses and Security, Data Verification, Adjacent Properties, Other Relevant Data and Information and References.
6) I am not independent of the Issuer within the meaning of Section 1.5 of NI 43-101.
7) I have read NI 43-101 and Form 43-101F1, and the sections of the Technical Report for which I am responsible have been prepared in accordance with that instrument and form.
8) I consent to the filing of the Technical Report with any stock exchange and other regulatory authority and any publication by them for regulatory purposes, including electronic publication in the public company files on their websites accessible by the public, of the Technical Report.
| 215 | P a g e |
|
Technical Report and Pre - Feasibility Study for the Hollister
Underground Mine | Title May 31, 2017 | Effective Date August 9, 2017 | Report Date |
9) As at the effective date of the Technical Report, to the best of my knowledge, information and belief, the Technical Report contains all the scientific and technical information that is required to be disclosed to make the Technical Report not misleading.
10) I last visited the Hollister Mine on July 21, 2017.
Dated this 9th day of August, 2017.
| “Signed” Robert E. Thomason |
| Robert E. Thomason, SME |
| Klondex Mines Ltd. |
| rthomason@klondexmines.com |
| 216 | P a g e |
|
Technical Report and Pre - Feasibility Study for the Hollister
Underground Mine | Title May 31, 2017 | Effective Date August 9, 2017 | Report Date |
 |
 |
CERTIFICATE OF AUTHOR
Re: Technical Report and Pre-Feasibility Study on the Hollister Underground Mine, dated the 9th day of August 2017, with an effective date of May 31, 2017 (the "Technical Report"):
I, Sarah M Bull, P.E., do hereby certify that:
As of August 9, 2017, I am a consulting mining engineer at:
| Practical Mining LLC | |
| 495 Idaho Street, Suite 205 | |
| Elko, Nevada 89801 | |
| 775-345-3718 |
| 1) | I am a Registered Professional Mining Engineer in the State of Nevada (# 22797). |
|
| 2) | I am a graduate of The University of Alaska Fairbanks, Fairbanks, Alaska with a Bachelor of Science Degree in Mining Engineering in 2006. |
|
| 3) | Since my graduation from university I have been employed as a Mine Engineer at an underground gold mining operation and as Senior Mine Engineer for a consulting engineering firm. My responsibilities have included mine ventilation engineering, stope design and mine planning. |
|
| 4) | I have read the definition of "qualified person" set out in National Instrument 43-101 ("NI 43-101") and certify that by reason of my experience and qualifications and good standing with proper designation within a recognized professional organization I fully meet the criteria as a Qualified Person as defined under NI 43-101. |
|
| 5) | I am a contract consulting engineer for the issuer and project owner: Klondex Mines Ltd. |
|
| 6) | I am responsible for preparation of section 15 and 16, along with those parts of sections 1-2 and 27 pertaining thereto of this Technical Report. |
|
| 7) | I last visited the Hollister Mine on July 7, 2017. |
|
| 8) | I am independent of Klondex Mines Ltd. within the meaning of Section 1.5 of NI 43-101. |
|
| 9) | I was paid a daily rate for consulting services performed in evaluation of the Hollister Mine for the Issuer and do not have any other interests relating to the Hollister Mine. I do not have any interest in adjoining properties in the Hollister area. |
| 217 | P a g e |
|
Technical Report and Pre - Feasibility Study for the Hollister
Underground Mine | Title May 31, 2017 | Effective Date August 9, 2017 | Report Date |
| 10) | I have read NI 43-101 and Form 43-101F1, and the sections of the Technical Report for which I am responsible have been prepared in accordance with that instrument and form. |
|
| 11) | I consent to the filing of the Technical Report with any stock exchange and other regulatory authority and any publication by them for regulatory purposes, including electronic publication in the public company files on their websites accessible by the public, of the Technical Report. |
|
| 12) | As at the effective date of the Technical Report, to the best of my knowledge, information and belief, the Technical Report contains all the scientific and technical information that is required to be disclosed to make the Technical Report not misleading. |
Dated this 9th day of August, 2017.
| “Signed” Sarah Bull |
| Sarah M Bull, P.E. |
| Practical Mining LLC |
| 495 Idaho Street, Suite 205 |
| Elko, Nevada 89801 |
| 775-304-5836 |
| sarahbull@practicalmining.com |
| 218 | P a g e |
|
Technical Report and Pre - Feasibility Study for the Hollister
Underground Mine | Title May 31, 2017 | Effective Date August 9, 2017 | Report Date |
|
|
CERTIFICATE of QUALIFIED PERSON
Re: Technical Report and Pre-Feasibility Study on the Hollister Underground Mine dated the 9th day of August 2017, with an effective date of May 31, 2017 (the "Technical Report"):
I, Mark A. Odell, P.E., do hereby certify that:
| As of August 9, 2017, I am a consulting mining engineer at: | |
| Practical Mining LLC | |
| 495 Idaho Street, Suite 205 | |
| Elko, Nevada 89801 | |
| 775-345-3718 |
| 1) | I am a Registered Professional Mining Engineer in the State of Nevada (# 13708), and a Registered Member (#2402150) of the Society for Mining, Metallurgy and Exploration (SME). |
|
| 2) | I graduated from The Colorado School of Mines, Golden, Colorado with a Bachelor of Science Degree in Mining Engineering in 1985. I have practiced my profession continuously since 1985. |
|
| 3) | Since 1985, I have held the positions of mine engineer, chief engineer, mine superintendent, technical services manager and mine manager at underground and surface metal and coal mines in the western United States. The past 12 years, I have worked as a self-employed mining consultant with clients located in North America, Asia and Africa. My responsibilities have included the preparation of detailed mine plans, geotechnical engineering, reserve and resource estimation, preparation of capital and operating budgets and the economic evaluation of mineral deposits. |
|
| 4) | I have read the definition of "qualified person" set out in National Instrument 43-101 ("NI 43-101") and certify that by reason of my experience and qualifications and good standing with proper designation within a recognized professional organization, I fully meet the criteria as a Qualified Person as defined under NI 43-101. |
|
| 5) | I am a contract consulting engineer for the issuer and project owner, Klondex Mines Ltd. (the "Issuer"). I last visited the Hollister Mine on July 7, 2017. |
|
| 6) | I am responsible for sections 15-16, 18, 21 and 22 along with those parts of sections 1-3, and 27 pertaining thereto of this Technical Report. |
|
| 7) | I am independent of the Issuer within the meaning of Section 1.5 of NI 43-101. |
|
| 8) | I was paid a daily rate for consulting services performed in evaluation of the Hollister Mine for the Issuer and do not have any other interests relating to the Hollister Mine. I do not have any interest in adjoining properties in the Hollister area. |
| 219 | P a g e |
|
Technical Report and Pre - Feasibility Study for the Hollister
Underground Mine | Title May 31, 2017 | Effective Date August 9, 2017 | Report Date |
| 9) | I have read NI 43-101 and Form 43-101F1, and the sections of the Technical Report for which I am responsible have been prepared in accordance with that instrument and form. |
|
| 10) | I consent to the filing of the Technical Report with any stock exchange and other regulatory authority and any publication by them for regulatory purposes, including electronic publication in the public company files on their websites accessible by the public, of the Technical Report. |
|
| 11) | As at the effective date of the Technical Report, to the best of my knowledge, information and belief, the Technical Report contains all the scientific and technical information that is required to be disclosed to make the Technical Report not misleading. |
Dated this 9th day of August, 2017.
| “Signed” Mark A. Odell |
| Mark A. Odell, P.E. |
| Practical Mining LLC |
| markodell@practicalmining.com |
| 220 | P a g e |