Attached files
| file | filename |
|---|---|
| 8-K - 8-K - PEGASYSTEMS INC | d437838d8k.htm |
EXHIBIT 99.1

|

|
PEGASYSTEMS ANNOUNCES SECOND QUARTER 2017 FINANCIAL RESULTS
| • | License and Cloud Backlog increases 32% year over year |
| • | First half revenue growth of 15% coupled with operating margin expansion |
| • | Record operating cash flow of $86 million in first half of 2017 |
CAMBRIDGE, MA - August 9, 2017 - Pegasystems Inc. (NASDAQ: PEGA), the software company empowering customer engagement at the world’s leading enterprises, today announced its second quarter and first half 2017 financial results.
“The first half of 2017 has created a great foundation for the year,” said Alan Trefler, founder and CEO, Pegasystems. “We’re excited about the reception of our CRM capabilities and see a good mix of business between our applications and platform. We’re entering the second half of the year with tremendous momentum coming out of PegaWorld, our largest customer engagement and sales event to date, and we are very pleased with how the new products and partnerships we launched there are being received.”
“We’re very pleased with our first half results,” said Ken Stillwell, CFO, Pegasystems, “with revenue growth outpacing spending. In the second quarter we continued to see a higher than historical mix of recurring, which increases our longer-term visibility and predictability, and contributed to a 32% increase in license and cloud backlog compared to a year ago.”
SELECTED GAAP AND NON-GAAP FINANCIAL RESULTS (1)
| Three Months Ended June 30, |
Six Months Ended June 30, |
|||||||||||||||||||||||
| ($ in thousands, except per share amounts and %) | 2017 | 2016 | Change | 2017 | 2016 | Change | ||||||||||||||||||
| Total Revenue (GAAP) |
$ | 197,980 | $ | 188,996 | 5 | % | $ | 421,227 | $ | 367,854 | 15 | % | ||||||||||||
| Total Revenue (Non-GAAP) |
197,980 | 189,846 | 4 | % | 421,227 | 368,704 | 14 | % | ||||||||||||||||
| Net Income (GAAP) |
11,406 | 4,536 | 151 | % | 38,427 | 14,936 | 157 | % | ||||||||||||||||
| Net Income (Non-GAAP) |
12,231 | 14,644 | (16 | %) | 44,171 | 32,447 | 36 | % | ||||||||||||||||
| Diluted Earnings per share (GAAP) |
0.14 | 0.06 | 133 | % | 0.47 | 0.19 | 147 | % | ||||||||||||||||
| Diluted Earnings per share (Non-GAAP) |
0.15 | 0.19 | (21 | %) | 0.54 | 0.41 | 32 | % | ||||||||||||||||
| (1) | See a reconciliation of our GAAP to Non-GAAP measures contained in the financial schedules at the end of this release. |
Impact of New Revenue Standard: Historically, Recurring Revenue and License and Cloud Backlog have been our primary performance metrics. However, due to the change in the revenue recognition patterns of term license arrangements as a result of the expected implementation of the new revenue accounting standard (ASC 606 “Revenue from Contracts with Customers”) in the first quarter of 2018, we have started tracking the performance measure Annualized Contract Value (“ACV”). The change in ACV measures the growth and predictability of future cash flows from committed term license, cloud, and maintenance arrangements as of the end of the particular reporting period. Additional information about our future adoption of the new revenue standard and its impact can be found in Note 2. “New Accounting Pronouncements” contained in Item 1 of the Quarterly Report on Form 10-Q for the quarter ended June 30, 2017.
1
Recurring Revenue and Total License, Cloud, and Maintenance Revenue
| Three Months Ended June 30, |
Six Months Ended June 30, |
|||||||||||||||||||||||
| ($ in thousands) | 2017 | 2016 | Change | 2017 | 2016 | Change | ||||||||||||||||||
| Term license |
$ | 30,782 | $ | 18,864 | 63 | % | $ | 84,492 | $ | 73,196 | 15 | % | ||||||||||||
| Cloud |
12,733 | 11,269 | 13 | % | 23,560 | 19,767 | 19 | % | ||||||||||||||||
| Maintenance |
59,590 | 55,161 | 8 | % | 118,555 | 108,136 | 10 | % | ||||||||||||||||
|
|
|
|
|
|
|
|
|
|||||||||||||||||
| Total recurring revenue |
103,105 | 85,294 | 21 | % | 226,607 | 201,099 | 13 | % | ||||||||||||||||
| Perpetual license |
30,255 | 51,807 | (42 | %) | 68,935 | 65,820 | 5 | % | ||||||||||||||||
|
|
|
|
|
|
|
|
|
|||||||||||||||||
| Total license, cloud, and maintenance revenue |
$ | 133,360 | $ | 137,101 | (3 | %) | $ | 295,542 | $ | 266,919 | 11 | % | ||||||||||||
|
|
|
|
|
|
|
|
|
|||||||||||||||||
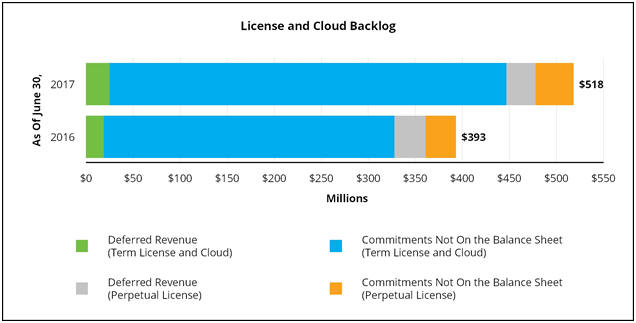
License and Cloud Backlog(1): The Company computes license and cloud backlog by adding deferred license and cloud revenue as recorded on the Company’s balance sheet and license and cloud contractual commitments, which are not yet billed and not recorded on its balance sheet.
| June 30, | ||||||||||||||||||||
| ($ in thousands) | 2017 | 2016 | Change | |||||||||||||||||
| Deferred license and cloud revenue on the balance sheet:(2) |
||||||||||||||||||||
| Term license and cloud |
$ | 25,104 | 45 | % | $ | 19,021 | 37 | % | 32 | % | ||||||||||
| Perpetual license |
30,542 | 55 | % | 32,834 | 63 | % | (7 | %) | ||||||||||||
|
|
|
|
|
|||||||||||||||||
| Total deferred license and cloud revenue |
55,646 | 100 | % | 51,855 | 100 | % | 7 | % | ||||||||||||
|
|
|
|
|
|||||||||||||||||
| License and cloud contractual commitments not on the balance sheet:(3) |
||||||||||||||||||||
| Term license and cloud |
422,414 | 91 | % | 309,338 | 91 | % | 37 | % | ||||||||||||
| Perpetual license |
39,949 | 9 | % | 31,439 | 9 | % | 27 | % | ||||||||||||
|
|
|
|
|
|||||||||||||||||
| Total license and cloud commitments |
462,363 | 100 | % | 340,777 | 100 | % | 36 | % | ||||||||||||
|
|
|
|
|
|||||||||||||||||
| Total license (term and perpetual) and cloud backlog |
$ | 518,009 | $ | 392,632 | 32 | % | ||||||||||||||
|
|
|
|
|
|||||||||||||||||
| Total term license and cloud backlog |
447,518 | 86 | % | 328,359 | 84 | % | 36 | % | ||||||||||||
|
|
|
|
|
|||||||||||||||||
| (1) | See historical quarterly license and cloud backlog amounts in a separate schedule at the end of this release. |
| (2) | See Note 9. “Deferred Revenue” contained in Item 1 of the Quarterly Report on Form 10-Q for the quarter ended June 30, 2017. |
| (3) | See “Future Cash Receipts from Committed License and Cloud Arrangements “ contained in Item 2 of the Quarterly Report on Form 10-Q for the quarter ended June 30, 2017. |
2
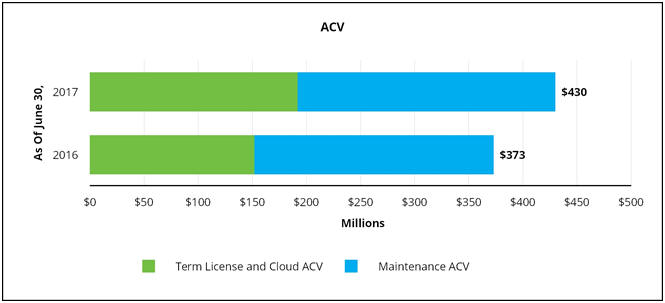
Annualized Contract Value (ACV): The change in ACV measures the growth and predictability of future cash flows from committed term license, cloud, and maintenance arrangements as of the end of the particular reporting period.
ACV is the sum of the following two components:
| • | Term and Cloud contract value divided by the number of committed contract years |
| • | Quarterly Maintenance revenue reported for the three months ended multiplied by 4. |
3
Quarterly Conference Call
Pegasystems will host a conference call and audio-only Webcast associated with this announcement at 5:00 p.m. EDT today. A live audio Webcast of the conference call, together with detailed financial information, can be accessed through the Company’s Website at www.pega.com/about/investors. Dial-in information is as follows: 1-877-705-6003 (domestic) or 1-201-493-6725 (international). To listen to the Webcast, log onto www.pega.com at least five minutes prior to the event’s broadcast and click on the Webcast icon in the Investors section. A replay of the call will also be available on www.pega.com by clicking the Earnings Calls link in the Investors section.
Discussion of Non-GAAP Financial Measures
To supplement financial results presented in accordance with Generally Accepted Accounting Principles in the U.S. (“GAAP”), the Company provides non-GAAP measures, including in this release. Pegasystems’ management utilizes a number of different financial measures, both GAAP and non-GAAP, in analyzing and assessing the overall performance of the business, for making operating decisions, and for forecasting and planning for future periods. The Company’s annual financial plan is prepared both on a GAAP and non-GAAP basis, and both are approved by our board of directors. In addition and as a consequence of the importance of these measures in managing the business, the Company uses non-GAAP measures and financial performance results in the evaluation process to establish management’s compensation.
The non-GAAP measures exclude the effects of certain business combination accounting entries, stock-based compensation expense, amortization of acquired intangibles, acquisition-related and restructuring expenses, and certain other adjustments. The Company believes that these non-GAAP measures are helpful in understanding its past financial performance and its anticipated future results. These non-GAAP financial measures are not meant to be considered in isolation or as a substitute for comparable GAAP measures and should be read only in conjunction with the Company’s consolidated financial statements prepared in accordance with GAAP. A reconciliation of the Company’s GAAP to non-GAAP measures is included in the financial schedules at the end of this release.
Forward-Looking Statements
“Safe harbor” statement under the Private Securities Litigation Reform Act of 1995: Certain statements contained in this press release may be construed as “forward-looking statements” as defined in the Private Securities Litigation Reform Act of 1995.
These forward-looking statements are based on current expectations, estimates, forecasts, and projections about the industry and markets in which we operate, and management’s beliefs and assumptions. In addition, other written or oral statements that constitute forward-looking statements may be made by us or on the Company’s behalf. Words such as “expect,” “anticipate,” “intend,” “plan,” “believe,” “could,” “estimate,” “may,” “target,” “strategy,” “is intended to,” “project,” “guidance,” “likely,” “usually,” or variations of such words and similar expressions are intended to identify such forward-looking statements. These statements are not guarantees of future performance and involve certain risks, uncertainties, and assumptions that are difficult to predict. Important factors that could cause actual future activities and results to differ materially from those expressed in such forward-looking statements include, among others, variation in demand for the Company’s products and services and the difficulty in predicting the completion of product acceptance and other factors affecting the timing of license revenue recognition; the ongoing consolidation in the financial services, insurance, healthcare, and communications markets; reliance on third party relationships; the potential loss of vendor specific objective evidence for the Company’s consulting services; the inherent risks associated with international operations and the continued uncertainties in international economies; foreign currency exchange rates; the financial impact of the Company’s past acquisitions and any future acquisitions; the potential legal and financial liabilities and reputation damage due to cyber-attacks and security breaches; and management of the Company’s growth. These risks, and other factors that could cause actual results to differ materially from those expressed in such forward-looking statements, are described more completely in the Company’s Annual Report on Form 10-K for the year ended December 31, 2016.
These documents are available on the Company’s website at http://www.pega.com/about/investors. The forward-looking statements contained in this press release represent the Company’s views as of August 9, 2017. Investors are cautioned not to place undue reliance on such forward-looking statements and there are no assurances that the matters contained in such statements will be achieved. Although subsequent events may cause the Company’s view to change, except as required by
4
applicable law, the Company does not undertake and specifically disclaims any obligation to publicly update or revise these forward-looking statements whether as the result of new information, future events or otherwise. The statements should therefore not be relied upon as representing the Company’s view as of any date subsequent to August 9, 2017.
About Pegasystems
Pegasystems Inc. is the leader in software for customer engagement and operational excellence. Pega’s adaptive, cloud-architected software - built on its unified Pega® Platform - empowers people to rapidly deploy, and easily extend and change applications to meet strategic business needs. Over its 30-year history, Pega has delivered award-winning capabilities in CRM and BPM, powered by advanced artificial intelligence and robotic automation, to help the world’s leading brands achieve breakthrough business results. For more information on Pegasystems (NASDAQ: PEGA) visit www.pega.com.
Press Contact:
Lisa Pintchman
Pegasystems Inc.
lisa.pintchman@pega.com
(617) 866-6022
Twitter: @pega
Investor Contact:
Garo Toomajanian
ICR for Pegasystems
PegaInvestorRelations@pega.com
(617) 866-6077
All trademarks are the property of their respective owners.
5
PEGASYSTEMS INC.
UNAUDITED CONDENSED CONSOLIDATED STATEMENTS OF OPERATIONS
(in thousands, except per share amounts)
| Three Months Ended June 30, |
Six Months Ended June 30, |
|||||||||||||||
| 2017 | 2016 | 2017 | 2016 | |||||||||||||
| Revenue: |
||||||||||||||||
| Software license |
$ | 61,037 | $ | 70,671 | $ | 153,427 | $ | 139,016 | ||||||||
| Maintenance |
59,590 | 55,161 | 118,555 | 108,136 | ||||||||||||
| Services |
77,353 | 63,164 | 149,245 | 120,702 | ||||||||||||
|
|
|
|
|
|
|
|
|
|||||||||
| Total revenue |
197,980 | 188,996 | 421,227 | 367,854 | ||||||||||||
|
|
|
|
|
|
|
|
|
|||||||||
| Cost of revenue: |
||||||||||||||||
| Software license |
1,250 | 1,312 | 2,550 | 2,333 | ||||||||||||
| Maintenance |
7,011 | 6,315 | 14,229 | 12,230 | ||||||||||||
| Services |
59,614 | 52,473 | 119,186 | 102,047 | ||||||||||||
|
|
|
|
|
|
|
|
|
|||||||||
| Total cost of revenue |
67,875 | 60,100 | 135,965 | 116,610 | ||||||||||||
|
|
|
|
|
|
|
|
|
|||||||||
| Gross profit |
130,105 | 128,896 | 285,262 | 251,244 | ||||||||||||
|
|
|
|
|
|
|
|
|
|||||||||
| Operating expenses: |
||||||||||||||||
| Selling and marketing |
75,887 | 74,016 | 147,175 | 135,094 | ||||||||||||
| Research and development |
39,762 | 35,574 | 80,058 | 70,494 | ||||||||||||
| General and administrative |
12,706 | 11,294 | 25,041 | 22,342 | ||||||||||||
| Acquisition-related |
— | 1,623 | — | 2,542 | ||||||||||||
| Restructuring |
— | 29 | — | 287 | ||||||||||||
|
|
|
|
|
|
|
|
|
|||||||||
| Total operating expenses |
128,355 | 122,536 | 252,274 | 230,759 | ||||||||||||
|
|
|
|
|
|
|
|
|
|||||||||
| Income from operations |
1,750 | 6,360 | 32,988 | 20,485 | ||||||||||||
| Foreign currency transaction (loss) gain |
(917 | ) | 306 | (241 | ) | 1,682 | ||||||||||
| Interest income, net |
161 | 188 | 326 | 478 | ||||||||||||
| Other income (expense), net |
566 | (1,356 | ) | 287 | (3,654 | ) | ||||||||||
|
|
|
|
|
|
|
|
|
|||||||||
| Income before (benefit)/provision for income taxes |
1,560 | 5,498 | 33,360 | 18,991 | ||||||||||||
| (Benefit)/provision for income taxes |
(9,846 | ) | 962 | (5,067 | ) | 4,055 | ||||||||||
|
|
|
|
|
|
|
|
|
|||||||||
| Net income |
$ | 11,406 | $ | 4,536 | $ | 38,427 | $ | 14,936 | ||||||||
|
|
|
|
|
|
|
|
|
|||||||||
| Earnings per share: |
||||||||||||||||
| Basic |
$ | 0.15 | $ | 0.06 | $ | 0.50 | $ | 0.20 | ||||||||
|
|
|
|
|
|
|
|
|
|||||||||
| Diluted |
$ | 0.14 | $ | 0.06 | $ | 0.47 | $ | 0.19 | ||||||||
|
|
|
|
|
|
|
|
|
|||||||||
| Weighted-average number of common shares outstanding: |
||||||||||||||||
| Basic |
77,313 | 76,318 | 77,039 | 76,347 | ||||||||||||
| Diluted |
82,945 | 79,422 | 82,412 | 79,329 | ||||||||||||
| Cash dividends declared per share |
$ | 0.03 | $ | 0.03 | $ | 0.06 | $ | 0.06 | ||||||||
6
PEGASYSTEMS INC.
UNAUDITED RECONCILIATION OF SELECTED GAAP MEASURES TO NON-GAAP MEASURES (1)
(in thousands, except per share amounts)
| Three Months Ended June 30, |
Six Months Ended June 30, |
|||||||||||||||||||||||
| 2017 | 2016 | Change | 2017 | 2016 | Change | |||||||||||||||||||
| GAAP total revenue |
$ | 197,980 | $ | 188,996 | 5 | % | $ | 421,227 | $ | 367,854 | 15 | % | ||||||||||||
| Deferred revenue purchase accounting |
— | 850 | — | 850 | ||||||||||||||||||||
|
|
|
|
|
|
|
|
|
|||||||||||||||||
| Non-GAAP total revenue |
$ | 197,980 | $ | 189,846 | 4 | % | $ | 421,227 | $ | 368,704 | 14 | % | ||||||||||||
|
|
|
|
|
|
|
|
|
|||||||||||||||||
| GAAP gross profit |
$ | 130,105 | $ | 128,896 | 1 | % | $ | 285,262 | $ | 251,244 | 14 | % | ||||||||||||
| Deferred revenue purchase accounting |
— | 850 | — | 850 | ||||||||||||||||||||
| Amortization of intangible assets |
1,305 | 1,638 | 2,639 | 2,984 | ||||||||||||||||||||
| Stock-based compensation (2) |
3,677 | 2,914 | 7,299 | 5,594 | ||||||||||||||||||||
|
|
|
|
|
|
|
|
|
|||||||||||||||||
| Non-GAAP gross profit |
$ | 135,087 | $ | 134,298 | 1 | % | $ | 295,200 | $ | 260,672 | 13 | % | ||||||||||||
|
|
|
|
|
|
|
|
|
|||||||||||||||||
| GAAP income from operations |
$ | 1,750 | $ | 6,360 | (72 | %) | $ | 32,988 | $ | 20,485 | 61 | % | ||||||||||||
| Deferred revenue purchase accounting |
— | 850 | — | 850 | ||||||||||||||||||||
| Amortization of intangible assets |
3,174 | 3,604 | 6,374 | 6,569 | ||||||||||||||||||||
| Stock-based compensation (2) |
13,932 | 10,881 | 26,440 | 19,816 | ||||||||||||||||||||
| Other adjustments |
— | (220 | ) | — | (220 | ) | ||||||||||||||||||
| Acquisition-related |
— | 1,271 | — | 2,190 | ||||||||||||||||||||
| Restructuring |
— | 29 | — | 287 | ||||||||||||||||||||
|
|
|
|
|
|
|
|
|
|||||||||||||||||
| Non-GAAP income from operations |
$ | 18,856 | $ | 22,775 | (17 | %) | $ | 65,802 | $ | 49,977 | 32 | % | ||||||||||||
|
|
|
|
|
|
|
|
|
|||||||||||||||||
| GAAP net income |
$ | 11,406 | $ | 4,536 | 151 | % | $ | 38,427 | $ | 14,936 | 157 | % | ||||||||||||
| Deferred revenue purchase accounting |
— | 850 | — | 850 | ||||||||||||||||||||
| Amortization of intangible assets |
3,174 | 3,604 | 6,374 | 6,569 | ||||||||||||||||||||
| Stock-based compensation (2) |
13,932 | 10,881 | 26,440 | 19,816 | ||||||||||||||||||||
| Other adjustments |
— | (220 | ) | — | (220 | ) | ||||||||||||||||||
| Acquisition-related |
— | 1,271 | — | 2,190 | ||||||||||||||||||||
| Restructuring |
— | 29 | — | 287 | ||||||||||||||||||||
| Income tax effects (3) |
(16,281 | ) | (6,307 | ) | (27,070 | ) | (11,981 | ) | ||||||||||||||||
|
|
|
|
|
|
|
|
|
|||||||||||||||||
| Non-GAAP net income |
$ | 12,231 | $ | 14,644 | (16 | %) | $ | 44,171 | $ | 32,447 | 36 | % | ||||||||||||
|
|
|
|
|
|
|
|
|
|||||||||||||||||
| GAAP diluted earnings per share |
$ | 0.14 | $ | 0.06 | 133 | % | $ | 0.47 | $ | 0.19 | 147 | % | ||||||||||||
| Deferred revenue purchase accounting |
— | 0.01 | — | 0.01 | ||||||||||||||||||||
| Amortization of intangible assets |
0.04 | 0.05 | 0.08 | 0.08 | ||||||||||||||||||||
| Stock-based compensation (2) |
0.17 | 0.14 | 0.32 | 0.25 | ||||||||||||||||||||
| Acquisition-related |
— | 0.02 | — | 0.03 | ||||||||||||||||||||
| Income tax effects (3) |
(0.20 | ) | (0.09 | ) | (0.33 | ) | (0.15 | ) | ||||||||||||||||
|
|
|
|
|
|
|
|
|
|||||||||||||||||
| Non-GAAP diluted earnings per share |
$ | 0.15 | $ | 0.19 | (21 | %) | $ | 0.54 | $ | 0.41 | 32 | % | ||||||||||||
|
|
|
|
|
|
|
|
|
|||||||||||||||||
| GAAP and non-GAAP diluted weighted average common shares outstanding |
82,945 | 79,422 | 4 | % | 82,412 | 79,329 | 4 | % | ||||||||||||||||
7
| (1) | This presentation includes non-GAAP measures. Our non-GAAP measures are not meant to be considered in isolation or as a substitute for comparable GAAP measures, and should be read only in conjunction with our consolidated financial statements prepared in accordance with GAAP. For a detailed explanation of the adjustments made to comparable GAAP measures, the reasons why management uses these measures, the usefulness of these measures, and the material limitations on the usefulness of these measures, see disclosure under Discussion of Non-GAAP Financial Measures included earlier in this release and below. |
Our non-GAAP financial measures reflect adjustments based on the following items, as well as the related income tax effects:
| • | Deferred revenue purchase accounting: Business combination accounting rules require that we determine the fair value of the deferred revenue liability for contractual obligations assumed primarily from our acquisition of OpenSpan in April 2016. In post-acquisition reporting periods, we recognize revenue for the fair value of these contracts, when all the revenue recognition criteria are satisfied, instead of the revenue that would have been recognized by OpenSpan as an independent company. We add back the effect of the deferred revenue fair value adjustment in non-GAAP revenue to reflect the full amount of these revenues to provide a more complete comparison of the revenue guidance to peer companies. |
| • | Amortization of intangible assets: We have excluded the amortization expense of intangible assets from our non-GAAP operating expenses and net earnings measures. Amortization of intangible assets is inconsistent in amount and frequency and is significantly affected by the timing and size of our acquisitions. Investors should note that the use of intangible assets contributed to our revenues earned during the periods presented and will contribute to our future period revenues as well. Amortization of intangible assets will recur in future periods. |
| • | Stock-based compensation expense: We have excluded stock-based compensation expense from our non-GAAP operating expenses and net earnings measures. Although stock-based compensation is a key incentive offered to our employees, and we believe such compensation contributed to the revenues earned during the periods presented and will contribute to the generation of future period revenues, we continue to evaluate our business performance excluding stock-based compensation expense. |
| • | Acquisition-related and restructuring expenses: We have excluded the effect of acquisition-related and restructuring expenses from our non-GAAP operating expenses and net earnings measures. We incurred direct and incremental expenses associated primarily with the OpenSpan acquisition. These acquisition related expenses were primarily professional fees to affect the acquisition. We have also incurred restructuring expenses for one-time employee termination benefits related to the closure of one of our domestic offices, which we generally would not have otherwise incurred in the periods presented as a part of our continuing operations. We believe it is useful for investors to understand the effects of these items on our total operating expenses. |
| (2) | Stock-based compensation expense (in thousands) was as follows: |
| Three Months Ended June 30, |
Six Months Ended June 30, |
|||||||||||||||
| 2017 | 2016 | 2017 | 2016 | |||||||||||||
| Cost of revenues |
$ | 3,677 | $ | 2,914 | $ | 7,299 | $ | 5,594 | ||||||||
| Operating expenses |
$ | 10,255 | $ | 7,967 | $ | 19,141 | $ | 14,222 | ||||||||
|
|
|
|
|
|
|
|
|
|||||||||
| Total stock-based compensation before tax |
$ | 13,932 | $ | 10,881 | $ | 26,440 | $ | 19,816 | ||||||||
|
|
|
|
|
|
|
|
|
|||||||||
| (3) | The GAAP effective tax rate was (631%) and 17% for the three months ended June 30, 2017 and 2016, respectively. The effective non-GAAP tax rate was 34% and 33% for the three months ended June 30, 2017 and 2016, respectively. The differences between our GAAP and non-GAAP effective tax rates for the three months ended June 30, 2017 and 2016 primarily relate to the impact of excess tax benefits generated by our stock compensation plans adjustments on our GAAP effective tax rate. |
The GAAP effective tax rate was (15%) and 21% for the six months ended June 30, 2017 and 2016, respectively. The effective non-GAAP tax rate was 33% and 33% for the six months ended June 30, 2017 and 2016, respectively. The differences between our GAAP and non-GAAP effective tax rates for the six months ended June 30, 2017 and 2016 primarily relate to the impact of excess tax benefits generated by our stock compensation plans adjustments on our GAAP effective tax rate.
8
PEGASYSTEMS INC.
UNAUDITED CONDENSED CONSOLIDATED BALANCE SHEETS
(in thousands)
| June 30, 2017 |
December 31, 2016 |
|||||||
| Assets: |
||||||||
| Total cash, cash equivalents, and marketable securities |
$ | 180,040 | $ | 133,761 | ||||
| Trade accounts receivable, net |
217,020 | 265,028 | ||||||
| Property and equipment, net |
38,881 | 38,281 | ||||||
| Deferred income taxes |
71,096 | 69,898 | ||||||
| Goodwill and Intangible assets, net |
110,734 | 117,355 | ||||||
| Other assets |
45,201 | 30,333 | ||||||
|
|
|
|
|
|||||
| Total assets |
$ | 662,972 | $ | 654,656 | ||||
|
|
|
|
|
|||||
| Liabilities and Stockholders’ Equity: |
||||||||
| Accrued expenses, including compensation and related expenses |
$ | 82,524 | $ | 97,411 | ||||
| Deferred revenue |
178,357 | 186,636 | ||||||
| Other liabilities |
33,456 | 34,720 | ||||||
| Stockholders’ equity |
368,635 | 335,889 | ||||||
|
|
|
|
|
|||||
| Total liabilities and stockholders’ equity |
$ | 662,972 | $ | 654,656 | ||||
|
|
|
|
|
|||||
PEGASYSTEMS INC.
UNAUDITED CONDENSED CONSOLIDATED STATEMENTS OF CASH FLOWS
(in thousands)
| Six Months Ended June 30, |
||||||||
| 2017 | 2016 | |||||||
| Operating activities: |
||||||||
| Net Income |
$ | 38,427 | $ | 14,936 | ||||
| Adjustments to reconcile net income to cash provided by operating activities: |
||||||||
| Depreciation, amortization, foreign currency transaction loss, and other non-cash items |
11,724 | 13,379 | ||||||
| Stock-based compensation expense |
26,440 | 19,816 | ||||||
| Change in operating assets and liabilities, net |
9,178 | (36,562 | ) | |||||
|
|
|
|
|
|||||
| Cash provided by operating activities |
85,769 | 11,569 | ||||||
|
|
|
|
|
|||||
| Cash used in investing activities |
(1,159 | ) | (7,930 | ) | ||||
|
|
|
|
|
|||||
| Cash used in financing activities |
(34,860 | ) | (31,666 | ) | ||||
|
|
|
|
|
|||||
| Effect of exchange rates on cash and cash equivalents |
1,282 | (738 | ) | |||||
|
|
|
|
|
|||||
| Net increase (decrease) in cash and cash equivalents |
51,032 | (28,765 | ) | |||||
| Cash and cash equivalents, beginning of period |
70,594 | 93,026 | ||||||
|
|
|
|
|
|||||
| Cash and cash equivalents, end of period |
$ | 121,626 | $ | 64,261 | ||||
|
|
|
|
|
|||||
9
PEGASYSTEMS INC.
HISTORICAL LICENSE AND CLOUD BACKLOG
(in thousands)
| 2017 | 2016 | 2015 | ||||||||||||||||||||||||||||||
| Q2 | Q1 | Q4 | Q3 | Q2 | Q1 | Q4 | Q3 | |||||||||||||||||||||||||
| Deferred license and cloud revenue on the balance sheet: |
| |||||||||||||||||||||||||||||||
| Term license and cloud |
$ | 25,104 | $ | 29,297 | $ | 30,725 | $ | 19,627 | $ | 19,021 | $ | 18,409 | $ | 29,929 | $ | 14,123 | ||||||||||||||||
| Perpetual license |
30,542 | 32,141 | 31,098 | 27,653 | 32,834 | 39,381 | 33,483 | 41,247 | ||||||||||||||||||||||||
|
|
|
|
|
|
|
|
|
|
|
|
|
|
|
|
|
|||||||||||||||||
| Total deferred license and cloud revenue |
55,646 | 61,438 | 61,823 | 47,280 | 51,855 | 57,790 | 63,412 | 55,370 | ||||||||||||||||||||||||
| License and cloud contractual commitments not on the balance sheet: |
| |||||||||||||||||||||||||||||||
| Term license and cloud |
422,414 | 416,088 | 434,323 | 352,804 | 309,338 | 287,926 | 322,844 | 287,863 | ||||||||||||||||||||||||
| Perpetual license |
39,949 | 35,532 | 31,652 | 19,728 | 31,439 | 43,944 | 33,544 | 36,477 | ||||||||||||||||||||||||
|
|
|
|
|
|
|
|
|
|
|
|
|
|
|
|
|
|||||||||||||||||
| Total license and cloud commitments |
462,363 | 451,620 | 465,975 | 372,532 | 340,777 | 331,870 | 356,388 | 324,340 | ||||||||||||||||||||||||
|
|
|
|
|
|
|
|
|
|
|
|
|
|
|
|
|
|||||||||||||||||
| Total license (term and perpetual) and cloud backlog |
518,009 | 513,058 | 527,798 | 419,812 | 392,632 | 389,660 | 419,800 | 379,710 | ||||||||||||||||||||||||
|
|
|
|
|
|
|
|
|
|
|
|
|
|
|
|
|
|||||||||||||||||
| Total term license and cloud backlog |
$ | 447,518 | $ | 445,385 | $ | 465,048 | $ | 372,431 | $ | 328,359 | $ | 306,335 | $ | 352,773 | $ | 301,986 | ||||||||||||||||
|
|
|
|
|
|
|
|
|
|
|
|
|
|
|
|
|
|||||||||||||||||
| Term license and cloud backlog as a % of total license and cloud backlog |
86 | % | 87 | % | 88 | % | 89 | % | 84 | % | 79 | % | 84 | % | 80 | % | ||||||||||||||||
10