Attached files
| file | filename |
|---|---|
| 8-K - 8-K - MITEL NETWORKS CORP | d429564d8k.htm |

Mitel + ShoreTel: Stronger Together Oppenheimer 20th Annual Technology, Internet & Communications Conference Steve Spooner, CFO August 9th, 2017 Exhibit 99.1
Safe Harbor Statement Important Information The tender offer for the outstanding shares of ShoreTel common stock to be conducted in connection with the proposed acquisition of ShoreTel referenced in this communication has not yet commenced. This communication is for informational purposes only and is neither an offer to purchase nor a solicitation of an offer to sell shares of ShoreTel common stock, nor is it a substitute for the tender offer materials that Mitel and its acquisition subsidiary will file with the U.S. Securities and Exchange Commission (the “SEC”) upon commencement of the tender offer. At the time the offer is commenced, Mitel and its acquisition subsidiary will file tender offer materials on Schedule TO, and ShoreTel will thereafter file a Solicitation/Recommendation Statement on Schedule 14D-9 with the SEC with respect to the tender offer. The tender offer materials (including an Offer to Purchase, a related Letter of Transmittal and certain other offer documents) and the Solicitation/Recommendation Statement will contain important information. Holders of shares of ShoreTel common stock are urged to read these documents when they become available because they will contain important information that holders of ShoreTel common stock should consider before making any decision regarding tendering their shares. The Offer to Purchase, the related Letter of Transmittal and certain other offer documents, as well as the Solicitation/Recommendation Statement, will be made available to all holders of shares of ShoreTel common stock at no expense to them. The tender offer materials and the Solicitation/Recommendation Statement will be made available for free at the SEC’s web site at www.sec.gov. Copies of these documents will also be made available free of charge on Mitel’s website at investor.Mitel.com or by contacting Mitel’s Investor Relations Department at 469-574-8134. Copies of the documents filed with the SEC by ShoreTel will be available free of charge on ShoreTel website at ir.shoretel.com or by contacting ShoreTel’s Investor Relations Department at (408) 962-2573. In addition to the Offer to Purchase, the related Letter of Transmittal and certain other offer documents, as well as the Solicitation/Recommendation Statement, Mitel and ShoreTel file annual, quarterly and special reports and other information with the SEC. You may read and copy any reports or other information filed by Mitel or ShoreTel at the SEC public reference room at 100 F Street, N.E., Washington, D.C. 20549. Please call the Commission at 1-800-SEC-0330 for further information on the public reference room. Mitel’s and ShoreTel's filings with the SEC are also available to the public from commercial document-retrieval services and at the website maintained by the SEC at www.sec.gov. Forward Looking Statements Some of the statements in this communication are forward-looking statements (or forward-looking information) within the meaning of applicable U.S. and Canadian securities laws. These include statements using the words believe, target, outlook, may, will, should, could, estimate, continue, expect, intend, plan, predict, potential, project and anticipate, and similar statements which do not describe the present or provide information about the past. There is no guarantee that the expected events or expected results will actually occur. Such statements reflect the current views of management of Mitel and ShoreTel and are subject to a number of risks and uncertainties. These statements are based on many assumptions and factors, including general economic and market conditions, industry conditions, operational and other factors. Any changes in these assumptions or other factors could cause actual results to differ materially from current expectations. All forward-looking statements attributable to Mitel or ShoreTel, or persons acting on either of their behalf, are expressly qualified in their entirety by the cautionary statements set forth in this paragraph. Undue reliance should not be placed on such statements. In addition, material risks that could cause actual results to differ from forward-looking statements include: the inherent uncertainty associated with financial or other projections; the integration of Mitel and ShoreTel and the ability to recognize the anticipated benefits from the proposed acquisition of ShoreTel (the “transaction”); the ability to obtain required regulatory approvals for the transaction, the timing of obtaining such approvals and the risk that such approvals may result in the imposition of conditions that could adversely affect the expected benefits of the transaction; the risk that the conditions to the transaction are not satisfied on a timely basis or at all and the failure of the transaction to close for any other reason; the anticipated size of the markets and continued demand for Mitel and ShoreTel products and services; the impact of competitive products and pricing and disruption to Mitel’s and ShoreTel's respective businesses that could result from the announcement of the transaction; access to available financing on a timely basis and on reasonable terms, including amending Mitel’s existing credit facilities to fund the cash portion of the consideration in connection with the transaction; the ability to recognize the anticipated benefits from the divestment of Mitel’s mobile division (“Mobile Division”); risks associated with the non-cash consideration received by Mitel in connection with the divestment of the Mobile Division; the impact to Mitel’s business that could result from the announcement of the divestment of the Mobile Division; Mitel's ability to achieve or sustain profitability in the future; fluctuations in quarterly and annual revenues and operating results; fluctuations in foreign exchange rates; current and ongoing global economic instability, political unrest and related sanctions; intense competition; reliance on channel partners for a significant component of sales; dependence upon a small number of outside contract manufacturers to manufacture products; and, Mitel's ability to successfully implement and achieve its business strategies, including its growth of the company through acquisitions and the integration of recently acquired businesses and realization of synergies, including the proposed acquisition of ShoreTel. Additional risks are described under the heading “Risk Factors” in Mitel’s Annual Report on Form 10-K for the year ended December 31, 2016 filed with the SEC and Canadian securities regulatory authorities on March 1, 2017, in Mitel’s Quarterly Report on Form 10-Q for the quarter ended June 30, 2017 filed on July 28, 2017 with the SEC and Canadian securities regulatory authorities, and in ShoreTel’s Annual Report on Form 10-K for the year ended June 30, 2016 filed with the SEC on September 12, 2016. Forward-looking statements speak only as of the date they are made. Except as required by law, neither Mitel nor ShoreTel has any intention or obligation to update or to publicly announce the results of any revisions to any of the forward-looking statements to reflect actual results, future events or developments, changes in assumptions or changes in other factors affecting the forward-looking statements.
Non-GAAP Financial Measurements In an effort to provide investors with additional information regarding the company's results as determined by generally accepted accounting principles (GAAP), the company also discusses, in its earnings press release and earnings presentation materials, the following non-GAAP information which management believes provides useful information to investors. Mitel provides a reconciliation between GAAP and non-GAAP financial information in our quarterly results announcements and in the supplemental slides used in conjunction with the company’s quarterly call. This information is available on our website at www.mitel.com under the “Investor Relations” section http://investor.mitel.com/events.cfm. In addition, see the reconciliations located in the tables at the end of this presentation. Non-GAAP Financial Measures This presentation includes references to non-GAAP financial measures including Adjusted EBITDA, non-GAAP net income, and non-GAAP EPS (earnings per share). Non-GAAP financial measures do not have any standardized meaning and are therefore unlikely to be comparable to similar measures presented by other companies. We use these non-GAAP financial measures to assist management and investors in understanding our past financial performance and prospects for the future, including changes in our operating results, trends and marketplace performance, exclusive of unusual events or factors which do not directly affect what we consider to be our core operating performance. Non-GAAP measures are among the primary indicators management uses as a basis for our planning and forecasting of future periods. Investors are cautioned that non-GAAP financial measures should not be relied upon as a substitute for financial measures prepared in accordance with U.S. GAAP. Please see the reconciliation of non-GAAP financial measures to the most directly comparable U.S. GAAP measure attached to our quarterly results announcement and the reconciliation located in the tables at the end of this presentation. See “Constant Currency Estimates” below, which are Non-GAAP measures. Constant Currency Estimates Management refers to growth rates at constant currency or adjusting for currency so that certain financial results can be viewed without the impact of fluctuations in foreign currency exchange rates, thereby facilitating period-to-period comparisons of the company's business performance. Financial results adjusted for currency are calculated by translating prior period activity in local currency using the current period currency conversion rate. This approach is used for countries where the functional currency is the local currency. Generally, when the US dollar either strengthens or weakens against other currencies, the growth at constant currency rates or adjusting for currency will be higher or lower than growth reported at actual exchange rates. Annualized Exit Monthly Cloud Recurring Revenue Annualized Exit Monthly Cloud Recurring Revenue is a leading indicator of our anticipated cloud recurring revenues. We believe that trends in revenue are important to understanding the overall health of our cloud business. Our Annualized Exit Monthly Cloud Recurring Revenue equals our Monthly Cloud Recurring Revenue multiplied by 12. Our Monthly Cloud Recurring Revenue equals the monthly value of all customer subscriptions in effect at the end of a given month. For example, our Monthly Recurring Subscriptions at June 30, 2017 were $10.65 million. As such, our Annualized Exit Monthly Cloud Recurring Revenues at June 30, 2017 were $127.8 million.
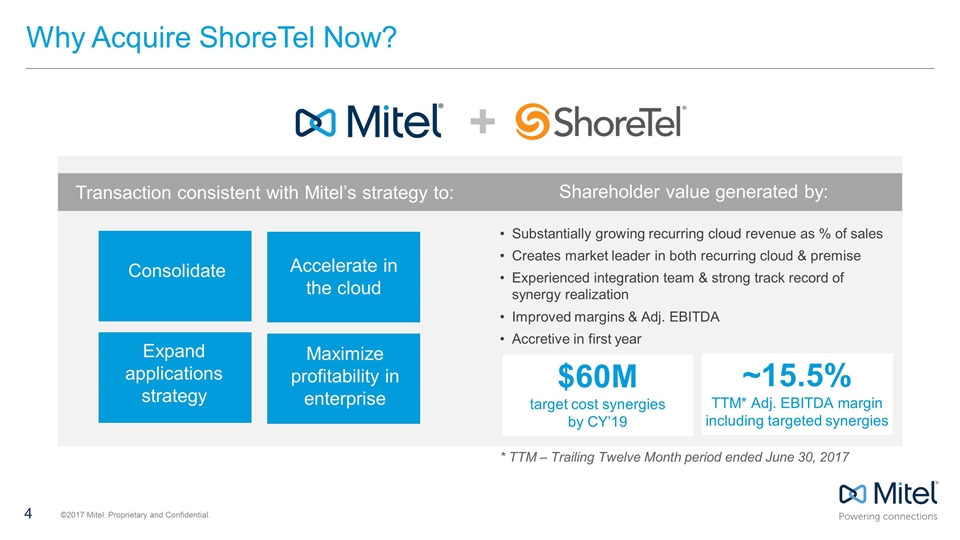
Why Acquire ShoreTel Now? + Consolidate Substantially growing recurring cloud revenue as % of sales Creates market leader in both recurring cloud & premise Experienced integration team & strong track record of synergy realization Improved margins & Adj. EBITDA Accretive in first year * TTM – Trailing Twelve Month period ended June 30, 2017 Transaction consistent with Mitel’s strategy to: Accelerate in the cloud Expand applications strategy Maximize profitability in enterprise $60M target cost synergies by CY’19 ~15.5% TTM* Adj. EBITDA margin including targeted synergies Shareholder value generated by:
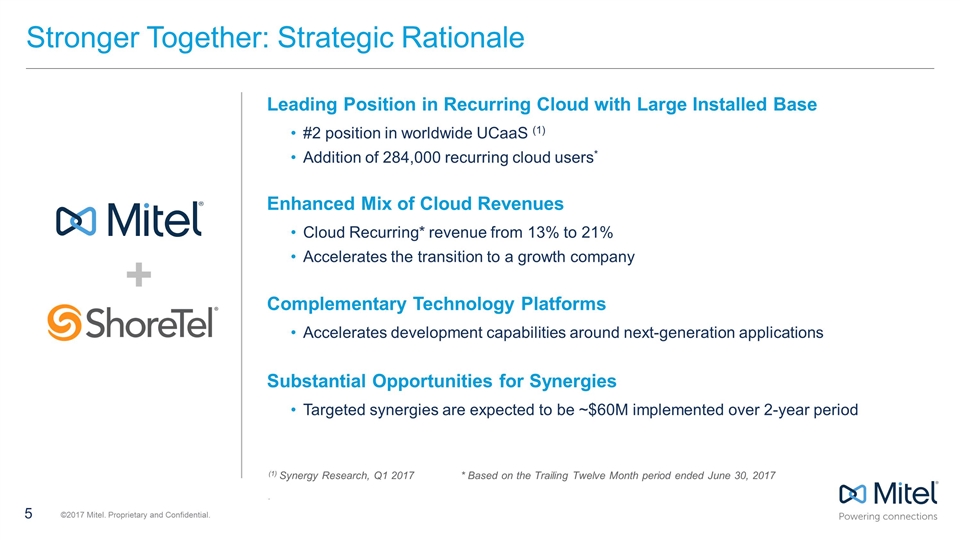
Stronger Together: Strategic Rationale Enhanced Mix of Cloud Revenues Cloud Recurring* revenue from 13% to 21% Accelerates the transition to a growth company Complementary Technology Platforms Accelerates development capabilities around next-generation applications Substantial Opportunities for Synergies Targeted synergies are expected to be ~$60M implemented over 2-year period (1) Synergy Research, Q1 2017* Based on the Trailing Twelve Month period ended June 30, 2017 . Leading Position in Recurring Cloud with Large Installed Base #2 position in worldwide UCaaS (1) Addition of 284,000 recurring cloud users* +
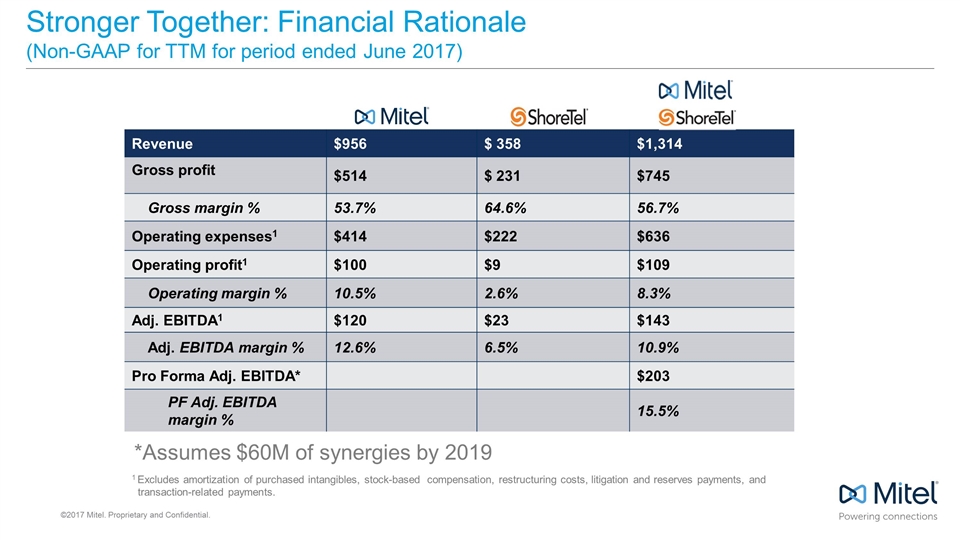
Stronger Together: Financial Rationale (Non-GAAP for TTM for period ended June 2017) Revenue $956 $ 358 $1,314 Gross profit $514 $ 231 $745 Gross margin % 53.7% 64.6% 56.7% Operating expenses1 $414 $222 $636 Operating profit1 $100 $9 $109 Operating margin % 10.5% 2.6% 8.3% Adj. EBITDA1 $120 $23 $143 Adj. EBITDA margin % 12.6% 6.5% 10.9% Pro Forma Adj. EBITDA* $203 PF Adj. EBITDA margin % 15.5% 1 Excludes amortization of purchased intangibles, stock-based compensation, restructuring costs, litigation and reserves payments, and transaction-related payments. *Assumes $60M of synergies by 2019
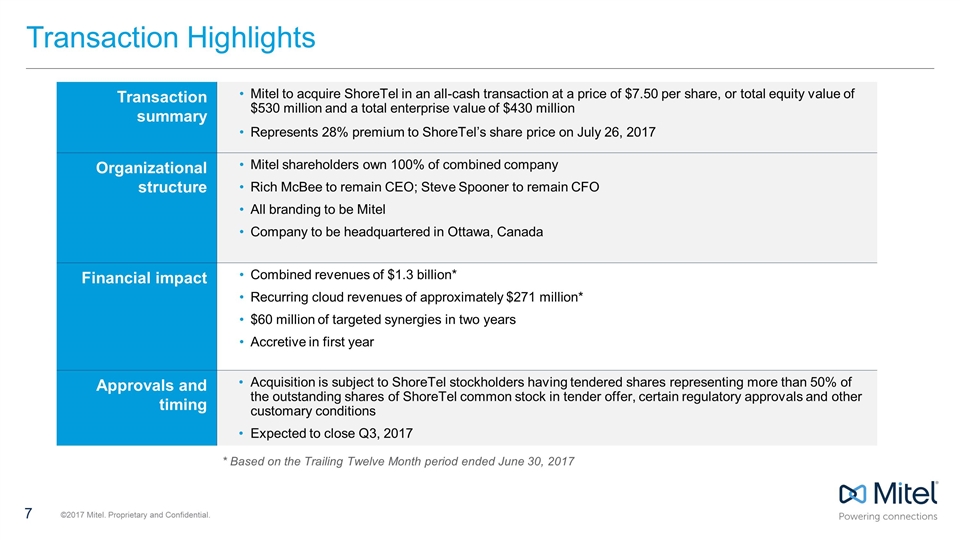
Transaction Highlights Transaction summary Mitel to acquire ShoreTel in an all-cash transaction at a price of $7.50 per share, or total equity value of $530 million and a total enterprise value of $430 million Represents 28% premium to ShoreTel’s share price on July 26, 2017 Organizational structure Mitel shareholders own 100% of combined company Rich McBee to remain CEO; Steve Spooner to remain CFO All branding to be Mitel Company to be headquartered in Ottawa, Canada Financial impact Combined revenues of $1.3 billion* Recurring cloud revenues of approximately $271 million* $60 million of targeted synergies in two years Accretive in first year Approvals and timing Acquisition is subject to ShoreTel stockholders having tendered shares representing more than 50% of the outstanding shares of ShoreTel common stock in tender offer, certain regulatory approvals and other customary conditions Expected to close Q3, 2017 * Based on the Trailing Twelve Month period ended June 30, 2017
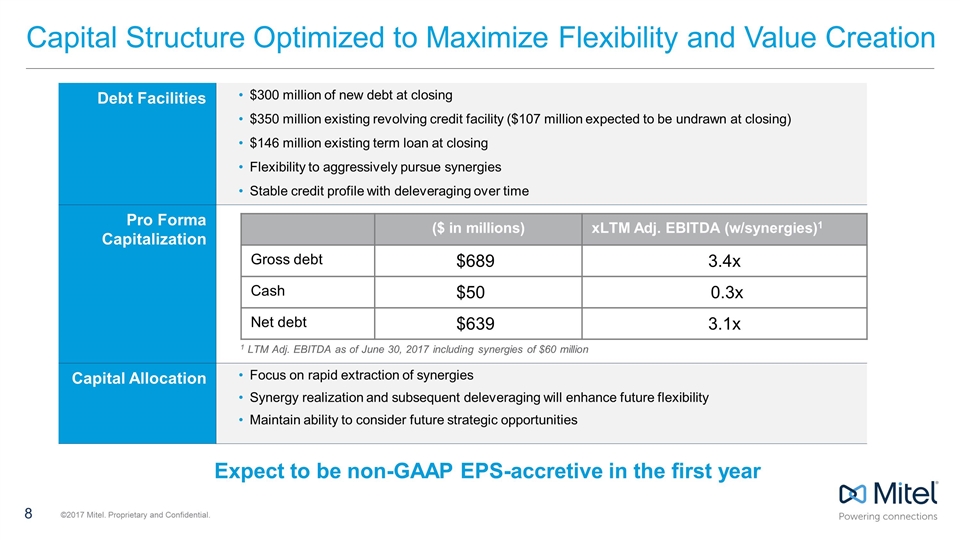
Capital Structure Optimized to Maximize Flexibility and Value Creation Debt Facilities $300 million of new debt at closing $350 million existing revolving credit facility ($107 million expected to be undrawn at closing) $146 million existing term loan at closing Flexibility to aggressively pursue synergies Stable credit profile with deleveraging over time Pro Forma Capitalization Capital Allocation Focus on rapid extraction of synergies Synergy realization and subsequent deleveraging will enhance future flexibility Maintain ability to consider future strategic opportunities Expect to be non-GAAP EPS-accretive in the first year ($ in millions) xLTM Adj. EBITDA (w/synergies)1 Gross debt $689 3.4x Cash $50 0.3x Net debt $639 3.1x 1 LTM Adj. EBITDA as of June 30, 2017 including synergies of $60 million
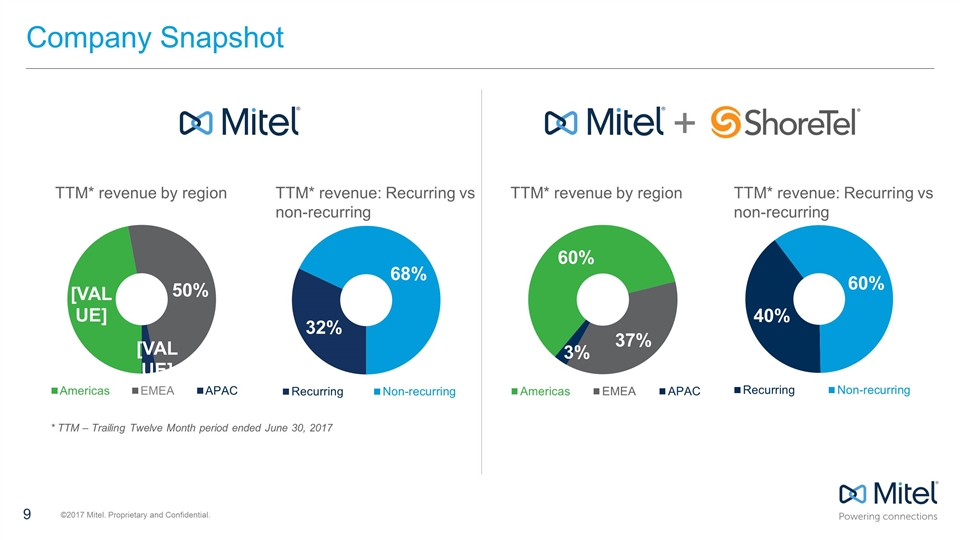
Company Snapshot TTM* revenue by region TTM* revenue: Recurring vs non-recurring TTM* revenue by region TTM* revenue: Recurring vs non-recurring + * TTM – Trailing Twelve Month period ended June 30, 2017
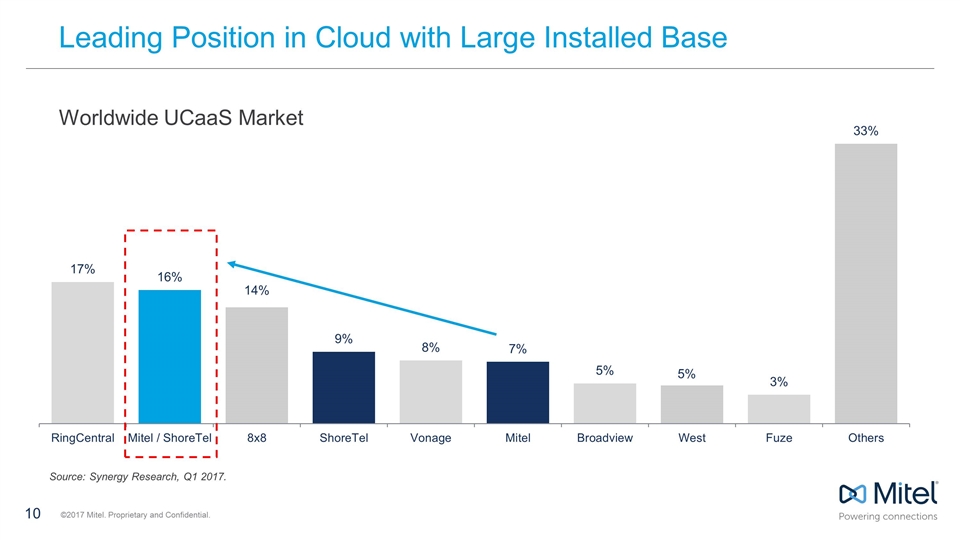
Source: Synergy Research, Q1 2017. Leading Position in Cloud with Large Installed Base Worldwide UCaaS Market
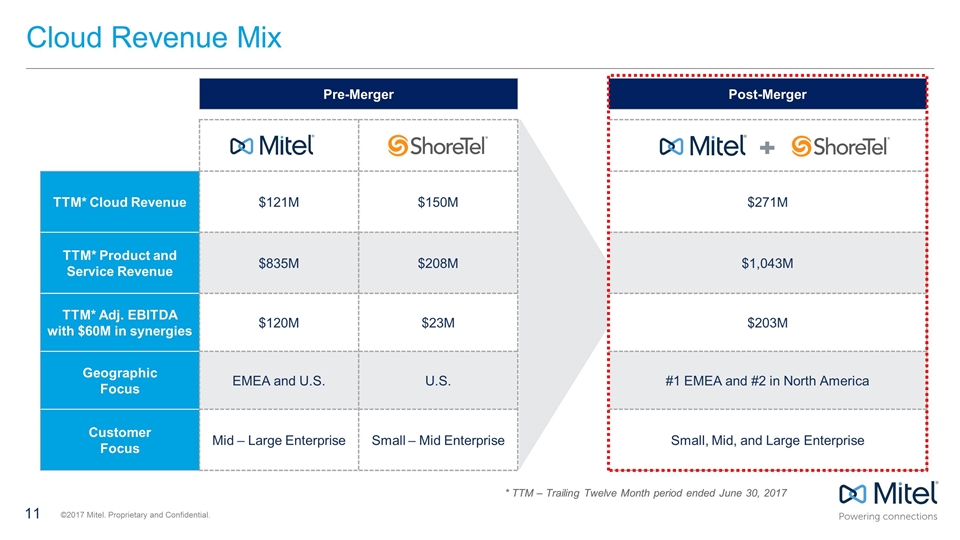
Pre-Merger Post-Merger TTM* Cloud Revenue $121M $150M $271M TTM* Product and Service Revenue $835M $208M $1,043M TTM* Adj. EBITDA with $60M in synergies $120M $23M $203M Geographic Focus EMEA and U.S. U.S. #1 EMEA and #2 in North America Customer Focus Mid – Large Enterprise Small – Mid Enterprise Small, Mid, and Large Enterprise Cloud Revenue Mix * TTM – Trailing Twelve Month period ended June 30, 2017
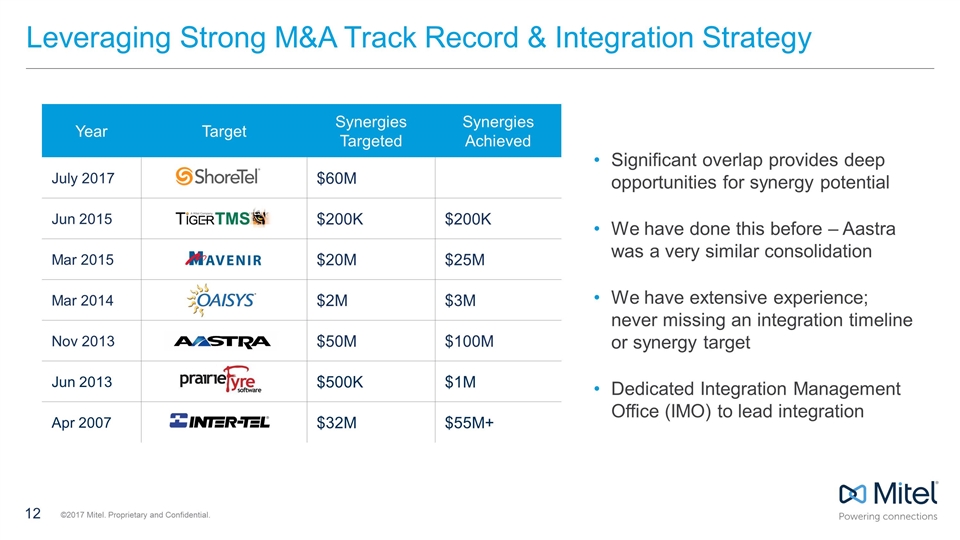
Year Target Synergies Targeted Synergies Achieved July 2017 $60M Jun 2015 $200K $200K Mar 2015 $20M $25M Mar 2014 $2M $3M Nov 2013 $50M $100M Jun 2013 $500K $1M Apr 2007 $32M $55M+ Significant overlap provides deep opportunities for synergy potential We have done this before – Aastra was a very similar consolidation We have extensive experience; never missing an integration timeline or synergy target Dedicated Integration Management Office (IMO) to lead integration Leveraging Strong M&A Track Record & Integration Strategy
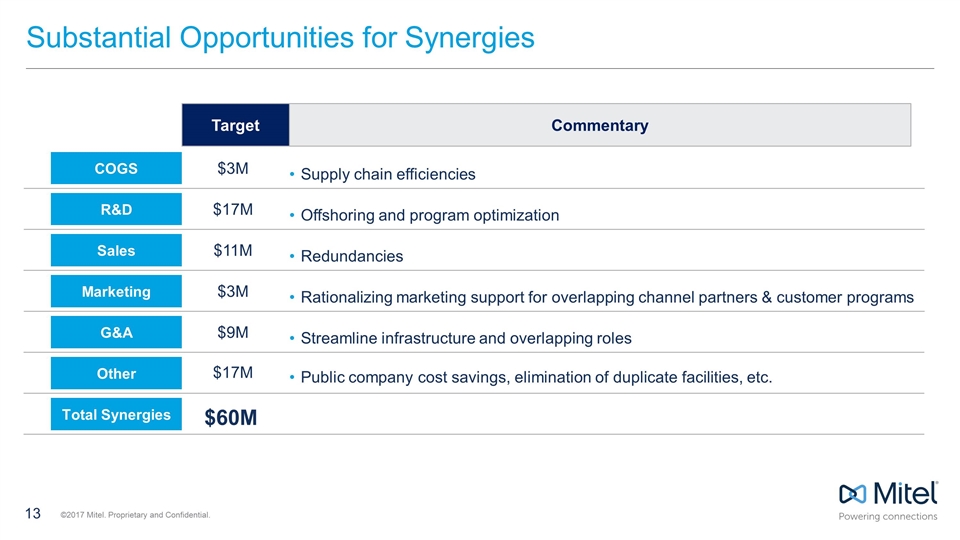
Substantial Opportunities for Synergies Target Commentary G&A Streamline infrastructure and overlapping roles $9M Marketing Rationalizing marketing support for overlapping channel partners & customer programs $3M Sales Redundancies $11M R&D Offshoring and program optimization $17M COGS Supply chain efficiencies $3M Total Synergies $60M Other $17M Public company cost savings, elimination of duplicate facilities, etc.
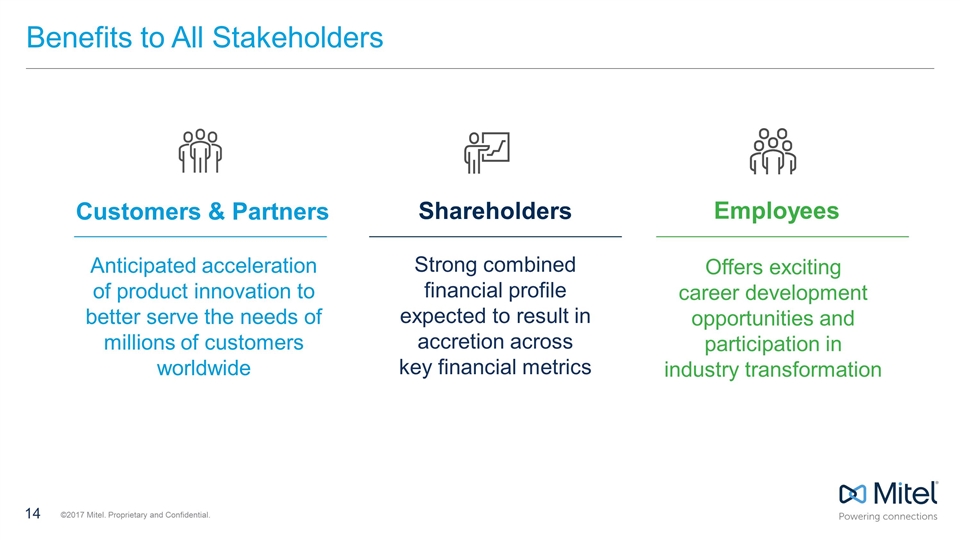
Benefits to All Stakeholders Customers & Partners Anticipated acceleration of product innovation to better serve the needs of millions of customers worldwide Shareholders Strong combined financial profile expected to result in accretion across key financial metrics Employees Offers exciting career development opportunities and participation in industry transformation

Mitel Q2 2017 Financial Summary July 27, 2017
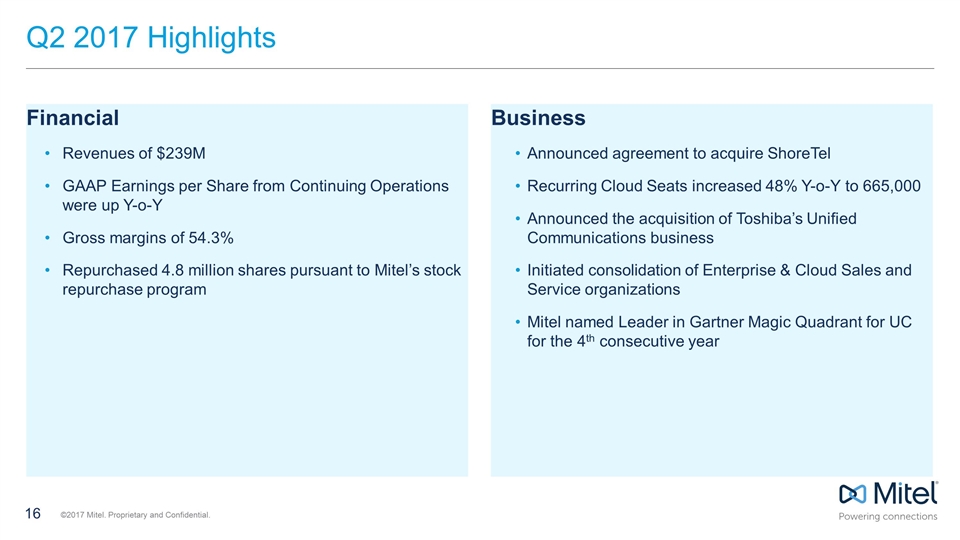
Q2 2017 Highlights Financial Revenues of $239M GAAP Earnings per Share from Continuing Operations were up Y-o-Y Gross margins of 54.3% Repurchased 4.8 million shares pursuant to Mitel’s stock repurchase program Business Announced agreement to acquire ShoreTel Recurring Cloud Seats increased 48% Y-o-Y to 665,000 Announced the acquisition of Toshiba’s Unified Communications business Initiated consolidation of Enterprise & Cloud Sales and Service organizations Mitel named Leader in Gartner Magic Quadrant for UC for the 4th consecutive year
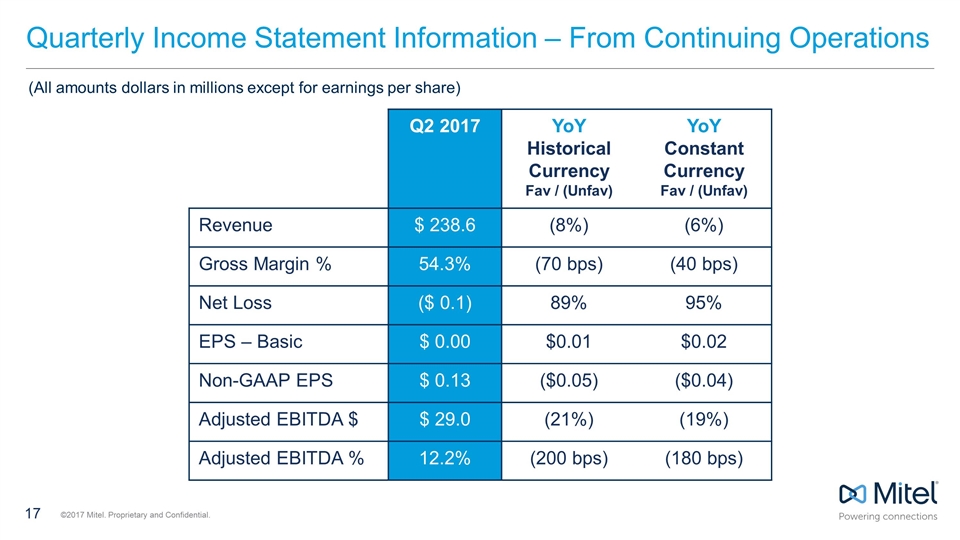
Quarterly Income Statement Information – From Continuing Operations Q2 2017 YoY Historical Currency Fav / (Unfav) YoY Constant Currency Fav / (Unfav) Revenue $ 238.6 (8%) (6%) Gross Margin % 54.3% (70 bps) (40 bps) Net Loss ($ 0.1) 89% 95% EPS – Basic $ 0.00 $0.01 $0.02 Non-GAAP EPS $ 0.13 ($0.05) ($0.04) Adjusted EBITDA $ $ 29.0 (21%) (19%) Adjusted EBITDA % 12.2% (200 bps) (180 bps) (All amounts dollars in millions except for earnings per share)
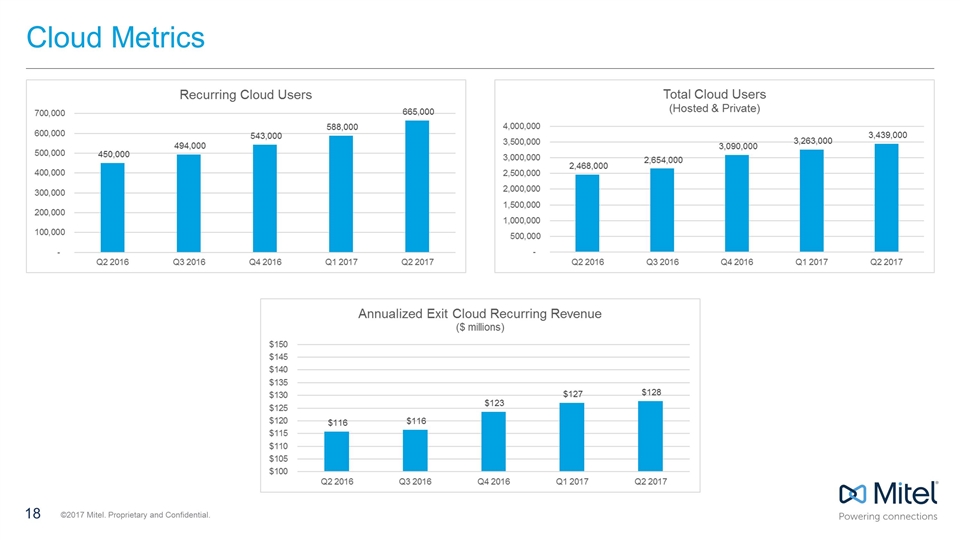
Cloud Metrics
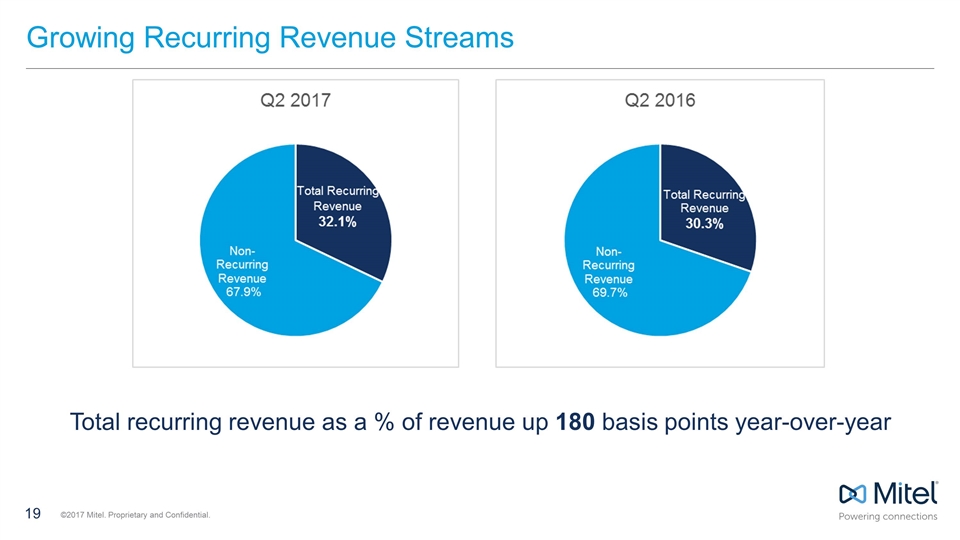
Growing Recurring Revenue Streams Total recurring revenue as a % of revenue up 180 basis points year-over-year
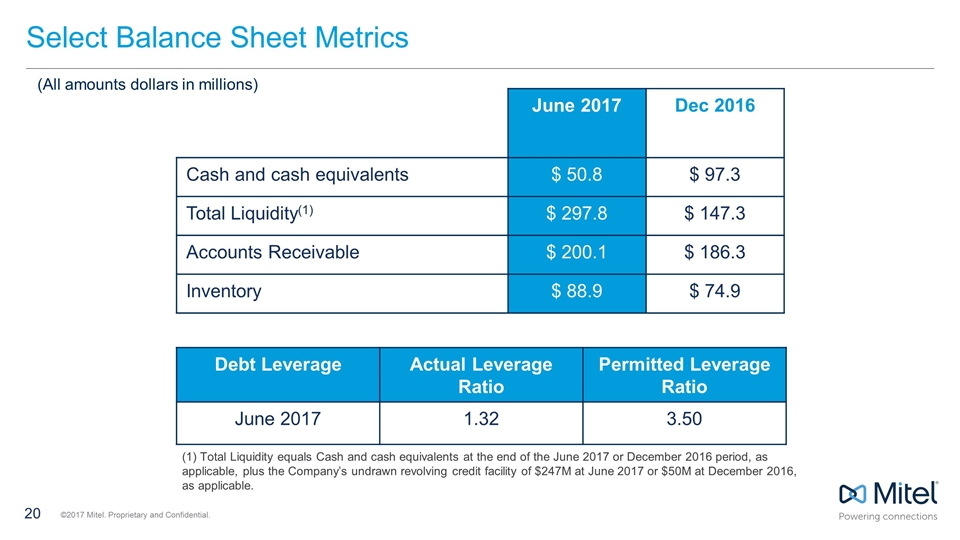
Select Balance Sheet Metrics June 2017 Dec 2016 Cash and cash equivalents $ 50.8 $ 97.3 Total Liquidity(1) $ 297.8 $ 147.3 Accounts Receivable $ 200.1 $ 186.3 Inventory $ 88.9 $ 74.9 (All amounts dollars in millions) Debt Leverage Actual Leverage Ratio Permitted Leverage Ratio June 2017 1.32 3.50 (1) Total Liquidity equals Cash and cash equivalents at the end of the June 2017 or December 2016 period, as applicable, plus the Company’s undrawn revolving credit facility of $247M at June 2017 or $50M at December 2016, as applicable.

Appendix
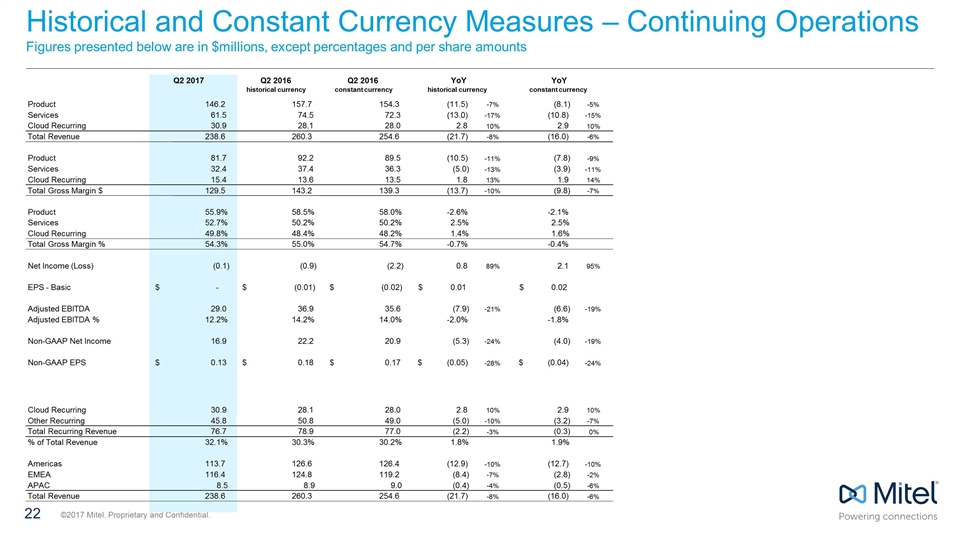
Historical and Constant Currency Measures – Continuing Operations Figures presented below are in $millions, except percentages and per share amounts Q2 2017 Q2 2016 Q2 2016 historical currency constant currency Product 146.2 157.7 154.3 (11.5) -7% (8.1) -5% Services 61.5 74.5 72.3 (13.0) -17% (10.8) -15% Cloud Recurring 30.9 28.1 28.0 2.8 10% 2.9 10% Total Revenue 238.6 260.3 254.6 (21.7) -8% (16.0) -6% Product 81.7 92.2 89.5 (10.5) -11% (7.8) -9% Services 32.4 37.4 36.3 (5.0) -13% (3.9) -11% Cloud Recurring 15.4 13.6 13.5 1.8 13% 1.9 14% Total Gross Margin $ 129.5 143.2 139.3 (13.7) -10% (9.8) -7% Product 55.9% 58.5% 58.0% -2.6% -2.1% Services 52.7% 50.2% 50.2% 2.5% 2.5% Cloud Recurring 49.8% 48.4% 48.2% 1.4% 1.6% Total Gross Margin % 54.3% 55.0% 54.7% -0.7% -0.4% Net Income (Loss) (0.1) (0.9) (2.2) 0.8 89% 2.1 95% EPS - Basic - $ (0.01) $ (0.02) $ 0.01 $ 0.02 $ Adjusted EBITDA 29.0 36.9 35.6 (7.9) -21% (6.6) -19% Adjusted EBITDA % 12.2% 14.2% 14.0% -2.0% -1.8% Non-GAAP Net Income 16.9 22.2 20.9 (5.3) -24% (4.0) -19% Non-GAAP EPS 0.13 $ 0.18 $ 0.17 $ (0.05) $ -28% (0.04) $ -24% Cloud Recurring 30.9 28.1 28.0 2.8 10% 2.9 10% Other Recurring 45.8 50.8 49.0 (5.0) -10% (3.2) -7% Total Recurring Revenue 76.7 78.9 77.0 (2.2) -3% (0.3) 0% % of Total Revenue 32.1% 30.3% 30.2% 1.8% 1.9% Americas 113.7 126.6 126.4 (12.9) -10% (12.7) -10% EMEA 116.4 124.8 119.2 (8.4) -7% (2.8) -2% APAC 8.5 8.9 9.0 (0.4) -4% (0.5) -6% Total Revenue 238.6 260.3 254.6 (21.7) -8% (16.0) -6% YoY historical currency YoY constant currency
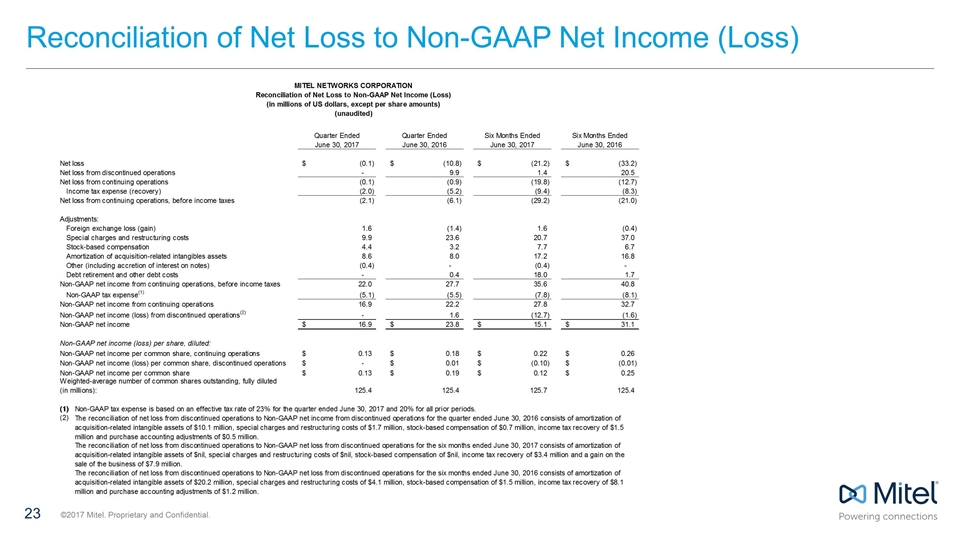
Reconciliation of Net Loss to Non-GAAP Net Income (Loss)
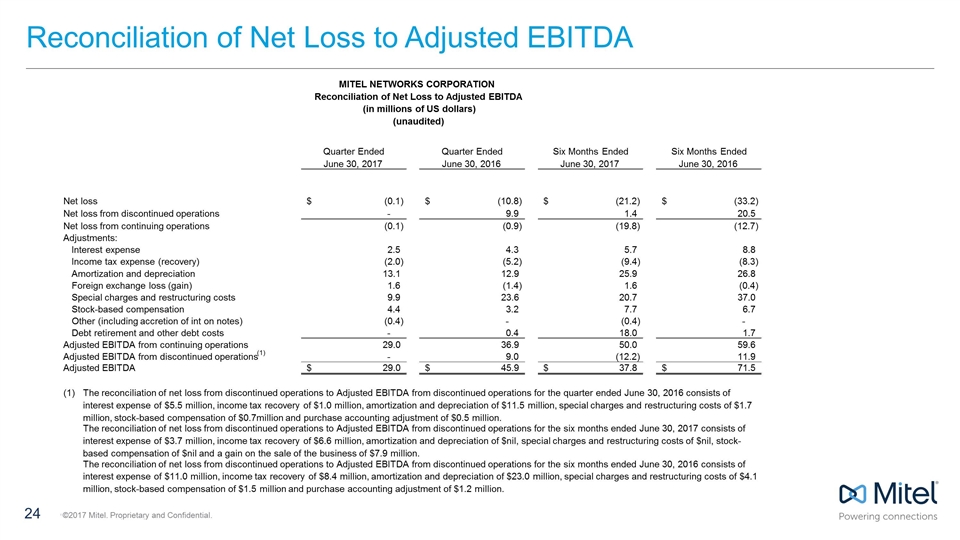
Reconciliation of Net Loss to Adjusted EBITDA Net loss (0.1) $ (10.8) $ (21.2) $ (33.2) $ Net loss from discontinued operations - 9.9 1.4 20.5 Net loss from continuing operations (0.1) (0.9) (19.8) (12.7) Adjustments: Interest expense 2.5 4.3 5.7 8.8 Income tax expense (recovery) (2.0) (5.2) (9.4) (8.3) Amortization and depreciation 13.1 12.9 25.9 26.8 Foreign exchange loss (gain) 1.6 (1.4) 1.6 (0.4) Special charges and restructuring costs 9.9 23.6 20.7 37.0 Stock-based compensation 4.4 3.2 7.7 6.7 Other (including accretion of int on notes) (0.4) - (0.4) - Debt retirement and other debt costs - 0.4 18.0 1.7 Adjusted EBITDA from continuing operations 29.0 36.9 50.0 59.6 Adjusted EBITDA from discontinued operations (1) - 9.0 (12.2) 11.9 Adjusted EBITDA 29.0 $ 45.9 $ 37.8 $ 71.5 $ (1) The reconciliation of net loss from discontinued operations to Adjusted EBITDA from discontinued operations for the six months ended June 30, 2016 consists of interest expense of $11.0 million, income tax recovery of $8.4 million, amortization and depreciation of $23.0 million, special charges and restructuring costs of $4.1 million, stock-based compensation of $1.5 million and purchase accounting adjustment of $1.2 million. Six Months Ended June 30, 2016 Six Months Ended June 30, 2017 MITEL NETWORKS CORPORATION Reconciliation of Net Loss to Adjusted EBITDA (in millions of US dollars) (unaudited) Quarter Ended June 30, 2017 Quarter Ended June 30, 2016 The reconciliation of net loss from discontinued operations to Adjusted EBITDA from discontinued operations for the quarter ended June 30, 2016 consists of interest expense of $5.5 million, income tax recovery of $1.0 million, amortization and depreciation of $11.5 million, special charges and restructuring costs of $1.7 million, stock-based compensation of $0.7million and purchase accounting adjustment of $0.5 million. The reconciliation of net loss from discontinued operations to Adjusted EBITDA from discontinued operations for the six months ended June 30, 2017 consists of interest expense of $3.7 million, income tax recovery of $6.6 million, amortization and depreciation of $nil, special charges and restructuring costs of $nil, stock- based compensation of $nil and a gain on the sale of the business of $7.9 million. ©2017 Mitel. Proprietary and Confidential.

Stronger Together
