Attached files
| file | filename |
|---|---|
| 8-K - FORM 8-K - WRKCo Inc. | f8k_080817.htm |
Exhibit 99.1

Jefferies 2017 Industrials Conference August 8, 2017
2 Forward Looking Statements This presentation contains forward - looking statements within the meaning of the Private Securities Litigation Reform Act of 1995 , including but not limited to the statements on the slides entitled “WestRock – Building a Paper and Packaging Leader”, “Q3 FY17 Land and Development Results”, “Synergy and Performance Improvements”, “Capital Allocated Since July 2015” and “Guidance”, that give g uid ance or estimates for future periods as well as statements regarding, among other things, that we expect a run - rate of $825 million i n synergy and performance improvements by end of FY17 and to achieve $1 billion goal by end of Q3 FY18; that the monetization program i s proceeding as planned; that with the portfolio changes we have made, we estimate our baseline maintenance and return generati ng capital expenditures will now be approximately $800 - $850 million per year; that we expect after - tax free cash flow of $150 - 175 million in fiscal 2017 and $275 - 300 million overall from monetization; that we expect FY17 Adjusted Free Cash Flow of $1.2 billion; and we estimat e FY17 capex of $750 million. Forward - looking statements are based on our current expectations, beliefs, plans or forecasts and are typically identified by wo rds or phrases such as "may," "will," "could," "should," "would," "anticipate," "estimate," "expect," "project," "intend," "plan," " bel ieve," "target," "prospects," "potential" and "forecast," and other words, terms and phrases of similar meaning. Forward - looking statements invol ve estimates, expectations, projections, goals, forecasts, assumptions, risks and uncertainties. WestRock cautions readers that a f orward - looking statement is not a guarantee of future performance and that actual results could differ materially from those contain ed in the forward - looking statement. Forward - looking statements are subject to a number of factors, including economic, competitive and ma rket conditions generally; volumes and price levels of purchases by customers; competitive conditions in WestRock's businesses and po ssible adverse actions of their customers, competitors and suppliers. Further, WestRock's businesses are subject to a number of gene ral risks that would affect any such forward - looking statements. Such risks and other factors that may impact management's assumptions are more particularly described in our filings with the Securities and Exchange Commission, including in Item 1A under the caption "Ri sk Factors" in our Annual Report on Form 10 - K for the year ended September 30, 2016 and our Form 10 - Q for the quarter ended March 31, 2017. The information contained herein speaks as of the date hereof and WestRock does not have or undertake any obligation to update or re vise its forward - looking statements, whether as a result of new information, future events or otherwise.

3 Disclaimer; Non - GAAP Financial Measures We may from time to time be in possession of certain information regarding WestRock that applicable law would not require us to disclose to the public in the ordinary course of business, but would require us to disclose if we were engaged in the purchase or sale of our securities. This presentation shall not be considered to be part of any solicitation of an offer to buy or sell WestRock securities. This presentation also may not include all of the information regarding WestRock that you may need to make an investment decision regarding WestRock securities. Any investment decision should be made on the basis of the total mix of information regarding WestRock that is publicly available as of the date of the decision. We report our financial results in accordance with accounting principles generally accepted in the United States ("GAAP"). However, management believes certain non - GAAP financial measures provide users with additional meaningful financial information that should be considered when assessing our ongoing performance. Management also uses these non - GAAP financial measures in making financial, operating and planning decisions and in evaluating our performance. Non - GAAP financial measures should be viewed in addition to, and not as an alternative for, our GAAP results. The non - GAAP financial measures we present may differ from similarly captioned measures presented by other companies. See the Appendix for details about these non - GAAP financial measures, as well as the required reconciliations.
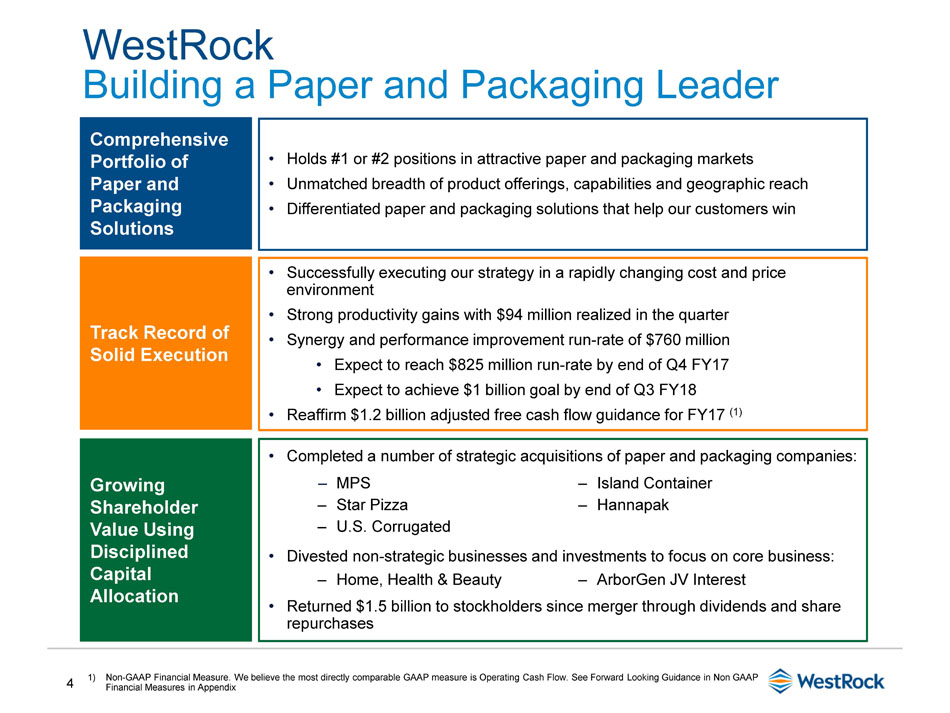
4 WestRock Building a Paper and Packaging Leader 1) Non - GAAP Financial Measure. We believe the most directly comparable GAAP measure is Operating Cash Flow. See Forward Looking Gui dance in Non GAAP Financial Measures in Appendix Comprehensive Portfolio of Paper and Packaging Solutions • Holds #1 or #2 positions in attractive paper and packaging markets • Unmatched breadth of product offerings, capabilities and geographic reach • Differentiated paper and packaging solutions that help our customers win Track Record of Solid Execution • Successfully executing our strategy in a rapidly changing cost and price environment • Strong productivity gains with $94 million realized in the quarter • Synergy and performance improvement run - rate of $ 760 million • Expect to reach $825 million run - rate by end of Q4 FY17 • Expect to achieve $1 billion goal by end of Q3 FY18 • Reaffirm $1.2 billion adjusted free cash flow guidance for FY17 (1) Growing Shareholder Value Using Disciplined Capital Allocation • Completed a number of strategic acquisitions of paper and packaging companies: • Divested non - strategic businesses and investments to focus on core business: • Returned $1.5 billion to stockholders since merger through dividends and share repurchases ‒ Home, Health & Beauty ‒ ArborGen JV Interest ‒ MPS ‒ Star Pizza ‒ U.S. Corrugated ‒ Island Container ‒ Hannapak

5 Focusing and Building the WestRock Portfolio MARCH 2017 Acquired Star Pizza Corrugated Packaging Acquired MPS Specialty Packaging JUNE 2017 JUNE 2017 Acquired U.S. Corrugated facilities Corrugated Packaging Completed sale of HH&B to Silgan APRIL 2017 JULY 2017 Acquired Island Container Corrugated Packaging AUGUST 2017 Acquired Hannapak Consumer Packaging JUNE 2017 Completed sale of ArborGen JV Interest 2016 (1) 1) FY2016 transactions include the acquisitions of SP Fiber and Cenveo Packaging, the joint venture with Grupo Gondi and the sep ara tion of Ingevity
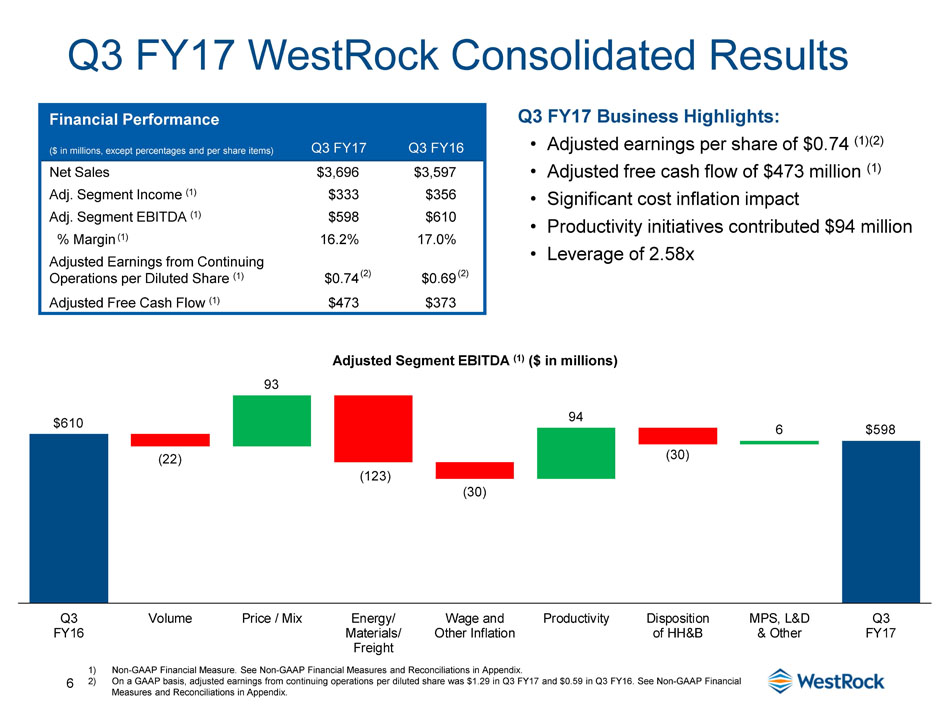
6 Q3 FY17 WestRock Consolidated Results 1) Non - GAAP Financial Measure. See Non - GAAP Financial Measures and Reconciliations in Appendix. 2) On a GAAP basis, adjusted earnings from continuing operations per diluted share was $1.29 in Q3 FY17 and $0.59 in Q3 FY16. See Non - GAAP Financial Measures and Reconciliations in Appendix. Q3 FY17 Business Highlights: • Adjusted earnings per share of $0.74 (1)(2) • Adjusted free cash flow of $473 million (1) • Significant cost inflation impact • Productivity initiatives contributed $ 94 million • Leverage of 2.58x Financial Performance ($ in millions, except percentages and per share items) Q3 FY17 Q3 FY16 Net Sales $3,696 $3,597 Adj. Segment Income (1) $333 $356 Adj. Segment EBITDA (1) $598 $610 % Margin (1) 16.2% 17.0% Adjusted Earnings from Continuing Operations per Diluted Share (1) $0.74 $0.69 Adjusted Free Cash Flow (1) $473 $373 Adjusted Segment EBITDA (1) ($ in millions) $610 93 94 6 $598 (22) (123) (30) (30) Q3 FY16 Volume Price / Mix Energy/ Materials/ Freight Wage and Other Inflation Productivity Disposition of HH&B MPS, L&D & Other Q3 FY17 (2) (2)

7 $165 million $580 million $675 million $760 million $825 million $1 billion $255 million $350 million $425 million $500 million Q4 FY15 Q1 FY16 Q2 FY16 Q3 FY16 Q4 FY16 Q1 FY17 Q2 FY17 Q3 FY17 Q4 FY17 Q3 FY18 Synergy and Performance Improvements On track to achieve $1 billion objective by end of Q3 FY18 • Achieved annualized run - rate of $ 760 million at 6/30 • Estimate annualized run - rate of $825 million by end of FY17 Q3 FY17 PROGRESS (1) (1) 35% 29% 26% 10% Procurement Capital Investment Ongoing Productivity Corporate & Support $1 billion RUN - RATE AT 6/30/17 THREE YEAR GOAL $760 million 10% 25% 30% 35% Corporate & Support Capital Investment Ongoing Productivity Procurement

8 ▪ FY17 estimate of approx. $750 million ▪ Maintenance capital expenditures: 60% ▪ Strategic, return - generating capital expenditures: 40% ▪ YTD Q3 FY17: $537 million ▪ With the portfolio changes we have made, we estimate our baseline maintenance and return generating CapEx will now be approximately $800 - $850 million per year CapEx $1.6 billion ▪ 15.3 million shares repurchased to date ▪ 6% of shares outstanding Repurchases $756 million Capital Allocated Since July 2015 (1) 1) Excludes RKT - MWV merger - related share repurchases of $668 million. Acquisitions: JV with Grupo Gondi Divestitures: M&A $2.1 billion ▪ Annual dividend of $1.60 per share ▪ Increased annual dividend by 6.7% in November 2016 ▪ Ingevity spin - off (non - cash; current market value of $2.5 billion) Dividends $780 million $5.2 billion ▪ SP Fiber ▪ Cenveo Packaging ▪ Star Pizza ▪ MPS ▪ U.S. Corrugated ▪ L&D monetization ▪ HH&B ▪ ArborGen JV
Appendix
10 Non - GAAP Financial Measures Credit Agreement EBITDA “Credit Agreement EBITDA” is calculated in accordance with the definition contained in our Credit Agreement. Credit Agreement EBITDA is generally defined as Consolidated Net Income plus: consolidated interest expense, income taxes of the consolidated companies det ermined in accordance with GAAP, depreciation and amortization expense of the consolidated companies determined in accordance with GAAP, lo ss on extinguishment of debt and financing fees, certain non - cash and cash charges incurred, including goodwill impairment, certain re structuring and other costs, merger / acquisition and integration costs, charges and expenses associated with the write - up of inventory acquired and other items. LTM Credit Agreement EBITDA margin is calculated by dividing LTM Credit Agreement EBITDA by Net Sales adjusted for Tra de Sales. Adjusted Free Cash Flow Free Cash Flow is defined as Cash Provided by Operating Activities, excluding after - tax cash restructuring costs minus capital e xpenditures. We believe the most directly comparable GAAP measure is net cash provided by operating activities. Management believes this i s a n important measure in evaluating our financial performance and measures our ability to generate cash without incurring additional extern al financings. Total Funded Debt and Leverage Ratio “Total Funded Debt” is calculated in accordance with the definition contained in our Credit Agreement. Total Funded Debt is g ene rally defined as aggregate debt obligations reflected in our balance sheet less the stepped up value of said debt, less non - recourse debt exce pt for Securitization related debt, less trade payables related debt that may be recharacterized as debt, less insurance policy loan s t o the extent offset by assets of the applicable insurance policies, obligations with the hedge adjustments resulting from terminated and existing fa ir value interest rate derivatives or swaps, if any, less certain cash, plus additional outstanding letters of credit not already reflected in deb t and certain guarantees. Our management uses Credit Agreement EBITDA and Total Funded Debt to evaluate compliance with our debt covenants and borrowin g capacity available under our Credit Agreement, as a measure of operating performance and to compare to our target Leverage Ra tio of 2.25x – 2.50x. Management believes that investors also use these measures to evaluate our compliance with our debt covenants and avai lab le borrowing capacity. Borrowing capacity is dependent upon, in addition to other measures, the “Credit Agreeme nt Debt/EBITDA ratio” or the “Leverage Ratio,” which is defined as Total Funded Debt divided by Credit Agreement EBITDA. As of the June 30, 2017 calculati on, our Leverage Ratio was 2.58 times. While the Leverage Ratio under the Credit Agreement determines the credit spread on our debt we are not subject to a Leverage Ratio cap. The Credit Agreement is subject to a Debt to Capitalization and Consolidated Interest Covera ge Ratio, as defined in the Credit Agreement.
11 Non - GAAP Financial Measures (cont.) Adjusted Segment EBITDA Margins Our management uses “Adjusted Segment EBITDA Margins”, along with other factors, to evaluate our segment performance against our peers. Management believes that investors also use this measure to evaluate our performance relative to our peers. “Adjusted Segment EB ITDA Margin” is calculated for each segment by dividing that segment’s Adjusted Segment EBITDA by Adjusted Segment Sales. “Adjuste d S egment EBITDA” is calculated for each segment by adding that segment’s “Adjusted Segment Income” to its Depreciation, Depletion and Amo rtization. Adjusted Earnings Per Diluted Share We also use the non - GAAP measure “adjusted earnings per diluted share,” also referred to as “adjusted earnings per share” or “Ad justed EPS.” Management believes this non - GAAP financial measure provides our board of directors, investors, potential investors, securities analysts and others with useful information to evaluate our performance because it excludes restructuring and other costs, net, and other spe cific items that management believes are not indicative of the ongoing operating results of the business. We and our board of directors use th is information to evaluate our performance relative to other periods. Forward - looking Guidance We are not providing forward - looking guidance for U.S. GAAP reported financial measures or a reconciliation of forward - looking n on - GAAP financial measures to the most directly comparable U.S. GAAP measure because it is unable to predict with reasonable certaint y t he ultimate outcome of certain significant items without unreasonable effort. These items include, but are not limited to, merger and acq uis ition - related expenses, restructuring expenses, asset impairments, litigation settlements, changes to contingent consideration and certain oth er gains or losses. These items are uncertain, depend on various factors, and could have a material impact on U.S. GAAP reported results for the guidance period.
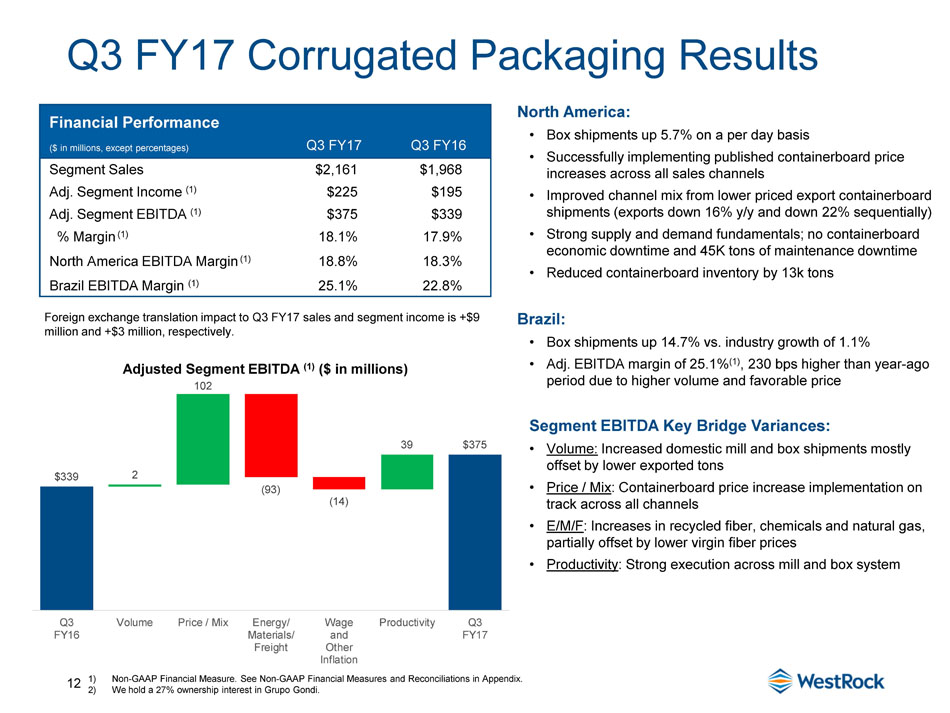
12 Q3 FY17 Corrugated Packaging Results 1) Non - GAAP Financial Measure. See Non - GAAP Financial Measures and Reconciliations in Appendix. 2) We hold a 27% ownership interest in Grupo Gondi. North America: • Box shipments up 5.7% on a per day basis • Successfully implementing published containerboard price increases across all sales channels • Improved channel mix from lower priced export containerboard shipments (exports down 16% y/y and down 22% sequentially) • Strong supply and demand fundamentals; no containerboard economic downtime and 45K tons of maintenance downtime • Reduced containerboard inventory by 13k tons Brazil: • Box shipments up 14.7% vs. industry growth of 1.1% • Adj. EBITDA margin of 25.1% (1) , 230 bps higher than year - ago period due to higher volume and favorable price Segment EBITDA Key Bridge Variances: • Volume: Increased domestic mill and box shipments mostly offset by lower exported tons • Price / Mix : Containerboard price increase implementation on track across all channels • E/M/F : Increases in recycled fiber, chemicals and natural gas, partially offset by lower virgin fiber prices • Productivity : Strong execution across mill and box system Financial Performance ($ in millions, except percentages) Q3 FY17 Q3 FY16 Segment Sales $2,161 $1,968 Adj. Segment Income (1) $225 $195 Adj. Segment EBITDA (1) $375 $339 % Margin (1) 18.1% 17.9% North America EBITDA Margin (1) 18.8% 18.3% Brazil EBITDA Margin (1) 25.1% 22.8% Adjusted Segment EBITDA (1) ($ in millions) Foreign exchange translation impact to Q3 FY17 sales and segment income is +$9 million and +$3 million, respectively. $339 2 102 39 $375 (93) (14) Q3 FY16 Volume Price / Mix Energy/ Materials/ Freight Wage and Other Inflation Productivity Q3 FY17
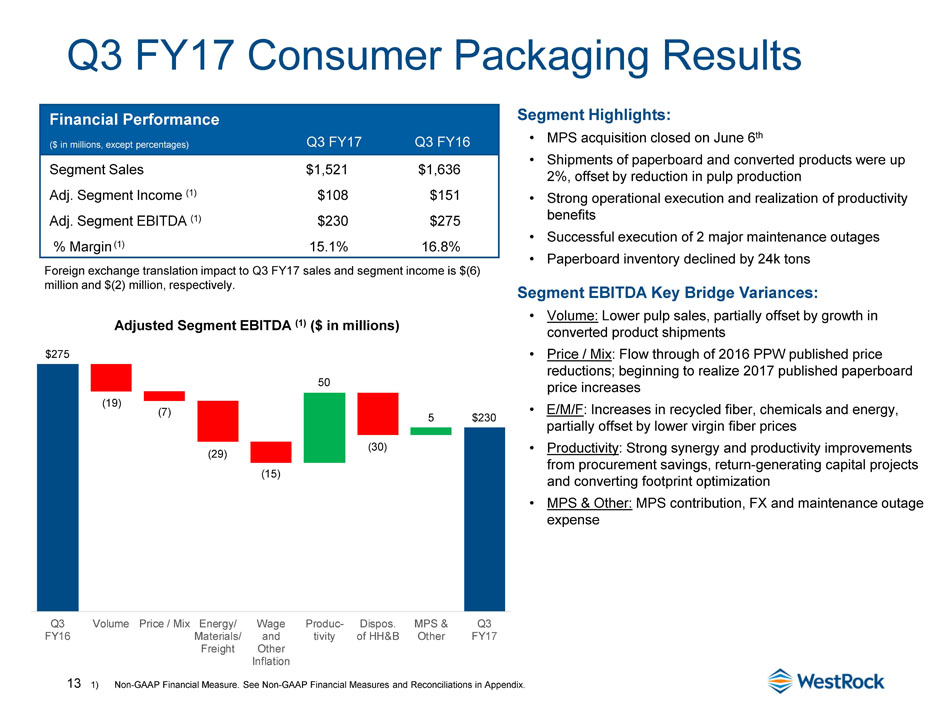
13 Q3 FY17 Consumer Packaging Results 1) Non - GAAP Financial Measure. See Non - GAAP Financial Measures and Reconciliations in Appendix. Segment Highlights: • MPS acquisition closed on June 6 th • Shipments of paperboard and converted products were up 2%, offset by reduction in pulp production • Strong operational execution and realization of productivity benefits • Successful execution of 2 major maintenance outages • Paperboard inventory declined by 24k tons Segment EBITDA Key Bridge Variances: • Volume: Lower pulp sales, partially offset by growth in converted product shipments • Price / Mix : F low through of 2016 PPW published price reductions; beginning to realize 2017 published paperboard price increases • E/M/F : Increases in recycled fiber, chemicals and energy, partially offset by lower virgin fiber prices • Productivity : Strong synergy and productivity improvements from procurement savings, return - generating capital projects and converting footprint optimization • MPS & Other: MPS contribution, FX and maintenance outage expense Financial Performance ($ in millions, except percentages) Q3 FY17 Q3 FY16 Segment Sales $1,521 $1,636 Adj. Segment Income (1) $108 $151 Adj. Segment EBITDA (1) $230 $275 % Margin (1) 15.1% 16.8% Adjusted Segment EBITDA (1) ($ in millions) Foreign exchange translation impact to Q3 FY17 sales and segment income is $(6) million and $(2) million, respectively. $275 50 5 $230 (19) (7) (29) (15) (30) Q3 FY16 Volume Price / Mix Energy/ Materials/ Freight Wage and Other Inflation Produc- tivity Dispos. of HH&B MPS & Other Q3 FY17

14 Business Performance Highlights: • Strong sales quarter in monetizing large East Edisto land tract, industrial properties and other assets Update on Accelerated Monetization Activity: • The monetization program is proceeding as planned • Reaffirm after - tax free cash flow to WestRock of $275 to $300 million by end of FY18 • Expect approximately $150 to $175 million of after - tax free cash flow in FY17 Q3 FY17 Land and Development Results Financial Performance ($ in millions) Q3 FY17 Q3 FY16 Segment Sales $71 $42 Segment Income $0 $10
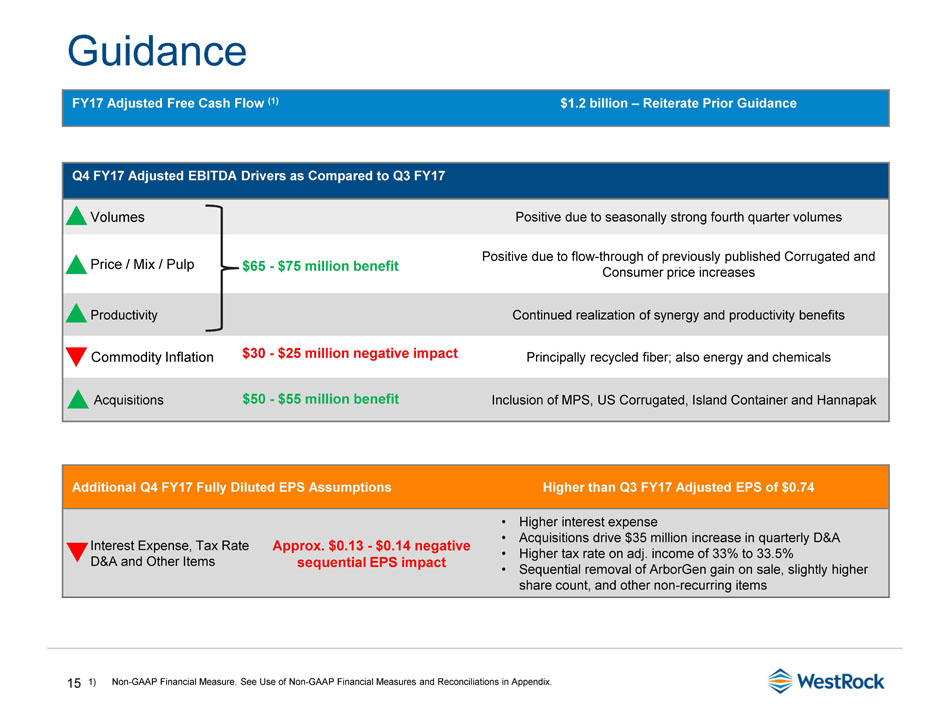
15 Guidance 1) Non - GAAP Financial Measure. See Use of Non - GAAP Financial Measures and Reconciliations in Appendix. FY 17 Adjusted Free Cash Flow (1) $1.2 billion – Reiterate Prior Guidance Q4 FY17 Adjusted EBITDA Drivers as Compared to Q3 FY17 Volumes Positive due to seasonally strong fourth quarter volumes Price / Mix / Pulp Positive due to flow - through of previously published Corrugated and Consumer price increases Productivity Continued realization of synergy and productivity benefits Commodity Inflation Principally recycled fiber; also energy and chemicals Acquisitions Inclusion of MPS, US Corrugated, Island Container and Hannapak Additional Q4 FY17 Fully Diluted EPS Assumptions Higher than Q3 FY17 Adjusted EPS of $0.74 Interest Expense, Tax Rate D&A and Other Items • Higher interest expense • Acquisitions drive $35 million increase in quarterly D&A • Higher tax rate on adj. income of 33% to 33.5% • Sequential removal of ArborGen gain on sale, slightly higher share count, and other non - recurring items $65 - $75 million benefit $ 50 - $55 million benefit $30 - $25 million negative impact Approx. $0.13 - $0.14 negative sequential EPS impact
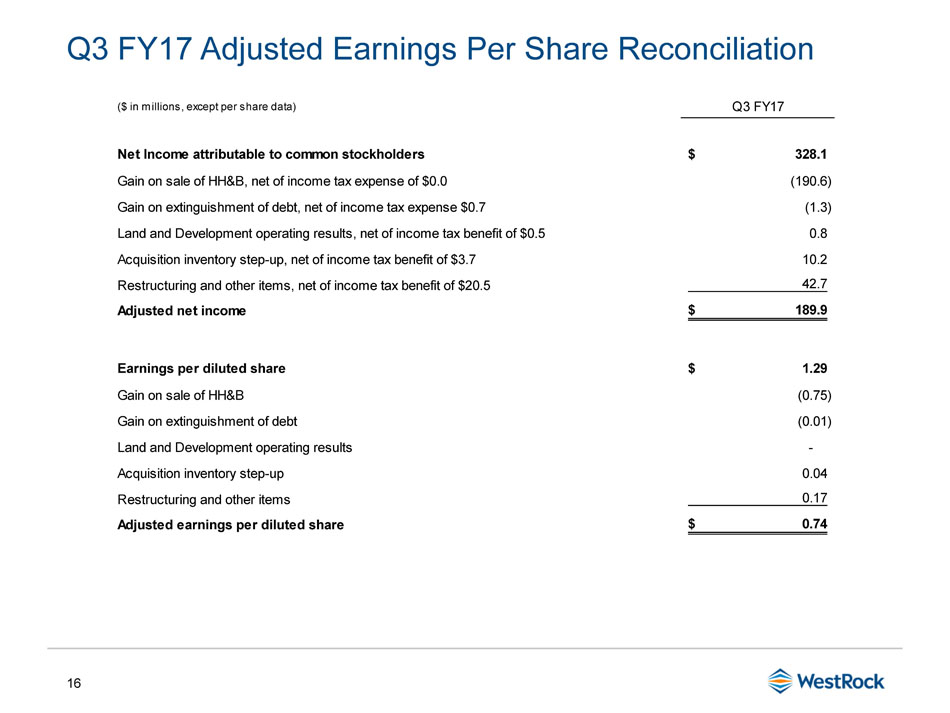
16 Q3 FY17 Adjusted Earnings Per Share Reconciliation ($ in millions, except per share data) Q3 FY17 Net Income attributable to common stockholders 328.1$ Gain on sale of HH&B, net of income tax expense of $0.0 (190.6) Gain on extinguishment of debt, net of income tax expense $0.7 (1.3) Land and Development operating results, net of income tax benefit of $0.5 0.8 Acquisition inventory step-up, net of income tax benefit of $3.7 10.2 Restructuring and other items, net of income tax benefit of $20.5 42.7 Adjusted net income 189.9$ Earnings per diluted share 1.29$ Gain on sale of HH&B (0.75) Gain on extinguishment of debt (0.01) Land and Development operating results - Acquisition inventory step-up 0.04 Restructuring and other items 0.17 Adjusted earnings per diluted share 0.74$
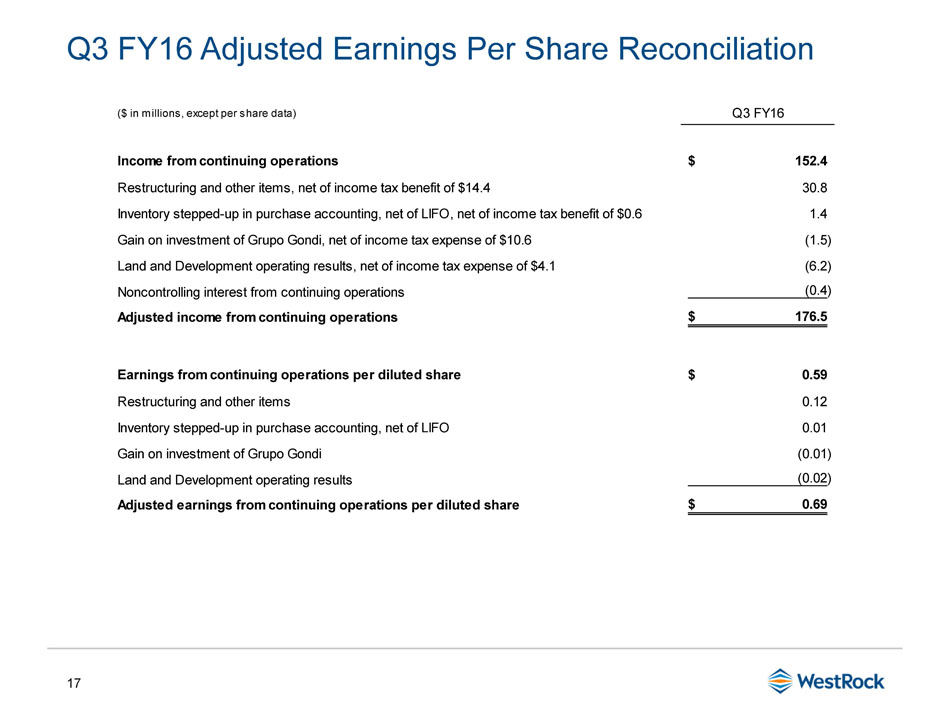
17 Q3 FY16 Adjusted Earnings Per Share Reconciliation ($ in millions, except per share data) Q3 FY16 Income from continuing operations 152.4$ Restructuring and other items, net of income tax benefit of $14.4 30.8 Inventory stepped-up in purchase accounting, net of LIFO, net of income tax benefit of $0.6 1.4 Gain on investment of Grupo Gondi, net of income tax expense of $10.6 (1.5) Land and Development operating results, net of income tax expense of $4.1 (6.2) Noncontrolling interest from continuing operations (0.4) Adjusted income from continuing operations 176.5$ Earnings from continuing operations per diluted share 0.59$ Restructuring and other items 0.12 Inventory stepped-up in purchase accounting, net of LIFO 0.01 Gain on investment of Grupo Gondi (0.01) Land and Development operating results (0.02) Adjusted earnings from continuing operations per diluted share 0.69$
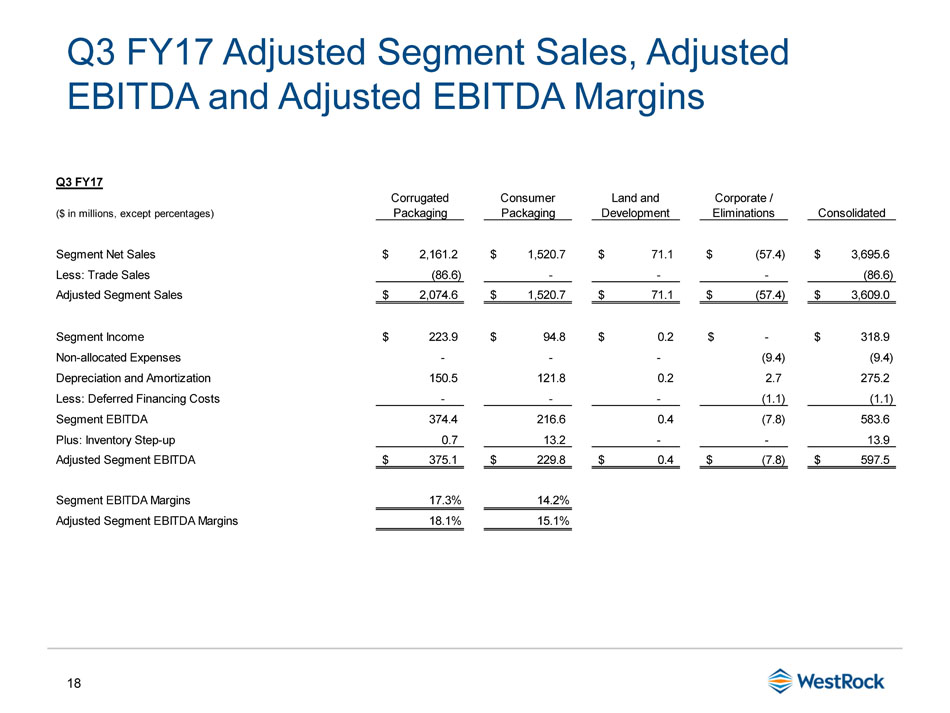
18 Q3 FY17 Adjusted Segment Sales, Adjusted EBITDA and Adjusted EBITDA Margins Q3 FY17 ($ in millions, except percentages) Corrugated Packaging Consumer Packaging Land and Development Corporate / Eliminations Consolidated Segment Net Sales 2,161.2$ 1,520.7$ 71.1$ (57.4)$ 3,695.6$ Less: Trade Sales (86.6) - - - (86.6) Adjusted Segment Sales 2,074.6$ 1,520.7$ 71.1$ (57.4)$ 3,609.0$ Segment Income 223.9$ 94.8$ 0.2$ -$ 318.9$ Non-allocated Expenses - - - (9.4) (9.4) Depreciation and Amortization 150.5 121.8 0.2 2.7 275.2 Less: Deferred Financing Costs - - - (1.1) (1.1) Segment EBITDA 374.4 216.6 0.4 (7.8) 583.6 Plus: Inventory Step-up 0.7 13.2 - - 13.9 Adjusted Segment EBITDA 375.1$ 229.8$ 0.4$ (7.8)$ 597.5$ Segment EBITDA Margins 17.3% 14.2% Adjusted Segment EBITDA Margins 18.1% 15.1%
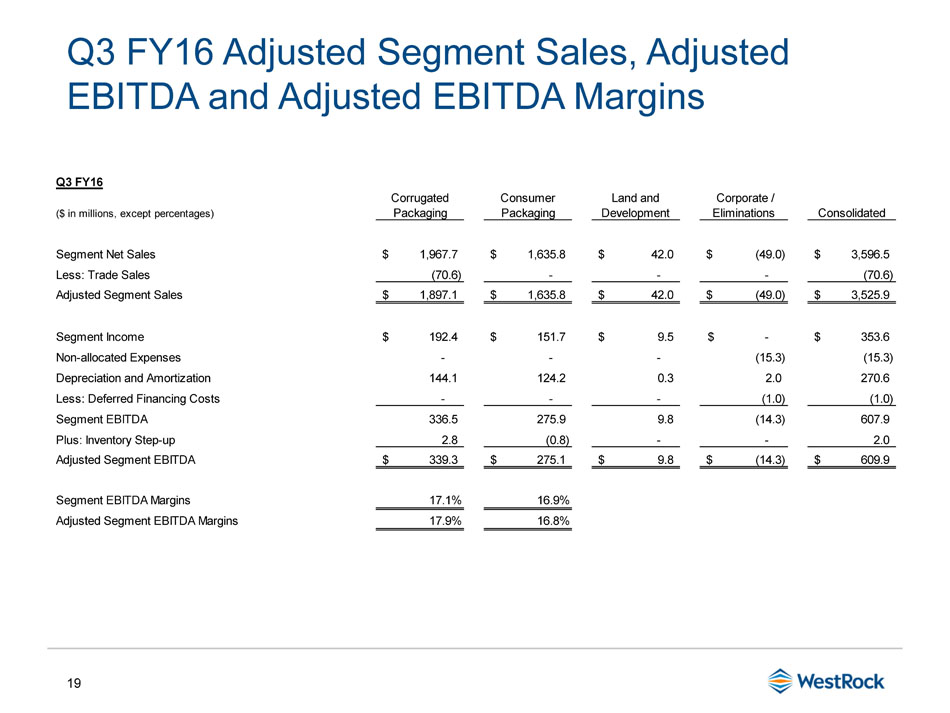
19 Q3 FY16 Adjusted Segment Sales, Adjusted EBITDA and Adjusted EBITDA Margins Q3 FY16 ($ in millions, except percentages) Corrugated Packaging Consumer Packaging Land and Development Corporate / Eliminations Consolidated Segment Net Sales 1,967.7$ 1,635.8$ 42.0$ (49.0)$ 3,596.5$ Less: Trade Sales (70.6) - - - (70.6) Adjusted Segment Sales 1,897.1$ 1,635.8$ 42.0$ (49.0)$ 3,525.9$ Segment Income 192.4$ 151.7$ 9.5$ -$ 353.6$ Non-allocated Expenses - - - (15.3) (15.3) Depreciation and Amortization 144.1 124.2 0.3 2.0 270.6 Less: Deferred Financing Costs - - - (1.0) (1.0) Segment EBITDA 336.5 275.9 9.8 (14.3) 607.9 Plus: Inventory Step-up 2.8 (0.8) - - 2.0 Adjusted Segment EBITDA 339.3$ 275.1$ 9.8$ (14.3)$ 609.9$ Segment EBITDA Margins 17.1% 16.9% Adjusted Segment EBITDA Margins 17.9% 16.8%
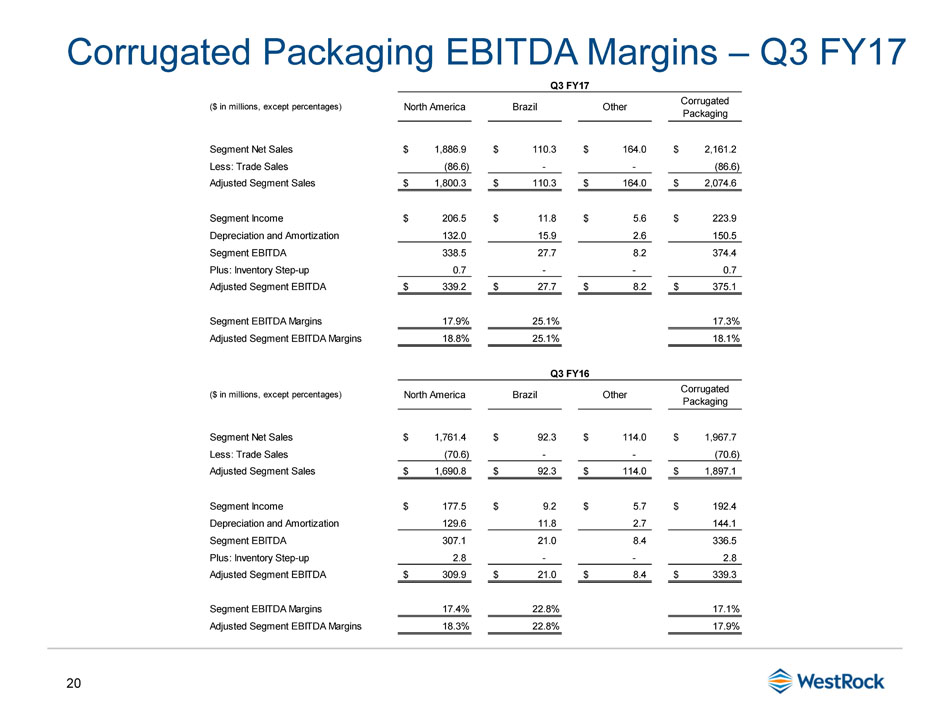
20 Corrugated Packaging EBITDA Margins – Q3 FY17 ($ in millions, except percentages) North America Brazil Other Corrugated Packaging Segment Net Sales 1,886.9$ 110.3$ 164.0$ 2,161.2$ Less: Trade Sales (86.6) - - (86.6) Adjusted Segment Sales 1,800.3$ 110.3$ 164.0$ 2,074.6$ Segment Income 206.5$ 11.8$ 5.6$ 223.9$ Depreciation and Amortization 132.0 15.9 2.6 150.5 Segment EBITDA 338.5 27.7 8.2 374.4 Plus: Inventory Step-up 0.7 - - 0.7 Adjusted Segment EBITDA 339.2$ 27.7$ 8.2$ 375.1$ Segment EBITDA Margins 17.9% 25.1% 17.3% Adjusted Segment EBITDA Margins 18.8% 25.1% 18.1% ($ in millions, except percentages) North America Brazil Other Corrugated Packaging Segment Net Sales 1,761.4$ 92.3$ 114.0$ 1,967.7$ Less: Trade Sales (70.6) - - (70.6) Adjusted Segment Sales 1,690.8$ 92.3$ 114.0$ 1,897.1$ Segment Income 177.5$ 9.2$ 5.7$ 192.4$ Depreciation and Amortization 129.6 11.8 2.7 144.1 Segment EBITDA 307.1 21.0 8.4 336.5 Plus: Inventory Step-up 2.8 - - 2.8 Adjusted Segment EBITDA 309.9$ 21.0$ 8.4$ 339.3$ Segment EBITDA Margins 17.4% 22.8% 17.1% Adjusted Segment EBITDA Margins 18.3% 22.8% 17.9% Q3 FY17 Q3 FY16

21 Corrugated Packaging EBITDA Margins – Q2 FY17 ($ in millions, except percentages) North America Brazil Other Corrugated Packaging Segment Net Sales 1,807.3$ 104.7$ 153.0$ 2,065.0$ Less: Trade Sales (72.0) - - (72.0) Adjusted Segment Sales 1,735.3$ 104.7$ 153.0$ 1,993.0$ Segment Income 146.7$ 5.8$ 7.0$ 159.5$ Depreciation and Amortization 128.2 14.5 2.6 145.3 Segment EBITDA 274.9 20.3 9.6 304.8 Plus: Inventory Step-up 0.5 - - 0.5 Adjusted Segment EBITDA 275.4$ 20.3$ 9.6$ 305.3$ Segment EBITDA Margins 15.2% 19.4% 14.8% Adjusted Segment EBITDA Margins 15.9% 19.4% 15.3% ($ in millions, except percentages) North America Brazil Other Corrugated Packaging Segment Net Sales 1,740.9$ 80.8$ 111.1$ 1,932.8$ Less: Trade Sales (67.4) - - (67.4) Adjusted Segment Sales 1,673.5$ 80.8$ 111.1$ 1,865.4$ Segment Income 166.3$ 6.6$ 2.1$ 175.0$ Depreciation and Amortization 126.0 12.0 2.8 140.8 Segment EBITDA 292.3 18.6 4.9 315.8 Plus: Inventory Step-up - - - - Adjusted Segment EBITDA 292.3$ 18.6$ 4.9$ 315.8$ Segment EBITDA Margins 16.8% 23.0% 16.3% Adjusted Segment EBITDA Margins 17.5% 23.0% 16.9% Q2 FY17 Q2 FY16

22 Q3 FY17 Packaging Shipments Results (1) 1) Combined RKT and MWV shipments for Q1 FY15 to Q3 FY15. 2) Recast to exclude box plants contributed to Grupo Gondi prior to Q3 FY16. 3) Combined North America, Brazil and India shipments. Corrugated Packaging North America Corrugated Unit Q1 Q2 Q3 Q4 Q1 Q2 Q3 Q4 Q1 Q2 Q3 External Box, Containerboard & Kraft Paper Shipments Thousands of tons 1,908.2 1,877.1 1,953.0 1,934.0 1,940.6 1,969.2 2,019.8 2,063.5 1,951.8 2,049.5 2,030.7 Newsprint Shipments Thousands of tons - - - - 26.0 - - - - - - Pulp Shipments Thousands of tons 87.6 59.6 79.6 84.0 80.1 71.1 94.3 89.7 80.1 66.6 82.0 Total North American Corrugated Packaging Shipments Thousands of tons 1,995.8 1,936.7 2,032.6 2,018.0 2,046.7 2,040.3 2,114.1 2,153.2 2,031.9 2,116.1 2,112.7 Corrugated Container Shipments (2) Billions of square feet 18.2 18.1 18.8 18.7 18.7 18.2 18.6 18.9 18.8 18.7 19.4 Corrugated Container Shipments per Shipping Day (2) Millions of square feet 297.7 292.6 298.7 292.6 306.3 288.6 291.4 294.5 312.9 291.9 308.0 Corrugated Packaging Maintenance Downtime Thousands of tons 68.5 79.6 104.1 3.1 119.9 68.1 60.5 32.2 115.4 77.8 45.1 Corrugated Packaging Economic Downtime Thousands of tons 53.1 24.5 29.5 83.9 144.0 30.1 71.7 - 0.1 - - Brazil and India Corrugated Packaging Shipments Thousands of tons 166.5 168.2 175.1 171.4 180.2 173.5 166.8 164.8 151.0 171.0 178.8 Corrugated Container Shipments Billions of square feet 1.4 1.4 1.5 1.4 1.5 1.3 1.4 1.6 1.5 1.6 1.6 Corrugated Container Shipments per Shipping Day Millions of square feet 18.7 20.4 19.9 18.1 19.2 18.1 18.7 19.8 20.4 20.2 21.3 Total Corrugated Packaging Segment Shipments (3) Thousands of tons 2,162.3 2,104.9 2,207.7 2,189.4 2,226.9 2,213.8 2,280.9 2,318.0 2,182.9 2,287.1 2,291.5 Consumer Packaging WestRock Consumer Packaging Paperboard and Converting Shipments Thousands of tons 871.0 875.4 955.3 955.1 876.0 898.3 911.0 929.9 879.0 906.8 929.3 Pulp Shipments Thousands of tons 68.3 45.6 60.7 88.8 73.3 76.1 75.3 68.8 37.5 40.2 27.9 Total Consumer Packaging Segment Shipments Thousands of tons 939.3 921.0 1,016.0 1,043.9 949.3 974.4 986.3 998.7 916.5 947.0 957.2 Consumer Packaging Converting Shipments Billions of square feet 8.6 8.6 9.2 9.2 8.8 9.0 9.5 9.4 9.0 8.9 9.9 FY15 FY16 FY17 Scheduled Maintenance Downtime – North America Q1 FY17 Q2 FY17 Q3 FY17 Q4 FY17 Total FY17 Corrugated Mills 115K 78K 45K 16K 254K Consumer Mills 31K 3K 48K 3K 85K

23 Q3 FY17 LTM Credit Agreement EBITDA 1) Additional Permitted Charges includes among other items, $208 million of restructuring and other costs and $16 million pre - tax e xpense for inventory stepped - up in purchase accounting. ($ in millions) Q3 FY17 LTM Income from Continuing Operations 416.9$ Interest Expense, Net 184.5 Income Taxes 38.6 Depreciation, Depletion and Amortization 1,093.1 Additional Permitted Charges (1) 653.6 LTM Credit Agreement EBITDA 2,386.7$
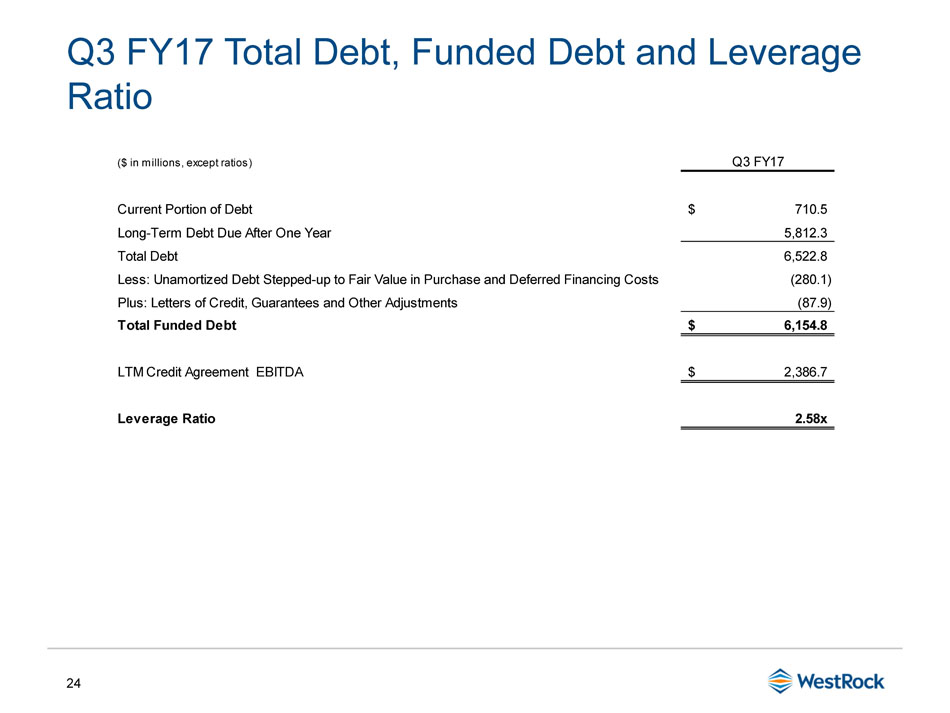
24 Q3 FY17 Total Debt, Funded Debt and Leverage Ratio ($ in millions, except ratios) Q3 FY17 Current Portion of Debt 710.5$ Long-Term Debt Due After One Year 5,812.3 Total Debt 6,522.8 Less: Unamortized Debt Stepped-up to Fair Value in Purchase and Deferred Financing Costs (280.1) Plus: Letters of Credit, Guarantees and Other Adjustments (87.9) Total Funded Debt 6,154.8$ LTM Credit Agreement EBITDA 2,386.7$ Leverage Ratio 2.58x
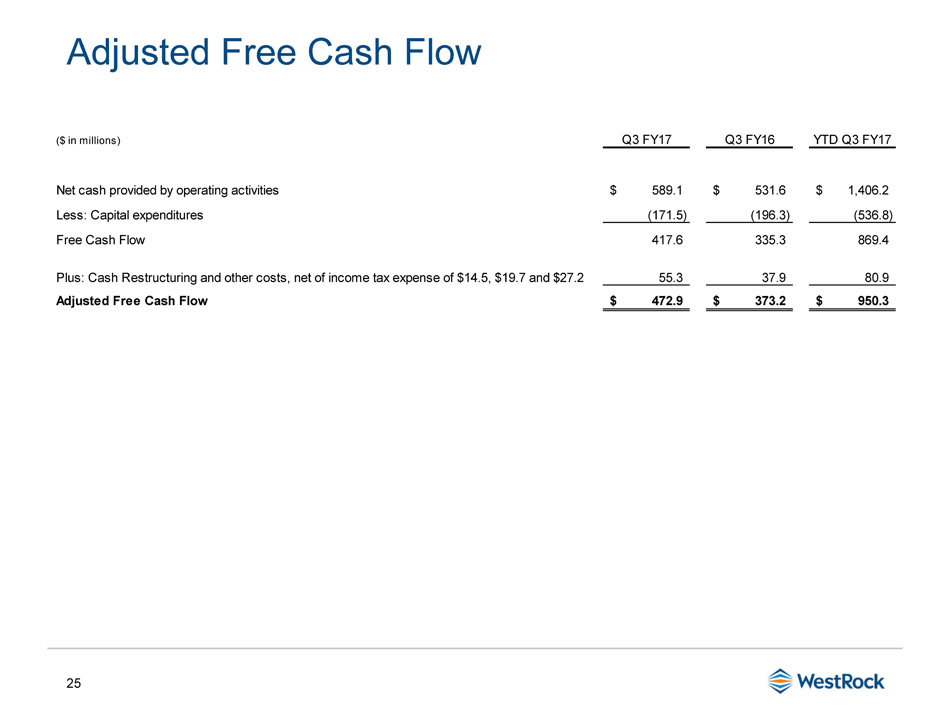
25 Adjusted Free Cash Flow ($ in millions) Q3 FY17 Q3 FY16 YTD Q3 FY17 Net cash provided by operating activities 589.1$ 531.6$ 1,406.2$ Less: Capital expenditures (171.5) (196.3) (536.8) Free Cash Flow 417.6 335.3 869.4 Plus: Cash Restructuring and other costs, net of income tax expense of $14.5, $19.7 and $27.2 55.3 37.9 80.9 Adjusted Free Cash Flow 472.9$ 373.2$ 950.3$

26 Key Commodity Annual Consumption Volumes and FX by Currency Commodity Category Volume Recycled Fiber (tons millions) 4.9 Wood (tons millions) 31 Natural Gas (cubic feet billions) 68 Diesel (gallons millions) 87 Electricity (kwh billions) 4.6 Polyethylene (lbs millions) 41 Caustic Soda (tons thousands) 205 Starch (lbs millions) 523 Annual Consumption Volumes FX By Currency in Q3 FY17 Sensitivity Analysis Category Increase in Spot Price Annual EPS Impact Recycled Fiber (tons millions) +$10.00 / ton ($0.10) Natural Gas (cubic feet billions) +$0.25 / MMBTU ($0.04) FX Translation Impact +10% USD Appreciation ($0.06 - $0.07) Revenue by Transaction Currency 83% USD 7% CAD 3% EUR 3% BRL 4% Other