Attached files
| file | filename |
|---|---|
| EX-99.1 - EX-99.1 PRESS RELEASE - MYRIAD GENETICS INC | mygn-ex991_8.htm |
| 8-K - 8-K Q4 EARNINGS RELEASE - MYRIAD GENETICS INC | mygn-8k_20170808.htm |

Myriad Genetics Fiscal Fourth-Quarter 2017 Earnings Call 08/08/2017 Exhibit 99.2
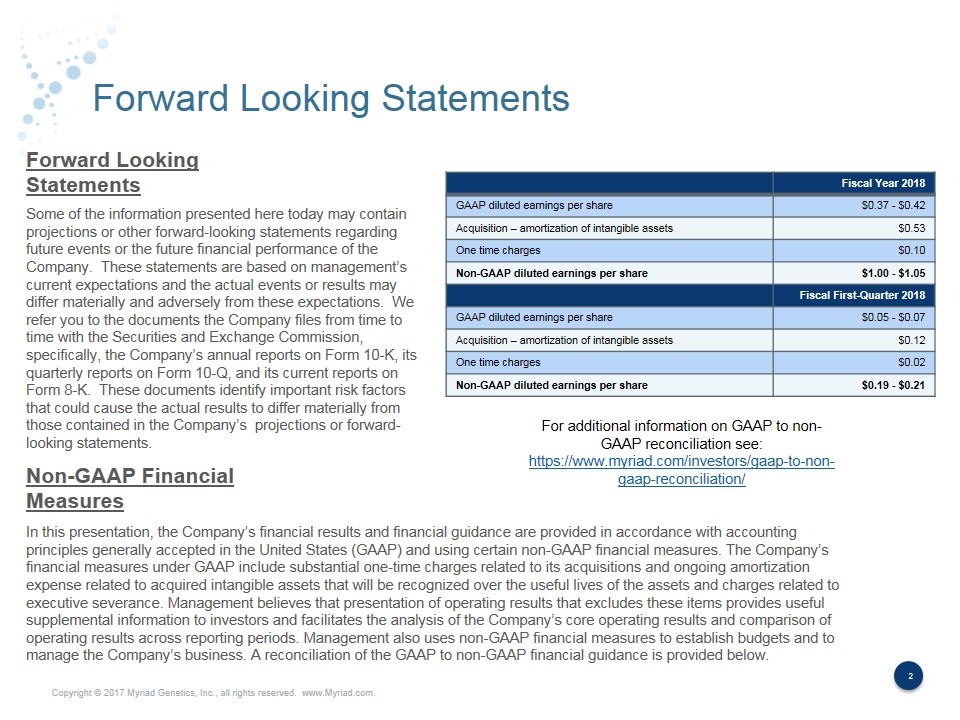
Forward Looking Statements Some of the information presented here today may contain projections or other forward-looking statements regarding future events or the future financial performance of the Company. These statements are based on management’s current expectations and the actual events or results may differ materially and adversely from these expectations. We refer you to the documents the Company files from time to time with the Securities and Exchange Commission, specifically, the Company’s annual reports on Form 10-K, its quarterly reports on Form 10-Q, and its current reports on Form 8-K. These documents identify important risk factors that could cause the actual results to differ materially from those contained in the Company’s projections or forward-looking statements. In this presentation, the Company’s financial results and financial guidance are provided in accordance with accounting principles generally accepted in the United States (GAAP) and using certain non-GAAP financial measures. The Company’s financial measures under GAAP include substantial one-time charges related to its acquisitions and ongoing amortization expense related to acquired intangible assets that will be recognized over the useful lives of the assets and charges related to executive severance. Management believes that presentation of operating results that excludes these items provides useful supplemental information to investors and facilitates the analysis of the Company’s core operating results and comparison of operating results across reporting periods. Management also uses non-GAAP financial measures to establish budgets and to manage the Company’s business. A reconciliation of the GAAP to non-GAAP financial guidance is provided below. Forward Looking Statements Non-GAAP Financial Measures Fiscal Year 2018 GAAP diluted earnings per share $0.37 - $0.42 Acquisition – amortization of intangible assets $0.53 One time charges $0.10 Non-GAAP diluted earnings per share $1.00 - $1.05 Fiscal First-Quarter 2018 GAAP diluted earnings per share $0.05 - $0.07 Acquisition – amortization of intangible assets $0.12 One time charges $0.02 Non-GAAP diluted earnings per share $0.19 - $0.21 For additional information on GAAP to non-GAAP reconciliation see: https://www.myriad.com/investors/gaap-to-non-gaap-reconciliation/
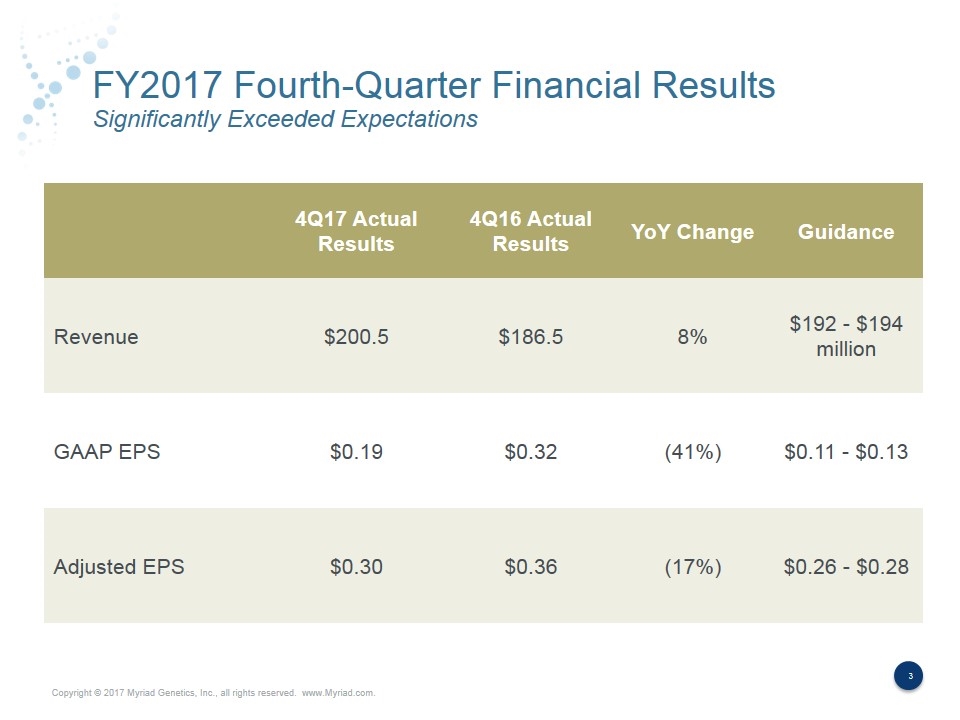
FY2017 Fourth-Quarter Financial Results Significantly Exceeded Expectations 4Q17 Actual Results 4Q16 Actual Results YoY Change Guidance Revenue $200.5 $186.5 8% $192 - $194 million GAAP EPS $0.19 $0.32 (41%) $0.11 - $0.13 Adjusted EPS $0.30 $0.36 (17%) $0.26 - $0.28
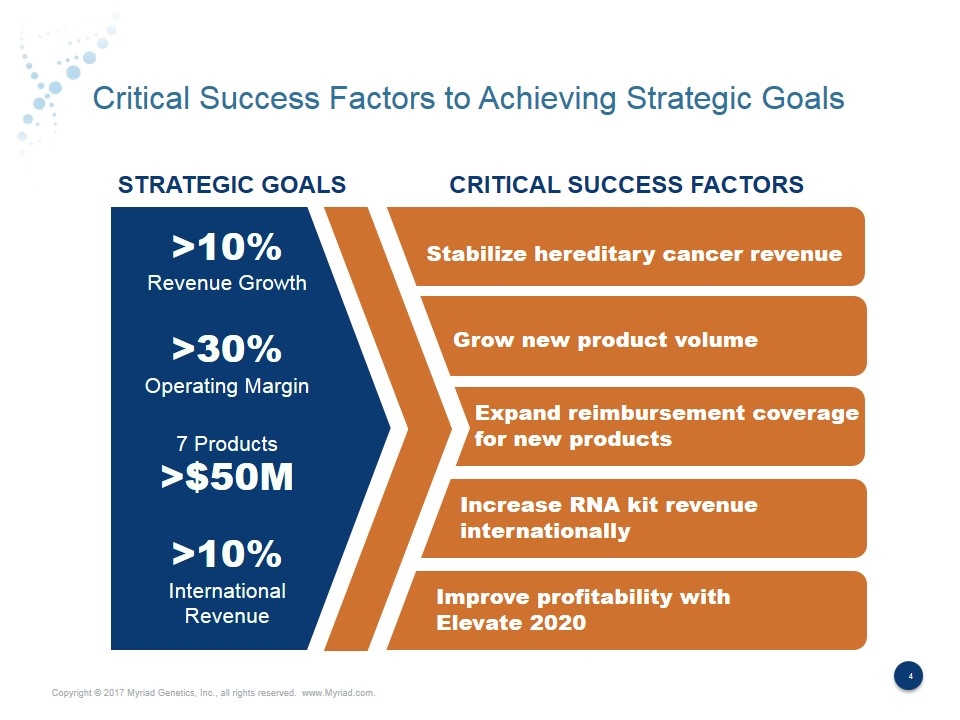
Critical Success Factors to Achieving Strategic Goals Stabilize hereditary cancer revenue Grow new product volume STRATEGIC GOALS CRITICAL SUCCESS FACTORS >10% Revenue Growth >30% Operating Margin 7 Products >$50M >10% International Revenue Expand reimbursement coverage for new products Increase RNA kit revenue internationally Improve profitability with Elevate 2020
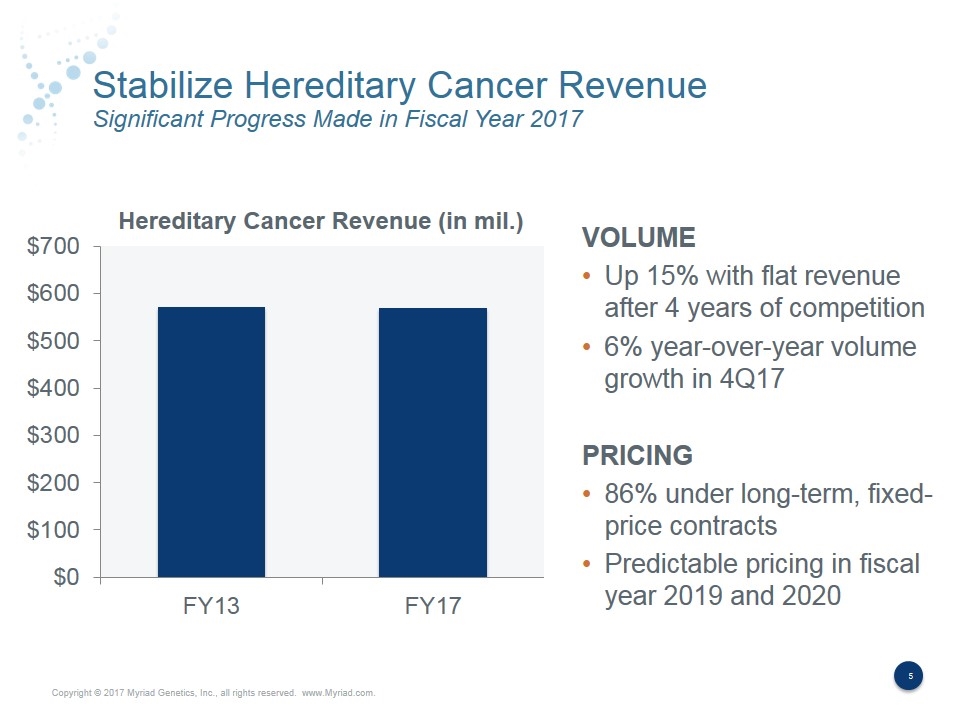
Stabilize Hereditary Cancer Revenue Significant Progress Made in Fiscal Year 2017 VOLUME Up 15% with flat revenue after 4 years of competition 6% year-over-year volume growth in 4Q17 PRICING 86% under long-term, fixed- price contracts Predictable pricing in fiscal year 2019 and 2020
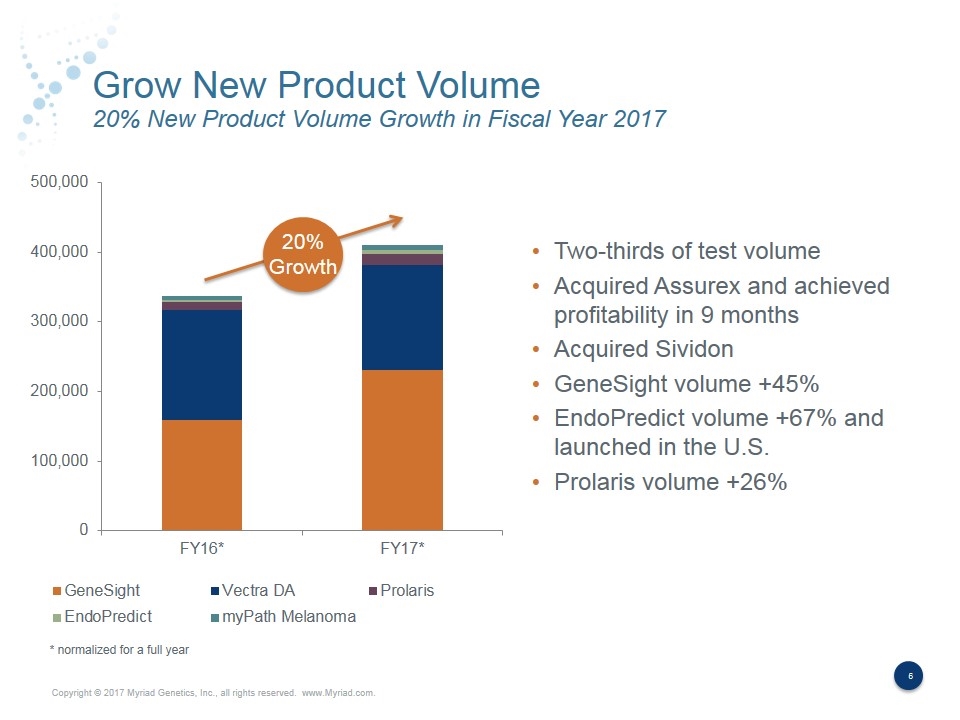
Grow New Product Volume 20% New Product Volume Growth in Fiscal Year 2017 20% Growth Two-thirds of test volume Acquired Assurex and achieved profitability in 9 months Acquired Sividon GeneSight volume +45% EndoPredict volume +67% and launched in the U.S. Prolaris volume +26% * normalized for a full year
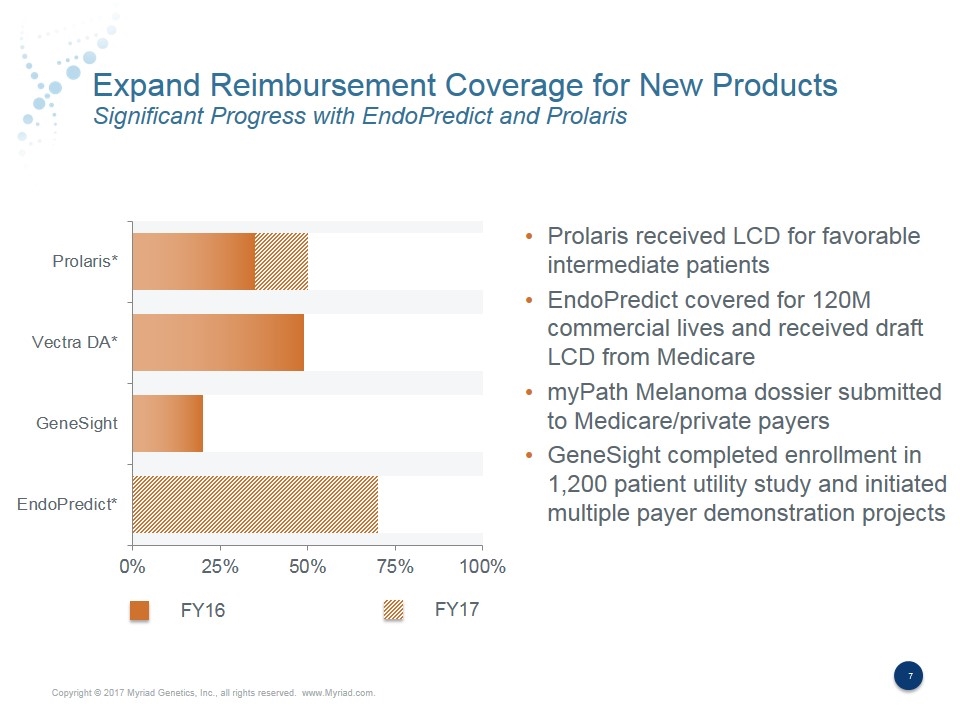
Expand Reimbursement Coverage for New Products Significant Progress with EndoPredict and Prolaris Prolaris received LCD for favorable intermediate patients EndoPredict covered for 120M commercial lives and received draft LCD from Medicare myPath Melanoma dossier submitted to Medicare/private payers GeneSight completed enrollment in 1,200 patient utility study and initiated multiple payer demonstration projects FY16 FY17
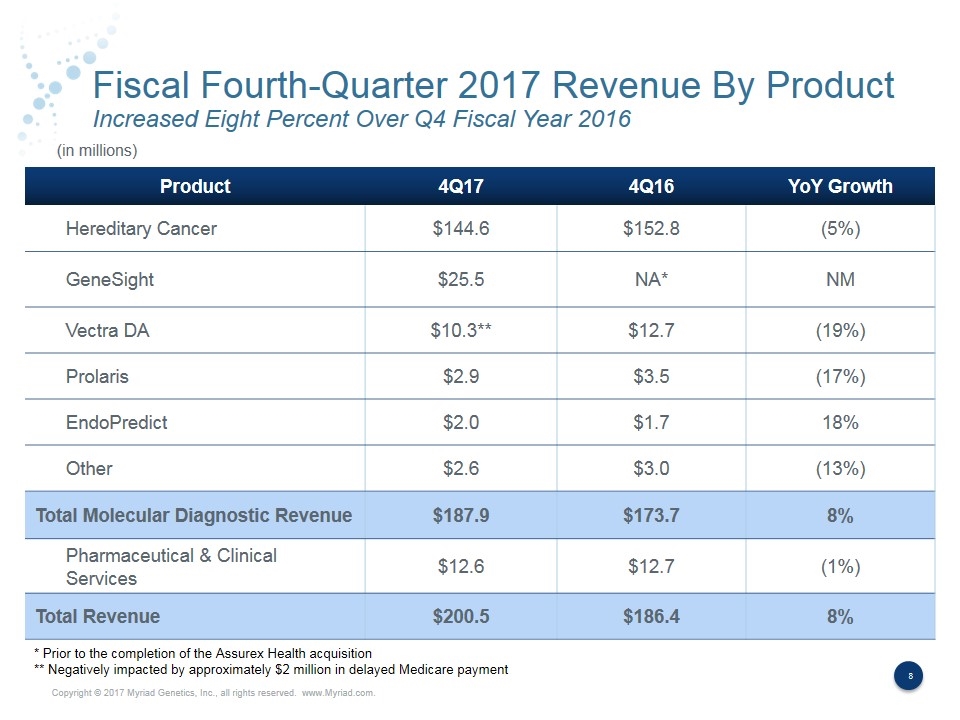
Fiscal Fourth-Quarter 2017 Revenue By Product Increased Eight Percent Over Q4 Fiscal Year 2016 Product 4Q17 4Q16 YoY Growth Hereditary Cancer $144.6 $152.8 (5%) GeneSight $25.5 NA* NM Vectra DA $10.3** $12.7 (19%) Prolaris $2.9 $3.5 (17%) EndoPredict $2.0 $1.7 18% Other $2.6 $3.0 (13%) Total Molecular Diagnostic Revenue $187.9 $173.7 8% Pharmaceutical & Clinical Services $12.6 $12.7 (1%) Total Revenue $200.5 $186.4 8% (in millions) * Prior to the completion of the Assurex Health acquisition ** Negatively impacted by approximately $2 million in delayed Medicare payment
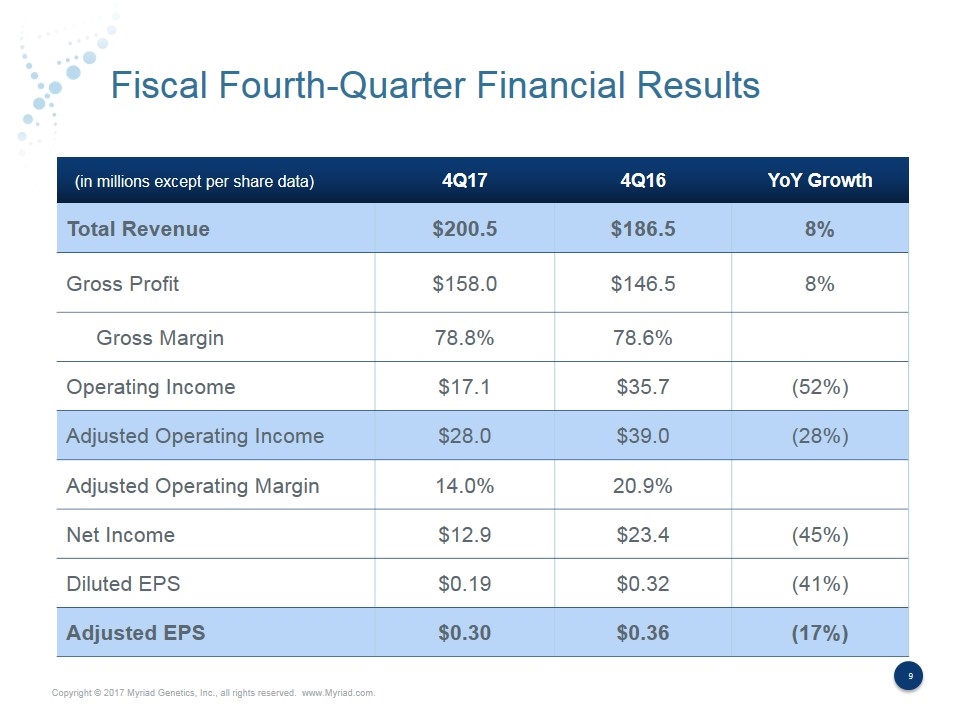
Fiscal Fourth-Quarter Financial Results 4Q17 4Q16 YoY Growth Total Revenue $200.5 $186.5 8% Gross Profit $158.0 $146.5 8% Gross Margin 78.8% 78.6% Operating Income $17.1 $35.7 (52%) Adjusted Operating Income $28.0 $39.0 (28%) Adjusted Operating Margin 14.0% 20.9% Net Income $12.9 $23.4 (45%) Diluted EPS $0.19 $0.32 (41%) Adjusted EPS $0.30 $0.36 (17%) (in millions except per share data)
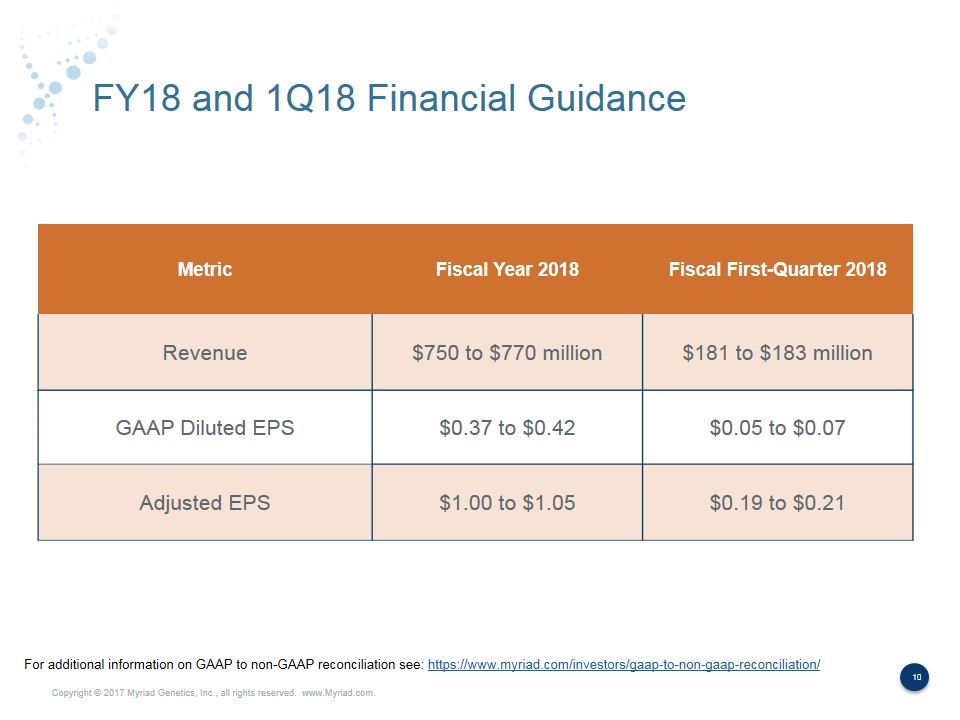
FY18 and 1Q18 Financial Guidance Metric Fiscal Year 2018 Fiscal First-Quarter 2018 Revenue $750 to $770 million $181 to $183 million GAAP Diluted EPS $0.37 to $0.42 $0.05 to $0.07 Adjusted EPS $1.00 to $1.05 $0.19 to $0.21 For additional information on GAAP to non-GAAP reconciliation see: https://www.myriad.com/investors/gaap-to-non-gaap-reconciliation/
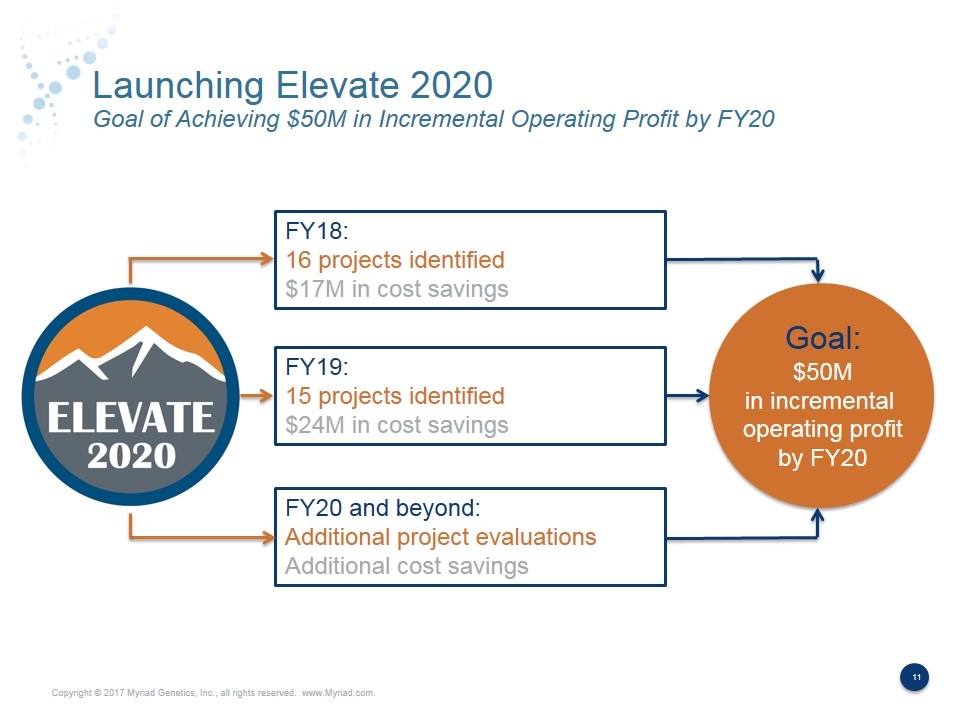
Launching Elevate 2020 Goal of Achieving $50M in Incremental Operating Profit by FY20 FY18: 16 projects identified $17M in cost savings FY19: 15 projects identified $24M in cost savings FY20 and beyond: Additional project evaluations Additional cost savings Goal: $50M in incremental operating profit by FY20
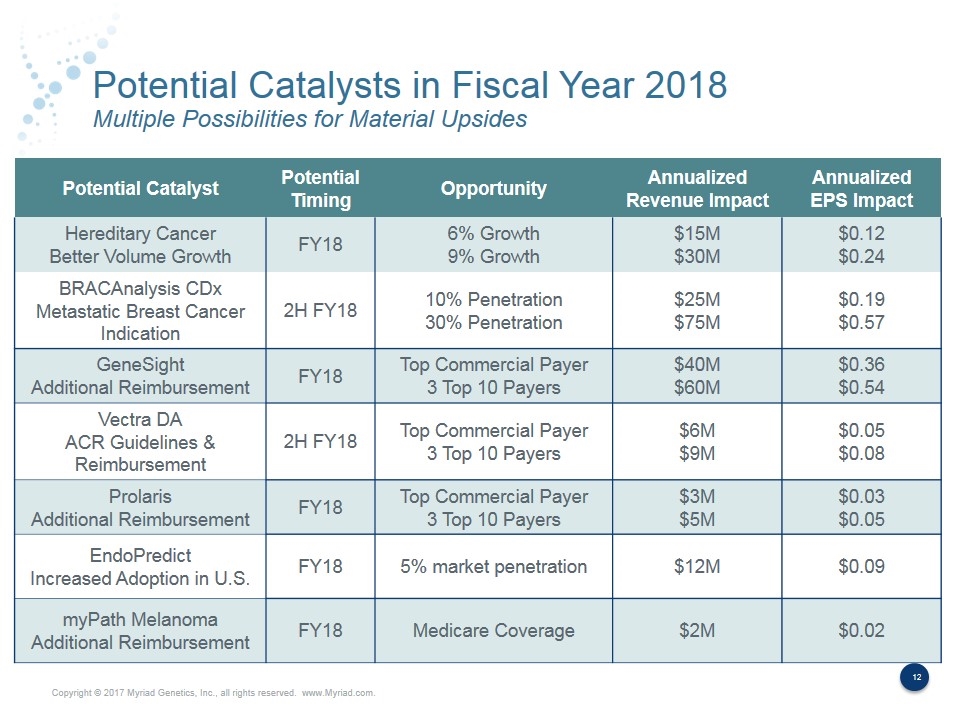
Potential Catalysts in Fiscal Year 2018 Multiple Possibilities for Material Upsides Potential Catalyst Potential Timing Opportunity Annualized Revenue Impact Annualized EPS Impact Hereditary Cancer Better Volume Growth FY18 6% Growth 9% Growth $15M $30M $0.12 $0.24 BRACAnalysis CDx Metastatic Breast Cancer Indication 2H FY18 10% Penetration 30% Penetration $25M $75M $0.19 $0.57 GeneSight Additional Reimbursement FY18 Top Commercial Payer 3 Top 10 Payers $40M $60M $0.36 $0.54 Vectra DA ACR Guidelines & Reimbursement 2H FY18 Top Commercial Payer 3 Top 10 Payers $6M $9M $0.05 $0.08 Prolaris Additional Reimbursement FY18 Top Commercial Payer 3 Top 10 Payers $3M $5M $0.03 $0.05 EndoPredict Increased Adoption in U.S. FY18 5% market penetration $12M $0.09 myPath Melanoma Additional Reimbursement FY18 Medicare Coverage $2M $0.02
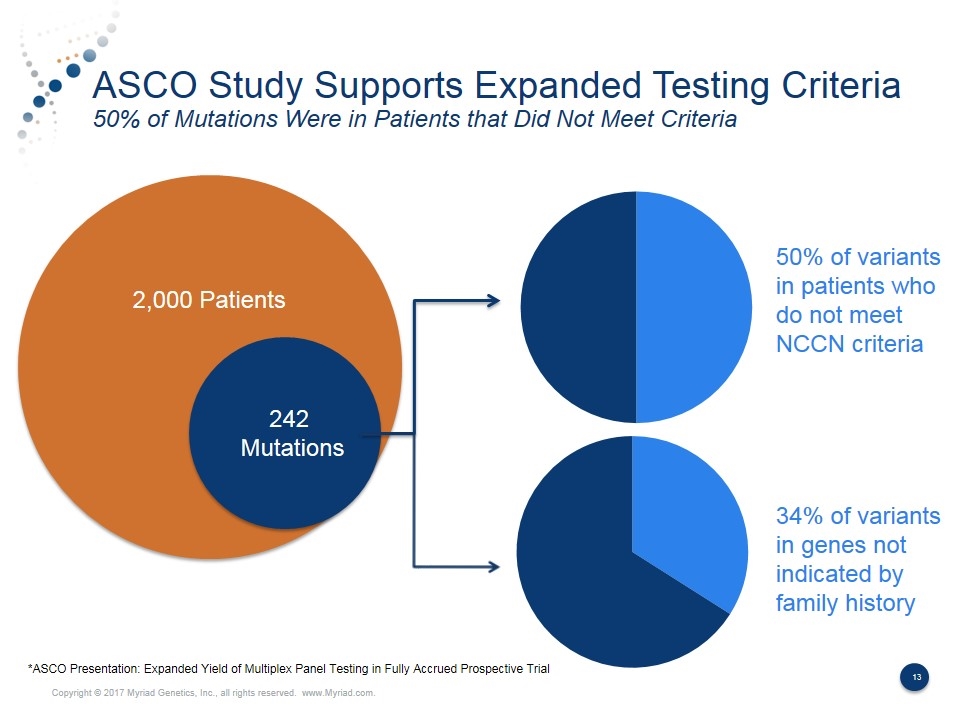
ASCO Study Supports Expanded Testing Criteria 50% of Mutations Were in Patients that Did Not Meet Criteria 2,000 Patients 242 Mutations 50% of variants in patients who do not meet NCCN criteria 34% of variants in genes not indicated by family history *ASCO Presentation: Expanded Yield of Multiplex Panel Testing in Fully Accrued Prospective Trial
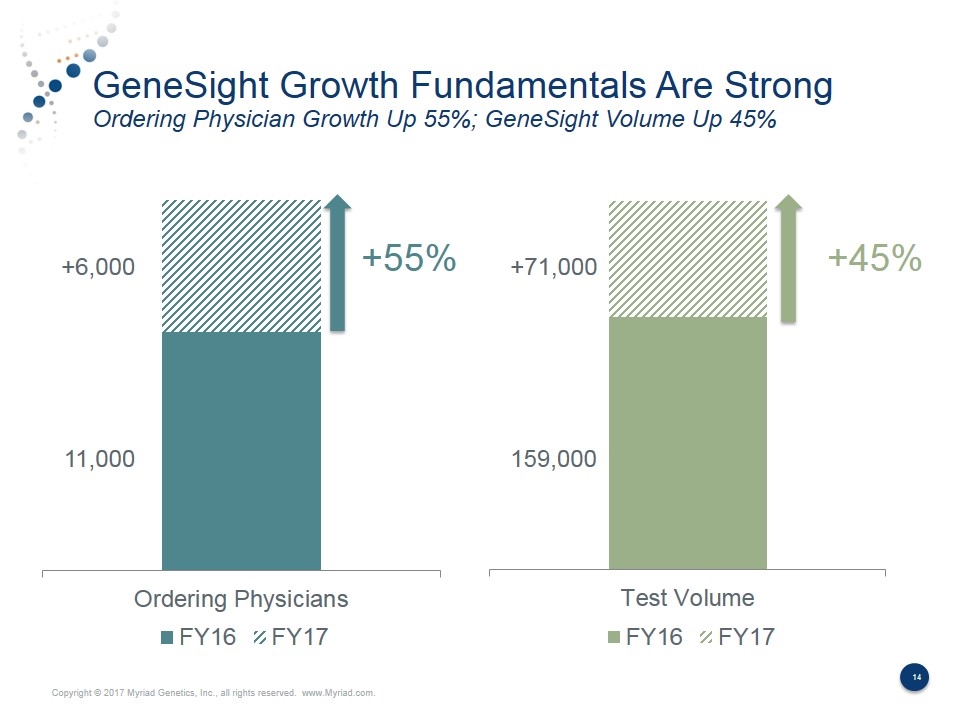
GeneSight Growth Fundamentals Are Strong Ordering Physician Growth Up 55%; GeneSight Volume Up 45% +55% +45% 11,000 +6,000 +71,000 159,000
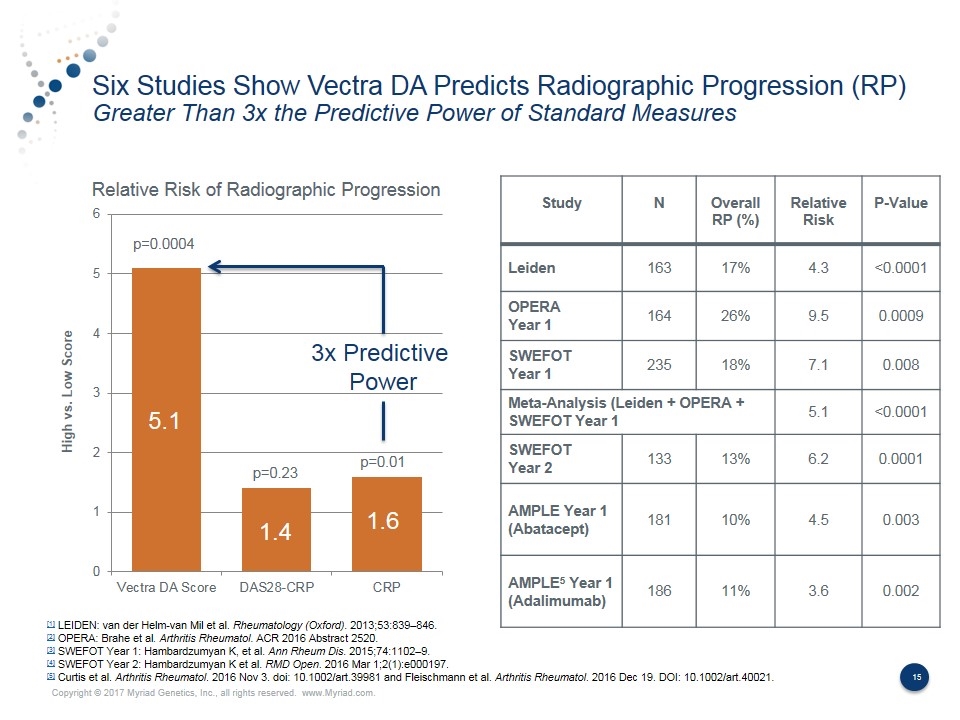
Six Studies Show Vectra DA Predicts Radiographic Progression (RP) Greater Than 3x the Predictive Power of Standard Measures Study N Overall RP (%) Relative Risk P-Value Leiden 163 17% 4.3 <0.0001 OPERA Year 1 164 26% 9.5 0.0009 SWEFOT Year 1 235 18% 7.1 0.008 Meta-Analysis (Leiden + OPERA + SWEFOT Year 1 5.1 <0.0001 SWEFOT Year 2 133 13% 6.2 0.0001 AMPLE Year 1 (Abatacept) 181 10% 4.5 0.003 AMPLE5 Year 1 (Adalimumab) 186 11% 3.6 0.002 [1] LEIDEN: van der Helm-van Mil et al. Rheumatology (Oxford). 2013;53:839–846. [2] OPERA: Brahe et al. Arthritis Rheumatol. ACR 2016 Abstract 2520. [3] SWEFOT Year 1: Hambardzumyan K, et al. Ann Rheum Dis. 2015;74:1102–9. [4] SWEFOT Year 2: Hambardzumyan K et al. RMD Open. 2016 Mar 1;2(1):e000197. [5] Curtis et al. Arthritis Rheumatol. 2016 Nov 3. doi: 10.1002/art.39981 and Fleischmann et al. Arthritis Rheumatol. 2016 Dec 19. DOI: 10.1002/art.40021. Relative Risk of Radiographic Progression 5.1 1.4 1.6 p=0.0004 p=0.23 p=0.01 3x Predictive Power
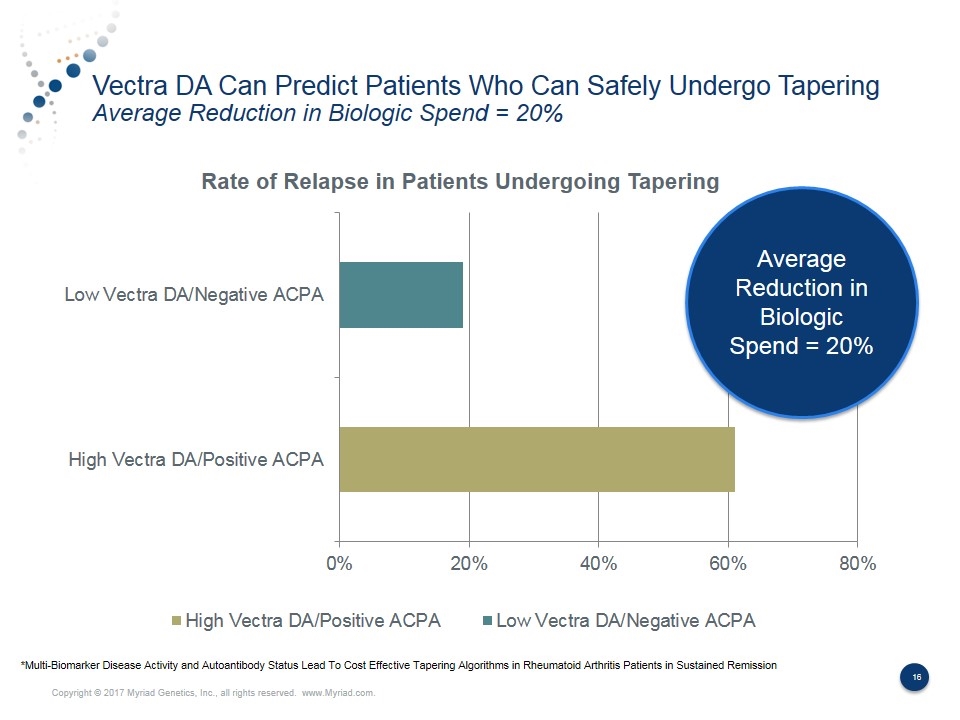
Vectra DA Can Predict Patients Who Can Safely Undergo Tapering Average Reduction in Biologic Spend = 20% Average Reduction in Biologic Spend = 20% *Multi-Biomarker Disease Activity and Autoantibody Status Lead To Cost Effective Tapering Algorithms in Rheumatoid Arthritis Patients in Sustained Remission
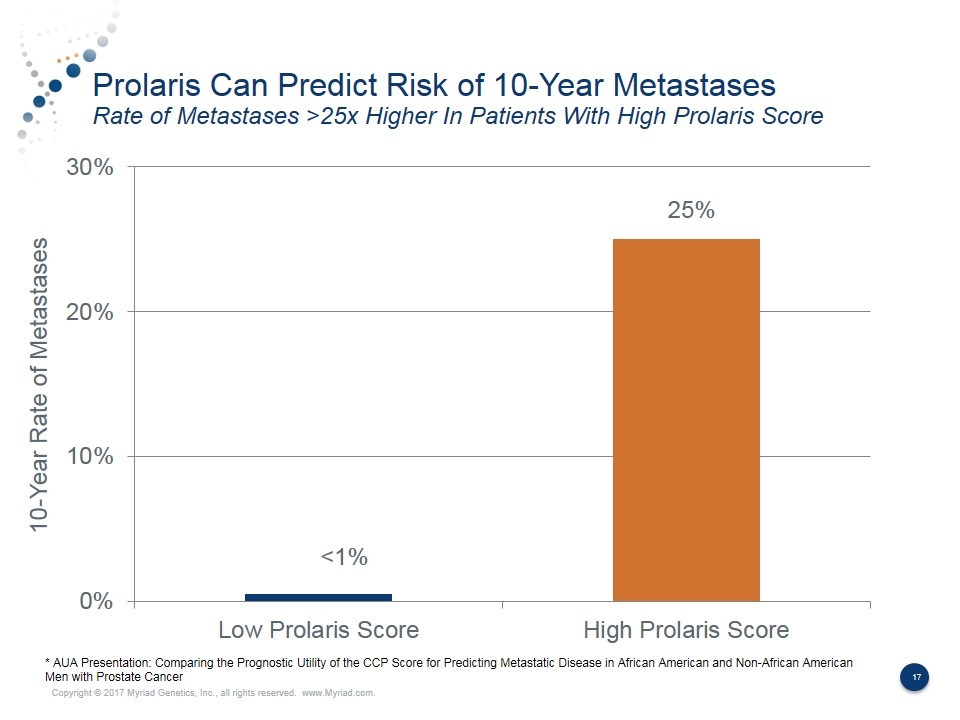
Prolaris Can Predict Risk of 10-Year Metastases Rate of Metastases >25x Higher In Patients With High Prolaris Score <1% 25% 10-Year Rate of Metastases * AUA Presentation: Comparing the Prognostic Utility of the CCP Score for Predicting Metastatic Disease in African American and Non-African American Men with Prostate Cancer
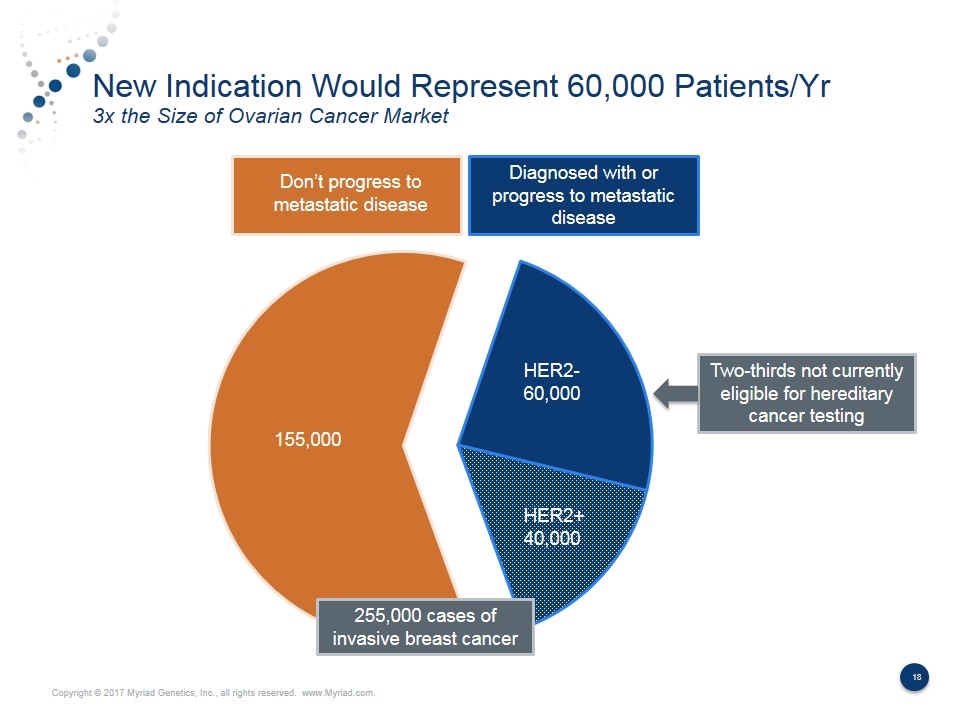
New Indication Would Represent 60,000 Patients/Yr 3x the Size of Ovarian Cancer Market Diagnosed with or progress to metastatic disease HER2+ 40,000 HER2- 60,000 155,000 Two-thirds not currently eligible for hereditary cancer testing Don’t progress to metastatic disease 255,000 cases of invasive breast cancer
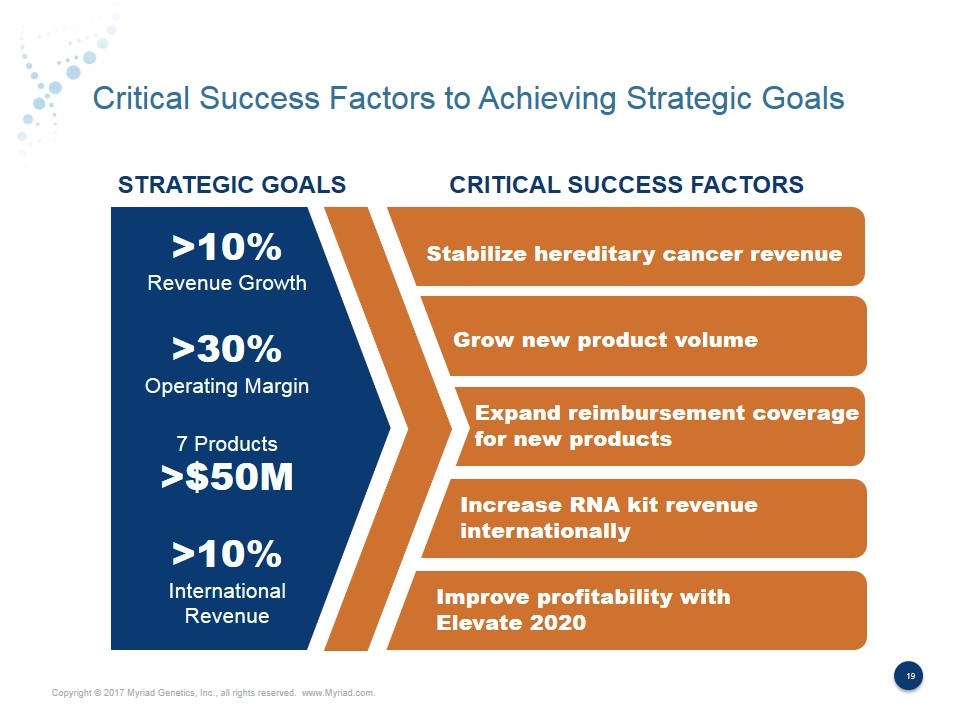
Critical Success Factors to Achieving Strategic Goals Stabilize hereditary cancer revenue Grow new product volume STRATEGIC GOALS CRITICAL SUCCESS FACTORS >10% Revenue Growth >30% Operating Margin 7 Products >$50M >10% International Revenue Expand reimbursement coverage for new products Increase RNA kit revenue internationally Improve profitability with Elevate 2020
