Attached files
| file | filename |
|---|---|
| EX-99.1 - EXHIBIT 99.1 - COOPER TIRE & RUBBER CO | v472382_ex99-1.htm |
| 8-K - FORM 8-K - COOPER TIRE & RUBBER CO | v472382_8k.htm |
Exhibit 99.2
Company Update Second Quarter 2017 August 4, 2017
Safe Harbor Statement This presentation contains what the company believes are forward - looking statements related to future financial results and business operations for Cooper Tire & Rubber Company. Actual results may differ materially from current management forecasts and projections as a result of factors over which the company may have limited or no control. Information on certain of these risk factors and additional information on forward - looking statements are included in the company’s reports on file with the Securities and Exchange Commission and set forth at the end of this presentation. 2
Available Information You can find Cooper Tire on the web at coopertire.com. Our company webcasts earnings calls and presentations from certain events that we participate in or host on the investor relations portion of our website (http://coopertire.com/investors.aspx). In addition, we also make available a variety of other information for investors on the site. Our goal is to maintain the investor relations portion of the website as a portal through which investors can easily find or navigate to pertinent information about Cooper Tire, including: • our annual report on Form 10 - K, quarterly reports on Form 10 - Q, current reports on Form 8 - K, and any amendments to those reports, as soon as reasonably practicable after we electronically file that material or furnish it to the Securities and Exchange Commission (“SEC”); • information on our business strategies, financial results and selected key performance indicators; • announcements of our participation at investor conferences and other events; • press releases on quarterly earnings, product and service announcements and legal developments; • corporate governance information; and • other news and announcements that we may post from time to time that investors may find relevant. The content of our website is not intended to be incorporated by reference into this presentation or in any report or document we file with or furnish to the SEC, and any references to our website are intended to be inactive textual references only. 3
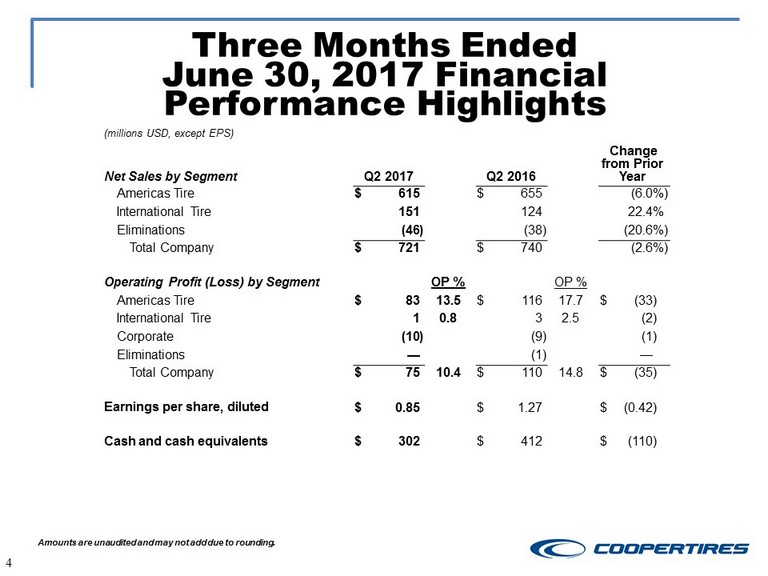
Three Months Ended June 30, 2017 Financial Performance Highlights 4 Amounts are unaudited and may not add due to rounding. (millions USD, except EPS) Net Sales by Segment Q2 2017 Q2 2016 Change from Prior Year Americas Tire $ 615 $ 655 (6.0 %) International Tire 151 124 22.4 % Eliminations (46 ) (38 ) (20.6 %) Total Company $ 721 $ 740 (2.6 %) Operating Profit (Loss) by Segment OP % OP % Americas Tire $ 83 13.5 $ 116 17.7 $ (33 ) International Tire 1 0.8 3 2.5 (2 ) Corporate (10 ) (9 ) (1 ) Eliminations — (1 ) — Total Company $ 75 10.4 $ 110 14.8 $ (35 ) Earnings per share, diluted $ 0.85 $ 1.27 $ (0.42 ) Cash and cash equivalents $ 302 $ 412 $ (110 )
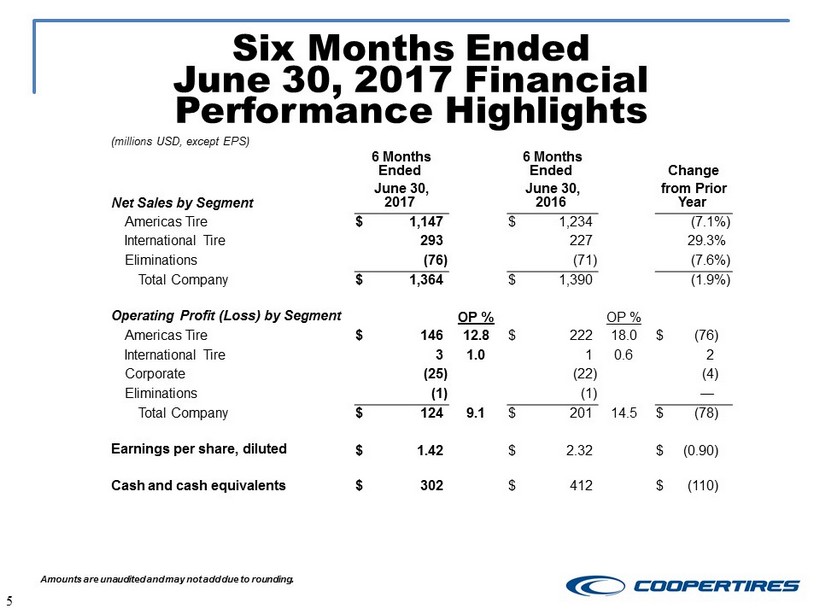
Six Months Ended June 30, 2017 Financial Performance Highlights 5 Amounts are unaudited and may not add due to rounding. (millions USD, except EPS) 6 Months Ended 6 Months Ended Change Net Sales by Segment June 30, 2017 June 30, 2016 from Prior Year Americas Tire $ 1,147 $ 1,234 (7.1%) International Tire 293 227 29.3% Eliminations (76) (71) (7.6%) Total Company $ 1,364 $ 1,390 (1.9%) Operating Profit (Loss) by Segment OP % OP % Americas Tire $ 146 12.8 $ 222 18.0 $ (76) International Tire 3 1.0 1 0.6 2 Corporate (25) (22) (4) Eliminations (1) (1) — Total Company $ 124 9.1 $ 201 14.5 $ (78) Earnings per share, diluted $ 1.42 $ 2.32 $ (0.90) Cash and cash equivalents $ 302 $ 412 $ (110)
Six Months Ended June 30, 2017 Financial Performance Highlights 5 Amounts are unaudited and may not add due to rounding. (millions USD, except EPS) Net Sales by Segment Q2 2017 Q2 2016 Change from Prior Year Americas Tire $ 1,147 $ 1,234 (7.1 %) International Tire 293 227 29.3 % Eliminations (76 ) (71 ) (7.6 %) Total Company $ 1,364 $ 1,390 (1.9 %) Operating Profit (Loss) by Segment OP % OP % Americas Tire $ 146 12.8 $ 222 18.0 $ (76 ) International Tire 3 1.0 1 0.6 2 Corporate (25 ) (22 ) (4 ) Eliminations (1 ) (1 ) — Total Company $ 124 9.1 $ 201 14.5 $ (78 ) Earnings per share, diluted $ 1.42 $ 2.32 $ (0.90 ) Cash and cash equivalents $ 302 $ 412 $ (110 )
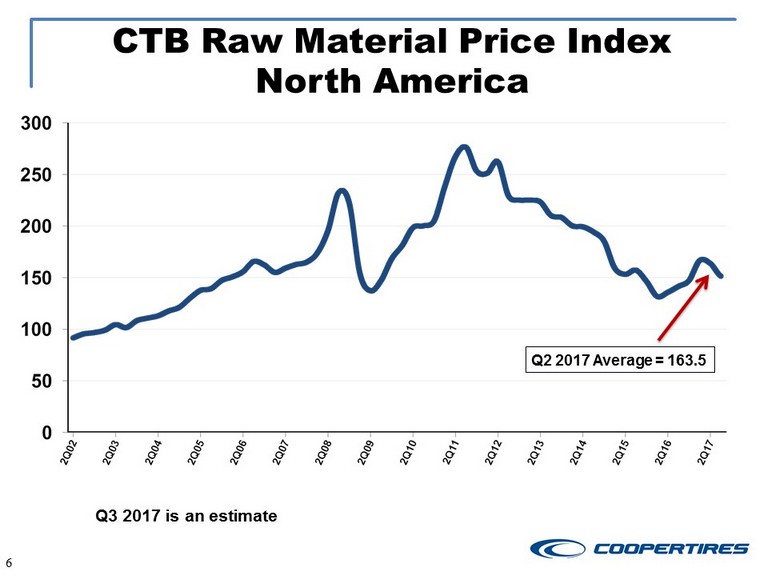
6 CTB Raw Material Price Index North America Q2 2017 Average = 163.5 Q3 2017 is an estimate
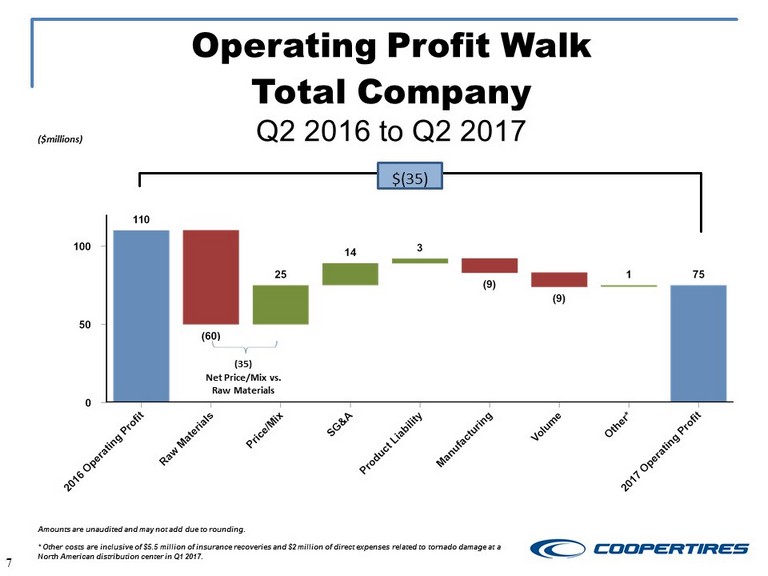
Operating Profit Walk Total Company Q2 2016 to Q2 2017 7 Amounts are unaudited and may not add due to rounding. * Other costs are inclusive of $5.5 million of insurance recoveries and $2 million of direct expenses related to tornado dama ge at a North American distribution center in Q1 2017. ($millions) (35) Net Price/Mix vs. Raw Materials $(35)
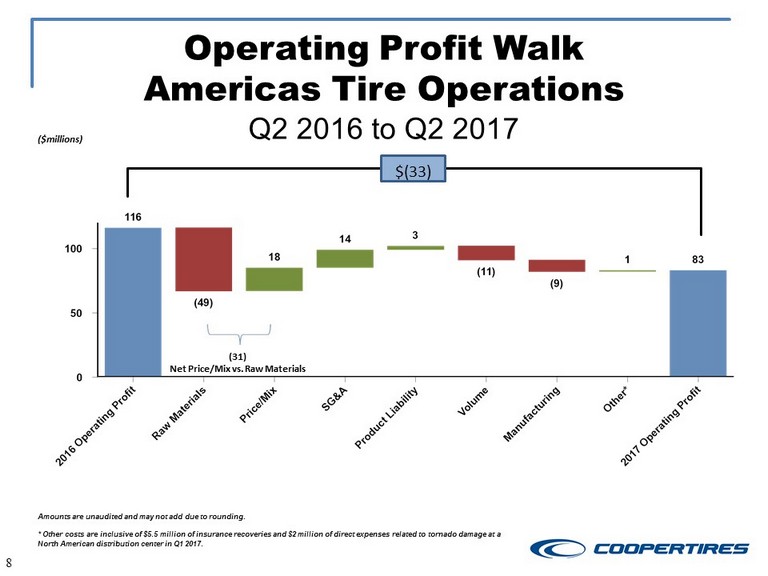
Operating Profit Walk Americas Tire Operations Q2 2016 to Q2 2017 8 Amounts are unaudited and may not add due to rounding. * Other costs are inclusive of $5.5 million of insurance recoveries and $2 million of direct expenses related to tornado dama ge at a North American distribution center in Q1 2017. ($millions) (31) Net Price/Mix vs. Raw Materials $(33)
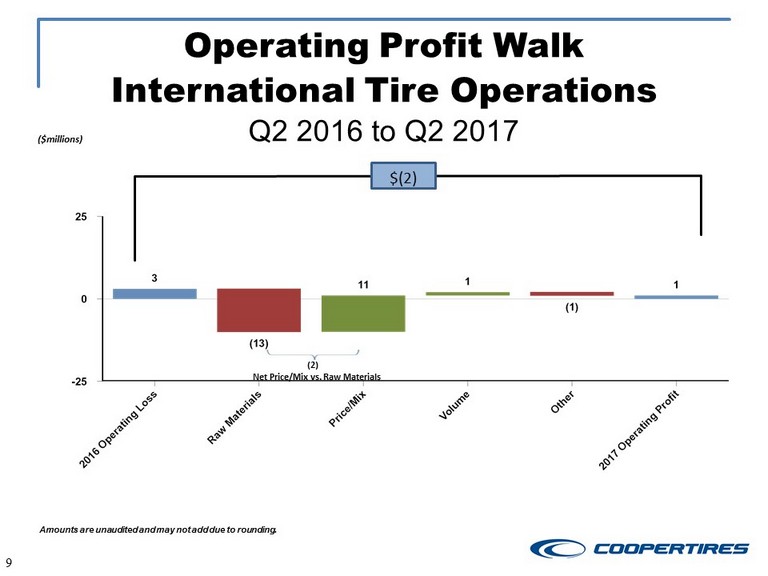
Operating Profit Walk International Tire Operations Q2 2016 to Q2 2017 Amounts are unaudited and may not add due to rounding. 9 ($millions) ( 2) Net Price/Mix vs. Raw Materials $(2)
Non - GAAP Measures 10 Non - GAAP financial measures should be considered in addition to, not as a substitute for, other financial measures prepared in accordance with generally accepted accounting principles (“ GAAP”). The company’s methods of determining these non - GAAP financial measures may differ from the methods used by other companies for these or similar non - GAAP financial measures. Accordingly, these non - GAAP financial measures may not be comparable to measures used by other companies. Pursuant to the requirements of SEC Regulation G, detailed reconciliations between the company’s GAAP and non - GAAP financial results were posted, by incorporation within this presentation, on the company’s Investor Relations website at http://coopertire.com/investors.aspx on the day the company’s operating and financial results were announced for the quarter ended June 30, 2017 and management presented certain non - GAAP financial measures during a conference call with analysts and investors. Investors are advised to carefully review and consider this information as well as the GAAP financial results that are disclosed in the company’s earnings releases and annual and quarterly SEC filings.
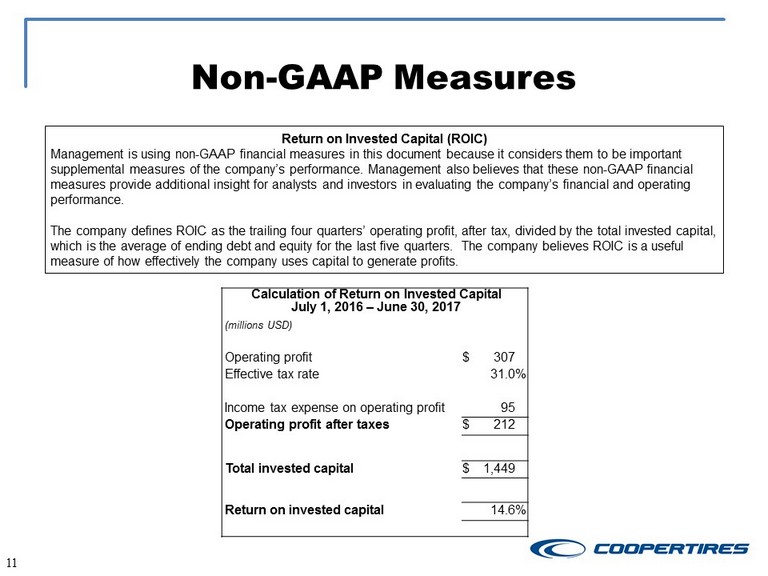
Non - GAAP Measures 11 Return on Invested Capital (ROIC) Management is using non - GAAP financial measures in this document because it considers them to be important supplemental measures of the company’s performance. Management also believes that these non - GAAP financial measures provide additional insight for analysts and investors in evaluating the company’s financial and operating performance. The company defines ROIC as the trailing four quarters’ operating profit, after tax, divided by the total invested capital, which is the average of ending debt and equity for the last five quarters. The company believes ROIC is a useful measure of how effectively the company uses capital to generate profits. Calculation of Return on Invested Capital July 1, 2016 – June 30, 2017 (millions USD) Operating profit $ 307 Effective tax rate 31.0 % Income tax expense on operating profit 95 Operating profit after taxes $ 212 Total invested capital $ 1,449 Return on invested capital 14.6 %
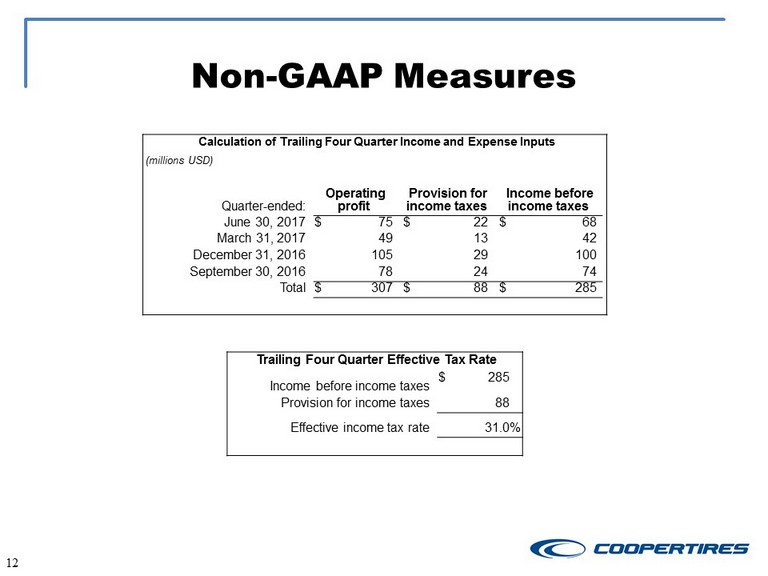
Non - GAAP Measures 12 Calculation of Trailing Four Quarter Income and Expense Inputs (millions USD) Quarter - ended: Operating profit Provision for income taxes Income before income taxes June 30, 2017 $ 75 $ 22 $ 68 March 31, 2017 49 13 42 December 31, 2016 105 29 100 September 30, 2016 78 24 74 Total $ 307 $ 88 $ 285 Trailing Four Quarter Effective Tax Rate Income before income taxes $ 285 Provision for income taxes 88 Effective income tax rate 31.0 %
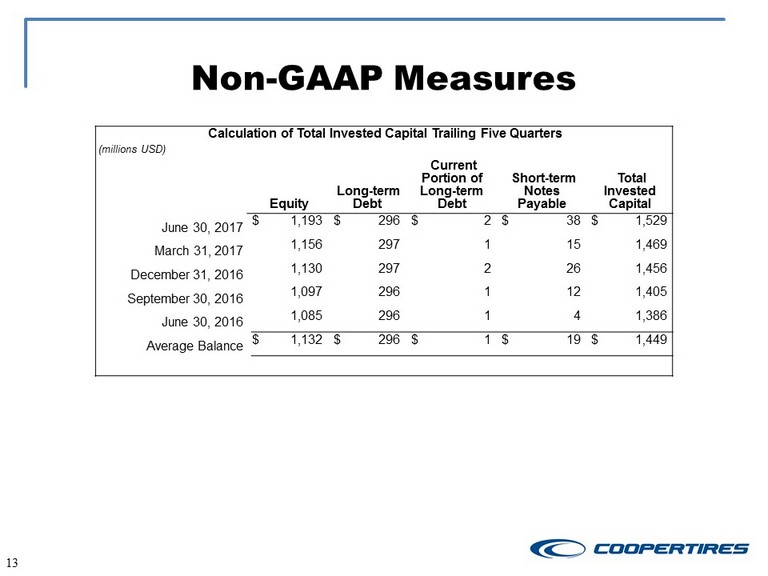
Non - GAAP Measures 13 Calculation of Total Invested Capital Trailing Five Quarters (millions USD) Equity Long - term Debt Current Portion of Long - term Debt Short - term Notes Payable Total Invested Capital June 30, 2017 $ 1,193 $ 296 $ 2 $ 38 $ 1,529 March 31, 2017 1,156 297 1 15 1,469 December 31, 2016 1,130 297 2 26 1,456 September 30, 2016 1,097 296 1 12 1,405 June 30, 2016 1,085 296 1 4 1,386 Average Balance $ 1,132 $ 296 $ 1 $ 19 $ 1,449
Risks 14 It is possible that actual results may differ materially from projections or expectations due to a variety of factors, includ ing but not limited to: • volatility in raw material and energy prices, including those of rubber, steel, petroleum based products and natural gas or t he unavailability of such raw materials or energy sources; • the failure of the company’s suppliers to timely deliver products or services in accordance with contract specifications; • changes to tariffs or the imposition of new tariffs or trade restrictions, including changes related to tariffs on tires impo rte d into the U.S. from China, as well as tariffs imposed on raw materials which the company uses; • changes in economic and business conditions in the world, including changes related to the United Kingdom’s decision to withd raw from the European Union; • increased competitive activity including actions by larger competitors or lower - cost producers; • the failure to achieve expected sales levels; • changes in the company’s customer relationships, including loss of particular business for competitive or other reasons; • the ultimate outcome of litigation brought against the company, including product liability claims, which could result in com mit ment of significant resources and time to defend and possible material damages against the company or other unfavorable outcomes; • a disruption in, or failure of, the company’s information technology systems, including those related to cyber security, coul d a dversely affect the company’s business operations and financial performance; • changes in pension expense and/or funding resulting from the company’s pension strategy, investment performance of the compan y’s pension plan assets and changes in discount rate, salary increase rate, and expected return on plan assets assumptions, or changes to related accounting regulat ion s; • government regulatory and legislative initiatives including environmental, healthcare and tax matters; • volatility in the capital and financial markets or changes to the credit markets and/or access to those markets; • a variety of factors, including market conditions, may affect the actual amount expended on stock repurchases; the company’s abi lity to consummate stock repurchases; changes in the company’s results of operations or financial conditions or strategic priorities may lead to a modification, su spe nsion or cancellation of stock repurchases, which may occur at any time; • changes in interest or foreign exchange rates; • an adverse change in the company’s credit ratings, which could increase borrowing costs and/or hamper access to the credit ma rke ts; • failure to implement information technologies or related systems, including failure by the company to successfully implement ERP systems; • the risks associated with doing business outside of the U.S.; • the failure to develop technologies, processes or products needed to support consumer demand; • technology advancements; • the inability to recover the costs to develop and test new products or processes; • the impact of labor problems, including labor disruptions at the company, its joint ventures, or at one or more of its large cus tomers or suppliers; • failure to attract or retain key personnel; • consolidation among the company’s competitors or customers; • inaccurate assumptions used in developing the company’s strategic plan or operating plans or the inability or failure to succ ess fully implement such plans; • risks relating to acquisitions including the failure to successfully integrate them into operations or their related financin gs may impact liquidity and capital resources; • changes in the company’s relationship with its joint - venture partners or suppliers, including any changes with respect to its fo rmer PCT joint venture’s production of Cooper - branded products; • the ability to find alternative sources for products supplied by PCT; • the inability to obtain and maintain price increases to offset higher production or material costs; • inability to adequately protect the company’s intellectual property rights; and • inability to use deferred tax assets.