Attached files
| file | filename |
|---|---|
| EX-99.1 - EXHIBIT 99.1 - Prestige Consumer Healthcare Inc. | exhibit991fy18-q1earningsr.htm |
| 8-K - 8-K - Prestige Consumer Healthcare Inc. | a8-kpressreleasejune302017.htm |

Exhibit 99.2
This presentation contains certain “forward-looking” statements within the meaning of the Private Securities Litigation Reform Act of 1995, such
as statements regarding the Company’s expected financial performance, including revenue growth, adjusted EPS, and adjusted free cash flow;
the Company’s expected leverage; the Company’s focus on brand-building, supply chain and product development initiatives; and the ability to
achieve synergies from the Fleet acquisition. Words such as “trend,” “continue,” “will,” “expect,” “project,” “anticipate,” “likely,” “estimate,” “may,”
“should,” “could,” “would,” and similar expressions identify forward-looking statements. Such forward-looking statements represent the
Company’s expectations and beliefs and involve a number of known and unknown risks, uncertainties and other factors that may cause actual
results to differ materially from those expressed or implied by such forward-looking statements. These factors include, among others, general
economic and business conditions, regulatory matters, competitive pressures, difficulties successfully integrating the Fleet brands, manufacturing
facility and R&D resources, supplier issues, unexpected costs or liabilities, and other risks set forth in Part I, Item 1A. Risk Factors in the Company’s
Annual Report on Form 10-K for the year ended March 31, 2017. You are cautioned not to place undue reliance on these forward-looking
statements, which speak only as of the date this presentation. Except to the extent required by applicable law, the Company undertakes no
obligation to update any forward-looking statement contained in this presentation, whether as a result of new information, future events, or
otherwise.
All adjusted GAAP numbers presented are footnoted and reconciled to their closest GAAP measurement in the attached reconciliation schedule
or in our earnings release in the “About Non-GAAP Financial Measures” section.

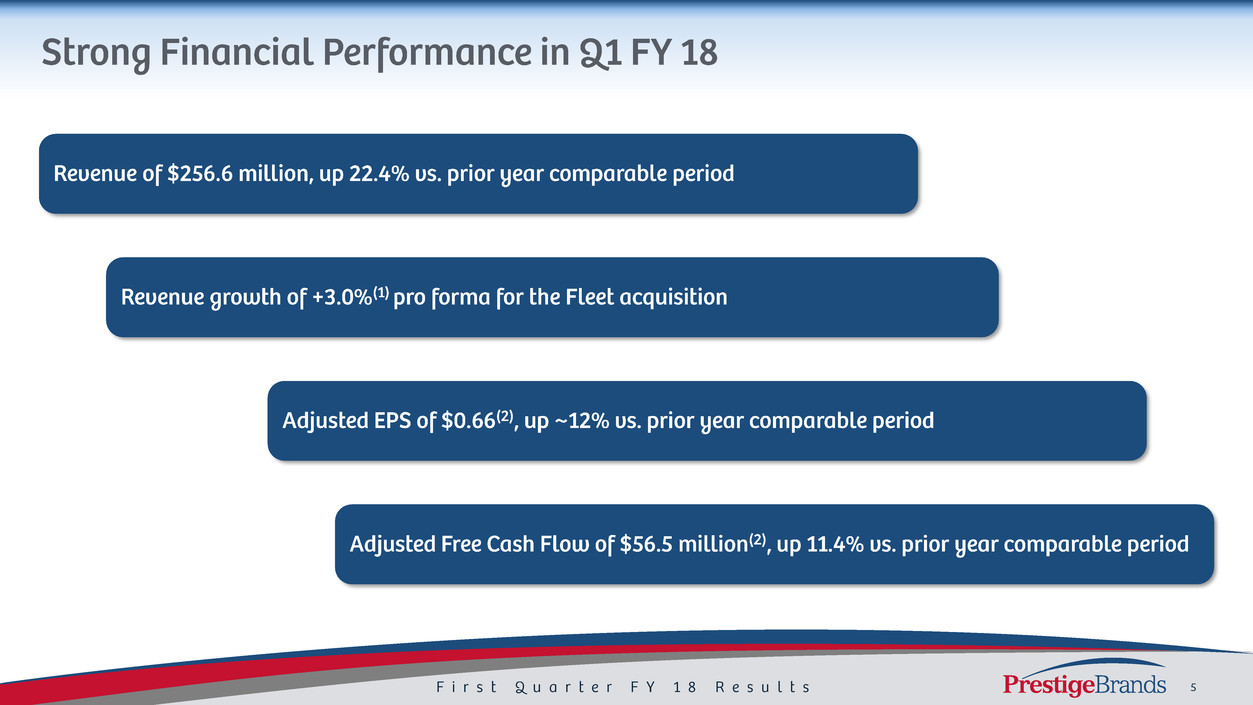
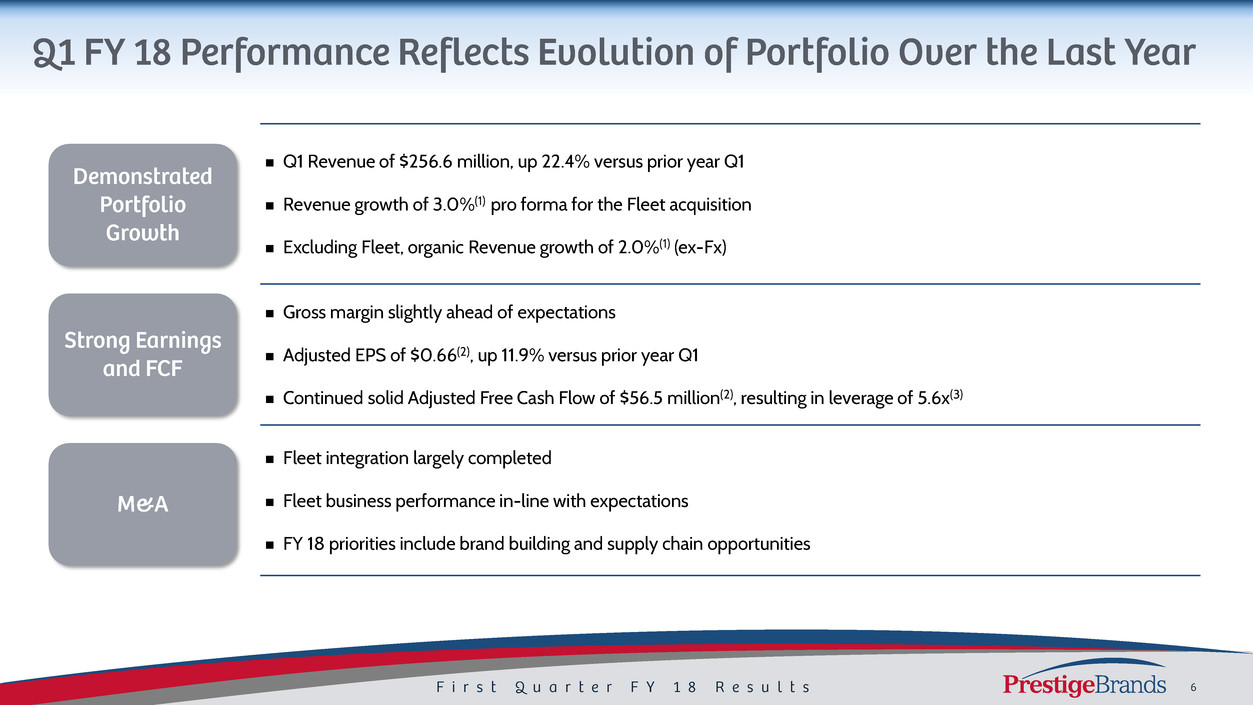
Q1 Revenue of $256.6 million, up 22.4% versus prior year Q1
Revenue growth of 3.0%(1) pro forma for the Fleet acquisition
Excluding Fleet, organic Revenue growth of 2.0%(1) (ex-Fx)
Gross margin slightly ahead of expectations
Adjusted EPS of $0.66(2), up 11.9% versus prior year Q1
Continued solid Adjusted Free Cash Flow of $56.5 million(2), resulting in leverage of 5.6x(3)
Fleet integration largely completed
Fleet business performance in-line with expectations
FY 18 priorities include brand building and supply chain opportunities
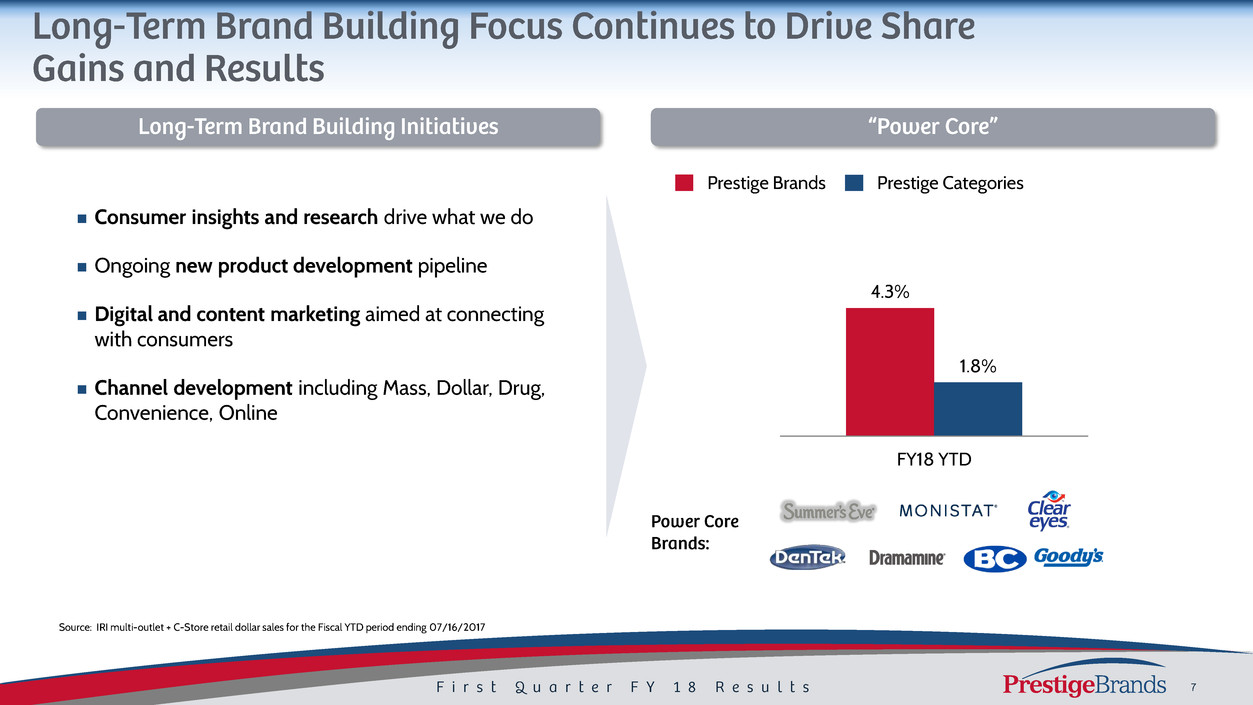
4.3%
1.8%
FY18 YTD
Prestige Brands Prestige Categories
Source: IRI multi-outlet + C-Store retail dollar sales for the Fiscal YTD period ending 07/16/2017
Consumer insights and research drive what we do
Ongoing new product development pipeline
Digital and content marketing aimed at connecting
with consumers
Channel development including Mass, Dollar, Drug,
Convenience, Online
Source: IRI MULO through latest period
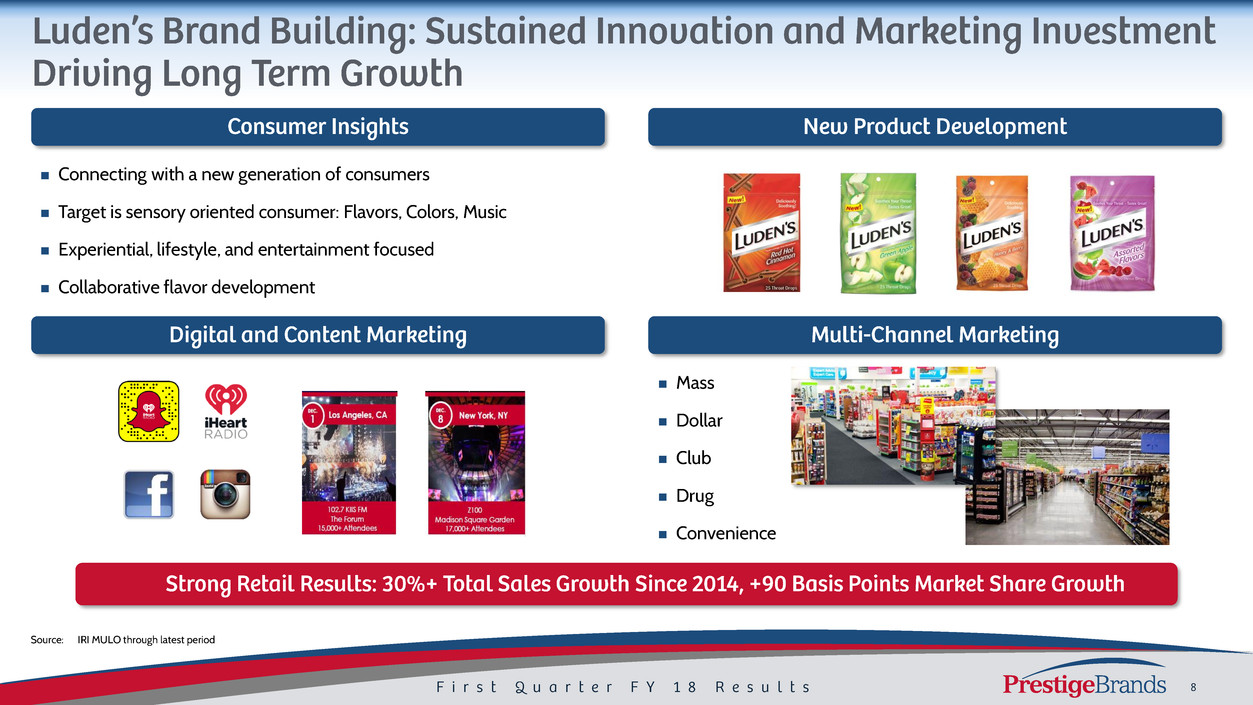
Connecting with a new generation of consumers
Target is sensory oriented consumer: Flavors, Colors, Music
Experiential, lifestyle, and entertainment focused
Collaborative flavor development
Mass
Dollar
Club
Drug
Convenience
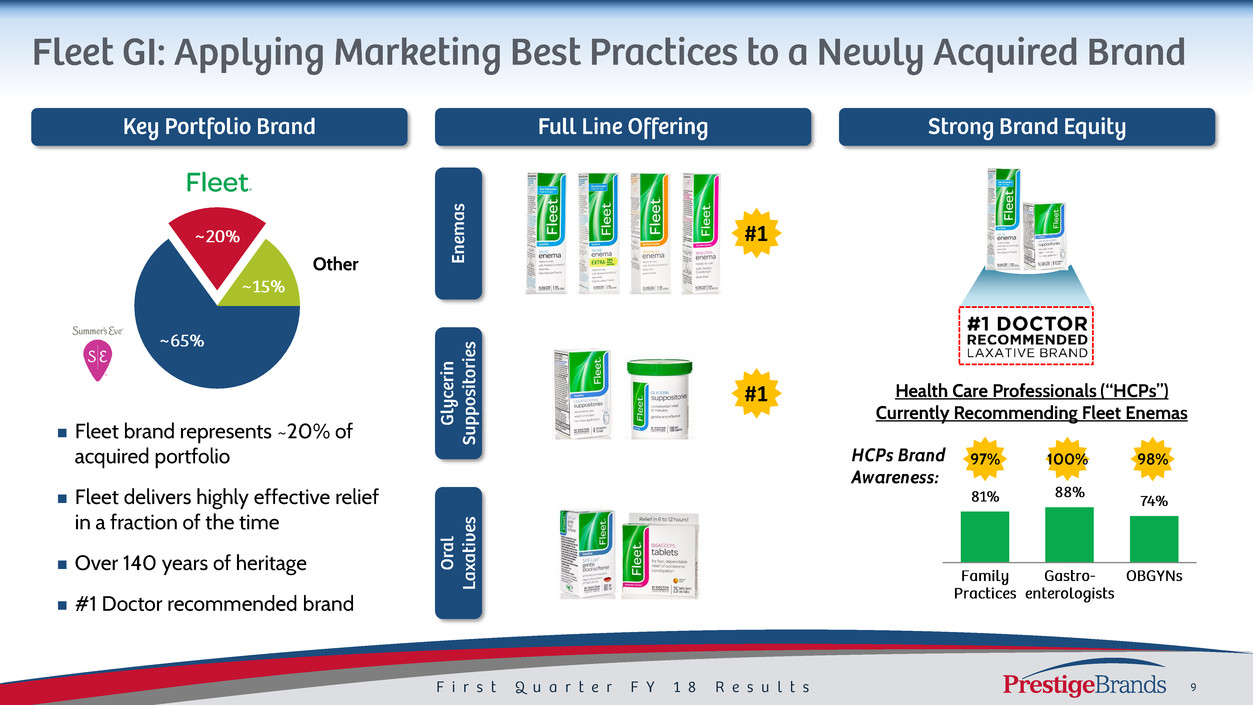
Fleet brand represents ~20% of
acquired portfolio
Fleet delivers highly effective relief
in a fraction of the time
Over 140 years of heritage
#1 Doctor recommended brand
#1
#1
Other
Health Care Professionals (“HCPs”)
Currently Recommending Fleet Enemas
97% 100% 98%HCPs Brand
Awareness:
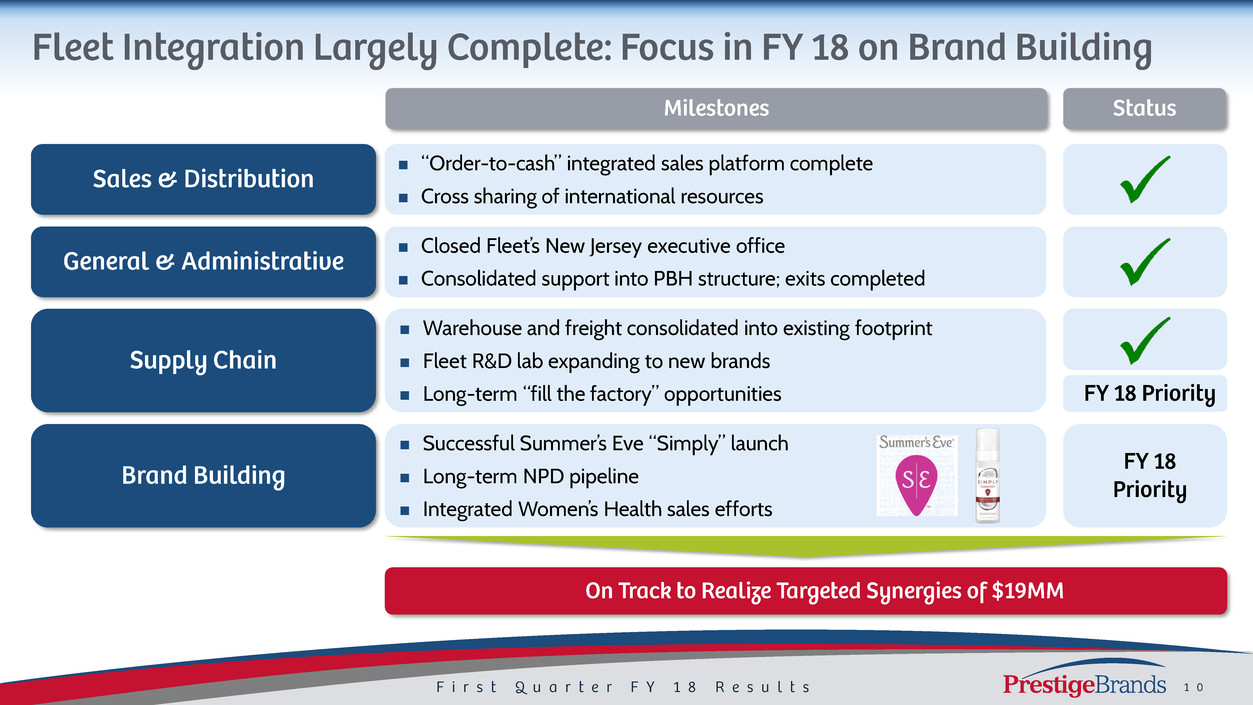
“Order-to-cash” integrated sales platform complete
Cross sharing of international resources
Successful Summer’s Eve “Simply” launch
Long-term NPD pipeline
Integrated Women’s Health sales efforts
Warehouse and freight consolidated into existing footprint
Fleet R&D lab expanding to new brands
Long-term “fill the factory” opportunities
Closed Fleet’s New Jersey executive office
Consolidated support into PBH structure; exits completed
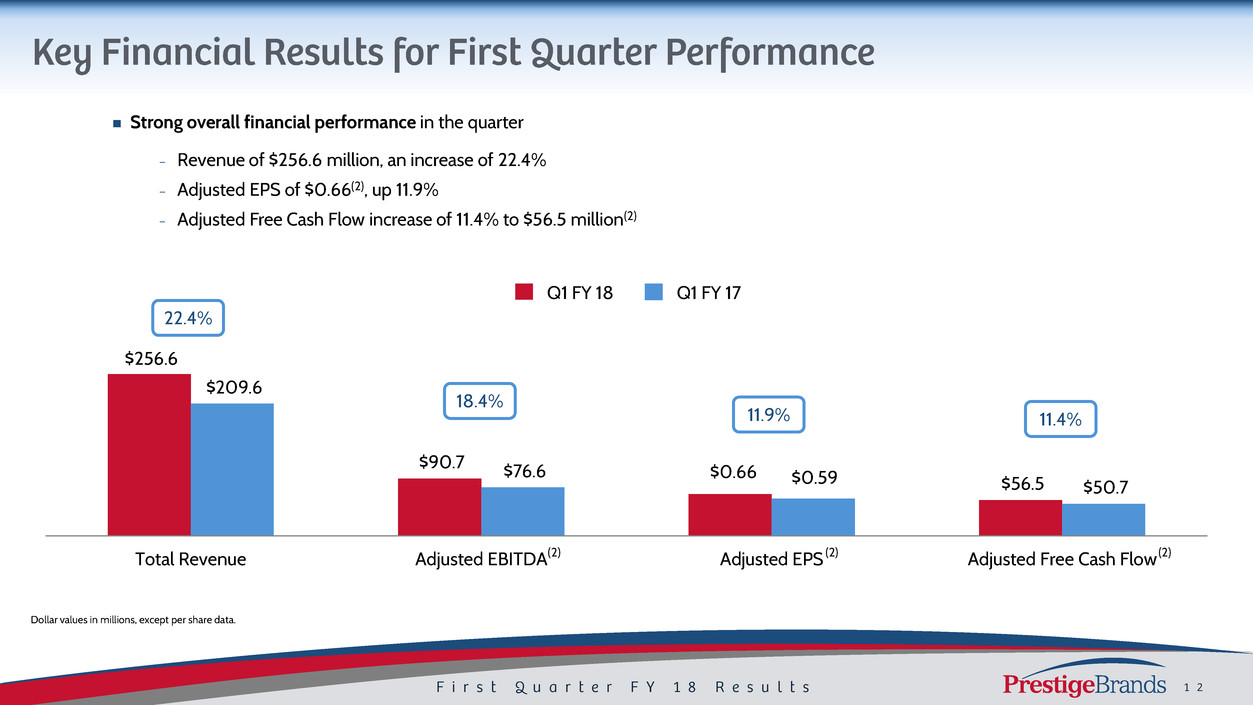
Strong overall financial performance in the quarter
− Revenue of $256.6 million, an increase of 22.4%
− Adjusted EPS of $0.66(2), up 11.9%
− Adjusted Free Cash Flow increase of 11.4% to $56.5 million(2)
$256.6
$90.7
$56.5
$209.6
$76.6
$50.7
Total Revenue Adjusted EBITDA Adjusted EPS Adjusted Free Cash Flow
Q1 FY 17Q1 FY 18
22.4%
18.4%
11.9% 11.4%
$0.59$0.66
(2) (2) (2)
Dollar values in millions, except per share data.
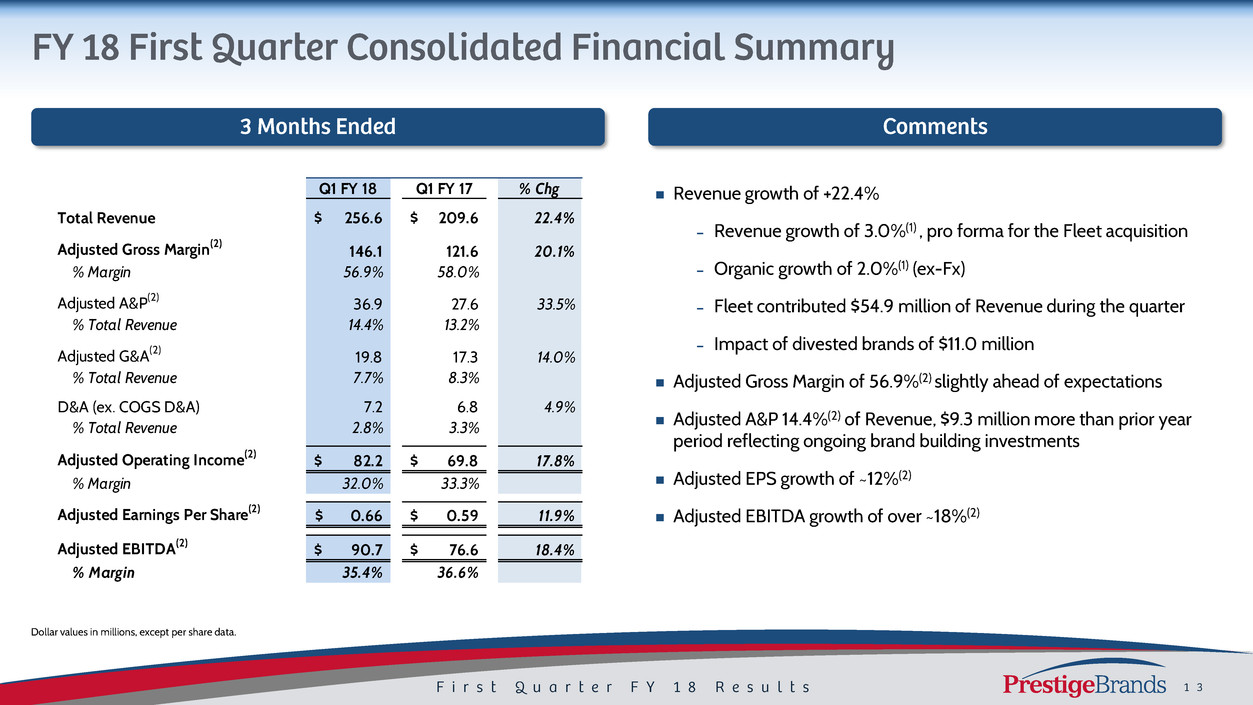
Revenue growth of +22.4%
– Revenue growth of 3.0%(1) , pro forma for the Fleet acquisition
– Organic growth of 2.0%(1) (ex-Fx)
– Fleet contributed $54.9 million of Revenue during the quarter
– Impact of divested brands of $11.0 million
Adjusted Gross Margin of 56.9%(2) slightly ahead of expectations
Adjusted A&P 14.4%(2) of Revenue, $9.3 million more than prior year
period reflecting ongoing brand building investments
Adjusted EPS growth of ~12%(2)
Adjusted EBITDA growth of over ~18%(2)
Dollar values in millions, except per share data.
Q1 FY 18 Q1 FY 17 % Chg
Total Revenue 256.6$ 209.6$ 22.4%
Adjusted Gross Margin(2) 146.1 121.6 20.1%
% Margin 56.9% 58.0%
Adjusted A&P(2) 36.9 27.6 33.5%
% Total Revenue 14.4% 13.2%
Adjusted G&A(2) 19.8 17.3 14.0%
% Total Revenue 7.7% 8.3%
D&A (ex. COGS D&A) 7.2 6.8 4.9%
% Total Revenue 2.8% 3.3%
Adjusted Operating Income(2) 82.2$ 69.8$ 17.8%
% Margin 32.0% 33.3%
Adjusted Earnings Per Share(2) 0.66$ 0.59$ 11.9%
Adjusted EBITDA(2) 90.7$ 76.6$ 18.4%
% Margin 35.4% 36.6%
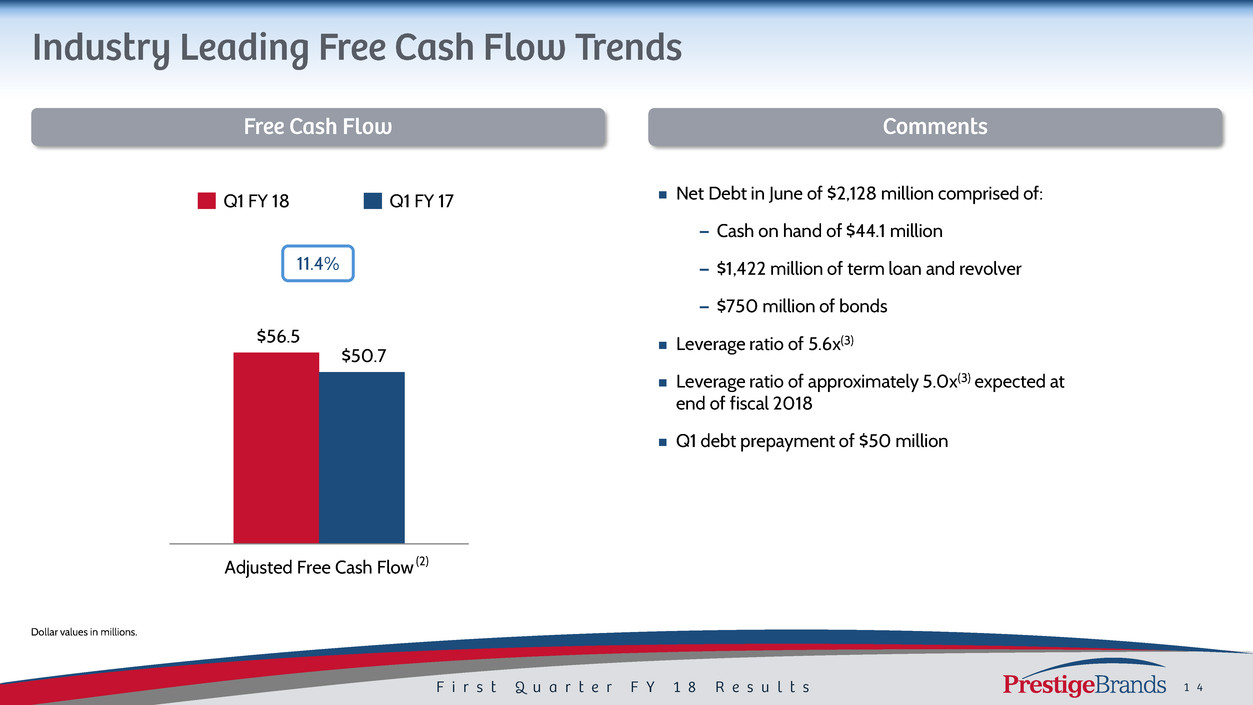
Net Debt in June of $2,128 million comprised of:
– Cash on hand of $44.1 million
– $1,422 million of term loan and revolver
– $750 million of bonds
Leverage ratio of 5.6x(3)
Leverage ratio of approximately 5.0x(3) expected at
end of fiscal 2018
Q1 debt prepayment of $50 million
$56.5
$50.7
Adjusted Free Cash Flow
11.4%
Q1 FY 18 Q1 FY 17
Dollar values in millions.
(2)
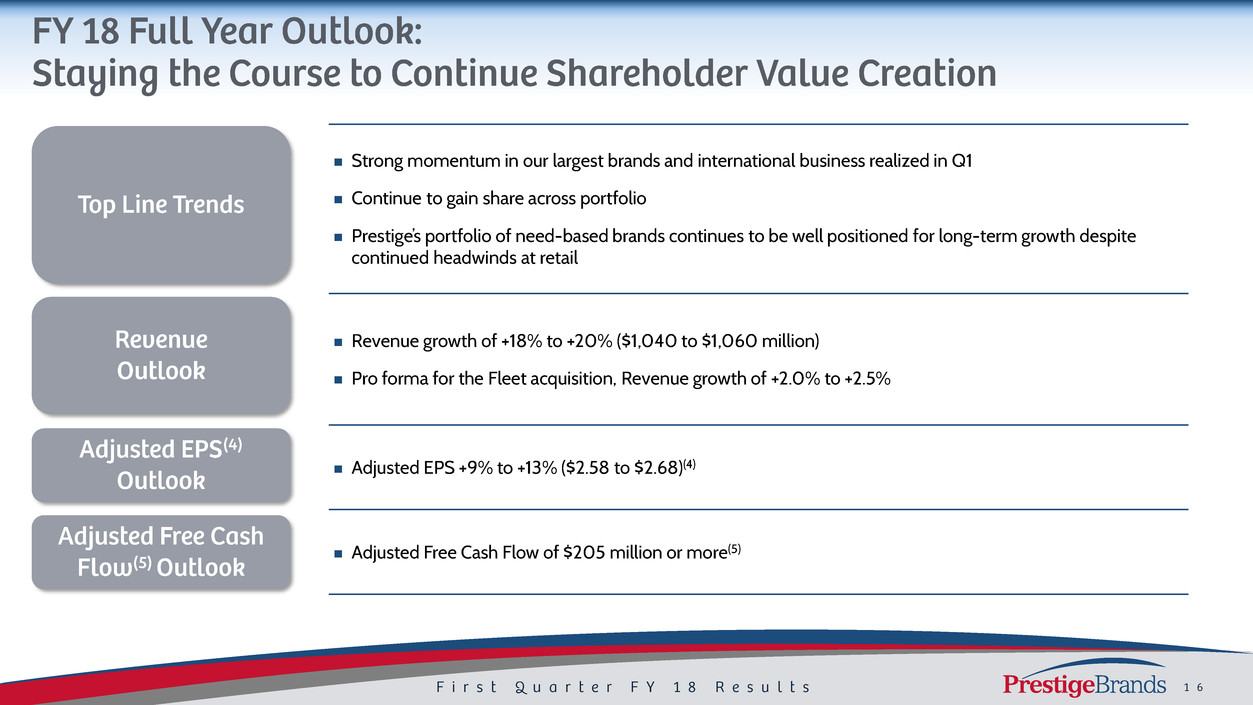
Strong momentum in our largest brands and international business realized in Q1
Continue to gain share across portfolio
Prestige’s portfolio of need-based brands continues to be well positioned for long-term growth despite
continued headwinds at retail
Revenue growth of +18% to +20% ($1,040 to $1,060 million)
Pro forma for the Fleet acquisition, Revenue growth of +2.0% to +2.5%
Adjusted EPS +9% to +13% ($2.58 to $2.68)(4)
Adjusted Free Cash Flow of $205 million or more(5)
(1) Organic Revenue Growth on a constant currency basis and Proforma Revenue Growth on a constant currency basis are Non-
GAAP financial measures and are reconciled to the most closely related GAAP financial measure in the attached Reconciliation
Schedules and / or our earnings release in the “About Non-GAAP Financial Measures” section.
(2) Adjusted Gross Margin, Adjusted A&P, Adjusted G&A, Adjusted EBITDA, Adjusted Operating Income, Adjusted Net Income,
Adjusted EPS, Adjusted Free Cash Flow and Net Debt are Non-GAAP financial measures and are reconciled to their most closely
related GAAP financial measures in the attached Reconciliation Schedules and / or in our earnings release in the “About Non-
GAAP Financial Measures” section.
(3) Leverage ratio reflects net debt / covenant defined EBITDA.
(4) Adjusted EPS for FY 18 is a projected Non-GAAP financial measure, is reconciled to projected GAAP EPS in the attached
Reconciliation Schedules and / or in our earnings release in the “About Non-GAAP Financial Measures” section and is calculated
based on projected GAAP EPS less costs associated with Fleet integration.
(5) Adjusted Free Cash Flow for FY 18 is a projected Non-GAAP financial measure, is reconciled to projected GAAP Net Cash
Provided by Operating Activities in the attached Reconciliation Schedules and / or in our earnings release in the “About Non-
GAAP Financial Measures” section and is calculated based on projected Net Cash Provided by Operating Activities less projected
capital expenditures plus payments associated with acquisitions less tax effect of payments associated with acquisitions.

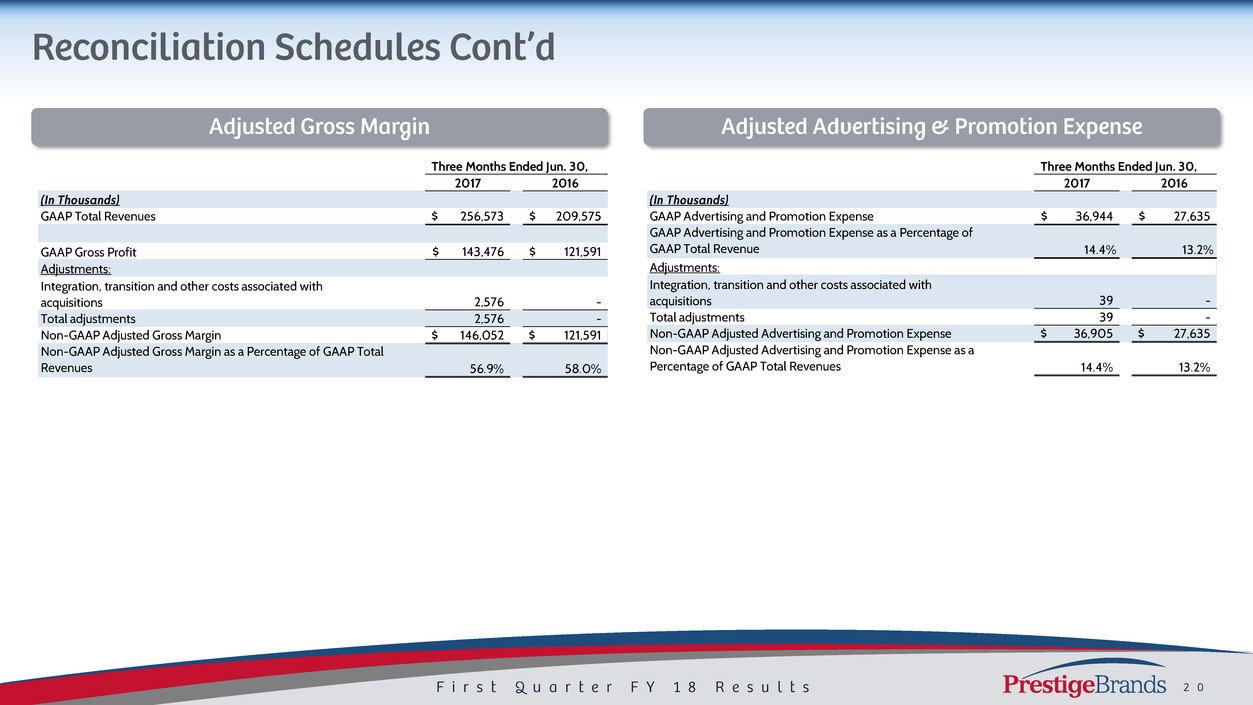
Three Months Ended Jun. 30,
2017 2016
(In Thousands)
GAAP Total Revenues 256,573$ 209,575$
Revenue Growth 22.4%
Adjustments:
Revenues associated with acquisitions (54,887) -
Revenues associated with divested brands - (11,039)
Impact of foregn currency exchange rates - (752)
Non-GAAP Organic Revenues on a constant currency basis 201,686 197,784
Constant Currency Non-GAAP Organic Revenue Growth 2.0%
Non-GAAP Organic Revenues on a constant currency basis 201,686 197,784
Revenues associated with acquisitions 54,887 51,201
Non-GAAP Proforma Revenues on a constant currency basis 256,573 248,985
Constant Currency Non-GAAP Proforma Revenue Growth 3.0%
Three Months Ended Jun. 30,
2017 2016
(In Thousands)
GAAP Total Revenues 256,573$ 209,575$
GAAP Gross Profit 143,476$ 121,591$
Adjustments:
Integration, transition and other costs associated with
acquisitions 2,576 -
Total adjustments 2,576 -
Non-GAAP Adjusted Gross Margin 146,052$ 121,591$
Non-GAAP Adjusted Gross Margin as a Percentage of GAAP Total
Revenues 56.9% 58.0%
Three Months Ended Jun. 30,
7 2016
(In Thousands)
GAAP Advertising and Promotion Expense 36,944 27,635$
GAAP Advertising and Promotion Expense as a Percentage of
GAAP Total Revenue 14.4% 13.2%
Adjustments:
Integrati n, t ansi ion and other costs associated with
acquisitions 39 -
Total adjustments 39 -
Non-GAAP Adjusted Advertising and Promotion Expense 36,905 27,635$
Non-GAAP Adjusted Adv rtising and Prom ion Expense as a
Percentage of GAAP Total Revenues 14 4 13.2%
Three Months Ended Jun. 30,
2017 2016
(In Thousands)
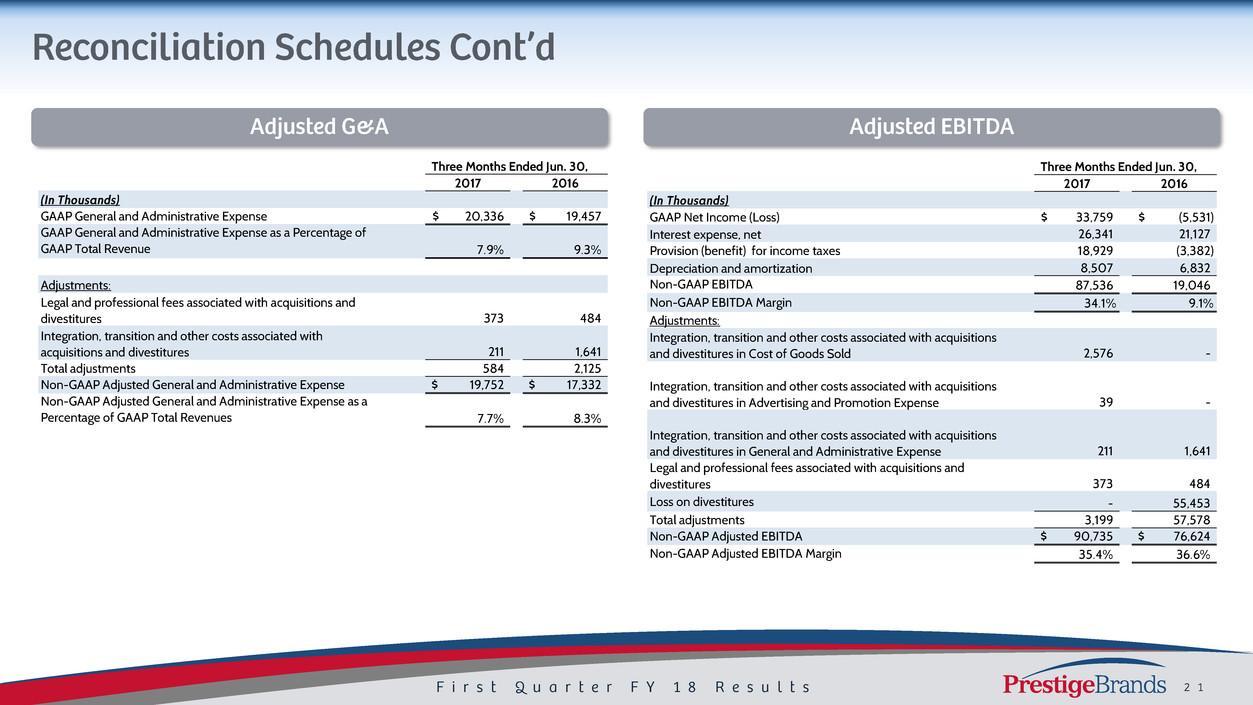
GAAP General and Administrative Expense 20,336$ 19,457$
GAAP General and Administrative Expense as a Percentage of
GAAP Total Revenue 7.9% 9.3%
Adjustments:
Legal and professional fees associated with acquisitions and
divestitures 373 484
Integration, transition and other costs associated with
acquisitions and divestitures 211 1,641
Total adjustments 584 2,125
Non-GAAP Adjusted General and Administrative Expense 19,752$ 17,332$
Non-GAAP Adjusted General and Administrative Expense as a
Percentage of GAAP Total Revenues 7.7% 8.3%
Three Months Ended Jun. 30,
2017 2016
(In Thousands)
GAAP Net Income (Loss) 33,759$ (5,531)$
Interest expense, net 26,341 21,127
Provision (benefit) for income taxes 18,929 (3,382)
Depreciation and amortization 8,507 6,832
Non-GAAP EBITDA 87,536 19,046
Non-GAAP EBITDA Margin 34.1% 9.1%
Adjustments:
Integration, transition and other costs associated with acquisitions
and divestitures in Cost of Goods Sold 2,576 -
Integration, transition and other costs associated with acquisitions
and divestitures in Advertising and Promotion Expense 39 -
Integration, transition and other costs associated with acquisitions
and divestitures in General and Administrative Expense 211 1,641
Legal and professional fees associated with acquisitions and
divestitures 373 484
Loss on divestitures - 55,453
Total adjustments 3,199 57,578
Non-GAAP Adjusted EBITDA 90,735$ 76,624$
Non-GAAP Adjusted EBITDA Margin 35.4% 36.6%

Three Months Ended June 30,
2017
2017
Adjusted
EPS 2016
2016
Adjusted
EPS
(In Thousands)
GAAP Net Income (Loss) 33,759$ 0.63$ (5,531)$ (0.10)$
Adjustments:
Integration, transition and other costs associated
with acquisitions and divestitures in Cost of Goods
Sold 2,576 0.05 - -
Integration, transition and other costs associated
with acquisitions and divestitures in Advertising and
Promotion Expense 39 - - -
Integration, transition and other costs associated
with acquisitions and divestitures in General and
Administrative Expense 211 - 1,641 0.03
Legal and professional fees associated with
acquisitions and divestitures 373 0.01 484 0.01
Loss on divestitures - - 55,453 1.04
Tax impact of adjustments (1,167) (0.02) (20,658) (0.39)
Normalized tax rate adjustment (302) (0.01) - -
Total adjustments 1,730 0.03 36,920 0.69
Non-GAAP Adjusted Net Income and Adjusted EPS 35,489$ 0.66$ 31,389$ 0.59$
Three Months Ended Jun. 30,
2017 2016
(In Thousands)
GAAP Net Income (Loss) 33,759$ (5,531)$
Adjustments:
A justments to reconcile net income (loss) to net
cash provided by operating activities as shown in
the Statement of Cash Flows 21,983 57,346
Changes in operating assets and liabilities, net of
effects from acquisitions as shown in the
Statement of Cash Flows
(1,621) (514)
Total Adjustments 20,362 56,832
GAAP N t cash provided by operating activities 54,121 51,301
Purchase of property and equipment (2,554) (895)
Non-GAAP Free Cash Flow 51,567 50,406
Integration, transition and other payments
associated with acquisitions and divestitures 4,948 331
Non-GAAP Adjusted Free Cash Flow 56,515$ 50,737$
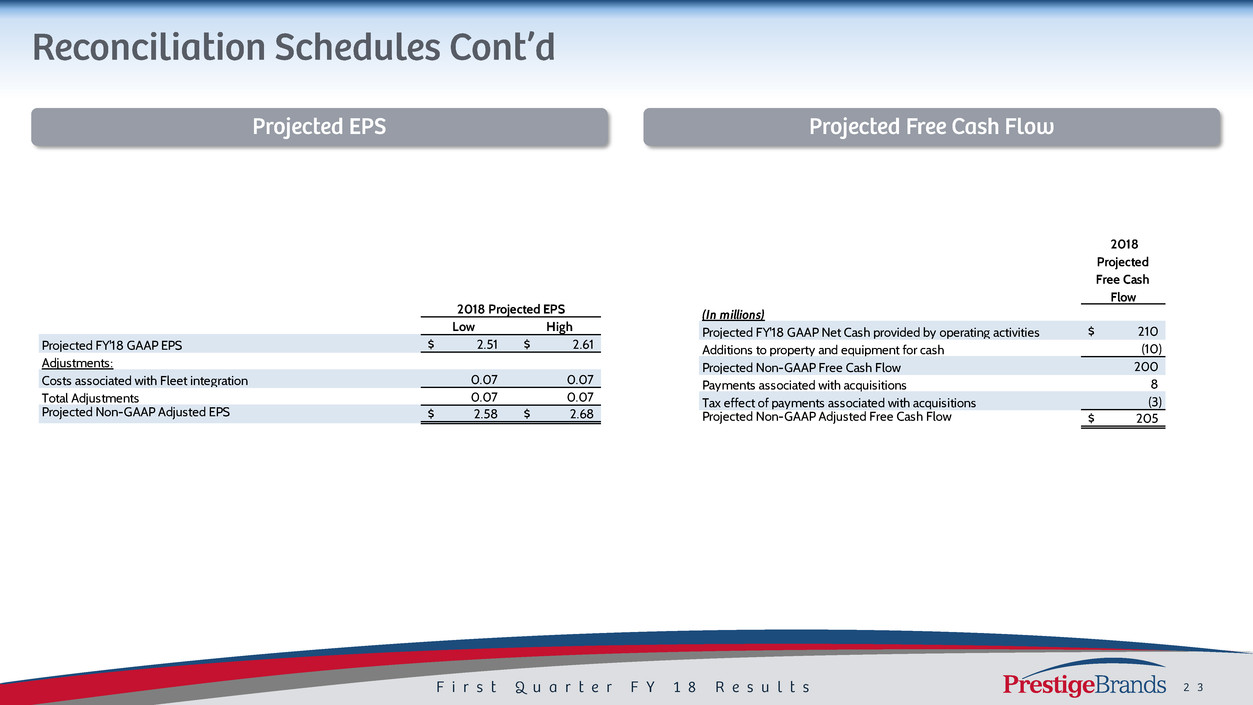
2018 Projected EPS
Low High
Projected FY'18 GAAP EPS 2.51$ 2.61$
Adjustments:
Costs associated with Fleet integration 0.07 0.07
Total Adjustments 0.07 0.07
Projected Non-GAAP Adjusted EPS 2.58$ 2.68$
2018
Projected
Free Cash
Flow
(In millions)
Projected FY'18 GAAP Net Cash provided by operating activities 210$
Additions to property and equipment for cash (10)
Projected Non-GAAP Free Cash Flow 200
ayments associated with acquisitions 8
Tax ffect of payme ts associated with acquisitions (3)
Projected Non-GAAP Adjusted Free Cash Flow 205$
