Attached files
| file | filename |
|---|---|
| 8-K - 8-K - ISTAR INC. | star-06302017xpr8xk.htm |
| EX-99.2 - EXHIBIT 99.2 - ISTAR INC. | q217istarsupplementalfin.htm |
Exhibit 99.1

Press Release
iStar Announces Second Quarter 2017 Results
NEW YORK, August 3, 2017
iStar (NYSE: STAR) today reported results for the quarter ended June 30, 2017.
Highlights
◦ | Net income and adjusted income for the second quarter was $2.04 and $2.28, respectively, per diluted common share. |
◦ | Successful IPO of Safety, Income & Growth Inc. (NYSE: SAFE), the first publicly traded company exclusively focused on ground leases. |
▪ | Largest shareholder of SAFE (28% of shares outstanding). |
◦ | SAFE transactions generated a $179 million economic gain for iStar, comprised of: |
▪ | $123 million gain recorded in the second quarter 2017. |
▪ | $56 million gain to be recorded retrospectively for the second quarter 2017 upon adoption of new accounting standards on January 1, 2018. |
◦ | Judgment in favor of iStar on Bevard litigation, which generated $234 million of net proceeds and $125 million of income for iStar. |
1
Second Quarter 2017 Results
iStar reported net income allocable to common shareholders for the second quarter of $177.5 million, or $2.04 per diluted common share, versus $38.1 million, or $0.37 per diluted common share for the second quarter 2016.
Adjusted income allocable to common shareholders for the second quarter was $198.4 million, or $2.28 per diluted common share, versus $61.1 million, or $0.56 per diluted common share for the second quarter 2016.
Net income and adjusted income for the quarter reflect $235 million of income from our previously announced transactions to form and capitalize Safety, Income and Growth, Inc. (NYSE:SAFE) and the successful outcome of the Bevard litigation with Lennar Corporation, net of costs.
Adjusted income represents net income computed in accordance with GAAP, prior to the effects of certain non-cash items. The calculation of adjusted income and reconciliation to GAAP net income is presented in the financial tables that follow the text of this press release.
The Company has published a supplemental to this earnings release which is available at www.istar.com in the "Investors" section.
Safety, Income & Growth Inc.
iStar formed SAFE to expand and efficiently capitalize iStar's ground lease business. iStar contributed to SAFE an initial portfolio of 12 assets, many of which iStar had owned for more than a decade, which had a gross book value of $223 million and a net book value of $161 million, net of $62 million of depreciation, on March 31, 2017.
In March, SAFE completed a $227 million secured debt financing on the initial portfolio and distributed all of the proceeds of the financing to iStar. In April, through a merger and other transactions, two institutional investors acquired a 51% ownership interest in SAFE for $57.5 million, representing $20.00 per share, based on a total enterprise value of SAFE of $340 million, including the $227 million of in-place secured debt. iStar received the $57.5 million of cash proceeds from the acquisition transaction and retained a 49% interest in SAFE.
On June 27th, SAFE completed its $205 million initial public offering (IPO) and a $45 million concurrent private placement of common stock to iStar, each at a price of $20.00 per share. After giving effect to the IPO and concurrent private placement, iStar held 28% of SAFE's outstanding common stock.
2
As a result of the SAFE transactions, iStar:
• | received approximately $285 million of cash proceeds, including $227 million of financing raised during the first quarter; |
• | recorded $123 million of income in the second quarter, partially offset by $14 million of expensed IPO costs; |
• | expects to retrospectively record an additional gain of approximately $56 million in the second quarter 2017 when new revenue recognition accounting standards become effective on January 1, 2018; and |
• | owns 5,025,000 shares of SAFE (28% of shares outstanding). |
"We believe ground leases represent one of the most compelling investment opportunities in the real estate market. There are very few hard assets that offer safety in uncertain times, growing income in an environment in which rates remain at historically low levels, along with an opportunity for significant capital appreciation," said Jay Sugarman, chairman and chief executive officer. "We have created SAFE to allow iStar shareholders to benefit from what we believe is a large and attractive market opportunity."
iStar will manage SAFE pursuant to a management agreement. After the first anniversary of SAFE's IPO, iStar will receive an annual management fee equal to 1% of SAFE's equity which will be paid in shares of SAFE stock.
Following SAFE's IPO, iStar, along with two senior executives, have entered into a 10b5-1 stock purchase plan to purchase in the open market up to $25 million of additional SAFE common stock at prices below $20 per share.
Portfolio Overview and Investment Activity
At June 30, 2017, the Company’s portfolio totaled $4.2 billion, which is gross of $375 million of accumulated depreciation and $18 million of general loan loss reserves and includes $96 million market value of SAFE shares as of June 30, 2017.
iStar's strategy is to focus on finding investment opportunities within its real estate finance, net lease and ground leases businesses. In addition, the Company continues to make significant progress in developing and monetizing its operating properties and land & development assets.
3
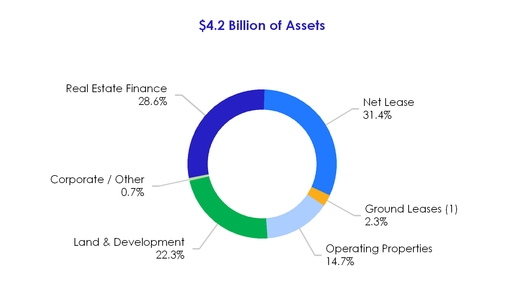
_______________________________________________________________________________
(1)Represents the market value of our equity method investment in SAFE as of June 30, 2017.
During the second quarter of 2017, the Company invested a total of $200 million associated with new investments (including SAFE), prior financing commitments and ongoing development across its four segments, and generated $441 million of proceeds from repayments and sales.
Real Estate Finance
iStar's real estate finance business targets sophisticated and innovative investors by providing one-stop capabilities that encompass financial alternatives ranging from full envelope senior loans to custom-tailored mezzanine and preferred equity capital positions.
At June 30, 2017, the Company’s real estate finance portfolio totaled $1.2 billion. The portfolio is categorized into iStar 3.0 loans, made post January 1, 2008, and legacy loans, which were all made prior to December 31, 2007.
4
Real Estate Finance Statistics | |||||||
$ in millions | |||||||
iStar 3.0 | Legacy Loans | ||||||
Gross book value | $ | 975 | $ | 213 | |||
% of total loan portfolio | 82 | % | 18 | % | |||
Performing loans | $ | 975 | $ | 24 | |||
Non-performing loans | $ | — | $ | 189 | |||
% Performing / Non-performing | 100% / 0% | 11% / 89% | |||||
First mortgages / senior loans | 63 | % | 27 | % | |||
Mezzanine / subordinated debt | 37 | % | 73 | % | |||
Total | 100 | % | 100 | % | |||
Wtd. avg. LTV (1) | 66.1 | % | n/a | ||||
Unlevered yield (1) | 9.7 | % | 8.9 | % | |||
Wtd. avg. maturity (years) (1) | 2.1 | 2.4 | |||||
Note: Gross book value represents the carrying value of iStar's loans, gross of general reserves. | |||||||
(1) Includes performing loans only. | |||||||
Net Lease
iStar's net lease business seeks to create stable cash flows through long-term leases to single tenants on its properties. The Company targets mission-critical facilities leased on a long-term basis to tenants, offering structured solutions that combine iStar's capabilities in underwriting, lease structuring, asset management and build-to-suit construction.
At the end of the quarter, iStar’s net lease portfolio totaled $1.4 billion, gross of $314 million of accumulated depreciation. The portfolio was comprised of $1.2 billion of wholly-owned assets, a $129 million equity investment in its net lease joint venture and the $96 million market value in shares of SAFE.
Since 2014, the Company has invested in new net lease investments primarily through its net lease joint venture with a sovereign wealth fund, in which it holds a 52% interest. At the end of the quarter, the venture's balance sheet, gross of $23 million of accumulated depreciation, included $650 million of assets, $357 million of liabilities and $270 million of equity (net of a $23 million non-controlling interest).
The overall net lease portfolio totaled 16 million square feet across 33 states. Occupancy for the portfolio was 98% at the end of the quarter, with a weighted average remaining lease term of 11.5 years. The net lease portfolio generated an unleveraged yield of 8.1% for the quarter.
5
Operating Properties
At the end of the quarter, iStar's operating property portfolio totaled $608 million, gross of $54 million of accumulated depreciation, and was comprised of $541 million of commercial and $67 million of residential real estate properties.
Commercial Operating Properties
The Company’s commercial operating properties represent a diverse pool of assets across a broad range of geographies and collateral types including office, retail and hotel properties. These properties generated $28.7 million of revenue offset by $20.9 million of operating expenses during the quarter. At the end of the second quarter, the Company had $343 million of stabilized assets and $198 million of transitional assets. iStar generally seeks to reposition transitional assets with the objective of maximizing their values through the infusion of capital and intensive asset management efforts.
Residential Operating Properties
At the end of the quarter, the $67 million residential operating portfolio was comprised of 36 units generally located within luxury projects in major U.S. cities. The Company sold 5 units during the quarter, generating $7.4 million of proceeds and a $0.8 million gain.
Land & Development
At the end of the quarter, the Company’s land & development portfolio totaled $925 million, including 8 master planned communities, 6 waterfront projects and 15 urban/infill developments. These projects are collectively entitled for approximately 13,000 lots and units.
For the quarter, the Company's land and development portfolio generated $132.7 million of revenues, offset by $122.5 million of cost of sales. In addition, the Company earned $3.6 million of earnings from land development equity method investments. During the quarter, the Company invested $29.0 million in its land portfolio.
Sales in the quarter included the conveyance of Bevard, a master planned community in Maryland, to Lennar following a judgment in the Company's favor in a long-standing legal dispute. The Company received a total of $234 million of net proceeds during the quarter which resulted in $123 million of other income and an $8 million income from the land sale. The Company had previously announced that Lennar had filed a petition with the Court of Appeals with respect to approximately $30 million of post-judgment interest, however that motion was denied. iStar is also entitled to recover attorneys' fees and costs which the Company is pursuing. A third party holds a 4.3% participation interest in all proceeds from the judgment.
6
Capital Markets and Balance Sheet
The Company is capitalized with unsecured and secured debt, preferred equity and common equity. The chart below shows the capital structure of the Company at quarter end.
Capital Structure | ||
$ in millions | ||
At June 30, 2017 | ||
Secured debt | $717 | |
Unsecured debt | $2,652 | |
Total debt | $3,369 | |
Preferred equity (A) (1) | $745 | |
Common equity (B) | $424 | |
Total equity | $1,169 | |
Accumulated depreciation and amortization and general loan loss reserves (2) (C) | $448 | |
Adjusted common equity (B) + (C) | $872 | |
Adjusted total equity (A) + (B) + (C) | $1,617 | |
(1) Represents liquidation preference value. (2) Accumulated depreciation and amortization includes iStar's proportionate share of accumulated depreciation and amortization relating to equity method investments. | ||
The Company’s weighted average cost of debt for the second quarter was 5.5%. The Company’s leverage was 1.5x at the end of the quarter, below the Company’s targeted range of 2.0x - 2.5x. The chart below shows the calculation of the Company's leverage.
7
Leverage | |||
$ in millions | |||
At June 30, 2017 | |||
Book debt | $ | 3,369 | |
Less: Cash and cash equivalents | (954 | ) | |
Net book debt (A) | $ | 2,415 | |
Book equity (1) | $ | 1,169 | |
Add: Accumulated depreciation and amortization (2) | 430 | ||
Add: General loan loss reserves | 18 | ||
Sum of book equity, accumulated D&A and general loan loss reserves (B) | $ | 1,617 | |
Leverage (A) / (B) | 1.5x | ||
(1) Includes preferred equity. (2) Accumulated depreciation and amortization includes iStar's proportionate share of accumulated depreciation and amortization relating to equity method investments. | |||
Liquidity
At the end of the quarter, iStar had unrestricted cash and capacity on its revolving credit facility of $1.2 billion, which will be available for investment activity, repayment of debt and working capital.
Liquidity | |
$ in millions | |
At June 30, 2017 | |
Unrestricted cash | $954 |
Revolving credit facility capacity | $235 |
Total liquidity | $1,189 |
Earnings Guidance
The Company's guidance remains:
◦ | Target net income per diluted common share of $2.15 - $2.65. |
◦ | Target adjusted income per diluted common share of $3.00 - $3.50. |
This guidance assumes, among other things, the closing of certain land & development and operating properties that the Company is marketing for sale and that general macro economic conditions continue to remain favorable. Please see the financial tables that follow the text of this press release for a reconciliation from GAAP net income guidance to adjusted income guidance.
8
Ÿ Ÿ Ÿ
iStar (NYSE: STAR) finances, invests in and develops real estate and real estate related projects as part of its fully-integrated investment platform. Building on over two decades of experience and more than $35 billion of transactions, iStar brings uncommon capabilities and new ways of thinking to commercial real estate and adapts its investment strategy to changing market conditions. The Company is structured as a real estate investment trust (“REIT”), with a diversified portfolio focused on larger assets located in major metropolitan markets.
iStar will hold a quarterly earnings conference call at 10:00 a.m. ET today, August 3, 2017. This conference call will be broadcast live over the internet and can be accessed by all interested parties through iStar’s website, www.istar.com. To listen to the live call, please go to the website’s “Investors” section at least 15 minutes prior to the start of the call to register, download and install any necessary audio software. For those who are not available to listen to the live broadcast, a replay will be available shortly after the call on iStar's website.
Note: Statements in this press release which are not historical fact may be deemed forward-looking statements within the meaning of Section 27A of the Securities Act of 1933 and Section 21E of the Securities Exchange Act of 1934. Although iStar believes the expectations reflected in any forward-looking statements are based on reasonable assumptions, the Company can give no assurance that its expectations will be attained. The Company undertakes no obligation to update or revise publicly any forward look statements, whether as a result of new information, future events or otherwise. Factors that could cause actual results to differ materially from iStar’s expectations include general economic conditions and conditions in the commercial real estate and credit markets, the Company’s ability to generate liquidity and to repay indebtedness as it comes due, additional loan loss provisions, the amount and timing of asset sales, changes in NPLs, repayment levels, the Company's ability to make new investments, the Company’s ability to maintain compliance with its debt covenants, the Company’s ability to generate income and gains from operating properties and land and other risks detailed from time to time in iStar SEC reports.
Company Contact:
Jason Fooks, Vice President of Investor Relations & Marketing
1114 Avenue of the Americas
New York, NY 10036
(212) 930-9400
investors@istar.com
9
iStar
Consolidated Statements of Operations
(In thousands)
(unaudited)
Three Months Ended June 30, | For the Six Months Ended June 30, | |||||||||||||||
2017 | 2016 | 2017 | 2016 | |||||||||||||
REVENUES | ||||||||||||||||
Operating lease income | $ | 47,002 | $ | 49,975 | $ | 94,349 | $ | 100,470 | ||||||||
Interest income | 28,645 | 34,400 | 57,703 | 67,620 | ||||||||||||
Other income | 139,510 | 10,096 | 151,374 | 21,636 | ||||||||||||
Land development revenue | 132,710 | 27,888 | 152,760 | 42,835 | ||||||||||||
Total revenues | $ | 347,867 | $ | 122,359 | $ | 456,186 | $ | 232,561 | ||||||||
COST AND EXPENSES | ||||||||||||||||
Interest expense | $ | 48,807 | $ | 56,047 | $ | 99,952 | $ | 113,068 | ||||||||
Real estate expense | 34,684 | 35,328 | 70,274 | 69,572 | ||||||||||||
Land development cost of sales | 122,466 | 17,262 | 138,376 | 28,838 | ||||||||||||
Depreciation and amortization | 13,171 | 13,673 | 25,451 | 27,581 | ||||||||||||
General and administrative(1) | 27,218 | 19,665 | 52,392 | 42,768 | ||||||||||||
(Recovery of) provision for loan losses | (600 | ) | 700 | (5,528 | ) | 2,206 | ||||||||||
Impairment of assets | 10,284 | 3,012 | 14,696 | 3,012 | ||||||||||||
Other expense | 16,276 | 3,182 | 18,145 | 3,922 | ||||||||||||
Total costs and expenses | $ | 272,306 | $ | 148,869 | $ | 413,758 | $ | 290,967 | ||||||||
Income (loss) before other items | $ | 75,561 | $ | (26,510 | ) | $ | 42,428 | $ | (58,406 | ) | ||||||
Income (loss) from discontinued operations | 173 | 3,633 | 4,939 | 7,214 | ||||||||||||
Gain from discontinued operations | 123,418 | — | 123,418 | — | ||||||||||||
Income tax expense from discontinued operations | (4,545 | ) | — | (4,545 | ) | — | ||||||||||
Income from sales of real estate | 844 | 43,484 | 8,954 | 53,943 | ||||||||||||
Earnings from equity method investments | 5,515 | 39,447 | 11,217 | 47,714 | ||||||||||||
Income tax benefit (expense) | (1,644 | ) | 1,190 | (2,251 | ) | 1,604 | ||||||||||
Loss on early extinguishment of debt | (3,315 | ) | (1,457 | ) | (3,525 | ) | (1,582 | ) | ||||||||
Net income (loss) | $ | 196,007 | $ | 59,787 | $ | 180,635 | $ | 50,487 | ||||||||
Net (income) loss attributable to noncontrolling interests | (5,710 | ) | (8,825 | ) | (4,610 | ) | (7,883 | ) | ||||||||
Net income (loss) attributable to iStar | $ | 190,297 | $ | 50,962 | $ | 176,025 | $ | 42,604 | ||||||||
Preferred dividends | (12,830 | ) | (12,830 | ) | (25,660 | ) | (25,660 | ) | ||||||||
Net (income) loss allocable to Participating Security holders(2) | — | (20 | ) | — | (11 | ) | ||||||||||
Net income (loss) allocable to common shareholders | $ | 177,467 | $ | 38,112 | $ | 150,365 | $ | 16,933 | ||||||||
_______________________________________________________________________________
(1) For the three months ended June 30, 2017 and 2016, includes $3,915 and $1,633 of stock-based compensation expense, respectively. For the six months ended June 30, 2017 and 2016, includes $9,796 and $6,211 of stock-based compensation expense, respectively.
(2) Participating Security holders are non-employee directors who hold common stock equivalents and restricted stock awards granted under the Company's LTIP who are eligible to participate in dividends.
10
iStar
Supplemental Information
(In thousands, except per share data)
(unaudited)
Three Months Ended June 30, | For the Six Months Ended June 30, | |||||||||||||||
2017 | 2016 | 2017 | 2016 | |||||||||||||
ADJUSTED INCOME (1) | ||||||||||||||||
Reconciliation of Net Income to Adjusted Income | ||||||||||||||||
Net income (loss) allocable to common shareholders | $ | 177,467 | $ | 38,112 | $ | 150,365 | $ | 16,933 | ||||||||
Add: Depreciation and amortization | 15,620 | 17,335 | 30,672 | 34,508 | ||||||||||||
Add: (Recovery of) provision for loan losses | (600 | ) | 700 | (5,528 | ) | 2,206 | ||||||||||
Add: Impairment of assets | 10,284 | 3,012 | 14,696 | 3,927 | ||||||||||||
Add: Stock-based compensation expense | 3,915 | 1,633 | 9,796 | 6,211 | ||||||||||||
Add: Loss on early extinguishment of debt | 565 | 1,457 | 775 | 1,582 | ||||||||||||
Less: Losses on charge-offs and dispositions | (8,811 | ) | (1,148 | ) | (14,127 | ) | (4,563 | ) | ||||||||
Less: Participating Security allocation | — | (12 | ) | — | (28 | ) | ||||||||||
Adjusted income allocable to common shareholders | $ | 198,440 | $ | 61,089 | $ | 186,649 | $ | 60,776 | ||||||||
_______________________________________________________________________________
(1) Adjusted Income allocable to common shareholders should be examined in conjunction with net income (loss) as shown in the Consolidated Statements of Operations. This non-GAAP financial measure should not be considered as an alternative to net income (determined in accordance with GAAP) or to cash flows from operating activities (determined in accordance with GAAP) as a measure of the Company’s liquidity, nor is it indicative of funds available to fund the Company’s cash needs or available for distribution to shareholders. Rather, Adjusted Income is an additional measure the Company uses to analyze its business performance because it excludes the effects of certain non-cash charges that the Company believes are not necessarily indicative of its operating performance while including the effect of gains or losses on investments when realized. It should be noted that the Company’s manner of calculating this non-GAAP financial measure may differ from the calculations of similarly-titled measures by other companies. Management considers this non-GAAP financial measure as supplemental information to net income in analyzing the performance of our underlying business. Depreciation and amortization includes our proportionate share of depreciation and amortization expense relating to equity method investments and excludes the portion of depreciation and amortization expense allocable to non-controlling interests. Impairment of assets includes impairments on cost and equity method investments recorded in other income and earnings from equity method investments, respectively. Effective in the second quarter 2016, the Company modified its presentation of Adjusted Income to include losses on charge-offs and dispositions of previously impaired or reserved assets to provide a more informative metric for investors to help evaluate our operating performance. Losses on charge-offs and dispositions represents the impact of charge-offs and dispositions realized during the period. These charge-offs and dispositions were taken on assets that were previously impaired for GAAP and reflected in net income but not in Adjusted Income.
Reconciliation of Adjusted Income per Share Guidance
to Net Income per Share Guidance
For the Year Ending | |
December 31, 2017 | |
Targeted Net Income per Diluted Common Share Range | $2.15 - $2.65 |
Add: Depreciation and amortization | $0.67 - $0.71 |
Add: Other non-cash adjustments | $0.54 - $0.58 |
Less: Losses on charge-offs and dispositions | ($0.36) - ($0.44) |
Targeted Adjusted Income per Diluted Common Share Range | $3.00 - $3.50 |
11
iStar
Earnings Per Share Information
(In thousands, except per share data)
(unaudited)
Three Months Ended June 30, | For the Six Months Ended June 30, | |||||||||||||||
2017 | 2016 | 2017 | 2016 | |||||||||||||
EPS INFORMATION FOR COMMON SHARES | ||||||||||||||||
Income (loss) from continuing operations attributable to iStar(1) | ||||||||||||||||
Basic | $ | 0.81 | $ | 0.47 | $ | 0.37 | $ | 0.13 | ||||||||
Diluted | $ | 0.69 | $ | 0.34 | $ | 0.35 | $ | 0.13 | ||||||||
Net income (loss) | ||||||||||||||||
Basic | $ | 2.46 | $ | 0.52 | $ | 2.09 | $ | 0.22 | ||||||||
Diluted | $ | 2.04 | $ | 0.37 | $ | 1.76 | $ | 0.22 | ||||||||
Adjusted income | ||||||||||||||||
Basic | $ | 2.75 | $ | 0.83 | $ | 2.59 | $ | 0.80 | ||||||||
Diluted | $ | 2.28 | $ | 0.56 | $ | 2.17 | $ | 0.59 | ||||||||
Weighted average shares outstanding | ||||||||||||||||
Basic | 72,142 | 73,984 | 72,104 | 75,522 | ||||||||||||
Diluted (for net income per share) | 88,195 | 118,510 | 88,156 | 75,872 | ||||||||||||
Diluted (for adjusted income per share) | 88,195 | 118,510 | 88,156 | 120,006 | ||||||||||||
Common shares outstanding at end of period | 72,190 | 71,891 | 72,190 | 71,891 | ||||||||||||
_______________________________________________________________________________
(1) Including preferred dividends, net (income) loss attributable to noncontrolling interests and income from sales of real estate.
12
iStar
Consolidated Balance Sheets
(In thousands)
(unaudited)
As of | As of | ||||||
June 30, 2017 | December 31, 2016 | ||||||
ASSETS | |||||||
Real estate | |||||||
Real estate, at cost | $ | 1,710,915 | $ | 1,740,893 | |||
Less: accumulated depreciation | (367,933 | ) | (353,619 | ) | |||
Real estate, net | $ | 1,342,982 | $ | 1,387,274 | |||
Real estate available and held for sale | 68,045 | 237,531 | |||||
$ | 1,411,027 | $ | 1,624,805 | ||||
Land and development, net | 855,497 | 945,565 | |||||
Loans receivable and other lending investments, net | 1,170,565 | 1,450,439 | |||||
Other investments | 276,821 | 214,406 | |||||
Cash and cash equivalents | 954,279 | 328,744 | |||||
Accrued interest and operating lease income receivable, net | 10,501 | 11,254 | |||||
Deferred operating lease income receivable | 88,944 | 88,189 | |||||
Deferred expenses and other assets, net | 147,121 | 162,112 | |||||
Total assets | $ | 4,914,755 | $ | 4,825,514 | |||
LIABILITIES AND EQUITY | |||||||
Accounts payable, accrued expenses and other liabilities | $ | 230,259 | $ | 211,570 | |||
Loan participations payable, net | 107,442 | 159,321 | |||||
Debt obligations, net | 3,368,113 | 3,389,908 | |||||
Total liabilities | $ | 3,705,814 | $ | 3,760,799 | |||
Redeemable noncontrolling interests | $ | 3,585 | $ | 5,031 | |||
Total iStar shareholders' equity | $ | 1,169,278 | $ | 1,016,564 | |||
Noncontrolling interests | 36,078 | 43,120 | |||||
Total equity | $ | 1,205,356 | $ | 1,059,684 | |||
Total liabilities and equity | $ | 4,914,755 | $ | 4,825,514 | |||
13
iStar
Segment Analysis
(In thousands)
(unaudited)
FOR THE THREE MONTHS ENDED JUNE 30, 2017 | |||||||||||||||||||||||
Real Estate Finance | Net Lease | Operating Properties | Land & Dev | Corporate / Other | Total | ||||||||||||||||||
Operating lease income | $ | — | $ | 30,852 | $ | 15,940 | $ | 210 | $ | — | $ | 47,002 | |||||||||||
Interest income | 28,645 | — | — | — | — | 28,645 | |||||||||||||||||
Other income | 479 | 550 | 13,333 | 123,871 | 1,277 | 139,510 | |||||||||||||||||
Land development revenue | — | — | — | 132,710 | — | 132,710 | |||||||||||||||||
Earnings from equity method investments | — | 1,080 | 469 | 3,606 | 360 | 5,515 | |||||||||||||||||
Income from disc. operations | — | 173 | — | — | — | 173 | |||||||||||||||||
Gains from disc. operations | — | 123,418 | — | — | — | 123,418 | |||||||||||||||||
Income from sales of real estate | — | — | 844 | — | — | 844 | |||||||||||||||||
Total revenue and other earnings | $ | 29,124 | $ | 156,073 | $ | 30,586 | $ | 260,397 | $ | 1,637 | $ | 477,817 | |||||||||||
Real estate expense | — | (4,064 | ) | (22,653 | ) | (7,967 | ) | — | (34,684 | ) | |||||||||||||
Land development cost of sales | — | — | — | (122,466 | ) | — | (122,466 | ) | |||||||||||||||
Other expense | (399 | ) | — | — | — | (15,877 | ) | (16,276 | ) | ||||||||||||||
Allocated interest expense | (10,508 | ) | (13,669 | ) | (5,006 | ) | (7,122 | ) | (12,502 | ) | (48,807 | ) | |||||||||||
Allocated G&A(1) | (4,691 | ) | (5,921 | ) | (2,364 | ) | (5,004 | ) | (5,323 | ) | (23,303 | ) | |||||||||||
Segment profit (loss) | $ | 13,526 | $ | 132,419 | $ | 563 | $ | 117,838 | $ | (32,065 | ) | $ | 232,281 | ||||||||||
_______________________________________________________________________________
(1) Excludes $3,915 of stock-based compensation expense.
AS OF JUNE 30, 2017 | |||||||||||||||||||||||
Real Estate Finance | Net Lease | Operating Properties | Land & Dev | Corporate / Other | Total | ||||||||||||||||||
Real estate | |||||||||||||||||||||||
Real estate, at cost | $ | — | $ | 1,177,779 | $ | 533,136 | $ | — | $ | — | $ | 1,710,915 | |||||||||||
Less: accumulated depreciation | — | (314,373 | ) | (53,560 | ) | — | — | (367,933 | ) | ||||||||||||||
Real estate, net | $ | — | $ | 863,406 | $ | 479,576 | $ | — | $ | — | $ | 1,342,982 | |||||||||||
Real estate available and held for sale | — | 924 | 67,121 | — | — | 68,045 | |||||||||||||||||
Total real estate | $ | — | $ | 864,330 | $ | 546,697 | $ | — | $ | — | $ | 1,411,027 | |||||||||||
Land & development, net | — | — | — | 855,497 | — | 855,497 | |||||||||||||||||
Loans receivable and other lending investments, net | 1,170,565 | — | — | — | — | 1,170,565 | |||||||||||||||||
Other investments | — | 179,284 | 7,882 | 62,417 | 27,238 | 276,821 | |||||||||||||||||
Total portfolio assets | $ | 1,170,565 | $ | 1,043,614 | $ | 554,579 | $ | 917,914 | $ | 27,238 | $ | 3,713,910 | |||||||||||
Cash and other assets | 1,200,845 | ||||||||||||||||||||||
Total assets | $ | 4,914,755 | |||||||||||||||||||||
14
iStar
Supplemental Information
(In thousands)
(unaudited)
Three Months Ended June 30, 2017 | |||||||||||
OPERATING STATISTICS | |||||||||||
Expense Ratio | |||||||||||
General and administrative expenses - trailing twelve months (A) | $ | 93,651 | |||||||||
Average total assets (B) | $ | 5,096,440 | |||||||||
Expense Ratio (A) / (B) | 1.8 | % | |||||||||
As of | |||||||||||
June 30, 2017 | |||||||||||
UNENCUMBERED ASSETS / UNSECURED DEBT | |||||||||||
Unencumbered assets (C)(1) | $ | 3,911,045 | |||||||||
Unsecured debt (D) | $ | 2,670,000 | |||||||||
Unencumbered Assets / Unsecured Debt (C) / (D) | 1.5x | ||||||||||
UNFUNDED COMMITMENTS | |||||||||||
Performance-based commitments(2) | $ | 342,921 | |||||||||
Strategic investments | 45,634 | ||||||||||
Total Unfunded Commitments | $ | 388,555 | |||||||||
LOAN RECEIVABLE CREDIT STATISTICS | As of | ||||||||||
June 30, 2017 | December 31, 2016 | ||||||||||
Carrying value of NPLs / | |||||||||||
As a percentage of total carrying value of loans | $ | 188,670 | 17.4 | % | $ | 191,696 | 14.0 | % | |||
Total reserve for loan losses / | |||||||||||
As a percentage of total gross carrying value of loans(3) | $ | 78,789 | 6.8 | % | $ | 85,545 | 5.9 | % | |||
_______________________________________________________________________________
(1) Unencumbered assets are calculated in accordance with the indentures governing the Company's unsecured debt securities.
(2) Excludes $130.3 million of commitments on loan participations sold that are not the obligation of the Company but are consolidated on the Company's balance sheet.
(3) Gross carrying value represents iStar's carrying value of loans, gross of loan loss reserves.
15
iStar
Supplemental Information
(In millions)
(unaudited)
PORTFOLIO STATISTICS AS OF JUNE 30, 2017(1) | |||||||||||||||||||||||
Property Type | Real Estate Finance | Net Lease | Operating Properties | Land & Dev | Total | % of Total | |||||||||||||||||
Land & Development | $ | — | $ | — | $ | — | $ | 925 | $ | 925 | 22 | % | |||||||||||
Office / Industrial | 37 | 761 | 123 | — | 921 | 22 | % | ||||||||||||||||
Entertainment / Leisure | — | 490 | — | — | 490 | 12 | % | ||||||||||||||||
Mixed Use / Collateral | 297 | — | 180 | — | 477 | 11 | % | ||||||||||||||||
Hotel | 338 | — | 103 | — | 441 | 11 | % | ||||||||||||||||
Condominium | 258 | — | 66 | — | 324 | 8 | % | ||||||||||||||||
Other Property Types | 229 | — | — | — | 229 | 6 | % | ||||||||||||||||
Retail | 29 | 57 | 136 | — | 222 | 5 | % | ||||||||||||||||
Ground Leases | — | 96 | — | — | 96 | 2 | % | ||||||||||||||||
Strategic Investments | — | — | — | — | 27 | 1 | % | ||||||||||||||||
Total | $ | 1,188 | $ | 1,404 | $ | 608 | $ | 925 | $ | 4,153 | 100 | % | |||||||||||
Geography | Real Estate Finance | Net Lease | Operating Properties | Land & Dev | Total | % of Total | |||||||||||||||||
Northeast | $ | 569 | $ | 399 | $ | 47 | $ | 258 | $ | 1,273 | 30 | % | |||||||||||
West | 98 | 312 | 43 | 365 | 818 | 20 | % | ||||||||||||||||
Southeast | 175 | 250 | 147 | 124 | 696 | 17 | % | ||||||||||||||||
Southwest | 60 | 160 | 243 | 22 | 485 | 12 | % | ||||||||||||||||
Central | 188 | 98 | 72 | 32 | 390 | 9 | % | ||||||||||||||||
Mid-Atlantic | — | 154 | 47 | 124 | 325 | 8 | % | ||||||||||||||||
Various | 98 | 31 | 10 | — | 139 | 3 | % | ||||||||||||||||
Strategic Investments | — | — | — | — | 27 | 1 | % | ||||||||||||||||
Total | $ | 1,188 | $ | 1,404 | $ | 608 | $ | 925 | $ | 4,153 | 100 | % | |||||||||||
_______________________________________________________________________________
(1) Based on carrying value of the Company's total investment portfolio, gross of accumulated depreciation, general loan loss reserves and market value of its investment in shares of SAFE stock.
16