Attached files
| file | filename |
|---|---|
| 8-K - 8-K - SHORE BANCSHARES INC | v472135_8k.htm |
Exhibit 99.1

KBW 2017 COMMUNITY BANK KBW 2017 COMMUNITY BANK INVESTOR CONFERENCE August 1 - 2, 2017

Safe Harbor Regarding Forward - Looking Statements This presentation may contain “forward - looking statements” within the meaning of the Private Securities Litigation Reform Act of 1995 regarding Shore Bancshares, Inc. (the “Company”). Forward - looking statements often include the words “believes,” “expects,” “anticipates,” “estimates,” “forecasts,” “intends,” “plans,” “targets,” “potentially,” “probably,” “projects,” “outlook” or s imi lar expressions or future or conditional verbs such as “may,” “will,” “should,” “would” and “could.” These forward - looking statements are subjec t to known and unknown risks, uncertainties and other factors that could cause the actual results to differ materially from the fo rwa rd - looking statements, including, without limitation, the following: the strength of the United States economy in general and the streng th of the local economies in which the Company conducts operations; fluctuations in interest rates and in real estate values; monetary and fiscal policies of the Board of Governors of the Federal Reserve System and the U.S. Government and other governmental initiatives a ffe cting the financial services industry; the risks of lending and investing activities, including changes in the level and direction of loan delinquencies and write - offs and changes in estimates of the adequacy of the allowance for loan losses; the Company’s ability to access cost - effective funding; the timely development of and acceptance of the Bank’s new products and services and the perceived overa ll value of these products and services by users, including the features, pricing and quality compared to competitors’ products and services; expected cost savings, synergies and other benefits from the Company’s merger and acquisition activities might not be realize d w ithin the anticipated time frames or at all, and costs or difficulties relating to integration matters, including but not limited to cu sto mer and employee retention, might be greater than expected; fluctuations in real estate values and both residential and commercial re al estate market conditions; demand for loans and deposits in the Company’s market areas; legislative or regulatory changes that advers ely affect the Company’s business; results of examinations of the Company and its subsidiaries by their regulators, including the possib ili ty that such regulators may, among other things, take regulatory enforcement action or require the Company’s bank subsidiary to incre ase their reserves for loan losses or to write - down assets; the impact of technological changes; and the Company’s success at managing the risks involved in the foregoing. Any forward - looking statements are based upon management’s beliefs and assumptions at the time they a re made. The Company undertakes no obligation to publicly update or revise any forward - looking statements or to update the reasons why ac tual results could differ from those contained in such statements, whether as a result of new information, future events or otherw ise . In light of these risks, uncertainties and assumptions, the forward - looking statements discussed might not occur, and you should not put undue reliance on any forward - looking statements. Important Statements 2

Management Team Name Title/Function Entity Years in Banking Years with Company L. Lloyd “Scott” Beatty, Jr. President and Chief Executive Officer SHBI 24 11 Edward C. Allen SVP and Chief Financial Officer SHBI, Bank 40 6 Donna J. Stevens SVP and Chief Operating Officer SHBI, Bank 37 19 Patrick M. Bilbrough President and Chief Executive Officer Bank 20 6 Charles E. Ruch, Jr. SVP and Chief Credit Officer Bank 30 11 Michael T. Cavey SVP and Chief Lending Officer Bank 33 3 W. David Morse SVP and Legal Counsel SHBI, Bank Bank 26 31 26 1 Jennifer Joseph SVP and Chief Retail Banking Officer 241 83 Significant depth of executive management talent as well as across our employee base. SHBI: Shore Bancshares, Inc. Bank: Shore United Bank 3
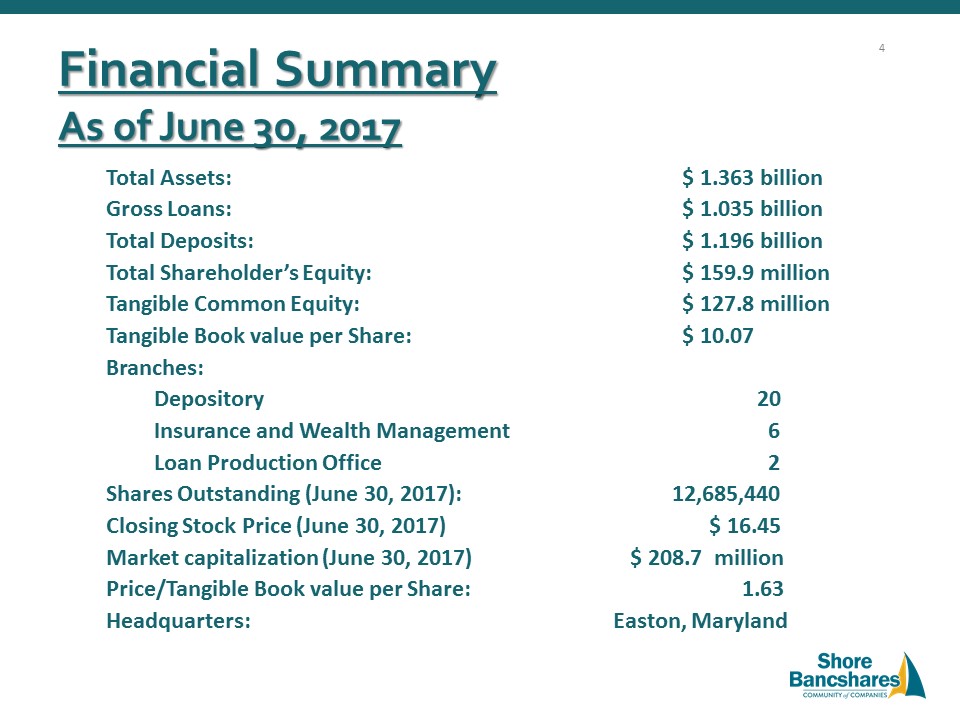
Financial Summary As of June 30, 2017 Total Assets: $ 1.363 billion Gross Loans: $ 1.035 billion Total Deposits: $ 1.196 billion Total Shareholder’s Equity: $ 159.9 million Tangible Common Equity: $ 127.8 million Tangible Book value per Share: $ 10.07 Branches: Depository 20 Insurance and Wealth Management 6 Loan Production Office 2 Shares Outstanding (June 30, 2017): 12,685,440 Closing Stock Price (June 30, 2017) $ 16.45 Market capitalization (June 30, 2017) $ 208.7 million Price/Tangible Book value per Share: 1.63 Headquarters: Easton, Maryland 4
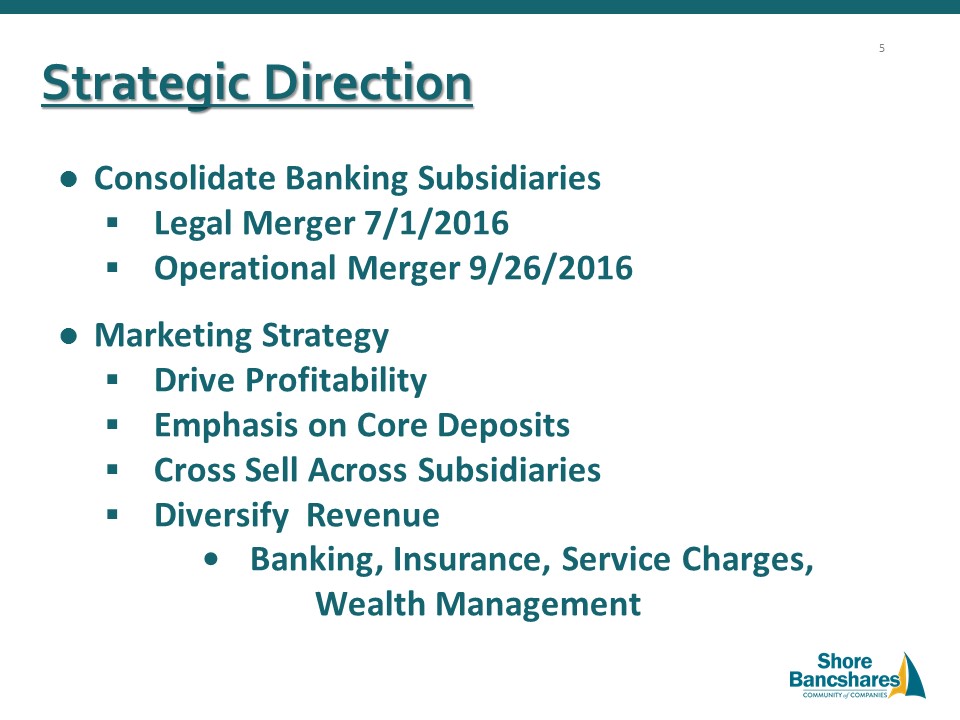
Strategic Direction Consolidate Banking Subsidiaries ▪ Legal Merger 7/1/2016 ▪ Operational Merger 9/26/2016 Marketing Strategy ▪ Drive Profitability ▪ Emphasis on Core Deposits ▪ Cross Sell Across Subsidiaries ▪ Diversify Revenue • Banking, Insurance, Service Charges, Wealth Management 5

Strategic Direction Market Expansion ▪ LPO’s and Strategic Branching ▪ Acquire Banks Contiguous to our Existing Markets ▪ Leverage Existing Platform ● Striving to be the Bank and Employer of Choice on the Delmarva ▪ Dominant Independent Locally Headquartered Company in our Footprint ▪ Opportunity to Dominate the Delmarva 6
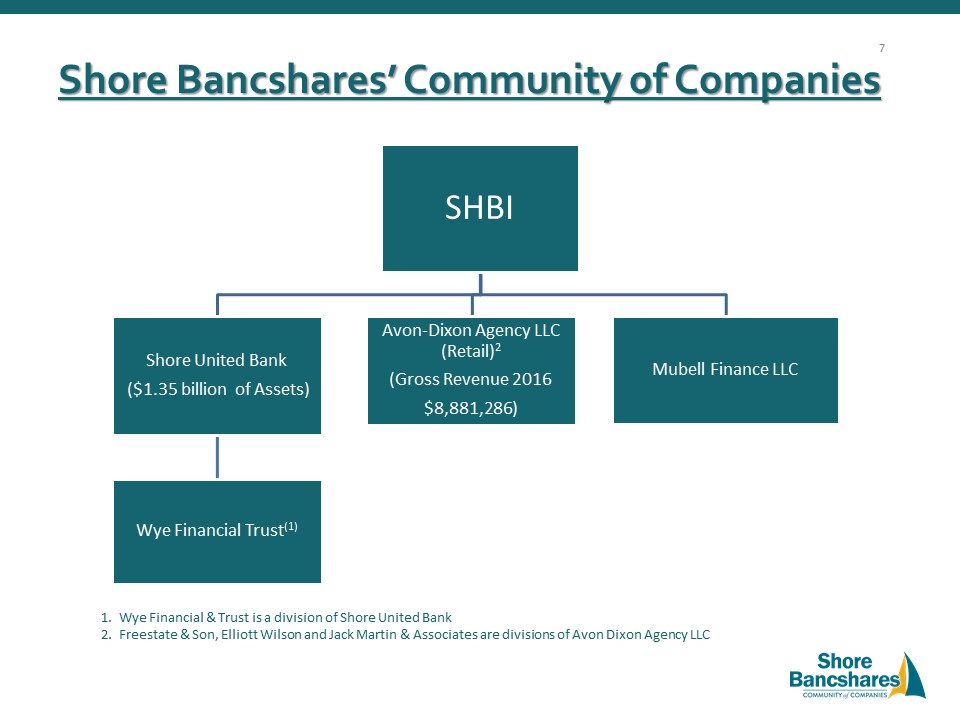
Shore Bancshares’ Community of Companies SHBI Shore United Bank ($1.35 billion of Assets) Wye Financial Trust (1) Avon - Dixon Agency LLC (Retail) 2 (Gross Revenue 2016 $8,881,286) Mubell Finance LLC 1. Wye Financial & Trust is a division of Shore United Bank 2. Freestate & Son, Elliott Wilson and Jack Martin & Associates are divisions of Avon Dixon Agency LLC 7

Shore Bancshares’ Community of Companies 8

28 locations 20 branches 2 loan production offices 6 non - bank offices Branch Map 9

Geographical Diversification In addition to expansion to the Baltimore suburbs, Shore United is entering new markets East and Southeast: Lower Shore expansion – Hiring of Market Executive LPO – Ocean City, MD opened early 2 nd quarter - Hired top lenders in market - Potential for full service branch there New Branch in Onley, VA - Opening late 3 rd quarter - Good deposit gathering potential - Market disruption there - Market Executive has background there Potential to fill in gaps – East and Southeast 10

Selected SHBI Market Highlights ▪ Household income for entire franchise is $76,252 in MD and $63,487 in DE vs. $57,462 for the US. ▪ Projected HH income change (2017 - 2022) is 4.05% for MD, and 5.78% for DE ▪ Projected 5 - year population growth rate (2017 - 2022) in overall market = 3.60% for MD and 5.11% for DE ▪ SHBI deposit market rank/share by county (2016): * Source:SNL Maryland Rank Share # Branches Talbot #1 41.90% 4 Queen Anne’s #2 25.39% 5 Caroline #3 15.52% 2 Kent #5 8.54% 1 Dorchester #8 5.47% 1 Baltimore #15 1.09% 2 Howard #17 0.48% 1 Delaware Rank Share #Branches Kent #6 4.74% 4 11
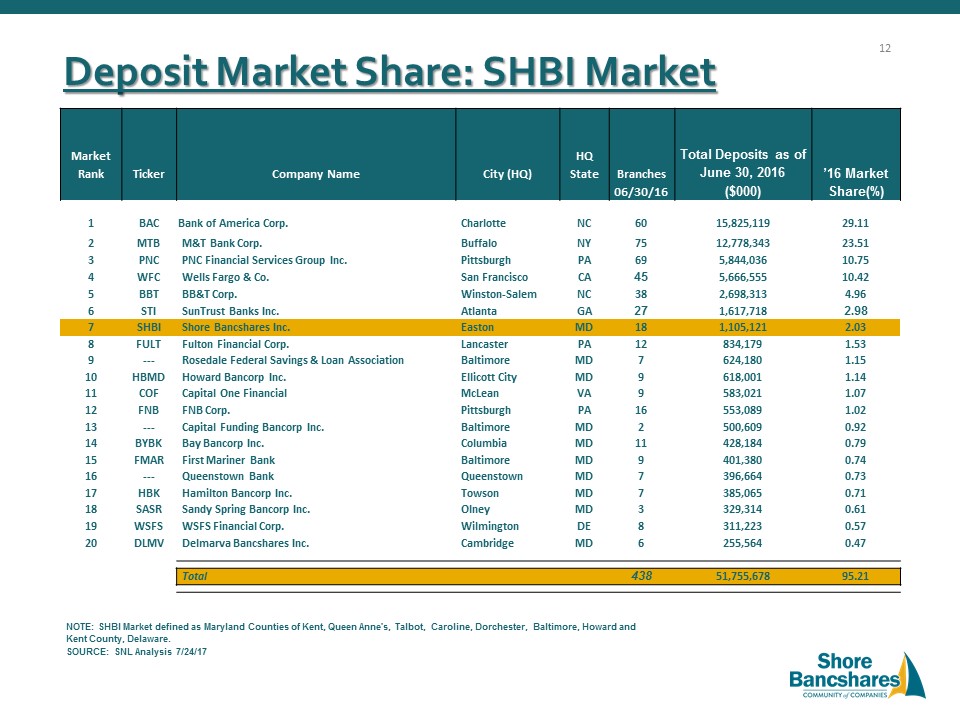
Deposit Market Share: SHBI Market Market Rank Ticker Company Name City (HQ) HQ State Branches 06/30/16 Total Deposits as of June 30, 2016 ($000) ’16 Market Share(%) 1 BAC Bank of America Corp. Charlotte NC 60 15,825,119 29.11 2 MTB M&T Bank Corp. Buffalo NY 75 12,778,343 23.51 3 PNC PNC Financial Services Group Inc. Pittsburgh PA 69 5,844,036 10.75 4 WFC Wells Fargo & Co. San Francisco CA 45 5,666,555 10.42 5 BBT BB&T Corp. Winston - Salem NC 38 2,698,313 4.96 6 STI SunTrust Banks Inc. Atlanta GA 27 1,617,718 2.98 7 SHBI Shore Bancshares Inc. Easton MD 18 1,105,121 2.03 8 FULT Fulton Financial Corp. Lancaster PA 12 834,179 1.53 9 --- Rosedale Federal Savings & Loan Association Baltimore MD 7 624,180 1.15 10 HBMD Howard Bancorp Inc. Ellicott City MD 9 618,001 1.14 11 COF Capital One Financial McLean VA 9 583,021 1.07 12 FNB FNB Corp. Pittsburgh PA 16 553,089 1.02 13 --- Capital Funding Bancorp Inc. Baltimore MD 2 500,609 0.92 14 BYBK Bay Bancorp Inc. Columbia MD 11 428,184 0.79 15 FMAR First Mariner Bank Baltimore MD 9 401,380 0.74 16 --- Queenstown Bank Queenstown MD 7 396,664 0.73 17 HBK Hamilton Bancorp Inc. Towson MD 7 385,065 0.71 18 SASR Sandy Spring Bancorp Inc. Olney MD 3 329,314 0.61 19 WSFS WSFS Financial Corp. Wilmington DE 8 311,223 0.57 20 DLMV Delmarva Bancshares Inc. Cambridge MD 6 255,564 0.47 Total 438 51,755,678 95.21 NOTE: SHBI Market defined as Maryland Counties of Kent, Queen Anne's, Talbot, Caroline, Dorchester, Baltimore, Howard and Kent County, Delaware . SOURCE: SNL Analysis 7/24/17 12
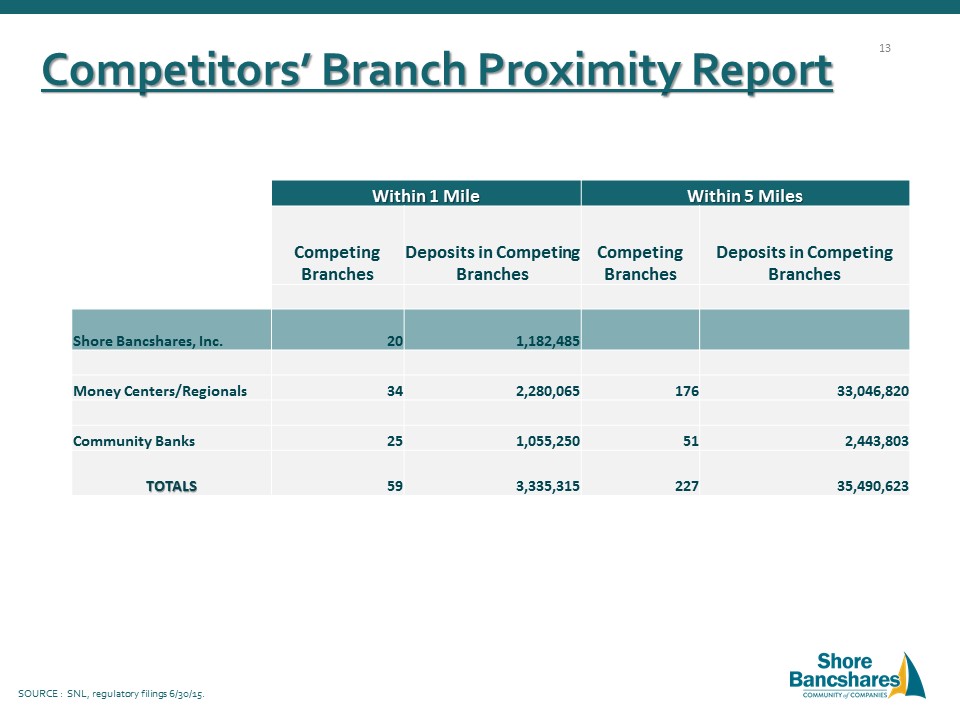
Competitors’ Branch Proximity Report Within 1 Mile Within 5 Miles Competing Branches Deposits in Competing Branches Competing Branches Deposits in Competing Branches Shore Bancshares, Inc. 20 1,182,485 Money Centers/Regionals 34 2,280,065 176 33,046,820 Community Banks 25 1,055,250 51 2,443,803 TOTALS 59 3,335,315 227 35,490,623 SOURCE : SNL, regulatory filings 6/30/15. 13
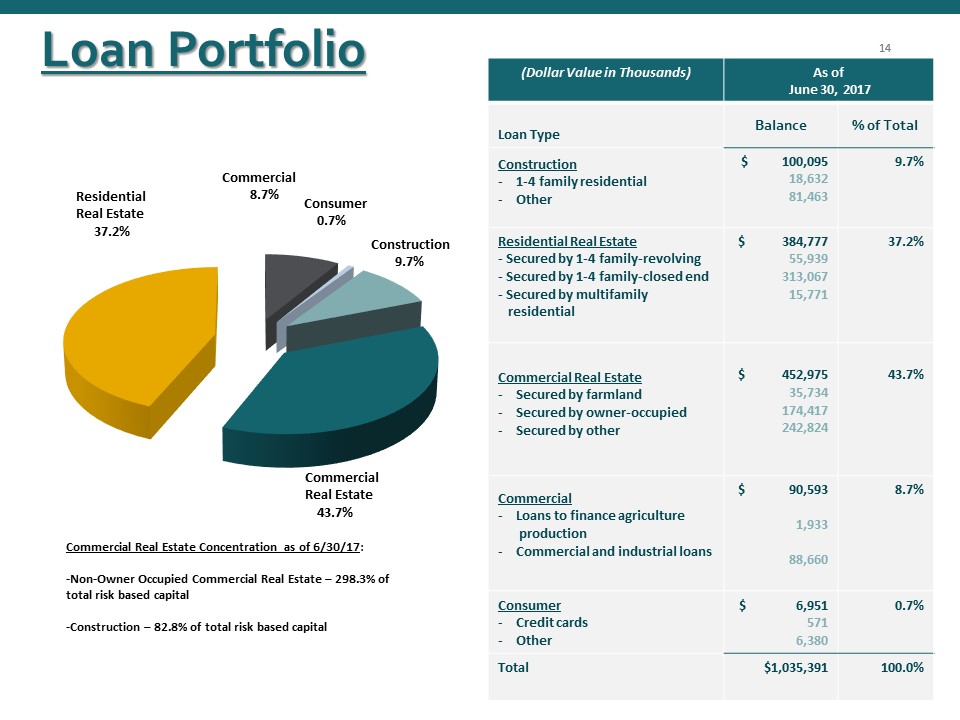
Loan Portfolio (Dollar Value in Thousands) As of June 30, 2017 Loan Type Balance % of Total Construction - 1 - 4 family residential - Other $ 100,095 18,632 81,463 9.7% Residential Real Estate - Secured by 1 - 4 family - revolving - Secured by 1 - 4 family - closed end - Secured by multifamily residential $ 384,777 55,939 313,067 15,771 37.2% Commercial Real Estate - Secured by farmland - Secured by owner - occupied - Secured by other $ 452,975 35,734 174,417 242,824 43.7% Commercial - Loans to finance agriculture production - Commercial and industrial loans $ 90,593 1,933 88,660 8.7% Consumer - Credit cards - Other $ 6,951 571 6,380 0.7% Total $1,035,391 100.0% 14 Residential Real Estate 37.2% Commercial 8.7% Consumer 0.7% Construction 9.7% Commercial Real Estate 43.7% 14 Commercial Real Estate Concentration as of 6/30/17 : - Non - Owner Occupied Commercial Real Estate – 298.3% of total risk based capital - Construction – 82.8% of total risk based capital
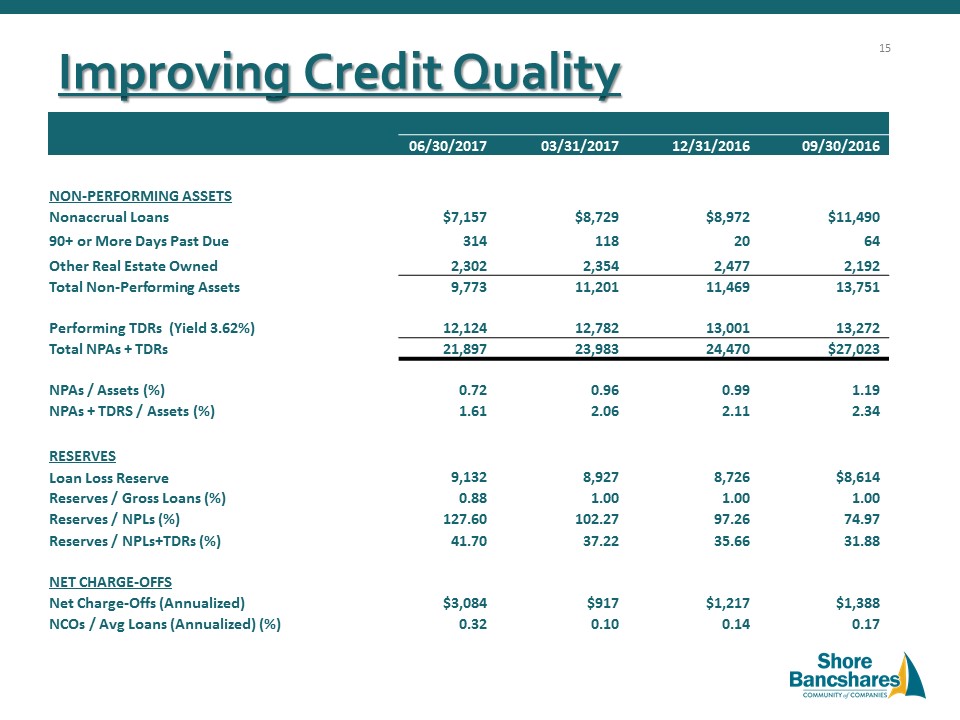
Improving Credit Quality 06/30/2017 03/31/2017 12/31/2016 09/30/2016 NON - PERFORMING ASSETS Nonaccrual Loans $7,157 $8,729 $8,972 $11,490 90+ or More Days Past Due 314 118 20 64 Other Real Estate Owned 2,302 2,354 2,477 2,192 Total Non - Performing Assets 9,773 11,201 11,469 13,751 Performing TDRs (Yield 3.62%) 12,124 12,782 13,001 13,272 Total NPAs + TDRs 21,897 23,983 24,470 $27,023 NPAs / Assets (%) 0.72 0.96 0.99 1.19 NPAs + TDRS / Assets (%) 1.61 2.06 2.11 2.34 RESERVES Loan Loss Reserve 9,132 8,927 8,726 $8,614 Reserves / Gross Loans (%) 0.88 1.00 1.00 1.00 Reserves / NPLs (%) 127.60 102.27 97.26 74.97 Reserves / NPLs+TDRs (%) 41.70 37.22 35.66 31.88 NET CHARGE - OFFS Net Charge - Offs (Annualized) $3,084 $917 $1,217 $1,388 NCOs / Avg Loans (Annualized) (%) 0.32 0.10 0.14 0.17 15

Credit Trends: NPAs & TDRs 06/30/2017 03/31/2017 12/31/2016 09/30/2016 Construction $ 7,037 $ 7,883 $ 8,007 $ 9,554 Residential Real Estate 6,646 7,974 7,778 7,986 Commercial Real Estate 5,567 5,663 6,089 7,145 Commercial 345 --- 10 41 Consumer --- 109 109 100 Total $19,595 $21,629 $21,993 $24,826 OREO 2,302 2,354 2,477 2,197 Nonaccrual Loans Held for Sale --- --- --- --- Total NPAs & TDRs $21,897 $23,983 $24,470 $27,023 16

Securities Portfolio (Dollars in thousands) Amortized Cost G Gross Unrealized Gains/Losses E Estimated Fair Value Available - for - sale securities: June 30, 2017 U.S. Treasury $ --- $ --- $ --- U.S. Government Agencies 49,173 43 216 Mortgage - backed 151,375 338 713 Equity Securities 659 <1> 658 Total $ 201,207 (255) $ 201,587 Held - to - maturity securities: June 30, 2017 U.S Government Agencies $ 2,007 57 $ 2,064 States and Political Subdivisions 1,404 71 1,475 Financial Institutions Subordinated Debt 3,000 124 3,124 Total $ 6,411 $ 252 $ 6,663 Total Securities $ 207,618 $ 208,250 Average Yield 1.99% Average Duration 3.1 years 17

Attractive Deposit Base (Dollar Value in Thousands) June 30, 2017 Deposit Type Quarterly Balance % of Total Cost Noninterest Bearing Demand $ 311,438 26.0% 0.00% Interest Bearing Demand 202,651 16.9 0.16 Money Market & Savings 380,934 31.9 0.12 CDs $100,000 or more 131,243 11.0 0.51 Other Time 169,993 14.2 0.55 Total Deposits $1,196,259 100.0% 0.27% Total Cost of Funds 0.21% Noninterest Bearing Demand 26.0% Interest Bearing Demand 16.9% Money Market & Savings 31.9% CDs $100k or more 11.0% Other Time 14.2% Deposit Type 18
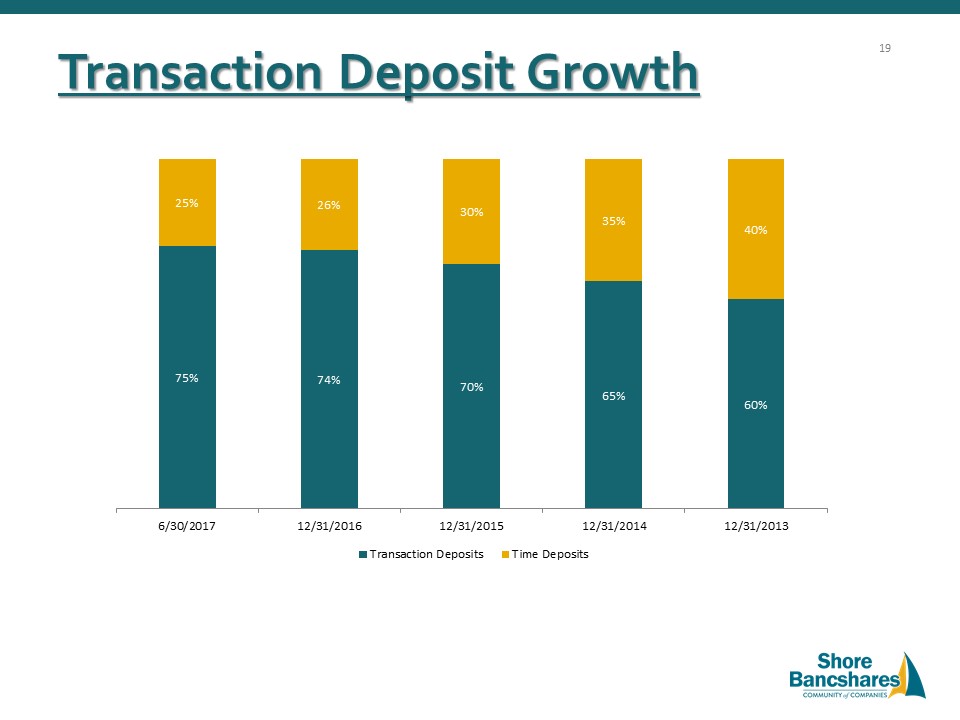
Transaction Deposit Growth 75% 74% 70% 65% 60% 25% 26% 30% 35% 40% 6/30/2017 12/31/2016 12/31/2015 12/31/2014 12/31/2013 Transaction Deposits Time Deposits 19

Income Statement (Quarterly) (Dollars in thousands, except per share amounts) 2Q17 1Q17 4Q16 3Q16 2Q16 Interest income $11,449 $10,447 $10,505 $10,236 $10,003 Interest expense 549 514 540 578 620 Net interest income 10,900 9,933 9,965 9,658 9,383 Provision for credit losses 974 427 418 605 375 Noninterest income 4,179 4,807 4,056 4,007 4,041 Noninterest expense 10,199 9,651 9,226 9,217 9,365 Income (loss) before income taxes 3,906 4,662 4,377 3,843 3,684 Net (loss) income $ 2,352 $ ,800 $ 2,495 $ 2,411 $ 2,272 EPS diluted $ 0.19 $ .22 $ 0.20 $ 0.19 $ 0.18 20

SHBI Net Interest Margin 3.71% 3.71% 3.63% 3.54% 3.57% 3.00% 3.10% 3.20% 3.30% 3.40% 3.50% 3.60% 3.70% 3.80% 2Q17 1Q17 4Q16 3Q16 2Q16 21

Continued Focus on Fee Revenue Total Revenue Breakdown Noninterest Income * annualized Dollars in thousands 24% 25% 26% 34% 32% 31% Trust and Investment Fee Income 8.1% Other Non - interest Income 18.8% Retail Insurance Agency Commission 54.0% Service Charges on Deposits 19.1% 22 $0 $10,000 $20,000 $30,000 $40,000 $50,000 $60,000 6/30/2017* 2016 2015 2014 Net Interest Income Noninterest Income

6/30/17 12/31/16 6/30/16 Return on Average Assets 0.75% 0.84% 0.81% Return on Average Equity 5.47% 6.32% 6.04% Net Interest Margin 3.71% 3.56% 3.57% Non - interest Income/Operating Revenue 30.13% 30.32% 31.54% Non - interest Income/Average Assets (1) 1.50% 1.46% 1.52% Non - interest Expense/Average Assets (1)(4) 3.17% 3.26% 3.32% Efficiency Ratio Bank Only (Non - GAAP) (2)(4) 60.00% 58.56% 61.38% Nonperforming Assets/Assets (Excluding TDRs) (3) 0.72% 0.99% 1.37% Nonperforming Assets/Assets (Including TDRs) (3) 1.61% 2.11% 2.55% Key Ratios As of June 30, 2017 (1) Non - interest income and expense are annualized for comparative purposes. (2) Noninterest expense (excluding amortization of intangible assets) as a percentage of fully taxable net interest income and noninterest income. Excludes non - bank entities. (3) Nonperforming assets (NPAs) include nonaccrual and 90 days past due and still accruing loans, accruing troubled debt restructurings and net other real estate and other assets owned (4) Less acquisition costs of NW 23

Capital Ratios 10.52% 12.30% 11.29% 11.70% 12.18% 15.78% 15.55% 15.27% 13.08% 16.79% 16.61% 16.36% 12.18% 15.78% 15.55% 0.00% 2.00% 4.00% 6.00% 8.00% 10.00% 12.00% 14.00% 16.00% 18.00% 6/30/2017 YE 2016 YE 2015 YE 2014 Tangible Common equity / Tangible Assets Tier 1 Risk-Based Capital Ratio Total Risk-Based Capital Ratio Common Equity Tier 1 24

Institutional Ownership as of 03/31/17 Major Holders % of Ownership Wellington Management Company 9.73% FJ Capital Management LLC 8.49% Blackrock Inc. 5.91% Banc Funds Company LLC 5.67% Manufactures Live Insurance Company 4.01% Vanguard Group Inc. 3.62% Basswood Partners, LLC 2.62% Bridgeway Capital Management Inc. 2.34% Renaissance Technologies, LLC 2.33% Dimensional Fund Advisors LP 1.85% Mendon Capital Advisors, Corp. 1.70% Corbyn Investment Management Inc. 1.68% 25

● We are a very different Company now x Improved credit culture x Entirely new Management Team at Bank and Holding Company x Revamped strategic plan positioned for organic growth and acquisitions x Focused on creating sustainable competitive advantages x Strengthened noninterest revenue sources x Forging a sales culture with both a commercial and retail focus ● Current valuation is attractive 6/30/17 Compelling Investment Considerations 26

SHBI – LTM Price Change (%) 27

ADDENDUM 28

Peer Group Definition Publically traded banking companies in MD, DC, VA, DE with total assets between $750M - $2B. 29

Peer Group Company Name State Total Assets ($000) ROAA LTM (%) Total Equity/ Total Assets (%) Tangible Equity/ Tangible Assets (%) Tier 1 Capital Ratio (%) Net Interest Margin (%) Noninterest Inc/ Operating Rev (%) Efficiency Ratio LTM (%) NPAs/ Assets (%) ROAE (%) 2017Q1 2017Q1 2017Q1 2017Q1 2017Q1 2017Q1 2017Q1 2017Q1 2017Q1 2017Q1 First United Corp. MD 1,319,434 0.56 8.71 7.18 14.88 3.17 27.25 72.10 2.20 6.49 Old Point Financial Corp. VA 922,776 0.42 10.31 10.31 - 12.82 3.51 31.83 82.60 2.28 3.91 Howard Bancorp, Inc. MD 1,048,752 0.60 12.02 11.79 13.96 3.65 31.86 76.34 1.12 6.51 Community Bankers Trust Corp. VA 1,262,721 0.82 9.32 9.29 12.30 3.81 9.71 64.59 1.37 8.81 Severn Bancorp, Inc. MD 798,740 1.98 11.12 10.68 13.67 3.16 24.23 80.77 3.01 17.18 Access National Corp. VA 1,401,347 1.12 8.86 8.74 10.44 3.48 40.82 62.42 0.45 12.54 National Bankshares , Inc. VA 1,243,126 1.22 14.72 14.31 26.30 3.46 51.77 51.77 1.00 8.18 Community Finl Corp MD 1,356,073 0.63 7.86 7.86 10.69 3.43 8.36 63.49 1.83 7.69 Old Line Bancshares, Inc.* MD 1,794,317 0.93 8.98 8.31 --- 3.68 11.67 56.33 --- 9.85 Revere Bank MD 1,949,401 0.69 8.89 7.42 8.81 3.87 3.02 57.68 0.09 8.64 Eastern Virginia Bankshares VA 1,446,601 0.55 9.19 6.57 11.05 3.68 12.46 77.49 1.24 5.49 Middleburg Financial Corp.** VA 1,272,643 0.61 9.95 9.71 16.61 3.20 19.08 71.67 2.10 6.34 Washington First Bancshares VA 2,059,018 0.99 9.58 9.01 11.53 3.50 29.03 62.42 0.37 9.60 Average 1,374,996 0.86 9.96 9.32 13.59 3.51 20.82 67.67 1.42 8.56 Shore Bancshares Inc. MD 1,125,690 0.87 13.51 12.54 13.51 3.60 30.13 65.78 2.05 6.47 *Fiscal Period Ended 6/30/17 **Fiscal Period Ended 12/31/16 Reference SNL Bank Performance Report 07/21/2017 30

Talent, depth, unique skills • Lloyd L. “Scott” Beatty, Jr ., 64, CPA, President & CEO of SHBI since June 2013, Director of SHBI since December 2000, Director of Shore United Bank (for mer ly the Talbot Bank and CNB) since 1992. COO from 2006 until 2012 and named President and COO in 2012. Formerly COO, private equity f irm Darby Overseas Investments. Formerly Managing Partner of public accounting firm. • Edward C. Allen , 68, Chief Financial Officer for Shore United Bank and Shore Bancshares Inc. He served as President & CEO of CNB since Sep tem ber 2014. Prior to that he served as CNB’s Chief Financial Officer since October 2011. Mr. Allen is a career banker with 40 years experience i n c ommunity banks. He has extensive experience in budgeting and investment portfolio management. • Donna J. Stevens , 54, was appointed Senior Vice President and Chief Operating Officer of the Company in July 2015 and for Shore United Bank sin ce July 2016. She served as the Company’s Chief Operations Officer from July 2013 to July 2015. She has been employed by the Company in variou s o fficer capacities since 1997, including Senior Vice President, Senior Operations and Compliance Officer and Corporate Secretary for CNB, the Company’s whol ly - owned commercial bank subsidiary from February 2010 to June 2013. She is a graduate of Maryland Banking School and ABA Stonier Graduate School of B ank ing. • Patrick M. Bilbrough , 51, President and CEO of the Talbot Bank since December 2012. He joined Shore United Bank (formerly Talbot Bank) in May of 201 1 as an Executive Vice President. Prior to his employment with Talbot Bank and since 2007, Mr. Bilbrough served as the Market Execu tiv e of PNC Bank, N.A. From 1995 to 2004, Mr. Bilbrough was with the Peoples Bank of Maryland, of Denton, where he had most recently been President and CEO after be ginning as its Chief Financial Officer and comptroller. He was a small business owner from 1985 to 1995. • Charles E. Ruch Jr. , 57, Senior Vice President and Chief Credit Officer of Shore United Bank (formerly CNB) since 2010 and joined CNB in 2006. Ent ered banking in 1977, holding various retail positions from teller to core manager through the 1980s with Equitable Bank. Joined AB&T as a co mme rcial lender in 1987 and was AB&T’s Senior Commercial Lender for 10 years. Graduated from the University of Maryland in 1983. • Michael T. Cavey , 59 , Senior Vice President and Chief Lending Officer of Shore United Bank (formerly the Talbot Bank) joined the bank in 20 14 as a Senior Vice President and Commercial Sales Manager. Prior to his employment in 2014 with The Talbot Bank, Mr. Cavey worked for Howard Ban k a s a Senior Vice President and Regional Executive for Howard and Anne Arundel Counties for five years. Prior to his position at Howard Bank, Mr. Cavey held a Senior Vice President and Commercial Team Leader positions at Sandy Spring Bank and M& T Bank. • Jennifer M. Joseph ; 49, Senior Vice President and Chief Retail Officer of Shore United Bank since November 2016. Prior to her employment, Mrs. Jo seph served as the Market Executive of PNC Bank, N.A. from 2011 to 2015. Mrs. Joseph entered into banking in 1986, holding various retail and lend ing positions, including Business Banking Sales Manager. She is a graduate of ABA Stonier Graduate School of Banking and CBA Graduate School of Retail Bank Man age ment. • W. David Morse , 55, Senior Vice President and Legal Counsel of Shore Bancshares, Inc. and Shore United Bank (formerly the Talbot Bank) has se rved as Secretary and General Counsel for the Company since 2008. He began employment with Talbot Bank in 1991. He received his Juris Doctorate fr om the University of Baltimore and his Bachelor of Arts degree from High Point College, NC. SHBI Management Team 31
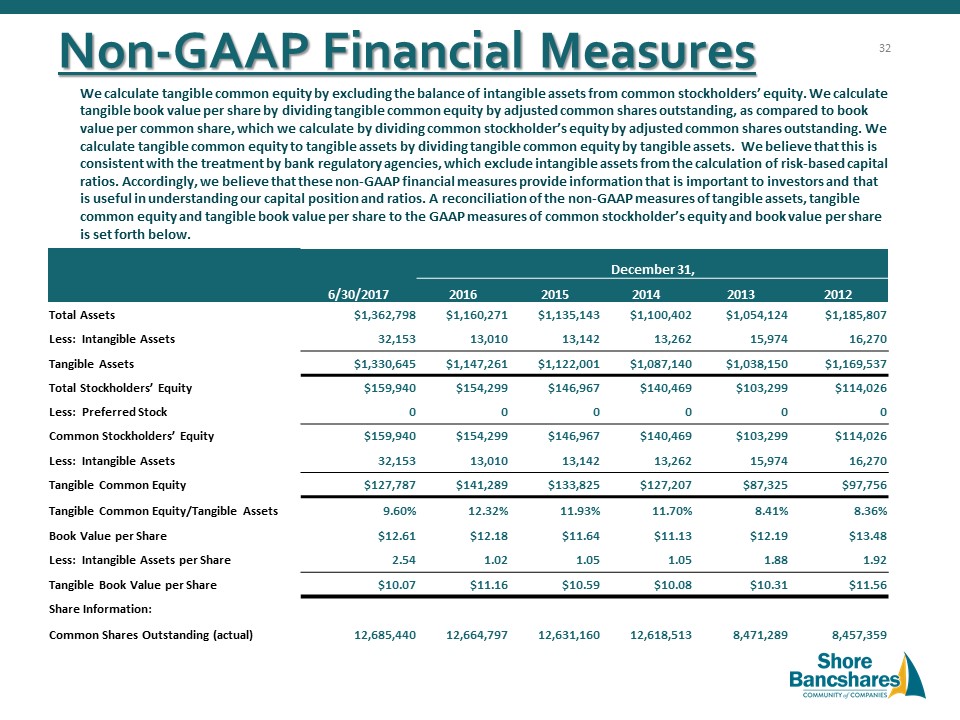
Non - GAAP Financial Measures 6/30/2017 December 31, 2016 2015 2014 2013 2012 Total Assets $1,362,798 $1,160,271 $1,135,143 $1,100,402 $1,054,124 $1,185,807 Less: Intangible Assets 32,153 13,010 13,142 13,262 15,974 16,270 Tangible Assets $1,330,645 $1,147,261 $1,122,001 $1,087,140 $1,038,150 $1,169,537 Total Stockholders’ Equity $159,940 $154,299 $146,967 $140,469 $103,299 $114,026 Less: Preferred Stock 0 0 0 0 0 0 Common Stockholders’ Equity $159,940 $154,299 $146,967 $140,469 $103,299 $114,026 Less: Intangible Assets 32,153 13,010 13,142 13,262 15,974 16,270 Tangible Common Equity $127,787 $141,289 $133,825 $127,207 $87,325 $97,756 Tangible Common Equity/Tangible Assets 9.60% 12.32% 11.93% 11.70% 8.41% 8.36% Book Value per Share $12.61 $12.18 $11.64 $11.13 $12.19 $13.48 Less: Intangible Assets per Share 2.54 1.02 1.05 1.05 1.88 1.92 Tangible Book Value per Share $10.07 $11.16 $10.59 $10.08 $10.31 $11.56 Share Information: Common Shares Outstanding (actual) 12,685,440 12,664,797 12,631,160 12,618,513 8,471,289 8,457,359 We calculate tangible common equity by excluding the balance of intangible assets from common stockholders’ equity. We calcul ate tangible book value per share by dividing tangible common equity by adjusted common shares outstanding, as compared to book value per common share, which we calculate by dividing common stockholder’s equity by adjusted common shares outstanding. We calculate tangible common equity to tangible assets by dividing tangible common equity by tangible assets. We believe that t his is consistent with the treatment by bank regulatory agencies, which exclude intangible assets from the calculation of risk - based ca pital ratios. Accordingly, we believe that these non - GAAP financial measures provide information that is important to investors and th at is useful in understanding our capital position and ratios. A reconciliation of the non - GAAP measures of tangible assets, tangib le common equity and tangible book value per share to the GAAP measures of common stockholder’s equity and book value per share is set forth below. 32