Attached files
| file | filename |
|---|---|
| 8-K - FORM 8-K - SHENANDOAH TELECOMMUNICATIONS CO/VA/ | f8k_080217.htm |
Exhibit 99.1

August 2, 2017 2 Q 2017 Earnings Conference Call

2 Safe Harbor Statement This presentation includes “forward - looking statements” within the meaning of Section 27A of the Securities Act and Section 21E of the Securities Exchange Act of 1934, as amended, regarding, among other things, our business strategy, our prospects and our financial position. These statements can be identified by the use of forward - looking terminology such as “believes,” “estimates,” “expects,” “intends,” “may,” “will,” “should,” “could,” or “anticipates” or the negative or other variation of these similar words, or by discussions of strategy or risks and uncertainties. These statements are based on current expectations of future events. If underlying assumptions prove inaccurate or unknown risks or uncertainties materialize, actual results could vary materially from the Company’s expectations and projections. Important factors that could cause actual results to differ materially from such forward - looking statements include, without limitation, risks related to the following: □ Increasing competition in the communications industry; and □ A complex and uncertain regulatory environment. A further list and description of these risks, uncertainties and other factors can be found in the Company’s SEC filings which are available online at www.sec.gov, www.shentel.com or on request from the Company. The Company does not undertake to update any forward - looking statements as a result of new information or future events or developments.

3 Use of Non - GAAP Financial Measures Included in this presentation are certain non - GAAP financial measures that are not determined in accordance with US generally accepted accounting principles. These financial performance measures are not indicative of cash provided or used by operating activities and exclude the effects of certain operating, capital and financing costs and may differ from comparable information provided by other companies, and they should not be considered in isolation, as an alternative to, or more meaningful than measures of financial performance determined in accordance with US generally accepted accounting principles. These financial performance measures are commonly used in the industry and are presented because Shentel believes they provide relevant and useful information to investors. Shentel utilizes these financial performance measures to assess its ability to meet future capital expenditure and working capital requirements, to incur indebtedness if necessary, return investment to shareholders and to fund continued growth. Shentel also uses these financial performance measures to evaluate the performance of its businesses and for budget planning purposes.

4 Chris French President and CEO

5 Second Quarter 2017 Highlights Net Loss in Q2’17 ▪ Net loss of $80 thousand in Q2’17 compared to a net loss of $7.0 million in Q2’16 Adjusted OIBDA Growth ▪ Increased 24.2% to $69.4 million over Q2’16 Revenue Growth ▪ Increased 17.6% to $153.3 million over Q2’16 Customer Change 3/31/17 6/30/17 Change Wireless 960,707 979,464 18,757 Cable (RGUs) 132,846 132,287 (559)

6 Wireless Highlights PCS Customers (000s) ▪ Postpaid Growth Postpaid customer s up 2.2% over last 3 months ▪ Prepaid Customers Prepaid customers up 1.3% over last 3 months ▪ Adjusted OIBDA Growth Increas ed to $58.2 million, up 29.4% in Q2’17 vs Q2’16
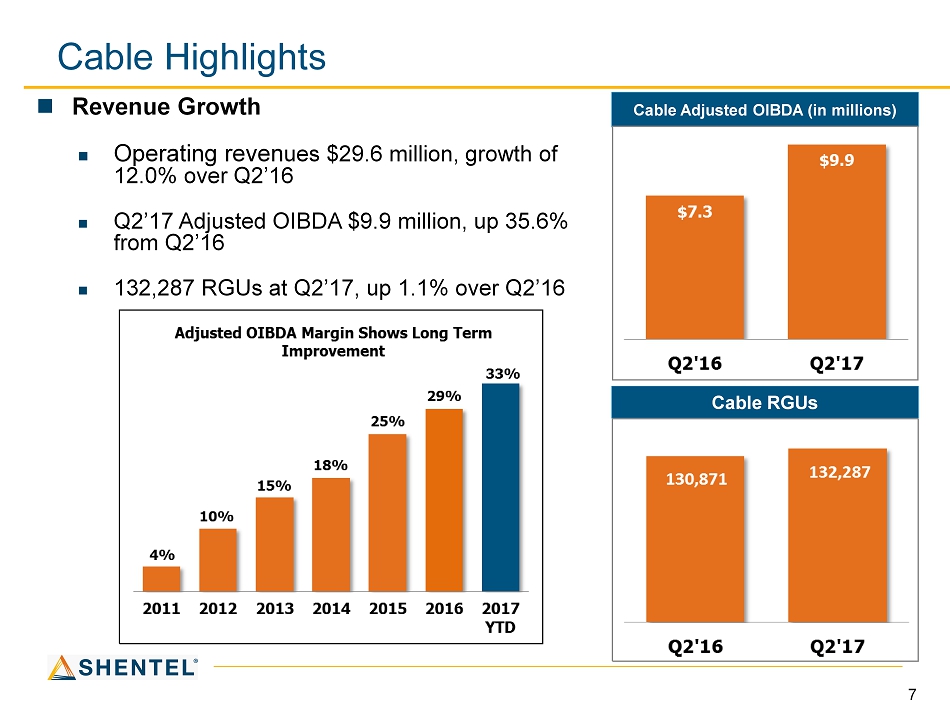
7 Cable Highlights Revenue Growth Operating reven ues $29.6 million, growth of 12.0% over Q2’16 Q2’17 Adjusted OIBDA $9.9 million, up 35.6% from Q2’16 132,287 RGUs at Q2’17, up 1.1% over Q2’16 Cable Adjusted OIBDA (in millions) Cable RGUs

8 Fiber and Tower Highlights Wireline and Cable fiber l ease revenues of $ 11.7 million, up 12.7% from Q2’16 195 towers generated $1.8 million of OIBDA in Q2’17 *Fiber Lease Revenue (in millions) Mobile Tower OIBDA ($ thousands) *Includes both Affiliate and Non - affiliate revenues 9.6 10.5 0.7 1.2 Q2'16 Q2'17 Wireline Cable $ 10.3 $11.7 (in thousands) Q2'16 Q2'17 Operating Income $1,121 $1,320 Deprec. and Amort. 472 471 Loss on Asset Disposals 22 - Share Based Compensation 13 6 Adjusted OIBDA $1,628 $1,797

9 Adele Skolits VP of Finance and CFO

10 Profitability Consolidated Results ($ in millions, except per share amounts) 6/30/16 6/30/17 Operating Income $ (6.2) $ 8.3 Net Income $ (7.0) $ (0.1) Earnings Per Share: Basic Diluted $ (0.14) $ (0.14) $ (0.0) $ (0.0) For the Quarter Ended:___

11 Profitability Adjusted OIBDA ($ millions) 6/30/16 6/30/17 Change ($) Change (%) Operating income (6.2) 8.3 14.5 234% Depreciation and amortization 32.4 44.9 12.5 39% Share based compensation 1.0 0.8 (0.2) -20% Straight line adjustment to reduce management fee waiver 3.0 4.4 1.4 47% Amortization of intangible netted in revenue 3.3 5.3 2.0 61% Amortization of intangible netted in rent expense - 0.3 0.3 N.M. Integration, acquisition and migration expense 20.1 3.7 (16.4) N.M. Temporary backoffice costs to support the billings operations through migration 2.3 1.7 (0.6) -26% Adjusted OIBDA 55.9 69.4 13.5 24% Less waived management fee (6.1) (9.2) (3.1) 51% Continuing OIBDA 49.8 60.3 10.5 21% For the Quarter Ended:

12 Adjusted OIBDA by Segment ($ millions ) Q2'16 Q2'17 Q2'16 Q2'17 Q2'16 Q2'17 Operating income 7.3$ 6.4$ 1.2$ 3.7$ 5.2$ 5.4$ Depreciation and amortization 23.5 35.6 5.8 6.1 2.9 3.2 Plus (gain) loss on asset sales - - - (0.1) 0.1 - Share based compensation 0.3 0.4 0.3 0.2 0.1 - Straight line adjustment - mgmt fee waiver 3.0 4.4 - - - - Amort. of intangible netted in revenue 3.3 5.3 - - - - Amort. of intangible netted in rent expense - 0.3 - - - - Integration, acquisition and migration expense 5.3 4.1 - - - - Temporary backoffice costs 2.3 1.7 Adjusted OIBDA 45.0$ 58.2$ 7.3$ 9.9$ 8.3$ 8.6$ Percent Change 29% 36% 4% Adjusted OIBDA Margin 48% 51% 28% 34% 45% 44% Wireless Cable Wireline

13 Wireless Segment – Change in Adjusted OIBDA Q2’17 vs. Q2’16 ($ millions ) Postpaid Revenue Prepaid Revenue Waived Mgt Fee Travel Revenue Other & Postpaid Acquisition Costs Prepaid Costs Prepaid Acquisition Costs Network Costs Total (1) Postpaid Revenue and Prepaid Revenue exclude the effect of allocating the management fee waiver (1) (1)

14 Cable Segment – Change in Adjusted OIBDA Q2’17 vs. Q2’16 ($ millions )

15 Earle MacKenzie EVP and COO
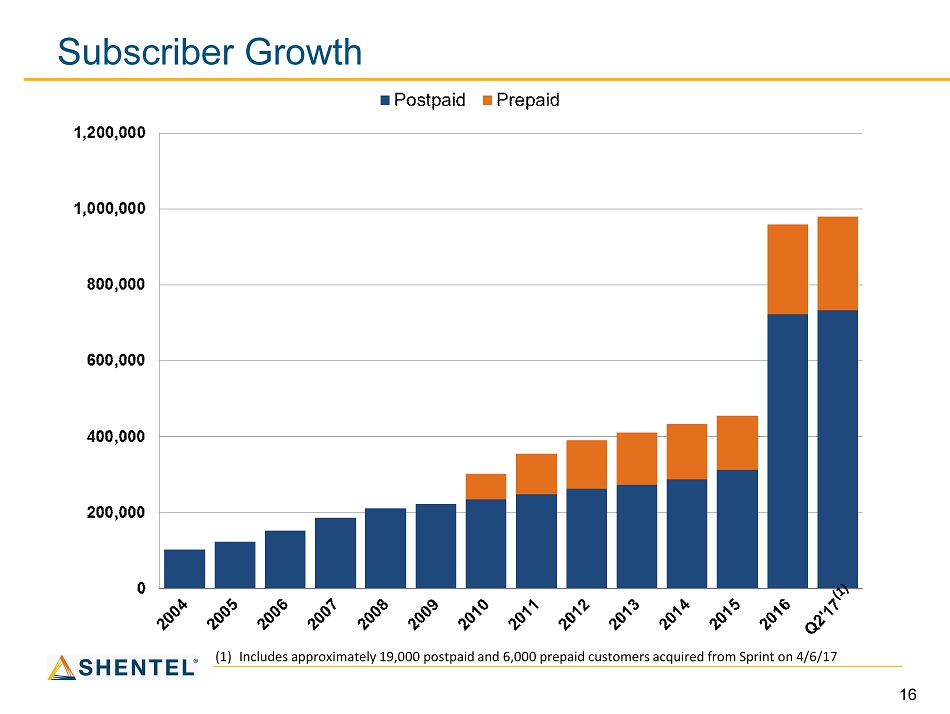
16 Subscriber Growth (1) Includes approximately 19,000 postpaid and 6,000 prepaid customers acquired from Sprint on 4/6/17
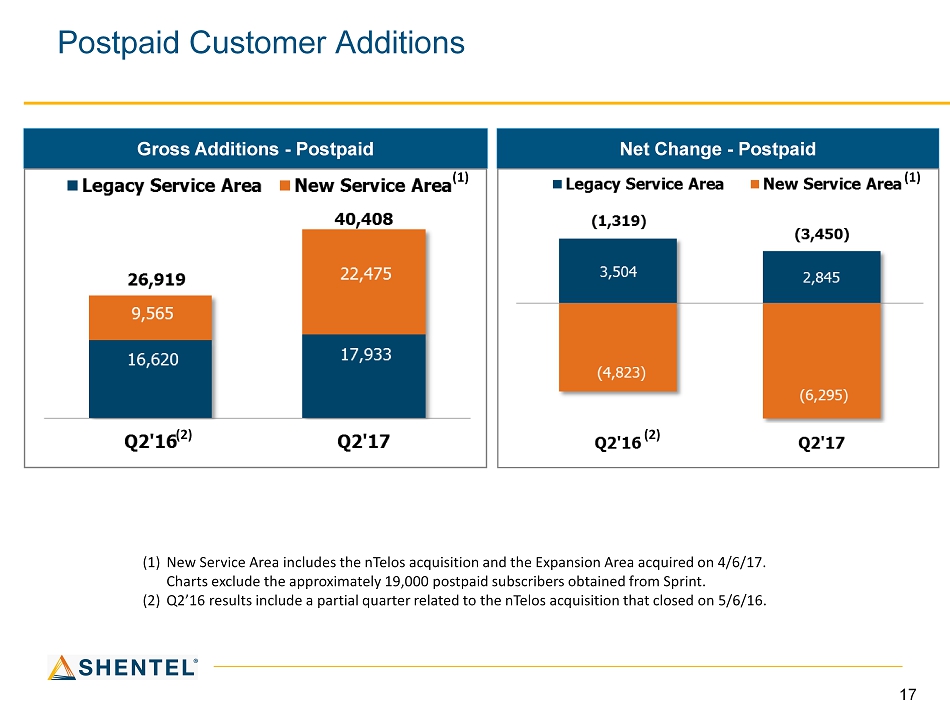
17 Postpaid Customer Additions Net Change - Postpaid Gross Additions - Postpaid (1) New Service Area includes the nTelos acquisition and the E xpansion A rea acquired on 4/6/17. Charts exclude the approximately 19,000 postpaid subscribers obtained from Sprint. (2) Q2’16 results include a partial quarter related to the nTelos acquisition that closed on 5/6/16. (1) (1) (2) (2)

18 PCS Postpaid Statistics Gross Billed Revenue Less Credits and Discounts per Postpaid User Postpaid Churn
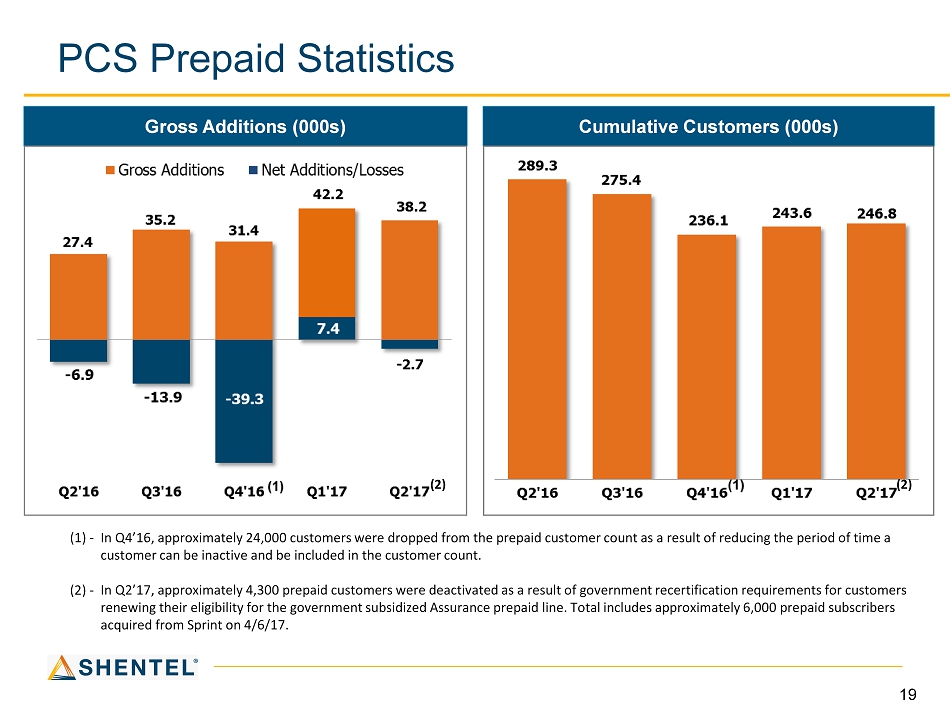
19 PCS Prepaid Statistics Gross Additions (000s) Cumulative Customers (000s) In Q4’16, approximately 24,000 customers were dropped from the prepaid customer count as a result of reducing the period of t ime a customer can be inactive and be included in the customer count. In Q2’17, approximately 4,300 prepaid customers were deactivated as a result of government recertification requirements for c ust omers renewing their eligibility for the government subsidized Assurance prepaid line . Total includes approximately 6,000 prepaid subscribers acquired from Sprint on 4/6/17. (1) - (2) - (2) (2)

20 PCS Prepaid Statistics Churn % Average Gross Billed Revenue (1) – In Q4’16, customers were dropped from the prepaid customer count as a result of reducing the period of time a customer can be inactive and be included in the customer count. The churn calculation excludes the impact from this one - time event. (2) – In Q2’17, approximately 4,300 prepaid customers were deactivated as a result of government recertification requirements for c u stomers renewing their eligibility for the government subsidized Assurance prepaid line. Excluding the impact of this activity, prepa id churn would have been 4.91% for the period ending Q2’17. (2)

21 Status of Network Enhancements – nTelos Footprint 100 186 220 363 0% 20% 40% 60% 80% 100% Coverage Sites 3G to 4G Add 800 Mhz Decommission Overlapping Sites Completed Expected Completion in 2017 Expected Completion in 2018 Enhancement # of cell sites

May 6, 2017 Q2 2017 Estimated YE 2017 Company Owned Stores 41 31 29 Agent Postpaid Stores 55 69 79 Nationals – Postpaid 29 32 32 Total Postpaid Stores 125 132 140 Agent Boost Stores 33 64 83 Nationals - Boost 50 56 56 Total Boost Stores 83 120 139 nTelos Area Distribution (1) Includes nTelos and Sprint stores (1) $2m of local advertising in last 4 months of 2017!

23 Cable - RGU Growth by Quarter Customers 76,471 77,393 77,366 77,925 77,305 RGU's/Customer 1.71 1.71 1.71 1.70 1.71 (1) College students disconnect during summer (1) (1)

24 Increasing Average Monthly Cable Revenue Average Monthly Revenue per RGU Average Monthly Revenue per Customer* *Average monthly revenue per video subscriber was $158.71 and $188.45 for Q2 2016 and Q2 2017, respectively .

25 Key Operational Results – Cable (1) - Excludes cable operations in Shenandoah County, VA which are included in the Wireline segment. (2) - Wireline segment includes approximately 16.5k homes passed, 5.2k video customers, and 1.4k cable modem customers (2) Q2 2016 Q2 2017 Homes Passed (1) 184,627 184,834 Total Revenue Generating Units 130,871 132,287 Customer Relationships 76,471 77,305 RGUs per Customer Relationship 1.71 1.71 Video Revenue generating units 51,549 48,248 Penetration 27.9% 26.1% Digital video penetration 75.3% 81.5% High-speed Internet Available Homes 183,743 184,834 Revenue generating units 58,230 61,947 Penetration 31.7% 33.5% Voice Available Homes 181,006 182,303 Revenue generating units 21,092 22,092 Penetration 11.7% 12.1%

26 Key Operational Results - Wireline A ccess line loss of 5.8% in past 12 months as a result of no longer requiring access line to purchase internet service Effective Q4’15, subscribers were offered a cable modem internet option up to 101 Mbps 5,180 video subscribers at 6/30/17 Access lines (000s) DSL & Cable Modem Customers (000s)

27 Wireline and Cable Fiber Sales ($ millions) Fiber Lease Revenue New External Fiber Lease Contracts * * Amounts represent the first 10 years of contract value. Contract Terms range from 36 to 120 months.
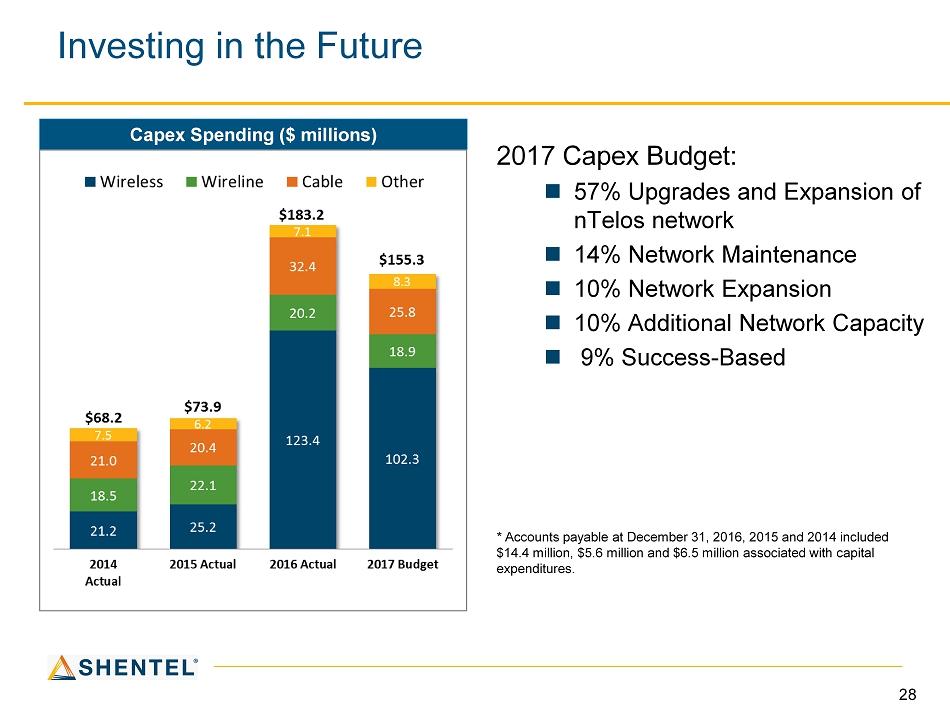
28 Investing in the Future Capex Spending ($ millions) 2017 Capex Budget: 57% Upgrades and Expansion of nTelos network 14% Network Maintenance 10% Network Expansion 10 % Additional Network Capacity 9% Success - Based * Accounts payable at December 31, 2016, 2015 and 2014 included $14.4 million, $5.6 million and $6.5 million associated with capital expenditures.

29 Q&A

30 Appendix
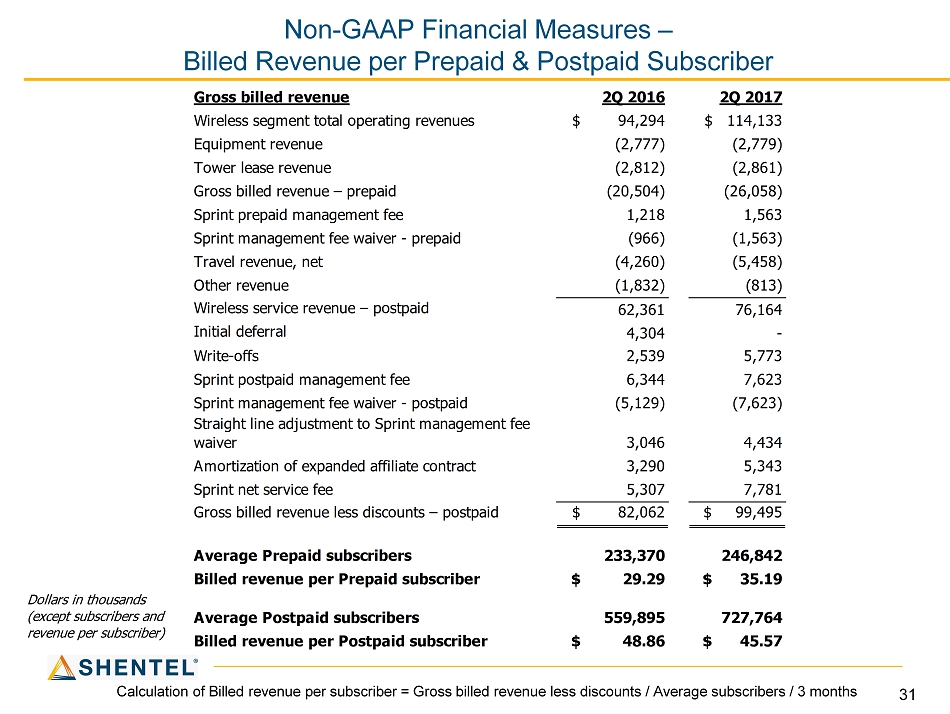
31 Non - GAAP Financial Measures – Billed Revenue per Prepaid & Postpaid Subscriber Calculation of Billed revenue per subscriber = Gross billed revenue less discounts / Average subscribers / 3 months Dollars in thousands (except subscribers and revenue per subscriber) Gross billed revenue 2Q 2016 2Q 2017 Wireless segment total operating revenues $ 94,294 $ 114,133 Equipment revenue (2,777) (2,779) Tower lease revenue (2,812) (2,861) Gross billed revenue – prepaid (20,504) (26,058) Sprint prepaid management fee 1,218 1,563 Sprint management fee waiver - prepaid (966) (1,563) Travel revenue, net (4,260) (5,458) Other revenue (1,832) (813) Wireless service revenue – postpaid 62,361 76,164 Initial deferral 4,304 - Write-offs 2,539 5,773 Sprint postpaid management fee 6,344 7,623 Sprint management fee waiver - postpaid (5,129) (7,623) Straight line adjustment to Sprint management fee waiver 3,046 4,434 Amortization of expanded affiliate contract 3,290 5,343 Sprint net service fee 5,307 7,781 Gross billed revenue less discounts – postpaid $ 82,062 $ 99,495 Average Prepaid subscribers 233,370 246,842 Billed revenue per Prepaid subscriber $ 29.29 $ 35.19 Average Postpaid subscribers 559,895 727,764 Billed revenue per Postpaid subscriber $ 48.86 $ 45.57

32 Network Statistics at 6/30/17 Cell Sites Legacy New CDMA Base Stations (sites) 568 973 nTelos 3G s ites still requiring upgrade 0 34 Sites with 2 nd LTE carrier 550 869 Sites with three carriers, including a 2 nd carrier @ 1900 MHz 209 195 Sites with 2.5 GHz LTE 141 178 Traffic % LTE traffic 96.7% 91.2% Data usage increase (Q over Q) 6.0% 8.1% Avg LTE speeds (Mbps) 7.0 6.3 Avg data usage per subscriber (Gb) 7.9 6.7 Dropped call rate 0.37% 0.51% Blocked call rate 0.16% 0.16% (1) (1) “New” is comprised of nTelos and Q2’17 Expansion Area acquisitions

33 Non - GAAP Financial Measure – Average Monthly Cable Revenue Dollars in thousands (except subscribers and revenue per subscriber) Q2 2016 Q2 2017 Net Service Revenue $ 22,258 $ 25,145 Set-top box rentals 2,119 2,080 FUSC and pass-through fees 426 435 Video, Internet & Voice Revenue 24,803 27,660 Other miscellaneous revenue 1,559 1,904 Total Operating Revenue 26,362 29,564 Video revenue 12,929 13,014 Internet revenue 9,959 12,308 Voice revenue 1,915 2,338 Video, Internet & Voice Revenue $ 24,803 $ 27,660 Average Subscribers Video 52,093 48,925 Internet 58,355 61,984 Voice 20,937 21,921 Revenue Generating Units (RGUs) 131,385 132,829 Average Customer Relationships 76,929 77,737 Average Revenue Per User (ARPU) Revenue Generating Units (RGUs) $ 62.93 $ 69.41 Customer Relationships 107.47 118.61 Video 158.71 188.45
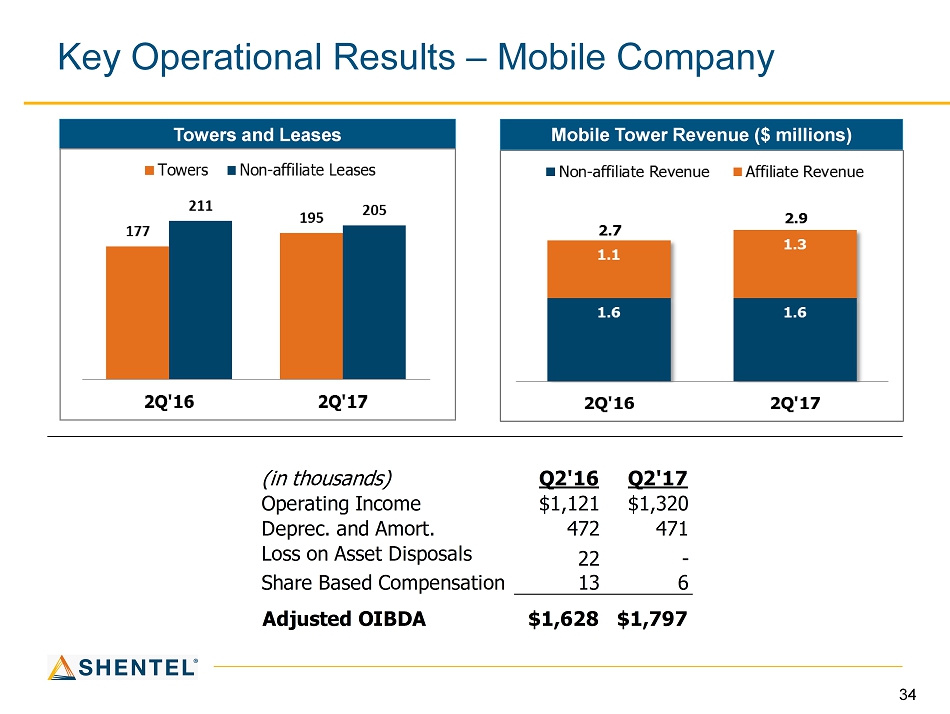
34 Key Operational Results – Mobile Company Mobile Tower Revenue ($ millions) Towers and Leases (in thousands) Q2'16 Q2'17 Operating Income $1,121 $1,320 Deprec. and Amort. 472 471 Loss on Asset Disposals 22 - Share Based Compensation 13 6 Adjusted OIBDA $1,628 $1,797