Attached files
| file | filename |
|---|---|
| 8-K - 8-K - RETAIL PROPERTIES OF AMERICA, INC. | form8-k6x30x17.htm |
| EX-99.1 - EXHIBIT 99.1 - RETAIL PROPERTIES OF AMERICA, INC. | ex-9916x30x17.htm |
Exhibit 99.2

RETAIL PROPERTIES OF AMERICA, INC. REPORTS
SECOND QUARTER AND YEAR TO DATE RESULTS
Oak Brook, IL – August 1, 2017 – Retail Properties of America, Inc. (NYSE: RPAI) (the “Company”) today reported financial and operating results for the quarter and six months ended June 30, 2017.
FINANCIAL RESULTS
For the quarter ended June 30, 2017, the Company reported:
▪ | Net income attributable to common shareholders of $112.4 million, or $0.48 per share, compared to $26.2 million, or $0.11 per share, for the same period in 2016; |
▪ | Funds from operations (FFO) attributable to common shareholders of $60.7 million, or $0.26 per share, compared to $73.9 million, or $0.31 per share, for the same period in 2016; and |
▪ | Operating funds from operations (Operating FFO) attributable to common shareholders of $62.9 million, or $0.27 per share, compared to $66.7 million, or $0.28 per share, for the same period in 2016. |
For the six months ended June 30, 2017, the Company reported:
▪ | Net income attributable to common shareholders of $100.9 million, or $0.43 per share, compared to $71.3 million, or $0.30 per share, for the same period in 2016; |
▪ | FFO attributable to common shareholders of $61.2 million, or $0.26 per share, compared to $150.3 million, or $0.64 per share, for the same period in 2016; and |
▪ | Operating FFO attributable to common shareholders of $129.8 million, or $0.55 per share, compared to $132.5 million, or $0.56 per share, for the same period in 2016. |
OPERATING RESULTS
For the quarter ended June 30, 2017, the Company’s portfolio results were as follows:
▪ | 1.8% increase in same store net operating income (NOI) over the comparable period in 2016; |
▪ | Total same store portfolio percent leased, including leases signed but not commenced: 94.8% at June 30, 2017, down 50 basis points from 95.3% at March 31, 2017 and down 90 basis points from 95.7% at June 30, 2016; |
▪ | Retail portfolio percent leased, including leases signed but not commenced: 93.7% at June 30, 2017, down 60 basis points from 94.3% at March 31, 2017 and down 120 basis points from 94.9% at June 30, 2016; |
▪ | Retail portfolio annualized base rent (ABR) per occupied square foot of $18.00 at June 30, 2017, up 7.0% from $16.82 ABR per occupied square foot at June 30, 2016; |
▪ | 797,000 square feet of retail leasing transactions comprised of 140 new and renewal leases; and |
▪ | Positive comparable cash leasing spreads of 28.4% on new leases and 5.6% on renewal leases for a blended spread of 8.1%. Excluding the impact from one lease within the Company’s non-target portfolio, blended comparable cash leasing spreads were 9.7% and comparable renewal cash leasing spreads were 7.2%. |
n Retail Properties of America, Inc.
T: 800.541.7661
www.rpai.com 2021 Spring Road, Suite 200
Oak Brook, IL 60523
For the six months ended June 30, 2017, the Company’s portfolio results were as follows:
▪ | 1.9% increase in same store NOI over the comparable period in 2016; |
▪ | 1,263,000 square feet of retail leasing transactions comprised of 261 new and renewal leases; and |
▪ | Positive comparable cash leasing spreads of 25.6% on new leases and 6.9% on renewal leases for a blended spread of 8.9%. Excluding the impact from one lease within the Company’s non-target portfolio, blended comparable cash leasing spreads were 9.8% and comparable renewal cash leasing spreads were 7.8%. |
“Our strong leasing and transactional performance continues to counteract the current retail narrative,” stated Steve Grimes, president and chief executive officer. “With nearly two-thirds of our targeted retail dispositions closed, we remain focused on completing our 2017 strategic initiatives.”
INVESTMENT ACTIVITY
Dispositions
Year to date, the Company has completed, is under contract or has letters of intent (LOIs) for dispositions totaling $842.9 million. During the quarter, the Company completed $308.8 million of dispositions, which included the sales of 14 non-target multi-tenant retail assets for $287.2 million and three single-user retail assets for $21.6 million. Subsequent to quarter end, the Company completed the sales of three non-target multi-tenant retail assets, two of which were classified as held for sale as of June 30, 2017, for $74.3 million. Year to date, the Company has completed dispositions totaling $489.1 million.
The Company is under contract to sell seven non-target multi-tenant retail assets for $122.3 million and one single-user retail asset for $8.0 million. In addition, the Company has LOIs to sell $223.5 million of dispositions, which includes 11 non-target multi-tenant retail assets for $221.0 million and one single-user retail asset for $2.5 million. These transactions are expected to close during the second half of 2017, subject to satisfaction of customary closing conditions and, for those transactions subject to an LOI, negotiations of definitive agreements consistent with the LOIs.
Acquisitions
Year to date, the Company has completed or is under contract for $147.6 million of acquisitions. During the quarter, the Company acquired two additional phases at One Loudoun Downtown, located in the Washington, D.C. metropolitan statistical area (MSA), for a gross purchase price of $5.7 million.
Subsequent to quarter end, the Company completed the acquisition of New Hyde Park Shopping Center, located in the New York MSA, for a gross purchase price of $22.1 million. New Hyde Park Shopping Center is a 32,000 square foot neighborhood shopping center that is 96.4% leased to an impressive mix of national retailers and service-oriented tenants. The property is situated in a densely populated and highly affluent submarket that boasts a strong demographic profile with population of over 202,000 and average household income of $138,000 within a three-mile radius.
The Company remains under contract for the remaining phases at One Loudoun Downtown, representing an aggregate gross purchase price of up to $25.7 million. These transactions are expected to close, subject to satisfaction of customary closing conditions, during the third quarter of 2017 as the seller completes construction on stand-alone buildings at the property.
BALANCE SHEET AND CAPITAL MARKETS ACTIVITY
As of June 30, 2017, the Company had approximately $1.9 billion of consolidated indebtedness, which resulted in a net debt to adjusted EBITDA ratio of 5.2x, or a net debt and preferred stock to
ii
adjusted EBITDA ratio of 5.6x. Consolidated indebtedness had a weighted average contractual interest rate of 3.64% and a weighted average maturity of 5.3 years.
During the quarter, the Company repaid $16.8 million of mortgage debt, excluding amortization, with an interest rate of 4.82% and incurred a prepayment penalty of $2.3 million. In addition, the Company repurchased 6.0 million shares of common stock under its stock repurchase program at an average price per share of $12.55 for a total of approximately $75.7 million.
GUIDANCE
The Company expects to generate net income attributable to common shareholders of $0.95 to $1.00 per share in 2017. The Company is maintaining its 2017 Operating FFO attributable to common shareholders guidance range of $1.00 to $1.05 per share, based, in part, on the following assumptions:
▪ | Maintained 2017 same store NOI growth range of 1.25% to 2.25%; |
▪ | Revised 2017 acquisitions range of $375 to $475 million to include repurchases of common stock; |
▪ | Maintained 2017 dispositions range of $800 to $900 million, including the sale of Schaumburg Towers; and |
▪ | Maintained 2017 general and administrative expenses range of $42 to $44 million. |
DIVIDEND
On July 25, 2017, the Company declared the third quarter 2017 Series A preferred stock cash dividend of $0.4375 per preferred share, for the period beginning July 1, 2017, which will be paid on October 2, 2017 to preferred shareholders of record on September 21, 2017.
On July 25, 2017, the Company also declared the third quarter 2017 quarterly cash dividend of $0.165625 per share on its outstanding Class A common stock, which will be paid on October 10, 2017 to Class A common shareholders of record on September 26, 2017.
WEBCAST AND CONFERENCE CALL INFORMATION
The Company’s management team will hold a webcast on Wednesday, August 2, 2017 at 11:00 AM (ET), to discuss its quarterly financial results and operating performance, as well as business highlights and outlook. In addition, the Company may discuss business and financial developments and trends and other matters affecting the Company, some of which may not have been previously disclosed.
A live webcast will be available online on the Company’s website at www.rpai.com in the INVEST section. A replay of the webcast will be available. To listen to the replay, please go to www.rpai.com in the INVEST section of the website and follow the instructions.
The conference call can be accessed by dialing (877) 705-6003 or (201) 493-6725 for international participants. Please dial in at least ten minutes prior to the start of the call to register. A replay of the call will be available from 2:00 PM (ET) on August 2, 2017 until midnight (ET) on August 16, 2017. The replay can be accessed by dialing (844) 512-2921 or (412) 317-6671 for international callers and entering pin number 13662949.
SUPPLEMENTAL INFORMATION
The Company has posted supplemental financial and operating information and other data in the INVEST section of its website.
ABOUT RPAI
Retail Properties of America, Inc. is a REIT that owns and operates high quality, strategically located shopping centers in the United States. As of June 30, 2017, the Company owned 132 retail operating
iii
properties representing 23.3 million square feet. The Company is publicly traded on the New York Stock Exchange under the ticker symbol RPAI. Additional information about the Company is available at www.rpai.com.
SAFE HARBOR LANGUAGE
The statements and certain other information contained in this press release, which can be identified by the use of forward-looking terminology such as “believes”, “expects”, “may”, “should”, “intends”, “plans”, “estimates”, “continue” or “anticipates” and variations of such words or similar expressions or the negative of such words, constitute “forward-looking statements” within the meaning of Section 27A of the Securities Act of 1933, as amended, and Section 21E of the Securities Exchange Act of 1934, as amended, and are subject to the safe harbors created thereby. These forward-looking statements reflect the Company’s current views about its plans, intentions, expectations, strategies and prospects, which are based on the information currently available to the Company and on assumptions it has made. Although the Company believes that its plans, intentions, expectations, strategies and prospects as reflected in or suggested by those forward-looking statements are reasonable, the Company can give no assurance that such plans, intentions, expectations or strategies will be attained or achieved. Furthermore, these forward-looking statements should be considered as subject to the many risks and uncertainties that exist in the Company’s operations and business environment. Such risks and uncertainties could cause actual results to differ materially from those projected. These uncertainties include, but are not limited to, economic, business and financial conditions, and changes in the Company’s industry and changes in the real estate markets in particular, rental rates and/or vacancy rates, frequency and magnitude of defaults on, early terminations of or non-renewal of leases by tenants, bankruptcy or insolvency of a major tenant or a significant number of smaller tenants, interest rates or operating costs, real estate valuations, the availability, terms and deployment of capital, general volatility of the capital and credit markets and the market price of the Company’s Class A common stock, risks generally associated with real estate acquisitions and dispositions, including the Company’s ability to identify and pursue acquisition and disposition opportunities, risks generally associated with redevelopment, including the impact of construction delays and cost overruns, the Company’s ability to lease redeveloped space and the Company’s ability to identify and pursue redevelopment opportunities, competitive and cost factors, the Company’s ability to enter into new leases or renew leases on favorable terms, the Company’s ability to create long-term shareholder value, satisfaction of closing conditions to the pending transactions described herein, the Company’s failure to successfully execute its non-target disposition program and capital recycling efforts, regulatory changes and other risk factors, including those detailed in the sections of the Company’s most recent Forms 10-K and 10-Q filed with the SEC titled “Risk Factors”. The Company assumes no obligation to update publicly any forward-looking statements, whether as a result of new information, future events or otherwise.
NON-GAAP FINANCIAL MEASURES
As defined by the National Association of Real Estate Investment Trusts (NAREIT), an industry trade group, Funds From Operations (FFO) means net income (loss) computed in accordance with generally accepted accounting principles (GAAP), excluding gains (or losses) from sales of depreciable real estate, plus depreciation and amortization and impairment charges on depreciable real estate. The Company has adopted the NAREIT definition in its computation of FFO attributable to common shareholders. The Company believes that, subject to the following limitations, FFO attributable to common shareholders provides a basis for comparing its performance and operations to those of other real estate investment trusts (REITs). The Company believes that FFO attributable to common shareholders, which is a supplemental non-GAAP financial measure, provides an additional and useful means to assess the operating performance of REITs. FFO attributable to common shareholders does not represent an alternative to (i) “Net income” or “Net income attributable to common shareholders” as an indicator of the Company’s financial performance, or (ii) “Cash flows from operating activities” in accordance with GAAP as a measure of the Company’s capacity to fund cash needs, including the payment of dividends.
The Company also reports Operating FFO attributable to common shareholders, which is defined as FFO attributable to common shareholders excluding the impact of discrete non-operating transactions and other events which the Company does not consider representative of the comparable operating results of its real estate operating portfolio, which is its core business platform. Specific examples of discrete non-operating transactions and other events include, but are not limited to, the financial statement impact of gains or losses associated with the early extinguishment of debt or other liabilities, impairment charges to write down the carrying value of assets other than depreciable real estate, actual or anticipated settlement of litigation involving the Company, including associated legal costs, and executive and realignment separation charges, which are otherwise excluded from the Company’s calculation of FFO attributable to common shareholders. The Company believes that Operating FFO attributable to common shareholders, which is a supplemental non-GAAP financial measure, provides an additional and useful means to assess the operating performance of REITs. Operating FFO attributable to common shareholders does not represent an alternative to (i) “Net income” or “Net income attributable to common shareholders” as an indicator of the Company’s financial performance, or (ii) “Cash flows from operating activities” in accordance with GAAP as a measure of the Company’s capacity to fund cash needs, including the payment of dividends. Comparison of the Company’s presentation of Operating FFO attributable
iv
to common shareholders to similarly titled measures for other REITs may not necessarily be meaningful due to possible differences in definition and application by such REITs.
The Company also reports Net Operating Income (NOI), which it defines as all revenues other than straight-line rental income, amortization of lease inducements, amortization of acquired above and below market lease intangibles and lease termination fee income, less real estate taxes and all operating expenses other than straight-line ground rent expense and amortization of acquired ground lease intangibles, which are non-cash items. NOI consists of Same Store NOI and NOI from Other Investment Properties. Same Store NOI for the three and six months ended June 30, 2017 represents NOI from the Company’s same store portfolio consisting of 123 retail operating properties acquired or placed in service and stabilized prior to January 1, 2016. NOI from Other Investment Properties for the three and six months ended June 30, 2017 represents NOI primarily from properties acquired during 2016 and 2017, the Company’s one remaining office property, three properties where the Company has begun redevelopment and/or activities in anticipation of future redevelopment, the properties that were sold or held for sale in 2016 and 2017, the net income from the Company’s wholly-owned captive insurance company and the historical ground rent expense related to an existing same store investment property that was subject to a ground lease with a third party prior to the Company’s acquisition of the fee interest on April 29, 2016. The Company believes that NOI, Same Store NOI and NOI from Other Investment Properties, which are supplemental non-GAAP financial measures, provide an additional and useful operating perspective not immediately apparent from “Operating income” or “Net income attributable to common shareholders” in accordance with GAAP. The Company uses these measures to evaluate its performance on a property-by-property basis because they allow management to evaluate the impact that factors such as lease structure, lease rates and tenant base have on the Company’s operating results. NOI, Same Store NOI and NOI from Other Investment Properties do not represent alternatives to “Net income” or “Net income attributable to common shareholders” in accordance with GAAP as indicators of the Company’s financial performance. Comparison of the Company’s presentation of NOI, Same Store NOI and NOI from Other Investment Properties to similarly titled measures for other REITs may not necessarily be meaningful due to possible differences in definition and application by such REITs.
Adjusted EBITDA is a supplemental non-GAAP financial measure and represents net income attributable to common shareholders before interest, income taxes, depreciation and amortization, as further adjusted to eliminate the impact of certain items that the Company does not consider indicative of its ongoing performance. The Company believes that Adjusted EBITDA is useful because it allows investors and management to evaluate and compare the Company’s performance from period to period in a meaningful and consistent manner in addition to standard financial measurements under GAAP. Adjusted EBITDA should not be considered an alternative to “Net income attributable to common shareholders” as an indicator of the Company’s financial performance. Comparison of the Company’s presentation of Adjusted EBITDA to similarly titled measures for other REITs may not necessarily be meaningful due to possible differences in definition and application by such REITs.
Net Debt to Adjusted EBITDA is a supplemental non-GAAP financial measure and represents (i) the Company’s total notional debt, excluding unamortized premium, discount and capitalized loan fees, less cash and cash equivalents and disposition proceeds temporarily restricted related to potential Internal Revenue Code Section 1031 tax-deferred exchanges (1031 Exchanges) divided by (ii) Adjusted EBITDA for the prior three months, annualized. The Company believes that this ratio is useful because it provides investors with information regarding its total notional debt net of cash and cash equivalents and disposition proceeds temporarily restricted related to potential 1031 Exchanges, which could be used to repay debt, compared to its performance as measured using Adjusted EBITDA. Comparison of the Company’s presentation of Net Debt to Adjusted EBITDA to similarly titled measures for other REITs may not necessarily be meaningful due to possible differences in definition and application by such REITs.
Net Debt and Preferred Stock to Adjusted EBITDA is a supplemental non-GAAP financial measure and represents (i) the Company’s total notional debt, excluding unamortized premium, discount and capitalized loan fees, plus preferred stock, less cash and cash equivalents and disposition proceeds temporarily restricted related to potential 1031 Exchanges divided by (ii) Adjusted EBITDA for the prior three months, annualized. The Company believes that this ratio is useful because it provides investors with information regarding its total notional debt and preferred stock, net of cash and cash equivalents and disposition proceeds temporarily restricted related to potential 1031 Exchanges, which could be used to repay debt, compared to its performance as measured using Adjusted EBITDA. Comparison of the Company’s presentation of Net Debt and Preferred Stock to Adjusted EBITDA to similarly titled measures for other REITs may not necessarily be meaningful due to possible differences in definition and application by such REITs.
CONTACT INFORMATION
Michael Fitzmaurice
VP – Capital Markets & Investor Relations
Retail Properties of America, Inc.
(630) 634-4233
v
Retail Properties of America, Inc.
FFO Attributable to Common Shareholders and
Operating FFO Attributable to Common Shareholders Guidance
Per Share Guidance Range Full Year 2017 | ||||||||
Low | High | |||||||
Net income attributable to common shareholders | $ | 0.95 | $ | 1.00 | ||||
Depreciation and amortization of depreciable real estate | 0.86 | 0.86 | ||||||
Provision for impairment of investment properties | 0.06 | 0.06 | ||||||
Gain on sales of depreciable investment properties | (1.19 | ) | (1.19 | ) | ||||
FFO attributable to common shareholders | $ | 0.68 | $ | 0.73 | ||||
Impact on earnings from the early extinguishment of debt | 0.30 | 0.30 | ||||||
Provision for hedge ineffectiveness | — | — | ||||||
Preferred stock redemption in excess of carrying value | 0.02 | 0.02 | ||||||
Other | — | — | ||||||
Operating FFO attributable to common shareholders | $ | 1.00 | $ | 1.05 | ||||
vi
Retail Properties of America, Inc.
Condensed Consolidated Balance Sheets
(amounts in thousands, except par value amounts)
(unaudited)
June 30, 2017 | December 31, 2016 | |||||||
Assets | ||||||||
Investment properties: | ||||||||
Land | $ | 1,141,172 | $ | 1,191,403 | ||||
Building and other improvements | 4,023,200 | 4,284,664 | ||||||
Developments in progress | 28,254 | 23,439 | ||||||
5,192,626 | 5,499,506 | |||||||
Less accumulated depreciation | (1,363,604 | ) | (1,443,333 | ) | ||||
Net investment properties | 3,829,022 | 4,056,173 | ||||||
Cash and cash equivalents | 28,003 | 53,119 | ||||||
Accounts and notes receivable (net of allowances of $6,938 and $6,886, respectively) | 71,588 | 78,941 | ||||||
Acquired lease intangible assets, net | 131,092 | 142,015 | ||||||
Assets associated with investment properties held for sale | 44,087 | 30,827 | ||||||
Other assets, net | 160,531 | 91,898 | ||||||
Total assets | $ | 4,264,323 | $ | 4,452,973 | ||||
Liabilities and Equity | ||||||||
Liabilities: | ||||||||
Mortgages payable, net (includes unamortized premium of $1,223 and $1,437, respectively, unamortized discount of $(601) and $(622), respectively, and unamortized capitalized loan fees of $(772) and $(5,026), respectively) | $ | 355,239 | $ | 769,184 | ||||
Unsecured notes payable, net (includes unamortized discount of $(912) and $(971), respectively, and unamortized capitalized loan fees of $(3,647) and $(3,886), respectively) | 695,441 | 695,143 | ||||||
Unsecured term loans, net (includes unamortized capitalized loan fees of $(3,446) and $(2,402), respectively) | 646,554 | 447,598 | ||||||
Unsecured revolving line of credit | 182,000 | 86,000 | ||||||
Accounts payable and accrued expenses | 65,093 | 83,085 | ||||||
Distributions payable | 38,318 | 39,222 | ||||||
Acquired lease intangible liabilities, net | 102,720 | 105,290 | ||||||
Liabilities associated with investment properties held for sale | 1,142 | 864 | ||||||
Other liabilities | 75,339 | 74,501 | ||||||
Total liabilities | 2,161,846 | 2,300,887 | ||||||
Commitments and contingencies | ||||||||
Equity: | ||||||||
Preferred stock, $0.001 par value, 10,000 shares authorized, 7.00% Series A cumulative redeemable preferred stock, 5,400 shares issued and outstanding as of June 30, 2017 and December 31, 2016; liquidation preference $135,000 | 5 | 5 | ||||||
Class A common stock, $0.001 par value, 475,000 shares authorized, 230,943 and 236,770 shares issued and outstanding as of June 30, 2017 and December 31, 2016, respectively | 231 | 237 | ||||||
Additional paid-in capital | 4,853,680 | 4,927,155 | ||||||
Accumulated distributions in excess of earnings | (2,752,648 | ) | (2,776,033 | ) | ||||
Accumulated other comprehensive income | 1,209 | 722 | ||||||
Total equity | 2,102,477 | 2,152,086 | ||||||
Total liabilities and equity | $ | 4,264,323 | $ | 4,452,973 | ||||
2nd Quarter 2017 Supplemental Information | 1 | |
Retail Properties of America, Inc.
Condensed Consolidated Statements of Operations
(amounts in thousands, except per share amounts)
(unaudited)
Three Months Ended June 30, | Six Months Ended June 30, | |||||||||||||||
2017 | 2016 | 2017 | 2016 | |||||||||||||
Revenues | ||||||||||||||||
Rental income | $ | 106,017 | $ | 115,194 | $ | 215,991 | $ | 230,454 | ||||||||
Tenant recovery income | 29,524 | 29,654 | 60,310 | 60,010 | ||||||||||||
Other property income | 1,798 | 2,378 | 4,731 | 5,401 | ||||||||||||
Total revenues | 137,339 | 147,226 | 281,032 | 295,865 | ||||||||||||
Expenses | ||||||||||||||||
Operating expenses | 21,004 | 20,092 | 42,868 | 43,153 | ||||||||||||
Real estate taxes | 21,487 | 21,090 | 43,366 | 41,029 | ||||||||||||
Depreciation and amortization | 52,325 | 53,443 | 105,799 | 106,839 | ||||||||||||
Provision for impairment of investment properties | 13,034 | 4,142 | 13,034 | 6,306 | ||||||||||||
General and administrative expenses | 10,370 | 10,773 | 21,583 | 22,179 | ||||||||||||
Total expenses | 118,220 | 109,540 | 226,650 | 219,506 | ||||||||||||
Operating income | 19,119 | 37,686 | 54,382 | 76,359 | ||||||||||||
Gain on extinguishment of debt | — | — | — | 13,653 | ||||||||||||
Gain on extinguishment of other liabilities | — | 6,978 | — | 6,978 | ||||||||||||
Interest expense | (21,435 | ) | (25,977 | ) | (106,967 | ) | (52,741 | ) | ||||||||
Other income, net | 451 | 302 | 456 | 427 | ||||||||||||
(Loss) income from continuing operations | (1,865 | ) | 18,989 | (52,129 | ) | 44,676 | ||||||||||
Gain on sales of investment properties | 116,628 | 9,613 | 157,792 | 31,352 | ||||||||||||
Net income | 114,763 | 28,602 | 105,663 | 76,028 | ||||||||||||
Preferred stock dividends | (2,363 | ) | (2,363 | ) | (4,725 | ) | (4,725 | ) | ||||||||
Net income attributable to common shareholders | $ | 112,400 | $ | 26,239 | $ | 100,938 | $ | 71,303 | ||||||||
Earnings per common share – basic and diluted | ||||||||||||||||
Net income per common share attributable to common shareholders | $ | 0.48 | $ | 0.11 | $ | 0.43 | $ | 0.30 | ||||||||
Weighted average number of common shares outstanding – basic | 234,243 | 236,716 | 235,269 | 236,647 | ||||||||||||
Weighted average number of common shares outstanding – diluted | 234,818 | 236,902 | 235,842 | 236,781 | ||||||||||||
2nd Quarter 2017 Supplemental Information | 2 | |
Retail Properties of America, Inc.
Funds From Operations (FFO) Attributable to Common Shareholders,
Operating FFO Attributable to Common Shareholders and Additional Information
(dollar amounts in thousands, except per share amounts)
(unaudited)
FFO attributable to common shareholders and Operating FFO attributable to common shareholders (a) | ||||||||||||||||
Three Months Ended June 30, | Six Months Ended June 30, | |||||||||||||||
2017 | 2016 | 2017 | 2016 | |||||||||||||
Net income attributable to common shareholders | $ | 112,400 | $ | 26,239 | $ | 100,938 | $ | 71,303 | ||||||||
Depreciation and amortization of depreciable real estate | 51,911 | 53,100 | 104,990 | 106,194 | ||||||||||||
Provision for impairment of investment properties | 13,034 | 4,142 | 13,034 | 4,142 | ||||||||||||
Gain on sales of depreciable investment properties | (116,628 | ) | (9,613 | ) | (157,792 | ) | (31,352 | ) | ||||||||
FFO attributable to common shareholders | $ | 60,717 | $ | 73,868 | $ | 61,170 | $ | 150,287 | ||||||||
FFO attributable to common shareholders per common share outstanding | $ | 0.26 | $ | 0.31 | $ | 0.26 | $ | 0.64 | ||||||||
FFO attributable to common shareholders | $ | 60,717 | $ | 73,868 | $ | 61,170 | $ | 150,287 | ||||||||
Impact on earnings from the early extinguishment of debt, net | 2,312 | 4 | 68,669 | (12,842 | ) | |||||||||||
Provision for hedge ineffectiveness | 5 | 3 | 11 | 3 | ||||||||||||
Provision for impairment of non-depreciable investment property | — | — | — | 2,164 | ||||||||||||
Gain on extinguishment of other liabilities | — | (6,978 | ) | — | (6,978 | ) | ||||||||||
Other (b) | (149 | ) | (184 | ) | (19 | ) | (184 | ) | ||||||||
Operating FFO attributable to common shareholders | $ | 62,885 | $ | 66,713 | $ | 129,831 | $ | 132,450 | ||||||||
Operating FFO attributable to common shareholders per common share outstanding | $ | 0.27 | $ | 0.28 | $ | 0.55 | $ | 0.56 | ||||||||
Weighted average number of common shares outstanding – basic | 234,243 | 236,716 | 235,269 | 236,647 | ||||||||||||
Dividends declared per common share | $ | 0.165625 | $ | 0.165625 | $ | 0.33125 | $ | 0.33125 | ||||||||
Additional Information (c) | ||||||||||||||||
Lease-related expenditures (d) | ||||||||||||||||
Same store | $ | 8,381 | $ | 11,521 | $ | 13,966 | $ | 17,891 | ||||||||
Other investment properties (e) | $ | 9,790 | $ | 1,215 | $ | 11,094 | $ | 3,498 | ||||||||
Capital expenditures (f) | ||||||||||||||||
Same store | $ | 6,729 | $ | 6,549 | $ | 13,205 | $ | 9,206 | ||||||||
Other investment properties | $ | 1,902 | $ | 5,322 | $ | 3,121 | $ | 5,588 | ||||||||
Straight-line rental income, net | $ | 919 | $ | 800 | $ | 1,260 | $ | 1,828 | ||||||||
Amortization of above and below market lease intangibles and lease inducements | $ | 290 | $ | 74 | $ | 698 | $ | 419 | ||||||||
Non-cash ground rent expense (g) | $ | 537 | $ | 624 | $ | 1,083 | $ | 1,400 | ||||||||
(a) | Refer to page 19 for definitions of FFO attributable to common shareholders and Operating FFO attributable to common shareholders. |
(b) | Primarily consists of the impact on earnings from actual or anticipated settlement of litigation involving the Company, including associated legal costs, which are included in "Other income, net" in the condensed consolidated statements of operations. |
(c) | The same store portfolio for the three and six months ended June 30, 2017 consists of 123 retail operating properties. Refer to pages 19 – 22 for definitions and reconciliations of non-GAAP financial measures. |
(d) | Consists of payments for tenant improvements, lease commissions and lease inducements and excludes developments in progress. |
(e) | 2017 expenditures are primarily associated with Schaumburg Towers, the Company's one remaining office property. |
(f) | Consists of payments for building, site and other improvements, net of anticipated recoveries, and excludes developments in progress. |
(g) | Includes amortization of acquired ground lease intangibles and straight-line ground rent expense. |
2nd Quarter 2017 Supplemental Information | 3 | |
Retail Properties of America, Inc.
Supplemental Financial Statement Detail
(amounts in thousands)
(unaudited)
Supplemental Balance Sheet Detail | June 30, 2017 | December 31, 2016 | ||||||
Accounts and Notes Receivable | ||||||||
Accounts and notes receivable (net of allowances of $5,913 and $6,200, respectively) | $ | 23,274 | $ | 27,948 | ||||
Straight-line receivables (net of allowances of $1,025 and $686, respectively) | 48,314 | 50,993 | ||||||
Total | $ | 71,588 | $ | 78,941 | ||||
Other Assets, Net | ||||||||
Deferred costs, net | $ | 34,901 | $ | 30,657 | ||||
Restricted cash and escrows | 10,083 | 29,230 | ||||||
Disposition proceeds temporarily restricted related to potential Internal Revenue Code Section 1031 tax-deferred exchanges (1031 Exchanges) | 93,561 | — | ||||||
Fair value of derivatives | 1,219 | 743 | ||||||
Other assets, net | 20,767 | 31,268 | ||||||
Total | $ | 160,531 | $ | 91,898 | ||||
Other Liabilities | ||||||||
Unearned income | $ | 19,261 | $ | 16,883 | ||||
Straight-line ground rent liability | 31,485 | 31,516 | ||||||
Other liabilities | 24,593 | 26,102 | ||||||
Total | $ | 75,339 | $ | 74,501 | ||||
Developments in Progress | ||||||||
Active developments/redevelopments (a) | $ | 28,254 | $ | 23,439 | ||||
Supplemental Statements of Operations Detail | |||||||||||||||
Three Months Ended June 30, | Six Months Ended June 30, | ||||||||||||||
2017 | 2016 | 2017 | 2016 | ||||||||||||
Rental Income | |||||||||||||||
Base rent | $ | 103,843 | $ | 113,213 | $ | 210,860 | $ | 225,197 | |||||||
Percentage and specialty rent | 965 | 1,107 | 3,173 | 3,010 | |||||||||||
Straight-line rent | 919 | 800 | 1,260 | 1,828 | |||||||||||
Amortization of above and below market lease intangibles and lease inducements | 290 | 74 | 698 | 419 | |||||||||||
Total | $ | 106,017 | $ | 115,194 | $ | 215,991 | $ | 230,454 | |||||||
Other Property Income | |||||||||||||||
Lease termination income | $ | 510 | $ | 1,027 | $ | 2,122 | $ | 2,685 | |||||||
Other property income | 1,288 | 1,351 | 2,609 | 2,716 | |||||||||||
Total | $ | 1,798 | $ | 2,378 | $ | 4,731 | $ | 5,401 | |||||||
Operating Expense Supplemental Information | |||||||||||||||
Bad Debt Expense | $ | (41 | ) | $ | 17 | $ | 822 | $ | 619 | ||||||
Non-Cash Ground Rent Expense (b) | $ | 537 | $ | 624 | $ | 1,083 | $ | 1,400 | |||||||
General and Administrative Expense Supplemental Information | |||||||||||||||
Acquisition Costs (c) | $ | — | $ | 351 | $ | — | $ | 690 | |||||||
Non-Cash Amortization of Stock-Based Compensation | $ | 1,756 | $ | 1,675 | $ | 3,549 | $ | 3,699 | |||||||
Additional Supplemental Information | |||||||||||||||
Capitalized Compensation Costs | $ | 400 | $ | 241 | $ | 878 | $ | 502 | |||||||
Capitalized Internal Leasing Incentives | $ | 92 | $ | 85 | $ | 189 | $ | 164 | |||||||
Capitalized Interest | $ | 88 | $ | — | $ | 166 | $ | — | |||||||
(a) | Represents Reisterstown Road Plaza and Towson Circle. See page 10 for further details. |
(b) | Includes amortization of acquired ground lease intangibles and straight-line ground rent expense. |
(c) | The Company adopted ASU 2017-01, Business Combinations, on a prospective basis as of October 1, 2016. As a result, 2017 acquisition costs have been capitalized. |
2nd Quarter 2017 Supplemental Information | 4 | |
Retail Properties of America, Inc.
Same Store Net Operating Income (NOI)
(dollar amounts in thousands)
(unaudited)
Same store portfolio (a) | |||||||||
Based on Same store portfolio as of June 30, 2017 | |||||||||
2017 | 2016 | Change | |||||||
Number of retail operating properties in same store portfolio | 123 | 123 | — | ||||||
Occupancy | 93.7 | % | 94.2 | % | (0.5 | )% | |||
Percent leased (b) | 94.8 | % | 95.7 | % | (0.9 | )% | |||
Same Store NOI (c) | ||||||||||||||||||||||
Three Months Ended June 30, | Six Months Ended June 30, | |||||||||||||||||||||
2017 | 2016 | Change | 2017 | 2016 | Change | |||||||||||||||||
Base rent | $ | 88,041 | $ | 86,806 | $ | 175,787 | $ | 173,126 | ||||||||||||||
Percentage and specialty rent | 490 | 802 | 1,890 | 2,134 | ||||||||||||||||||
Tenant recovery income | 24,562 | 23,992 | 49,926 | 48,738 | ||||||||||||||||||
Other property operating income (d) | 874 | 809 | 1,773 | 1,622 | ||||||||||||||||||
113,967 | 112,409 | 229,376 | 225,620 | |||||||||||||||||||
Property operating expenses (e) | 15,229 | 15,319 | 30,975 | 31,908 | ||||||||||||||||||
Bad debt expense | (29 | ) | 90 | 531 | 442 | |||||||||||||||||
Real estate taxes | 17,556 | 17,223 | 35,017 | 33,523 | ||||||||||||||||||
32,756 | 32,632 | 66,523 | 65,873 | |||||||||||||||||||
Same Store NOI (c) | $ | 81,211 | $ | 79,777 | 1.8 | % | $ | 162,853 | $ | 159,747 | 1.9 | % | ||||||||||
(a) | For the three and six months ended June 30, 2017, the Company's same store portfolio consists of 123 retail operating properties and excludes properties acquired or placed in service and stabilized during 2016 and 2017, the Company's one remaining office property, three properties where the Company has begun redevelopment and/or activities in anticipation of future redevelopment and investment properties sold or classified as held for sale during 2016 and 2017. |
(b) | Includes leases signed but not commenced. |
(c) | Refer to pages 19 – 22 for definitions and reconciliations of non-GAAP financial measures. Comparison of the Company's presentation of Same Store NOI to similarly titled measures for other REITs may not necessarily be meaningful due to possible differences in definition and application by such REITs. |
(d) | Consists of all operating items included in "Other property income" in the condensed consolidated statements of operations, which include all items other than lease termination fee income. |
(e) | Consists of all property operating items included in "Operating expenses" in the condensed consolidated statements of operations, which include all items other than straight-line ground rent expense and amortization of acquired ground lease intangibles, which are non-cash items. |
2nd Quarter 2017 Supplemental Information | 5 | |
Retail Properties of America, Inc.
Capitalization
(dollar amounts in thousands, except share price and ratios)
Capitalization Data | ||||||||
June 30, 2017 | December 31, 2016 | |||||||
Equity Capitalization | ||||||||
Common stock shares outstanding (a) | 230,943 | 236,770 | ||||||
Common stock share price | $ | 12.21 | $ | 15.33 | ||||
2,819,814 | 3,629,684 | |||||||
Series A preferred stock | 135,000 | 135,000 | ||||||
Total equity capitalization | $ | 2,954,814 | $ | 3,764,684 | ||||
Debt Capitalization | ||||||||
Mortgages payable (b) | $ | 355,389 | $ | 773,395 | ||||
Unsecured notes payable (c) | 700,000 | 700,000 | ||||||
Unsecured term loans (d) | 650,000 | 450,000 | ||||||
Unsecured revolving line of credit | 182,000 | 86,000 | ||||||
Total debt capitalization | $ | 1,887,389 | $ | 2,009,395 | ||||
Total capitalization at end of period | $ | 4,842,203 | $ | 5,774,079 | ||||
Calculation of Net Debt to Adjusted EBITDA Ratios (e)
June 30, 2017 | December 31, 2016 | |||||||
Total notional debt | $ | 1,887,389 | $ | 2,009,395 | ||||
Less: consolidated cash and cash equivalents | (28,003 | ) | (53,119 | ) | ||||
Less: disposition proceeds temporarily restricted related to potential 1031 Exchanges | (93,561 | ) | — | |||||
Total net debt | $ | 1,765,825 | $ | 1,956,276 | ||||
Total net debt and preferred stock | $ | 1,900,825 | $ | 2,091,276 | ||||
Adjusted EBITDA (f) | $ | 339,716 | $ | 351,472 | ||||
Net Debt to Adjusted EBITDA | 5.2x | 5.6x | ||||||
Net Debt and Preferred Stock to Adjusted EBITDA | 5.6x | 6.0x | ||||||
(a) | Excludes performance restricted stock units and options outstanding, which could potentially convert into common stock in the future. |
(b) | Mortgages payable excludes mortgage premium of $1,223 and $1,437, discount of $(601) and $(622), and capitalized loan fees of $(772) and $(5,026), net of accumulated amortization, as of June 30, 2017 and December 31, 2016, respectively. |
(c) | Unsecured notes payable exclude discount of $(912) and $(971) and capitalized loan fees of $(3,647) and $(3,886), net of accumulated amortization, as of June 30, 2017 and December 31, 2016, respectively. |
(d) | Unsecured term loans exclude capitalized loan fees of $(3,446) and $(2,402), net of accumulated amortization, as of June 30, 2017 and December 31, 2016, respectively. |
(e) | Refer to pages 19 – 22 for definitions and reconciliations of non-GAAP financial measures. |
(f) | For purposes of these ratio calculations, annualized three months ended figures were used. |
2nd Quarter 2017 Supplemental Information | 6 | |
Retail Properties of America, Inc.
Covenants
Unsecured Credit Facility, Term Loan Due 2023 and Notes Due 2021, 2024, 2026 and 2028 (a) | |||||
Covenant | June 30, 2017 | ||||
Leverage ratio (b) | < 60.0% | (b) | 34.3 | % | |
Secured leverage ratio (b) | Unsecured Credit Facility and Term Loan Due 2023: Notes Due 2021, 2024, 2026 and 2028: | < 45.0% < 40.0% | (b) | 6.5 | % |
Fixed charge coverage ratio (c) | > 1.50x | 3.2x | |||
Interest coverage ratio (d) | > 1.50x | 3.9x | |||
Unencumbered leverage ratio (b) | < 60.0% | (b) | 32.8 | % | |
Unencumbered interest coverage ratio | > 1.75x | 5.3x | |||
Notes Due 2025 (e) | ||||
Covenant | June 30, 2017 | |||
Leverage ratio (f) | < 60.0% | 33.9 | % | |
Secured leverage ratio (f) | < 40.0% | 6.4 | % | |
Debt service coverage ratio (g) | > 1.50x | 4.8x | ||
Unencumbered assets to unsecured debt ratio | > 150% | 312 | % | |
(a) | For a complete listing of all covenants related to the Company's Unsecured Credit Facility (comprised of the unsecured term loans and unsecured revolving line of credit) as well as covenant definitions, refer to the Fourth Amended and Restated Credit Agreement filed as Exhibit 10.8 to the Company's Annual Report on Form 10-K for the year ended December 31, 2015, filed on February 17, 2016. For a complete listing of all covenants as well as covenant definitions related to the Company's Term Loan Due 2023, refer to the credit agreement filed as Exhibit 10.1 to the Company's Current Report on Form 8-K, dated November 29, 2016. The Term Loan Due 2023 closed during the year ended December 31, 2016 and funded on January 3, 2017. For a complete listing of all covenants related to the Company's 4.12% senior unsecured notes due 2021 and 4.58% senior unsecured notes due 2024 (Notes Due 2021 and 2024) as well as covenant definitions, refer to the Note Purchase Agreement filed as Exhibit 10.1 to the Company's Current Report on Form 8-K, dated May 22, 2014. For a complete listing of all covenants related to the Company's 4.08% senior unsecured notes due 2026 and 4.24% senior unsecured notes due 2028 (Notes Due 2026 and 2028) as well as covenant definitions, refer to the Note Purchase Agreement filed as Exhibit 10.1 to the Company's Current Report on Form 8-K, dated October 5, 2016. |
(b) | Based upon a capitalization rate of 6.75%. |
(c) | Applies only to the Company's Unsecured Credit Facility, Term Loan Due 2023 and Notes Due 2026 and 2028. This ratio is based upon consolidated debt service, including interest expense, principal amortization and preferred dividends declared, excluding interest expense related to defeasance costs and prepayment premiums. |
(d) | Applies only to the Company's Notes Due 2021, 2024, 2026 and 2028. |
(e) | For a complete listing of all covenants related to the Company's 4.00% senior unsecured notes due 2025 (Notes Due 2025) as well as covenant definitions, refer to the First Supplemental Indenture filed as Exhibit 4.2 to the Company's Current Report on Form 8-K, dated March 12, 2015. |
(f) | Based upon the book value of Total Assets as defined in the First Supplemental Indenture. |
(g) | Based upon interest expense and excludes principal amortization and preferred dividends declared. This ratio is calculated on a pro forma basis with the assumption that debt and property transactions occurred on the first day of the preceding four-quarter period. |
2nd Quarter 2017 Supplemental Information | 7 | |
Retail Properties of America, Inc.
Consolidated Debt Summary as of June 30, 2017
(dollar amounts in thousands)
Balance | Weighted Average (WA) Interest Rate (a) | WA Years to Maturity | |||||||
Fixed rate mortgages payable (b) | $ | 355,389 | 5.22 | % | 4.9 years | ||||
Unsecured notes payable: | |||||||||
Senior notes – 4.12% due 2021 | 100,000 | 4.12 | % | 4.0 years | |||||
Senior notes – 4.58% due 2024 | 150,000 | 4.58 | % | 7.0 years | |||||
Senior notes – 4.00% due 2025 | 250,000 | 4.00 | % | 7.7 years | |||||
Senior notes – 4.08% due 2026 | 100,000 | 4.08 | % | 9.3 years | |||||
Senior notes – 4.24% due 2028 | 100,000 | 4.24 | % | 11.5 years | |||||
Total unsecured notes payable (b) | 700,000 | 4.19 | % | 7.8 years | |||||
Unsecured credit facility: | |||||||||
Term loan – fixed rate (c) | 250,000 | 1.97 | % | 3.5 years | |||||
Term loan – variable rate | 200,000 | 2.61 | % | 0.9 years | |||||
Revolving line of credit – variable rate | 182,000 | 2.58 | % | 2.5 years | |||||
Total unsecured credit facility (b) | 632,000 | 2.35 | % | 2.4 years | |||||
Term Loan Due 2023 – fixed rate (b) (d) | 200,000 | 2.96 | % | 6.4 years | |||||
Total consolidated indebtedness | $ | 1,887,389 | 3.64 | % | 5.3 years | ||||
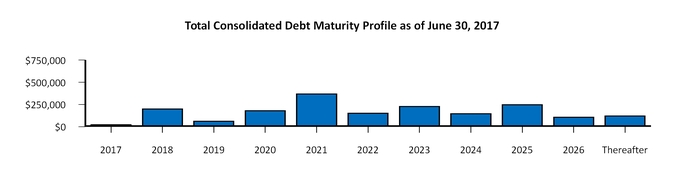
Consolidated Debt Maturity Schedule as of June 30, 2017 | ||||||||||||||||||||||||
Year | Fixed Rate (b) | WA Rates on Fixed Debt | Variable Rate (b) | WA Rates on Variable Debt (e) | Total | % of Total | WA Rates on Total Debt (a) | |||||||||||||||||
2017 | $ | 27,157 | 4.18 | % | $ | — | — | $ | 27,157 | 1.4 | % | 4.18 | % | |||||||||||
2018 | 5,065 | 5.49 | % | 200,000 | 2.61 | % | 205,065 | 10.9 | % | 2.68 | % | |||||||||||||
2019 | 65,352 | 7.45 | % | — | — | 65,352 | 3.5 | % | 7.45 | % | ||||||||||||||
2020 | 3,923 | 4.62 | % | 182,000 | 2.58 | % | 185,923 | 9.8 | % | 2.62 | % | |||||||||||||
2021 | 372,820 | 2.73 | % | — | — | 372,820 | 19.8 | % | 2.73 | % | ||||||||||||||
2022 | 157,216 | 4.97 | % | — | — | 157,216 | 8.3 | % | 4.97 | % | ||||||||||||||
2023 | 231,758 | 3.12 | % | — | — | 231,758 | 12.3 | % | 3.12 | % | ||||||||||||||
2024 | 151,737 | 4.57 | % | — | — | 151,737 | 8.0 | % | 4.57 | % | ||||||||||||||
2025 | 251,809 | 4.00 | % | — | — | 251,809 | 13.3 | % | 4.00 | % | ||||||||||||||
2026 | 112,634 | 4.15 | % | — | — | 112,634 | 6.0 | % | 4.15 | % | ||||||||||||||
Thereafter | 125,918 | 4.26 | % | — | — | 125,918 | 6.7 | % | 4.26 | % | ||||||||||||||
Total | $ | 1,505,389 | 3.90 | % | $ | 382,000 | 2.59 | % | $ | 1,887,389 | 100.0 | % | 3.64 | % | ||||||||||
(a) | Interest rates presented exclude the impact of premium, discount and capitalized loan fee amortization. As of June 30, 2017, the Company's overall weighted average interest rate for consolidated debt including the impact of premium, discount and capitalized loan fee amortization was 3.82%. |
(b) | Fixed rate mortgages payable excludes mortgage premium of $1,223, discount of $(601) and capitalized loan fees of $(772), net of accumulated amortization, as of June 30, 2017. Unsecured notes payable excludes discount of $(912) and capitalized loan fees of $(3,647), net of accumulated amortization, as of June 30, 2017. Term loans exclude capitalized loan fees of $(3,446), net of accumulated amortization, as of June 30, 2017. In the consolidated debt maturity schedule, maturity amounts for each year include scheduled principal amortization payments. |
(c) | Reflects $250,000 of LIBOR-based variable rate debt that has been swapped to a weighted average fixed rate of 0.67% plus a credit spread based on a leverage grid ranging from 1.30% to 2.20% through December 31, 2017. The applicable credit spread was 1.30% as of June 30, 2017. |
(d) | Reflects $200,000 of LIBOR-based variable rate debt that has been swapped to a fixed rate of 1.26% plus a credit spread based on a leverage grid ranging from 1.70% to 2.55% through November 22, 2018. The applicable credit spread was 1.70% as of June 30, 2017. |
(e) | Represents interest rates as of June 30, 2017. |
2nd Quarter 2017 Supplemental Information | 8 | |
Retail Properties of America, Inc.
Summary of Indebtedness as of June 30, 2017
(dollar amounts in thousands)
Description | Maturity Date | Interest Rate (a) | Interest Rate Type | Secured or Unsecured | Balance as of 6/30/2017 | |||||||
Consolidated Indebtedness | ||||||||||||
Lincoln Park | 12/01/17 | 4.05% | Fixed | Secured | $ | 24,796 | ||||||
Corwest Plaza | 04/01/19 | 7.25% | Fixed | Secured | 13,890 | |||||||
Dorman Center | 04/01/19 | 7.70% | Fixed | Secured | 19,779 | |||||||
Shops at Park Place | 05/01/19 | 7.48% | Fixed | Secured | 7,468 | |||||||
Shoppes of New Hope | 06/01/19 | 7.75% | Fixed | Secured | 3,335 | |||||||
Village Shoppes at Simonton | 06/01/19 | 7.75% | Fixed | Secured | 3,078 | |||||||
Plaza at Marysville | 09/01/19 | 8.00% | Fixed | Secured | 8,478 | |||||||
Forks Town Center | 10/01/19 | 7.70% | Fixed | Secured | 7,734 | |||||||
Sawyer Heights Village | 07/01/21 | 5.00% | Fixed | Secured | 18,700 | |||||||
Ashland & Roosevelt (bank pad) | 02/25/22 | 7.48% | Fixed | Secured | 897 | |||||||
Gardiner Manor Mall | 03/01/22 | 4.95% | Fixed | Secured | 34,441 | |||||||
Peoria Crossings | 04/01/22 | 4.82% | Fixed | Secured | 24,131 | |||||||
Southlake Corners | 04/01/22 | 4.89% | Fixed | Secured | 20,945 | |||||||
Tollgate Marketplace | 04/01/22 | 4.84% | Fixed | Secured | 35,000 | |||||||
Reisterstown Road Plaza | 06/01/22 | 5.25% | Fixed | Secured | 46,250 | |||||||
Gateway Village | 01/01/23 | 4.14% | Fixed | Secured | 34,633 | |||||||
Home Depot Plaza | 12/01/26 | 4.82% | Fixed | Secured | 10,750 | |||||||
Northgate North | 06/01/27 | 4.50% | Fixed | Secured | 26,107 | |||||||
The Shoppes at Union Hill | 06/01/31 | 3.75% | Fixed | Secured | 14,977 | |||||||
Mortgages payable (b) | 355,389 | |||||||||||
Senior notes – 4.12% due 2021 | 06/30/21 | 4.12% | Fixed | Unsecured | 100,000 | |||||||
Senior notes – 4.58% due 2024 | 06/30/24 | 4.58% | Fixed | Unsecured | 150,000 | |||||||
Senior notes – 4.00% due 2025 | 03/15/25 | 4.00% | Fixed | Unsecured | 250,000 | |||||||
Senior notes – 4.08% due 2026 | 09/30/26 | 4.08% | Fixed | Unsecured | 100,000 | |||||||
Senior notes – 4.24% due 2028 | 12/28/28 | 4.24% | Fixed | Unsecured | 100,000 | |||||||
Unsecured notes payable (b) | 700,000 | |||||||||||
Term loan | 01/05/21 | 1.97% | (c) | Fixed | Unsecured | 250,000 | ||||||
Term loan | 05/11/18 | 2.61% | Variable | Unsecured | 200,000 | |||||||
Revolving line of credit | 01/05/20 | 2.58% | Variable | Unsecured | 182,000 | |||||||
Unsecured credit facility (b) | 632,000 | |||||||||||
Term Loan Due 2023 (b) | 11/22/23 | 2.96% | (d) | Fixed | Unsecured | 200,000 | ||||||
Total consolidated indebtedness | 10/13/22 | 3.64% | $ | 1,887,389 | ||||||||
(a) | Interest rates presented exclude the impact of the premium, discount and capitalized loan fee amortization. As of June 30, 2017, the Company's overall weighted average interest rate for consolidated debt including the impact of premium, discount and capitalized loan fee amortization was 3.82%. |
(b) | Mortgages payable excludes mortgage premium of $1,223, discount of $(601) and capitalized loan fees of $(772), net of accumulated amortization, as of June 30, 2017. Unsecured notes payable excludes discount of $(912) and capitalized loan fees of $(3,647), net of accumulated amortization, as of June 30, 2017. Term loans exclude capitalized loan fees of $(3,446), net of accumulated amortization, as of June 30, 2017. |
(c) | Reflects $250,000 of LIBOR-based variable rate debt that has been swapped to a weighted average fixed rate of 0.67% plus a credit spread based on a leverage grid ranging from 1.30% to 2.20% through December 31, 2017. The applicable credit spread was 1.30% as of June 30, 2017. |
(d) | Reflects $200,000 of LIBOR-based variable rate debt that has been swapped to a fixed rate of 1.26% plus a credit spread based on a leverage grid ranging from 1.70% to 2.55% through November 22, 2018. The applicable credit spread was 1.70% as of June 30, 2017. |
2nd Quarter 2017 Supplemental Information | 9 | |
Retail Properties of America, Inc.
Development Projects as of June 30, 2017
(dollar amounts in thousands)
Property Name | Metropolitan Statistical Area (MSA) | Included in Same store portfolio (a) | Total Estimated Net Costs (b) | Net Costs Inception to Date | Incremental Gross Leasable Area (GLA) | Targeted Completion (c) | Projected Incremental Return on Cost (d) | Project Description | |||||||||||||
Redevelopments | |||||||||||||||||||||
Reisterstown Road Plaza | Baltimore | No | $9,500-$10,500 | $ | 4,857 | (61,200 | ) | Q4 2017 | 9.5%-11.5% | Reconfigure existing space with a facade renovation | |||||||||||
Towson Circle | Baltimore | No | $33,000-$35,000 | $ | 11,207 | (40,000 | ) | Q4 2019 | 8.0%-10.0% | Mixed-use redevelopment that will include double-sided street level retail with approximately 370 third-party-owned residential units above | |||||||||||
Expansions and Pad Developments | |||||||||||||||||||||
Lakewood Towne Center | Seattle | Yes | $ | 1,900 | $ | 526 | 4,500 | Q3 2017 | 7.0%-8.0% | 4,500 sq. ft. pad development | |||||||||||
Property Name | MSA | Included in Same store portfolio (a) | Targeted Commencement | Project Description | ||||
Redevelopment Pipeline | ||||||||
Boulevard at the Capital Centre | Washington, D.C. | No | 2018 | Dimensions Healthcare/University of Maryland Regional Medical Center phased redevelopment; Certificate of Need approved in October 2016 | ||||
Merrifield Town Center II | Washington, D.C. | No (e) | 2019 | Mixed-use redevelopment and monetization of air rights | ||||
Tysons Corner | Washington, D.C. | Yes | 2021 | Redevelopment with increased density | ||||
(a) | The Company's same store portfolio consists of retail operating properties acquired or placed in service and stabilized prior to January 1, 2016. A property is removed from the Company's same store portfolio if the project is considered to significantly impact the existing property's NOI and activities have begun in anticipation of the project. Expansions and Pad Developments are not considered to significantly impact the existing property's NOI, and therefore, have not been removed from the Company's same store portfolio if they have otherwise met the criteria to be included in the Company's same store portfolio as of June 30, 2017. |
(b) | Net costs represent the Company's estimated share of the project costs, net of proceeds from land sales, reimbursement from third parties and contributions from project partners, as applicable. |
(c) | A redevelopment is considered complete and its classification changed from development to operating when it is substantially completed and held available for occupancy, but no later than one year from the completion of major construction activity. |
(d) | Projected Incremental Return on Cost (ROC) generally reflects only the unleveraged incremental NOI generated by the project upon stabilization and is calculated as incremental NOI divided by incremental cost. A property is considered stabilized upon reaching 90% occupancy, but no later than one year from the date it was classified as operating. Incremental NOI is the difference between NOI expected to be generated by the stabilized project and the NOI generated prior to the commencement of active redevelopment, development or expansion of the space. ROC does not include peripheral impacts, such as the impact on future lease rollover at the property or the impact on the long-term value of the property. |
(e) | Property was acquired subsequent to December 31, 2015, and as such, does not meet the criteria to be included in the Company's same store portfolio as of June 30, 2017. |
The Company cannot guarantee that (i) ROC will be generated at the percentage listed or at all, (ii) total net costs associated with these projects will be equal to the total estimated net costs, (iii) project completion or stabilization will occur when anticipated or (iv) that the Company will ultimately complete any or all of these projects. The ROC and total estimated net costs reflect the Company's best estimate based upon current information, may change over time and are subject to certain conditions which are beyond the Company's control, including, without limitation, general economic conditions, market conditions and other business factors.
2nd Quarter 2017 Supplemental Information | 10 | |
Retail Properties of America, Inc.
Development Projects as of June 30, 2017 (continued)
(dollar amounts in thousands)
The Company has identified the following potential expansion and pad development opportunities to add stand-alone buildings, convert previously under-utilized space or develop additional retail GLA at existing properties. Executing on these opportunities may be subject to certain conditions which are beyond the Company's control, including, without limitation, government approvals, tenant consents as well as general economic, market and other conditions and, therefore, the Company can provide no assurances that any of the expansion and pad development opportunities (i) will be executed on, (ii) will commence when anticipated or (iii) will ultimately be realized.
Property Name | MSA | Included in Same store portfolio (a) | Potential Additional Square Feet | |||||
Expansions and Pad Development Opportunities | ||||||||
Southlake Town Square | Dallas | Yes | 275,000 | |||||
One Loudoun Downtown | Washington, D.C. | No (b) | 182,000 | (c) | ||||
Main Street Promenade | Chicago | No (b) | 62,000 | |||||
Governor's Marketplace | Tallahassee | Yes | 20,600 | |||||
Lakewood Towne Center | Seattle | Yes | 10,500 | |||||
Reisterstown Road Plaza | Baltimore | No (d) | 8,000 - 12,000 | |||||
Gateway Plaza | Dallas | Yes | 8,000 | |||||
High Ridge Crossing | St. Louis | Yes | 7,500 | |||||
Humblewood Shopping Center | Houston | Yes | 5,000 | |||||
Watauga Pavilion | Dallas | Yes | 5,000 | |||||
Page Field Commons | Cape Coral-Fort Myers, FL | Yes | 4,700 | |||||
Downtown Crown | Washington, D.C. | Yes | 3,000 - 9,000 | |||||
(a) | The Company's same store portfolio consists of retail operating properties acquired or placed in service and stabilized prior to January 1, 2016. A property is removed from the Company's same store portfolio if the project is considered to significantly impact the existing property's NOI and activities have begun in anticipation of the project. Expansions and Pad Development Opportunities are not considered to significantly impact the existing property's NOI, and therefore, have not been removed from the Company's same store portfolio if they have otherwise met the criteria to be included in the Company's same store portfolio as of June 30, 2017. |
(b) | Property was acquired subsequent to December 31, 2015, and as such, does not meet the criteria to be included in the Company's same store portfolio as of June 30, 2017. |
(c) | The acquisition of One Loudoun Downtown includes six vacant parcels that have been identified for future development of up to 182,000 square feet of commercial GLA and rights to develop 408 multi-family units at the property. |
(d) | Property is an active redevelopment, and as such, does not meet the criteria to be included in the Company's same store portfolio as of June 30, 2017. |
Property Name | MSA | Included in Same store portfolio (e) | Total Estimated Net Costs (e) | Net Costs Inception to Date | Incremental GLA | Completion | Projected Incremental Return on Cost (e) | Project Description | |||||||||||||
Completed Expansions and Pad Developments | |||||||||||||||||||||
Lake Worth Towne Crossing – Parcel | Dallas | Yes | $ | 2,872 | $ | 2,872 | 15,030 | Q4 2015 | 11.3% | 15,030 sq. ft. multi-tenant retail | |||||||||||
Parkway Towne Crossing | Dallas | Yes | $ | 3,468 | $ | 3,468 | 21,000 | Q3 2016 | 9.9% | 21,000 sq. ft. multi-tenant retail | |||||||||||
Heritage Square | Seattle | Yes | $ | 1,507 | $ | 1,507 | (360 | ) | Q3 2016 | 11.2% | 4,200 sq. ft. redevelopment of outparcel for new tenant, Corner Bakery | ||||||||||
Pavilion at King's Grant | Charlotte | Yes | $ | 2,500 | $ | 2,171 | 32,400 | Q2 2017 | 14.7% | 32,400 sq. ft. multi-tenant retail | |||||||||||
Shops at Park Place | Dallas | Yes | $ | 3,950 | $ | 3,230 | 25,040 | Q2 2017 | 9.1% | 25,040 sq. ft. pad development | |||||||||||
(e) | See footnotes on page 10. |
2nd Quarter 2017 Supplemental Information | 11 | |
Retail Properties of America, Inc.
Acquisitions for the Six Months Ended June 30, 2017
(amounts in thousands, except square footage amounts)
Property Name | Acquisition Date | MSA | Property Type | GLA | Gross Purchase Price | Mortgage Debt Assumed | |||||||||||
Main Street Promenade | January 13, 2017 | Chicago | Multi-tenant retail | 181,600 | $ | 88,000 | $ | — | |||||||||
Boulevard at the Capital Centre – Fee Interest (a) | January 25, 2017 | Washington, D.C. | Fee interest (a) | — | 2,000 | — | |||||||||||
One Loudoun Downtown – Phase II (b) | February 24, 2017 | Washington, D.C. | Additional phase of multi-tenant retail (b) | 15,900 | 4,128 | — | |||||||||||
One Loudoun Downtown – Phase III (b) | April 5, 2017 | Washington, D.C. | Additional phase of multi-tenant retail (b) | 9,800 | 2,193 | — | |||||||||||
One Loudoun Downtown – Phase IV (b) | May 16, 2017 | Washington, D.C. | Development rights (b) | — | 3,500 | — | |||||||||||
Total 2017 acquisitions (through June 30, 2017) | 207,300 | $ | 99,821 | $ | — | ||||||||||||
(a) | The wholly-owned multi-tenant retail operating property located in Largo, Maryland was previously subject to an approximately 70 acre long-term ground lease with a third party. The Company completed a transaction whereby it received the fee interest in approximately 50 acres of the underlying land in exchange for which (i) the Company paid $1,939 and (ii) the term of the ground lease with respect to the remaining approximately 20 acres was shortened to nine months. The Company derecognized building and improvements of $11,347 related to the remaining ground lease, recognized the fair value of land received of $15,200 and recorded a deferred gain of $2,524. The deferred gain will be recognized upon the expiration of the remaining ground lease. The total number of properties in the Company's portfolio was not affected by this transaction. |
(b) | The Company acquired three additional phases, including the development rights for an additional 123 multi-family units for a total of 408, at its One Loudoun Downtown multi-tenant retail operating property. The total number of properties in the Company's portfolio was not affected by these transactions. The remaining phases at One Loudoun Downtown, representing an aggregate gross purchase price of up to $25,700, are expected to close during the third quarter of 2017 as the seller completes construction on stand-alone buildings at the property. |
Subsequent to June 30, 2017, the Company closed on the following acquisition:
Property Name | Acquisition Date | MSA | Property Type | GLA | Gross Purchase Price | Mortgage Debt Assumed | |||||||||||
New Hyde Park Shopping Center | July 6, 2017 | New York | Multi-tenant retail | 32,300 | $ | 22,075 | $ | — | |||||||||
Subsequent acquisition | 32,300 | $ | 22,075 | $ | — | ||||||||||||
2nd Quarter 2017 Supplemental Information | 12 | |
Retail Properties of America, Inc.
Dispositions for the Six Months Ended June 30, 2017
(amounts in thousands, except square footage amounts)
Property Name | Disposition Date | Property Type | GLA | Consideration | Debt Repaid or Defeased | Defeasance Cost / Prepayment Premium | |||||||||||||
Rite Aid Store (Eckerd), Culver Rd. – Rochester, NY | January 27, 2017 | Single-user retail | 10,900 | $ | 500 | $ | — | $ | — | ||||||||||
Shoppes at Park West | February 21, 2017 | Multi-tenant retail | 63,900 | 15,383 | 4,993 | (a) | 792 | ||||||||||||
CVS Pharmacy – Sylacauga, AL | March 7, 2017 | Single-user retail | 10,100 | 3,700 | (b) | — | — | ||||||||||||
Rite Aid Store (Eckerd) – Kill Devil Hills, NC | March 8, 2017 | Single-user retail | 13,800 | 4,297 | 1,783 | (a) | 283 | ||||||||||||
Century III Plaza – Home Depot (c) | March 15, 2017 | Single-user parcel | 131,900 | 17,519 | — | — | |||||||||||||
Village Shoppes at Gainesville | March 16, 2017 | Multi-tenant retail | 229,500 | 41,750 | 19,371 | 2,054 | |||||||||||||
Northwood Crossing | March 24, 2017 | Multi-tenant retail | 160,000 | 22,850 | (b) | — | — | ||||||||||||
University Town Center | April 4, 2017 | Multi-tenant retail | 57,500 | 14,700 | (b) | 4,191 | (a) | 665 | |||||||||||
Edgemont Town Center | April 4, 2017 | Multi-tenant retail | 77,700 | 19,025 | (b) | 6,108 | (a) | 969 | |||||||||||
Phenix Crossing | April 4, 2017 | Multi-tenant retail | 56,600 | 12,400 | (b) | 3,923 | (a) | 622 | |||||||||||
Brown's Lane | April 27, 2017 | Multi-tenant retail | 74,700 | 10,575 | 4,637 | (a) | 736 | ||||||||||||
Rite Aid Store (Eckerd) – Greer, SC | May 9, 2017 | Single-user retail | 13,800 | 3,050 | 1,498 | (a) | 238 | ||||||||||||
Evans Towne Centre | May 9, 2017 | Multi-tenant retail | 75,700 | 11,825 | 4,012 | (a) | 637 | ||||||||||||
Red Bug Village | May 25, 2017 | Multi-tenant retail | 26,200 | 8,100 | — | — | |||||||||||||
Wilton Square | May 26, 2017 | Multi-tenant retail | 438,100 | 49,300 | — | — | |||||||||||||
Town Square Plaza | May 30, 2017 | Multi-tenant retail | 215,600 | 28,600 | 16,815 | 2,261 | |||||||||||||
Cuyahoga Falls Market Center | May 31, 2017 | Multi-tenant retail | 76,400 | 11,500 | 3,433 | (a) | 545 | ||||||||||||
Plaza Santa Fe II | June 5, 2017 | Multi-tenant retail | 224,200 | 35,220 | — | — | |||||||||||||
Rite Aid Store (Eckerd)–Columbia, SC | June 6, 2017 | Single-user retail | 13,400 | 3,250 | 1,560 | (a) | 248 | ||||||||||||
Fox Creek Village | June 16, 2017 | Multi-tenant retail | 107,500 | 24,825 | 8,471 | (a) | 1,344 | ||||||||||||
Cottage Plaza | June 29, 2017 | Multi-tenant retail | 85,500 | 23,050 | 10,076 | (a) | 1,598 | ||||||||||||
Magnolia Square | June 29, 2017 | Multi-tenant retail | 116,000 | 16,000 | 5,974 | (a) | 948 | ||||||||||||
Cinemark Seven Bridges | June 29, 2017 | Single-user retail | 70,200 | 15,271 | 4,637 | (a) | 736 | ||||||||||||
Low Country Village I & II | June 29, 2017 | Multi-tenant retail | 139,900 | 22,075 | (b) | — | — | ||||||||||||
Total 2017 dispositions (through June 30, 2017) | 2,489,100 | $ | 414,765 | $ | 101,482 | $ | 14,676 | ||||||||||||
(a) | Debt on this property was defeased as part of the January 2017 defeasance of the IW JV portfolio of mortgages payable. |
(b) | Disposition proceeds related to this property are temporarily restricted related to a potential 1031 Exchange. As of June 30, 2017, disposition proceeds totaling $93,561 are temporarily restricted and are included in "Other assets, net" in the condensed consolidated balance sheets. |
(c) | The Company disposed of the Home Depot parcel at Century III Plaza, an existing 284,100 square foot multi-tenant retail operating property. The remaining portion of Century III Plaza is classified as held for sale as of June 30, 2017. |
Subsequent to June 30, 2017, the Company closed on the following dispositions:
Property Name | Disposition Date | Property Type | GLA | Consideration | Debt Repaid or Defeased | Defeasance Cost / Prepayment Premium | |||||||||||||
Boulevard Plaza | July 20, 2017 | Multi-tenant retail | 111,100 | $ | 14,300 | $ | 2,229 | (d) | $ | 354 | |||||||||
Irmo Station | July 26, 2017 | Multi-tenant retail | 99,400 | 16,027 | (e) | 4,726 | (d) | 750 | |||||||||||
Hickory Ridge | July 27, 2017 | Multi-tenant retail | 380,600 | 44,020 | 18,100 | (d) | 2,872 | ||||||||||||
Subsequent dispositions | 591,100 | $ | 74,347 | $ | 25,055 | $ | 3,976 | ||||||||||||
(d) | Debt on this property was defeased as part of the January 2017 defeasance of the IW JV portfolio of mortgages payable. |
(e) | Disposition proceeds of $15,643 are temporarily restricted related to a potential 1031 Exchange. |
2nd Quarter 2017 Supplemental Information | 13 | |
Retail Properties of America, Inc.
Market Summary as of June 30, 2017
(dollar amounts and square footage in thousands)
Property Type/Market | Number of Properties | Annualized Base Rent (ABR) (a) | % of Total Multi-Tenant Retail ABR (a) | ABR per Occupied Sq. Ft. | GLA (a) | % of Total Multi-Tenant Retail GLA (a) | Occupancy | % Leased Including Signed | ||||||||||||||||||
Multi-Tenant Retail: | ||||||||||||||||||||||||||
Target Markets | ||||||||||||||||||||||||||
Dallas, Texas | 19 | $ | 80,210 | 21.2 | % | $ | 21.96 | 3,927 | 17.2 | % | 93.0 | % | 94.4 | % | ||||||||||||
Washington, D.C. / Baltimore, Maryland | 13 | 49,327 | 13.0 | % | 22.32 | 2,643 | 11.5 | % | 83.6 | % | 84.7 | % | ||||||||||||||
New York, New York | 8 | 33,891 | 9.0 | % | 27.79 | 1,260 | 5.5 | % | 96.8 | % | 97.8 | % | ||||||||||||||
Chicago, Illinois | 7 | 25,537 | 6.8 | % | 22.98 | 1,257 | 5.5 | % | 88.4 | % | 91.8 | % | ||||||||||||||
Seattle, Washington | 8 | 20,149 | 5.3 | % | 15.13 | 1,473 | 6.4 | % | 90.4 | % | 92.8 | % | ||||||||||||||
Atlanta, Georgia | 9 | 19,108 | 5.1 | % | 13.20 | 1,513 | 6.6 | % | 95.7 | % | 95.7 | % | ||||||||||||||
Houston, Texas | 9 | 15,317 | 4.0 | % | 14.18 | 1,141 | 5.0 | % | 94.7 | % | 94.9 | % | ||||||||||||||
San Antonio, Texas | 3 | 12,232 | 3.2 | % | 17.14 | 723 | 3.2 | % | 98.7 | % | 100.0 | % | ||||||||||||||
Phoenix, Arizona | 3 | 10,114 | 2.7 | % | 17.41 | 632 | 2.8 | % | 91.9 | % | 91.9 | % | ||||||||||||||
Austin, Texas | 4 | 5,253 | 1.4 | % | 16.10 | 350 | 1.5 | % | 93.2 | % | 94.1 | % | ||||||||||||||
Subtotal | 83 | 271,138 | 71.7 | % | 19.84 | 14,919 | 65.2 | % | 91.6 | % | 92.9 | % | ||||||||||||||
Non-Target – Top 50 MSAs | ||||||||||||||||||||||||||
California | 3 | 11,542 | 3.0 | % | 20.28 | 658 | 2.9 | % | 86.5 | % | 92.7 | % | ||||||||||||||
Florida | 4 | 7,177 | 1.9 | % | 19.96 | 370 | 1.6 | % | 97.2 | % | 98.1 | % | ||||||||||||||
Missouri | 2 | 4,779 | 1.3 | % | 9.71 | 530 | 2.3 | % | 92.9 | % | 93.5 | % | ||||||||||||||
Virginia | 1 | 4,746 | 1.3 | % | 18.02 | 308 | 1.3 | % | 85.5 | % | 89.7 | % | ||||||||||||||
North Carolina | 1 | 3,338 | 0.9 | % | 11.59 | 318 | 1.4 | % | 90.6 | % | 90.6 | % | ||||||||||||||
Pennsylvania | 2 | 3,315 | 0.9 | % | 12.90 | 257 | 1.1 | % | 100.0 | % | 100.0 | % | ||||||||||||||
Indiana | 2 | 2,974 | 0.8 | % | 14.67 | 205 | 0.9 | % | 98.9 | % | 98.9 | % | ||||||||||||||
Connecticut | 1 | 2,671 | 0.7 | % | 24.50 | 115 | 0.5 | % | 94.8 | % | 94.8 | % | ||||||||||||||
Massachusetts | 1 | 1,719 | 0.4 | % | 16.22 | 106 | 0.5 | % | 100.0 | % | 100.0 | % | ||||||||||||||
Tennessee | 1 | 1,048 | 0.3 | % | 11.67 | 93 | 0.4 | % | 96.6 | % | 96.6 | % | ||||||||||||||
South Carolina | 1 | 845 | 0.2 | % | 12.43 | 68 | 0.3 | % | 100.0 | % | 100.0 | % | ||||||||||||||
Subtotal | 19 | 44,154 | 11.7 | % | 15.75 | 3,028 | 13.2 | % | 92.6 | % | 94.6 | % | ||||||||||||||
Subtotal Target Markets and Top 50 MSAs | 102 | 315,292 | 83.4 | % | 19.14 | 17,947 | 78.4 | % | 91.8 | % | 93.2 | % | ||||||||||||||
Non-Target – Other | ||||||||||||||||||||||||||
South Carolina | 5 | 10,545 | 2.8 | % | 12.33 | 870 | 3.8 | % | 98.3 | % | 98.3 | % | ||||||||||||||
Texas | 3 | 8,422 | 2.2 | % | 13.35 | 651 | 2.8 | % | 96.9 | % | 96.9 | % | ||||||||||||||
Florida | 3 | 7,597 | 2.0 | % | 13.92 | 616 | 2.7 | % | 88.6 | % | 90.0 | % | ||||||||||||||
Michigan | 1 | 7,189 | 1.9 | % | 22.63 | 333 | 1.5 | % | 95.4 | % | 96.7 | % | ||||||||||||||
Massachusetts | 1 | 5,417 | 1.4 | % | 10.92 | 537 | 2.3 | % | 92.4 | % | 92.4 | % | ||||||||||||||
Tennessee | 2 | 4,934 | 1.3 | % | 11.61 | 445 | 1.9 | % | 95.5 | % | 96.3 | % | ||||||||||||||
Washington | 1 | 4,186 | 1.1 | % | 13.12 | 378 | 1.7 | % | 84.4 | % | 84.8 | % | ||||||||||||||
North Carolina | 1 | 4,136 | 1.1 | % | 11.03 | 380 | 1.7 | % | 98.7 | % | 98.7 | % | ||||||||||||||
Pennsylvania | 3 | 3,543 | 0.9 | % | 14.96 | 264 | 1.2 | % | 89.7 | % | 89.7 | % | ||||||||||||||
Connecticut | 2 | 2,628 | 0.7 | % | 13.55 | 194 | 0.8 | % | 100.0 | % | 100.0 | % | ||||||||||||||
Maryland | 1 | 2,060 | 0.6 | % | 19.15 | 113 | 0.5 | % | 95.2 | % | 95.2 | % | ||||||||||||||
New York | 1 | 2,040 | 0.6 | % | 12.38 | 166 | 0.7 | % | 99.3 | % | 99.3 | % | ||||||||||||||
Subtotal | 24 | 62,697 | 16.6 | % | 13.44 | 4,947 | 21.6 | % | 94.3 | % | 94.7 | % | ||||||||||||||
Total Multi-Tenant Retail | 126 | 377,989 | 100.0 | % | 17.87 | 22,894 | 100.0 | % | 92.4 | % | 93.5 | % | ||||||||||||||
Single-User Retail | 6 | 10,669 | 23.45 | 455 | 100.0 | % | 100.0 | % | ||||||||||||||||||
Total Retail | 132 | 388,658 | 18.00 | 23,349 | 92.5 | % | 93.7 | % | ||||||||||||||||||
Office | 1 | 1,891 | 15.54 | 895 | 13.6 | % | 46.1 | % | ||||||||||||||||||
Total Operating Portfolio (b) | 133 | $ | 390,549 | $ | 17.98 | 24,244 | 89.6 | % | 91.9 | % | ||||||||||||||||
(a) | Excludes $7,501 of multi-tenant retail ABR and 816 square feet of multi-tenant retail GLA attributable to the Company's two active redevelopments, which are located in the Washington, D.C./Baltimore MSA. Including these amounts, 72.3% of the Company's multi-tenant retail ABR and 66.4% of the Company's multi-tenant retail GLA is located in Target Markets. |
(b) | Excludes four multi-tenant retail operating properties classified as held for sale as of June 30, 2017. |
2nd Quarter 2017 Supplemental Information | 14 | |
Retail Properties of America, Inc.
Retail Operating Portfolio Occupancy Breakdown as of June 30, 2017
(square footage in thousands)
Total Retail Operating Portfolio: | ||||||||||||||||||||||||||||||||||||||
Target Markets | Non-Target – Top 50 MSAs | Non-Target – Other | Total Multi-Tenant Retail (a) | Single-User Retail | Total Retail | |||||||||||||||||||||||||||||||||
Number of Properties | 83 | 19 | 24 | 126 | 6 | 132 | ||||||||||||||||||||||||||||||||
GLA | Occupancy | GLA | Occupancy | GLA | Occupancy | GLA | Occupancy | GLA | Occupancy | GLA | Occupancy | % Leased Including Signed | ||||||||||||||||||||||||||
25,000+ sq ft | 6,708 | 94.1 | % | 1,695 | 95.7 | % | 2,831 | 95.8 | % | 11,234 | 94.8 | % | 430 | 100.0 | % | 11,664 | 94.9 | % | 95.5 | % | ||||||||||||||||||
10,000-24,999 sq ft | 2,710 | 94.0 | % | 626 | 89.0 | % | 851 | 98.2 | % | 4,187 | 94.1 | % | 25 | 100.0 | % | 4,212 | 94.1 | % | 96.2 | % | ||||||||||||||||||
Anchor | 9,418 | 94.0 | % | 2,321 | 93.8 | % | 3,682 | 96.4 | % | 15,421 | 94.6 | % | 455 | 100.0 | % | 15,876 | 94.7 | % | 95.7 | % | ||||||||||||||||||
5,000-9,999 sq ft | 2,145 | 91.2 | % | 292 | 94.4 | % | 543 | 95.5 | % | 2,980 | 92.3 | % | — | — | 2,980 | 92.3 | % | 93.4 | % | |||||||||||||||||||
0-4,999 sq ft | 3,356 | 85.2 | % | 415 | 84.6 | % | 722 | 83.0 | % | 4,493 | 84.8 | % | — | — | 4,493 | 84.8 | % | 86.7 | % | |||||||||||||||||||
Non-Anchor | 5,501 | 87.5 | % | 707 | 88.7 | % | 1,265 | 88.4 | % | 7,473 | 87.8 | % | — | — | 7,473 | 87.8 | % | 89.4 | % | |||||||||||||||||||
Total | 14,919 | 91.6 | % | 3,028 | 92.6 | % | 4,947 | 94.3 | % | 22,894 | 92.4 | % | 455 | 100.0 | % | 23,349 | 92.5 | % | 93.7 | % | ||||||||||||||||||
(a) | Excludes four multi-tenant retail operating properties classified as held for sale as of June 30, 2017. |
2nd Quarter 2017 Supplemental Information | 15 | |
Retail Properties of America, Inc.
Top Retail Tenants as of June 30, 2017
(dollar amounts and square footage in thousands)
The following table sets forth information regarding the 20 largest tenants in the Company's retail operating portfolio based on ABR as of June 30, 2017. Dollars (other than per square foot information) and square feet of GLA are presented in thousands.
Tenant | Primary DBA | Number of Stores | ABR | % of Total ABR | ABR per Occupied Sq. Ft. | Occupied GLA | % of Occupied GLA | |||||||||||||||
Best Buy Co., Inc. | Best Buy, Pacific Sales | 19 | $ | 12,011 | 3.1 | % | $ | 15.91 | 755 | 3.5 | % | |||||||||||
Ahold U.S.A. Inc. | Giant Foods, Stop & Shop, Martin's | 7 | 9,030 | 2.3 | % | 21.05 | 429 | 2.0 | % | |||||||||||||
The TJX Companies, Inc. | HomeGoods, Marshalls, T.J. Maxx | 31 | 8,823 | 2.3 | % | 9.98 | 884 | 4.1 | % | |||||||||||||
Ross Stores, Inc. | Ross Dress for Less | 25 | 8,423 | 2.2 | % | 11.52 | 731 | 3.4 | % | |||||||||||||
Bed Bath & Beyond Inc. | Bed Bath & Beyond, Buy Buy Baby, Cost Plus World Market | 22 | 7,909 | 2.0 | % | 13.59 | 582 | 2.7 | % | |||||||||||||
Regal Entertainment Group | Edwards Cinema | 2 | 6,911 | 1.8 | % | 31.56 | 219 | 1.0 | % | |||||||||||||
AB Acquisition LLC | Safeway, Jewel-Osco, Tom Thumb | 8 | 6,252 | 1.6 | % | 13.45 | 465 | 2.2 | % | |||||||||||||
PetSmart, Inc. | 20 | 6,142 | 1.6 | % | 14.98 | 410 | 1.9 | % | ||||||||||||||
Michaels Stores, Inc. | Michaels, Aaron Brothers Art & Frame | 19 | 5,471 | 1.4 | % | 12.69 | 431 | 2.0 | % | |||||||||||||
Ascena Retail Group, Inc. | Dress Barn, Lane Bryant, Justice, Catherine's, Ann Taylor, Maurices, LOFT | 45 | 5,294 | 1.4 | % | 21.70 | 244 | 1.1 | % | |||||||||||||
Gap Inc. | Old Navy, Banana Republic, The Gap, Gap Factory Store, Athleta | 25 | 5,225 | 1.4 | % | 16.53 | 316 | 1.5 | % | |||||||||||||
Dick's Sporting Goods, Inc. | Dick's Sporting Goods, Field & Stream | 8 | 5,139 | 1.3 | % | 13.52 | 380 | 1.8 | % | |||||||||||||
Pier 1 Imports, Inc. | 23 | 4,792 | 1.2 | % | 20.66 | 232 | 1.1 | % | ||||||||||||||
Office Depot, Inc. | Office Depot, OfficeMax | 16 | 4,766 | 1.2 | % | 14.36 | 332 | 1.5 | % | |||||||||||||
BJ's Wholesale Club, Inc. | 2 | 4,609 | 1.2 | % | 18.81 | 245 | 1.1 | % | ||||||||||||||
The Home Depot, Inc. | 3 | 4,162 | 1.1 | % | 11.86 | 351 | 1.6 | % | ||||||||||||||
Party City Holdings Inc. | 20 | 4,061 | 1.0 | % | 14.61 | 278 | 1.3 | % | ||||||||||||||
The Kroger Co. | Kroger, Harris Teeter, King Soopers, QFC | 8 | 4,005 | 1.0 | % | 10.09 | 397 | 1.8 | % | |||||||||||||
Lowe's Companies, Inc. | 4 | 3,944 | 1.0 | % | 6.47 | 610 | 2.8 | % | ||||||||||||||
Petco Animal Supplies, Inc. | 16 | 3,879 | 1.0 | % | 17.63 | 220 | 1.0 | % | ||||||||||||||
Total Top Retail Tenants | 323 | $ | 120,848 | 31.1 | % | $ | 14.20 | 8,511 | 39.4 | % | ||||||||||||
2nd Quarter 2017 Supplemental Information | 16 | |
Retail Properties of America, Inc.
Retail Leasing Activity Summary
(square footage amounts in thousands)
The following table summarizes the leasing activity in the Company's retail operating portfolio as of June 30, 2017 and for the preceding four quarters. Leases of less than 12 months have been excluded.
Total Leases | ||||||||||||||||||||||||
Number of Leases Signed | GLA Signed | New Contractual Rent per Square Foot (PSF) (a) | Prior Contractual Rent PSF (a) | % Change over Prior ABR (a) | WA Lease Term | Tenant Allowances PSF | ||||||||||||||||||
Q2 2017 | 140 | 797 | $ | 17.65 | $ | 16.32 | 8.1 | % | (b) | 5.7 | $ | 8.63 | ||||||||||||
Q1 2017 | 121 | 466 | $ | 27.14 | $ | 24.68 | 10.0 | % | 5.3 | $ | 12.14 | |||||||||||||
Q4 2016 | 136 | 502 | $ | 23.20 | $ | 21.73 | 6.8 | % | 6.0 | $ | 10.98 | |||||||||||||
Q3 2016 | 135 | 1,121 | $ | 16.62 | $ | 15.36 | 8.2 | % | 5.7 | $ | 5.58 | |||||||||||||
Total – 12 months | 532 | 2,886 | $ | 19.71 | $ | 18.21 | 8.2 | % | 5.7 | $ | 8.42 | |||||||||||||
Comparable Renewal Leases | ||||||||||||||||||||||||
Number of Leases Signed | GLA Signed | New Contractual Rent PSF | Prior Contractual Rent PSF | % Change over Prior ABR | WA Lease Term | Tenant Allowances PSF | ||||||||||||||||||
Q2 2017 | 107 | 637 | $ | 17.03 | $ | 16.13 | 5.6 | % | (b) | 4.8 | $ | 0.73 | ||||||||||||
Q1 2017 | 88 | 308 | $ | 27.51 | $ | 25.33 | 8.6 | % | 4.6 | $ | 2.49 | |||||||||||||
Q4 2016 | 89 | 357 | $ | 23.71 | $ | 22.70 | 4.4 | % | 4.9 | $ | 0.62 | |||||||||||||
Q3 2016 | 87 | 756 | $ | 16.44 | $ | 15.34 | 7.2 | % | 4.7 | $ | 0.13 | |||||||||||||
Total – 12 months | 371 | 2,058 | $ | 19.54 | $ | 18.36 | 6.4 | % | 4.8 | $ | 0.75 | |||||||||||||
Comparable New Leases | ||||||||||||||||||||||||
Number of Leases Signed | GLA Signed | New Contractual Rent PSF | Prior Contractual Rent PSF | % Change over Prior ABR | WA Lease Term | Tenant Allowances PSF | ||||||||||||||||||
Q2 2017 | 9 | 71 | $ | 23.16 | $ | 18.04 | 28.4 | % | 9.3 | $ | 39.94 | |||||||||||||
Q1 2017 | 9 | 45 | $ | 24.57 | $ | 20.17 | 21.8 | % | 7.8 | $ | 47.57 | |||||||||||||
Q4 2016 | 10 | 57 | $ | 19.95 | $ | 15.66 | 27.4 | % | 9.3 | $ | 47.54 | |||||||||||||
Q3 2016 | 15 | 85 | $ | 18.22 | $ | 15.58 | 16.9 | % | 9.1 | $ | 33.65 | |||||||||||||
Total – 12 months | 43 | 258 | $ | 21.07 | $ | 17.07 | 23.4 | % | 9.0 | $ | 40.87 | |||||||||||||
Non-Comparable New and Renewal Leases (c) | ||||||||||||||||||||||||
Number of Leases Signed | GLA Signed | New Contractual Rent PSF | Prior Contractual Rent PSF | % Change over Prior ABR | WA Lease Term | Tenant Allowances PSF | ||||||||||||||||||
Q2 2017 | 24 | 89 | $ | 22.72 | n/a | n/a | 7.3 | $ | 40.36 | |||||||||||||||
Q1 2017 | 24 | 113 | $ | 12.93 | n/a | n/a | 7.0 | $ | 24.38 | |||||||||||||||
Q4 2016 | 37 | 88 | $ | 23.44 | n/a | n/a | 8.4 | $ | 29.26 | |||||||||||||||
Q3 2016 | 33 | 280 | $ | 11.44 | n/a | n/a | 8.1 | $ | 11.77 | |||||||||||||||
Total – 12 months | 118 | 570 | $ | 15.35 | n/a | n/a | 7.8 | $ | 21.43 | |||||||||||||||
(a) | Excludes the impact of Non-Comparable New and Renewal Leases. |
(b) | Excluding the impact from one lease within the Company's non-target portfolio, combined comparable re-leasing spreads were approximately 9.7% and comparable renewal re-leasing spreads were approximately 7.2% over previous rental rates for the three months ended June 30, 2017. |
(c) | Includes (i) leases signed on units that were vacant for over 12 months, (ii) leases signed without fixed rental payments and (iii) leases signed where the previous and the current lease do not have a consistent lease structure. |
2nd Quarter 2017 Supplemental Information | 17 | |
Retail Properties of America, Inc.
Retail Lease Expirations as of June 30, 2017
(dollar amounts and square footage in thousands)
The following tables set forth a summary, as of June 30, 2017, of lease expirations scheduled to occur during the remainder of 2017 and each of the nine calendar years from 2018 to 2026 and thereafter, assuming no exercise of renewal options or early termination rights for all leases in the Company's retail operating portfolio. The following tables are based on leases commenced as of June 30, 2017. Dollars (other than per square foot information) and square feet of GLA are presented in thousands in the table.
Lease Expiration Year | Lease Count | ABR | % of Total ABR | ABR per Occupied Sq. Ft. | ABR at Exp. (a) | ABR per Occupied Sq. Ft. at Exp. | GLA | % of Occupied GLA | % of Total GLA | ||||||||||||||||||||||
2017 | 144 | $ | 10,514 | 2.7 | % | $ | 22.18 | $ | 10,520 | $ | 22.19 | 474 | 2.2 | % | 2.1 | % | |||||||||||||||
2018 | 425 | 45,130 | 11.6 | % | 19.68 | 45,432 | 19.81 | 2,293 | 10.6 | % | 9.8 | % | |||||||||||||||||||
2019 | 491 | 66,571 | 17.1 | % | 19.52 | 67,298 | 19.74 | 3,410 | 15.8 | % | 14.6 | % | |||||||||||||||||||
2020 | 350 | 42,725 | 11.0 | % | 16.97 | 43,559 | 17.30 | 2,518 | 11.6 | % | 10.7 | % | |||||||||||||||||||
2021 | 301 | 45,347 | 11.7 | % | 19.23 | 46,531 | 19.73 | 2,358 | 10.9 | % | 10.1 | % | |||||||||||||||||||
2022 | 283 | 48,264 | 12.4 | % | 15.78 | 50,584 | 16.54 | 3,058 | 14.2 | % | 13.1 | % | |||||||||||||||||||
2023 | 132 | 28,108 | 7.2 | % | 15.47 | 30,233 | 16.64 | 1,817 | 8.4 | % | 7.8 | % | |||||||||||||||||||
2024 | 151 | 24,941 | 6.4 | % | 17.00 | 27,373 | 18.66 | 1,467 | 6.8 | % | 6.2 | % | |||||||||||||||||||
2025 | 106 | 22,707 | 5.9 | % | 16.95 | 24,995 | 18.65 | 1,340 | 6.2 | % | 5.8 | % | |||||||||||||||||||
2026 | 80 | 15,160 | 3.9 | % | 19.66 | 17,503 | 22.70 | 771 | 3.6 | % | 3.3 | % | |||||||||||||||||||
Thereafter | 101 | 37,789 | 9.7 | % | 18.59 | 44,567 | 21.92 | 2,033 | 9.4 | % | 8.7 | % | |||||||||||||||||||
Month to month | 24 | 1,402 | 0.4 | % | 23.76 | 1,402 | 23.76 | 59 | 0.3 | % | 0.3 | % | |||||||||||||||||||
Leased Total | 2,588 | $ | 388,658 | 100.0 | % | $ | 18.00 | $ | 409,997 | $ | 18.98 | 21,598 | 100.0 | % | 92.5 | % | |||||||||||||||
Leases signed but not commenced | 46 | $ | 6,138 | — | $ | 22.82 | $ | 6,869 | $ | 25.54 | 269 | — | 1.2 | % | |||||||||||||||||
Available | 1,482 | — | 6.3 | % | |||||||||||||||||||||||||||
The following tables break down the above information into anchor (10,000 sf and above) and non-anchor (under 10,000 sf) details for the Company's retail operating portfolio. Dollars (other than per square foot information) and square feet of GLA are presented in thousands in the tables. | |||||||||||||||||||||||||||||||
Anchor | |||||||||||||||||||||||||||||||
Lease Expiration Year | Lease Count | ABR | % of Total ABR | ABR per Occupied Sq. Ft. | ABR at Exp. (a) | ABR per Occupied Sq. Ft. at Exp. | GLA | % of Occupied GLA | % of Total GLA | ||||||||||||||||||||||
2017 | 6 | $ | 1,470 | 0.4 | % | $ | 11.14 | $ | 1,470 | $ | 11.14 | 132 | 0.6 | % | 0.6 | % | |||||||||||||||
2018 | 49 | 16,337 | 4.2 | % | 13.47 | 16,412 | 13.53 | 1,213 | 5.6 | % | 5.2 | % | |||||||||||||||||||
2019 | 80 | 33,856 | 8.7 | % | 15.44 | 33,978 | 15.49 | 2,193 | 10.2 | % | 9.4 | % | |||||||||||||||||||
2020 | 61 | 19,799 | 5.1 | % | 12.22 | 19,817 | 12.23 | 1,620 | 7.5 | % | 6.9 | % | |||||||||||||||||||
2021 | 57 | 24,524 | 6.3 | % | 15.27 | 24,610 | 15.32 | 1,606 | 7.4 | % | 6.9 | % | |||||||||||||||||||
2022 | 67 | 29,794 | 7.7 | % | 12.54 | 30,479 | 12.83 | 2,376 | 11.0 | % | 10.2 | % | |||||||||||||||||||
2023 | 44 | 19,031 | 4.9 | % | 12.89 | 20,118 | 13.63 | 1,476 | 6.8 | % | 6.3 | % | |||||||||||||||||||
2024 | 34 | 12,893 | 3.3 | % | 11.84 | 13,687 | 12.57 | 1,089 | 5.1 | % | 4.6 | % | |||||||||||||||||||
2025 | 28 | 13,106 | 3.4 | % | 12.84 | 13,998 | 13.71 | 1,021 | 4.7 | % | 4.4 | % | |||||||||||||||||||
2026 | 23 | 7,772 | 2.0 | % | 14.58 | 8,444 | 15.84 | 533 | 2.5 | % | 2.3 | % | |||||||||||||||||||
Thereafter | 39 | 29,756 | 7.6 | % | 16.71 | 34,648 | 19.45 | 1,781 | 8.2 | % | 7.6 | % | |||||||||||||||||||
Month to month | — | — | — | % | — | — | — | — | — | % | — | % | |||||||||||||||||||
Leased Total | 488 | $ | 208,338 | 53.6 | % | $ | 13.85 | $ | 217,661 | $ | 14.47 | 15,040 | 69.6 | % | 64.4 | % | |||||||||||||||
Leases signed but not commenced | 7 | $ | 2,398 | — | $ | 16.20 | $ | 2,542 | $ | 17.18 | 148 | — | 0.7 | % | |||||||||||||||||
Available | 688 | — | 2.9 | % | |||||||||||||||||||||||||||
Non-Anchor | |||||||||||||||||||||||||||||||
Lease Expiration Year | Lease Count | ABR | % of Total ABR | ABR per Occupied Sq. Ft. | ABR at Exp. (a) | ABR per Occupied Sq. Ft. at Exp. | GLA | % of Occupied GLA | % of Total GLA | ||||||||||||||||||||||
2017 | 138 | $ | 9,044 | 2.3 | % | $ | 26.44 | $ | 9,050 | $ | 26.46 | 342 | 1.6 | % | 1.5 | % | |||||||||||||||
2018 | 376 | 28,793 | 7.4 | % | 26.66 | 29,020 | 26.87 | 1,080 | 5.0 | % | 4.6 | % | |||||||||||||||||||
2019 | 411 | 32,715 | 8.4 | % | 26.88 | 33,320 | 27.38 | 1,217 | 5.6 | % | 5.2 | % | |||||||||||||||||||
2020 | 289 | 22,926 | 5.9 | % | 25.53 | 23,742 | 26.44 | 898 | 4.1 | % | 3.8 | % | |||||||||||||||||||
2021 | 244 | 20,823 | 5.4 | % | 27.69 | 21,921 | 29.15 | 752 | 3.5 | % | 3.2 | % | |||||||||||||||||||
2022 | 216 | 18,470 | 4.7 | % | 27.08 | 20,105 | 29.48 | 682 | 3.2 | % | 2.9 | % | |||||||||||||||||||
2023 | 88 | 9,077 | 2.3 | % | 26.62 | 10,115 | 29.66 | 341 | 1.6 | % | 1.5 | % | |||||||||||||||||||
2024 | 117 | 12,048 | 3.1 | % | 31.87 | 13,686 | 36.21 | 378 | 1.7 | % | 1.6 | % | |||||||||||||||||||
2025 | 78 | 9,601 | 2.5 | % | 30.10 | 10,997 | 34.47 | 319 | 1.5 | % | 1.4 | % | |||||||||||||||||||
2026 | 57 | 7,388 | 1.9 | % | 31.04 | 9,059 | 38.06 | 238 | 1.1 | % | 1.0 | % | |||||||||||||||||||
Thereafter | 62 | 8,033 | 2.1 | % | 31.88 | 9,919 | 39.36 | 252 | 1.2 | % | 1.1 | % | |||||||||||||||||||
Month to month | 24 | 1,402 | 0.4 | % | 23.76 | 1,402 | 23.76 | 59 | 0.3 | % | 0.3 | % | |||||||||||||||||||
Leased Total | 2,100 | $ | 180,320 | 46.4 | % | $ | 27.50 | $ | 192,336 | $ | 29.33 | 6,558 | 30.4 | % | 28.1 | % | |||||||||||||||
Leases signed but not commenced | 39 | $ | 3,740 | — | $ | 30.91 | $ | 4,327 | $ | 35.76 | 121 | — | 0.5 | % | |||||||||||||||||
Available | 794 | — | 3.4 | % | |||||||||||||||||||||||||||
(a) | Represents annualized base rent at the scheduled expiration of the lease giving effect to fixed contractual increases in base rent. |
2nd Quarter 2017 Supplemental Information | 18 | |
Retail Properties of America, Inc.
Non-GAAP Financial Measures and Other Definitions
Gross Leasable Area (GLA)
Gross Leasable Area (GLA) is defined as the aggregate number of square feet available for lease. GLA excludes square footage attributable to third-party managed storage units, of which the Company owned 62,000 square feet as of June 30, 2017.
Occupancy
Occupancy is defined, for a property or group of properties, as the ratio, expressed as a percentage, of (a) the number of square feet of such property economically occupied by tenants under leases with an initial term of greater than one year, to (b) the aggregate number of square feet for such property.
Percent Leased Including Signed
Percent Leased Including Signed is defined, for a property or group of properties, as the ratio, expressed as a percentage, of (a) the sum of occupied square feet (pursuant to the definition above) of such property and vacant square feet for which a lease with an initial term of greater than one year has been signed, but rent has not yet commenced, to (b) the aggregate number of square feet for such property.
Funds From Operations (FFO) Attributable to Common Shareholders
As defined by the National Association of Real Estate Investment Trusts (NAREIT), an industry trade group, Funds From Operations (FFO) means net income (loss) computed in accordance with generally accepted accounting principles (GAAP), excluding gains (or losses) from sales of depreciable real estate, plus depreciation and amortization and impairment charges on depreciable real estate. The Company has adopted the NAREIT definition in its computation of FFO attributable to common shareholders. The Company believes that, subject to the following limitations, FFO attributable to common shareholders provides a basis for comparing its performance and operations to those of other real estate investment trusts (REITs). The Company believes that FFO attributable to common shareholders, which is a supplemental non-GAAP financial measure, provides an additional and useful means to assess the operating performance of REITs. FFO attributable to common shareholders does not represent an alternative to (i) "Net income" or "Net income attributable to common shareholders" as an indicator of the Company's financial performance, or (ii) "Cash flows from operating activities" in accordance with GAAP as a measure of the Company's capacity to fund cash needs, including the payment of dividends.
Operating FFO Attributable to Common Shareholders
Operating FFO attributable to common shareholders is defined as FFO attributable to common shareholders excluding the impact of discrete non-operating transactions and other events which the Company does not consider representative of the comparable operating results of its real estate operating portfolio, which is its core business platform. Specific examples of discrete non-operating transactions and other events include, but are not limited to, the financial statement impact of gains or losses associated with the early extinguishment of debt or other liabilities, impairment charges to write down the carrying value of assets other than depreciable real estate, actual or anticipated settlement of litigation involving the Company, including associated legal costs, and executive and realignment separation charges, which are otherwise excluded from the Company's calculation of FFO attributable to common shareholders. The Company believes that Operating FFO attributable to common shareholders, which is a supplemental non-GAAP financial measure, provides an additional and useful means to assess the operating performance of REITs. Operating FFO attributable to common shareholders does not represent an alternative to (i) "Net income" or "Net income attributable to common shareholders" as an indicator of the Company's financial performance, or (ii) "Cash flows from operating activities" in accordance with GAAP as a measure of the Company's capacity to fund cash needs, including the payment of dividends. Comparison of the Company's presentation of Operating FFO attributable to common shareholders to similarly titled measures for other REITs may not necessarily be meaningful due to possible differences in definition and application by such REITs.
Net Operating Income (NOI)
The Company defines Net Operating Income (NOI) as all revenues other than straight-line rental income, amortization of lease inducements, amortization of acquired above and below market lease intangibles and lease termination fee income, less real estate taxes and all operating expenses other than straight-line ground rent expense and amortization of acquired ground lease intangibles, which are non-cash items. NOI consists of Same Store NOI and NOI from Other Investment Properties. The Company believes that NOI, which is a supplemental non-GAAP financial measure, provides an additional and useful operating perspective not immediately apparent from "Operating income" or "Net income attributable to common shareholders" in accordance with GAAP. The Company uses NOI to evaluate its performance on a property-by-property basis because this measure allows management to evaluate the impact that factors such as lease structure, lease rates and tenant base have on the Company's operating results. NOI does not represent an alternative to "Net income" or "Net income attributable to common shareholders" in accordance with GAAP as an indicator of the Company's financial performance. Comparison of the Company's presentation of NOI to similarly titled measures for other REITs may not necessarily be meaningful due to possible differences in definition and application by such REITs.
2nd Quarter 2017 Supplemental Information | 19 | |
Retail Properties of America, Inc.
Non-GAAP Financial Measures and Other Definitions (continued)
Same Store NOI and NOI from Other Investment Properties
Same Store NOI for the three and six months ended June 30, 2017 represents NOI from the Company's same store portfolio consisting of 123 retail operating properties acquired or placed in service and stabilized prior to January 1, 2016. NOI from Other Investment Properties for the three and six months ended June 30, 2017 represents NOI primarily from properties acquired during 2016 and 2017, the Company's one remaining office property, three properties where the Company has begun redevelopment and/or activities in anticipation of future redevelopment, the properties that were sold or held for sale in 2016 and 2017, the net income from the Company's wholly-owned captive insurance company and the historical ground rent expense related to an existing same store investment property that was subject to a ground lease with a third party prior to the Company's acquisition of the fee interest on April 29, 2016.
The Company believes that Same Store NOI and NOI from Other Investment Properties, which are supplemental non-GAAP financial measures, provide an additional and useful operating perspective not immediately apparent from "Operating income" or "Net income attributable to common shareholders" in accordance with GAAP. The Company uses these measures to evaluate its performance on a property-by-property basis because they allow management to evaluate the impact that factors such as lease structure, lease rates and tenant base have on the Company's operating results. Same Store NOI and NOI from Other Investment Properties do not represent alternatives to "Net income" or "Net income attributable to common shareholders" in accordance with GAAP as indicators of the Company's financial performance. Comparison of the Company's presentation of Same Store NOI and NOI from Other Investment Properties to similarly titled measures for other REITs may not necessarily be meaningful due to possible differences in definition and application by such REITs.
Adjusted EBITDA
Adjusted EBITDA is a supplemental non-GAAP financial measure and represents net income attributable to common shareholders before interest, income taxes, depreciation and amortization, as further adjusted to eliminate the impact of certain items that the Company does not consider indicative of its ongoing performance. The Company believes that Adjusted EBITDA is useful because it allows investors and management to evaluate and compare the Company's performance from period to period in a meaningful and consistent manner in addition to standard financial measurements under GAAP. Adjusted EBITDA should not be considered an alternative to "Net income attributable to common shareholders" as an indicator of the Company's financial performance. Comparison of the Company's presentation of Adjusted EBITDA to similarly titled measures for other REITs may not necessarily be meaningful due to possible differences in definition and application by such REITs.
Net Debt to Adjusted EBITDA
Net Debt to Adjusted EBITDA is a supplemental non-GAAP financial measure and represents (i) the Company's total notional debt, excluding unamortized premium, discount and capitalized loan fees, less cash and cash equivalents and disposition proceeds temporarily restricted related to potential 1031 Exchanges divided by (ii) Adjusted EBITDA for the prior three months, annualized. The Company believes that this ratio is useful because it provides investors with information regarding its total notional debt net of cash and cash equivalents and disposition proceeds temporarily restricted related to potential 1031 Exchanges, which could be used to repay debt, compared to its performance as measured using Adjusted EBITDA. Comparison of the Company's presentation of Net Debt to Adjusted EBITDA to similarly titled measures for other REITs may not necessarily be meaningful due to possible differences in definition and application by such REITs.
Net Debt and Preferred Stock to Adjusted EBITDA
Net Debt and Preferred Stock to Adjusted EBITDA is a supplemental non-GAAP financial measure and represents (i) the Company's total notional debt, excluding unamortized premium, discount and capitalized loan fees, plus preferred stock, less cash and cash equivalents and disposition proceeds temporarily restricted related to potential 1031 Exchanges divided by (ii) Adjusted EBITDA for the prior three months, annualized. The Company believes that this ratio is useful because it provides investors with information regarding its total notional debt and preferred stock, net of cash and cash equivalents and disposition proceeds temporarily restricted related to potential 1031 Exchanges, which could be used to repay debt, compared to its performance as measured using Adjusted EBITDA. Comparison of the Company's presentation of Net Debt and Preferred Stock to Adjusted EBITDA to similarly titled measures for other REITs may not necessarily be meaningful due to possible differences in definition and application by such REITs.
2nd Quarter 2017 Supplemental Information | 20 | |
Retail Properties of America, Inc.
Reconciliation of Non-GAAP Financial Measures
(amounts in thousands)
(unaudited)
Reconciliation of Net Income Attributable to Common Shareholders to Same Store NOI
Three Months Ended June 30, | Six Months Ended June 30, | |||||||||||||||
2017 | 2016 | 2017 | 2016 | |||||||||||||
Net income attributable to common shareholders | $ | 112,400 | $ | 26,239 | $ | 100,938 | $ | 71,303 | ||||||||
Adjustments to reconcile to Same Store NOI: | ||||||||||||||||
Preferred stock dividends | 2,363 | 2,363 | 4,725 | 4,725 | ||||||||||||
Gain on sales of investment properties | (116,628 | ) | (9,613 | ) | (157,792 | ) | (31,352 | ) | ||||||||
Depreciation and amortization | 52,325 | 53,443 | 105,799 | 106,839 | ||||||||||||
Provision for impairment of investment properties | 13,034 | 4,142 | 13,034 | 6,306 | ||||||||||||
General and administrative expenses | 10,370 | 10,773 | 21,583 | 22,179 | ||||||||||||
Gain on extinguishment of debt | — | — | — | (13,653 | ) | |||||||||||
Gain on extinguishment of other liabilities | — | (6,978 | ) | — | (6,978 | ) | ||||||||||
Interest expense | 21,435 | 25,977 | 106,967 | 52,741 | ||||||||||||
Straight-line rental income, net | (919 | ) | (800 | ) | (1,260 | ) | (1,828 | ) | ||||||||
Amortization of acquired above and below market lease intangibles, net | (549 | ) | (395 | ) | (1,280 | ) | (971 | ) | ||||||||
Amortization of lease inducements | 259 | 321 | 582 | 552 | ||||||||||||
Lease termination fees | (510 | ) | (1,027 | ) | (2,122 | ) | (2,685 | ) | ||||||||
Straight-line ground rent expense | 677 | 764 | 1,363 | 1,680 | ||||||||||||
Amortization of acquired ground lease intangibles | (140 | ) | (140 | ) | (280 | ) | (280 | ) | ||||||||
Other income, net | (451 | ) | (302 | ) | (456 | ) | (427 | ) | ||||||||
NOI | 93,666 | 104,767 | 191,801 | 208,151 | ||||||||||||
NOI from Other Investment Properties | (12,455 | ) | (24,990 | ) | (28,948 | ) | (48,404 | ) | ||||||||
Same Store NOI | $ | 81,211 | $ | 79,777 | $ | 162,853 | $ | 159,747 | ||||||||
2nd Quarter 2017 Supplemental Information | 21 | |
Retail Properties of America, Inc.
Reconciliation of Non-GAAP Financial Measures (continued)
(amounts in thousands)
(unaudited)
Reconciliation of Mortgages Payable, Net, Unsecured Notes Payable, Net, Unsecured Term Loans, Net and
Unsecured Revolving Line of Credit to Total Net Debt and Total Net Debt and Preferred Stock
June 30, 2017 | December 31, 2016 | |||||||
Mortgages payable, net | $ | 355,239 | $ | 769,184 | ||||
Unsecured notes payable, net | 695,441 | 695,143 | ||||||
Unsecured term loans, net | 646,554 | 447,598 | ||||||
Unsecured revolving line of credit | 182,000 | 86,000 | ||||||
Total | 1,879,234 | 1,997,925 | ||||||
Mortgage premium, net of accumulated amortization | (1,223 | ) | (1,437 | ) | ||||
Mortgage discount, net of accumulated amortization | 601 | 622 | ||||||
Unsecured notes payable discount, net of accumulated amortization | 912 | 971 | ||||||
Capitalized loan fees, net of accumulated amortization | 7,865 | 11,314 | ||||||
Total notional debt | 1,887,389 | 2,009,395 | ||||||
Less: consolidated cash and cash equivalents | (28,003 | ) | (53,119 | ) | ||||
Less: disposition proceeds temporarily restricted related to potential 1031 Exchanges | (93,561 | ) | — | |||||
Total net debt | 1,765,825 | 1,956,276 | ||||||
Series A preferred stock | 135,000 | 135,000 | ||||||
Total net debt and preferred stock | $ | 1,900,825 | $ | 2,091,276 | ||||
Reconciliation of Net Income Attributable to Common Shareholders to Adjusted EBITDA
Three Months Ended | ||||||||
June 30, 2017 | December 31, 2016 | |||||||
Net income attributable to common shareholders | $ | 112,400 | $ | 15,932 | ||||
Preferred stock dividends | 2,363 | 2,363 | ||||||
Interest expense | 21,435 | 31,387 | ||||||
Depreciation and amortization | 52,325 | 60,828 | ||||||
Gain on sales of investment properties | (116,628 | ) | (31,970 | ) | ||||
Provision for impairment of investment properties | 13,034 | 9,328 | ||||||
Adjusted EBITDA | $ | 84,929 | $ | 87,868 | ||||
Annualized | $ | 339,716 | $ | 351,472 | ||||
2nd Quarter 2017 Supplemental Information | 22 | |