Attached files
| file | filename |
|---|---|
| 8-K - KAI FORM 8-K 08-01-2017 - KADANT INC | kaiform8k08012017.htm |
Second Quarter 2017 Business Review
Jonathan W. Painter, President & CEO
Michael J. McKenney, Senior Vice President & CFO
Forward-Looking Statements
The following constitutes a “Safe Harbor” statement under the Private Securities Litigation Reform Act of 1995: This presentation and our accompanying commentary
contains forward-looking statements that involve a number of risks and uncertainties, including forward-looking statements about our expected future financial and
operating performance, demand for our products, and economic and industry outlook.
Our actual results may differ materially from these forward-looking statements as a result of various important factors, including those set forth under the heading
"Risk Factors" in Kadant’s annual report on Form 10-K for the year ended December 31, 2016 and subsequent filings with the Securities and Exchange Commission.
These include risks and uncertainties relating to adverse changes in global and local economic conditions; the variability and difficulty in accurately predicting revenues
from large capital equipment and systems projects; the variability and uncertainties in sales of capital equipment in China; the effect of currency fluctuations on our
financial results; our customers’ ability to obtain financing for capital equipment projects; changes in government regulations and policies; oriented strand board
market and levels of residential construction activity; development and use of digital media; price increases or shortages of raw materials; dependence on certain
suppliers; international sales and operations; economic conditions and regulatory changes caused by the United Kingdom’s likely exit from the European Union;
disruption in production; our acquisition strategy; our internal growth strategy; competition; soundness of suppliers and customers; our effective tax rate; future
restructurings; soundness of financial institutions; our debt obligations; restrictions in our credit agreement; loss of key personnel; reliance on third-party research;
protection of patents and proprietary rights; failure of our information systems or breaches of data security; fluctuations in our share price; and anti-takeover
provisions.
We undertake no obligation to publicly update any forward-looking statement, whether as a result of new information, future events, or otherwise.
KAI 2Q17 Business Review–August 1, 2017 | © 2017 Kadant Inc. All rights reserved. 2
Use of Non-GAAP Financial Measures
In addition to the financial measures prepared in accordance with generally accepted accounting principles (GAAP), we use certain non-GAAP financial measures,
including increases or decreases in revenues excluding the effect of acquisitions and foreign currency translation, adjusted operating income, adjusted net income,
adjusted diluted EPS, adjusted earnings before interest, taxes, depreciation, and amortization (adjusted EBITDA) and adjusted EBITDA margin.
A reconciliation of those numbers to the most directly comparable U.S. GAAP financial measures is shown in our 2017 second quarter earnings press release issued
August 1, 2017, which is available in the Investors section of our website at www.kadant.com under the heading Press Releases.
We believe that these non-GAAP financial measures, when taken together with the corresponding GAAP financial measures, provide meaningful supplemental
information regarding our performance by excluding certain items that may not be indicative of our core business, operating results, or future outlook. We believe
that the inclusion of such measures helps investors to gain an understanding of our underlying operating performance and future prospects, consistent with how
management measures and forecasts our performance, especially when comparing such results to previous periods or forecasts and to the performance of our
competitors. Such measures are also used by us in our financial and operating decision-making and for compensation purposes. We also believe this information is
responsive to investors' requests and gives them an additional measure of our performance.
KAI 2Q17 Business Review–August 1, 2017 | © 2017 Kadant Inc. All rights reserved. 3

BUSINESS REVIEW
Jonathan W. Painter
President & CEO
Q2 2017 Financial Highlights
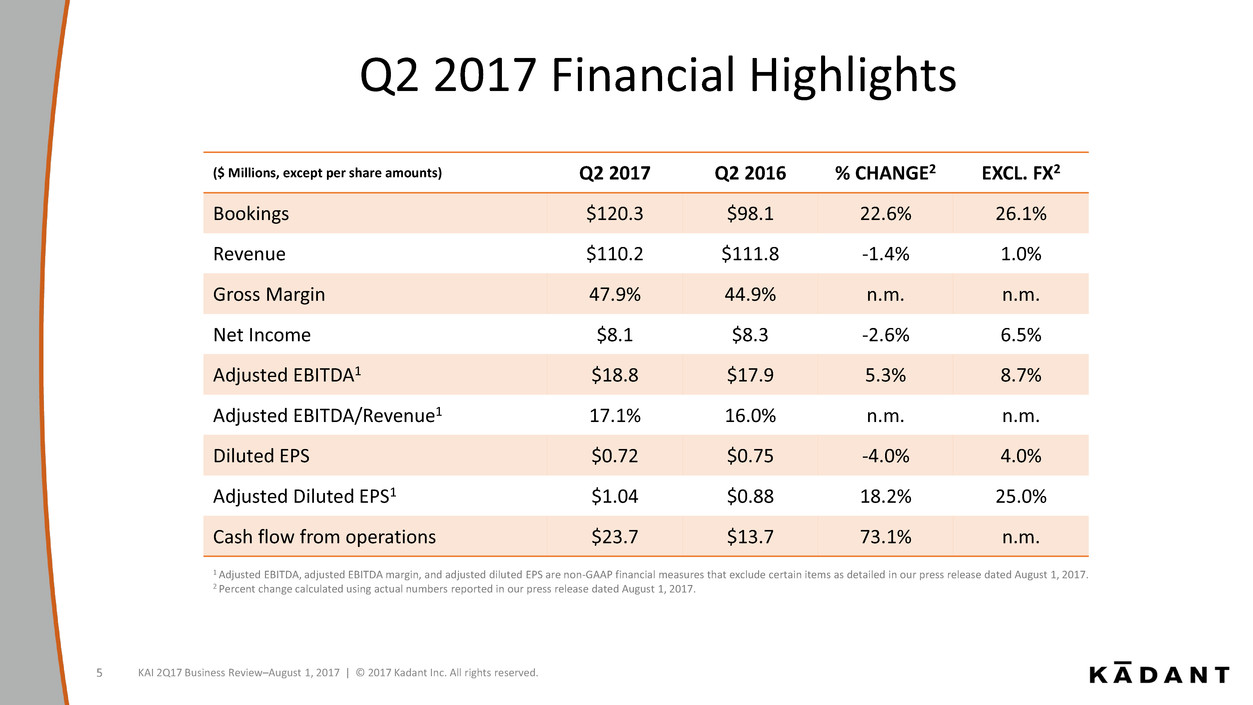
($ Millions, except per share amounts) Q2 2017 Q2 2016 % CHANGE2 EXCL. FX2
Bookings $120.3 $98.1 22.6% 26.1%
Revenue $110.2 $111.8 -1.4% 1.0%
Gross Margin 47.9% 44.9% n.m. n.m.
Net Income $8.1 $8.3 -2.6% 6.5%
Adjusted EBITDA1 $18.8 $17.9 5.3% 8.7%
Adjusted EBITDA/Revenue1 17.1% 16.0% n.m. n.m.
Diluted EPS $0.72 $0.75 -4.0% 4.0%
Adjusted Diluted EPS1 $1.04 $0.88 18.2% 25.0%
Cash flow from operations $23.7 $13.7 73.1% n.m.
1 Adjusted EBITDA, adjusted EBITDA margin, and adjusted diluted EPS are non-GAAP financial measures that exclude certain items as detailed in our press release dated August 1, 2017.
2 Percent change calculated using actual numbers reported in our press release dated August 1, 2017.
KAI 2Q17 Business Review–August 1, 2017 | © 2017 Kadant Inc. All rights reserved. 5
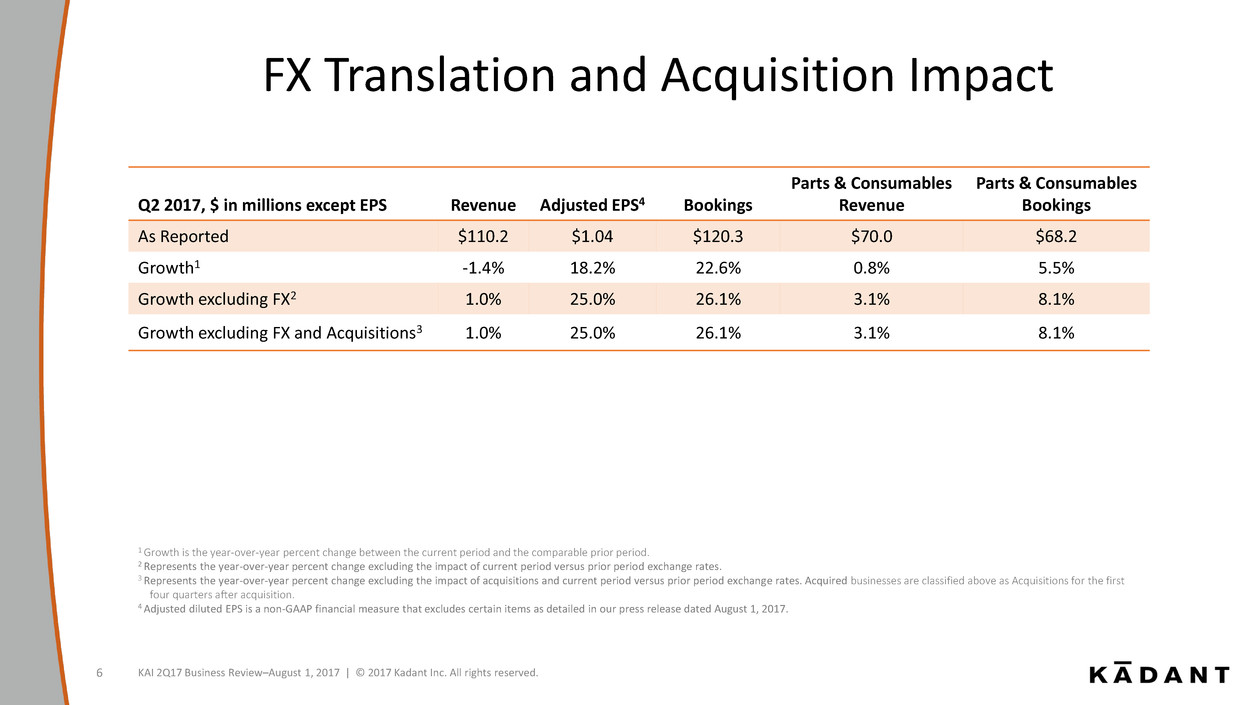
FX Translation and Acquisition Impact
Q2 2017, $ in millions except EPS Revenue Adjusted EPS4 Bookings
Parts & Consumables
Revenue
Parts & Consumables
Bookings
As Reported $110.2 $1.04 $120.3 $70.0 $68.2
Growth1 -1.4% 18.2% 22.6% 0.8% 5.5%
Growth excluding FX2 1.0% 25.0% 26.1% 3.1% 8.1%
Growth excluding FX and Acquisitions3 1.0% 25.0% 26.1% 3.1% 8.1%
1 Growth is the year-over-year percent change between the current period and the comparable prior period.
2 Represents the year-over-year percent change excluding the impact of current period versus prior period exchange rates.
3 Represents the year-over-year percent change excluding the impact of acquisitions and current period versus prior period exchange rates. Acquired businesses are classified above as Acquisitions for the first
four quarters after acquisition.
4 Adjusted diluted EPS is a non-GAAP financial measure that excludes certain items as detailed in our press release dated August 1, 2017.
KAI 2Q17 Business Review–August 1, 2017 | © 2017 Kadant Inc. All rights reserved. 6
$0
$20
$40
$60
$80
$100
$120
$140
Bookings Booking Reversal Revenues
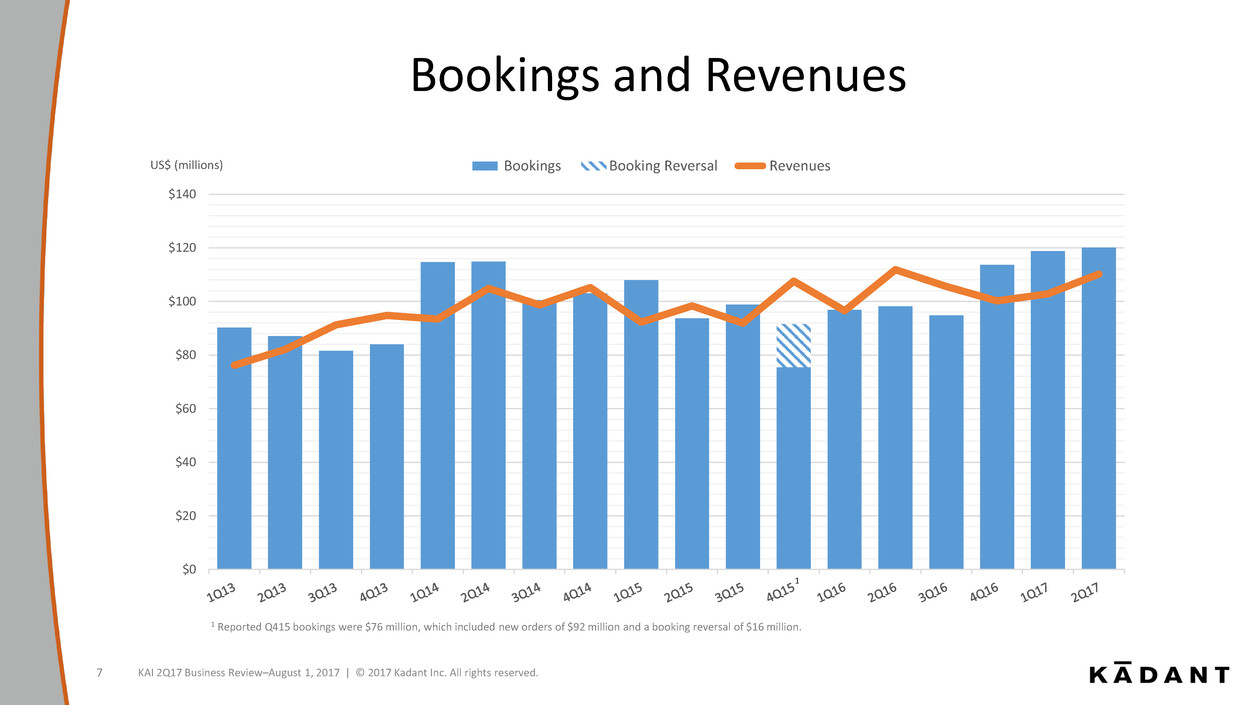
Bookings and Revenues
US$ (millions)
1 Reported Q415 bookings were $76 million, which included new orders of $92 million and a booking reversal of $16 million.
1
KAI 2Q17 Business Review–August 1, 2017 | © 2017 Kadant Inc. All rights reserved. 7
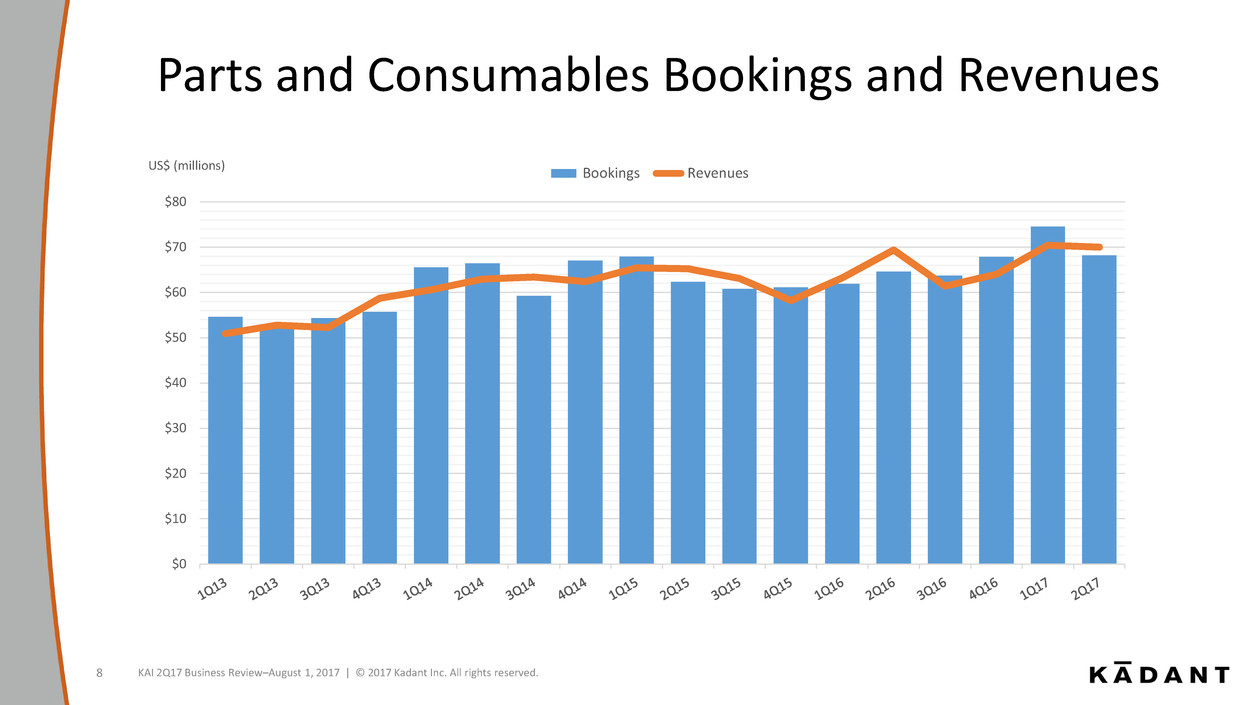
Parts and Consumables Bookings and Revenues
KAI 2Q17 Business Review–August 1, 2017 | © 2017 Kadant Inc. All rights reserved. 8
US$ (millions)
$0
$10
$20
$30
$40
$50
$60
$70
$80
Bookings Revenues
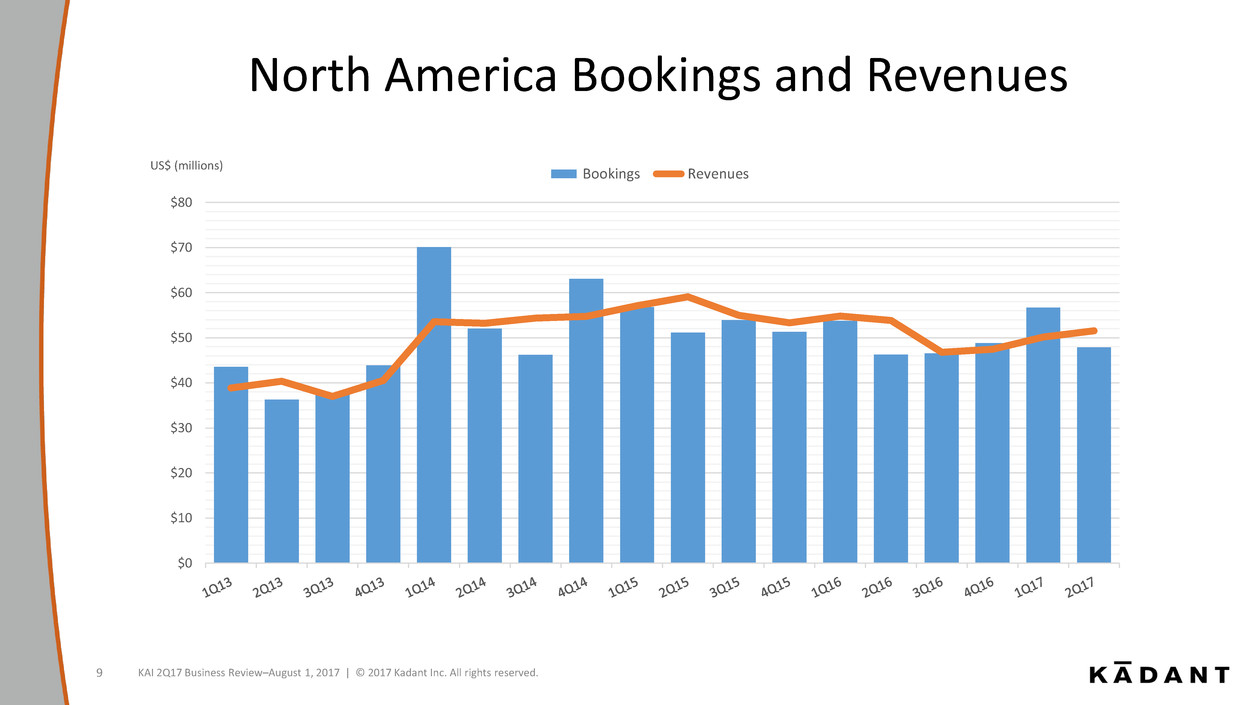
North America Bookings and Revenues
US$ (millions)
KAI 2Q17 Business Review–August 1, 2017 | © 2017 Kadant Inc. All rights reserved. 9
$0
$10
$20
$30
$40
$50
$60
$70
$80
Bookings Revenues
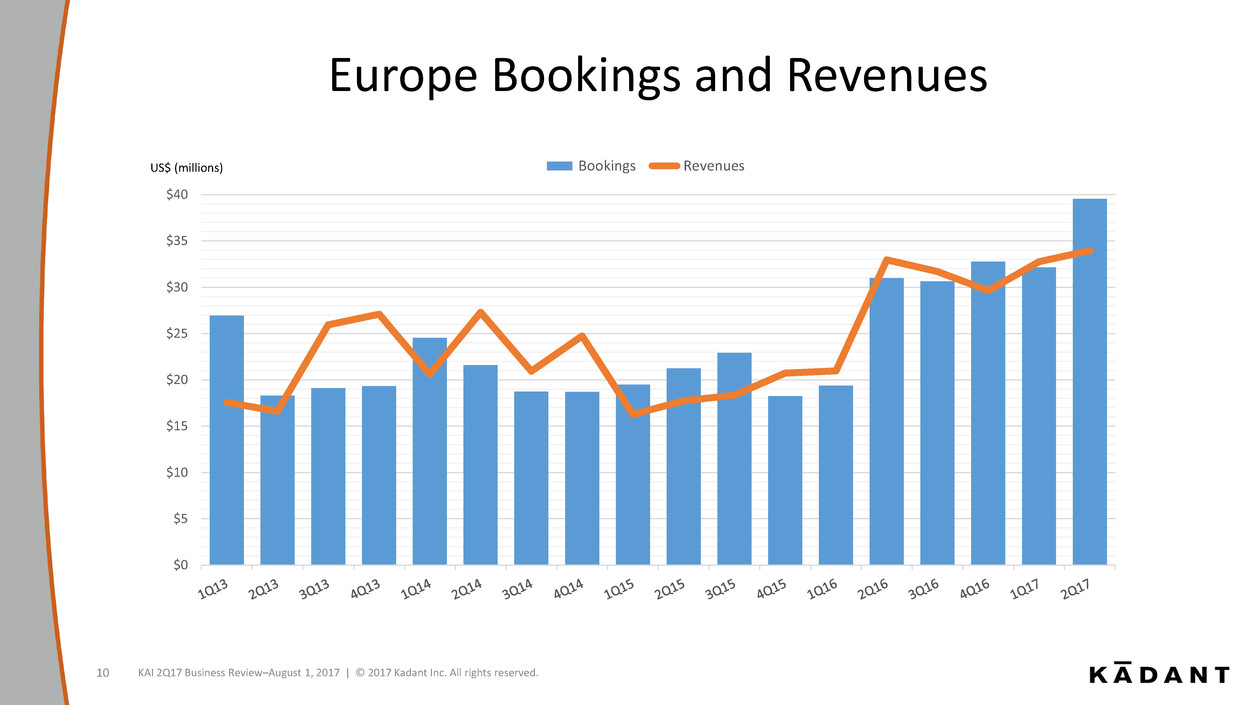
Europe Bookings and Revenues
US$ (millions)
KAI 2Q17 Business Review–August 1, 2017 | © 2017 Kadant Inc. All rights reserved. 10
$0
$5
$10
$15
$20
$25
$30
$35
$40
Bookings Revenues
-$10
-$5
$0
$5
$10
$15
$20
$25
$30
$35
$40
Bookings New Orders Revenues
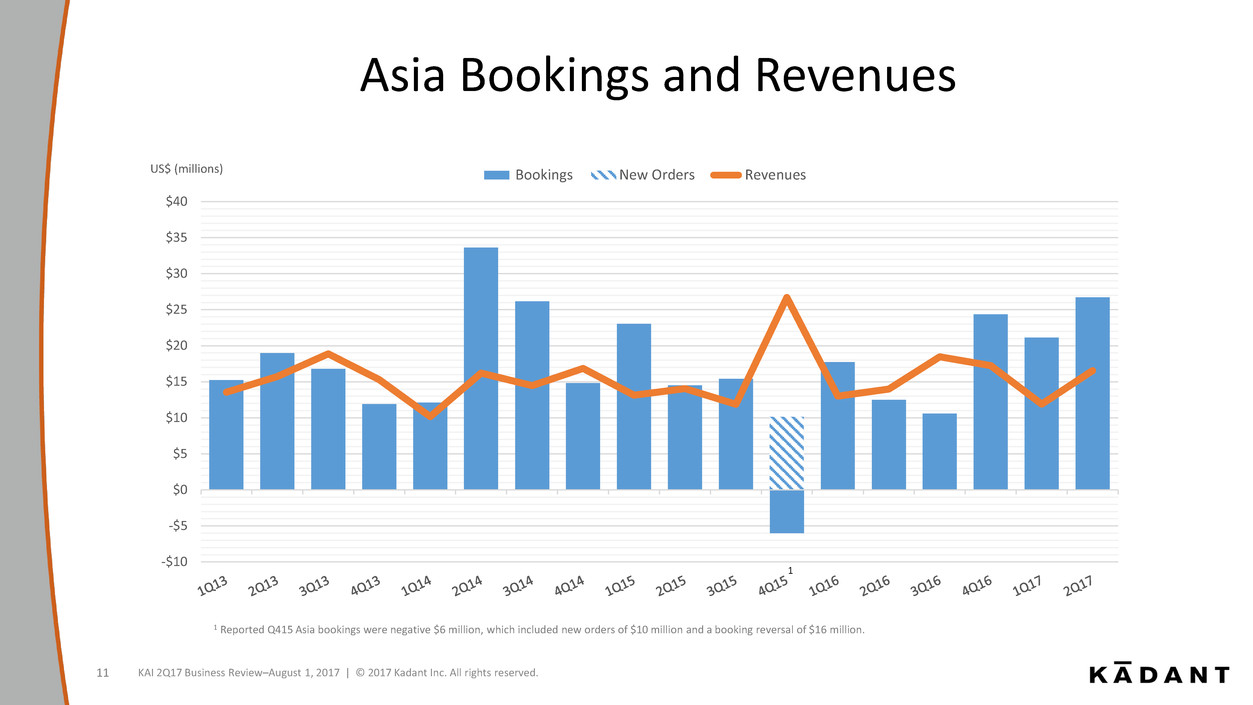
Asia Bookings and Revenues
US$ (millions)
1 Reported Q415 Asia bookings were negative $6 million, which included new orders of $10 million and a booking reversal of $16 million.
1
KAI 2Q17 Business Review–August 1, 2017 | © 2017 Kadant Inc. All rights reserved. 11
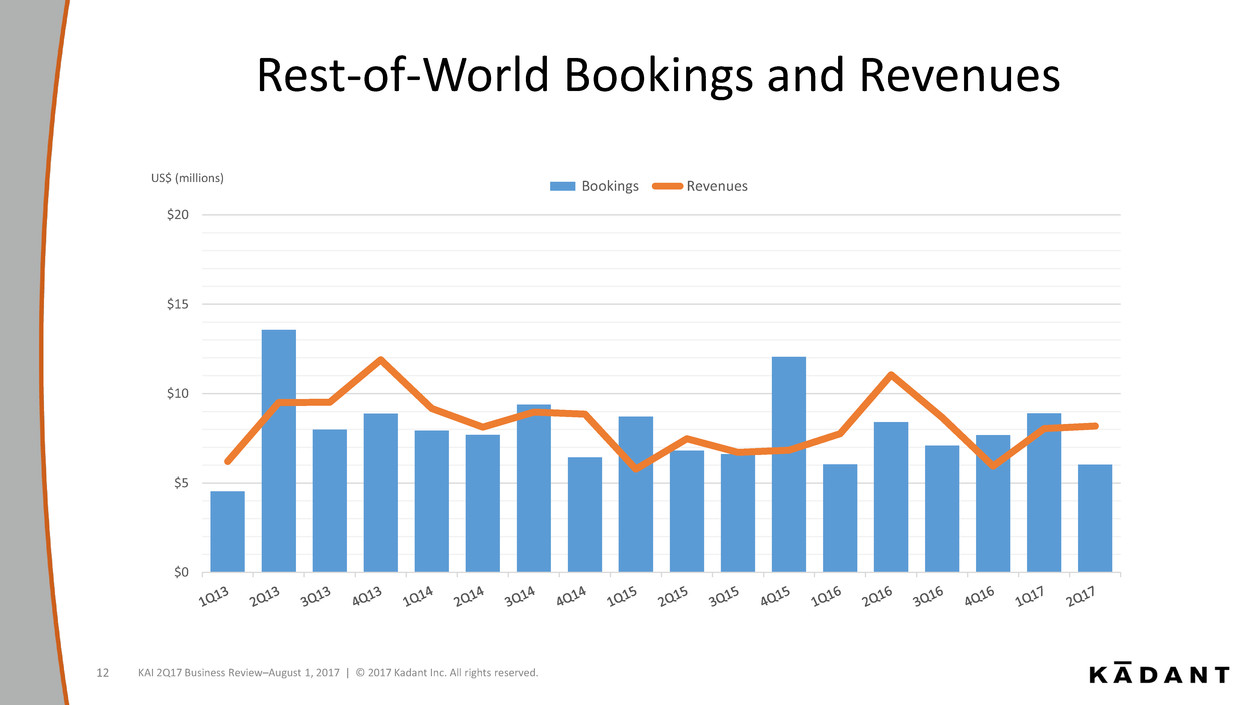
Rest-of-World Bookings and Revenues
US$ (millions)
KAI 2Q17 Business Review–August 1, 2017 | © 2017 Kadant Inc. All rights reserved. 12
$0
$5
$10
$15
$20
Bookings Revenues
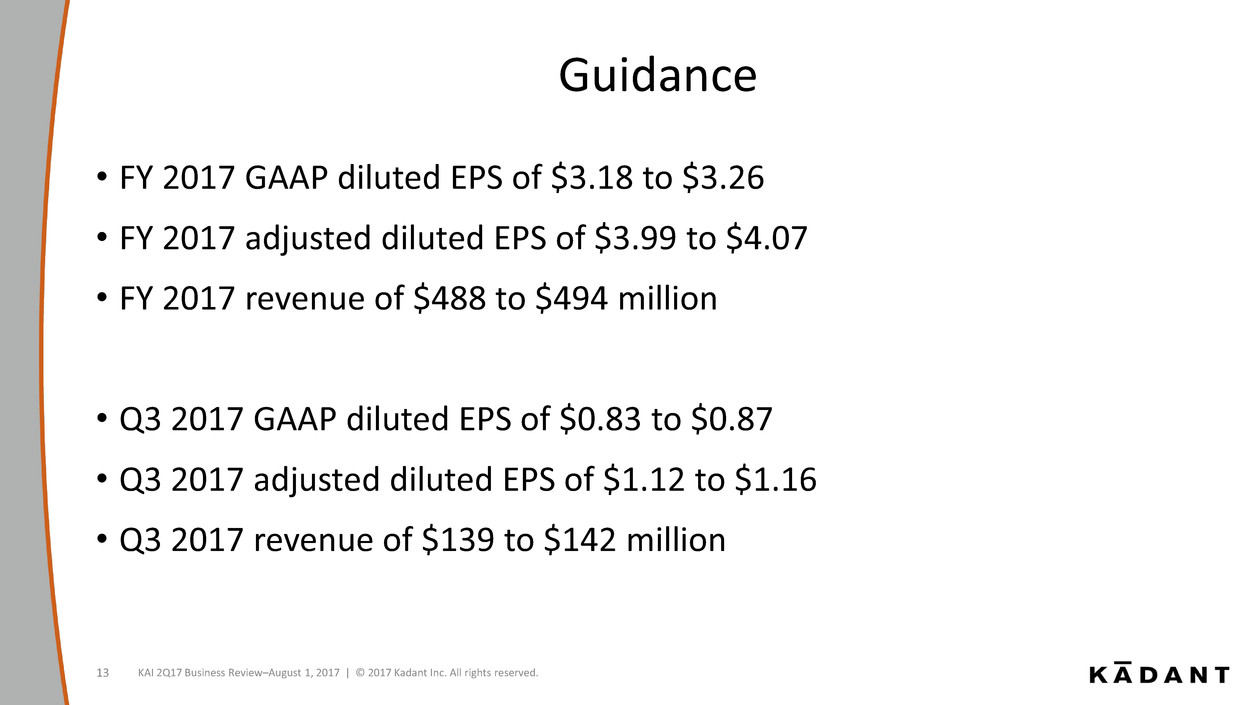
Guidance
• FY 2017 GAAP diluted EPS of $3.18 to $3.26
• FY 2017 adjusted diluted EPS of $3.99 to $4.07
• FY 2017 revenue of $488 to $494 million
• Q3 2017 GAAP diluted EPS of $0.83 to $0.87
• Q3 2017 adjusted diluted EPS of $1.12 to $1.16
• Q3 2017 revenue of $139 to $142 million
KAI 2Q17 Business Review–August 1, 2017 | © 2017 Kadant Inc. All rights reserved. 13
FINANCIAL REVIEW
Michael J. McKenney
Senior Vice President & Chief Financial Officer
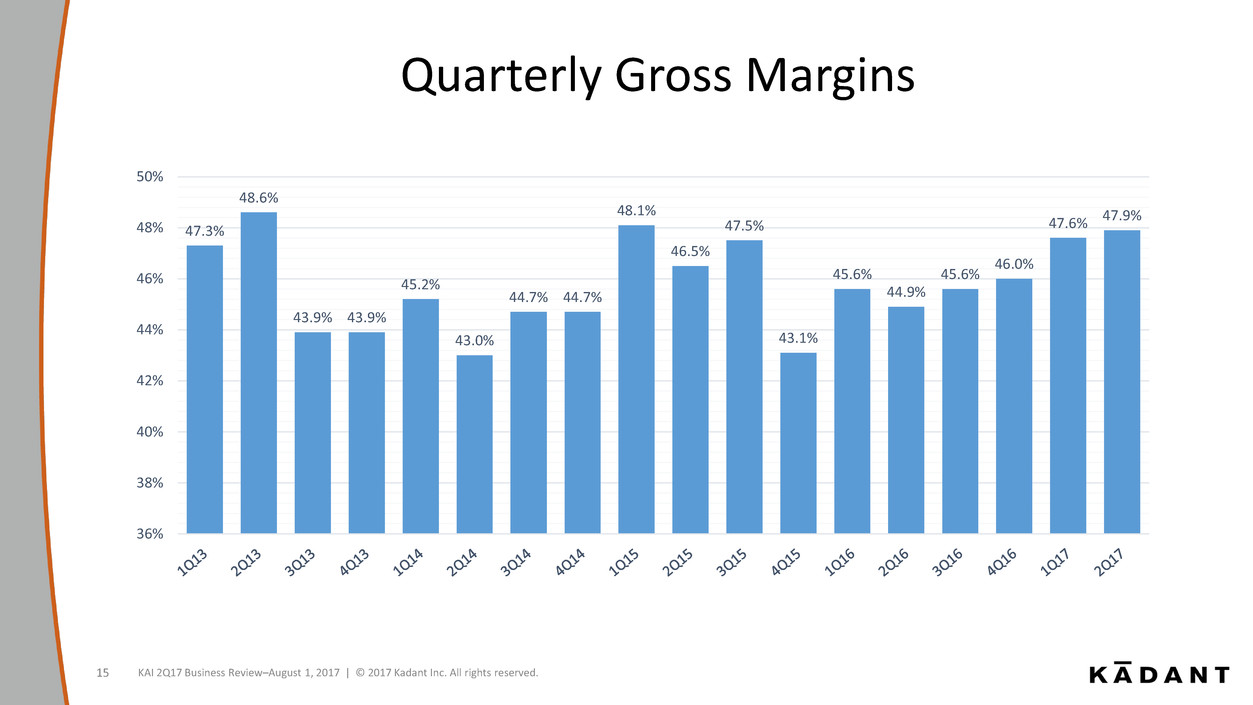
Quarterly Gross Margins
KAI 2Q17 Business Review–August 1, 2017 | © 2017 Kadant Inc. All rights reserved. 15
47.3%
48.6%
43.9% 43.9%
45.2%
43.0%
44.7% 44.7%
48.1%
46.5%
47.5%
43.1%
45.6%
44.9%
45.6%
46.0%
47.6% 47.9%
36%
38%
40%
42%
44%
46%
48%
50%
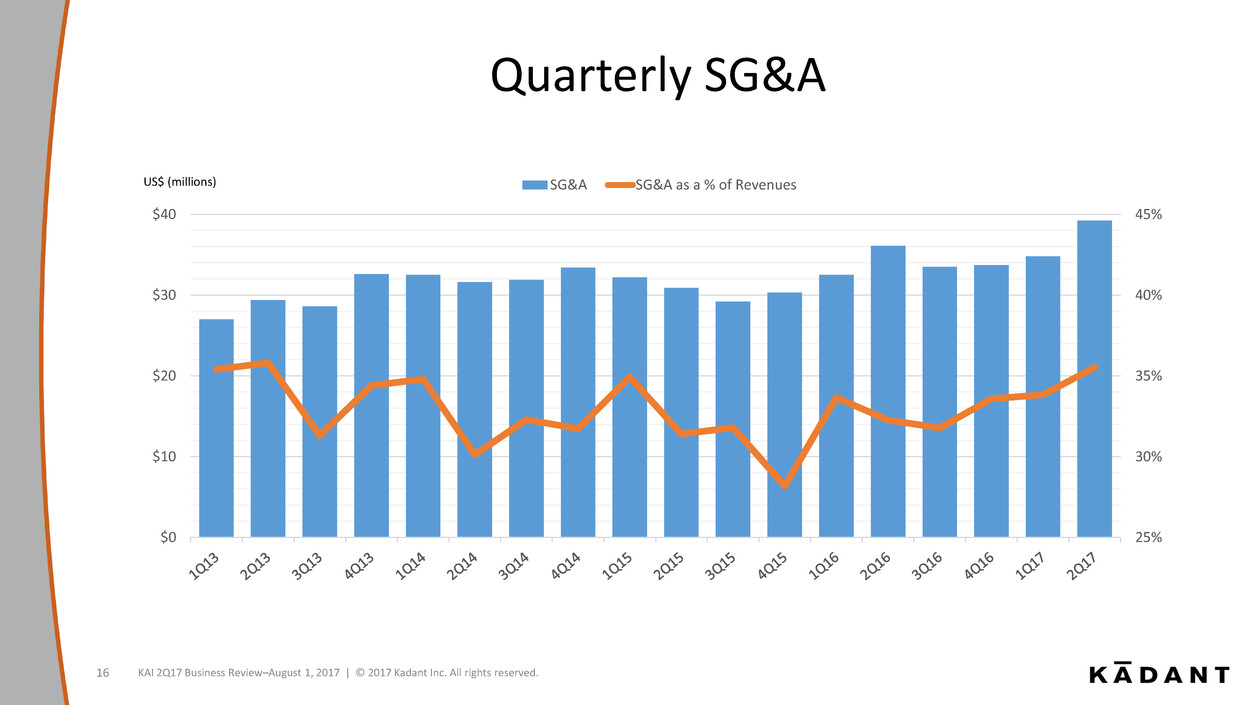
Quarterly SG&A
US$ (millions)
KAI 2Q17 Business Review–August 1, 2017 | © 2017 Kadant Inc. All rights reserved. 16
25%
30%
35%
40%
45%
$0
$10
$20
$30
$40
SG&A SG&A as a % of Revenues
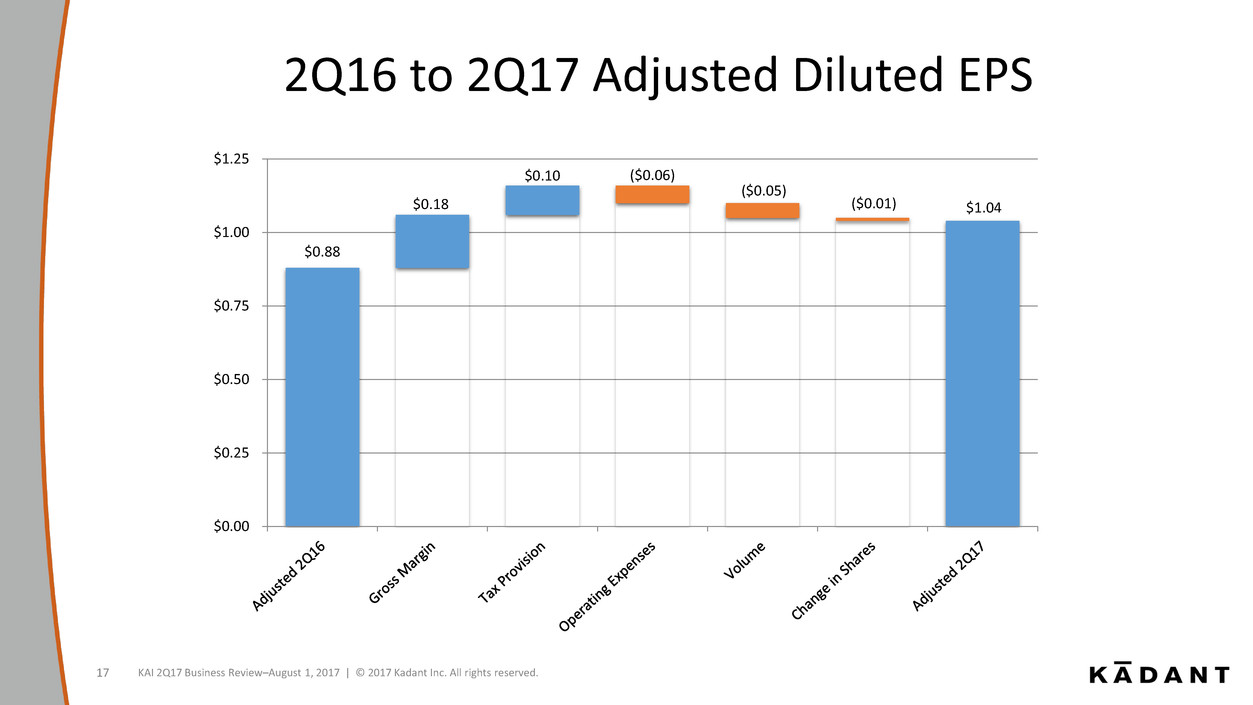
2Q16 to 2Q17 Adjusted Diluted EPS
KAI 2Q17 Business Review–August 1, 2017 | © 2017 Kadant Inc. All rights reserved. 17
$0.88
$0.18
$0.10 ($0.06)
($0.05)
($0.01) $1.04
$0.00
$0.25
$0.50
$0.75
$1.00
$1.25
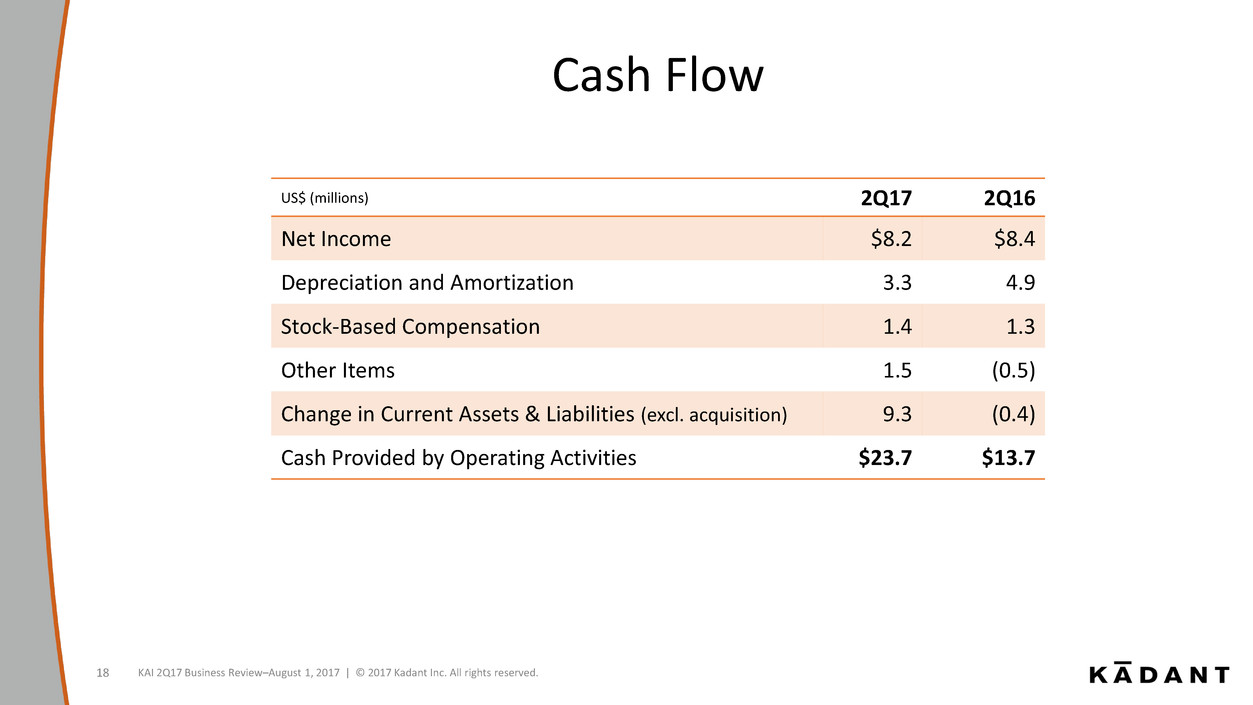
Cash Flow
US$ (millions) 2Q17 2Q16
Net Income $8.2 $8.4
Depreciation and Amortization 3.3 4.9
Stock-Based Compensation 1.4 1.3
Other Items 1.5 (0.5)
Change in Current Assets & Liabilities (excl. acquisition) 9.3 (0.4)
Cash Provided by Operating Activities $23.7 $13.7
KAI 2Q17 Business Review–August 1, 2017 | © 2017 Kadant Inc. All rights reserved. 18
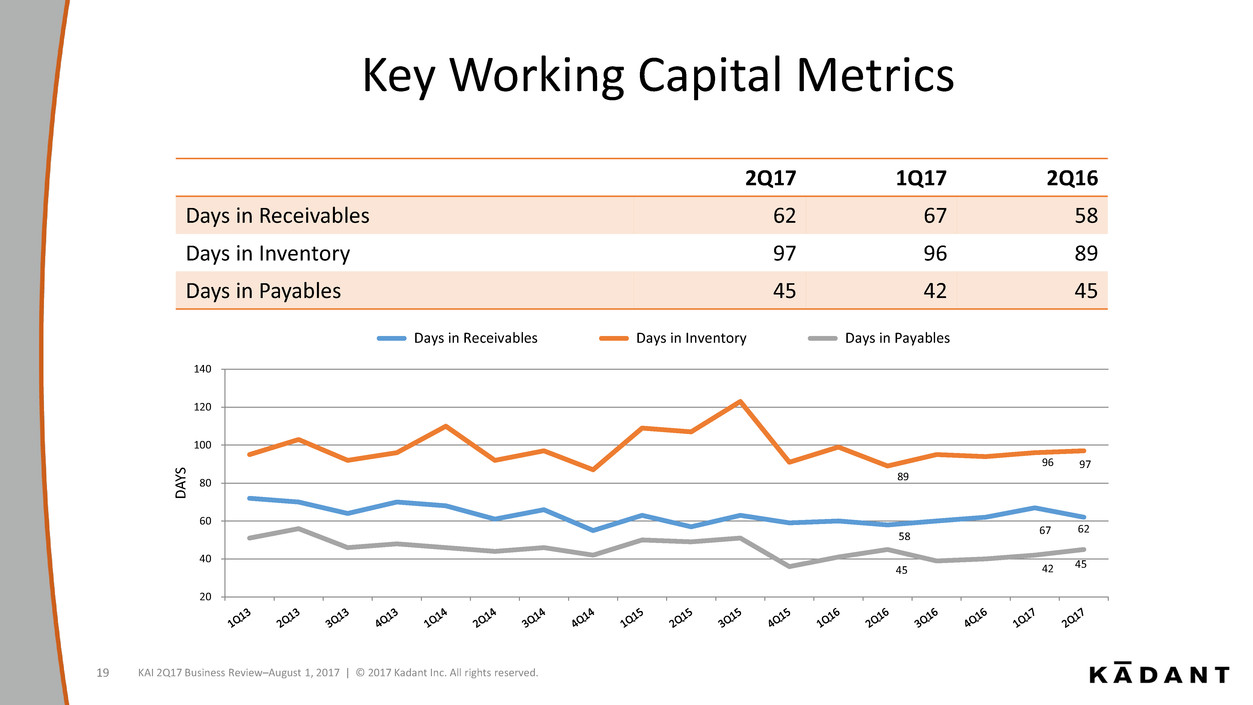
Key Working Capital Metrics
2Q17 1Q17 2Q16
Days in Receivables 62 67 58
Days in Inventory 97 96 89
Days in Payables 45 42 45
KAI 2Q17 Business Review–August 1, 2017 | © 2017 Kadant Inc. All rights reserved. 19
58
67 62
89
96 97
45 42
45
20
40
60
80
100
120
140
D
A
YS
Days in Receivables Days in Inventory Days in Payables
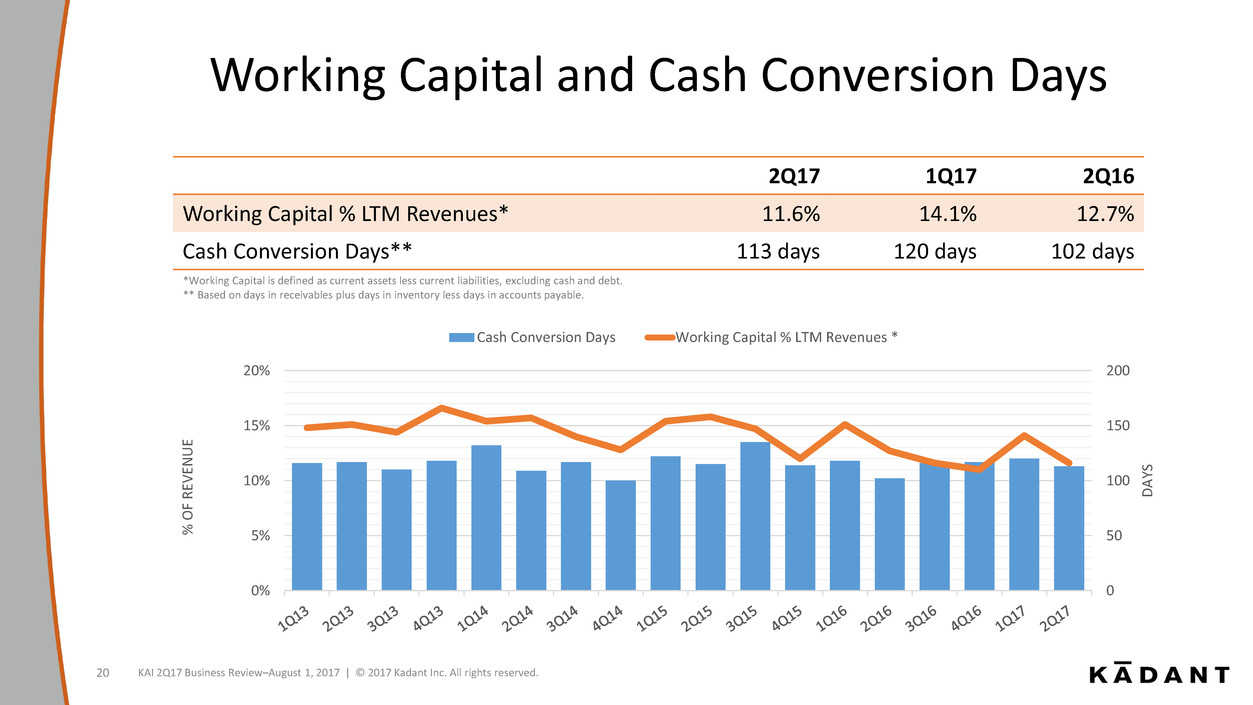
Working Capital and Cash Conversion Days
2Q17 1Q17 2Q16
Working Capital % LTM Revenues* 11.6% 14.1% 12.7%
Cash Conversion Days** 113 days 120 days 102 days
*Working Capital is defined as current assets less current liabilities, excluding cash and debt.
** Based on days in receivables plus days in inventory less days in accounts payable.
KAI 2Q17 Business Review–August 1, 2017 | © 2017 Kadant Inc. All rights reserved. 20
0
50
100
150
200
0%
5%
10%
15%
20%
D
A
YS
%
OF
REV
EN
U
E
Cash Conversion Days Working Capital % LTM Revenues *
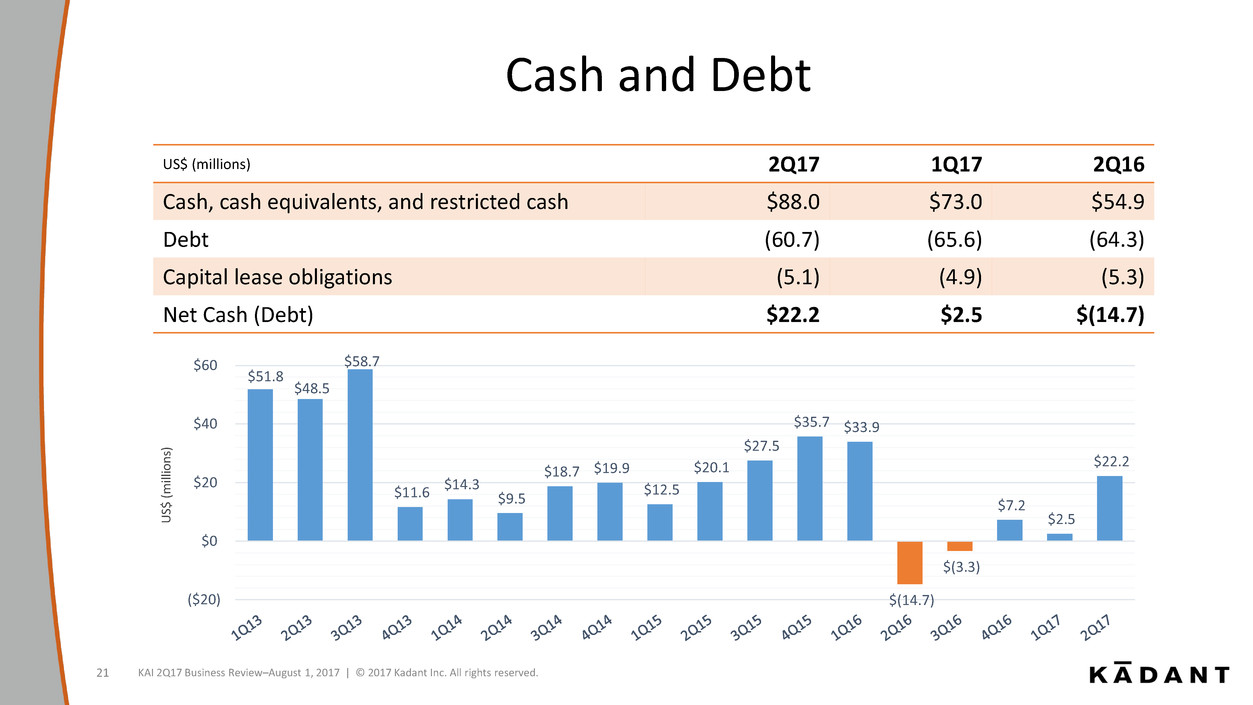
Cash and Debt
US$ (millions) 2Q17 1Q17 2Q16
Cash, cash equivalents, and restricted cash $88.0 $73.0 $54.9
Debt (60.7) (65.6) (64.3)
Capital lease obligations (5.1) (4.9) (5.3)
Net Cash (Debt) $22.2 $2.5 $(14.7)
KAI 2Q17 Business Review–August 1, 2017 | © 2017 Kadant Inc. All rights reserved. 21
U
S$
(
m
ill
io
n
s)
$51.8
$48.5
$58.7
$11.6
$14.3
$9.5
$18.7 $19.9
$12.5
$20.1
$27.5
$35.7 $33.9
$(14.7)
$(3.3)
$7.2
$2.5
$22.2
($20)
$0
$20
$40
$60
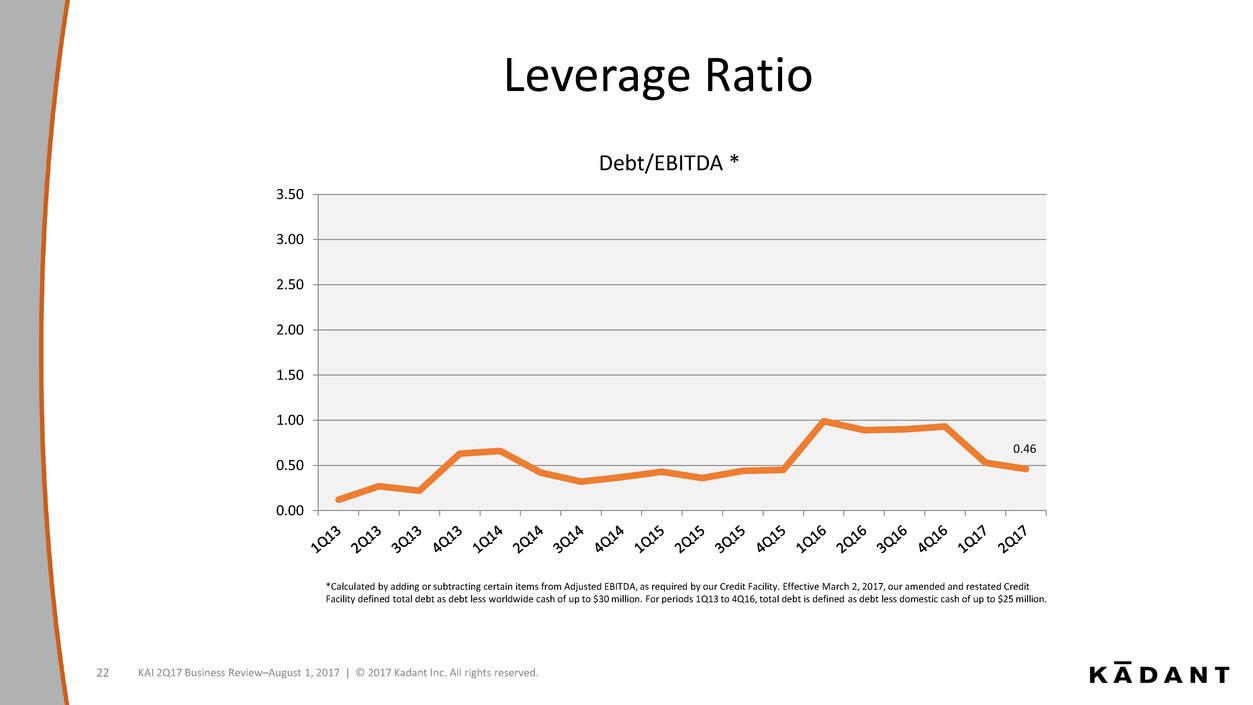
Leverage Ratio
KAI 2Q17 Business Review–August 1, 2017 | © 2017 Kadant Inc. All rights reserved. 22
*Calculated by adding or subtracting certain items from Adjusted EBITDA, as required by our Credit Facility. Effective March 2, 2017, our amended and restated Credit
Facility defined total debt as debt less worldwide cash of up to $30 million. For periods 1Q13 to 4Q16, total debt is defined as debt less domestic cash of up to $25 million.
0.46
0.00
0.50
1.00
1.50
2.00
2.50
3.00
3.50
Debt/EBITDA *
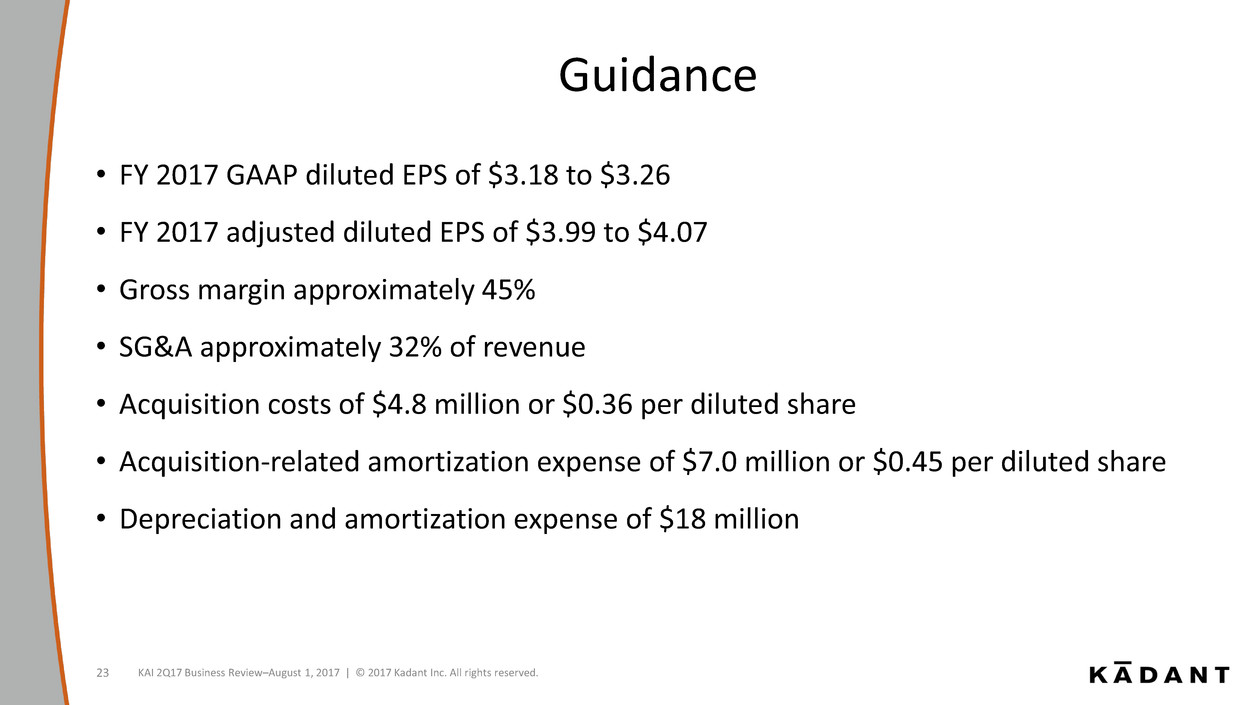
Guidance
• FY 2017 GAAP diluted EPS of $3.18 to $3.26
• FY 2017 adjusted diluted EPS of $3.99 to $4.07
• Gross margin approximately 45%
• SG&A approximately 32% of revenue
• Acquisition costs of $4.8 million or $0.36 per diluted share
• Acquisition-related amortization expense of $7.0 million or $0.45 per diluted share
• Depreciation and amortization expense of $18 million
KAI 2Q17 Business Review–August 1, 2017 | © 2017 Kadant Inc. All rights reserved. 23
Questions & Answers
To ask a question, please call 888-326-8410 within the U.S. or
+1 704-385-4884 outside the U.S. and reference 58 886 672.
Please mute the audio on your computer.
KAI 2Q17 Business Review–August 1, 2017 | © 2017 Kadant Inc. All rights reserved. 24
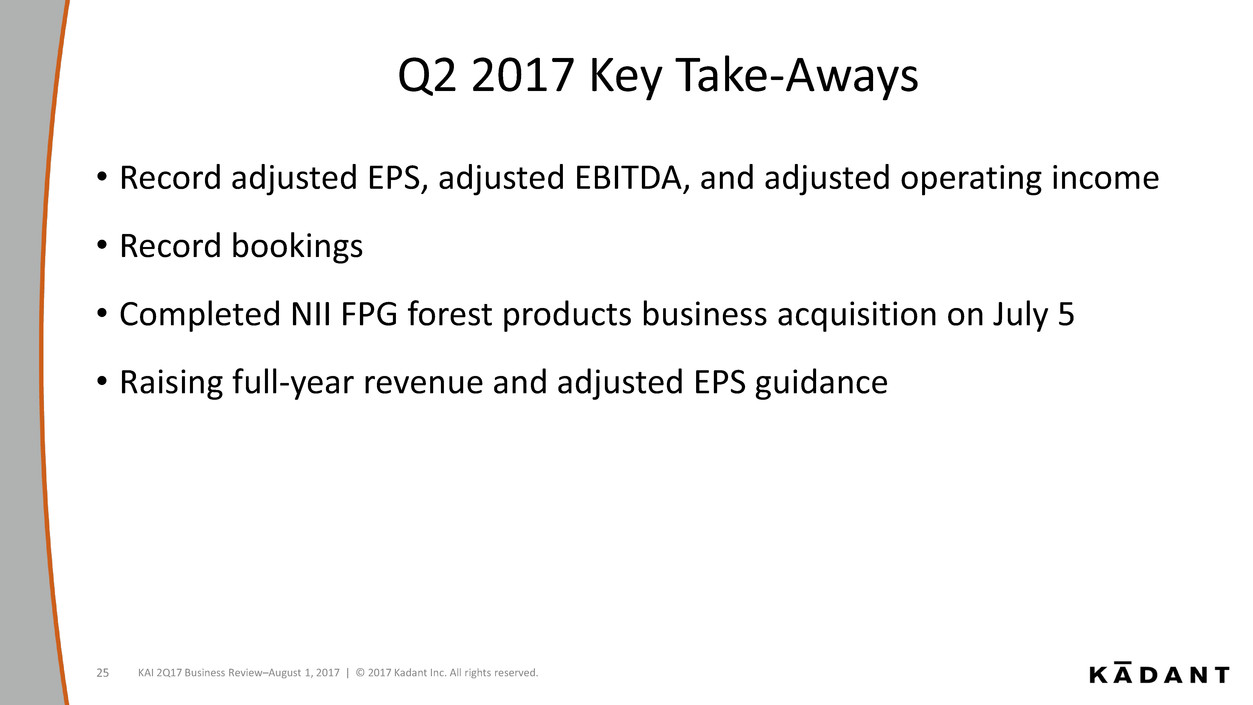
Q2 2017 Key Take-Aways
• Record adjusted EPS, adjusted EBITDA, and adjusted operating income
• Record bookings
• Completed NII FPG forest products business acquisition on July 5
• Raising full-year revenue and adjusted EPS guidance
KAI 2Q17 Business Review–August 1, 2017 | © 2017 Kadant Inc. All rights reserved. 25
