Attached files
Table of Contents
UNITED STATES
SECURITIES AND EXCHANGE COMMISSION
WASHINGTON, D.C. 20549
FORM 10-K
(mark one)
| x | ANNUAL REPORT PURSUANT TO SECTION 13 OR 15(D) OF THE SECURITIES EXCHANGE ACT OF 1934 |
| For the fiscal year ended January 1, 2011 |
OR
| ¨ | TRANSITION REPORT PURSUANT TO SECTION 13 OR 15(D) OF THE SECURITIES EXCHANGE ACT OF 1934 |
| For the transition period from to |
Commission file number 1-11406
KADANT INC.
(Exact name of Registrant as specified in its charter)
| Delaware | 52-1762325 | |
| (State or other jurisdiction of incorporation or organization) | (I.R.S. Employer Identification No.) | |
| One Technology Park Drive Westford, Massachusetts |
01886 | |
| (Address of principal executive offices) | (Zip Code) |
Registrant’s telephone number, including area code: (978) 776-2000
Securities registered pursuant to Section 12(b) of the Act:
| Title of each class |
Name of each exchange on which registered | |
| Common Stock, $.01 par value | New York Stock Exchange |
Securities registered pursuant to Section 12(g) of the Act: None
Indicate by check mark if the Registrant is a well-known seasoned issuer, as defined in Rule 405 of the Securities Act. Yes ¨ No x
Indicate by check mark if the Registrant is not required to file reports pursuant to Section 13 or Section 15(d) of the Act. Yes ¨ No x
Indicate by check mark whether the Registrant (1) has filed all reports required to be filed by Section 13 or 15(d) of the Securities Exchange Act of 1934 during the preceding 12 months (or for such shorter period that the Registrant was required to file such reports), and (2) has been subject to such filing requirements for the past 90 days. Yes x No ¨
Indicate by check mark whether the Registrant has submitted electronically and posted on its corporate Web site, if any, every Interactive Data File required to be submitted and posted pursuant to Rule 405 of Regulation S-T during the preceding 12 months (or for such shorter period that the Registrant was required to submit and post such files). Yes ¨ No ¨
Indicate by check mark if disclosure of delinquent filers pursuant to Item 405 of Regulation S-K is not contained herein, and will not be contained, to the best of the Registrant’s knowledge, in definitive proxy or information statements incorporated by reference in Part III of this Form 10-K or any amendment to this Form 10-K. x
Indicate by check mark whether the Registrant is a large accelerated filer, an accelerated filer, a non-accelerated filer, or a smaller reporting company. See the definitions of “large accelerated filer”, “accelerated filer”, and “smaller reporting company” in Rule 12b-2 of the Exchange Act.
| Large accelerated filer ¨ | Accelerated filer x | |
| Non-accelerated filer ¨ (Do not check if a smaller reporting company) |
Smaller reporting company ¨ |
Indicate by check mark whether the Registrant is a shell company (as defined in Rule 12b-2 of the Exchange Act). Yes ¨ No x
The aggregate market value of the voting and non-voting common equity held by nonaffiliates of the Registrant as of July 3, 2010, was approximately $201,612,000.
As of February 18, 2011, the Registrant had 12,254,737 shares of Common Stock outstanding.
DOCUMENTS INCORPORATED BY REFERENCE
Portions of the Registrant’s definitive Proxy Statement pursuant to Regulation 14A promulgated under the Securities Exchange Act of 1934, as amended, to be used in connection with the Registrant’s 2011 Annual Meeting of Shareholders are incorporated by reference into Part III of this Form 10-K.
Table of Contents
Annual Report on Form 10-K
for the Fiscal Year Ended January 1, 2011
Table of Contents
Table of Contents
| Kadant Inc. | 2010 Annual Report |
PART I
Forward-Looking Statements
This Annual Report on Form 10-K and the documents that we incorporate by reference in this Report include forward-looking statements within the meaning of Section 21E of the Securities Exchange Act of 1934, as amended, and Section 27A of the Securities Act of 1933, as amended. These forward-looking statements are not statements of historical fact, and may include statements regarding possible or assumed future results of operations. Forward-looking statements are subject to risks and uncertainties and are based on the beliefs and assumptions of our management, using information currently available to our management. When we use words such as “believes,” “expects,” “anticipates,” “intends,” “plans,” “estimates,” “seeks,” “should,” “likely,” “will,” “would,” “may,” “continue,” “could,” or similar expressions, we are making forward-looking statements.
Forward-looking statements are not guarantees of performance. They involve risks, uncertainties, and assumptions. Our future results of operations may differ materially from those expressed in the forward-looking statements. Many of the important factors that will determine these results and values are beyond our ability to control or predict. You should not put undue reliance on any forward-looking statements. We undertake no obligation to publicly update any forward-looking statement, whether as a result of new information, future events, or otherwise. For a discussion of important factors that may cause our actual results to differ materially from those suggested by the forward-looking statements, you should read carefully the section captioned “Risk Factors” in Part I, Item 1A, of this Report.
| Item 1. | Business |
General Development of Business
We were incorporated in Delaware in November 1991 to be the successor-in-interest to several papermaking equipment businesses of Thermo Electron Corporation (Thermo Electron). In November 1992, we completed an initial public offering of a portion of our outstanding common stock. On July 12, 2001, we changed our name to Kadant Inc. from Thermo Fibertek Inc. In August 2001, Thermo Electron disposed of its remaining equity interest in Kadant Inc. by means of a stock dividend to its shareholders. Our common stock is listed on the New York Stock Exchange, where it trades under the symbol “KAI.”
The terms “we,” “us,” “our,” “Registrant,” or “Company” in this Report refer to Kadant Inc. and its consolidated subsidiaries.
Description of Our Business
We are a leading supplier of equipment used in the global papermaking and paper recycling industries and a manufacturer of granules made from papermaking byproducts. Our continuing operations are comprised of one reportable operating segment: Papermaking Systems, and a separate product line, Fiber-based Products. Through our Papermaking Systems segment, we develop, manufacture, and market a range of equipment and products for the global papermaking, paper recycling, and process industries. We have a large customer base that includes most of the world’s major paper manufacturers. We believe our large installed base provides us with a spare parts and consumables business that yields higher margins than our capital equipment business.
Through our Fiber-based Products business, we manufacture and sell granules derived from pulp fiber for use as carriers for agricultural, home lawn and garden, and professional lawn, turf and ornamental applications, as well as for oil and grease absorption.
Papermaking Systems
Our Papermaking Systems segment has a long and well-established history of developing, manufacturing, and marketing equipment for the global papermaking and paper recycling industries. Some of our businesses or their predecessor companies have been in operation for more than 100 years. Our customer base includes major global paper manufacturers and, with our equipment found in most of the world’s pulp and paper mills, we
1
Table of Contents
| Kadant Inc. | 2010 Annual Report |
believe we have one of the largest installed bases of equipment in the pulp and paper industry. We manufacture our products in nine countries in Europe, North and South America, and Asia.
Our Papermaking Systems segment consists of the following product lines: stock-preparation, fluid-handling, doctoring (formerly referred to as paper machine accessory), and water-management.
Stock-preparation
We develop, manufacture, and market complete custom-engineered systems and equipment, as well as standard individual components, for pulping, de-inking, screening, cleaning, and refining recycled and virgin fibers for preparation for entry into the paper machine. Our principal stock-preparation products include:
| – | Recycling and approach flow systems: Our equipment includes pulping, screening, cleaning, and de-inking systems that blend pulp mixtures and remove contaminants, such as ink, glue, metals, and other impurities, to prepare them for entry into the paper machine during the production of recycled paper. |
| – | Virgin pulping process equipment: Our equipment includes pulp washing, evaporator, recausticizing, and condensate treatment systems used to remove lignin, concentrate and recycle process chemicals, and remove condensate gases. |
Fluid-handling
We develop, manufacture and market rotary joints, precision unions, steam and condensate systems, components, and controls used primarily in the dryer section of the papermaking process and during the production of corrugated boxboard, metals, plastics, rubber, textiles, chemicals, and food. Our principal fluid-handling systems include:
| – | Rotary joints: Our mechanical devices, used with rotating shafts, allow the transfer of pressurized fluid from a stationary source into and out of rotating machinery for heating, cooling, or the transfer of fluid power. |
| – | Syphons: Our devices, installed primarily inside the rotating cylinders of paper machines, are used to remove condensate from the drying cylinders through rotary joints located on either end of the cylinder. |
| – | Turbulator ® bars: Our steel or stainless steel axial bars, installed on the inside of cylinders, are used to induce turbulence in the condensate layer to improve the uniformity and rate of heat transfer through the cylinders. |
| – | Engineered steam and condensate systems: Our steam systems control the flow of steam from the boiler to the paper drying cylinders, collect condensed steam, and return it to the boiler to improve energy efficiency during the paper drying process. Our systems and equipment are also used to efficiently and effectively distribute steam in a wide variety of industrial processing applications. |
Doctoring
We develop, manufacture, and market a wide range of doctoring systems and related consumables that continuously clean rolls to keep paper machines running efficiently. Doctor blades are made of a variety of materials to perform a variety of functions including cleaning, creping, web removal, flaking, and the application of coatings. Profiling systems are used to control moisture, web curl, and gloss during paper converting. Our principal doctoring products include:
| – | Doctor systems and holders: Our doctor systems clean papermaking rolls to maintain the efficient operation of paper machines and other equipment by placing a blade against the roll at a constant and uniform pressure. A doctor system consists of the structure supporting the blade and the blade holder. A large paper machine may have as many as 100 doctor systems. |
| – | Profiling systems: We offer profiling systems that control moisture, web curl, and gloss during paper converting. |
2
Table of Contents
| Kadant Inc. | 2010 Annual Report |
| – | Doctor blades: We manufacture doctor and scraper blades made of a variety of materials including metal, bi-metal, or synthetic materials that perform a variety of functions including cleaning, creping, web removal, flaking, and the application of coatings. A typical doctor blade has a life ranging from eight hours to two months, depending on the application. |
Water-management
We develop, manufacture, and market water-management systems and equipment used to continuously clean paper machine fabrics, drain water from pulp mixtures, form the sheet or web, and filter the process water for reuse. Our principal water-management systems include:
| – | Shower and fabric-conditioning systems: Our shower and fabric-conditioning systems assist in the removal of contaminants that collect on paper machine fabrics used to convey the paper web through the forming, pressing, and drying sections of the paper machine. A typical paper machine has between 3 and 12 fabrics. These fabrics can easily become contaminated with fiber, fillers, pitch, and dirt that can have a detrimental effect on paper machine performance and paper quality. Our shower and fabric-conditioning systems assist in the removal of these contaminants. |
| – | Formation systems: We supply structures that drain, purify, and recycle process water from the pulp mixture during paper sheet and web formation. |
| – | Water-filtration systems: We offer a variety of filtration systems and strainers that remove contaminants from process water before reuse and recover reusable fiber for recycling back into the pulp mixture. |
Fiber-based Products
We produce biodegradable, absorbent granules from papermaking byproducts for use primarily as carriers for agricultural, home lawn and garden, and professional lawn, turf and ornamental applications, as well as for oil and grease absorption.
Discontinued Operation
In 2005, our Kadant Composites LLC subsidiary (Composites LLC) sold substantially all of its assets to a third party. Under the terms of the asset purchase agreement, Composites LLC retained certain liabilities associated with the operation of the business prior to the sale, including the warranty obligations related to products manufactured prior to the sale date. Composites LLC retained all of the cash proceeds received from the asset sale and continued to administer and pay warranty claims from the sale proceeds into the third quarter of 2007. On September 30, 2007, Composites LLC announced that it no longer had sufficient funds to honor warranty claims, was unable to pay or process warranty claims, and ceased doing business. All activity related to this business is classified in the results of the discontinued operation in the accompanying consolidated financial statements.
Composites LLC’s inability to pay or process warranty claims has exposed us to greater risks associated with litigation. For more information regarding our current litigation arising from these claims, see Part I, Item 1A, “Risk Factors.”
Research and Development
We develop a broad range of products for all facets of the markets we serve. We operate research and development facilities in Europe and the U.S., and focus our product innovation on process industry challenges and the need for improved fiber processing, heat transfer, showering, filtration, doctoring, and fluid handling. In addition to internal product development activities, our research centers allow customers to simulate their own operating conditions and applications to identify and quantify opportunities for improvement.
3
Table of Contents
| Kadant Inc. | 2010 Annual Report |
Our research and development expenses were $5.3 million, $5.6 million, and $6.2 million in 2010*, 2009, and 2008, respectively.
Raw Materials
The primary raw materials used in our Papermaking Systems segment are steel, stainless steel, brass, and bronze, which have generally been available through a number of suppliers. To date, we have not needed to maintain raw material inventories in excess of our current needs to ensure availability.
The raw material used in the manufacture of our fiber-based granules is obtained from two paper recycling mills. Although we believe that our relationships with the mills are good, the mills may not continue to supply sufficient raw material. From time to time, we have experienced some difficulty in obtaining sufficient raw material to operate at optimal production levels. We continue to work with the mills to ensure a stable supply of raw material. To date, we have been able to meet all of our customer delivery requirements, but there can be no assurance that we will be able to meet future delivery requirements. If the mills were unable or unwilling to supply us sufficient fiber, we would be forced to find one or more alternative suppliers for this raw material.
Patents, Licenses, and Trademarks
We protect our intellectual property rights by applying for and obtaining patents when appropriate. We also rely on technical know-how, trade secrets, and trademarks to maintain our competitive position. We also enter into license agreements with others to grant and/or receive rights to patents and know-how. No particular patent, or related group of patents, is so important that its expiration or loss would significantly affect our operations.
Papermaking Systems
We have numerous U.S. and foreign patents, including foreign counterparts to our U.S. patents, expiring on various dates ranging from 2011 to 2029. From time to time, we enter into licenses of products with other companies that serve the pulp, papermaking, converting, and paper recycling industries.
Fiber-based Products
We currently hold several U.S. patents, expiring on various dates ranging from 2012 to 2026, related to various aspects of the processing of fiber-based granules and the use of these materials in the agricultural, professional turf, home lawn and garden, general absorption, oil and grease absorption, and catbox filler markets.
Seasonal Influences
Papermaking Systems
There are no material seasonal influences on this segment’s sales of products and services.
Fiber-based Products
Our Fiber-based Products business experiences fluctuations in sales, usually in the third and fourth quarters, when sales decline due to the seasonality of the agricultural and home lawn and garden markets.
| * | Unless otherwise noted, references to 2010, 2009, and 2008 in this Annual Report on Form 10-K are for the fiscal years ended January 1, 2011, January 2, 2010, and January 3, 2009, respectively. |
4
Table of Contents
| Kadant Inc. | 2010 Annual Report |
Working Capital Requirements
There are no special inventory requirements or credit terms extended to customers that would have a material adverse effect on our working capital.
Dependency on a Single Customer
No single customer accounted for more than 10% of our consolidated revenues or more than 10% of the Papermaking Systems segment’s revenues in any of the past three years. During 2010, 2009, and 2008, approximately 58%, 59%, and 61%, respectively, of our sales were to customers outside the United States, principally in Europe and China.
Backlog
Our backlog of firm orders for the Papermaking Systems segment was $92.7 million and $60.0 million at year-end 2010 and 2009, respectively. The total consolidated backlog of firm orders was $94.3 million and $61.5 million at year-end 2010 and 2009, respectively. We anticipate that substantially all of the backlog at year-end 2010 will be shipped or completed during the next 12 months. Some of these orders can be canceled by the customer upon payment of a cancellation fee.
Competition
We face significant competition in each of our principal markets. We compete primarily on the basis of quality, price, service, technical expertise, and product performance and innovation. We believe the reputation that we have established for quality products and in-depth process knowledge provides us with a competitive advantage. In addition, a significant portion of our business is generated from our existing worldwide customer base. To maintain this base, we have emphasized technology, service, and a problem-solving relationship with our customers.
We are a leading supplier of stock-preparation systems and equipment used for the preparation of recycled and virgin fibers in the production of recycled paper. Several major competitors supply various pieces of equipment for this process. Our principal competitors in this market are Voith Paper GmbH, Metso Corporation, and Maschinenfabrik Andritz AG. We compete in this market primarily on the basis of technical expertise, price, and product innovation. There are other competitors that specialize in segments within the white- and brown-paper markets.
We are a leading supplier of fluid-handling systems and equipment, offering global sales and service, application expertise, and an extensive rotary joint product line. There are numerous competitors in this market, including Deublin Company, Barco Company, Christian Maier GmbH & Co. KG, and Duff-Norton Company. In addition, we compete with numerous local competitors. We generally compete in this market based on process knowledge, technical competence, price, and product and service quality.
We are a leading supplier of doctoring systems and equipment for paper machines. Our principal global competitors in this market are Joh. Clouth GmbH & Co. KG and Metso Corporation. Because of the high capital cost of paper machines and the role of our doctoring equipment in maintaining the efficiency of these machines, we generally compete in this market on the basis of service, technical expertise, price, and performance.
In our water-management product line, various competitors exist in the formation, shower and fabric-conditioning systems, and filtration systems markets. Principal competitors are IBS-Paper Performance Group in formation, shower and fabric-conditioning systems and Asten/Johnson Foils in formation tables. In addition, a variety of companies compete within the shower and fabric-conditioning systems and filtration systems markets. In each of these markets, we generally compete on the basis of process knowledge, application experience, product quality, price, and service.
Environmental Protection Regulations
We believe that our compliance with federal, state, and local environmental protection regulations will not have a material adverse effect on our capital expenditures, earnings, or competitive position.
5
Table of Contents
| Kadant Inc. | 2010 Annual Report |
Employees
As of year-end 2010, we had approximately 1,600 employees worldwide.
Financial Information
Financial information concerning our segment and product lines is summarized in Note 12 to the consolidated financial statements, which begin on page F-1 of this Report.
Financial information about exports by domestic operations and about foreign operations is summarized in Note 12 to the consolidated financial statements, which begin on page F-1 of this Report.
Available Information
We file annual, quarterly, and current reports, proxy statements, and other documents with the Securities and Exchange Commission (SEC) under the Exchange Act. The public may read and copy any materials that we file with the SEC at the SEC’s Public Reference Room at 100 F Street, NE, Washington, D.C. 20549. The public may obtain information on the operation of the Public Reference Room by calling the SEC at 1-800-SEC-0330. Also, the SEC maintains a website that contains reports, proxy and information statements, and other information regarding issuers, including us, that file electronically with the SEC. The public can obtain any documents that we file with the SEC at www.sec.gov. We also make available free of charge through our website at www.kadant.com our Annual Reports on Form 10-K, Quarterly Reports on Form 10-Q, Current Reports on Form 8-K, and, if applicable, amendments to these Reports filed with or furnished pursuant to Section 13(a) or 15(d) of the Exchange Act, as soon as reasonably practicable after we electronically file these materials with, or furnish them to, the SEC. We are not including the information contained in our website as part of this Report nor are we incorporating the information on our website into this Report by reference.
Executive Officers of the Registrant
The following table summarizes certain information concerning individuals who are our executive officers as of March 1, 2011:
| Name |
Age | Present Title (Fiscal Year First Became Executive Officer) | ||||
| Jonathan W. Painter |
52 | President and Chief Executive Officer (1997) | ||||
| Eric T. Langevin |
48 | Executive Vice President and Chief Operating Officer (2006) | ||||
| Thomas M. O’Brien |
59 | Executive Vice President and Chief Financial Officer (1994) | ||||
| Jeffrey L. Powell |
52 | Senior Vice President (2009) | ||||
| Sandra L. Lambert |
55 | Vice President, General Counsel, and Secretary (2001) | ||||
| Michael J. McKenney |
49 | Vice President, Finance and Chief Accounting Officer (2002) | ||||
Mr. Painter has been our chief executive officer and a director since January 2010 and our president since September 1, 2009. Between 1997 and September 2009, Mr. Painter served as an executive vice president and from March 2007 through September 2009 had supervisory responsibility for our stock-preparation and fiber-based products businesses. He served as president of our composite building products business from 2001 until its sale in 2005. He also served as our treasurer and the treasurer of Thermo Electron from 1994 until 1997. Prior to 1994, Mr. Painter held various managerial positions with us and Thermo Electron.
Mr. Langevin has been an executive vice president and our chief operating officer since January 2010. Prior to January 2010, Mr. Langevin had been a senior vice president since March 2007 and had supervisory responsibility for our paperline business, consisting of our doctoring, fluid-handling, and water-management product lines. He served as vice president, with responsibility for our doctoring and water-management product lines, from 2006 to 2007. From 2001 to 2006, Mr. Langevin was president of Kadant Web Systems Inc. (now our Kadant Solutions division) and before that served as its senior vice president and vice president of operations. Prior to 2001, Mr. Langevin managed several product groups and departments within Kadant Web Systems after joining us in 1986 as a product development engineer.
6
Table of Contents
| Kadant Inc. | 2010 Annual Report |
Mr. O’Brien has been an executive vice president since 1998 and our chief financial officer since 2001. He served as our treasurer from 2001 to February 2005 and also as vice president, finance, from 1991 to 1998. Prior to joining us, Mr. O’Brien held various finance positions at Racal Interlan, Inc., Prime Computer, Compugraphic Corporation, and the General Electric Company.
Mr. Powell has been a senior vice president since September 2009 and has supervisory responsibility for our stock-preparation and fiber-based products businesses. From January 2008 to September 2009, Mr. Powell was vice president, new ventures, with principal responsibility for acquisition-related activities. Prior to joining us, Mr. Powell was the chairman and chief executive officer of Castion Corporation, a provider of sustainable wastewater treatment and recovery solutions, from April 2003 through December 2007.
Ms. Lambert has been a vice president and our general counsel since 2001, and our secretary since our incorporation in 1991. Prior to joining us, she was a vice president and the secretary of Thermo Electron since 1999 and 1990, respectively, and before that was a member of Thermo Electron’s legal department.
Mr. McKenney has been our vice president, finance and chief accounting officer since January 2002 and served as our corporate controller from 1997 to 2007. Mr. McKenney was controller of our Kadant AES division (now part of our Kadant Solutions division) from 1993 to 1997. Prior to 1993, Mr. McKenney held various financial positions at Albany International Corp.
| Item 1A. | Risk Factors |
In connection with the “safe harbor” provisions of the Private Securities Litigation Reform Act of 1995, we wish to caution readers that the following important factors, among others, in some cases have affected, and in the future could affect, our actual results and could cause our actual results in 2011 and beyond to differ materially from those expressed in any forward-looking statements made by us, or on our behalf.
Our business is dependent on worldwide and local economic conditions as well as the condition of the pulp and paper industry.
We sell products worldwide primarily to the pulp and paper industry, which is a cyclical industry. Generally, the financial condition of the global pulp and paper industry corresponds to general worldwide economic conditions, as well as to a number of other factors, including pulp and paper production capacity relative to demand in the geographic markets in which we compete. Although global markets appear to be recovering from the extreme disruptions which began in 2008, uncertainty about continuing economic stability remains. Our business and performance was significantly affected by the global economic crisis and would be negatively affected by a return of economic uncertainty. Uncertainty about global and regional economic conditions negatively affected, and may in the future negatively affect, demand for our customers’ products and for our products, especially our capital equipment products. Also, uncertainty regarding economic conditions has caused, and may in the future cause, liquidity and credit issues for many businesses, including our customers in the pulp and paper industry as well as other industries, and may result in their inability to fund projects, capacity expansion plans, and to some extent, routine operations. These conditions have resulted, and may in the future result, in a number of structural changes in the pulp and paper industry, including decreased spending, mill closures, consolidations, and bankruptcies, all of which negatively affect our business, revenue, and profitability. Any renewed financial and economic turmoil affecting the worldwide economy or the banking system and financial markets, in particular, due to political or economic developments could cause the expectations for our business to differ materially in the future.
Our financial performance will be negatively impacted if there are delays in customers securing financing or our customers become unable to secure such financing. The inability of our customers to obtain credit may affect our ability to recognize revenue and income, particularly on large capital equipment orders from new customers for which we may require letters of credit. We may also be unable to issue letters of credit to our customers, which are required in some cases to guarantee performance, during periods of economic uncertainty.
Paper producers have been, and may in the future be, negatively affected by higher operating costs. Paper companies curtail their capital and operating spending during periods of economic uncertainty and will likely be
7
Table of Contents
| Kadant Inc. | 2010 Annual Report |
cautious about resuming spending as market conditions improve. As paper companies consolidate operations in response to market weakness, they frequently reduce capacity, increase downtime, defer maintenance and upgrades, and postpone or even cancel capacity addition or expansion projects. It is difficult to accurately forecast our revenues and earnings per share during periods of economic uncertainty.
A significant portion of our international sales has, and may in the future, come from China and we operate several manufacturing facilities in China, which exposes us to political, economic, operational and other risks.
We have historically had significant revenues from China, operate significant manufacturing facilities in China, and expect to manufacture and source more of our equipment and components from China in the future. As a result, we are exposed to increased risk in the event of economic slowdowns, changes in the policies of the Chinese government, political unrest, unstable economic conditions, or other developments in China or in U.S.-China relations that are adverse to trade, including enactment of protectionist legislation or trade or currency restrictions. For example, the Chinese premier recently announced plans to target slower economic growth in China in order to avoid inflation and to reduce dependency on exports. Such policies may negatively affect our business in China if customers are unable to expand capacity or obtain financing for expansion or improvement projects.
In addition, orders from customers in China, particularly for large stock-preparation systems that have been tailored to a customer’s specific requirements, have credit risks higher than we generally incur elsewhere, and some orders are subject to the receipt of financing approvals from the Chinese government. For this reason, we do not record signed contracts from customers in China for large stock-preparation systems as orders until we receive the down payments for such contracts. The timing of the receipt of these orders and the down payments are uncertain and there is no assurance that we will be able to recognize revenue on these contracts. Delays in the receipt of payments and letters of credit affect when revenues can be recognized on these contracts, making it difficult to accurately forecast our future financial performance. We may experience a loss if a contract is cancelled prior to the receipt of a down payment in the event we commence engineering or other work associated with the contract. In addition, we may experience a loss if the contract is cancelled, or the customer does not fulfill its obligations under the contract, prior to the receipt of a letter of credit or final payments covering the remaining balance of the contract. In those instances in which a letter of credit is required, it may represent 80% or more of the total order.
We may be unable to expand capacity sufficiently in China to meet current demand.
We experienced a large increase in demand for our stock-preparation products in China in the fourth quarter of 2010 with bookings of nearly $36 million in the quarter. We are implementing a program to meet this demand, which includes expanding our manufacturing capacity in China, hiring additional workers, and accelerating investment in capital equipment. In some cases, we may shift production to our other manufacturing plants outside of China. While we believe that we will meet all of our customer commitments, there can be no assurance that we will be successful, which could expose us to contractual penalties. In addition, the shift to higher-cost production facilities may reduce our gross profit margins on these products. Our business and reputation could be damaged by our inability to perform and our financial performance could suffer as a consequence.
Commodity or component price increases and significant shortages of commodities and component products may adversely impact our financial results or our ability to meet commitments to customers.
We use steel, stainless steel, brass, bronze, and other commodities to manufacture our products. We also use natural gas in the production of our fiber-based granular products. As a result, unanticipated increases in the prices of such commodities could increase our costs more than expected, negatively impacting our business, results of operations and financial condition if we are unable to fully offset the effect of these increased costs through price increases, productivity improvements, or cost reduction programs.
8
Table of Contents
| Kadant Inc. | 2010 Annual Report |
We rely on suppliers to secure commodity and component products required for the manufacture of our products. A disruption in deliveries to or from suppliers or decreased availability of such components or commodities could have an adverse effect on our ability to meet our commitments to customers or increase our operating costs. We believe our sources of raw materials and component products will generally be sufficient for our needs in the foreseeable future. However, our business, results of operations or financial condition could be negatively impacted if supply is insufficient for our operations.
We are dependent on two paper mills for the fiber used in the manufacture of our fiber-based granular products. From time to time we have experienced, and may in the future experience, some difficulty obtaining sufficient raw material to operate at optimal production levels. We continue to work with the mills to ensure a stable supply of raw material. To date, we have been able to meet all of our customer delivery requirements, but there can be no assurance that we will be able to meet future delivery requirements. Although we believe our relationships with the mills are good, the mills could decide not to continue to supply sufficient papermaking byproducts, or may not agree to continue to supply such products on commercially reasonable terms. If the mills were unable or unwilling to supply us sufficient fiber, we would be forced to find one or more alternative sources of supply of this raw material. We may be unable to find alternative supplies on commercially reasonable terms or could incur excessive transportation costs if an alternative supplier were found, which would increase our manufacturing costs, and might prevent prices for our products from being competitive or require closure of this business.
Our business is subject to economic, currency, political, and other risks associated with international sales and operations.
During 2010 and 2009, approximately 58% and 59%, respectively, of our sales were to customers outside the United States, principally in Europe and China. In addition, we operate several manufacturing operations worldwide, including those in China, Europe, Mexico, and Brazil. International revenues and operations are subject to a number of risks, including the following:
| – | agreements may be difficult to enforce and receivables difficult to collect through a foreign country’s legal system, |
| – | foreign customers may have longer payment cycles, |
| – | foreign countries may impose additional withholding taxes or otherwise tax our foreign income, impose tariffs, adopt other restrictions on foreign trade, impose currency restrictions or enact other protectionist or anti-trade measures, |
| – | worsening economic conditions may result in worker unrest, labor actions, and potential work stoppages, |
| – | political unrest, such as that currently occurring in North Africa and the Middle East, may disrupt commercial activities of ours or our customers, |
| – | it may be difficult to repatriate funds, due to unfavorable domestic and foreign tax consequences or other restrictions or limitations imposed by foreign governments, and |
| – | the protection of intellectual property in foreign countries may be more difficult to enforce. |
Although we seek to charge our customers in the same currency in which our operating costs are incurred, fluctuations in currency exchange rates may affect product demand and adversely affect the profitability in U.S. dollars of products we provide in international markets where payment for our products and services is made in their local currencies. In addition, our inability to repatriate funds could adversely affect our ability to service our debt obligations. Any of these factors could have a material adverse impact on our business and results of operations. Furthermore, while some risks can be hedged using derivatives or other financial instruments, or may be insurable, such attempts to mitigate these risks may be costly and not always successful.
9
Table of Contents
| Kadant Inc. | 2010 Annual Report |
We are subject to intense competition in all our markets.
We believe that the principal competitive factors affecting the markets for our products include quality, price, service, technical expertise, and product performance and innovation. Our competitors include a number of large multinational corporations that may have substantially greater financial, marketing, and other resources than we do. As a result, they may be able to adapt more quickly to new or emerging technologies and changes in customer requirements, or to devote greater resources to the promotion and sale of their services and products. Competitors’ technologies may prove to be superior to ours. Our current products, those under development, and our ability to develop new technologies may not be sufficient to enable us to compete effectively. Competition, especially in China, has increased as new companies enter the market and existing competitors expand their product lines and manufacturing operations.
Adverse changes to the soundness of our suppliers and customers could affect our business and results of operations.
All of our businesses are exposed to risk associated with the creditworthiness of our key suppliers and customers, including pulp and paper manufacturers and other industrial customers, many of which may be adversely affected by the volatile conditions in the financial markets, worldwide economic downturns, and difficult economic conditions. These conditions could result in financial instability, bankruptcy, or other adverse effects at any of our suppliers or customers. The consequences of such adverse effects could include the interruption of production at the facilities of our suppliers, the reduction, delay or cancellation of customer orders, delays in or the inability of customers to obtain financing to purchase our products, and bankruptcy of customers or other creditors. Any adverse changes to the soundness of our suppliers or customers may adversely affect our cash flow, profitability and financial condition.
Changes in our effective tax rate may impact our results of operations.
We derive a significant portion of our revenue and earnings from our international operations, and are subject to income and other taxes in the U.S. and numerous foreign jurisdictions. A number of factors may increase our effective tax rate, including: increases in tax rates in various jurisdictions; unanticipated decreases in the amount of profit in jurisdictions with low statutory tax rates; the resolution of issues arising from tax audits with various tax authorities; changes in the valuation of our deferred tax assets and liabilities; adjustments to income taxes upon finalization of various tax returns; increases in expenses not deductible for tax purposes, including impairments of goodwill in connection with acquisitions; changes in available tax credits or our ability to utilize foreign tax credits; and changes in tax laws or the interpretation of such tax laws. Any significant increase in our future effective tax rates would adversely impact our net income for future periods.
We may be required to reorganize our operations in response to changing conditions in the worldwide economy and the pulp and paper industry, and such actions may require significant expenditures and may not be successful.
We have undertaken various restructuring measures in response to changing market conditions in the countries in which we operate and in the pulp and paper industry in general, which have affected our business. We may engage in additional cost reduction programs in the future. We may not recoup the costs of programs we have already initiated, or other programs in which we may decide to engage in the future, the costs of which may be significant. In connection with any future plant closures, delays or failures in the transition of production from existing facilities to our other facilities in other geographic regions could also adversely affect our results of operations. In addition, it is difficult to accurately forecast our financial performance given the continuing uncertainly in the global economic environment, and the efforts we have made or may make to align our cost structure may not be sufficient or able to keep pace with rapidly changing business conditions. Our profitability may decline if our restructuring efforts do not sufficiently reduce our future costs and position us to maintain or increase our sales.
10
Table of Contents
| Kadant Inc. | 2010 Annual Report |
Adverse changes to the soundness of financial institutions could affect us.
We have relationships with many financial institutions, including lenders under our credit facilities and insurance underwriters, and from time to time, we execute transactions with counterparties in the financial industry, such as our interest rate swap arrangements and other hedging transactions. As a consequence of volatility in the financial markets, these financial institutions or counterparties could be adversely affected and we may not be able to access credit facilities in the future, complete transactions as intended, or otherwise obtain the benefit of the arrangements we have entered into with such financial parties, which could adversely affect our business and results of operations.
Our debt may adversely affect our cash flow and may restrict our investment opportunities.
In 2008, we entered into a five-year unsecured revolving credit facility (2008 Credit Agreement) in the aggregate principal amount of up to $75 million. The 2008 Credit Agreement also includes an uncommitted unsecured incremental borrowing facility of up to an additional $75 million. We had $15 million outstanding under the 2008 Credit Agreement as of January 1, 2011 and we have also borrowed additional amounts under other agreements to fund our operations. We may also obtain additional long-term debt and working capital lines of credit to meet future financing needs, which would have the effect of increasing our total leverage. Our indebtedness could have negative consequences, including:
| – | increasing our vulnerability to adverse economic and industry conditions, |
| – | limiting our ability to obtain additional financing, |
| – | limiting our ability to pay dividends on or to repurchase our capital stock, |
| – | limiting our ability to complete a merger or an acquisition, |
| – | limiting our ability to acquire new products and technologies through acquisitions or licensing agreements, and |
| – | limiting our flexibility in planning for, or reacting to, changes in our business and the industries in which we compete. |
Our existing indebtedness bears interest at floating rates and as a result, our interest payment obligations on our indebtedness will increase if interest rates increase. As of January 1, 2011, $17.8 million of our outstanding floating rate debt was hedged through interest rate swap agreements. The unrealized loss associated with these swap agreements was $1.6 million as of January 1, 2011. This unrealized loss represents the estimated amount for which the swap agreements could be settled. The counterparty to the swap agreements could demand an early termination of the swap agreements if we are in default under the 2008 Credit Agreement, or any agreement that amends or replaces the 2008 Credit Agreement in which the counterparty is a member, and we are unable to cure the default. If these swap agreements were terminated prior to the scheduled maturity date and if we were required to pay cash for the value of the swap, we would incur a loss, which would adversely affect our financial results.
Our ability to satisfy our obligations and to reduce our total debt depends on our future operating performance and on economic, financial, competitive, and other factors beyond our control. Our business may not generate sufficient cash flows to meet these obligations or to successfully execute our business strategy. The 2008 Credit Agreement includes certain financial covenants and our failure to comply with these covenants could result in an event of default under the 2008 Credit Agreement, the swap agreements, and our other credit facilities, and would have significant negative consequences for our current operations and our future ability to fund our operations and grow our business. If we are unable to service our debt and fund our business, we may be forced to reduce or delay capital expenditures or research and development expenditures, seek additional financing or equity capital, restructure or refinance our debt, or sell assets.
11
Table of Contents
| Kadant Inc. | 2010 Annual Report |
Restrictions in our 2008 Credit Agreement may limit our activities.
Our 2008 Credit Agreement contains, and future debt instruments to which we may become subject may contain, restrictive covenants that limit our ability to engage in activities that could otherwise benefit us, including restrictions on our ability and the ability of our subsidiaries to:
| – | incur additional indebtedness, |
| – | pay dividends on, redeem, or repurchase our capital stock, |
| – | make investments, |
| – | create liens, |
| – | sell assets, |
| – | enter into transactions with affiliates, and |
| – | consolidate, merge, or transfer all or substantially all of our assets and the assets of our subsidiaries. |
We are also required to meet specified financial covenants under the terms of our 2008 Credit Agreement. Our ability to comply with these financial restrictions and covenants is dependent on our future performance, which is subject to prevailing economic conditions and other factors, including factors that are beyond our control such as currency exchange rates, interest rates, changes in technology, and changes in the level of competition. Our failure to comply with any of these restrictions or covenants may result in an event of default under our 2008 Credit Agreement and other loan obligations, which could permit acceleration of the debt under those instruments and require us to repay the debt before its scheduled due date. If an event of default were to occur, we might not have sufficient funds available to make the payments required under our indebtedness. If we are unable to repay amounts owed under our debt agreements, those lenders may be entitled to foreclose on and sell the collateral that secures our borrowings under the agreements.
The inability of Composites LLC to pay claims against it has exposed us to litigation, which if we are unable to successfully defend, could have a material adverse effect on our consolidated financial results.
On October 21, 2005, our Composites LLC subsidiary sold substantially all of its assets to a third party and retained certain liabilities associated with the operation of the business prior to the sale, including warranty obligations related to products manufactured prior to the sale date (Retained Liabilities). Composites LLC retained all of the cash proceeds received from the asset sale in 2005 and continued to administer and pay warranty claims from the sale proceeds into the third quarter of 2007, when it announced that it no longer had sufficient funds to honor warranty claims, was unable to pay or process warranty claims, and ceased doing business.
Composites LLC, jointly and severally with its parent company Kadant Inc., agreed to indemnify the original buyer and a subsequent purchaser of the business against losses arising from claims associated with the Retained Liabilities. This indemnification obligation is contractually limited to approximately $8.4 million. All activity related to this business is classified in the results of the discontinued operation in our consolidated financial statements.
We were previously named as co-defendants, together with Composites LLC and two other defendants, in several state class action complaints and one federal class action complaint filed in 2008 and 2009, as disclosed in our prior filings. These complaints sought to recover damages allegedly associated with the composite building products manufactured by Composites LLC between April 2002 and October 2003. This litigation has been dismissed, in the case of the federal class action, and voluntarily withdrawn without prejudice by the state plaintiffs. We continue to discuss with these plaintiffs potential alternative dispute resolution or other settlement of these matters. There can be no assurance that the parties will reach a resolution on terms satisfactory to the parties, or that these or other plaintiffs will not file new complaints against us or the other parties indemnified by Composites LLC. While we believe any such asserted or possible claims against us or other indemnified parties would be without merit, the cost of litigation and the outcome, including any settlement, could adversely affect our consolidated financial results.
12
Table of Contents
| Kadant Inc. | 2010 Annual Report |
An increase in the accrual for warranty costs of the discontinued operation adversely affects our consolidated financial results.
The discontinued operation has experienced significant liabilities associated with warranty claims related to its composite decking products manufactured prior to the sale of the business in 2005. The accrued warranty costs of the discontinued operation as of January 1, 2011 represents the low end of the estimated range of warranty costs based on the level of claims received before Composites LLC ceased operations and judgments entered against it in litigation. Composites LLC has calculated that the total potential warranty cost ranges from $2.1 million to approximately $13.1 million. The high end of the range represents the estimated maximum level of warranty claims remaining based on the total sales of the products under warranty. On September 30, 2007, the discontinued operation ceased doing business and has no employees or other service providers to collect or process warranty claims. Composites LLC will continue to record adjustments to accrued warranty costs to reflect the minimum amount of the potential range of loss for products under warranty based on any judgments entered against it in litigation, which will adversely affect our consolidated results.
Our inability to successfully identify and complete acquisitions or successfully integrate any new or previous acquisitions could have a material adverse effect on our business.
Our strategy includes the acquisition of technologies and businesses that complement or augment our existing products and services. Any such acquisition involves numerous risks that may adversely affect our future financial performance and cash flows. These risks include:
| – | competition with other prospective buyers resulting in our inability to complete an acquisition or in us paying substantial premiums over the fair value of the net assets of the acquired business, |
| – | inability to obtain regulatory approval, including antitrust approvals, |
| – | difficulty in assimilating operations, technologies, products and the key employees of the acquired business, |
| – | inability to maintain existing customers or to sell the products and services of the acquired business to our existing customers, |
| – | diversion of management’s attention away from other business concerns, |
| – | inability to improve the revenues and profitability or realize the cost savings and synergies expected in the acquisition, |
| – | assumption of significant liabilities, some of which may be unknown at the time, |
| – | potential future impairment of the value of goodwill and intangible assets acquired, and |
| – | identification of internal control deficiencies of the acquired business. |
In 2008, we recorded a $40.3 million impairment charge to write down the goodwill associated with the stock-preparation reporting unit within our Papermaking Systems segment. We may incur additional impairment charges to write down the value of our goodwill and acquired intangible assets in the future if the assets are not deemed recoverable, which could have a material adverse effect on our operating results.
Our inability to protect our intellectual property could have a material adverse effect on our business. In addition, third parties may claim that we infringe their intellectual property, and we could suffer significant litigation or licensing expense as a result.
We seek patent and trade secret protection for significant new technologies, products, and processes because of the length of time and expense associated with bringing new products through the development process and into the marketplace. We own numerous U.S. and foreign patents, and we intend to file additional applications, as appropriate, for patents covering our products. Patents may not be issued for any pending or future patent applications owned by or licensed to us, and the claims allowed under any issued patents may not be sufficiently broad to protect our technology. Any issued patents owned by or licensed to us may be challenged, invalidated, or circumvented, and the rights under these patents may not provide us with competitive advantages. In addition,
13
Table of Contents
| Kadant Inc. | 2010 Annual Report |
competitors may design around our technology or develop competing technologies. Intellectual property rights may also be unavailable or limited in some foreign countries, which could make it easier for competitors to capture increased market share. We could incur substantial costs to defend ourselves in suits brought against us, including for alleged infringement of third party rights, or in suits in which we may assert our intellectual property rights against others. An unfavorable outcome of any such litigation could have a material adverse effect on our business and results of operations. In addition, as our patents expire, we rely on trade secrets and proprietary know-how to protect our products. We cannot be sure the steps we have taken or will take in the future will be adequate to deter misappropriation of our proprietary information and intellectual property. Of particular concern are developing countries, such as China, where the laws, courts, and administrative agencies may not protect our intellectual property rights as fully as in the United States or Europe.
We seek to protect trade secrets and proprietary know-how, in part, through confidentiality agreements with our collaborators, employees, and consultants. These agreements may be breached, we may not have adequate remedies for any breach, and our trade secrets may otherwise become known or be independently developed by our competitors, or our competitors may otherwise gain access to our intellectual property.
Our share price will fluctuate.
Stock markets in general and our common stock in particular experienced significant price and volume volatility during 2008 and 2009 and may experience significant price and volume volatility from time to time in the future. The market price and trading volume of our common stock may continue to be subject to significant fluctuations due not only to general stock market conditions but also to a change in sentiment in the market regarding our operations, business prospects, or future funding. Given the nature of the markets in which we participate and the impact of accounting standards related to revenue recognition, we may not be able to reliably predict future revenues and profitability, and unexpected changes may cause us to adjust our operations. A large proportion of our costs are fixed, due in part to our significant selling, research and development, and manufacturing costs. Thus, small declines in revenues could disproportionately affect our operating results. Other factors that could affect our share price and quarterly operating results include:
| – | failure of our products to pass contractually agreed upon acceptance tests, which would delay or prohibit recognition of revenues under applicable accounting guidelines, |
| – | changes in the assumptions used for revenue recognized under the percentage-of-completion method of accounting, |
| – | fluctuations in revenues due to customer-initiated delays in product shipments, |
| – | failure of a customer, particularly in Asia, to comply with an order’s contractual obligations or inability of a customer to provide financial assurances of performance, |
| – | adverse changes in demand for and market acceptance of our products, |
| – | competitive pressures resulting in lower sales prices for our products, |
| – | adverse changes in the pulp and paper industry, |
| – | delays or problems in our introduction of new products, |
| – | delays or problems in the manufacture of our products, |
| – | our competitors’ announcements of new products, services, or technological innovations, |
| – | contractual liabilities incurred by us related to guarantees of our product performance, |
| – | increased costs of raw materials or supplies, including the cost of energy, |
| – | changes in the timing of product orders, |
| – | fluctuations in our effective tax rate, |
| – | the operating and share price performance of companies that investors consider to be comparable to us, and |
| – | changes in global financial markets and global economies and general market conditions. |
14
Table of Contents
| Kadant Inc. | 2010 Annual Report |
Anti-takeover provisions in our charter documents, under Delaware law, and in our shareholder rights plan could prevent or delay transactions that our shareholders may favor.
Provisions of our charter and bylaws may discourage, delay, or prevent a merger or acquisition that our shareholders may consider favorable, including transactions in which shareholders might otherwise receive a premium for their shares. For example, these provisions:
| – | authorize the issuance of “blank check” preferred stock without any need for action by shareholders, |
| – | provide for a classified board of directors with staggered three-year terms, |
| – | require supermajority shareholder voting to effect various amendments to our charter and bylaws, |
| – | eliminate the ability of our shareholders to call special meetings of shareholders, |
| – | prohibit shareholder action by written consent, and |
| – | establish advance notice requirements for nominations for election to our board of directors or for proposing matters that can be acted on by shareholders at shareholder meetings. |
In addition, our board of directors adopted a shareholder rights plan in 2001 intended to protect shareholders in the event of an unfair or coercive offer to acquire our company and to provide our board of directors with adequate time to evaluate unsolicited offers. Preferred stock purchase rights have been distributed to our common shareholders pursuant to the rights plan. This rights plan may have anti-takeover effects. The rights plan will cause substantial dilution to a person or group that attempts to acquire us on terms that our board of directors does not believe are in our best interests and those of our shareholders and may discourage, delay, or prevent a merger or acquisition that shareholders may consider favorable, including transactions in which shareholders might otherwise receive a premium for their shares. The shareholder rights plan will expire in July 2011 and our board of directors does not intend to renew it at this time.
| Item 1B. | Unresolved Staff Comments |
Not applicable.
| Item 2. | Properties |
We believe that our facilities are in good condition and are suitable and adequate for our present operations. We do not anticipate significant difficulty in obtaining lease renewals or alternative space as needed. The location and general character of our principal properties as of year-end 2010 are as follows:
Papermaking Systems
We own approximately 1,715,000 square feet and lease approximately 133,000 square feet, under leases expiring on various dates ranging from 2011 to 2022, of manufacturing, engineering, and office space. In addition, in China we lease the land associated with our buildings under long-term leases, which expire on dates ranging from 2044 to 2054. Our principal engineering and manufacturing facilities are located in Vitry-le-Francois, France; Jining, China; Three Rivers, Michigan, U.S.A; Auburn, Massachusetts, U.S.A; Yanzhou, China; Theodore, Alabama, U.S.A; Weesp, The Netherlands; Wuxi, China; Hindas, Sweden; Guadalajara, Mexico; Bury, England; Sao Paulo, Brazil; Mason, Ohio, U.S.A; and Summerstown, Ontario, Canada.
Fiber-based Products
We own approximately 31,000 square feet of manufacturing and office space located in Green Bay, Wisconsin. We also lease approximately 25,000 square feet of manufacturing space located in Green Bay, Wisconsin, on a tenant-at-will basis.
Corporate
We lease approximately 10,000 square feet in Westford, Massachusetts, for our corporate headquarters under a lease expiring in 2017.
15
Table of Contents
| Kadant Inc. | 2010 Annual Report |
| Item 3. | Legal Proceedings |
Not applicable.
| Item 4. | Reserved |
PART II
| Item 5. | Market for Registrant’s Common Equity, Related Stockholder Matters, and Issuer Purchases of Equity Securities |
Market Price of Common Stock
Our common stock trades on the New York Stock Exchange under the symbol “KAI”. The closing market price on the New York Stock Exchange for our common stock on February 18, 2011, was $21.94 per share.
The following table sets forth the high and low sales prices of our common stock for 2010 and 2009, as reported in the consolidated transaction reporting system.
| 2010 | 2009 | |||||||||||||||
| Quarter |
High | Low | High | Low | ||||||||||||
| First |
$ | 17.46 | $ | 13.24 | $ | 14.13 | $ | 6.50 | ||||||||
| Second |
22.77 | 14.57 | 14.88 | 10.05 | ||||||||||||
| Third |
19.98 | 15.97 | 14.31 | 8.99 | ||||||||||||
| Fourth |
24.44 | 18.29 | 16.91 | 11.90 | ||||||||||||
Holders of Common Stock
As of February 18, 2011, we had approximately 4,438 holders of record of our common stock. This does not include holdings in street or nominee name.
Dividend Policy
We have never declared or paid cash dividends and we do not at this time expect to pay cash dividends in the foreseeable future because our policy has been to use earnings to finance expansion and growth, as well as repurchase our stock. Payment of dividends will rest within the discretion of the board of directors and will depend upon, among other factors, our earnings, capital requirements, and financial condition. Our ability to pay dividends is restricted by the terms of our 2008 Credit Agreement.
Issuer Purchases of Equity Securities
We did not repurchase any of our common stock in the fourth quarter of 2010.
16
Table of Contents
| Kadant Inc. | 2010 Annual Report |
Performance Graph
This performance graph compares the cumulative, five-year total shareholder return assuming an investment of $100 (and the reinvestment of dividends) in our common stock, the Russell 3000 Stock Index and the Dow Jones U.S. Paper Total Stock Market (TSM) Index. Our common stock trades on the New York Stock Exchange under the ticker symbol “KAI.” Because our fiscal year ends on a Saturday, the graph uses the last trading day of our fiscal year.
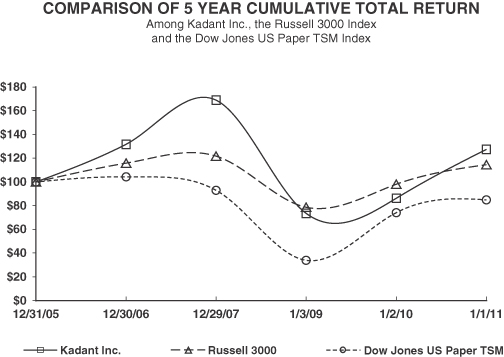
| 12/31/05 | 12/30/06 | 12/29/07 | 1/3/09 | 1/2/10 | 1/1/11 | |||||||||||||||||||
| Kadant Inc. |
100.00 | 131.78 | 168.76 | 73.41 | 86.27 | 127.41 | ||||||||||||||||||
| Russell 3000 |
100.00 | 115.71 | 121.66 | 78.58 | 97.89 | 114.46 | ||||||||||||||||||
| Dow Jones U.S. Paper Total Stock Market |
100.00 | 104.09 | 93.01 | 33.78 | 74.10 | 84.90 | ||||||||||||||||||
The information included under the heading “Performance Graph” in Item 5 of this Annual Report on Form 10-K is “furnished” and not “filed” and shall not be deemed to be “soliciting material” or subject to Regulation 14A , shall not be deemed “filed” for purposes of Section 18 of the Securities Exchange Act of 1934, as amended (the “Exchange Act”), or otherwise subject to the liabilities of that section, nor shall it be deemed incorporated by reference in any filing under the Securities Act of 1933, as amended, or the Exchange Act.
17
Table of Contents
| Kadant Inc. | 2010 Annual Report |
| Item 6. | Selected Financial Data |
| (In thousands, except per share amounts) |
2010 (a) | 2009 (b) | 2008 (c) | 2007 | 2006 | |||||||||||||||
| Statement of Operations Data |
||||||||||||||||||||
| Revenues |
$ | 270,029 | $ | 225,565 | $ | 329,158 | $ | 366,496 | $ | 341,613 | ||||||||||
| Operating Income (Loss) |
24,949 | (474 | ) | (13,007 | ) | 37,038 | 29,442 | |||||||||||||
| Amounts Attributable to Kadant: |
||||||||||||||||||||
| Income (Loss) from Continuing Operations |
18,409 | (5,906 | ) | (22,595 | ) | 25,418 | 18,281 | |||||||||||||
| Income (Loss) from Discontinued Operation, Net of Tax |
98 | (18 | ) | 37 | (2,750 | ) | (1,184 | ) | ||||||||||||
| Net Income (Loss) |
$ | 18,507 | $ | (5,924 | ) | $ | (22,558 | ) | $ | 22,668 | $ | 17,097 | ||||||||
| Earnings (Loss) per Share for Continuing Operations: |
||||||||||||||||||||
| Basic |
$ | 1.49 | $ | (.48 | ) | $ | (1.67 | ) | $ | 1.80 | $ | 1.32 | ||||||||
| Diluted |
$ | 1.48 | $ | (.48 | ) | $ | (1.67 | ) | $ | 1.78 | $ | 1.30 | ||||||||
| Earnings (Loss) per Share: |
||||||||||||||||||||
| Basic |
$ | 1.50 | $ | (.48 | ) | $ | (1.67 | ) | $ | 1.61 | $ | 1.24 | ||||||||
| Diluted |
$ | 1.48 | $ | (.48 | ) | $ | (1.67 | ) | $ | 1.59 | $ | 1.21 | ||||||||
| Balance Sheet Data |
||||||||||||||||||||
| Working Capital (d) |
$ | 79,006 | $ | 66,917 | $ | 98,017 | $ | 107,487 | $ | 80,542 | ||||||||||
| Total Assets |
336,772 | 307,656 | 356,917 | 437,069 | 393,085 | |||||||||||||||
| Long-Term Obligations |
17,250 | 22,750 | 52,122 | 30,460 | 44,652 | |||||||||||||||
| Shareholders’ Investment |
207,301 | 194,031 | 194,393 | 280,213 | 238,982 | |||||||||||||||
| (a) | Reflects a $1.0 million pre-tax gain on the sale of real estate, a $0.2 million pre-tax curtailment gain, and $0.2 million of pre-tax restructuring costs. |
| (b) | Reflects $4.4 million of pre-tax restructuring costs. |
| (c) | Reflects a $40.3 million pre-tax goodwill impairment charge, a $15.4 million tax provision related to applying a valuation allowance to certain deferred tax assets, and $2.0 million of pre-tax restructuring costs, net of gains. |
| (d) | Includes ($2.0) million, ($1.9) million, ($1.9) million, ($1.1) million, and $3.0 million in 2010, 2009, 2008, 2007, and 2006, respectively, associated with the discontinued operation. |
| Item 7. | Management’s Discussion and Analysis of Financial Condition and Results of Operations |
Reference is made throughout this Management’s Discussion and Analysis of Financial Condition and Results of Operations to Notes included in our consolidated financial statements beginning on page F-1 of this Report.
Overview
Company Overview
We are a leading supplier of equipment used in the global papermaking and paper recycling industries and a manufacturer of granules made from papermaking byproducts. Our continuing operations are comprised of one reportable operating segment: Papermaking Systems, and a separate product line, Fiber-based Products. Through our Papermaking Systems segment, we develop, manufacture, and market a range of equipment and products for the global papermaking and paper recycling industries. We have a large customer base that includes most of the world’s major paper manufacturers. We believe our large installed base provides us with a spare parts and consumables business that yields higher margins than our capital equipment business.
18
Table of Contents
| Kadant Inc. | 2010 Annual Report |
Through our Fiber-based Products business, we manufacture and sell granules derived from pulp fiber for use as carriers for agricultural, home lawn and garden, and professional lawn, turf and ornamental applications, as well as for oil and grease absorption.
International Sales
During 2010 and 2009, approximately 58% and 59%, respectively, of our sales were to customers outside the United States, principally in Europe and China. We generally seek to charge our customers in the same currency in which our operating costs are incurred. However, our financial performance and competitive position can be affected by currency exchange rate fluctuations affecting the relationship between the U.S. dollar and foreign currencies. We seek to reduce our exposure to currency fluctuations through the use of forward currency exchange contracts. We may enter into forward contracts to hedge certain firm purchase and sale commitments denominated in currencies other than our subsidiaries’ functional currencies. These contracts hedge transactions principally denominated in U.S. dollars.
Application of Critical Accounting Policies and Estimates
The discussion and analysis of our financial condition and results of operations are based upon our consolidated financial statements, which have been prepared in accordance with accounting principles generally accepted in the United States. The preparation of these consolidated financial statements requires us to make estimates and assumptions that affect the reported amounts of assets and liabilities, disclosure of contingent assets and liabilities at the date of our consolidated financial statements, and the reported amounts of revenues and expenses during the reporting period. Our actual results may differ from these estimates under different assumptions or conditions.
Critical accounting policies are defined as those that entail significant judgments and uncertainties, and could potentially result in materially different results under different assumptions and conditions. We believe that our most critical accounting policies upon which our financial position depends, and which involve the most complex or subjective decisions or assessments, are those described below. For a discussion on the application of these and other accounting policies, see Note 1 in the Notes to consolidated financial statements.
Revenue Recognition and Accounts Receivable. We enter into arrangements with customers that have multiple deliverables, such as equipment and installation, and we recognize revenues and profits on certain long-term contracts using the percentage-of-completion method of accounting.
| • | Percentage-of-Completion. Revenues recorded under the percentage-of-completion method of accounting pursuant to Accounting Standards Codification (ASC) 605, “Revenue Recognition” (ASC 605), were $26.1 million in 2010, $32.0 million in 2009, and $58.1 million in 2008. We determine the percentage of completion by comparing the actual costs incurred to date to an estimate of total costs to be incurred on each contract. If a loss is indicated on any contract in process, a provision is made currently for the entire loss. Our contracts generally provide for billing of customers upon the attainment of certain milestones specified in each contract. Revenues earned on contracts in process in excess of billings are classified as unbilled contract costs and fees, and amounts billed in excess of revenues are classified as billings in excess of contract costs and fees. The estimation process under the percentage-of-completion method affects the amounts reported in our consolidated financial statements. A number of internal and external factors affect our percentage-of-completion and cost of sales estimates, including labor rate and efficiency variances, estimates of warranty costs, estimated future material prices from vendors, and customer specification and testing requirements. In addition, we are exposed to the risk, primarily relating to our orders in China, that a customer will not comply with the order’s contractual obligations to take delivery of the equipment. The contractual obligations relating to the order may be difficult to enforce through a foreign country’s legal system, which could result in a significant credit exposure in the period or periods that were to be affected by the breach of contract. Although we make every effort to ensure the accuracy of our estimates in the application of |
19
Table of Contents
| Kadant Inc. | 2010 Annual Report |
| this accounting policy, if our actual results differed from our estimates, or if we were to use different assumptions, it is possible that materially different amounts could be reported as revenues in our consolidated financial statements. |
| • | Other Revenue Recognition Methods. Under ASC 605, when the terms of sale include customer acceptance provisions, and compliance with those provisions cannot be demonstrated until customer acceptance, we recognize revenues upon such acceptance. When a sale arrangement involves multiple elements, such as equipment and installation, we consider the guidance in ASC 605. Such transactions are evaluated to determine whether the deliverables in the arrangement represent separate units of accounting. If equipment and installation do not meet the separation criteria under ASC 605, revenues for products sold that require installation, for which the installation is essential to functionality or is not deemed inconsequential or perfunctory, are recognized upon completion of installation. Revenues for products sold where installation is not essential to functionality, and is deemed inconsequential or perfunctory, are recognized upon shipment, with estimated installation costs accrued. We provide a reserve for the estimated warranty and installation costs at the time revenue is recognized, as applicable. To the extent that installation becomes a significant component of our business in the future, the judgment associated with the determination of revenue recognition will increase. The complexity of all issues related to the assumptions, risks, and uncertainties inherent in the application of ASC 605 affects the amounts reported as revenues in our consolidated financial statements. Under ASC 605, we may not be able to reliably predict future revenues and profitability due to the difficulty of estimating when installation will be performed or when we will meet the contractually agreed upon performance tests, which can delay or prohibit recognition of revenues. The determination of when we install the equipment or fulfill the performance guarantees is largely dependent on our customers, their willingness to allow installation of the equipment or performance of the appropriate tests in a timely manner, and their cooperation in addressing possible problems that would impede achievement of the performance guarantee criteria. Unexpected changes in the timing related to the completion of installation or performance guarantees could cause our revenues and earnings to be significantly affected. |
We exercise judgment in determining our allowance for bad debts, which is based on our historical collection experience, current trends, credit policies, specific customer collection issues, and accounts receivable aging categories. In determining this allowance, we look at historical writeoffs of our receivables. We also look at current trends in the credit quality of our customer base as well as changes in our credit policies. We perform ongoing credit evaluations of our customers and adjust credit limits based upon payment history and each customer’s current creditworthiness. We continuously monitor collections and payments from our customers. In addition, in some instances we utilize letters of credit as a way to mitigate credit exposure. While actual bad debts have historically been within our expectations and the provisions established, we cannot guarantee that we will continue to experience the same rate of bad debts that we have had in the past. A significant change in the liquidity or financial position of any of our customers could result in the uncollectibility of the related accounts receivable and could adversely affect our operating results and cash flows in that period.
Warranty Obligations for Continuing Operations. We offer warranties of various durations to our customers depending upon the specific product and terms of the customer purchase agreement. We typically negotiate terms regarding warranty coverage and length of warranty depending on the products and their applications. Our standard mechanical warranties require us to repair or replace a defective product during the warranty period at no cost to the customer. We record an estimate for warranty-related costs at the time of sale based on our actual historical occurrence rates and repair costs, as well as other analytical tools for estimating future warranty claims. These estimates are revised for variances between actual and expected claims rates. While our warranty costs have historically been within our expectations and the provisions established, we cannot guarantee that we will continue to experience the same warranty return rates or repair costs that we have in the past.
20
Table of Contents
| Kadant Inc. | 2010 Annual Report |
A significant increase in warranty occurrence rates or costs to repair our products would lead to an increase in the warranty provision and could have a material adverse impact on our consolidated results for the period or periods in which such returns or additional costs occur.
Warranty Obligations for Discontinued Operation. In 2005, our Kadant Composites LLC subsidiary (Composites LLC) sold substantially all of its assets to a third party and retained certain liabilities associated with the operation of the business prior to the sale, including warranty obligations related to products manufactured prior to the sale date. On September 30, 2007, Composites LLC ceased doing business. All activity related to this business is classified in the results of the discontinued operation in the accompanying consolidated financial statements.
Composites LLC records adjustments to accrued warranty costs to reflect the minimum amount of the potential range of loss for products under warranty based on judgments entered against it in litigation, if any. As of January 1, 2011 and January 2, 2010, the accrued warranty costs associated with the composites business were $2.1 million, which represent the low end of the range of potential loss for products under warranty based on the level of claims received before Composites LLC ceased operations and judgments entered against it in litigation. Composites LLC has calculated that the potential warranty cost ranges from $2.1 million to approximately $13.1 million. The high end of the range represents the estimated maximum level of warranty claims remaining based on the total sales of the products under warranty.
Income Taxes. We operate in numerous countries under many legal forms and, as a result, are subject to the jurisdiction of numerous domestic and non-U.S. tax authorities, as well as to tax agreements and treaties among these governments. Determination of taxable income in any jurisdiction requires the interpretation of the related tax laws and regulations and the use of estimates and assumptions regarding significant future events, such as the amount, timing and character of deductions, permissible revenue recognition methods under the tax law and the sources and character of income and tax credits. Changes in tax laws, regulations, agreements and treaties, currency-exchange restrictions or our level of operations or profitability in each taxing jurisdiction could have an impact upon the amount of current and deferred tax balances and our results of operations.
We estimate the degree to which tax assets and loss carryforwards will result in a benefit based on expected profitability by tax jurisdiction, and provide a valuation allowance for tax assets and loss carryforwards that we believe will more likely than not go unused. If it were to become more likely than not that the tax assets or loss carryforwards would be used, we would reverse the related valuation allowance. Our tax valuation allowance totaled $25.9 million at year-end 2010, including $11.4 million in the U.S. and $14.5 million in foreign jurisdictions. Should our actual future taxable income by tax jurisdiction vary from our estimate, additional allowances or reversals thereof may be necessary. When assessing the need for a valuation allowance in a tax jurisdiction, we evaluate the weight of all available evidence to determine whether it is more likely than not that some portion or all of the deferred income tax assets will not be realized. As part of this evaluation, we consider our cumulative three-year history of earnings before income taxes, taxable income in prior carryback years, future reversals of existing taxable temporary differences, prudent and feasible tax planning strategies, and expected future results of operations. As of year-end 2010, we were in a three-year cumulative income position in the U.S.; however, due to the uncertainty of profitability in future periods we maintained a full valuation allowance in the U.S. Assuming, among other positive and negative factors, that we meet our estimates of 2011 forecasted earnings in the U.S., we may release a portion of our U.S. valuation allowance during 2011. Our full valuation allowance in certain foreign jurisdictions was maintained as of year-end 2010 as a result of the foreign subsidiaries being in a three-year cumulative loss position and the uncertainty of future profitability. Assuming, among other positive and negative factors, that certain of our foreign subsidiaries meet their estimates of 2011 forecasted earnings, these foreign jurisdictions would be in a three-year cumulative income position and a portion of the foreign valuation allowance may be released during 2011.
We provide a liability for future income tax payments in the worldwide tax jurisdictions in which we operate. Should tax return positions that we expect are sustainable not be sustained upon audit, we could be required to record an incremental tax provision for such taxes. Should previously unrecognized tax benefits be sustained, a reduction in our tax provision would result.
21
Table of Contents
| Kadant Inc. | 2010 Annual Report |
We reinvest certain earnings of foreign operations indefinitely and, accordingly, we do not provide for income taxes that could result from the remittance of such earnings.
In the ordinary course of business there is inherent uncertainty in quantifying our income tax positions. It is our policy to provide for uncertain tax positions and the related interest and penalties based upon our assessment of whether a tax benefit is more likely than not to be sustained upon examination by tax authorities. At January 1, 2011, we believe that we have appropriately accounted for any unrecognized tax benefits. To the extent we prevail in matters for which a liability for an unrecognized tax benefit is established or are required to pay amounts in excess of the liability, our effective tax rate in a given financial statement period may be affected.
Valuation of Goodwill and Intangible Assets. We evaluate the recoverability of goodwill and indefinite-lived intangible assets as of the end of each fiscal year, or more frequently if events or changes in circumstances, such as a decline in sales, earnings, or cash flows, or material adverse changes in the business climate, indicate that the carrying value of an asset might be impaired. Goodwill is considered to be impaired when the net book value of a reporting unit exceeds its estimated fair value. Fair values are primarily established using a discounted cash flow methodology (specifically, the income approach). The determination of discounted cash flows is based on our long-range forecasts and requires assumptions related to revenue and operating income growth, asset-related expenditures, working capital levels, and other factors. The revenue growth rates included in the forecasts are our best estimates based on current and anticipated market conditions, and the profitability assumptions are projected based on current and anticipated cost structures. Long-range forecasting involves uncertainty which increases with each successive period. Key assumptions, such as revenue growth rates and profitability, especially in the outer years involve a greater degree of uncertainty. Intangible assets subject to amortization are evaluated for impairment if events or changes in circumstances indicate that the carrying value of an asset might be impaired. No adjustment was required in 2010 or 2009 to the carrying value of our goodwill or intangible assets subject to amortization based on the analyses performed.
During the fourth quarter of 2008, we experienced a significant decline in our stock price. As a result of the decline in our stock price, our market capitalization fell significantly below the recorded value of our consolidated net assets. The reduced market capitalization reflected, in part, the then current economic climate, which led to weakness in demand for some of our products. The forecasts utilized in the 2008 impairment test reflected an anticipated decline in stock-preparation sales, especially in China, which we expected would occur over the next several years given the then current economic environment and its impact on paper producers. The impairment test performed as of year-end 2008 indicated the carrying amounts of goodwill for the stock-preparation reporting unit within our Papermaking Systems segment exceeded its implied fair value, and as a result, we recorded a $40.3 million pre-tax ($26.7 million after-tax) non-cash impairment charge to write down the goodwill associated with this reporting unit. The goodwill impairment test indicated that the estimated fair value of goodwill and indefinite-lived intangible assets associated with its other reporting units (doctoring, water management, and fluid-handling) exceeded their carrying value and, as a result, no adjustment to goodwill was required for these reporting units. No adjustment was required in 2008 to the carrying value of our intangible assets subject to amortization based on the analysis performed.
Our judgments and assumptions regarding the determination of the fair value of an intangible asset or goodwill associated with an acquired business could change as future events impact such fair values. A prolonged economic downturn, weakness in demand for our products, especially capital equipment products, or contraction in capital spending by paper companies in our key markets, such as China, could negatively affect the revenue and profitability assumptions used in our assessment of goodwill and intangible assets, which could result in additional impairment charges. Any future impairment loss could have a material adverse affect on our long-term assets and operating expenses in the period in which an impairment is determined to exist.
Inventories. We value our inventory at the lower of the actual cost (on a first-in, first-out; or weighted average basis) or market value and include materials, labor, and manufacturing overhead. We regularly review inventory quantities on hand and compare these amounts to historical and forecasted usage of and demand for each particular product or product line. We record a charge to cost of revenues for excess and obsolete inventory to reduce the carrying value of the inventories to net realizable value. Inventory writedowns have historically been within our expectations and the provisions established. A significant decrease in demand for our products
22
Table of Contents
| Kadant Inc. | 2010 Annual Report |
could result in an increase in the amount of excess inventory quantities on hand, resulting in a charge for the writedown of that inventory in that period. In addition, our estimates of future product usage or demand may prove to be inaccurate, resulting in an understated or overstated provision for excess and obsolete inventory. Therefore, although we make every effort to ensure the accuracy of our forecasts of future product usage and demand, any significant unanticipated changes in demand or technological developments could have a significant impact on the value of our inventory and our reported operating results.
Pension and Other Retiree Benefits. We sponsor a noncontributory defined benefit retirement plan for the benefit of eligible employees at our Kadant Solutions division and the corporate office. Our unfunded benefit obligation related to this plan totaled $2.8 million at year-end 2010 and the fair value of plan assets totaled $24.0 million. In addition, several of our U.S. and non-U.S. subsidiaries sponsor defined benefit pension and other retiree benefit plans with an aggregate unfunded benefit obligation of $4.0 million at year-end 2010.
The cost and obligations of these arrangements are calculated using many assumptions to estimate the benefits that the employee earns while working, the amount of which cannot be completely determined until the benefit payments cease. Major assumptions used in the accounting for these employee benefit plans include the discount rate, expected return on plan assets and rate of increase in employee compensation levels. Assumptions are determined based on Company data and appropriate market indicators in consultation with third-party actuaries, and are evaluated each year as of the plans’ measurement date. The fair value of plan assets is determined based on quoted market prices and observable market inputs. The unrecognized actuarial loss associated with these plans totaled $8.5 million at year-end 2010, $0.3 million of which we expect to recognize in 2011. Should any of these assumptions change, they would have an effect on net periodic pension costs and the unfunded benefit obligation. The projected benefit obligation and expense associated with these plans are sensitive to changes in the discount rate. For the noncontributory benefit retirement plan at our Kadant Solutions division, a 50 basis point decrease in the 2010 discount rate would have resulted in an increase in pension expense of $0.1 million and an increase in the projected benefit obligation of $1.3 million.
Derivatives. We use derivative instruments primarily to reduce our exposure to changes in currency exchange rates and interest rates. When we enter into a derivative contract, we make a determination as to whether the transaction is deemed to be a hedge for accounting purposes. For contracts deemed to be a hedge, we formally document the relationship between the derivative instrument and the risk being hedged. In this documentation, we specifically identify the asset, liability, forecasted transaction, cash flow, or net investment that has been designated as the hedged item, and evaluate whether the derivative instrument is expected to reduce the risks associated with the hedged item. To the extent these criteria are not met, we do not use hedge accounting for the derivative.
ASC 815, “Derivatives and Hedging,” requires that all derivatives be recognized on the balance sheet at fair value. For derivatives designated as cash flow hedges, the related gains or losses on these contracts are deferred as a component of accumulated other comprehensive items. These deferred gains and losses are recognized in the period in which the underlying anticipated transaction occurs. For derivatives designated as fair value hedges, the unrealized gains and losses resulting from the impact of currency exchange rate movements are recognized in earnings in the period in which the exchange rates change and offset the currency gains and losses on the underlying exposures being hedged. We perform an evaluation of the effectiveness of the hedge both at inception and on an ongoing basis. The ineffective portion of a hedge, if any, and changes in the fair value of a derivative not deemed to be a hedge, are recorded in the consolidated statement of operations.
We use interest rate swap agreements to hedge our exposure to variable rate debt and have designated these agreements as cash flow hedges of the forecasted interest payments. The fair values of the interest rate swap agreements are included in other assets for unrecognized gains and in other liabilities for unrecognized losses, with an offset in accumulated other comprehensive items (net of tax).
We use forward currency-exchange contracts primarily to hedge certain operational (“cash flow” hedges) and balance sheet (“fair value” hedges) exposures resulting from fluctuations in currency exchange rates. Such exposures primarily result from portions of our operations and assets that are denominated in currencies other than the functional currencies of the businesses conducting the operations or holding the assets. As part of our overall strategy to manage the level of exposure to the risk of currency-exchange fluctuations, some of our
23
Table of Contents
| Kadant Inc. | 2010 Annual Report |
subsidiaries hedge a portion of their currency exposures anticipated over the ensuing 12-month period, using forward currency-exchange contracts that have maturities of 12 months or less. We do not hold or engage in transactions involving derivative instruments for purposes other than risk management.
Industry and Business Outlook
Our products are primarily sold to the global pulp and paper industry. In North America, mill operating rates improved during 2010 as U.S. mills recovered approximately half of the production lost in 2009 and as inventory levels stabilized across all major grades of paper. Several of our North American customers have announced plans to increase capital spending in 2011. Our revenues in 2010 in North America increased $25.5 million, or 25%, due to an increase in demand for our capital equipment and, to a lesser extent, aftermarket products. In general, improvement in mill operating rates leads to increased demand for our aftermarket products. In 2010, our aftermarket business in North America improved and has continued to improve into the first quarter of 2011. In Europe, mill operating rates also improved during 2010 compared to the prior year. Revenues from our European businesses increased $1.2 million, primarily due to increases in demand of $8.9 million and $1.1 million for our fluid-handling and doctoring products, respectively, offset in part by a decrease of $9.3 million in our stock-preparation product line due to the shipment of a large order in 2009. In China significant capacity additions have been announced and are scheduled to come online over the next several years. Revenues in China in 2010 increased $14.7 million, or 66%. We had strong bookings activity in China in the fourth quarter of 2010, especially in our stock-preparation product line. Bookings in China were $35.9 million in the fourth quarter of 2010 and increased $29.8 million, or 485%, sequentially and $27.7 million, or 340%, over the fourth quarter of 2009. As a result, we are anticipating significant revenues from China in 2011 although this is dependent on customer-requested delivery dates and progress payments. In addition, we are investing in capital equipment and increasing our workforce in China to meet this surge in order activity.
We are currently concentrating our efforts on several initiatives intended to improve our operating results, including focusing on higher-growth emerging markets, further penetrating existing markets where we see opportunity, growing our market share and low-share regions, increasing aftermarket and consumables sales, and using low-cost manufacturing bases in locations such as China and Mexico. We also continue to focus our efforts on managing our operating costs and working capital.
For the first quarter of 2011, we expect to report diluted earnings per share of $.35 to $.37 from continuing operations on revenues of $71 to $73 million. For 2011, we expect to report diluted earnings per share of $1.65 to $1.75 from continuing operations on revenues of $300 to $310 million.
Results of Operations
2010 Compared to 2009
The following table sets forth our consolidated statement of operations expressed as a percentage of total revenue:
| 2010 | 2009 | |||||||
| Revenues |
100 | % | 100 | % | ||||
| Costs and Operating Expenses: |
||||||||
| Cost of revenues |
56 | 60 | ||||||
| Selling, general, and administrative expenses |
33 | 36 | ||||||
| Research and development expenses |
2 | 2 | ||||||
| Restructuring costs and other income, net |
– | 2 | ||||||
| 91 | 100 | |||||||
| Operating Income (Loss) |
9 | – | ||||||
| Interest Expense |
– | (1 | ) | |||||
| Income (Loss) from Continuing Operations Before Provision for Income Taxes |
9 | (1 | ) | |||||
| Provision for Income Taxes |
2 | 2 | ||||||
| Income (Loss) from Continuing Operations |
7 | % | (3 | )% | ||||
24
Table of Contents
| Kadant Inc. | 2010 Annual Report |
Revenues
Revenues increased $44.4 million, or 20%, to $270.0 million in 2010 from $225.6 million in 2009, including a $0.9 million decrease from the unfavorable effects of currency translation. Excluding the effects of currency translation, revenues in 2010 increased $45.3 million, or 20%, due to an increase in revenues in all of our Papermaking Systems segment’s product lines. The increase in our fluid-handling product line was primarily due to increased demand for our aftermarket products, while the increases in our stock-preparation, water-management, and doctoring product lines were primarily due to increased demand for both our capital and aftermarket products.
Revenues for 2010 and 2009 for our Papermaking Systems segment and Fiber-based Products business are as follows:
| (In thousands) | 2010 | 2009 | ||||||
| Revenues: |
||||||||
| Papermaking Systems |
$ | 261,188 | $ | 217,607 | ||||
| Fiber-based Products |
8,841 | 7,958 | ||||||
| $ | 270,029 | $ | 225,565 | |||||
Papermaking Systems Segment. Revenues at the Papermaking Systems segment increased $43.6 million, or 20%, to $261.2 million in 2010 from $217.6 million in 2009, including a $0.9 million decrease from the unfavorable effects of currency translation.
Fiber-based Products. Revenues from our Fiber-based Products business increased $0.8 million, or 11%, to $8.8 million in 2010 from $8.0 million in 2009 due to increased demand for our biodegradable granular products.
Papermaking Systems Segment by Product Line. The following table presents revenues for our Papermaking Systems segment by product line, the changes in revenues by product line between 2010 and 2009, and the changes in revenues by product line between 2010 and 2009 excluding the effect of currency translation. The increase in revenues excluding the effect of currency translation represents the increase resulting from the conversion of 2010 revenues in local currency into U.S. dollars at the 2009 exchange rates, and then comparing this result to the actual revenues in 2009. The presentation of the changes in revenues by product line excluding the effect of currency translation is a non-GAAP (generally accepted accounting principles) measure. We believe this non-GAAP measure helps investors gain a better understanding of our underlying operations, consistent with how management measures and forecasts our performance, especially when comparing such results to prior periods. This non-GAAP measure should not be considered superior to or a substitute for the corresponding GAAP measure.
| (In millions) | 2010 | 2009 | Increase | Increase Excluding Effect of Currency Translation |
||||||||||||
| Papermaking Systems Product Lines: |
||||||||||||||||
| Stock-Preparation |
$ | 95.5 | $ | 85.7 | $ | 9.8 | $ | 11.4 | ||||||||
| Fluid-Handling |
83.3 | 63.9 | 19.4 | 19.0 | ||||||||||||
| Doctoring |
51.3 | 45.9 | 5.4 | 5.4 | ||||||||||||
| Water-Management |
28.6 | 20.3 | 8.3 | 8.2 | ||||||||||||
| Other |
2.5 | 1.8 | 0.7 | 0.5 | ||||||||||||
| $ | 261.2 | $ | 217.6 | $ | 43.6 | $ | 44.5 | |||||||||
25
Table of Contents
| Kadant Inc. | 2010 Annual Report |
Our business benefited from the improvement in the pulp and paper industry in 2010, including improved mill operating rates, which led to increased spending on both capital and aftermarket products. Revenues for our parts and consumable products increased $23.6 million, or 18%. The improved business environment also led our customers to make capital additions in 2010. Sales of our capital products increased $19.3 million, or 23%, in 2010 compared to 2009.
Excluding a $1.6 million decrease from currency translation, revenues in our stock-preparation product line in 2010 increased $11.4 million, or 13%, primarily due to higher demand for our capital products in China and North America, offset in part by a decrease in Europe. The decrease in Europe was primarily due to higher revenues in 2009 resulting from a large capital equipment project that was shipped to Vietnam. In our fluid-handling product line revenues increased $19.0 million, or 30%, excluding a $0.4 million increase from the favorable effect of currency translation, primarily due to higher demand for our parts and consumable products in Europe and North America and our capital and aftermarket products in China. Revenues from our doctoring product line increased $5.4 million, or 12%, in 2010 compared to 2009, primarily due to an increase in demand for both capital and aftermarket products in North America, and for our aftermarket products in Europe. Revenues from the segment’s water-management product line increased $8.3 million, or 41%, in 2010 compared to 2009, primarily due to increased demand for our products in North America.
Revenues in 2010 increased in all of our major geographic regions compared to the depressed levels in 2009. In North America, our business benefited from improved economic conditions and increased mill operating rates and as a result our revenues increased $25.5 million, or 25%, in the region. Revenues in Europe also benefited from improved mill operating rates resulting in an increase of $1.2 million including an $8.9 million, or 38%, increase in our fluid-handling revenues. This was offset in part, by a $9.3 million, or 22%, decrease, in our stock-preparation systems revenues due to a large capital equipment project that was shipped to Vietnam in 2009. In China, we saw a significant increase in the number of large capital orders due to continued economic growth in the region. Our revenues in China increased $14.7 million, or 66%, to $37.1 million in 2010 compared to 2009 primarily due to increased demand for our capital products. We saw a significant sequential increase in our bookings in China in the fourth quarter of 2010 and anticipate strong revenues in 2011 as a result although this is dependent on customer-requested delivery dates and progress payments.
Gross Profit Margin
Gross profit margin for 2010 and 2009 for our Papermaking Systems segment and our Fiber-based Products business are as follows:
| 2010 | 2009 | |||||||
| Gross Profit Margin: |
||||||||
| Papermaking Systems |
44 | % | 40 | % | ||||
| Fiber-based Products |
46 | % | 35 | % | ||||
| 44 | % | 40 | % | |||||
Gross profit margin increased to 44% in 2010 from 40% in 2009 primarily due to higher margins in our Papermaking Systems segment.
Papermaking Systems Segment. The gross profit margin at the Papermaking Systems segment increased to 44% in 2010 from 40% in 2009. This increase was primarily due to an increase in gross profit margins in our stock-preparation, fluid-handling, and water-management product lines due to better utilization of overhead costs as a result of increased manufacturing volumes. Also contributing to the increase in gross profit margins in our water-management product line was the completion in early 2010 of the consolidation of our water-management manufacturing facility in New York into our facilities in Massachusetts and Mexico.
Fiber-based Products. The gross profit margin at our fiber-based products business increased to 46% in 2010 from 35% in 2009 primarily due to the lower cost of natural gas used in the production process in 2010 compared to the prior year.
26
Table of Contents
| Kadant Inc. | 2010 Annual Report |
Operating Expenses
Selling, general, and administrative expenses as a percentage of revenues decreased to 33% in 2010 from 36% in 2009 due to better operating leverage. Selling, general, and administrative expenses increased $8.0 million, or 10%, to $89.2 million in 2010 from $81.2 million in 2009. This increase was primarily due to higher incentive and commission expenses associated with improved operating performance and higher revenues in 2010 compared to 2009. This increase also included a $0.2 million decrease from the favorable effect of foreign currency translation and a $0.3 million increase due to acquisition expenses.
Total stock-based compensation expense was $2.8 million and $2.7 million in 2010 and 2009, respectively, and is included in selling, general, and administrative expenses. As of year-end 2010, unrecognized compensation expense related to stock-based compensation was approximately $2.6 million, which will be recognized over a weighted average period of 1.9 years.
Research and development expenses decreased $0.3 million, or 6%, to $5.3 million in 2010 from $5.6 million in 2009 and represented 2% of revenues in both 2010 and 2009.
Restructuring Costs and Other Income, Net
During 2010, restructuring costs and other income, net was $1.0 million of income. Other income in the 2010 period included a gain of $1.0 million associated with the sale of real estate in the U.S. and a curtailment gain on a pension liability of $0.2 million associated with the reduction of 25 employees in France. These gains were offset in part by restructuring costs of $0.2 million associated with previous restructuring plans. All of these items occurred in the Papermaking Systems segment.
During 2009, we recorded restructuring costs of $4.4 million, consisting primarily of severance and associated charges related to the reduction of 133 employees in Europe, China, the U.S., and Canada. These actions were taken to adjust our cost structure and streamline our operations, especially in our stock-preparation product line, in response to the weak economic environment. All of these items occurred in the Papermaking Systems segment.
Interest Income
Interest income decreased $0.2 million, or 45%, to $0.2 million in 2010 from $0.4 million in 2009 primarily due to lower average interest rates in the 2010 period.
Interest Expense
Interest expense decreased $0.9 million, or 39%, to $1.3 million in 2010 from $2.2 million in 2009 primarily due to lower average outstanding borrowings in the 2009 period.
Provision for Income Taxes
Our provision for income taxes was $5.2 million and $3.7 million in 2010 and 2009, respectively, and represented 22% and (164%) of pre-tax income (loss). The effective tax rate of 22% in 2010 included a recurring rate of 24%, offset in part by a 2% non-recurring tax benefit associated with the reduction in certain tax reserves. The effective tax rate of (164%) in 2009 included a $7.6 million tax provision associated primarily with the repatriation of foreign dividends to the U.S., offset in part by a $2.7 million tax benefit associated with valuation allowance reductions due to the utilization of certain domestic deferred tax assets. The change in effective tax rates between 2010 and 2009 was primarily due to the U.S. tax cost of repatriating foreign earnings in 2009. We expect our recurring effective tax rate to be approximately 28% in 2011 due to anticipated profitability in the U.S. and certain foreign tax jurisdictions. This rate does not include any assumptions related to the potential reversal of our tax valuation allowance. See Application of Critical Accounting Policies and Estimates for further information.
Income (Loss) from Continuing Operations
Income from continuing operations was $18.7 million in 2010 compared to a loss of $6.0 million in 2009. The income from continuing operations in 2010 includes an increase in operating income of $25.4 million offset
27
Table of Contents
| Kadant Inc. | 2010 Annual Report |
in part by an increase in provision for income taxes of $1.5 million (see Revenues, Gross Profit Margin, Operating Expenses, and Provision for Income Taxes discussed above).
Income (Loss) from Discontinued Operation
Income from the discontinued operation was $98 thousand in 2010 compared to a loss of $18 thousand in 2009. Results from the discontinued operation included tax benefits of $164 and $10 in 2010 and 2009, respectively.
As of January 1, 2011, the accrued warranty costs associated with the discontinued operation were $2.1 million, which represents the low end of the estimated range of warranty reserve required based on the level of claims received before the subsidiary ceased operations and judgments entered against it in litigation. Composites LLC will continue to record adjustments to accrued warranty costs to reflect the minimum amount of the potential range of loss for products under warranty based on judgments entered against it in litigation, if any. Our consolidated results in future reporting periods will be negatively impacted if the future level of warranty claims exceeds the warranty reserve.
Recent Accounting Pronouncements
Intangibles – Goodwill and Other. In December 2010, the Financial Accounting Standards Board (FASB) issued Accounting Standards Update (ASU) 2010-28, “Intangibles—Goodwill and Other,” which modifies Step 1 of the goodwill impairment test for reporting units with zero or negative carrying amounts. For those reporting units, an entity is required to perform Step 2 of the goodwill impairment test if it is more likely than not that a goodwill impairment exists. In determining whether it is more likely than not that a goodwill impairment exists, an entity should consider whether there are any adverse qualitative factors indicating that an impairment may exist. The qualitative factors are consistent with the existing guidance and examples, which requires that goodwill of a reporting unit be tested for impairment between annual tests if an event occurs or circumstances change that would more likely than not reduce the fair value of a reporting unit below its carrying amount. This guidance is effective for fiscal years, and interim periods within those years, beginning after December 15, 2010. We will adopt this standard in fiscal 2011 and do not expect it to have a material effect on our consolidated financial statements.
Business Combinations: Disclosure of Supplementary Pro Forma Information for Business Combinations. In December 2010, the FASB issued ASU 2010- 29, “Business Combinations (Topic 805): Disclosure of Supplementary Pro Forma Information for Business Combinations”, which affects any public entity that enters into business combinations that are material on an individual or aggregate basis. The amendments in this ASU specify that if a public entity presents comparative financial statements, the entity should disclose revenue and earnings of the combined entity as though the business combination(s) that occurred during the current year had occurred as of the beginning of the comparable prior annual reporting period only. The amendments also expand the supplemental pro forma disclosures to include a description of the nature and amount of material, nonrecurring pro forma adjustments directly attributable to the business combination included in the reported pro forma revenue and earnings. The amendments are effective prospectively for business combinations for which the acquisition date is on or after the beginning of the first annual reporting period beginning on or after December 15, 2010. We will adopt the disclosure requirements of this standard at the beginning of fiscal 2011 for material business combinations made subsequent to that date.
Revenue Arrangements with Multiple Deliverables. In September 2009, the FASB issued ASU 2009-13, “Multiple-Deliverable Revenue Arrangements,” which amends the multiple-element arrangement guidance under ASC 605, “Revenue Recognition.” This guidance amends the criteria for separating consideration for products or services in multiple-deliverable arrangements. This guidance establishes a selling price hierarchy for determining the selling price of a deliverable, eliminates the residual method of allocation, and requires that arrangement consideration be allocated at the inception of the arrangement to all deliverables using the relative selling price method. In addition, this guidance significantly expands required disclosures related to a vendor’s multiple-deliverable revenue arrangements. This guidance is effective prospectively for revenue arrangements entered into
28
Table of Contents
| Kadant Inc. | 2010 Annual Report |
or materially modified in fiscal years beginning on or after June 15, 2010 (fiscal 2011). We are currently evaluating the provisions of this guidance, but do not anticipate that it will have a material effect on our consolidated financial statements.
2009 Compared to 2008
The following table sets forth our consolidated statement of operations expressed as a percentage of total revenue:
| 2009 | 2008 | |||||||
| Revenues |
100 | % | 100 | % | ||||
| Costs and Operating Expenses: |
||||||||
| Cost of revenues |
60 | 59 | ||||||
| Selling, general, and administrative expenses |
36 | 30 | ||||||
| Research and development expenses |
2 | 2 | ||||||
| Restructuring costs and other income, net |
2 | 1 | ||||||
| Goodwill impairment |
– | 12 | ||||||
| 100 | 104 | |||||||
| Operating Loss |
– | (4 | ) | |||||
| Interest Income |
– | 1 | ||||||
| Interest Expense |
(1 | ) | (1 | ) | ||||
| Loss from Continuing Operations Before Provision for Income Taxes |
(1 | ) | (4 | ) | ||||
| Provision for Income Taxes |
2 | 3 | ||||||
| Loss from Continuing Operations |
(3 | )% | (7 | )% | ||||
Revenues
Revenues decreased $103.6 million, or 31%, to $225.6 million in 2009 from $329.2 million in 2008, including a $10.9 million decrease from the unfavorable effects of currency translation. Excluding the effects of currency translation, revenues in 2009 decreased $92.7 million, or 28%, as all of our major product lines experienced weak demand in response to the worldwide recession which began at the end of 2008. The largest declines, excluding the effects of currency translation, were in our stock-preparation product line, which decreased $39.5 million, or 31%, in 2009 compared to 2008 and our fluid-handling product line, which decreased $31.7 million, or 32%. These significant decreases in 2009 compared to 2008 were due to reduced spending by major manufacturers for capital equipment, spare parts, and consumables due to the weak economic environment.
Revenues for 2009 and 2008 for our Papermaking Systems segment and Fiber-based Products business are as follows:
| (In thousands) | 2009 | 2008 | ||||||
| Revenues: |
||||||||
| Papermaking Systems |
$ | 217,607 | $ | 321,747 | ||||
| Fiber-based Products |
7,958 | 7,411 | ||||||
| $ | 225,565 | $ | 329,158 | |||||
Papermaking Systems Segment. Revenues at the Papermaking Systems segment decreased $104.1 million, or 32%, to $217.6 million in 2009 from $321.7 million in 2008, including a $10.9 million decrease from the unfavorable effects of currency translation. Excluding the effects of currency translation, revenues in 2009
29
Table of Contents
| Kadant Inc. | 2010 Annual Report |
decreased $93.2 million, or 29%, due to decreases in all of our major product lines as paper producers took a number of steps to control operating costs, including deferring maintenance and upgrades and delaying or canceling projects, in response to the economic slowdown. The largest declines, excluding the effects of currency translation, were in our stock-preparation product line, which decreased $39.5 million, or 31%, and our fluid-handling product line, which decreased $31.7 million, or 32%. These significant decreases were due to a reduction in spending by major pulp and paper manufacturers for both capital equipment and maintenance projects in response to the weak economic environment. By geographic region, the $93.2 million decrease in revenues in 2009 includes reductions of $40.0 million, or 27%, in North America, $26.2 million, or 22%, in Europe and $24.5 million, or 53%, in China.
Fiber-based Products. Revenues from our Fiber-based Products business increased $0.6 million, or 7%, to $8.0 million in 2009 from $7.4 million in 2008.
Papermaking Systems Segment by Product Line. The following table presents revenues for our Papermaking Systems segment by product line, the changes in revenues by product line between 2009 and 2008, and the changes in revenues by product line between 2009 and 2008 excluding the effect of currency translation. The decrease in revenues excluding the effect of currency translation represents the decrease resulting from the conversion of 2009 revenues in local currency into U.S. dollars at the 2008 exchange rates, and then comparing this result to the actual revenues in 2008. The presentation of the changes in revenues by product line, excluding the effect of currency translation, is a non-GAAP (generally accepted accounting principles) measure. We believe this non-GAAP measure helps investors gain a better understanding of our underlying operations, consistent with how management measures and forecasts our performance, especially when comparing such results to prior periods. This non-GAAP measure should not be considered superior to or a substitute for the corresponding GAAP measure.
| (In millions) | 2009 | 2008 | Decrease | Decrease Excluding Effect of Currency Translation |
||||||||||||
| Papermaking Systems Product Lines: |
||||||||||||||||
| Stock-Preparation |
$ | 85.7 | $ | 128.2 | $ | (42.5 | ) | $ | (39.5 | ) | ||||||
| Fluid-Handling |
63.9 | 98.7 | (34.8 | ) | (31.7 | ) | ||||||||||
| Doctoring |
45.9 | 60.7 | (14.8 | ) | (11.4 | ) | ||||||||||
| Water-Management |
20.3 | 31.7 | (11.4 | ) | (10.4 | ) | ||||||||||
| Other |
1.8 | 2.4 | (0.6 | ) | (0.2 | ) | ||||||||||
| $ | 217.6 | $ | 321.7 | $ | (104.1 | ) | $ | (93.2 | ) | |||||||
Revenues from the segment’s stock-preparation product line decreased $42.5 million, or 33%, in 2009 compared to 2008, including a $3.0 million decrease from the unfavorable effect of currency translation. Excluding the effect of currency translation, revenues in 2009 decreased $39.5 million, or 31%, primarily due to a $20.1 million, or 58%, decrease in sales in China and a $17.5 million, or 38%, decrease in sales in North America. These significant decreases were a result of production slowdowns and curtailments by paper producers trying to reduce operating costs in response to the economic recession which began at the end of 2008.
Revenues from the segment’s fluid-handling product line decreased $34.8 million, or 35%, in 2009 compared to 2008, including a $3.1 million decrease from the unfavorable effect of currency translation. Excluding the effect of currency translation, revenues decreased $31.7 million, or 32%, including decreases of $17.7 million in Europe, $6.5 million in North America, and $5.0 million in China. These decreases were due to reduced spending by both new and existing customers as paper producers curtailed capital equipment and maintenance projects in an effort to reduce costs in the difficult economic environment in 2009.
Revenues from the segment’s doctoring product line decreased $14.8 million, or 24%, in 2009 compared to 2008, including a $3.4 million decrease from the unfavorable effect of currency translation. Excluding the effect
30
Table of Contents
| Kadant Inc. | 2010 Annual Report |
of currency translation, revenues decreased $11.4 million, or 19%, primarily due to a $7.8 million decrease in North America and a $3.9 million decrease in Europe as a result of production slowdowns and curtailments by paper producers trying to contain operating costs.
Revenues from the segment’s water-management product line decreased $11.4 million, or 36%, in 2009 compared to 2008, including a $1.0 million decrease from the unfavorable effect of currency translation. Excluding the effect of currency translation, revenues decreased $10.4 million, or 33%, primarily due to an $8.0 million decrease in sales in North America and a $2.6 million decrease in sales in Europe as customers curtailed production and reduced their spending on capital equipment, spare parts and consumables in response to the weak economic environment.
Gross Profit Margin
Gross profit margin for 2009 and 2008 for our Papermaking Systems segment and Fiber-based Products business are as follows:
| 2009 | 2008 | |||||||
| Gross Profit Margin: |
||||||||
| Papermaking Systems |
40 | % | 42 | % | ||||
| Fiber-based Products |
35 | % | 27 | % | ||||
| 40 | % | 41 | % | |||||
Gross profit margin decreased to 40% in 2009 from 41% in 2008.
Papermaking Systems Segment. The gross profit margin at the Papermaking Systems segment decreased to 40% in 2009 from 42% in 2008. This decrease was primarily due to lower margins in our water-management product line due to the underutilization of overhead costs as a result of reduced manufacturing volumes and higher costs associated with consolidating our water-management manufacturing facility in New York into our facilities in Massachusetts and Mexico. This decrease was partially offset by an increase in the gross profit margin due to a more favorable product mix and an increase in gross profit margin in our stock-preparation product line.
Fiber-based Products. The gross profit margin at our fiber-based products business increased to 35% in 2009 from 27% in 2008 primarily due to the lower cost of natural gas in 2009 compared to the prior year.
Operating Expenses
Selling, general, and administrative expenses as a percentage of revenues were 36% and 30% in 2009 and 2008, respectively. Selling, general, and administrative expenses decreased $19.1 million, or 19%, to $81.2 million in 2009 from $100.3 million in 2008. This decrease includes a $3.0 million favorable effect of currency translation and a $16.1 million net decrease primarily due to expense reductions throughout our Company, and reflects our restructuring efforts that reduced the number of employees and combined our sales forces in certain markets.
Total stock-based compensation expense was $2.7 million and $2.9 million in 2009 and 2008, respectively, and is included in selling, general, and administrative expenses.
Research and development expenses decreased $0.6 million, or 9%, to $5.6 million in 2009 from $6.2 million in 2008 and represented 2% of revenues in both 2009 and 2008.
Goodwill Impairment
During 2008, we recorded a pre-tax goodwill impairment charge of $40.3 million associated with our stock-preparation reporting unit within the Papermaking Systems segment. We completed our annual goodwill impairment test as of year-end 2008 using the estimates from our long-range forecasts, which reflected the
31
Table of Contents
| Kadant Inc. | 2010 Annual Report |
anticipated decline in stock-preparation sales, especially in China, which we expected to continue in the future given the then current economic environment and its impact on paper producers. See Valuation of Goodwill and Intangible Assets in Application of Critical Accounting Policies and Estimates above for further discussion.
Restructuring Costs and Other Income, Net
During 2009, we recorded restructuring costs of $4.4 million, consisting primarily of severance and associated charges related to the reduction of 133 employees in Europe, China, the U.S., and Canada. These actions were taken to adjust our cost structure and streamline our operations, especially in our stock-preparation product line, in response to the weak economic environment. All of these items occurred in the Papermaking Systems segment.
During 2008, we recorded restructuring costs and other income, net, of $2.0 million. The restructuring costs consisted of severance costs of $3.7 million related to the reduction of 329 employees in China, Latin America, Sweden, Canada, and the U.S. These actions were taken to adjust our cost structure and streamline our operations, especially in our stock-preparation product line, in response to the weak economic environment, which accelerated in the fourth quarter of 2008. Other income in 2008 consisted of a pre-tax gain of $1.1 million resulting from the sale of a building in the United Kingdom for $1.9 million in cash and a pre-tax gain of $0.6 million resulting from the sale of real estate in France for $0.7 million in cash. All of these items occurred in the Papermaking Systems segment.
Interest Income
Interest income decreased $1.5 million, or 80%, to $0.4 million in 2009 from $1.9 million in 2008 primarily due to lower average interest rates in the 2009 period.
Interest Expense
Interest expense decreased $0.5 million, or 21%, to $2.2 million in 2009 from $2.7 million in 2008 primarily due to lower average outstanding borrowings in the 2009 period.
Provision for Income Taxes
Our provision for income taxes was $3.7 million and $8.5 million in 2009 and 2008, respectively, and represented (164%) and (61%) of pre-tax loss. The effective tax rate of (164%) in 2009 included a $7.6 million tax provision associated primarily with the repatriation of foreign dividends to the U.S., offset in part by a $2.7 million tax benefit associated with valuation allowance reductions due to the utilization of certain domestic deferred tax assets. The effective tax rate of (61%) in 2008 included the following non-recurring items: a $15.4 million tax provision related to an increase in the valuation allowance on certain deferred tax assets, a $13.6 million tax benefit associated with the goodwill impairment charge, and a $1.0 million non-recurring tax benefit associated with our Canadian and Mexican operations. The change in effective tax rates between 2009 and 2008 was primarily due to the U.S. tax cost of repatriating foreign earnings in 2009 and a smaller impact from valuation allowances on deferred tax assets in 2009 versus 2008.
Loss from Continuing Operations
Loss from continuing operations decreased $16.3 million to $6.0 million in 2009 compared to $22.3 million in 2008. The loss from continuing operations in 2009 includes a decrease in operating loss of $12.5 million and a decrease in provision for income taxes of $4.8 million. The loss from continuing operations in 2008 included a $40.3 million pre-tax goodwill impairment charge and a $15.4 million tax provision related to an increase in the valuation allowance on certain deferred tax assets (see Revenues, Gross Profit Margin, Operating Expenses, and Provision for Income Taxes discussed above).
32
Table of Contents
| Kadant Inc. | 2010 Annual Report |
(Loss) Income from Discontinued Operation
Loss from the discontinued operation was $18 thousand in 2009 compared to income of $37 thousand in 2008.
Liquidity and Capital Resources
Consolidated working capital was $79.0 million at January 1, 2011 compared with $66.9 million at January 2, 2010. Included in working capital are cash and cash equivalents of $61.8 million at January 1, 2011, compared with $45.7 million at January 2, 2010. At January 1, 2011, $47.2 million of cash and cash equivalents was held by our foreign subsidiaries.
2010
Our operating activities provided cash of $28.4 million in 2010 primarily from our continuing operations. The change in current assets and liabilities provided cash of $0.5 million in 2010 despite a $44.4 million increase in revenues. This reflects our continued focus on improving our working capital management. The increase in accounts receivable of $13.5 million in 2010 is the result of higher sales compared to 2009. Inventories increased $4.0 million in 2010 as we purchased materials to fulfill orders that will ship in 2011. The increase in other current liabilities of $11.8 million in 2010 was largely due to an increase in customer deposits primarily in China and Europe. Also contributing to the increase in other current liabilities was an increase in accrued incentive compensation related to improved operating performance worldwide. The increase in accounts payable of $6.2 million in 2010 primarily related to raw material purchases that resulted from an increase in orders, as well as the timing of payments in all our major geographic regions. We also contributed cash of $2.2 million to our subsidiary’s noncontributory defined benefit retirement plan in 2010.
Our investing activities used cash of $6.4 million in 2010. We used cash of $3.2 million in 2010, net of cash acquired, for the acquisition of a Canadian-based supplier of pressure screen baskets and a related dewatering equipment product line, as well as for the acquisition of a European supplier of fluid-handling systems. We also used cash of $3.4 million for purchases of property, plant, and equipment and $2.6 million for acquisitions completed prior to 2010. These uses of cash were offset in part by proceeds of $2.9 million from the sale of property, plant, and equipment in 2010.
Our financing activities used cash of $4.5 million in 2010, including $4.4 million for the repurchase of our common stock on the open market and $0.5 million for principal payments on our outstanding debt obligations.
2009
Our operating activities provided cash of $43.1 million in 2009. Changes in current assets and liabilities contributed $41.6 million to operating cash flows in 2009. This change was a result of significant reductions in accounts receivable, unbilled contract costs and fees, and inventories as customers reduced their spending in 2009 in response to the weak economic environment, as well as our efforts to manage our working capital. This change included decreases in inventories of $18.8 million and accounts receivable of $18.6 million, which were offset in part by a use of cash of $6.7 million from a decrease in accounts payable. Contributing to the decrease in inventories in 2009 was the shipment of a large order in our stock-preparation product line to a customer in Vietnam. We also contributed cash of $4.8 million in 2009 to our subsidiary’s noncontributory defined benefit retirement plan.
Our investing activities used cash of $4.0 million in 2009. We used cash of $2.8 million in 2009 to purchase property, plant, and equipment and $1.4 million of cash for additional consideration associated primarily with the Kadant Johnson Inc. (Kadant Johnson) acquisition.
Our financing activities used cash of $35.3 million in 2009. We repaid $54.2 million and received cash proceeds of $22.0 million under our outstanding short- and long-term obligations. In addition, we used cash of $3.7 million in 2009 to repurchase our common stock on the open market.
33
Table of Contents
| Kadant Inc. | 2010 Annual Report |
2008
Our operating activities provided cash of $20.2 million in 2008 primarily from our continuing operations. Contributing to the cash provided by continuing operations in 2008 was a decrease in unbilled contract costs and fees of $17.4 million as orders for our stock-preparation equipment decreased, especially in China and North America. Offsetting this source of cash was an increase in inventory, which used $10.2 million of cash in 2008, principally related to our stock-preparation equipment product line as equipment was built for orders to be shipped in 2009. In addition a decrease in accounts payable used cash of $11.9 million due to a decrease in our stock-preparation equipment product line as we curtailed purchases as a result of weakening demand for our capital equipment.
Our investing activities used cash of $5.3 million in 2008. We used $6.2 million of cash to purchase property, plant, and equipment. We also used $2.1 million of cash for additional consideration due on prior period acquisitions. Partially offsetting these uses of cash was $2.9 million of cash received from the sale of property, plant, and equipment.
Our financing activities used cash of $29.7 million in 2008. We used cash of $54.5 million in 2008 for principal payments on our debt obligations and $47.6 million to repurchase our common stock on the open market. These uses of cash were partially offset by $68.8 million of proceeds from the issuance of debt obligations and $3.8 million from the issuance of common stock in connection with the exercise of employee stock options.
Revolving Credit Facility
On February 13, 2008, we entered into a five-year unsecured revolving credit facility (2008 Credit Agreement) in the aggregate principal amount of up to $75 million. The 2008 Credit Agreement also includes an uncommitted unsecured incremental borrowing facility of up to an additional $75 million. We can borrow up to $75 million under the 2008 Credit Agreement with a sublimit of $60 million within the 2008 Credit Agreement available for the issuance of letters of credit and bank guarantees. The principal on any borrowings made under the 2008 Credit Agreement is due on February 13, 2013. As of January 1, 2011, the outstanding balance borrowed under the 2008 Credit Agreement was $15.0 million, of which $5.0 million was classified as short-term. This short-term amount was paid on January 31, 2011. Interest on any loans outstanding under the 2008 Credit Agreement accrues and is payable quarterly in arrears at one of the following rates selected by us: (a) the prime rate plus an applicable margin (up to .20%) or (b) a Eurocurrency rate plus an applicable margin (up to 1.20%). The applicable margin is determined based upon our total debt to earnings before interest, taxes, depreciation, and amortization (EBITDA) ratio, as defined in the agreement. The amount we are able to borrow under the 2008 Credit Agreement is the total borrowing capacity less any outstanding borrowings, letters of credit and multi-currency borrowings issued under the 2008 Credit Agreement. As of January 1, 2011, we had $58.7 million of borrowing capacity available under the committed portion of the 2008 Credit Agreement subject to limitations associated with the financial covenants in the 2008 Credit Agreement.
Our obligations under the 2008 Credit Agreement may be accelerated upon the occurrence of an event of default under the 2008 Credit Agreement, which includes customary events of default including, without limitation, payment defaults, defaults in the performance of affirmative and negative covenants, the inaccuracy of representations or warranties, bankruptcy and insolvency-related defaults, defaults relating to such matters as the Employment Retirement Income Security Act (ERISA), uninsured judgments and the failure to pay certain indebtedness, and a change of control default.
The 2008 Credit Agreement contains negative covenants applicable to us, including financial covenants requiring us to comply with a maximum consolidated leverage ratio of 3.5 and a minimum consolidated fixed charge coverage ratio of 1.2, and restrictions on liens, indebtedness, fundamental changes, dispositions of property, making certain restricted payments (including dividends and stock repurchases), investments, transactions with affiliates, sale and leaseback transactions, swap agreements, changing our fiscal year, arrangements affecting subsidiary distributions, entering into new lines of business, and certain actions related to
34
Table of Contents
| Kadant Inc. | 2010 Annual Report |
the discontinued operation. As of January 1, 2011, we were in compliance with these covenants. Our EBITDA, as defined in the 2008 Credit Agreement, is a factor used in the consolidated leverage and fixed charge ratios.
Commercial Real Estate Loan
On May 4, 2006, we borrowed $10 million under a promissory note (2006 Commercial Real Estate Loan). The 2006 Commercial Real Estate Loan is repayable in quarterly installments of $125 thousand over a ten-year period with the remaining principal balance of $5 million due upon maturity. As of January 1, 2011, the remaining balance on the 2006 Commercial Real Estate Loan was $7.8 million. Interest on the 2006 Commercial Real Estate Loan accrues and is payable quarterly in arrears at one of the following rates selected by us: (a) the prime rate or (b) the three-month London Inter-Bank Offered Rate (LIBOR) plus a 1% margin. Effective February 14, 2008, this margin was lowered to .75%.
Our obligations under the 2006 Commercial Real Estate Loan may be accelerated upon the occurrence of an event of default under the 2006 Commercial Real Estate Loan and the mortgage and security agreements, which includes customary events of default including without limitation payment defaults, defaults in the performance of covenants and obligations, the inaccuracy of representations or warranties, bankruptcy- and insolvency-related defaults, liens on the properties or collateral and uninsured judgments. In addition, the occurrence of an event of default under the 2008 Credit Agreement or any successor credit facility would be an event of default under the 2006 Commercial Real Estate Loan.
Interest Rate Swap Agreements
To hedge the exposure to movements in the 3-month LIBOR rate on outstanding debt, on February 13, 2008, we entered into a swap agreement (2008 Swap Agreement). The 2008 Swap Agreement has a five-year term and a $15 million notional value, which decreased to $10 million on December 31, 2010, and will decrease to $5 million on December 30, 2011. Under the 2008 Swap Agreement, on a quarterly basis we receive a 3-month LIBOR rate and pay a fixed rate of interest of 3.265%. We also entered into a swap agreement in 2006 (2006 Swap Agreement) to convert the 2006 Commercial Real Estate Loan from a floating to a fixed rate of interest. The 2006 Swap Agreement has the same terms and quarterly payment dates as the corresponding debt, and reduces proportionately in line with the amortization of the 2006 Commercial Real Estate Loan. Under the 2006 Swap Agreement, we receive a three-month LIBOR rate and pay a fixed rate of interest of 5.63%. As of January 1, 2011, $17.8 million of our outstanding debt was hedged through interest rate swap agreements, which had an unrealized loss of $1.6 million. Our management believes that any credit risk associated with the 2006 and 2008 Swap Agreements is remote based on our financial position and the creditworthiness of the financial institution issuing the swap agreements.
Additional Liquidity and Capital Resources
On November 4, 2009, our board of directors approved the repurchase by us of up to $20 million of our equity securities during the period from November 4, 2009 through November 4, 2010. We repurchased 255,500 shares of our common stock for $4.4 million under this authorization. On October 27, 2010, our board of directors approved the repurchase by us of up to $20 million of our equity securities during the period from November 5, 2010 through November 5, 2011. To date, we have not made any repurchases under this authorization.
The severe economic downturn that began at the end of 2008 and continued into 2009 negatively affected our quarterly EBITDA, which is a factor used in the financial covenants in our 2008 Credit Agreement. In the second quarter of 2009, we implemented a one-time cash repatriation plan to ensure that we would continue to remain in compliance with these financial covenants. Under this plan, we repatriated $35.6 million of cash in 2009 from our foreign subsidiaries, which was used to repay a portion of our outstanding debt obligations in the U.S. and China. It is our intention to reinvest indefinitely the remaining earnings of our international subsidiaries in order to support the current and future capital needs of their operations. Through January 1, 2011, we have not
35
Table of Contents
| Kadant Inc. | 2010 Annual Report |
provided for U.S. income taxes on approximately $87.3 million of unremitted foreign earnings. The U.S. tax cost has not been determined due to the fact that it is not practicable to estimate at this time. The related foreign tax withholding, which would be required if we remitted the foreign earnings to the U.S., would be approximately $0.5 million.
It is our policy to provide for uncertain tax positions and the related interest and penalties based upon management’s assessment of whether a tax benefit is more likely than not to be sustained upon examination by tax authorities. At January 1, 2011, we had a liability for unrecognized tax benefits and an accrual for the payment of interest and penalties totaling $7.7 million. To the extent we prevail in matters for which a liability for an unrecognized tax benefit is established or are required to pay amounts in excess of the liability, our effective tax rate in a given financial statement period may be affected.
In 2005, Composites LLC sold its composites business, which is presented as a discontinued operation in the accompanying consolidated financial statements. Under the terms of the asset purchase agreement, Composites LLC retained certain liabilities associated with the operation of the business prior to the sale, including warranty obligations related to products manufactured prior to the sale date. At January 1, 2011, the accrued warranty costs associated with the composites business were $2.1 million, which represents the low end of the estimated range of warranty reserve required based on the level of claims received before Composites LLC ceased operations and judgments entered against it in litigation. Composites LLC will continue to record adjustments to accrued warranty costs to reflect the minimum amount of the potential range of loss for products under warranty based on judgments entered against it in litigation, if any.
Although we currently have no material commitments for capital expenditures, we plan to make expenditures of approximately $7 to $8 million during 2011 for property, plant, and equipment. In addition, we expect to make cash contributions of $0.9 million to our subsidiary’s noncontributory defined benefit retirement plan.
In the future, our liquidity position will be primarily affected by the level of cash flows from operations, cash paid to satisfy debt repayments, capital projects, stock repurchases, or additional acquisitions, if any. We believe that our existing resources, together with the cash available from our credit facilities and the cash we expect to generate from continuing operations, will be sufficient to meet the capital requirements of our current operations for the foreseeable future.
Contractual Obligations and Other Commercial Commitments
The following table summarizes our known contractual obligations and commercial commitments to make future payments or other consideration pursuant to certain contracts as of January 1, 2011, as well as an estimate of the timing in which these obligations are expected to be satisfied. Detailed information concerning these obligations and commitments can be found in Notes 2, 6 and 7 to our consolidated financial statements.
| Payments Due by Period or Expiration of Commitment | ||||||||||||||||||||
| (In millions) | Less than 1 Year |
1-3 Years |
4-5 Years |
After 5 Years |
Total | |||||||||||||||
| Contractual Obligations and Other Commitments: (a)(b) |
||||||||||||||||||||
| Short- and long-term debt obligations |
$ | 5.5 | $ | 11.0 | $ | 1.0 | $ | 5.3 | $ | 22.8 | ||||||||||
| Interest (c) |
0.9 | 1.1 | 0.7 | 0.2 | 2.9 | |||||||||||||||
| Operating lease obligations |
1.9 | 2.0 | 0.8 | 0.3 | 5.0 | |||||||||||||||
| Acquisition consideration |
0.7 | 0.2 | – | – | 0.9 | |||||||||||||||
| Letters of credit (d) |
9.4 | 2.2 | – | – | 11.6 | |||||||||||||||
| Total (e)(f) |
$ | 18.4 | $ | 16.5 | $ | 2.5 | $ | 5.8 | $ | 43.2 | ||||||||||
| (a) | We have purchase obligations related to the acquisition of raw material made in the ordinary course of business that may be terminated with minimal notice and are excluded from this table. |
36
Table of Contents
| Kadant Inc. | 2010 Annual Report |
| (b) | In the ordinary course of business, certain contracts contain limited performance guarantees, which do not require letters of credit, relating to our equipment and systems. We typically limit our liability under these guarantees to amounts that would not exceed the value of the contract. We believe that we have adequate reserves for any potential liability in connection with such guarantees. These guarantees are not included in this table. |
| (c) | Amounts assume interest rates on variable rate debt remain unchanged from rates as of January 1, 2011. |
| (d) | Primarily relates to performance obligations and customer deposit guarantees, which typically have expired without being drawn upon. This total includes letters of credit of $0.8 million, which have expired according to the original terms, but remain a contractual obligation by court order. |
| (e) | This table excludes $0.4 million of accrued restructuring costs. The table also excludes $6.7 million of accrued pension and other post-retirement benefits, as these liabilities are not subject to fixed payment terms. In addition, the table excludes an unrealized loss of $1.6 million associated with our interest rate swap agreements as this amount would only be owed if the counterparty demanded an early termination of the agreements in the event of a default under our 2008 Credit Agreement. |
| (f) | This table excludes a liability for unrecognized tax benefits and an accrual for the payment of interest and penalties totaling $7.7 million. Due to the uncertain nature of these tax matters, we are unable to make a reasonably reliable estimate as to if and when cash settlements with the appropriate taxing authorities will occur. |
Provisions in financial guarantees or commitments, debt or lease agreements, or other arrangements could trigger a requirement for an early payment, additional collateral support, amended terms, or acceleration of maturity.
We do not have special-purpose entities nor do we use off-balance-sheet financing arrangements.
| Item 7A. | Quantitative and Qualitative Disclosures About Market Risk |
We are exposed to market risk from changes in interest rates and foreign currency exchange rates, which could affect our future results of operations and financial condition. We manage our exposure to these risks through our regular operating and financing activities. We entered into “receive-variable pay-fixed” swap agreements in 2006 and 2008 to hedge our exposure to variable rate long-term debt. Additionally, we use short-term forward contracts to manage certain exposures to foreign currencies. We enter into forward currency-exchange contracts to hedge firm purchase and sale commitments denominated in currencies other than our subsidiaries’ local currencies. We do not engage in extensive foreign currency hedging activities; however, the purpose of our foreign currency hedging activities is to protect our local currency cash flows related to these commitments from fluctuations in foreign exchange rates. Our forward currency-exchange contracts principally hedge transactions denominated in U.S. dollars. Gains and losses arising from forward contracts are recognized as offsets to gains and losses resulting from the transactions being hedged. We do not hold or engage in transactions involving derivative instruments for purposes other than risk management.
Interest Rates
Our cash and cash equivalents are sensitive to changes in interest rates. Interest rate changes would result in a change in interest income due to the difference between the current interest rates on cash and cash equivalents and the variable rates to which these financial instruments may adjust in the future. A 10% decrease in year-end interest rates would have resulted in an immaterial impact on net income in 2010 and a negative impact on our net income of approximately $0.1 million in 2009.
A portion of our outstanding debt is sensitive to changes in interest rates. We hedged $17.8 million and $23.3 million of our debt at year-end 2010 and 2009, respectively, with “receive-variable pay-fixed” swap agreements. The fair values of the swap agreements are sensitive to changes in the 3-month LIBOR forward curve. A 10% decrease in the 3-month LIBOR forward curve would have resulted in an increase in unrealized losses of $0.1 million and $0.2 million as of year-end 2010 and 2009, respectively. The remaining unhedged
37
Table of Contents
| Kadant Inc. | 2010 Annual Report |
portion of the debt totaling $5.0 million at year-end 2010 is sensitive to changes in interest rates. As of year-end 2010, the interest rate on the unhedged portion of our U.S. debt was based on LIBOR. A 10% increase in the year-end 2010 rates would have had an immaterial impact on our net income.
Currency Exchange Rates
We generally view our investment in foreign subsidiaries in a functional currency other than our reporting currency as long-term. Our investment in foreign subsidiaries is sensitive to fluctuations in foreign currency exchange rates. The functional currencies of our foreign subsidiaries are principally denominated in euros, British pounds sterling, Mexican pesos, Canadian dollars, Chinese renminbi and Brazilian reals. The effect of changes in foreign exchange rates on our net investment in foreign subsidiaries is reflected in the “accumulated other comprehensive items” component of shareholders’ investment. A 10% decrease in functional currencies at year-end 2010 and 2009, relative to the U.S. dollar, would have resulted in a reduction in shareholders’ investment of $14.9 million and $13.4 million, respectively.
The fair value of forward currency-exchange contracts is sensitive to fluctuations in foreign currency exchange rates. The fair value of forward currency-exchange contracts is the estimated amount that we would pay or receive upon termination of the contracts, taking into account the change in foreign currency exchange rates. A 10% decrease in year-end 2010 and 2009 foreign currency exchange rates related to our contracts would have resulted in an increase in unrealized losses on forward currency-exchange contracts of $0.5 million and $1.1 million in 2010 and 2009, respectively. Since we use forward currency-exchange contracts as hedges of firm purchase and sale commitments, the unrealized gain or loss on forward currency-exchange contracts resulting from changes in foreign currency exchange rates would be offset primarily by corresponding changes in the fair value of the hedged items.
| Item 8. | Financial Statements and Supplementary Data |
This data is submitted as a separate section to this Report. See Item 15, “Exhibits and Financial Statement Schedules.”
| Item 9. | Changes in and Disagreements with Accountants on Accounting and Financial Disclosure |
Not applicable.
| Item 9A. | Controls and Procedures |
Evaluation of Disclosure Controls and Procedures
Our management, under the supervision and with the participation of our Chief Executive Officer and Chief Financial Officer, evaluated the effectiveness of our disclosure controls and procedures as of January 1, 2011. The term “disclosure controls and procedures,” as defined in Securities Exchange Act Rules 13a-15(e) and 15d-15(e), means controls and other procedures of a company that are designed to ensure that information required to be disclosed by the company in the reports that it files or submits under the Exchange Act is recorded, processed, summarized, and reported, within the time periods specified in the SEC’s rules and forms. Disclosure controls and procedures include, without limitation, controls and procedures designed to ensure that information required to be disclosed by a company in the reports that it files or submits under the Exchange Act is accumulated and communicated to the company’s management, including its principal executive and principal financial officers, as appropriate to allow timely decisions regarding required disclosure. Management recognizes that any controls and procedures, no matter how well designed and operated, can provide only reasonable assurance of achieving their objectives and management necessarily applies its judgment in evaluating the cost-benefit relationship of possible controls and procedures. Based upon the evaluation of our disclosure controls and procedures as of January 1, 2011, our Chief Executive Officer and Chief Financial Officer concluded that as of January 1, 2011, our disclosure controls and procedures were effective at the reasonable assurance level.
38
Table of Contents
| Kadant Inc. | 2010 Annual Report |
Management’s Annual Report on Internal Control over Financial Reporting
Our management is responsible for establishing and maintaining adequate internal control over financial reporting, as such term is defined in Securities Exchange Act Rules 13a-15(f) and 15d-15(f). Our management assessed the effectiveness of our internal control over financial reporting as of January 1, 2011. In making this assessment, our management used the criteria set forth in “Internal Control—Integrated Framework” issued by the Committee of Sponsoring Organizations of the Treadway Commission (COSO). Based on our assessment, management believes that as of January 1, 2011 our internal control over financial reporting is effective based on the criteria issued by COSO.
Because of inherent limitations, internal control over financial reporting may not prevent or detect misstatements. Projections of any evaluation of effectiveness to future periods are subject to the risk that controls may become inadequate because of changes in conditions, or that the degree of compliance with the policies or procedures may deteriorate.
Our independent registered public accountants, Ernst & Young LLP, have issued an audit report on our internal control over financial reporting, which is included herein on page F-3 and incorporated into this Item 9A by reference.
Changes in Internal Control over Financial Reporting
There have not been any changes in our internal control over financial reporting (as defined in Rules 13a-15(f) and 15d-15(f) under the Securities Exchange Act of 1934, as amended) during the fiscal quarter ended January 1, 2011 that have materially affected, or are reasonably likely to materially affect, our internal control over financial reporting.
| Item 9B. | Other Information |
Not applicable.
PART III
| Item 10. | Directors, Executive Officers, and Corporate Governance |
This information will be included under the heading “Election of Directors” in our 2011 proxy statement for our 2011 Annual Meeting of Shareholders and is incorporated in this Report by reference, except for the information concerning executive officers, which is included under the heading “Executive Officers of the Registrant” in Item 1 of Part I of this Report.
Section 16(a) Beneficial Ownership Reporting Compliance
The information required under Item 405 of Regulation S-K will be included under the heading “Stock Ownership–Section 16(a) Beneficial Ownership Reporting Compliance” in our 2011 proxy statement and is incorporated in this Report by reference.
Corporate Governance
The information required under Items 406 and 407 of Regulation S-K will be included under the heading “Corporate Governance” in our 2011 proxy statement and is incorporated in this Report by reference.
| Item 11. | Executive Compensation |
This information will be included under the headings “Executive Compensation”, “Compensation Committee Interlocks and Insider Participation”, and “Compensation Committee Report” in our 2011 proxy statement and is incorporated in this Report by reference.
39
Table of Contents
| Kadant Inc. | 2010 Annual Report |
| Item 12. | Security Ownership of Certain Beneficial Owners and Management and Related Stockholder Matters |
Except for the information concerning equity compensation plans, this information will be included under the heading “Stock Ownership” in our 2011 proxy statement and is incorporated in this Report by reference.
The following table provides information about the securities authorized for issuance under our equity compensation plans as of January 1, 2011:
Equity Compensation Plan Information
| Plan Category |
(a) Number of Securities to be Issued upon Exercise of Outstanding Options, Warrants, and Rights |
(b) Weighted-Average Exercise Price of Outstanding Options, Warrants, and Rights |
(c) Number of Securities Remaining Available for Future Issuance Under Equity Compensation Plans (Excluding Securities Reflected in Column (a)) |
|||||||||
| Equity compensation plans approved by security holders |
464,258 | (1) | $ | 16.03 | (1) | 719,453 | (2) | |||||
| Equity compensation plans not approved by security holders (3) |
9,167 | $ | 19.76 | 23,902 | ||||||||
| Total |
473,425 | (1) | $ | 16.11 | (1) | 743,355 | (2) | |||||
| (1) | Excludes an aggregate of 141,513 shares of common stock issuable under our employees’ stock purchase plan in connection with current and future offering periods under the plan. Excludes 2,569 shares reserved for issuance pursuant to our deferred compensation plan for directors. |
| (2) | Includes 141,513 shares of common stock issuable under our employees’ stock purchase plan in connection with current and future offering periods under the plan. Excludes 2,569 shares reserved for issuance pursuant to our deferred compensation plan for directors. |
| (3) | The material features of our 2001 employee equity incentive plan are substantially identical to our other equity plans as described in Note 3 to the consolidated financial statements included in this Report, except that awards may not be made to executive officers or directors. |
| Item 13. | Certain Relationships and Related Transactions, and Director Independence |
This information will be included under the heading “Election of Directors” in our 2011 proxy statement and is incorporated in this Report by reference.
| Item 14. | Principal Accountant Fees and Services |
This information will be included under the heading “Independent Registered Public Accounting Firm” in our 2011 proxy statement and is incorporated in this Report by reference.
40
Table of Contents
| Kadant Inc. | 2010 Annual Report |
PART IV
| Item 15. | Exhibits and Financial Statement Schedules |
| (a) | The following documents are filed as part of this Report: |
| (1) | Consolidated Financial Statements (see Index on Page F-1 of this Report): |
Report of Independent Registered Public Accounting Firm on Consolidated Financial Statements and Schedule
Report of Independent Registered Public Accounting Firm on Internal Control over Financial Reporting
Consolidated Statement of Operations
Consolidated Balance Sheet
Consolidated Statement of Cash Flows
Consolidated Statement of Comprehensive Income (Loss) and Shareholders’ Investment
Notes to Consolidated Financial Statements
| (2) | Consolidated Financial Statement Schedule (see Index on Page F-1 of this Report): |
Schedule II: Valuation and Qualifying Accounts
All other schedules are omitted because they are not applicable or not required, or because the required information is shown either in the consolidated financial statements or in the notes thereto.
| (3) | Exhibits filed herewith or incorporated in this Report by reference are set forth in the Exhibit Index beginning on page 43. This list of exhibits identifies each management contract or compensatory plan or arrangement required to be filed as an exhibit to this Report. |
| (b) | Exhibits |
See the Exhibit Index beginning on page 43.
41
Table of Contents
| Kadant Inc. | 2010 Annual Report |
Signatures
Pursuant to the requirements of Section 13 or 15(d) of the Securities Exchange Act of 1934, the Registrant has duly caused this Report to be signed on its behalf by the undersigned, thereunto duly authorized.
| KADANT INC. | ||||||
| Date: March 17, 2011 | By: | /S/ JONATHAN W. PAINTER | ||||
| Jonathan W. Painter | ||||||
| Chief Executive Officer and President | ||||||
Pursuant to the requirements of the Securities Exchange Act of 1934, this Report has been signed below by the following persons on behalf of the Registrant and in the capacities indicated, on March 17, 2011.
| Signature |
Title | |||||
| By: | /S/ JONATHAN W. PAINTER | Chief Executive Officer, President and Director | ||||
| Jonathan W. Painter | ||||||
| By: | /S/ THOMAS M. O’BRIEN | Executive Vice President, Chief Financial Officer | ||||
| Thomas M. O’Brien | ||||||
| By: | /S/ MICHAEL J. MCKENNEY | Vice President, Finance and Chief Accounting Officer | ||||
| Michael J. McKenney | ||||||
| By: | /S/ WILLIAM A. RAINVILLE | Director and Chairman of the Board | ||||
| William A. Rainville | ||||||
| By: | /S/ JOHN M. ALBERTINE | Director | ||||
| John M. Albertine | ||||||
| By: | /S/ THOMAS C. LEONARD | Director | ||||
| Thomas C. Leonard | ||||||
| By: | /S/ FRANCIS L. MCKONE | Director | ||||
| Francis L. McKone | ||||||
| By: | /S/ WILLIAM P. TULLY | Director | ||||
| William P. Tully | ||||||
42
Table of Contents
Exhibit Index
| Exhibit Number |
Description of Exhibit | |
| 2.1 | Purchase Agreement among the Registrant, Johnson Acquisition Corp., The Johnson Corporation and the principal shareholders of Johnson identified in the Purchase Agreement (filed as Exhibit 99.2 to the Registrant’s Current Report on Form 8-K [File No. 1-11406] filed with the Commission on April 12, 2005 and incorporated in this document by reference). (1) | |
| 2.2 | Purchase Agreement dated October 21, 2005, among the Registrant, its Kadant Composites LLC subsidiary, LDI Composites Co., a Minnesota corporation, and Liberty Diversified Industries, Inc., a Minnesota corporation, and parent corporation of the Buyer (filed as Exhibit 99.1 to the Registrant’s Current Report on Form 8-K [File No. 1-11406] filed with the Commission on October 27, 2005 and incorporated in this document by reference). (1) | |
| 2.3 | First Amendment dated as of October 10, 2006 to the Asset Purchase Agreement dated as of October 21, 2005, among the Registrant, its Kadant Composites LLC subsidiary, LDI Composites Co., a Minnesota corporation, and Liberty Diversified Industries, Inc., a Minnesota corporation, and parent corporation of the Buyer (filed as Exhibit 10.1 to the Registrant’s Quarterly Report on Form 10-Q for the quarter ended September 29, 2007 [File No. 1-11406] and incorporated in this document by reference). | |
| 2.4 | Second Amendment dated as of May 1, 2009 to the Asset Purchase Agreement dated as of October 21, 2005, among the Registrant, its Kadant Composites LLC subsidiary, LDI Composites Co., a Minnesota corporation, and Liberty Diversified Industries, Inc., a Minnesota corporation, and parent corporation of LDI Composites Co. (filed as Exhibit 2.1 to the Registrant’s Quarterly Report on Form 10-Q for the quarter ended April 4, 2009 [File No. 1-11406] and incorporated in this document by reference). | |
| 3.1 | Restated Certificate of Incorporation of the Registrant (filed as Exhibit 3.1 to the Registrant’s Quarterly Report on Form 10-Q for the quarter ended June 30, 2001 [File No. 1-11406] and incorporated in this document by reference). | |
| 3.2 | Amended and Restated Bylaws of the Registrant (filed as Exhibit 3.2 to the Registrant’s Quarterly Report on Form 10-Q for the quarter ended June 30, 2001 [File No. 1-11406] and incorporated in this document by reference). | |
| 4.1 | Rights Agreement, dated as of July 16, 2001, between the Registrant and American Stock Transfer & Trust Company, which includes as Exhibit A the Form of Certificate of Designations, as Exhibit B the Form of Rights Certificate, and as Exhibit C the Summary of Rights to Purchase Preferred Stock (filed as Exhibit 4.1 to the Registrant’s Current Report on Form 8-K [File No. 1-11406] filed with the Commission on July 17, 2001 and incorporated in this document by reference). | |
| 10.1* | Form of Indemnification Agreement between the Registrant and its directors and officers (filed as Exhibit 10.1 to the Registrant’s Quarterly Report on Form 10-Q for the quarter ended June 30, 2001 [File No. 1-11406] and incorporated in this document by reference). | |
| 10.2* | Form of Amended and Restated Executive Retention Agreement (change in control agreement) between the Company and its executive officers, as amended and restated on December 9, 2008 (filed as Exhibit 10.3 to the Registrant’s Annual Report on Form 10-K for the year ended January 3, 2009 [File No. 1-11406] and incorporated in this document by reference). | |
| 10.3* | Executive Transition Agreement between the Company and William A. Rainville, dated as of August 17, 2009 (filed as Exhibit 10.1 to the Registrant’s Current Report on Form 8-K [File No. 1-11406] filed with the Commission on August 20, 2009 and incorporated in this document by reference). | |
43
Table of Contents
Exhibit Index
| Exhibit Number |
Description of Exhibit | |
| 10.4* | Amended and Restated Equity Incentive Plan of the Registrant (filed as Exhibit 10.5 to the Registrant’s Annual Report on Form 10-K for the year ended January 3, 2009 [File No. 1-11406] and incorporated in this document by reference). | |
| 10.5* | 2001 Employees Equity Incentive Plan of the Registrant (filed as Exhibit 10.6 to the Registrant’s Annual Report on Form 10-K for the year ended January 3, 2009 [File No. 1-11406] and incorporated in this document by reference). | |
| 10.6* | Kadant Inc. 2006 Equity Incentive Plan (filed as Exhibit 10.7 to the Registrant’s Annual Report on Form 10-K for the year ended January 3, 2009 [File No. 1-11406] and incorporated in this document by reference). | |
| 10.7* | Amended and Restated Deferred Compensation Plan for Directors of the Registrant (filed as Exhibit 10.5 to the Registrant’s Quarterly Report on Form 10-Q for the quarter ended July 3, 1999 [File No. 1-11406] and incorporated in this document by reference). | |
| 10.8* | Cash Incentive Plan of the Registrant (filed as Exhibit 10.10 to the Registrant’s Annual Report on Form 10-K for the year ended January 3, 2009 [File No. 1-11406] and incorporated in this document by reference). | |
| 10.9* | Summary of non-employee director compensation of the Registrant. | |
| 10.10* | Form of Restricted Stock Unit Award Agreement between the Company and its non-employee directors used for annual restricted stock unit awards (filed as Exhibit 10.17 to the Registrant’s Annual Report on Form 10-K for the year ended January 2, 2010 [File No. 1-11406] and incorporated in this document by reference). | |
| 10.11* | Form of Restricted Stock Unit Award Agreement between the Company and its non-employee directors used for change-in-control restricted stock unit awards (filed as Exhibit 10.18 to the Registrant’s Annual Report on Form 10-K for the year ended January 2, 2010 [File No. 1-11406] and incorporated in this document by reference). | |
| 10.12* | Form of Performance-Based Restricted Stock Unit Award Agreement between the Company and its executive officers used for restricted stock unit awards granted on March 3, 2009 (filed as Exhibit 10.1 to the Registrant’s Quarterly Report on Form 10-Q for the quarter ended April 4, 2009 [File No. 1-11406] and incorporated in this document by reference). | |
| 10.13* | Form of Performance-Based Restricted Stock Unit Award Agreement between the Company and its executive officers used for restricted stock unit awards granted in 2010 and subsequent periods (filed as Exhibit 10.20 to the Registrant’s Annual Report on Form 10-K for the year ended January 2, 2010 [File No. 1-11406] and incorporated in this document by reference). | |
| 10.14* | Form of Stock Option Agreement between the Company and its executive officers used for stock option awards (filed as Exhibit 10.21 to the Registrant’s Annual Report on Form 10-K for the year ended January 2, 2010 [File No. 1-11406] and incorporated in this document by reference). | |
| 10.15 | Credit Agreement dated February 13, 2008 among the Registrant, the Foreign Subsidiary Borrowers from time to time parties thereto, the several banks and other financial institutions or entities from time to time parties thereto, and JPMorgan Chase Bank, N.A., as Administrative Agent, and J.P. Morgan Europe Limited, as Multi-currency Administrative Agent (filed as Exhibit 99.1 to the Registrant’s Current Report on Form 8-K [File No. 1-11406] filed with the Commission on February 15, 2008 and incorporated in this document by reference). (1) | |
44
Table of Contents
Exhibit Index
| Exhibit Number |
Description of Exhibit | |
| 10.16 | Guarantee Agreement dated February 13, 2008, among Kadant Inc. and the Subsidiary Guarantors, in favor of JPMorgan Chase Bank, N.A., as Administrative Agent for the several banks and other financial institutions or entities from time to time parties to the Credit Agreement dated as of February 13, 2008 (filed as Exhibit 99.2 to the Registrant’s Current Report on Form 8-K [File No. 1-11406] filed with the Commission on February 15, 2008 and incorporated in this document by reference). (1) | |
| 10.17 | Joinder Agreement dated as of March 17, 2008, to Credit Agreement dated as of February 13, 2008, among the Registrant, the Foreign Subsidiary Borrowers from time to time parties thereto, the several lenders from time to time parties thereto, and JPMorgan Chase Bank, N.A., as Administrative Agent, and J.P. Morgan Europe Limited, as Multi-currency Administrative Agent (filed as Exhibit 10.1 to the Registrant’s Quarterly Report on Form 10-Q for the quarter ended March 29, 2008 [File No. 1-11406] and incorporated in this document by reference). | |
| 10.18 | International Swap Dealers Association, Inc. Master Agreement dated May 13, 2005 between the Registrant and Citizens Bank of Massachusetts and Swap Confirmation dated May 18, 2005 (filed as Exhibit 10.1 to the Registrant’s Quarterly Report on Form 10-Q for the quarter ended July 2, 2005 [File No. 1-11406] and incorporated in this document by reference). | |
| 10.19 | Swap Confirmation dated February 13, 2008 between the Registrant and RBS Citizens, N.A. (filed as Exhibit 10.35 to the Registrant’s Annual Report on Form 10-K for the year ended December 29, 2007 [File No. 1-11406] and incorporated in this document by reference). | |
| 10.20 | Promissory Note in the principal amount of $10,000,000 dated May 4, 2006, between the Registrant and Citizens Bank of Massachusetts (filed as Exhibit 99.1 to the Registrant’s Current Report on Form 8-K [File No. 1-11406] filed with the Commission on May 9, 2006 and incorporated in this document by reference). | |
| 10.21 | Limited Guaranty Agreement dated May 4, 2006 between Kadant Web Systems Inc., a Massachusetts corporation, and Citizens Bank of Massachusetts (filed as Exhibit 99.2 to the Registrant’s Current Report on Form 8-K [File No. 1-11406] filed with the Commission on May 9, 2006 and incorporated in this document by reference). | |
| 10.22 | Limited Guaranty Agreement dated May 4, 2006 between Kadant Black Clawson Inc., a Delaware corporation, and Citizens Bank of Massachusetts (filed as Exhibit 99.3 to the Registrant’s Current Report on Form 8-K [File No. 1-11406] filed with the Commission on May 9, 2006 and incorporated in this document by reference). | |
| 10.23 | Limited Guaranty Agreement dated May 4, 2006 between Kadant Johnson Inc., a Michigan corporation, and Citizens Bank of Massachusetts (filed as Exhibit 99.4 to the Registrant’s Current Report on Form 8-K [File No. 1-11406] filed with the Commission on May 9, 2006 and incorporated in this document by reference). | |
| 10.24 | Mortgage and Security Agreement dated May 4, 2006 between Kadant Web Systems Inc., a Massachusetts corporation, and Citizens Bank of Massachusetts relating to the real property and related personal property located in Auburn, Massachusetts (filed as Exhibit 99.6 to the Registrant’s Current Report on Form 8-K [File No. 1-11406] filed with the Commission on May 9, 2006 and incorporated in this document by reference). (1) | |
| 10.25 | Amendment dated as of January 3, 2010 between the Registrant and RBS Citizens, National Association to the Mortgage and Security Agreement dated May 4, 2006 between Kadant Web Systems Inc. and Citizens Bank of Massachusetts (filed as Exhibit 10.20 to the Registrant’s Annual Report on Form 10-K for the year ended January 2, 2010 [File No. 1-11406] and incorporated in this document by reference). | |
45
Table of Contents
Exhibit Index
| Exhibit Number |
Description of Exhibit | |
| 10.26 | Mortgage and Security Agreement dated May 4, 2006 between Kadant Black Clawson Inc., a Delaware corporation, and Citizens Bank of Massachusetts relating to the real property and related personal property located in Theodore, Alabama (filed as Exhibit 99.7 to the Registrant’s Current Report on Form 8-K [File No. 1-11406] filed with the Commission on May 9, 2006 and incorporated in this document by reference). (1) | |
| 10.27 | Mortgage and Security Agreement dated May 9, 2006 between Kadant Johnson Inc., a Michigan corporation, and Citizens Bank of Massachusetts relating to the real property and related personal property located in Three Rivers, Michigan (filed as Exhibit 99.8 to the Registrant’s Current Report on Form 8-K [File No. 1-11406] filed with the Commission on May 9, 2006 and incorporated in this document by reference). (1) | |
| 10.28 | Plan and Agreement of Distribution, dated as of August 3, 2001, between the Registrant and Thermo Electron Corporation (filed as Exhibit 99.3 to the Registrant’s Current Report on Form 8-K [File No. 1-11406] filed with the Commission on August 6, 2001 and incorporated in this document by reference). | |
| 10.29 | First Amendment to Plan and Agreement of Distribution, dated as of December 27, 2001, between the Registrant and Thermo Electron Corporation (filed as Exhibit 10.4 to the Registrant’s Annual Report on Form 10-K for the year ended December 29, 2001 [File No. 1-11406] and incorporated in this document by reference). | |
| 10.30 | Tax Matters Agreement, dated as of August 8, 2001, between the Registrant and Thermo Electron Corporation (filed as Exhibit 99.4 to the Registrant’s Current Report on Form 8-K [File No. 1-11406] filed with the Commission on August 6, 2001 and incorporated in this document by reference). | |
| 21 | Subsidiaries of the Registrant. | |
| 23.1 | Consent of Independent Registered Public Accounting Firm. | |
| 31.1 | Certification of the Principal Executive Officer of the Registrant Pursuant to Rule 13a-15(e) and Rule 15d-14(a) of the Securities Exchange Act of 1934, as amended. | |
| 31.2 | Certification of the Principal Financial Officer of the Registrant Pursuant to Rule 13a-15(e) and Rule 15d-14(a) of the Securities Exchange Act of 1934, as amended. | |
| 32 | Certification of the Chief Executive Officer and the Chief Financial Officer of the Registrant pursuant to 18 U.S.C. Section 1350, as adopted pursuant to Section 906 of the Sarbanes-Oxley Act of 2002. | |
| * | Management contract or compensatory plan or arrangement. |
| (1) | The schedules to this document have been omitted from this filing pursuant to Item 601(b)(2) of Regulation S-K. The Company will furnish copies of any of the schedules to the U.S. Securities and Exchange Commission upon request. |
46
Table of Contents
Annual Report on Form 10-K
Index to Consolidated Financial Statements and Schedule
The following Consolidated Financial Statements of the Registrant and its subsidiaries are required to be included in Item 8:
| Page | ||||
| F-2 | ||||
| Report of Independent Registered Public Accounting Firm on Internal Control over Financial Reporting |
F-3 | |||
| F-4 | ||||
| Consolidated Balance Sheet as of January 1, 2011 and January 2, 2010 |
F-5 | |||
| F-6 | ||||
| F-7 | ||||
| F-8 | ||||
| The following Consolidated Financial Statement Schedule of the Registrant and its subsidiaries is filed as part of this Report as required to be included in Item 15(a)(2): |
| |||
| Page | ||||
| F-45 | ||||
F-1
Table of Contents
Report of Independent Registered Public Accounting Firm
on Consolidated Financial Statements and Schedule
To the Board of Directors and Shareholders of Kadant Inc.:
We have audited the accompanying consolidated balance sheet of Kadant Inc. as of January 1, 2011 and January 2, 2010, and the related consolidated statements of operations, comprehensive income (loss) and shareholders’ investment, and cash flows for each of the three fiscal years in the period ended January 1, 2011. Our audits also included the financial statement schedule listed in the index at Item 15(a)(2). These financial statements and schedule are the responsibility of the Company’s management. Our responsibility is to express an opinion on these financial statements and schedule based on our audits.
We conducted our audits in accordance with the standards of the Public Company Accounting Oversight Board (United States). Those standards require that we plan and perform the audit to obtain reasonable assurance about whether the financial statements are free of material misstatement. An audit includes examining, on a test basis, evidence supporting the amounts and disclosures in the financial statements. An audit also includes assessing the accounting principles used and significant estimates made by management, as well as evaluating the overall financial statement presentation. We believe that our audits provide a reasonable basis for our opinion.
In our opinion, the financial statements referred to above present fairly, in all material respects, the consolidated financial position of Kadant Inc. at January 1, 2011 and January 2, 2010 and the consolidated results of its operations and its cash flows for each of the three years in the fiscal period ended January 1, 2011, in conformity with U.S. generally accepted accounting principles. Also, in our opinion, the related financial statement schedule, when considered in relation to the basic financial statements taken as a whole, presents fairly in all material respects the information set forth therein.
We also have audited, in accordance with the standards of the Public Company Accounting Oversight Board (United States), Kadant Inc.’s internal control over financial reporting as of January 1, 2011, based on criteria established in Internal Control-Integrated Framework issued by the Committee of Sponsoring Organizations of the Treadway Commission and our report dated March 17, 2011 expressed an unqualified opinion thereon.
/s/ Ernst & Young LLP
Boston, Massachusetts
March 17, 2011
F-2
Table of Contents
Report of Independent Registered Public Accounting Firm
on Internal Control over Financial Reporting
To the Board of Directors and Shareholders of Kadant Inc.:
We have audited Kadant Inc.’s internal control over financial reporting as of January 1, 2011, based on criteria established in Internal Control—Integrated Framework issued by the Committee of Sponsoring Organizations of the Treadway Commission (the COSO criteria). Kadant Inc.’s management is responsible for maintaining effective internal control over financial reporting, and for its assessment of the effectiveness of internal control over financial reporting included in the accompanying Management’s Annual Report on Internal Control over Financial Reporting. Our responsibility is to express an opinion on the Company’s internal control over financial reporting based on our audit.
We conducted our audit in accordance with the standards of the Public Company Accounting Oversight Board (United States). Those standards require that we plan and perform the audit to obtain reasonable assurance about whether effective internal control over financial reporting was maintained in all material respects. Our audit included obtaining an understanding of internal control over financial reporting, assessing the risk that a material weakness exists, testing and evaluating the design and operating effectiveness of internal control based on the assessed risk, and performing such other procedures as we considered necessary in the circumstances. We believe that our audit provides a reasonable basis for our opinion.
A company’s internal control over financial reporting is a process designed to provide reasonable assurance regarding the reliability of financial reporting and the preparation of financial statements for external purposes in accordance with generally accepted accounting principles. A company’s internal control over financial reporting includes those policies and procedures that (1) pertain to the maintenance of records that, in reasonable detail, accurately and fairly reflect the transactions and dispositions of the assets of the company; (2) provide reasonable assurance that transactions are recorded as necessary to permit preparation of financial statements in accordance with generally accepted accounting principles, and that receipts and expenditures of the company are being made only in accordance with authorizations of management and directors of the company; and (3) provide reasonable assurance regarding prevention or timely detection of unauthorized acquisition, use, or disposition of the company’s assets that could have a material effect on the financial statements.
Because of its inherent limitations, internal control over financial reporting may not prevent or detect misstatements. Also, projections of any evaluation of effectiveness to future periods are subject to the risk that controls may become inadequate because of changes in conditions, or that the degree of compliance with the policies or procedures may deteriorate.
In our opinion, Kadant Inc. maintained, in all material respects, effective internal control over financial reporting as of January 1, 2011, based on the COSO criteria.
We also have audited, in accordance with the standards of the Public Company Accounting Oversight Board (United States), the 2010 consolidated financial statements of Kadant Inc. and our report dated March 17, 2011 expressed an unqualified opinion thereon.
/s/ Ernst & Young LLP
Boston, Massachusetts
March 17, 2011
F-3
Table of Contents
| Kadant Inc. | 2010 Financial Statements |
Consolidated Statement of Operations
| (In thousands, except per share amounts) |
2010 | 2009 | 2008 | |||||||||
| Revenues (Note 12) |
$ | 270,029 | $ | 225,565 | $ | 329,158 | ||||||
| Costs and Operating Expenses: |
||||||||||||
| Cost of revenues |
151,604 | 134,759 | 193,355 | |||||||||
| Selling, general, and administrative expenses |
89,212 | 81,229 | 100,280 | |||||||||
| Research and development expenses |
5,269 | 5,622 | 6,187 | |||||||||
| Restructuring costs and other income, net (Note 8) |
(1,005 | ) | 4,429 | 2,010 | ||||||||
| Goodwill impairment (Note 1) |
– | – | 40,333 | |||||||||
| 245,080 | 226,039 | 342,165 | ||||||||||
| Operating Income (Loss) |
24,949 | (474 | ) | (13,007 | ) | |||||||
| Interest Income |
214 | 387 | 1,935 | |||||||||
| Interest Expense |
(1,315 | ) | (2,171 | ) | (2,738 | ) | ||||||
| Income (Loss) from Continuing Operations Before Provision for Income Taxes |
23,848 | (2,258 | ) | (13,810 | ) | |||||||
| Provision for Income Taxes (Note 5) |
5,198 | 3,692 | 8,466 | |||||||||
| Income (Loss) from Continuing Operations |
18,650 | (5,950 | ) | (22,276 | ) | |||||||
| Income (Loss) from Discontinued Operation (net of income tax benefit of $164, $10 and $65 in 2010, 2009, and 2008, respectively; Note 9) |
98 | (18 | ) | 37 | ||||||||
| Net Income (Loss) |
18,748 | (5,968 | ) | (22,239 | ) | |||||||
| Net (Income) Loss Attributable to Noncontrolling Interest |
(241 | ) | 44 | (319 | ) | |||||||
| Net Income (Loss) Attributable to Kadant |
$ | 18,507 | $ | (5,924 | ) | $ | (22,558 | ) | ||||
| Amounts Attributable to Kadant: |
||||||||||||
| Income (Loss) from Continuing Operations |
$ | 18,409 | $ | (5,906 | ) | $ | (22,595 | ) | ||||
| Income (Loss) from Discontinued Operation |
98 | (18 | ) | 37 | ||||||||
| Net Income (Loss) Attributable to Kadant |
$ | 18,507 | $ | (5,924 | ) | $ | (22,558 | ) | ||||
| Earnings (Loss) per Share from Continuing Operations Attributable to Kadant (Note 13) |
||||||||||||
| Basic |
$ | 1.49 | $ | (.48 | ) | $ | (1.67 | ) | ||||
| Diluted |
$ | 1.48 | $ | (.48 | ) | $ | (1.67 | ) | ||||
| Earnings (Loss) per Share Attributable to Kadant (Note 13) |
||||||||||||
| Basic |
$ | 1.50 | $ | (.48 | ) | $ | (1.67 | ) | ||||
| Diluted |
$ | 1.48 | $ | (.48 | ) | $ | (1.67 | ) | ||||
| Weighted Average Shares (Note 13) |
||||||||||||
| Basic |
12,339 | 12,331 | 13,527 | |||||||||
| Diluted |
12,466 | 12,331 | 13,527 | |||||||||
The accompanying notes are an integral part of these consolidated financial statements.
F-4
Table of Contents
| Kadant Inc. | 2010 Financial Statements |
| (In thousands, except share amounts) |
2010 | 2009 | ||||||
| Assets |
||||||||
| Current Assets: |
||||||||
| Cash and cash equivalents |
$ | 61,805 | $ | 45,675 | ||||
| Accounts receivable, less allowances of $2,185 and $2,493 |
49,897 | 36,436 | ||||||
| Unbilled contract costs and fees |
875 | 3,370 | ||||||
| Inventories |
41,628 | 37,435 | ||||||
| Other current assets |
9,001 | 7,859 | ||||||
| Assets of discontinued operation (Note 9) |
401 | 496 | ||||||
| Total Current Assets |
163,607 | 131,271 | ||||||
| Property, Plant, and Equipment, at Cost, Net |
36,911 | 38,415 | ||||||
| Other Assets |
11,473 | 12,277 | ||||||
| Intangible Assets |
26,793 | 28,071 | ||||||
| Goodwill |
97,988 | 97,622 | ||||||
| Total Assets |
$ | 336,772 | $ | 307,656 | ||||
| Liabilities and Shareholders’ Investment |
||||||||
| Current Liabilities: |
||||||||
| Short-term obligations and current maturities of long-term obligations (Note 6) |
$ | 5,500 | $ | 500 | ||||
| Accounts payable |
23,756 | 17,612 | ||||||
| Accrued payroll and employee benefits |
15,739 | 11,515 | ||||||
| Customer deposits |
19,269 | 11,920 | ||||||
| Other current liabilities |
17,940 | 20,380 | ||||||
| Liabilities of discontinued operation (Note 9) |
2,397 | 2,427 | ||||||
| Total Current Liabilities |
84,601 | 64,354 | ||||||
| Deferred Income Taxes (Note 5) |
10,736 | 8,240 | ||||||
| Other Long-Term Liabilities (Note 3) |
16,884 | 18,281 | ||||||
| Long-Term Obligations (Note 6) |
17,250 | 22,750 | ||||||
| Commitments and Contingencies (Note 7) |
||||||||
| Shareholders’ Investment (Notes 3 and 4): |
||||||||
| Preferred stock, $.01 par value, 5,000,000 shares authorized; none issued |
– | – | ||||||
| Common stock, $.01 par value, 150,000,000 shares authorized; 14,624,159 shares issued |
146 | 146 | ||||||
| Capital in excess of par value |
92,935 | 92,244 | ||||||
| Retained earnings |
165,131 | 146,624 | ||||||
| Treasury stock at cost, 2,369,422 and 2,219,221 shares |
(48,786 | ) | (46,558 | ) | ||||
| Accumulated other comprehensive items (Note 14) |
(3,586 | ) | 252 | |||||
| Total Kadant Shareholders’ Investment |
205,840 | 192,708 | ||||||
| Noncontrolling interest |
1,461 | 1,323 | ||||||
| Total Shareholders’ Investment |
207,301 | 194,031 | ||||||
| Total Liabilities and Shareholders’ Investment |
$ | 336,772 | $ | 307,656 | ||||
The accompanying notes are an integral part of these consolidated financial statements.
F-5
Table of Contents
| Kadant Inc. | 2010 Financial Statements |
Consolidated Statement of Cash Flows
| (In thousands) |
2010 | 2009 | 2008 | |||||||||
| Operating Activities |
||||||||||||
| Net income (loss) attributable to Kadant |
$ | 18,507 | $ | (5,924 | ) | $ | (22,558 | ) | ||||
| Net income (loss) attributable to noncontrolling interest |
241 | (44 | ) | 319 | ||||||||
| (Income) loss from discontinued operation |
(98 | ) | 18 | (37 | ) | |||||||
| Income (loss) from continuing operations |
18,650 | (5,950 | ) | (22,276 | ) | |||||||
| Adjustments to reconcile income (loss) from continuing operations to net cash provided by operating activities: |
||||||||||||
| Goodwill impairment |
– | – | 40,333 | |||||||||
| Depreciation and amortization |
7,228 | 7,448 | 7,530 | |||||||||
| Stock-based compensation expense |
2,754 | 2,669 | 2,945 | |||||||||
| Gain on sale of property, plant and equipment |
(1,016 | ) | (12 | ) | (1,761 | ) | ||||||
| Provision for losses on accounts receivable |
455 | 305 | 1,252 | |||||||||
| Deferred income tax expense |
1,249 | 892 | 4,051 | |||||||||
| Other items, net |
671 | 945 | 811 | |||||||||
| Changes in current assets and liabilities, net of effects of acquisitions: |
||||||||||||
| Accounts receivable |
(13,506 | ) | 18,625 | (220 | ) | |||||||
| Unbilled contract costs and fees |
2,209 | 6,736 | 17,412 | |||||||||
| Inventories |
(4,001 | ) | 18,833 | (10,202 | ) | |||||||
| Other current assets |
(2,235 | ) | 9,380 | (1,387 | ) | |||||||
| Accounts payable |
6,250 | (6,657 | ) | (11,900 | ) | |||||||
| Other current liabilities |
11,755 | (5,298 | ) | (5,630 | ) | |||||||
| 472 | 41,619 | (11,927 | ) | |||||||||
| Contributions to pension plan |
(2,200 | ) | (4,800 | ) | (1,600 | ) | ||||||
| Net cash provided by continuing operations |
28,263 | 43,116 | 19,358 | |||||||||
| Net cash provided by discontinued operation |
163 | 10 | 803 | |||||||||
| Net cash provided by operating activities |
28,426 | 43,126 | 20,161 | |||||||||
| Investing Activities |
||||||||||||
| Acquisitions, net of cash acquired |
(5,800 | ) | (1,354 | ) | (2,119 | ) | ||||||
| Purchases of property, plant, and equipment |
(3,408 | ) | (2,804 | ) | (6,198 | ) | ||||||
| Proceeds from sale of property, plant, and equipment |
2,916 | 115 | 2,859 | |||||||||
| Other, net |
(60 | ) | – | 155 | ||||||||
| Net cash used in continuing operations for investing activities |
(6,352 | ) | (4,043 | ) | (5,303 | ) | ||||||
| Financing Activities |
||||||||||||
| Repayments of short- and long-term obligations |
(500 | ) | (54,153 | ) | (54,474 | ) | ||||||
| Proceeds from issuance of short- and long-term obligations |
– | 22,000 | 68,791 | |||||||||
| Purchases of Company common stock |
(4,407 | ) | (3,722 | ) | (47,623 | ) | ||||||
| Proceeds from issuance of Company common stock |
345 | 544 | 3,825 | |||||||||
| Tax benefits from stock-based compensation awards |
26 | 33 | 532 | |||||||||
| Other, net |
– | (6 | ) | (766 | ) | |||||||
| Net cash used in continuing operations for financing activities |
(4,536 | ) | (35,304 | ) | (29,715 | ) | ||||||
| Exchange Rate Effect on Cash from Continuing Operations |
(1,409 | ) | 1,757 | (6,558 | ) | |||||||
| Change in Cash from Discontinued Operation |
1 | – | 1 | |||||||||
| Increase (Decrease) in Cash and Cash Equivalents from Continuing Operations |
16,130 | 5,536 | (21,414 | ) | ||||||||
| Cash and Cash Equivalents at Beginning of Year |
45,675 | 40,139 | 61,553 | |||||||||
| Cash and Cash Equivalents at End of Year |
$ | 61,805 | $ | 45,675 | $ | 40,139 | ||||||
See Note 1 for supplemental cash flow information.
The accompanying notes are an integral part of these consolidated financial statements.
F-6
Table of Contents
| Kadant Inc. | 2010 Financial Statements |
Consolidated Statement of Comprehensive Income (Loss) and Shareholders’ Investment
| (In thousands, except par value) |
2010 | 2009 | 2008 | |||||||||
| Comprehensive Income (Loss) |
||||||||||||
| Net Income (Loss) |
$ | 18,748 | $ | (5,968 | ) | $ | (22,239 | ) | ||||
| Other Comprehensive Items: |
||||||||||||
| Foreign currency translation (loss) gain |
(3,367 | ) | 6,844 | (14,964 | ) | |||||||
| Pension and other post-retirement liability adjustments, net (net of tax of $80, $167, and $52 in 2010, 2009, and 2008, respectively) |
(408 | ) | (931 | ) | (5,510 | ) | ||||||
| Deferred (loss) gain on hedging instruments (net of tax of $44, $7, and $200 in 2010, 2009, and 2008, respectively) |
(166 | ) | 575 | (1,715 | ) | |||||||
| Other Comprehensive Items |
(3,941 | ) | 6,488 | (22,189 | ) | |||||||
| Comprehensive Income (Loss) |
14,807 | 520 | (44,428 | ) | ||||||||
| Comprehensive Income Attributable to Noncontrolling Interest |
(138 | ) | (4 | ) | (216 | ) | ||||||
| Comprehensive Income (Loss) Attributable to Kadant |
$ | 14,669 | $ | 516 | $ | (44,644 | ) | |||||
| Shareholders’ Investment |
||||||||||||
| Common Stock, $.01 Par Value: |
||||||||||||
| Balance at beginning and end of year (14,624,159 shares at year-end 2010, 2009, and 2008) |
$ | 146 | $ | 146 | $ | 146 | ||||||
| Capital in Excess of Par Value: |
||||||||||||
| Balance at beginning of year |
92,244 | 92,916 | 91,753 | |||||||||
| Activity under stock and 401(K) plans |
665 | (648 | ) | 631 | ||||||||
| Tax benefits related to employees’ and directors’ stock plans |
26 | 33 | 532 | |||||||||
| Acquisition of minority interest in subsidiary |
– | (57 | ) | – | ||||||||
| Balance at end of year |
92,935 | 92,244 | 92,916 | |||||||||
| Retained Earnings: |
||||||||||||
| Balance at beginning of year |
146,624 | 152,548 | 175,106 | |||||||||
| Net income (loss) attributable to Kadant |
18,507 | (5,924 | ) | (22,558 | ) | |||||||
| Balance at end of year |
165,131 | 146,624 | 152,548 | |||||||||
| Treasury Stock, at Cost: |
||||||||||||
| Balance at beginning of year (2,219,221; 2,074,362; and 174,045 shares) |
(46,558 | ) | (46,707 | ) | (4,152 | ) | ||||||
| Purchases of Company common stock (255,500; 289,800; and 2,140,800 shares) |
(4,407 | ) | (2,891 | ) | (48,454 | ) | ||||||
| Activity under stock and 401(K) plans (105,299; 144,941; and 240,483 shares) |
2,179 | 3,040 | 5,899 | |||||||||
| Balance at end of year (2,369,422; 2,219,221; and 2,074,362 shares) |
(48,786 | ) | (46,558 | ) | (46,707 | ) | ||||||
| Accumulated Other Comprehensive Items: |
||||||||||||
| Balance at beginning of year |
252 | (6,188 | ) | 15,898 | ||||||||
| Other comprehensive items |
(3,838 | ) | 6,440 | (22,086 | ) | |||||||
| Balance at end of year |
(3,586 | ) | 252 | (6,188 | ) | |||||||
| Total Kadant Shareholders’ Investment |
205,840 | 192,708 | 192,715 | |||||||||
| Noncontrolling Interest: |
||||||||||||
| Balance at beginning of year |
1,323 | 1,678 | 1,462 | |||||||||
| Net income (loss) attributable to noncontrolling interest |
241 | (44 | ) | 319 | ||||||||
| Acquisition of minority interest in subsidiary |
– | (141 | ) | – | ||||||||
| Dividend paid |
– | (218 | ) | – | ||||||||
| Other comprehensive items |
(103 | ) | 48 | (103 | ) | |||||||
| Balance at end of year |
1,461 | 1,323 | 1,678 | |||||||||
| Total Shareholders’ Investment |
$ | 207,301 | $ | 194,031 | $ | 194,393 | ||||||
The accompanying notes are an integral part of these consolidated financial statements.
F-7
Table of Contents
| Kadant Inc. | 2010 Financial Statements |
Notes to Consolidated Financial Statements
| 1. | Nature of Operations and Summary of Significant Accounting Policies |
Nature of Operations
Kadant Inc. and its subsidiaries’ (collectively, the Company) continuing operations include one operating segment, Papermaking Systems, and a separate product line, Fiber-based Products. Through its Papermaking Systems segment, the Company develops, manufactures, and markets a range of equipment and products for the global papermaking and paper recycling industries. The Company’s principal products in this segment include custom-engineered stock-preparation systems and equipment for the preparation of wastepaper for conversion into recycled paper; fluid-handling systems used primarily in the dryer section of the papermaking process and during the production of corrugated boxboard, metals, plastics, rubber, textiles, chemicals, and food; doctoring systems and equipment and related consumables important to the efficient operation of paper machines; and water-management systems essential for draining, purifying, and recycling process water. Through its Fiber-based Products business, the Company manufactures and sells granules derived from papermaking byproducts primarily for use as agricultural carriers and for home lawn and garden applications.
In 2005, the Company’s Kadant Composites LLC subsidiary (Composites LLC) sold its composites business, which is presented as a discontinued operation in the accompanying consolidated financial statements. Under the terms of the asset purchase agreement, Composites LLC retained certain liabilities associated with the operation of the business prior to the sale, including warranty obligations related to products manufactured prior to the sale date. Composites LLC retained all of the cash proceeds received from the asset sale and continued to administer and pay warranty claims from the sale proceeds into the third quarter of 2007. On September 30, 2007, Composites LLC announced that it no longer had sufficient funds to honor warranty claims, was unable to pay or process warranty claims, and ceased doing business. At January 1, 2011, the accrued warranty costs for Composites LLC were $2,142,000, which represents the low end of the range of potential loss for products under warranty based on the level of claims received before Composites LLC ceased operations and judgments entered against it in litigation. Composites LLC has calculated that the potential warranty cost ranges from $2,142,000 to approximately $13,100,000. See Warranty Obligations for Discontinued Operation below for further information. All future activity associated with this warranty reserve will continue to be classified in the results of the discontinued operation in the Company’s consolidated financial statements.
Company History and Former Relationship with Thermo Electron Corporation
The Company was incorporated in Delaware in November 1991 to be the successor-in-interest to several papermaking equipment businesses of Thermo Electron Corporation (Thermo Electron). In November 1992, the Company completed an initial public offering of a portion of its common stock. On July 12, 2001, the Company changed its name to Kadant Inc. from Thermo Fibertek Inc. Thermo Electron disposed of its remaining equity interest in the Company by means of a dividend to Thermo Electron shareholders on August 8, 2001 (Spinoff Date). On May 14, 2003, the Company began trading on the New York Stock Exchange under the ticker symbol “KAI.”
Principles of Consolidation
The accompanying consolidated financial statements of the Company include the accounts of its wholly and majority-owned subsidiaries. All material intercompany accounts and transactions have been eliminated.
Fiscal Year
The Company has adopted a fiscal year ending on the Saturday nearest to December 31. References to 2010, 2009, and 2008 are for the fiscal years ended January 1, 2011, January 2, 2010, and January 3, 2009, respectively.
F-8
Table of Contents
| Kadant Inc. | 2010 Financial Statements |
Notes to Consolidated Financial Statements
| 1. | Nature of Operations and Summary of Significant Accounting Policies (continued) |
Use of Estimates and Critical Accounting Policies
The preparation of financial statements in conformity with U.S. generally accepted accounting principles requires management to make estimates and assumptions that affect the reported amounts of assets and liabilities, disclosure of contingent assets and liabilities at the date of the financial statements, and the reported amounts of revenues and expenses during the reporting period.
Critical accounting policies are defined as those that entail significant judgments and estimates, and could potentially result in materially different results under different assumptions and conditions. The Company believes that the most critical accounting policies upon which its financial position depends, and which involve the most complex or subjective decisions or assessments, concern revenue recognition and accounts receivable, warranty obligations for continuing operations and the discontinued operation, income taxes, the valuation of goodwill and intangible assets, inventories, pension obligations, and derivatives. A discussion on the application of these and other accounting policies is included in Note 1.
Although the Company makes every effort to ensure the accuracy of the estimates and assumptions used in the preparation of its consolidated financial statements or in the application of accounting policies, if business conditions were different, or if the Company used different estimates and assumptions, it is possible that materially different amounts could be reported in the Company’s consolidated financial statements.
Revenue Recognition and Accounts Receivable
The Company recognizes revenue under Accounting Standards Codification (ASC) 605, “Revenue Recognition,” (ASC 605). Revenue is generally recognized when products are delivered or services are performed. The Company includes in revenue amounts invoiced for shipping and handling with the corresponding costs reflected in cost of revenues. When the terms of the sale include customer acceptance provisions, and compliance with those provisions cannot be demonstrated until customer acceptance, revenues are recognized upon such acceptance.
Due to the significance of the Company’s capital goods and spare parts businesses, most of the Company’s revenue is recognized in accordance with the accounting policies in the preceding paragraph. However, when a sale arrangement involves multiple elements, such as equipment and installation, the Company considers the guidance in ASC 605. Such transactions are evaluated to determine whether the deliverables in the arrangement represent separate units of accounting. If equipment and installation do not meet the separation criteria under ASC 605, revenues for products sold that require installation for which the installation is essential to functionality, or is not deemed inconsequential or perfunctory, are recognized upon completion of installation. Revenues for products sold where installation is not essential to functionality, and is deemed inconsequential or perfunctory, are recognized upon shipment with estimated installation costs accrued.
In addition, revenues and profits on certain long-term contracts are recognized using the percentage-of-completion method pursuant to ASC 605. Revenues recorded under the percentage-of-completion method were $26,145,000 in 2010, $32,034,000 in 2009, and $58,137,000 in 2008. The percentage of completion is determined by comparing the actual costs incurred to date to an estimate of total costs to be incurred on each contract. If a loss is indicated on any contract in process, a provision is made currently for the entire loss. The Company’s contracts generally provide for billing of customers upon the attainment of certain milestones specified in each contract. Revenues earned on contracts in process in excess of billings are classified as unbilled contract costs and fees, and amounts billed in excess of revenues earned are classified as billings in excess of contract costs and fees, which are included in other current liabilities in the accompanying balance sheet. There are no significant amounts included in the accompanying balance sheet that are not expected to be recovered from existing contracts at current contract values, or that are not expected to be collected within one year, including amounts that are billed but not paid under retainage provisions.
F-9
Table of Contents
| Kadant Inc. | 2010 Financial Statements |
Notes to Consolidated Financial Statements
| 1. | Nature of Operations and Summary of Significant Accounting Policies (continued) |
The Company exercises judgment in determining its allowance for bad debts, which is based on its historical collection experience, current trends, credit policies, specific customer collection issues, and accounts receivable aging categories. In determining this allowance, the Company looks at historical writeoffs of its receivables. The Company also looks at current trends in the credit quality of its customer base as well as changes in its credit policies. The Company performs ongoing credit evaluations of its customers and adjusts credit limits based upon payment history and each customer’s current creditworthiness. The Company continuously monitors collections and payments from its customers. In some instances, the Company utilizes letters of credit as a way to mitigate its credit exposure. In addition, the Company obtains letters of credit, principally issued by banks in China, related to certain contracts with its Chinese customers under which revenue is recognized using the percentage-of-completion method of accounting. While actual bad debts have historically been within the Company’s expectations and the provisions established, the Company cannot guarantee that it will continue to experience the same rate of bad debts that it has had in the past. A significant change in the liquidity or financial position of any of the Company’s customers could result in the uncollectibility of the related accounts receivable and could adversely affect its operating cash flows in that period.
Warranty Obligations for Continuing Operations
The Company provides for the estimated cost of product warranties at the time of sale based on the actual historical occurrence rates and repair costs. The Company typically negotiates the terms regarding warranty coverage and length of warranty depending on the products and applications. While the Company engages in extensive product quality programs and processes, the Company’s warranty obligation is affected by product failure rates, repair costs, service delivery costs incurred in correcting a product failure, and supplier warranties on parts delivered to the Company. Should actual product failure rates, repair costs, service delivery costs, or supplier warranties on parts differ from the Company’s estimates, revisions to the estimated warranty liability would be required. The changes in the carrying amount of accrued warranty costs included in other current liabilities in the accompanying consolidated balance sheet are as follows:
| (In thousands) |
2010 | 2009 | ||||||
| Balance at Beginning of Year |
$ | 2,801 | $ | 3,671 | ||||
| Provision charged to income |
2,915 | 960 | ||||||
| Usage |
(1,854 | ) | (1,887 | ) | ||||
| Currency translation |
(84 | ) | 57 | |||||
| Balance at End of Year |
$ | 3,778 | $ | 2,801 | ||||
Warranty Obligations for Discontinued Operation
In 2005, Composites LLC sold substantially all of its assets to a third party. Under the terms of the asset purchase agreement, Composites LLC retained certain liabilities associated with the operation of the business prior to the sale, including the warranty obligations associated with products manufactured prior to the sale date. Composites LLC retained all of the cash proceeds received from the asset sale and continued to administer and pay warranty claims from the sale proceeds into the third quarter of 2007. On September 30, 2007, Composites LLC announced that it no longer had sufficient funds to honor warranty claims, was unable to pay or process warranty claims, and ceased doing business. All activity related to this business is classified in the results of the discontinued operation in the accompanying consolidated financial statements.
Through the sale date of October 21, 2005, Composites LLC offered a standard limited warranty to the owner of its decking and roofing products, limited to repair or replacement of the defective product or a refund of the original purchase price. As of January 1, 2011 and January 2, 2010, the accrued warranty costs associated
F-10
Table of Contents
| Kadant Inc. | 2010 Financial Statements |
Notes to Consolidated Financial Statements
| 1. | Nature of Operations and Summary of Significant Accounting Policies (continued) |
with the composites business were $2,142,000, which represents the low end of the estimated range of warranty reserve required based on the level of claims received before Composites LLC ceased operations and judgments entered against it in litigation. Composites LLC has calculated that the total potential warranty cost ranges from $2,142,000 to approximately $13,100,000. The high end of the range represents the estimated maximum level of warranty claims remaining based on the total sales of the products under warranty. Composites LLC will continue to record adjustments to the accrued warranty costs to reflect the minimum amount of the potential range of loss for products under warranty based on judgments entered against it in litigation, if any.
Income Taxes
In accordance with ASC 740, “Income Taxes,” (ASC 740), the Company recognizes deferred income taxes based on the expected future tax consequences of differences between the financial statement basis and the tax basis of assets and liabilities, calculated using enacted tax rates in effect for the year in which the differences are expected to reverse. A tax valuation allowance is established, as needed, to reduce net deferred tax assets to the amount expected to be realized. In the event it becomes more likely than not that some or all of the deferred tax asset allowances will not be needed, the valuation allowance will be adjusted.
It is the Company’s policy to provide for uncertain tax positions and the related interest and penalties based upon management’s assessment of whether a tax benefit is more likely than not to be sustained upon examination by tax authorities. At January 1, 2011, the Company believes that it has appropriately accounted for any unrecognized tax benefits. To the extent the Company prevails in matters for which a liability for an unrecognized tax benefit is established or is required to pay amounts in excess of the liability, its effective tax rate in a given financial statement period may be affected.
Prior to the spinoff from Thermo Electron, the Company and Thermo Electron were parties to a tax allocation agreement under which the Company and its subsidiaries, except its foreign operations, its Fiberprep subsidiary, and in 2000, its Composites LLC subsidiary, were included in the consolidated federal and certain state income tax returns filed by Thermo Electron. The tax allocation agreement provided that, in years in which these entities had taxable income, the Company would pay to Thermo Electron amounts comparable to the taxes it would have paid if the Company had filed separate tax returns. The tax allocation agreement terminated as of the Spinoff Date, at which time the Company and Thermo Electron entered into a tax matters agreement. The tax matters agreement requires, among other things, that the Company file its own income tax returns for tax periods beginning immediately after the Spinoff Date. In addition, the tax matters agreement requires that the Company indemnify Thermo Electron, but not the shareholders of Thermo Electron, against liability for taxes resulting from (a) the conduct of the Company’s business following the distribution or (b) the failure of the distribution to Thermo Electron shareholders of shares of the Company’s common stock or of Viasys Healthcare Inc. (another Thermo Electron spinoff) common stock to continue to qualify as a tax-free spinoff under Section 355 of the Internal Revenue Code as a result of certain actions that the Company takes following the distribution. Thermo Electron has agreed to indemnify the Company against taxes resulting from the conduct of Thermo Electron’s business prior to and following the distribution, or from the failure of the distribution of shares of the Company’s common stock to Thermo Electron shareholders to continue to qualify as a tax-free spinoff other than as a result of some actions that the Company may take following the distribution. Although not anticipated, if any of the Company’s post-distribution activities cause the distribution to become taxable, the Company could incur a liability to Thermo Electron and/or various taxing authorities, which could adversely affect the Company’s results of operations, financial position, and cash flows.
Earnings (Loss) per Share
Basic earnings (loss) per share has been computed by dividing net income (loss) attributable to Kadant by the weighted average number of shares outstanding during the year. Diluted earnings per share was computed
F-11
Table of Contents
| Kadant Inc. | 2010 Financial Statements |
Notes to Consolidated Financial Statements
| 1. | Nature of Operations and Summary of Significant Accounting Policies (continued) |
assuming the effect of all potentially dilutive securities, including stock options, restricted stock units and employee stock purchase plan shares, as well as their related tax effects.
Cash and Cash Equivalents
At year-end 2010 and 2009, the Company’s cash equivalents included investments in money market funds and other marketable securities, which had maturities of three months or less at the date of purchase. The carrying amounts of cash equivalents approximate their fair values due to the short-term nature of these instruments.
Supplemental Cash Flow Information
| (In thousands) |
2010 | 2009 | 2008 | |||||||||
| Cash Paid for Interest |
$ | 1,339 | $ | 1,929 | $ | 2,732 | ||||||
| Cash Paid (Refunded) for Income Taxes |
$ | 2,754 | $ | (1,635 | ) | $ | 4,340 | |||||
| Non-Cash Investing Activities: |
||||||||||||
| Fair Value of Assets Acquired |
$ | 9,565 | $ | – | $ | – | ||||||
| Cash Paid for Acquired Businesses |
(7,658 | ) | – | – | ||||||||
| Liabilities Assumed of Acquired Businesses |
$ | 1,907 | $ | – | $ | – | ||||||
| Non-Cash Financing Activities: |
||||||||||||
| Issuance of Company Common Stock |
$ | 1,499 | $ | 2,685 | $ | 488 | ||||||
Inventories
Inventories are stated at the lower of cost (on a first-in, first-out; or weighted average basis) or market value and include materials, labor, and manufacturing overhead. The Company periodically reviews its quantities of inventories on hand and compares these amounts to the expected usage of each particular product or product line. The Company records as a charge to cost of revenues any amounts required to reduce the carrying value of inventories to net realizable value. The components of inventories are as follows:
| (In thousands) |
2010 | 2009 | ||||||
| Raw Materials and Supplies |
$ | 16,718 | $ | 15,347 | ||||
| Work in Process |
8,584 | 7,500 | ||||||
| Finished Goods (includes $1,953 and $1,093 at customer locations) |
16,326 | 14,588 | ||||||
| $ | 41,628 | $ | 37,435 | |||||
F-12
Table of Contents
| Kadant Inc. | 2010 Financial Statements |
Notes to Consolidated Financial Statements
| 1. | Nature of Operations and Summary of Significant Accounting Policies (continued) |
Property, Plant, and Equipment
Property, plant, and equipment are stated at cost. The costs of additions and improvements are capitalized, while maintenance and repairs are charged to expense as incurred. The Company provides for depreciation and amortization primarily using the straight-line method over the estimated useful lives of the property as follows: buildings, 10 to 40 years; machinery and equipment, 2 to 10 years; and leasehold improvements, the shorter of the term of the lease or the life of the asset. Property, plant, and equipment consist of the following:
| (In thousands) |
2010 | 2009 | ||||||
| Land |
$ | 3,965 | $ | 4,225 | ||||
| Buildings |
34,699 | 34,656 | ||||||
| Machinery, Equipment, and Leasehold Improvements |
60,682 | 61,819 | ||||||
| 99,346 | 100,700 | |||||||
| Less: Accumulated Depreciation and Amortization |
62,435 | 62,285 | ||||||
| $ | 36,911 | $ | 38,415 | |||||
Depreciation and amortization expense related to property, plant, and equipment was $4,612,000, $5,024,000, and $5,040,000 in 2010, 2009, and 2008, respectively.
Intangible Assets
Intangible assets in the accompanying balance sheet include the costs of acquired intellectual property, tradenames, patents, customer relationships, non-compete agreements and other specifically identifiable intangible assets. An intangible asset of $8,100,000 associated with the acquisition of the Johnson tradename as part of the Company’s acquisition of The Johnson Corporation in 2005 has an indefinite life and is not being amortized. The remaining intangible assets have been amortized using the straight-line method over periods ranging from 1 to 20 years with a weighted-average amortization period of 14 years. The intangible asset lives have been determined based on the anticipated period over which the Company will derive future cash flow benefits from the intangible assets. The Company has considered the effects of legal, regulatory, contractual, competitive, and other economic factors in determining these useful lives.
Acquired intangible assets are as follows:
| (In thousands) |
Gross | Currency Translation |
Accumulated Amortization |
Net | ||||||||||||
| January 1, 2011 |
||||||||||||||||
| Customer relationships |
$ | 16,772 | $ | 1,394 | $ | (6,858 | ) | $ | 11,308 | |||||||
| Intellectual property |
13,693 | 32 | (8,313 | ) | 5,412 | |||||||||||
| Tradenames |
8,166 | 3 | (4 | ) | 8,165 | |||||||||||
| Non-compete agreements |
3,148 | 1 | (3,122 | ) | 27 | |||||||||||
| Distribution network |
2,400 | – | (806 | ) | 1,594 | |||||||||||
| Licensing agreements |
400 | – | (113 | ) | 287 | |||||||||||
| Other |
118 | – | (118 | ) | – | |||||||||||
| $ | 44,697 | $ | 1,430 | $ | (19,334 | ) | $ | 26,793 | ||||||||
F-13
Table of Contents
| Kadant Inc. | 2010 Financial Statements |
Notes to Consolidated Financial Statements
| 1. | Nature of Operations and Summary of Significant Accounting Policies (continued) |
| (In thousands) |
Gross | Currency Translation |
Accumulated Amortization |
Net | ||||||||||||
| January 2, 2010 |
||||||||||||||||
| Customer relationships |
$ | 16,308 | $ | 1,405 | $ | (5,558 | ) | $ | 12,155 | |||||||
| Intellectual property |
13,057 | – | (7,286 | ) | 5,771 | |||||||||||
| Tradenames |
8,100 | – | – | 8,100 | ||||||||||||
| Non-compete agreements |
3,119 | – | (3,119 | ) | – | |||||||||||
| Distribution network |
2,400 | – | (662 | ) | 1,738 | |||||||||||
| Licensing agreements |
400 | – | (93 | ) | 307 | |||||||||||
| $ | 43,384 | $ | 1,405 | $ | (16,718 | ) | $ | 28,071 | ||||||||
Amortization of acquired intangible assets was $2,616,000 in 2010, $2,424,000 in 2009, and $2,490,000 in 2008. The estimated future amortization expense of acquired intangible assets is $2,397,000 in 2011; $2,197,000 in 2012; $2,197,000 in 2013; $2,106,000 in 2014; $1,475,000 in 2015; and $8,321,000 in the aggregate thereafter.
Goodwill
Goodwill as of year-end 2010 and 2009 relates entirely to the Company’s Papermaking Systems segment. The changes in the carrying amount of goodwill in 2010 and 2009 are as follows:
| (In thousands) |
2010 | 2009 | ||||||
| Balance as of Beginning of Year: |
||||||||
| Gross Balance at Beginning of Year |
$ | 183,131 | $ | 180,539 | ||||
| Accumulated Impairment Losses |
(85,509 | ) | (85,509 | ) | ||||
| Net Balance at Beginning of Year |
97,622 | 95,030 | ||||||
| Increase due to acquisitions |
2,574 | – | ||||||
| Currency translation adjustment |
(2,208 | ) | 2,592 | |||||
| Total Adjustments |
366 | 2,592 | ||||||
| Balance as of End of Year: |
||||||||
| Gross Balance at End of Year |
183,497 | 183,131 | ||||||
| Accumulated Impairment Losses |
(85,509 | ) | (85,509 | ) | ||||
| Net Balance at End of Year |
$ | 97,988 | $ | 97,622 | ||||
Impairment of Long-Lived Assets
The Company evaluates the recoverability of goodwill and intangible assets with indefinite useful lives as of the end of each fiscal year, or more frequently if events or changes in circumstances, such as a decline in sales, earnings, or cash flows, or material adverse changes in the business climate, indicate that the carrying value of an asset might be impaired. For 2010, the Company performed its annual goodwill impairment test as of January 1, 2011 and determined that no impairment charge was required. For 2009, as a result of the losses experienced during the year, the Company performed goodwill impairment tests at April 4, 2009, July 4, 2009, October 3, 2009, and January 2, 2010 and no impairment charges were required. In 2008, the Company recorded a $40,333,000 pre-tax, non-cash impairment charge associated with its stock-preparation reporting unit as a result of its goodwill impairment test. During the fourth quarter of 2008, the Company experienced a significant decline in its stock price. As a result of the decline in the Company’s stock price, its market capitalization fell significantly below the recorded value of its consolidated net assets. The reduced market capitalization reflected, in part, the current economic climate, which led to weakness in demand for some of its products.
F-14
Table of Contents
| Kadant Inc. | 2010 Financial Statements |
Notes to Consolidated Financial Statements
| 1. | Nature of Operations and Summary of Significant Accounting Policies (continued) |
The Company completed its impairment test as of year-end 2008 testing goodwill for impairment using the two-step method (as prescribed under ASC 350, “Intangibles–Goodwill and Other,”) on a “reporting unit” basis. The Company’s reporting units are as follows: (1) stock-preparation (2) doctoring and water-management and (3) fluid-handling. In step 1, goodwill is considered to be impaired when the net book value of a reporting unit exceeds its estimated fair value. The fair values of the reporting units were determined utilizing a discounted cash flow methodology and considered such assumptions as weighted average cost of capital, revenue growth, profitability, capital expenditures, and working capital requirements. The determination of discounted cash flow is based on the Company’s long-range forecasts. The revenue growth rates included in the forecast are the Company’s best estimates based on current and anticipated market conditions, and the profitability assumptions are projected based on current and anticipated cost structures. Long-range forecasting involves uncertainty which increases with each successive period. Key assumptions, such as revenue growth rates and profitability, especially in the outer years involve a greater degree of uncertainty.
These forecasts reflected an anticipated decline in stock-preparation sales, especially in China, which the Company expected would occur over the next several years given the economic environment and its impact on paper producers. As a result, the stock-preparation reporting unit failed step 1. In step 2, the Company calculated the implied fair value of goodwill for the stock-preparation reporting unit by deducting the estimated fair value of all tangible and intangible net assets (including unrecognized intangible assets) of the reporting unit from the fair value of the reporting unit as determined in step 1. The Company then compared the implied fair value of goodwill as determined in step 2 to the carrying value of goodwill. The impairment test indicated that the carrying amounts of goodwill for the stock-preparation reporting unit within the Company’s papermaking systems segment exceeded its implied fair value, and as a result, the Company recorded a $40,333,000 non-cash impairment charge to write down the goodwill associated with this reporting unit. The goodwill impairment test indicated that the estimated fair value of goodwill and indefinite- lived intangible assets associated with its other reporting units (doctoring, water management and fluid-handling) exceeded their carrying value and, as a result, no adjustment to goodwill was required for these reporting units. As part of the impairment test, the Company compared the sum of the estimated fair values of its reporting units with its fully diluted common stock market capitalization as a basis for concluding as to the reasonableness of the estimated reporting units’ fair values. Goodwill by reporting unit is as follows:
| (In thousands) |
2010 | 2009 | ||||||
| Stock-Preparation |
$ | 17,461 | $ | 14,731 | ||||
| Doctoring and Water-Management |
23,354 | 23,812 | ||||||
| Fluid-Handling |
57,173 | 59,079 | ||||||
| $ | 97,988 | $ | 97,622 | |||||
The Company assesses its long-lived assets, other than goodwill and indefinite-lived intangible assets, for impairment whenever facts and circumstances indicate that the carrying amounts may not be fully recoverable. To analyze recoverability, the Company projects undiscounted net future cash flows over the remaining lives of such assets. If these projected cash flows were less than the carrying amounts, an impairment loss would be recognized, resulting in a write-down of the assets with a corresponding charge to earnings. The impairment loss would be measured based upon the difference between the carrying amounts and the fair values of the assets. In the fourth quarter of 2008, the Company experienced a significant decline in its stock price and its market capitalization, which the Company believed to be impairment indicators. As a result, the Company performed an impairment test of its long-lived assets as of year-end 2008. No adjustment was required to the carrying value of its long-lived assets, other than goodwill.
F-15
Table of Contents
| Kadant Inc. | 2010 Financial Statements |
Notes to Consolidated Financial Statements
| 1. | Nature of Operations and Summary of Significant Accounting Policies (continued) |
Foreign Currency Translation and Transactions
All assets and liabilities of the Company’s foreign subsidiaries are translated at year-end exchange rates, and revenues and expenses are translated at average exchange rates for each quarter in accordance with ASC 830, “Foreign Currency Matters.” Resulting translation adjustments are reflected in the “accumulated other comprehensive items” component of shareholders’ investment (see Note 14). Foreign currency transaction gains and losses are included in the accompanying consolidated statement of operations and are not material for the three years presented.
Stock-Based Compensation
The Company recognizes compensation cost for all stock-based payments to employees and directors based on the grant date estimate of fair value for those awards. The Company uses the grant date trading price of the Company’s common stock to determine the fair value for restricted stock units (RSUs) and the Black-Scholes option-pricing model to determine the fair value for stock option grants. For performance-based RSUs that vest annually, compensation expense is recognized ratably over each annual vesting tranche. Compensation expense associated with all other RSUs and stock options is recognized ratably over the vesting period. For RSUs that include a performance condition, compensation expense is recognized during the performance period based on the probable number of RSUs expected to vest. The compensation expense recognized is net of estimated forfeitures.
Derivatives
The Company uses derivative instruments primarily to reduce its exposure to changes in currency exchange rates and interest rates. When the Company enters into a derivative contract, the Company makes a determination as to whether the transaction is deemed to be a hedge for accounting purposes. For a contract deemed to be a hedge, the Company formally documents the relationship between the derivative instrument and the risk being hedged. In this documentation, the Company specifically identifies the asset, liability, forecasted transaction, cash flow, or net investment that has been designated as the hedged item, and evaluates whether the derivative instrument is expected to reduce the risks associated with the hedged item. To the extent these criteria are not met, the Company does not use hedge accounting for the derivative. The changes in the fair value of a derivative not deemed to be a hedge are recorded currently in earnings. The Company does not hold or engage in transactions involving derivative instruments for purposes other than risk management.
ASC 815, “Derivatives and Hedging,” requires that all derivatives be recognized on the balance sheet at fair value. For derivatives designated as cash flow hedges, the related gains or losses on these contracts are deferred as a component of accumulated other comprehensive items. These deferred gains and losses are recognized in the period in which the underlying anticipated transaction occurs. For derivatives designated as fair value hedges, the unrealized gains and losses resulting from the impact of currency exchange rate movements are recognized in earnings in the period in which the exchange rates change and offset the currency gains and losses on the underlying exposures being hedged. The Company performs an evaluation of the effectiveness of the hedge both at inception and on an ongoing basis. The ineffective portion of a hedge, if any, and changes in the fair value of a derivative not deemed to be a hedge, are recorded in the consolidated statement of operations.
Recent Accounting Pronouncements
Intangibles–Goodwill and Other. In December 2010, the Financial Accounting Standards Board (FASB) issued Accounting Standards Update (ASU) 2010-28, “Intangibles–Goodwill and Other,” which modifies Step 1 of the goodwill impairment test for reporting units with zero or negative carrying amounts. For those reporting units, an entity is required to perform Step 2 of the goodwill impairment test if it is more likely than not that a
F-16
Table of Contents
| Kadant Inc. | 2010 Financial Statements |
Notes to Consolidated Financial Statements
| 1. | Nature of Operations and Summary of Significant Accounting Policies (continued) |
goodwill impairment exists. In determining whether it is more likely than not that a goodwill impairment exists, an entity should consider whether there are any adverse qualitative factors indicating that an impairment may exist. The qualitative factors are consistent with the existing guidance and examples, which requires that goodwill of a reporting unit be tested for impairment between annual tests if an event occurs or circumstances change that would more likely than not reduce the fair value of a reporting unit below its carrying amount. This guidance is effective for fiscal years, and interim periods within those years, beginning after December 15, 2010. The Company will adopt this standard in fiscal 2011 and does not expect it to have a material effect on its consolidated financial statements.
Business Combinations: Disclosure of Supplementary Pro Forma Information for Business Combinations. In December 2010, the FASB issued ASU 2010-29, “Business Combinations (Topic 805): Disclosure of Supplementary Pro Forma Information for Business Combinations”, which affects any public entity that enters into business combinations that are material on an individual or aggregate basis. The amendments in this ASU specify that if a public entity presents comparative financial statements, the entity should disclose revenue and earnings of the combined entity as though the business combination(s) that occurred during the current year had occurred as of the beginning of the comparable prior annual reporting period only. The amendments also expand the supplemental pro forma disclosures to include a description of the nature and amount of material, nonrecurring pro forma adjustments directly attributable to the business combination included in the reported pro forma revenue and earnings. The amendments are effective prospectively for business combinations for which the acquisition date is on or after the beginning of the first annual reporting period beginning on or after December 15, 2010. The Company will adopt the disclosure requirements of this standard at the beginning of fiscal 2011 for material business combinations made subsequent to that date.
Revenue Arrangements with Multiple Deliverables. In September 2009, the FASB issued ASU 2009-13, “Multiple-Deliverable Revenue Arrangements,” which amends the multiple-element arrangement guidance under ASC 605, “Revenue Recognition.” Its guidance amends the criteria for separating consideration for products or services in multiple-deliverable arrangements. This guidance establishes a selling price hierarchy for determining the selling price of a deliverable, eliminates the residual method of allocation, and requires that arrangement consideration be allocated at the inception of the arrangement to all deliverables using the relative selling price method. In addition, this guidance significantly expands required disclosures related to a vendor’s multiple-deliverable revenue arrangements. This guidance is effective prospectively for revenue arrangements entered into or materially modified in fiscal years beginning on or after June 15, 2010 (fiscal 2011). The Company is currently evaluating the provisions of this guidance, but does not anticipate that it will have a material effect on its consolidated financial statements.
| 2. | Acquisitions |
In 2010, the Company’s Papermaking Systems segment completed acquisitions of a Canadian-based supplier of pressure screen baskets and a related dewatering equipment product line, as well as a European supplier of fluid-handling systems. The aggregate purchase price for these acquisitions was $8,488,000. Approximately $7,658,000 of the purchase price, which included $4,450,000 of cash acquired, was paid at the closings in 2010. An additional $451,000 of the purchase price will be paid in 2011 and contingent consideration of $379,000 may be paid from 2011 to 2013 based on the sales of the acquired business’ products.
The Company also made final consideration payments totaling $2,592,000 in 2010 for acquisitions completed prior to 2010.
The Company’s acquisitions have historically been made at prices above the fair value of the acquired net assets, resulting in goodwill, due to expectations of synergies of combining the businesses. For these acquisitions, the primary synergy will be the use of the Company’s existing commercial infrastructure to expand sales of the acquired businesses’ products.
F-17
Table of Contents
| Kadant Inc. | 2010 Financial Statements |
Notes to Consolidated Financial Statements
| 2. | Acquisitions (continued) |
The acquisitions have been accounted for using the purchase method of accounting, and the results of the acquired businesses have been included in the accompanying financial statements from their dates of acquisition. Acquisition transaction costs of approximately $303,000 in 2010 were recorded in selling, general, and administrative expenses. Allocations of the purchase price for the acquisitions were based on estimates of the fair value of the net assets acquired. The purchase price allocations for the 2010 acquisitions include identifiable intangible assets acquired of $1,313,000, which are being amortized using the straight-line method over a weighted-average period of 8 years. The excess of the acquisitions’ purchase price over the tangible and identifiable intangible assets was recorded as goodwill and totaled $2,574,000, of which $740,000 is fully deductible for tax purposes. The allocation of the acquisitions’ purchase prices is finalized, except for certain income tax amounts, which are subject to change upon completion of the Company’s tax review.
Pro forma disclosures of the results of operations are not required, as the acquisitions are not considered material business combinations, individually or in the aggregate, as outlined in FASB ASC 805, “Business Combinations.”
| 3. | Employee Benefit Plans |
Stock-Based Compensation Plans
The Company maintains stock-based compensation plans primarily for its key employees and directors, although the plans permit awards to others expected to make significant contributions to the future of the Company. The plans authorize the compensation committee of the Company’s board of directors (the board committee) to award a variety of stock and stock-based incentives, such as restricted stock, restricted stock units, nonqualified and incentive stock options, stock bonus shares, or performance-based shares. The award recipients and the terms of awards, including price, granted under these plans are determined by the board committee. Upon a change-of-control, as defined in the plans, all options or other awards become fully vested and all restrictions lapse. The Company had 601,842 shares available for grant under stock-based compensation plans at year-end 2010.
The Company recognizes compensation cost for all stock-based payments to employees based on the grant date estimate of fair value for those awards. The total stock-based compensation expense was $2,754,000, $2,669,000, and $2,945,000 in 2010, 2009, and 2008, respectively, and is included in selling, general, and administrative expenses in the accompanying consolidated statement of operations.
Restricted Stock Units
On March 3, 2010, the Company granted an aggregate of 20,000 RSUs to its non-employee directors with an aggregate fair value of $283,400, of which 17,500 shares vested and 2,500 shares were forfeited in 2010. On December 8, 2010, the Company granted 1,250 RSUs to a non-employee director with an aggregate fair value of $27,600, which vested at the end of fiscal 2010. The Company recognized compensation expense of $276,000, $157,000, and $488,000 in 2010, 2009 and 2008, respectively, associated with RSUs granted to its outside directors.
In 2010, the Company also granted to its non-employee directors an aggregate of 50,000 RSUs with an aggregate fair value of $787,400, which will only vest and compensation expense will only be recognized upon a change in control as defined in the Company’s 2006 equity incentive plan. In July 2010, 10,000 of these RSUs were forfeited and the remaining 40,000 RSUs will be forfeited if a change in control does not occur before the last day of the first quarter of 2015.
Performance-Based Restricted Stock Units
On March 3, 2010, the Company granted to certain officers of the Company performance-based RSUs, which represented, in aggregate, the right to receive 59,000 shares (the target RSU amount), subject to
F-18
Table of Contents
| Kadant Inc. | 2010 Financial Statements |
Notes to Consolidated Financial Statements
| 3. | Employee Benefit Plans (continued) |
adjustment, with a grant date fair value of $14.17 per share. The RSUs were subject to adjustment based on the achievement of a specified earnings before interest, taxes, depreciation, and amortization (EBITDA) target generated from continuing operations for the 2010 fiscal year and resulted in an adjusted RSU amount of 88,501 shares deliverable upon vesting. Following adjustment, the RSUs are subject to additional time-based vesting, and vest in three equal annual installments on March 10, 2011, March 10, 2012 and March 10, 2013, provided that the officer is employed by the Company on the applicable vesting dates.
On March 3, 2009, the Company granted to certain officers of the Company performance-based RSUs, which represented, in aggregate, the right to receive 92,500 shares (the target RSU amount), subject to adjustment, with a grant date fair value of $8.47 per share. The RSUs were subject to adjustment based on the achievement of a specified EBITDA target generated from continuing operations for the 2009 fiscal year and resulted in an adjusted RSU amount of 55,610 shares deliverable upon vesting. Following adjustment, the RSUs are subject to additional time-based vesting and vest in their entirety on the last day of the Company’s 2011 fiscal year, provided the officer remains employed by the Company through the vesting date.
On March 3, 2008, the Company granted to certain officers of the Company performance-based RSUs, which represented, in aggregate, the right to receive 93,000 shares (the target RSU amount), subject to adjustment, with a grant date fair value of $25.07 per share. The RSUs were subject to adjustment based on the achievement of a specified EBITDA target generated from continuing operations for the 2008 fiscal year and resulted in an adjusted RSU amount of 47,430 shares deliverable upon vesting. Following adjustment, the RSUs were subject to additional time-based vesting, and vested in their entirety at the end of fiscal 2010.
The performance-based RSU agreements provide for forfeiture in certain events, such as voluntary or involuntary termination of employment, and for acceleration of vesting in certain events, such as death, disability or a change in control of the Company. If the officer dies or is disabled prior to the vesting date, then a ratable portion of the RSUs will vest. If a change in control occurs prior to the end of the performance period, the officer will receive the target RSU amount; otherwise, the officer will receive the number of deliverable RSUs based on the achievement of the performance goal, as stated in the RSU agreements.
Each performance-based RSU represents the right to receive one share of the Company’s common stock upon vesting. The Company recognizes compensation expense associated with performance-based RSUs ratably over each vesting tranche based on the grant date fair value. Compensation expense of $1,327,000, $1,976,000 and $1,817,000 was recognized in 2010, 2009 and 2008, respectively, associated with performance-based RSUs. Unrecognized compensation expense related to the unvested performance-based RSUs totaled approximately $700,000 at year-end 2010, and will be recognized over a weighted average period of 1.6 years.
Time-Based Restricted Stock Units
On March 3, 2010, the Company granted 85,000 time-based RSUs to certain employees of the Company with a grant date fair value of $14.17 per share. The RSUs generally vest in three equal installments on March 10, 2011, March 10, 2012 and March 10, 2013. The Company also granted time-based RSUs in 2007 and 2008 to certain employees of the Company. In general, these RSUs vest in their entirety on the fourth anniversary of the grant date. Each time-based RSU represents the right to receive one share of the Company’s common stock upon vesting. The Company is recognizing compensation expense associated with these time-based RSUs ratably over the vesting period based on the grant date fair value. The time-based RSU agreement provides for forfeiture in certain events, such as voluntary or involuntary termination of employment, and for acceleration of vesting in certain events, such as death, disability, or a change in control of the Company. Compensation expense of $778,000, $443,000, and $496,000, respectively, was recognized in 2010, 2009, and 2008 associated with these time-based RSUs. Unrecognized compensation expense related to the time-based RSUs totaled approximately $1,111,000 at year-end 2010 and will be recognized over a weighted average period of 1.9 years.
F-19
Table of Contents
| Kadant Inc. | 2010 Financial Statements |
Notes to Consolidated Financial Statements
| 3. | Employee Benefit Plans (continued) |
A summary of the activity of the Company’s unvested restricted stock units for 2010 is as follows:
| Unvested Restricted Stock Units |
Units (In thousands) |
Weighted Average Grant- Date Fair Value |
||||||
| Unvested RSUs at January 2, 2010 |
212 | $ | 17.89 | |||||
| Granted |
245 | $ | 14.53 | |||||
| Vested |
(86 | ) | $ | 20.43 | ||||
| Forfeited / Expired |
(59 | ) | $ | 9.56 | ||||
| Unvested RSUs at January 1, 2011 |
312 | $ | 16.77 | |||||
Stock Options
Options granted from 2001 to 2010 have been nonqualified options that vest over three years and are not exercisable until vested. To date, all options have been granted at an exercise price equal to the fair market value of the Company’s common stock on the date of grant. The Company generally issues its common stock out of treasury stock to satisfy option exercises.
On March 3, 2010, the Company granted stock options to purchase 140,000 shares of the Company’s common stock to certain officers of the Company. The stock options will vest in three equal annual installments on the first, second, and third anniversaries of the grant date, provided that the executive officer remains employed by the Company on the applicable vesting dates. The Company is recognizing compensation expense ratably over the vesting period based on the grant date fair value. Compensation expense of $287,000 was recognized in 2010 associated with these stock options. Unrecognized compensation expense related to these stock options totaled approximately $748,000 at January 1, 2011 and will be recognized over a weighted-average period of 2.2 years.
For 2010, the fair value of each option grant was estimated on the grant date using the Black-Scholes option-pricing model, assuming no expected dividends, with the following assumptions:
| 2010 | ||||
| Options Granted |
140,000 | |||
| Weighted-average Exercise Price |
$ | 14.17 | ||
| Weighted-average Grant Date Fair Value |
$ | 7.39 | ||
| Volatility |
45 | % | ||
| Risk-Free Interest Rate |
3.04 | % | ||
| Expected Life of Options |
7.5 years | |||
The Black-Scholes option-pricing model was developed for use in estimating the fair value of traded options, which have no vesting restrictions and are fully transferable. In addition, option-pricing models require the input of highly subjective assumptions, including expected stock price volatility. Expected stock price volatility was calculated based on a review of the Company’s actual historic stock prices commensurate with the expected life of the award. The expected option life was derived based on a review of the Company’s historic option holding periods, including consideration of the holding period inherent in currently vested but unexercised options. The risk-free interest rate is based on the yield on zero-coupon U.S. Treasury securities for a period that is commensurate with the expected term of the option. The compensation expense recognized for all equity-based awards is net of estimated forfeitures. Forfeitures are estimated based on an analysis of actual option forfeitures.
The Company did not grant stock options in 2009 and 2008.
F-20
Table of Contents
| Kadant Inc. | 2010 Financial Statements |
Notes to Consolidated Financial Statements
| 3. | Employee Benefit Plans (continued) |
A summary of the Company’s stock option activity for 2010 is as follows:
| (in thousands, except per share amounts) |
Number of Shares |
Weighted Average Exercise Price |
Weighted Average Remaining Contractual Life |
Aggregate Intrinsic Value (a) |
||||||||||||
| Options Outstanding, Beginning of Year |
21 | $ | 19.13 | |||||||||||||
| Granted |
140 | $ | 14.17 | |||||||||||||
| Options Outstanding, End of Year |
161 | $ | 14.82 | 1.2 years | $ | 1,410 | ||||||||||
| Vested and Unvested Expected to Vest, End of Year |
161 | $ | 14.82 | 1.2 years | $ | 1,410 | ||||||||||
| Options Exercisable, End of Year |
21 | $ | 19.13 | 1.7 years | $ | 94 | ||||||||||
(a) The closing price per share on the last trading day prior to January 1, 2011 was $23.57.
There were no stock option exercises in 2010 and 2009. A summary of the Company’s stock option exercises in 2008 are as follows:
| (In thousands) |
2008 | |||
| Total intrinsic value of options exercised |
$ | 1,534 | ||
| Cash received from options exercised |
2,894 | |||
| Income tax benefits from options exercised |
544 | |||
Employee Stock Purchase Plan
Substantially all of the Company’s full-time U.S. employees are eligible to participate in its employee stock purchase plan. Under the plan, shares of the Company’s common stock may be purchased at a 15% discount from the fair market value at the beginning or end of the purchase period, whichever is lower. Shares purchased under the plan are subject to a one-year resale restriction and are purchased through payroll deductions of up to 10% of each participating employee’s gross wages. For the 2010, 2009, and 2008 plan years, the Company issued 25,466 shares, 30,509 shares, and 24,816 shares, respectively, of its common stock under this plan.
401(k) Savings and Other Defined Contribution Plans
The Company’s U.S. subsidiaries participate in the Kadant Inc. 401(k) Retirement Savings Plan sponsored by the Company. Contributions to the plan are made by both the employee and the Company and are immediately vested. Company contributions are based upon the level of employee contributions. Effective April 2009, 401(k) retirement savings plans previously sponsored by two of the Company’s U.S. subsidiaries were merged into this plan. Prior to April 2009, two of the Company’s U.S. subsidiaries sponsored separate 401(k) retirement savings plans. Contributions to these plans were made by both the employee and the Company and were immediately vested. Company contributions were based on the level of employee contributions.
Certain of the Company’s subsidiaries offer other retirement plans, the majority of which are defined contribution plans. Company contributions to these plans are based on formulas determined by the Company.
For these plans, the Company contributed and charged to expense approximately $2,174,000, $2,318,000, and $2,558,000 in 2010, 2009, and 2008, respectively.
F-21
Table of Contents
| Kadant Inc. | 2010 Financial Statements |
Notes to Consolidated Financial Statements
| 3. | Employee Benefit Plans (continued) |
Defined Benefit Pension Plan and Post-Retirement Welfare Benefits Plans
The Company sponsors a noncontributory defined benefit retirement plan for the benefit of eligible employees at its Kadant Solutions division and the corporate office. Benefits under the plan are based on years of service and employee compensation. Funds are contributed to a trustee as necessary to provide for current service and for any unfunded projected benefit obligation over a reasonable period. Effective December 31, 2005, this plan was closed to new participants. This same subsidiary also has a post-retirement welfare benefits plan (included in the table below in “Other Benefits”). No future retirees are eligible for this post-retirement welfare benefits plan, and the plans include limits on the subsidiary’s contributions.
The Company’s Kadant Lamort subsidiary sponsors a defined benefit pension plan (included in the table below in “Other Benefits”). Benefits under this plan are based on years of service and projected employee compensation.
The Company’s Kadant Johnson subsidiary also offers a post-retirement welfare benefits plan (included in the table below in “Other Benefits”) to its U.S. employees upon attainment of eligible retirement age. In addition, this plan will be closed to employees who will not meet its retirement eligibility requirements on January 1, 2012.
In accordance with ASC 715, “Compensation–Retirement Benefits,” (ASC 715), an employer is required to recognize the overfunded or underfunded status of a defined benefit postretirement plan as an asset or liability in its balance sheet and to recognize changes in that funded status in the year in which the changes occur through comprehensive income. These amounts will be subsequently recognized as net periodic pension cost pursuant to the Company’s historical accounting policy for amortizing such amounts. Further, actuarial gains and losses that arise in subsequent periods and are not recognized as net periodic pension cost in the same periods will be recognized as a component of accumulated other comprehensive items. The actuarial loss and prior service loss included in accumulated other comprehensive items and expected to be recognized in net periodic pension cost in 2011 are $309,000 and $2,000, respectively.
F-22
Table of Contents
| Kadant Inc. | 2010 Financial Statements |
Notes to Consolidated Financial Statements
| 3. | Employee Benefit Plans (continued) |
The following table summarizes the change in benefit obligation; the change in plan assets; the funded status; and the amounts recognized in the balance sheet for the Company’s pension benefits and other benefits plans. The measurement date for all items set forth below is the last day of the fiscal year presented.
| Pension Benefits | Other Benefits | |||||||||||||||
| (In thousands) |
2010 | 2009 | 2010 | 2009 | ||||||||||||
| Change in Benefit Obligation: |
||||||||||||||||
| Benefit obligation at beginning of year |
$ | 24,447 | $ | 21,702 | $ | 4,261 | $ | 4,247 | ||||||||
| Service cost |
820 | 820 | 100 | 147 | ||||||||||||
| Interest cost |
1,294 | 1,322 | 218 | 252 | ||||||||||||
| Actuarial loss |
1,065 | 1,814 | 373 | 420 | ||||||||||||
| Prior Service Cost |
– | – | 81 | – | ||||||||||||
| Benefits paid |
(892 | ) | (1,211 | ) | (606 | ) | (844 | ) | ||||||||
| Curtailment gain |
– | – | (298 | ) | – | |||||||||||
| Effect of currency translation |
– | – | (154 | ) | 39 | |||||||||||
| Benefit obligation at end of year |
$ | 26,734 | $ | 24,447 | $ | 3,975 | $ | 4,261 | ||||||||
| Change in Plan Assets: |
||||||||||||||||
| Fair value of plan assets at beginning of year |
$ | 20,430 | $ | 14,280 | $ | – | $ | – | ||||||||
| Actual return on plan assets |
2,227 | 2,561 | – | – | ||||||||||||
| Employer contribution |
2,200 | 4,800 | 606 | 844 | ||||||||||||
| Benefits paid |
(892 | ) | (1,211 | ) | (606 | ) | (844 | ) | ||||||||
| Fair value of plan assets at end of year |
$ | 23,965 | $ | 20,430 | $ | – | $ | – | ||||||||
| Unfunded status |
$ | (2,769 | ) | $ | (4,017 | ) | $ | (3,975 | ) | $ | (4,261 | ) | ||||
| Accumulated benefit obligation as of year-end |
$ | 22,254 | $ | 20,283 | $ | 1,190 | $ | 1,366 | ||||||||
| Amounts Recognized in the Balance Sheet Consist of: |
||||||||||||||||
| Non-current liability |
$ | (2,769 | ) | $ | (4,017 | ) | $ | (3,975 | ) | $ | (4,261 | ) | ||||
| Amounts Recognized in Accumulated Other Comprehensive Items Before Tax Consist of: |
||||||||||||||||
| Unrecognized net actuarial loss |
$ | (8,030 | ) | $ | (8,218 | ) | $ | (441 | ) | $ | (89 | ) | ||||
| Unrecognized prior service (cost) income |
(384 | ) | (439 | ) | 116 | 174 | ||||||||||
| Total |
$ | (8,414 | ) | $ | (8,657 | ) | $ | (325 | ) | $ | 85 | |||||
| Changes in Amounts Recognized in Accumulated Other Comprehensive Items Before Tax: |
||||||||||||||||
| Current year unrecognized net actuarial loss |
$ | (251 | ) | $ | (550 | ) | $ | (373 | ) | $ | (420 | ) | ||||
| Current year prior service cost |
– | – | (81 | ) | – | |||||||||||
| Current year curtailment |
– | – | 82 | (279 | ) | |||||||||||
| Amortization of unrecognized prior service cost (income) |
55 | 55 | (58 | ) | (454 | ) | ||||||||||
| Amortization of unrecognized net actuarial loss |
439 | 497 | 13 | 2 | ||||||||||||
| Effect of currency translation |
– | – | 7 | 8 | ||||||||||||
| Total |
$ | 243 | $ | 2 | $ | (410 | ) | $ | (1,143 | ) | ||||||
F-23
Table of Contents
| Kadant Inc. | 2010 Financial Statements |
Notes to Consolidated Financial Statements
| 3. | Employee Benefit Plans (continued) |
The weighted-average assumptions used to determine the benefit obligation as of year-end were as follows:
| Pension Benefits | Other Benefits | |||||||||||||||
| 2010 | 2009 | 2010 | 2009 | |||||||||||||
| Discount rate |
5.25 | % | 5.75 | % | 5.05 | % | 5.44 | % | ||||||||
| Rate of compensation increase |
4.00 | % | 4.00 | % | 2.00 | % | 2.00 | % | ||||||||
The projected benefit obligations and fair value of plan assets for the Company’s pension plans with projected benefit obligations in excess of plan assets were as follows:
| Pension Benefits | Other Benefits | |||||||||||||||
| (In thousands) |
2010 | 2009 | 2010 | 2009 | ||||||||||||
| Pension Plans with Projected Benefit Obligations in Excess of Plan Assets: |
||||||||||||||||
| Projected benefit obligation |
$ | 26,734 | $ | 24,447 | $ | 1,574 | $ | 1,815 | ||||||||
| Fair value of plan assets |
$ | 23,965 | $ | 20,430 | $ | – | $ | – | ||||||||
The accumulated benefit obligations and fair value of plan assets for the Company’s pension plans with accumulated benefit obligations in excess of plan assets were as follows:
| Pension Benefits | Other Benefits | |||||||||||||||
| (In thousands) |
2010 | 2009 | 2010 | 2009 | ||||||||||||
| Pension Plans with Accumulated Benefit Obligations in Excess of Plan Assets: |
||||||||||||||||
| Accumulated benefit obligation |
$ | – | $ | – | $ | 1,190 | $ | 1,366 | ||||||||
| Fair value of plan assets |
$ | – | $ | – | $ | – | $ | – | ||||||||
| Pension Benefits | Other Benefits | |||||||||||||||||||||||
| (In thousands) |
2010 | 2009 | 2008 | 2010 | 2009 | 2008 | ||||||||||||||||||
| Components of Net Periodic Benefit Cost (Income): |
||||||||||||||||||||||||
| Service cost |
$ | 820 | $ | 820 | $ | 806 | $ | 100 | $ | 147 | $ | 83 | ||||||||||||
| Interest cost |
1,294 | 1,322 | 1,198 | 218 | 252 | 248 | ||||||||||||||||||
| Expected return on plan assets |
(1,412 | ) | (1,297 | ) | (1,464 | ) | – | – | – | |||||||||||||||
| Recognized net actuarial loss |
439 | 497 | 57 | 13 | 2 | – | ||||||||||||||||||
| Amortization of prior service cost (income) |
55 | 55 | 55 | (58 | ) | (454 | ) | (795 | ) | |||||||||||||||
| Net periodic benefit cost (income) |
1,196 | 1,397 | 652 | 273 | (53 | ) | (464 | ) | ||||||||||||||||
| Curtailment gain |
– | – | – | (219 | ) | (279 | ) | – | ||||||||||||||||
| Net periodic benefit cost (income) |
$ | 1,196 | $ | 1,397 | $ | 652 | $ | 54 | $ | (332 | ) | $ | (464 | ) | ||||||||||
The weighted-average assumptions used to determine net periodic benefit cost (income) were as follows:
| Pension Benefits | Other Benefits | |||||||||||||||||||||||
| 2010 | 2009 | 2008 | 2010 | 2009 | 2008 | |||||||||||||||||||
| Discount rate |
5.75 | % | 6.25 | % | 6.00 | % | 5.52 | % | 6.37 | % | 5.89 | % | ||||||||||||
| Expected long-term return on plan assets |
7.00 | % | 8.50 | % | 8.50 | % | – | – | – | |||||||||||||||
| Rate of compensation increase |
4.00 | % | 4.00 | % | 4.00 | % | 2.00 | % | 2.00 | % | 2.00 | % | ||||||||||||
F-24
Table of Contents
| Kadant Inc. | 2010 Financial Statements |
Notes to Consolidated Financial Statements
| 3. | Employee Benefit Plans (continued) |
In developing the overall expected long-term return on plan assets assumption, a building block approach was used in which rates of return in excess of inflation were considered separately for equity securities, debt securities, and other assets. The excess returns were weighted by the representative target allocation and added along with an appropriate rate of inflation to develop the overall expected long-term return on plan assets assumption. The Company believes this determination is consistent with ASC 715.
Assumed weighted-average healthcare cost trend rates as of year-end were as follows:
| 2010 | 2009 | |||||||
| Healthcare cost trend rate assumed for next year |
8.00 | % | 5.44 | % | ||||
| Ultimate healthcare cost trend rate |
8.00 | % | 5.00 | % | ||||
| Year assumed rate reaches ultimate rate |
2010 | 2011 | ||||||
Assumed healthcare cost trend rates can have a significant effect on the amounts reported for healthcare benefits. A one-percentage point change in assumed healthcare cost trend rates would have the following effects:
| (In thousands) |
1 Percentage Point Increase |
1 Percentage Point Decrease |
||||||
| Effect on total of service and interest cost components—(expense) income |
$ | – | $ | – | ||||
| Effect on post-retirement benefit obligation—(increase) decrease |
$ | (1 | ) | $ | 1 | |||
Plan Assets
The fair values of the Company’s noncontributory defined benefit retirement plan assets at year-end 2010 and 2009 by asset category are as follows:
| 2010 Fair Value Measurement |
||||||||||||||||
| (In thousands) |
Quoted Prices in Active Markets for Identical Assets (Level 1) |
Significant Observable Inputs (Level 2) |
Significant Unobservable Inputs (Level 3) |
Total | ||||||||||||
| Asset Category: |
||||||||||||||||
| Mutual Funds: |
||||||||||||||||
| U.S. Equity (a) |
$ | 3,258 | $ | – | $ | – | $ | 3,258 | ||||||||
| International Equity (a) |
$ | 815 | $ | – | $ | – | $ | 815 | ||||||||
| Fixed Income (b) |
$ | 12,814 | $ | 7,078 | $ | – | $ | 19,892 | ||||||||
| 2009 Fair Value Measurement |
||||||||||||||||
| (In thousands) |
Quoted Prices in Active Markets for Identical Assets (Level 1) |
Significant Observable Inputs (Level 2) |
Significant Unobservable Inputs (Level 3) |
Total | ||||||||||||
| Asset Category: |
||||||||||||||||
| Mutual Funds: |
||||||||||||||||
| Money Market |
$ | 115 | $ | – | $ | – | $ | 115 | ||||||||
| Fixed Income (c) |
$ | 5,969 | $ | – | $ | – | $ | 5,969 | ||||||||
| U.S. Equity (a) |
$ | 3,371 | $ | – | $ | – | $ | 3,371 | ||||||||
| International Equity (a) |
$ | 822 | $ | – | $ | – | $ | 822 | ||||||||
| Fixed Income (b) |
$ | – | $ | 9,062 | $ | – | $ | 9,062 | ||||||||
| Real Estate (d) |
$ | – | $ | 1,091 | $ | – | $ | 1,091 | ||||||||
| (a) | Common stock index funds. |
F-25
Table of Contents
| Kadant Inc. | 2010 Financial Statements |
Notes to Consolidated Financial Statements
| 3. | Employee Benefit Plans (continued) |
| (b) | Investments in commingled funds that invest in a diversified blend of investment and non-investment grade fixed income securities. |
| (c) | U.S. and government fixed income securities and investment and non-investment grade corporate securities. |
| (d) | Investment in a commingled fund that invests in a diversified portfolio of direct real estate investments. |
Description of Fair Value Measurements
Level 1 – Quoted, active market prices for identical assets. Share prices of the funds, referred to as a fund’s Net Asset Value (NAV), are calculated daily based on the closing market prices and accruals of securities in the fund’s total portfolio (total value of the fund) divided by the number of fund shares currently issued and outstanding. Redemptions of the mutual funds occur by contract at the respective fund’s redemption date NAV.
Level 2 – Observable inputs other than Level 1 prices, based on model-derived valuations in which all significant inputs are observable in active markets. The NAVs of the funds are calculated monthly based on the closing market prices and accruals of securities in the fund’s total portfolio (total value of the fund) divided by the number of fund shares currently issued and outstanding. Redemptions of the mutual funds occur by contract at the respective fund’s redemption date NAV.
Level 3 – Unobservable inputs based on the Company’s own assumptions.
The Company has developed an investment policy for its noncontributory defined benefit retirement plan. The investment strategy is to emphasize total return, that is, the aggregate return from capital appreciation and dividend and interest income. The primary objective of the investment management for the plan’s assets is the emphasis on consistent growth, specifically, growth in a manner that protects the plan’s assets from excessive volatility in market value from year to year. The investment policy takes into consideration the benefit obligations, including timing of distributions.
The primary objective for the noncontributory defined benefit retirement plan is to provide long-term capital appreciation through investment in equity and debt securities. The following target asset allocation has been established for the plan:
| Asset Category |
Minimum | Neutral | Maximum | |||||||||
| Equity securities |
10 | % | 15 | % | 20 | % | ||||||
| Debt securities |
80 | % | 85 | % | 90 | % | ||||||
| Total |
100 | % | ||||||||||
All equity securities must be drawn from recognized securities exchanges. Debt securities must be weighted to reflect a portfolio average maturity of not more than ten years, with average benchmark duration of five years. The credit quality must equal or exceed high investment grade quality (“BAA” or better).
Cash Flows
Contributions
The Company expects to make cash contributions of $900,000 to its noncontributory defined benefit retirement plan in 2011. For the remaining pension and post-retirement welfare benefits plans, no cash contributions other than to fund current benefit payments are expected in 2011.
F-26
Table of Contents
| Kadant Inc. | 2010 Financial Statements |
Notes to Consolidated Financial Statements
| 3. | Employee Benefit Plans (continued) |
Estimated Future Benefit Payments
The following benefit payments, which reflect future service as appropriate, are expected to be paid. The benefit payments are based on the same assumptions used to measure the Company’s benefit obligation at year-end 2010.
| (In thousands) |
Pension Benefits |
Other Benefits |
||||||
| 2011 |
$ | 3,696 | $ | 291 | ||||
| 2012 |
1,528 | 427 | ||||||
| 2013 |
1,301 | 258 | ||||||
| 2014 |
1,045 | 327 | ||||||
| 2015 |
2,049 | 256 | ||||||
| 2016-2020 |
11,465 | 1,752 | ||||||
Information and Assumptions for the Post-Retirement Welfare Benefits Plan
All eligible retirees of the Company’s Kadant Solutions division are currently participating in a post-retirement welfare benefits plan, with no future retirees eligible to participate. Effective September 1, 2003, the monthly contribution to the plan was capped at $358 per participant. For the majority of the retirees in the plan, no healthcare cost trend rate is assumed, as the Company cap applies. For the remainder, the healthcare cost trend rate is assumed to be 8% in 2010, which is the ultimate rate.
All eligible retirees of the Company’s Kadant Johnson Inc. subsidiary are currently participating in a post-retirement welfare benefits plan. Kadant Johnson pays 75% of all plan costs for retirees with a retirement date prior to January 1, 2005, and 50% of all plan costs for retirees with a retirement date after January 1, 2005, with no limits on its contributions up to annual employee and plan stop loss limitations. This plan will be closed to employees who will not meet its retirement eligibility requirements on January 1, 2012. The medical healthcare cost trend rate no longer affects the amounts reported for the health care benefits in this plan.
| 4. | Preferred and Common Stock |
Preferred Stock
The Company’s Certificate of Incorporation authorizes up to 5,000,000 shares of preferred stock, $.01 par value per share, for issuance by the Company’s board of directors without further shareholder approval. The board of directors has also designated 15,000 shares of such preferred stock as Series A junior participating preferred stock for issuance under the Company’s Shareholder Rights Plan (see below). No such preferred stock has been issued by the Company.
Common Stock
The Company has a Shareholder Rights Plan under which one right was distributed at the close of business on August 6, 2001 for each share of the Company’s common stock outstanding at that time. The rights plan is designed to provide shareholders with fair and equal treatment in the event of an unsolicited attempt to acquire the Company. The rights were attached to the Company’s outstanding common stock at the time of distribution and are not separately transferable or exercisable. The rights will become exercisable if a person acquires 15 percent or more of the Company’s common stock, or a tender or exchange offer is commenced for 15 percent or more of the Company’s common stock, unless, in either case, the transaction was approved by the Company’s board of directors. If the rights become exercisable, each right will initially entitle the Company’s shareholders to purchase .0001 of a share of the Company’s Series A junior participating preferred stock, $.01 par value, at an exercise price of $75. In addition, except with respect to transactions approved by the Company’s board of
F-27
Table of Contents
| Kadant Inc. | 2010 Financial Statements |
Notes to Consolidated Financial Statements
directors, if the Company is involved in a merger or other transaction with another company in which it is not the surviving corporation, or the Company sells or transfers 50 percent or more of its assets or earning power to another company, each right (other than rights owned by the acquirer) will entitle its holder to purchase $75 worth of the common stock of the acquirer at half the market value at that time. The Company is entitled to redeem the rights at $.001 per right at any time prior to the tenth business day (or later, if so determined by the board of directors) after the acquisition of 15 percent or more of the Company’s common stock. Unless the rights are redeemed or exchanged earlier, they will expire on July 16, 2011.
At year-end 2010, the Company had reserved 1,219,349 unissued shares of its common stock for possible issuance under its stock-based compensation plans.
| 5. | Income Taxes |
The components of income (loss) from continuing operations before provision for income taxes are as follows:
| (In thousands) |
2010 | 2009 | 2008 | |||||||||
| Domestic |
$ | 6,484 | $ | (7,353 | ) | $ | (32,079 | ) | ||||
| Foreign |
17,364 | 5,095 | 18,269 | |||||||||
| $ | 23,848 | $ | (2,258 | ) | $ | (13,810 | ) | |||||
The components of the provision for income taxes from continuing operations are as follows:
| (In thousands) |
2010 | 2009 | 2008 | |||||||||
| Current Provision (Benefit): |
||||||||||||
| Federal |
$ | (630 | ) | $ | 1,320 | $ | 241 | |||||
| Foreign |
3,976 | 1,337 | 3,855 | |||||||||
| State |
603 | 143 | 319 | |||||||||
| 3,949 | 2,800 | 4,415 | ||||||||||
| Deferred Provision (Benefit): |
||||||||||||
| Federal |
999 | 666 | 4,373 | |||||||||
| Foreign |
107 | 387 | (8 | ) | ||||||||
| State |
143 | (161 | ) | (314 | ) | |||||||
| 1,249 | 892 | 4,051 | ||||||||||
| $ | 5,198 | $ | 3,692 | $ | 8,466 | |||||||
The provision (benefit) for income taxes included in the accompanying statement of operations is as follows:
| (In thousands) |
2010 | 2009 | 2008 | |||||||||
| Continuing Operations |
$ | 5,198 | $ | 3,692 | $ | 8,466 | ||||||
| Discontinued Operation |
(164 | ) | (10 | ) | (65 | ) | ||||||
| $ | 5,034 | $ | 3,682 | $ | 8,401 | |||||||
The Company generally receives a tax deduction upon the exercise of nonqualified stock options by employees equal to the difference between the market price and the exercise price of the Company’s common stock on the date of exercise. There were no stock option exercises in 2010 and 2009. The current provision for income taxes does not reflect $544,000 of such benefits from the exercise of stock options that were allocated to capital in excess of par value in 2008. In addition, in 2010, 2009, and 2008, there was an additional tax provision (benefit) of $26,000, $33,000, and ($12,000), respectively, associated with restricted stock awards.
F-28
Table of Contents
| Kadant Inc. | 2010 Financial Statements |
Notes to Consolidated Financial Statements
| 5. | Income Taxes (continued) |
The provision for income taxes from continuing operations in the accompanying statement of operations differs from the provision calculated by applying the statutory federal income tax rate of 35% to income (loss) from continuing operations before provision for income taxes due to the following:
| (In thousands) |
2010 | 2009 | 2008 | |||||||||
| Provision (Benefit) for Income Taxes at Statutory Rate |
$ | 8,347 | $ | (790 | ) | $ | (4,833 | ) | ||||
| Increases (Decreases) Resulting From: |
||||||||||||
| State income taxes, net of federal tax |
485 | (57 | ) | 3 | ||||||||
| U.S. tax cost (benefit) of foreign earnings |
1,108 | 7,848 | (12 | ) | ||||||||
| Foreign tax rate differential |
(2,039 | ) | (1,531 | ) | (2,117 | ) | ||||||
| Unrecognized tax benefit reserves, net |
(386 | ) | 913 | 1,064 | ||||||||
| Change in valuation allowance |
(2,051 | ) | (2,652 | ) | 14,514 | |||||||
| Nondeductible expenses |
426 | 474 | 283 | |||||||||
| Research and development tax credits |
(266 | ) | (545 | ) | (419 | ) | ||||||
| Other |
(426 | ) | 32 | (17 | ) | |||||||
| $ | 5,198 | $ | 3,692 | $ | 8,466 | |||||||
The U.S. tax cost of foreign earnings in 2009 primarily includes a $22,274,000 provision related to foreign cash repatriation offset by a $14,630,000 benefit from foreign tax credits associated with the repatriation of foreign earnings.
Net deferred tax liability in the accompanying consolidated balance sheet consists of the following:
| (In thousands) |
2010 | 2009 | ||||||
| Deferred Tax Asset (Liability): |
||||||||
| Foreign and alternative minimum tax credits |
$ | 8,774 | $ | 10,214 | ||||
| Reserves and accruals |
5,377 | 6,583 | ||||||
| Operating loss carryforwards |
14,393 | 17,921 | ||||||
| Inventory basis difference |
2,403 | 2,225 | ||||||
| Research and development |
1,477 | 1,746 | ||||||
| Employee compensation |
1,739 | 860 | ||||||
| Allowance for doubtful accounts |
411 | 336 | ||||||
| Other |
36 | 61 | ||||||
| Deferred Tax Asset, Gross |
34,610 | 39,946 | ||||||
| Less: Valuation Allowance |
(25,884 | ) | (29,282 | ) | ||||
| Deferred Tax Asset, Net |
8,726 | 10,664 | ||||||
| Goodwill and intangible assets |
(11,537 | ) | (9,713 | ) | ||||
| Fixed assets basis difference |
(2,987 | ) | (2,959 | ) | ||||
| Revenue recognition |
(76 | ) | (2,542 | ) | ||||
| Reserves and accruals |
(446 | ) | (474 | ) | ||||
| Other |
(124 | ) | (82 | ) | ||||
| Deferred Tax Liability |
(15,170 | ) | (15,770 | ) | ||||
| Net Deferred Tax Liability |
$ | (6,444 | ) | $ | (5,106 | ) | ||
F-29
Table of Contents
| Kadant Inc. | 2010 Financial Statements |
Notes to Consolidated Financial Statements
| 5. | Income Taxes (continued) |
The deferred tax asset and liability are presented in the accompanying balance sheet within other current assets, other assets, other current liabilities and deferred income taxes based on when the tax benefits are expected to be realized and on a net basis by tax jurisdiction.
The Company has established valuation allowances related to certain domestic and foreign deferred tax assets and tax credits. The valuation allowance at year-end 2010 was $25,884,000, consisting of $11,375,000 in the U.S. and $14,509,000 in foreign jurisdictions. The decrease in the valuation allowance in 2010 of $3,398,000 related primarily to the use of domestic deferred tax assets. Compliance with ASC 740 requires the Company to periodically evaluate the necessity of establishing or adjusting a valuation allowance for deferred tax assets depending on whether it is more likely than not that a related tax benefit will be recognized in future periods. When assessing the need for a valuation allowance in a tax jurisdiction, the Company evaluates the weight of all available evidence to determine whether it is more likely than not that some portion or all of the deferred income tax assets will not be realized. As part of this evaluation, the Company considers its cumulative three-year history of earnings before income taxes, taxable income in prior carryback years, future reversals of existing taxable temporary differences, prudent and feasible tax planning strategies, and expected future results of operations. As of year-end 2010, the Company was in a three-year cumulative income position in the U.S.; however, due to the uncertainty of profitability in future periods the Company has maintained its full valuation allowance in the U.S. Assuming, among other positive and negative factors, that the Company meets its estimates of 2011 forecasted earnings in the U.S., it may release a portion of its U.S. valuation allowance during 2011. The Company’s full valuation allowance in certain foreign jurisdictions was maintained as of year-end 2010 as a result of the foreign subsidiaries being in a three-year cumulative loss position and the uncertainty of future profitability. Assuming, among other positive and negative factors, that certain of the Company’s foreign subsidiaries meet their estimates of 2011 forecasted earnings, these foreign jurisdictions would be in a three-year cumulative income position and a portion of the foreign valuation allowance may be released during 2011.
At year-end 2010, the Company had domestic state and foreign net operating loss carryforwards of $15,567,000 and $59,054,000, respectively, and U.S. foreign tax credit carryforwards of $7,615,000. The domestic state loss carryforwards will expire in the years 2011 through 2030. Their use is limited to future taxable earnings from the Company’s domestic subsidiaries. Of the foreign net operating loss carryforwards, $13,919,000 expire in the years 2012 through 2030, and the remainder do not expire. The U.S. foreign tax credits expire beginning in 2012.
The Company has not recognized a deferred tax liability for the difference between the book basis and the tax basis of its investment in the stock of its domestic subsidiaries, related primarily to unremitted earnings of subsidiaries, because it does not expect this basis difference to become subject to tax at the parent level. The Company believes it can implement certain tax strategies to recover its investment in its domestic subsidiaries tax-free.
The severe economic downturn that began at the end of 2008 and continued into 2009 negatively affected the Company’s quarterly EBITDA, which is a factor used in the financial covenants in its 2008 Credit Agreement. In the second quarter of 2009, the Company implemented a one-time cash repatriation plan to ensure that it would continue to remain in compliance with these financial covenants. Under this plan, the Company repatriated $35,612,000 of cash in 2009 from its foreign subsidiaries, which was used to repay a portion of the Company’s outstanding debt obligations in the U.S. and China. It is the Company’s intention to reinvest indefinitely the remaining earnings of its international subsidiaries in order to support the current and future capital needs of their operations. Through year-end 2010, the Company has not provided for U.S. income taxes on approximately $87,252,000 of unremitted foreign earnings. The U.S. tax cost has not been determined due to the fact that it is not practicable to estimate at this time. The related foreign tax withholding, which would be required if the Company were to remit the foreign earnings to the U.S., would be approximately $481,000.
F-30
Table of Contents
| Kadant Inc. | 2010 Financial Statements |
Notes to Consolidated Financial Statements
| 5. | Income Taxes (continued) |
The Company has two subsidiaries located in China that have a tax holiday, which reduces the income tax in that country. The tax holiday began in 2007 for each company and will expire in 2011. The Company realized a benefit of $492,000, or $.04 per diluted share, in 2010 from the tax holiday.
The Company operates within multiple tax jurisdictions and could be subject to audit in those jurisdictions. Such audits can involve complex issues, which may require an extended period of time to resolve and may cover multiple years. In management’s opinion, adequate provisions for income taxes have been made for all years subject to audit.
As of year-end 2010, the Company had $6,134,000 of unrecognized tax benefits which, if recognized, would reduce the effective tax rate. A tabular reconciliation of the beginning and ending amount of unrecognized tax benefits at year-end 2010 and 2009 is as follows:
| (In thousands) |
2010 | 2009 | ||||||
| Unrecognized tax benefits, beginning of year |
$ | 6,139 | $ | 5,116 | ||||
| Gross increases—tax positions in prior periods |
35 | 9 | ||||||
| Gross decreases—tax positions in prior periods |
(185 | ) | – | |||||
| Gross increases—current-period tax positions |
422 | 1,057 | ||||||
| Settlements |
(255 | ) | (18 | ) | ||||
| Lapses of statutes of limitation |
(217 | ) | (25 | ) | ||||
| Currency translation |
195 | – | ||||||
| Unrecognized tax benefits, end of year |
$ | 6,134 | $ | 6,139 | ||||
The Company recognizes accrued interest and penalties related to unrecognized tax benefits in income tax expense. The Company has accrued $1,574,000 and $1,541,000 for the potential payment of interest and penalties at year-end 2010 and 2009, respectively. The interest and penalties reflected in the statement of operations in 2010 and 2009 were approximately $33,000 and $116,000, respectively.
The Company is currently under audit in the U.S. and certain non-U.S. taxing jurisdictions. It is reasonably possible that over the next twelve months the amount of unrecognized tax benefits may be reduced by up to $3,000,000 due to the re-evaluation of current uncertain tax positions as a result of the examinations or from the expiration of tax statutes.
As of year-end 2010, the Company was subject to U.S. Federal income tax examinations for the stub period from January to August 2001 when the Company was part of its former parent company’s tax return and for the tax years 2007 through 2010, and to non-U.S. income tax examinations for the tax years 2003 through 2010. In addition, the Company was subject to state and local income tax examinations in the U.S. for the tax years 2006 through 2010.
F-31
Table of Contents
| Kadant Inc. | 2010 Financial Statements |
Notes to Consolidated Financial Statements
F-32
| 6. | Short- and Long-Term Obligations |
Short- and long-term obligations at year-end 2010 and 2009 are as follows:
| (In thousands) |
2010 | 2009 | ||||||
| Revolving Credit Facility |
$ | 15,000 | $ | 15,000 | ||||
| Variable Rate Term Loan, due from 2011 to 2016 |
7,750 | 8,250 | ||||||
| Total Short- and Long-Term Obligations |
22,750 | 23,250 | ||||||
| Less: Short-Term Obligations and Current Maturities |
(5,500 | ) | (500 | ) | ||||
| Long-Term Obligations, less Current Maturities |
$ | 17,250 | $ | 22,750 | ||||
The annual payment requirements for short- and long-term obligations are as follows:
| (In thousands) |
||||
| 2011 |
$ | 5,500 | ||
| 2012 |
500 | |||
| 2013 |
10,500 | |||
| 2014 |
500 | |||
| 2015 |
500 | |||
| 2016 and thereafter |
5,250 | |||
The weighted average interest rate for short- and long-term obligations was 4.06% and 4.89% at year-end 2010 and 2009, respectively.
See Note 11 for the fair value information related to the Company’s long-term obligations.
Revolving Credit Facility
On February 13, 2008, the Company entered into a five-year unsecured revolving credit facility (2008 Credit Agreement) in the aggregate principal amount of up to $75,000,000, which includes an uncommitted unsecured incremental borrowing facility of up to an additional $75,000,000. The Company can borrow up to $75,000,000 under the 2008 Credit Agreement with a sublimit of $60,000,000 within the 2008 Credit Agreement available for the issuances of letters of credit and bank guarantees. The principal on any borrowings made under the 2008 Credit Agreement is due on February 13, 2013. Interest on any loans outstanding under the 2008 Credit Agreement accrues and is payable quarterly in arrears at one of the following rates selected by the Company: (a) the prime rate plus an applicable margin (up to .20%) or (b) a Eurocurrency rate plus an applicable margin (up to 1.20%). The applicable margin is determined based upon the Company’s total debt to EBITDA, as defined in the 2008 Credit Agreement, ratio. As of year-end 2010, the outstanding balance on the 2008 Credit Agreement was $15,000,000. On January 31, 2011, the Company paid principal of $5,000,000, which has been classified as a short-term obligation as of year-end 2010. The Company had $58,747,000 of borrowing capacity available under the committed portion of the 2008 Credit Agreement. The amount the Company is able to borrow under the 2008 Credit Agreement is the total borrowing capacity less any outstanding borrowings, letters of credit and multi-currency borrowings issued under the 2008 Credit Agreement.
The obligations of the Company under the 2008 Credit Agreement may be accelerated upon the occurrence of an event of default under the 2008 Credit Agreement, which includes customary events of default including, without limitation, payment defaults, defaults in the performance of affirmative and negative covenants, the inaccuracy of representations or warranties, bankruptcy and insolvency related defaults, defaults relating to such matters as the Employment Retirement Income Security Act (ERISA), uninsured judgments and the failure to pay certain indebtedness, and a change of control default.
Table of Contents
| Kadant Inc. | 2010 Financial Statements |
Notes to Consolidated Financial Statements
| 6. | Short- and Long-Term Obligations (continued) |
The loans under the 2008 Credit Agreement are guaranteed by certain domestic subsidiaries of the Company pursuant to the Guarantee Agreement effective as of February 13, 2008. In addition, the 2008 Credit Agreement contains negative covenants applicable to the Company, including financial covenants requiring the Company to comply with a maximum consolidated leverage ratio of 3.5 and a minimum consolidated fixed charge coverage ratio of 1.2, and restrictions on liens, indebtedness, fundamental changes, dispositions of property, making certain restricted payments (including dividends and stock repurchases), investments, transactions with affiliates, sale and leaseback transactions, swap agreements, changing its fiscal year, arrangements affecting subsidiary distributions, entering into new lines of business, and certain actions related to the discontinued operation. As of year-end 2010, the Company was in compliance with these covenants.
2006 Commercial Real Estate Loan
On May 4, 2006, the Company borrowed $10,000,000 under a promissory note (2006 Commercial Real Estate Loan), which is repayable in quarterly installments of $125,000 over a ten-year period with the remaining principal balance of $5,000,000 due upon maturity. Interest on the 2006 Commercial Real Estate Loan accrues and is payable quarterly in arrears at one of the following rates selected by the Company: (a) the prime rate or (b) the three-month London Inter-Bank Offered Rate (LIBOR) plus a 1% margin. Effective February 14, 2008, this margin was lowered to .75%. The 2006 Commercial Real Estate Loan is guaranteed and secured by real estate and related personal property of the Company and certain of its domestic subsidiaries, located in Theodore, Alabama; Auburn, Massachusetts; and Three Rivers, Michigan, pursuant to mortgage and security agreements dated May 4, 2006 (Mortgage and Security Agreements). As of year-end 2010, the remaining balance on the 2006 Commercial Real Estate Loan was $7,750,000.
The Company’s obligations under the 2006 Commercial Real Estate Loan may be accelerated upon the occurrence of an event of default under the 2006 Commercial Real Estate Loan and the Mortgage and Security Agreements, which include customary events of default including without limitation payment defaults, defaults in the performance of covenants and obligations, the inaccuracy of representations or warranties, bankruptcy- and insolvency-related defaults, liens on the properties or collateral and uninsured judgments. In addition, the occurrence of an event of default under the 2008 Credit Agreement or any successor credit facility would be an event of default under the 2006 Commercial Real Estate Loan.
Debt Issuance Costs
Debt issuance costs are being amortized to interest expense over the corresponding debt term based on the effective-interest method. As of year-end 2010, unamortized debt issuance costs were approximately $299,000.
| 7. | Commitments and Contingencies |
Operating Leases
The Company occupies office and operating facilities under various operating leases. The accompanying consolidated statement of operations includes expenses from operating leases of $1,919,000, $2,105,000, and $2,927,000 in 2010, 2009, and 2008, respectively. The future minimum payments due under noncancelable operating leases as of January 1, 2011 are $1,933,000 in 2011; $1,370,000 in 2012; $642,000 in 2013; $411,000 in 2014; $366,000 in 2015 and $273,000 thereafter. Total future minimum lease payments are $4,995,000.
Letters of Credit
Outstanding letters of credit issued on behalf of the Company as applicant, principally relating to performance obligations and customer deposit guarantees, totaled $11,567,000 at year-end 2010. Certain of the Company’s contracts, particularly for stock-preparation and systems orders, require the Company to provide a
F-33
Table of Contents
| Kadant Inc. | 2010 Financial Statements |
Notes to Consolidated Financial Statements
| 7. | Commitments and Contingencies (continued) |
standby letter of credit to a customer as beneficiary, limited in amount to a negotiated percentage of the total contract value, in order to guarantee warranty and performance obligations of the Company under the contract. Typically, these standby letters of credit expire without being drawn by the beneficiary.
Contingencies
In the ordinary course of business, the Company is, at times, required to issue limited performance guarantees, some of which do not require the issuance of letters of credit to customers in support of these guarantees, relating to its equipment and systems. The Company typically limits its liability under these guarantees to amounts that would not exceed the value of the contract. The Company believes that it has adequate reserves for any potential liability in connection with such guarantees.
Indemnification
The Company is required to indemnify Thermo Electron, but not its shareholders, against liability for taxes arising from the Company’s conduct of business after the spin-off, or the failure of certain distributions to continue to qualify as a tax free spin-off, as described in Note 1 “Income Taxes.”
| 8. | Restructuring Costs and Other Income, Net |
Other Income
In 2010, the Company sold real estate in the U.S. for cash proceeds of $2,583,000, resulting in a pre-tax gain of $1,033,000 and recognized a curtailment gain on a pension liability of $219,000 associated with the reduction of 25 employees in France.
2008 Restructuring Plan
The Company recorded total restructuring costs of $4,373,000 in 2008 and 2009 associated with its 2008 Restructuring Plan. These restructuring costs included facility-related costs of $314,000 and severance and associated costs of $4,059,000 related to the reduction of 329 employees in China, North America, Latin America, and Europe, all in its Papermaking Systems segment. These actions were taken to adjust the Company’s cost structure and streamline its operations in response to the weak economic environment, which accelerated in the fourth quarter of 2008, and its negative impact on then current and projected order volumes, especially in its stock-preparation product line. The Company recorded additional restructuring costs of $142,000 in 2010 associated with its 2008 Restructuring Plan.
2009 Restructuring Plan
The Company recorded restructuring costs of $3,858,000 in 2009 associated with its 2009 Restructuring Plan, which consisted of severance and associated costs related to the reduction of 133 employees in Europe, China, the U.S., and Canada, all in its Papermaking Systems segment. These actions were taken to further adjust the Company’s cost structure and streamline its operations in response to the weak economic environment. The Company recorded additional restructuring costs of $105,000 in 2010 associated with its 2009 Restructuring Plan.
F-34
Table of Contents
| Kadant Inc. | 2010 Financial Statements |
Notes to Consolidated Financial Statements
| 8. | Restructuring Costs and Other Income, Net (continued) |
A summary of the changes in accrued restructuring costs, of which $33,000 is included in other current liabilities and $400,000 is included in other long-term liabilities in the accompanying consolidated balance sheet, are as follows:
| (In thousands) |
Severance Costs |
Other Costs |
Total Costs |
|||||||||
| 2008 Restructuring Plan |
||||||||||||
| Balance at January 3, 2009 |
2,872 | – | 2,872 | |||||||||
| Provision |
257 | 314 | 571 | |||||||||
| Usage |
(1,798 | ) | (314 | ) | (2,112 | ) | ||||||
| Currency translation |
3 | – | 3 | |||||||||
| Balance at January 2, 2010 |
$ | 1,334 | $ | – | $ | 1,334 | ||||||
| Provision |
71 | 71 | 142 | |||||||||
| Usage |
(989 | ) | (71 | ) | (1,060 | ) | ||||||
| Currency translation |
17 | – | 17 | |||||||||
| Balance at January 1, 2011 |
$ | 433 | $ | – | $ | 433 | ||||||
| 2009 Restructuring Plan |
||||||||||||
| Provision |
$ | 3,846 | $ | 12 | $ | 3,858 | ||||||
| Usage |
(1,529 | ) | (12 | ) | (1,541 | ) | ||||||
| Currency translation |
(15 | ) | – | (15 | ) | |||||||
| Balance at January 2, 2010 |
$ | 2,302 | $ | – | $ | 2,302 | ||||||
| Provision |
105 | – | 105 | |||||||||
| Usage |
(2,233 | ) | – | (2,233 | ) | |||||||
| Currency translation |
(174 | ) | – | (174 | ) | |||||||
| Balance at January 1, 2011 |
$ | – | $ | – | $ | – | ||||||
The Company expects to pay the remaining accrued restructuring costs as follows: $33,000 in 2011 and $400,000 from 2012 to 2015.
| 9. | Discontinued Operation |
In 2005, Composites LLC sold substantially all of its assets to a third party. Under the terms of the asset purchase agreement, Composites LLC retained certain liabilities associated with the operation of the business prior to the sale, including the warranty obligations associated with products manufactured prior to the sale date. Composites LLC retained all of the cash proceeds received from the asset sale and continued to administer and pay warranty claims from the sale proceeds into the third quarter of 2007. On September 30, 2007, Composites LLC announced that it no longer had sufficient funds to honor warranty claims, was unable to pay or process warranty claims, and ceased doing business. All activity related to this business is classified in the results of the discontinued operation in the accompanying consolidated financial statements.
F-35
Table of Contents
| Kadant Inc. | 2010 Financial Statements |
Notes to Consolidated Financial Statements
| 9. | Discontinued Operation (continued) |
Operating results for the discontinued operation included in the accompanying consolidated statement of operations are as follows:
| (In thousands) |
2010 | 2009 | 2008 | |||||||||
| Operating Loss |
$ | (66 | ) | $ | (28 | ) | $ | (28 | ) | |||
| Income Tax Benefit |
164 | 10 | 65 | |||||||||
| Income (Loss) from Discontinued Operation |
$ | 98 | $ | (18 | ) | $ | 37 | |||||
The major classes of assets and liabilities for the discontinued operation included in the accompanying consolidated balance sheet are as follows:
| (In thousands) |
2010 | 2009 | ||||||
| Cash and Cash Equivalents |
$ | 1 | $ | 2 | ||||
| Other Accounts Receivable |
255 | 322 | ||||||
| Other Assets |
145 | 172 | ||||||
| Total Assets |
401 | 496 | ||||||
| Accrued Warranty Costs |
2,142 | 2,142 | ||||||
| Other Current Liabilities |
255 | 285 | ||||||
| Total Liabilities |
2,397 | 2,427 | ||||||
| Net Liabilities |
$ | (1,996 | ) | $ | (1,931 | ) | ||
Through the sale date of October 21, 2005, Composites LLC offered a standard limited warranty to the owner of its decking and roofing products, limited to repair or replacement of the defective product or a refund of the original purchase price. As of January 1, 2011 and January 2, 2010, the accrued warranty costs associated with the composites business were $2,142,000, which represents the low end of the estimated range of warranty reserve required based on the level of claims received before Composites LLC ceased operations and judgments entered against it in litigation. Composites LLC has calculated that the total potential warranty cost ranges from $2,142,000 to approximately $13,100,000. The high end of the range represents the estimated maximum level of warranty claims remaining based on the total sales of the products under warranty. Composites LLC will continue to record adjustments to the accrued warranty costs to reflect the minimum amount of the potential range of loss for products under warranty based on judgments entered against it in litigation, if any.
| 10. | Derivatives |
Interest Rate Swaps
The Company entered into interest rate swap agreements in 2008 and 2006 to hedge its exposure to variable-rate debt and has designated these agreements as cash flow hedges. On February 13, 2008, the Company entered into a swap agreement (2008 Swap Agreement) to hedge the exposure to movements in the 3-month LIBOR rate on future outstanding debt. The 2008 Swap Agreement has a five-year term and a $15,000,000 notional value, which decreased to $10,000,000 on December 31, 2010, and will decrease to $5,000,000 on December 30, 2011. Under the 2008 Swap Agreement, on a quarterly basis the Company receives a 3-month LIBOR rate and pays a fixed rate of interest of 3.265% plus the applicable margin. The Company entered into a swap agreement in 2006 (the 2006 Swap Agreement) to convert a portion of the Company’s outstanding debt from floating to fixed rates of interest. The swap agreement has the same terms and quarterly payment dates as the corresponding debt, and reduces proportionately in line with the amortization of the debt. Under the 2006 Swap Agreement, the Company
F-36
Table of Contents
| Kadant Inc. | 2010 Financial Statements |
Notes to Consolidated Financial Statements
| 10. | Derivatives (continued) |
receives a three-month LIBOR rate and pays a fixed rate of interest of 5.63%. The fair values for these instruments as of year-end 2010 are included in other liabilities, with an offset to accumulated other comprehensive items (net of tax) in the accompanying consolidated balance sheet. The Company has structured these interest rate swap agreements to be 100% effective and as a result, there is no current impact to earnings resulting from hedge ineffectiveness. Management believes that any credit risk associated with the swap agreements is remote based on the Company’s financial position and the creditworthiness of the financial institution issuing the swap agreements.
The counterparty to the swap agreement could demand an early termination of the swap agreement if the Company is in default under the 2008 Credit Agreement, or any agreement that amends or replaces the 2008 Credit Agreement in which the counterparty is a member, and the Company is unable to cure the default. An event of default under the 2008 Credit Agreement includes customary events of default and failure to comply with financial covenants, including a maximum consolidated leverage ratio of 3.5 and a minimum consolidated fixed charge coverage ratio of 1.2. The unrealized loss of $1,595,000 as of year-end 2010 represents the estimated amount that the Company would pay to the counterparty in the event of an early termination.
Forward Currency-Exchange Contracts
The Company uses forward currency-exchange contracts primarily to hedge exposures resulting from fluctuations in currency exchange rates. Such exposures result primarily from portions of the Company’s operations and assets and liabilities that are denominated in currencies other than the functional currencies of the businesses conducting the operations or holding the assets and liabilities. The Company typically manages its level of exposure to the risk of currency-exchange fluctuations by hedging a portion of its currency exposures anticipated over the ensuing 12-month period, using forward currency-exchange contracts that have maturities of 12 months or less.
Forward currency-exchange contracts that hedge forecasted accounts receivable or accounts payable are designated as cash flow hedges. The fair values for these instruments are included in other current assets for unrecognized gains and in other current liabilities for unrecognized losses, with an offset in accumulated other comprehensive items (net of tax). For forward currency-exchange contracts that are designated as fair value hedges, the gain or loss on the derivative, as well as the offsetting loss or gain on the hedged item are recognized currently in earnings. The fair values of forward currency-exchange contracts that are not designated as hedges are recorded currently in earnings. The Company recognized a loss of $34,000 and $699,000 in 2010 and 2009, respectively, and a gain of $896,000 in 2008 included in selling, general, and administrative expenses associated with forward currency-exchange contracts that were not designated as hedges. Management believes that any credit risk associated with forward currency-exchange contracts is remote based on the Company’s financial position and the creditworthiness of the financial institutions issuing the contracts.
F-37
Table of Contents
| Kadant Inc. | 2010 Financial Statements |
Notes to Consolidated Financial Statements
| 10. | Derivatives (continued) |
The following table summarizes the fair value of the Company’s derivative instruments designated and not designated as hedging instruments, the notional values of the associated derivative contracts, and the location of these instruments in the consolidated balance sheet:
| 2010 | 2009 | |||||||||||||||||||
| (In thousands) |
Balance Sheet Location |
Asset (Liability) (a) |
Notional Amount (b) |
Asset (Liability) (a) |
Notional Amount (b) |
|||||||||||||||
| Derivatives Designated as Hedging Instruments: |
||||||||||||||||||||
| Derivatives in an Asset Position: |
||||||||||||||||||||
| Forward currency-exchange contracts |
|
Other Current Assets |
|
$ | 131 | $ | 1,794 | $ | 207 | $ | 7,856 | |||||||||
| Derivatives in a Liability Position: |
||||||||||||||||||||
| Forward currency-exchange contracts |
|
Other Current Liabilities |
|
$ | (59 | ) | $ | 1,056 | $ | – | $ | – | ||||||||
| Interest rate swap agreements |
|
Other Long-Term Liabilities |
|
$ | (1,595 | ) | $ | 17,750 | $ | (1,517 | ) | $ | 23,250 | |||||||
| Derivatives Not Designated as Hedging Instruments: |
||||||||||||||||||||
| Derivatives in a Liability Position: |
||||||||||||||||||||
| Forward currency-exchange contracts |
|
Other Current Liabilities |
|
$ | (48 | ) | $ | 1,816 | $ | (98 | ) | $ | 1,728 | |||||||
| (a) | See Note 11 for the fair value measurements relating to these financial instruments. |
| (b) | The total notional amount is indicative of the level of the Company’s derivative activity during 2010 and 2009. |
The following table summarizes the activity in accumulated other comprehensive items (OCI) associated with the Company’s derivative instruments designated as cash flow hedges as of and for the period ended January 1, 2011:
| (In thousands) |
Interest Rate Swap Agreements |
Forward Currency- Exchange Contracts |
Total | |||||||||
| Unrealized loss (gain), net of tax, at January 2, 2010 |
$ | 1,212 | $ | (138 | ) | $ | 1,074 | |||||
| (Loss) gain reclassified to earnings (a) |
(710 | ) | 138 | (572 | ) | |||||||
| Loss (gain) recognized in OCI |
788 | (50 | ) | 738 | ||||||||
| Unrealized loss (gain), net of tax, at January 1, 2011 |
$ | 1,290 | $ | (50 | ) | $ | 1,240 | |||||
(a) Included in interest expense for interest rate swap agreements and in revenues for forward currency-exchange contracts in the accompanying consolidated statement of operations.
As of January 1, 2011, $552,000 of the net unrealized loss included in OCI is expected to be reclassified to earnings over the next twelve months.
| 11. | Fair Value Measurements and Fair Value of Financial Instruments |
Fair value measurement is defined as the price that would be received to sell an asset or paid to transfer a liability in the principal or most advantageous market for the asset or liability in an orderly transaction between
F-38
Table of Contents
| Kadant Inc. | 2010 Financial Statements |
Notes to Consolidated Financial Statements
| 11. | Fair Value Measurements and Fair Value of Financial Instruments (continued) |
market participants at the measurement date. A fair value hierarchy is established, which prioritizes the inputs used in measuring fair value into three broad levels as follows:
| • | Level 1—Quoted prices in active markets for identical assets or liabilities. |
| • | Level 2—Inputs, other than the quoted prices in active markets, that are observable either directly or indirectly. |
| • | Level 3—Unobservable inputs based on the Company’s own assumptions. |
The following table presents the fair value hierarchy for those assets and liabilities measured at fair value on a recurring basis:
| Fair Value as of January 1, 2011 | ||||||||||||||||
| (In thousands) |
Level 1 | Level 2 | Level 3 | Total | ||||||||||||
| Assets: |
||||||||||||||||
| Money market funds and time deposits |
$ | 23,129 | $ | 5,027 | $ | – | $ | 28,156 | ||||||||
| Forward currency-exchange contracts |
$ | – | $ | 131 | $ | – | $ | 131 | ||||||||
| Liabilities: |
||||||||||||||||
| Forward currency-exchange contracts |
$ | – | $ | 107 | $ | – | $ | 107 | ||||||||
| Interest rate swap agreements |
$ | – | $ | 1,595 | $ | – | $ | 1,595 | ||||||||
| Fair Value as of January 2, 2010 | ||||||||||||||||
| (In thousands) |
Level 1 | Level 2 | Level 3 | Total | ||||||||||||
| Assets: |
||||||||||||||||
| Money market funds and time deposits |
$ | 26,555 | $ | 389 | $ | – | $ | 26,944 | ||||||||
| Forward currency-exchange contracts |
$ | – | $ | 207 | $ | – | $ | 207 | ||||||||
| Liabilities: |
||||||||||||||||
| Forward currency-exchange contracts |
$ | – | $ | 98 | $ | – | $ | 98 | ||||||||
| Interest rate swap agreements |
$ | – | $ | 1,517 | $ | – | $ | 1,517 | ||||||||
The Company uses the market approach technique to value its financial assets and liabilities, and there were no changes in valuation techniques during 2010. The Company’s financial assets and liabilities carried at fair value comprise cash equivalents and derivative instruments used to hedge the Company’s foreign currency and interest rate risks. The Company’s cash equivalents include money market funds and bank deposits which are highly liquid and easily tradable. These investments are valued using inputs observable in active markets for identical securities. The fair values of the Company’s interest rate swap agreements are based on LIBOR yield curves at the reporting date. The fair values of the Company’s forward currency-exchange contracts are based on quoted forward foreign exchange rates at the reporting date. The forward currency-exchange contracts and interest rate swap agreements are hedges of either recorded assets or liabilities or anticipated transactions. Changes in values of the underlying hedged assets and liabilities or anticipated transactions are not reflected in the table above.
The carrying amount and fair value of the Company’s debt obligations are as follows:
| 2010 | 2009 | |||||||||||||||
| (In thousands) |
Carrying Value |
Fair Value |
Carrying Value |
Fair Value |
||||||||||||
| Long-term debt obligations |
$ | 17,250 | $ | 17,250 | $ | 22,750 | $ | 22,750 | ||||||||
The carrying amounts of long-term debt obligations approximate fair value as the obligations bear variable rates of interest, which adjust quarterly based on prevailing market rates.
F-39
Table of Contents
| Kadant Inc. | 2010 Financial Statements |
Notes to Consolidated Financial Statements
F-40
| 12. | Business Segment and Geographical Information |
The Company has combined its operating entities into one reportable operating segment, Papermaking Systems, and a separate product line, Fiber-based Products. In classifying operational entities into a particular segment, the Company aggregated businesses with similar economic characteristics, products and services, production processes, customers, and methods of distribution.
The Company’s Papermaking Systems segment develops, manufactures, and markets stock-preparation systems and equipment, doctoring systems and equipment, water-management systems, and fluid-handling systems and equipment for the pulp and paper industry worldwide. Principal products manufactured by this segment include: custom-engineered systems and equipment for the preparation of wastepaper for conversion into recycled paper; fluid-handling systems used primarily in the dryer section of the papermaking process and during the production of corrugated boxboard, metals, plastics, rubber, textiles, chemicals, and food; doctoring systems and equipment and related consumables important to the efficient operation of paper machines; and water-management systems essential for draining, purifying, and recycling process water. The Fiber-based Products business produces biodegradable absorbent granules from papermaking byproducts. These granules are primarily used as carriers for agricultural, home lawn and garden, and professional lawn, turf and ornamental applications, as well as for oil and grease absorption.
Table of Contents
| Kadant Inc. | 2010 Financial Statements |
Notes to Consolidated Financial Statements
| 12. | Business Segment and Geographical Information (continued) |
| (In thousands) |
2010 | 2009 | 2008 | |||||||||
| Business Segment Information |
||||||||||||
| Revenues: |
||||||||||||
| Papermaking Systems |
$ | 261,188 | $ | 217,607 | $ | 321,747 | ||||||
| Fiber-based Products |
8,841 | 7,958 | 7,411 | |||||||||
| $ | 270,029 | $ | 225,565 | $ | 329,158 | |||||||
| Revenues by Product Line: |
||||||||||||
| Papermaking Systems: |
||||||||||||
| Stock-Preparation |
$ | 95,542 | $ | 85,731 | $ | 128,254 | ||||||
| Fluid-Handling |
83,302 | 63,930 | 98,675 | |||||||||
| Doctoring |
51,290 | 45,895 | 60,715 | |||||||||
| Water-Management |
28,570 | 20,273 | 31,687 | |||||||||
| Other |
2,484 | 1,778 | 2,416 | |||||||||
| Papermaking Systems |
$ | 261,188 | $ | 217,607 | $ | 321,747 | ||||||
| Fiber-based Products |
8,841 | 7,958 | 7,411 | |||||||||
| $ | 270,029 | $ | 225,565 | $ | 329,158 | |||||||
| Income (Loss) from Continuing Operations Before Provision for Income Taxes: |
||||||||||||
| Papermaking Systems (a)(b) |
$ | 37,281 | $ | 10,203 | $ | 1,341 | ||||||
| Corporate and Fiber-based Products |
(12,332 | ) | (10,677 | ) | (14,348 | ) | ||||||
| Total operating income (loss) |
24,949 | (474 | ) | (13,007 | ) | |||||||
| Interest expense, net |
(1,101 | ) | (1,784 | ) | (803 | ) | ||||||
| $ | 23,848 | $ | (2,258 | ) | $ | (13,810 | ) | |||||
| Total Assets: |
||||||||||||
| Papermaking Systems |
$ | 314,929 | $ | 293,434 | $ | 342,785 | ||||||
| Corporate and Fiber-based Products (c) |
21,442 | 13,726 | 13,608 | |||||||||
| Total Assets from Continuing Operations |
336,371 | 307,160 | 356,393 | |||||||||
| Total Assets from Discontinued Operation |
401 | 496 | 524 | |||||||||
| $ | 336,772 | $ | 307,656 | $ | 356,917 | |||||||
| Depreciation and Amortization: |
||||||||||||
| Papermaking Systems |
$ | 6,750 | $ | 6,984 | $ | 7,037 | ||||||
| Corporate and Fiber-based Products |
478 | 464 | 493 | |||||||||
| $ | 7,228 | $ | 7,448 | $ | 7,530 | |||||||
| Capital Expenditures: |
||||||||||||
| Papermaking Systems |
$ | 3,022 | $ | 2,529 | $ | 5,606 | ||||||
| Corporate and Fiber-based Products |
386 | 275 | 592 | |||||||||
| $ | 3,408 | $ | 2,804 | $ | 6,198 | |||||||
F-41
Table of Contents
| Kadant Inc. | 2010 Financial Statements |
Notes to Consolidated Financial Statements
| 12. | Business Segment and Geographical Information (continued) |
| (In thousands) |
2010 | 2009 | 2008 | |||||||||
| Geographical Information |
||||||||||||
| Revenues (d) (e): |
||||||||||||
| United States |
$ | 120,696 | $ | 97,368 | $ | 136,042 | ||||||
| France |
45,541 | 53,519 | 64,436 | |||||||||
| China |
37,087 | 22,361 | 46,466 | |||||||||
| Other |
66,705 | 52,317 | 82,214 | |||||||||
| $ | 270,029 | $ | 225,565 | $ | 329,158 | |||||||
| Long-lived Assets (f): |
||||||||||||
| United States |
$ | 14,890 | $ | 15,787 | $ | 18,546 | ||||||
| China |
12,220 | 12,711 | 13,585 | |||||||||
| Other |
9,801 | 9,917 | 9,507 | |||||||||
| $ | 36,911 | $ | 38,415 | $ | 41,638 | |||||||
| Export Revenues Included in United States Revenues Above (g)(e) |
$ | 9,881 | $ | 5,776 | $ | 7,941 | ||||||
| (a) | Includes a goodwill impairment charge of $40.3 million in 2008 (see Note 1). |
| (b) | Includes restructuring costs and other income, net, of ($1.0) million, $4.4 million, and $2.0 million in 2010, 2009, and 2008, respectively (see Note 8). |
| (c) | Primarily includes cash and cash equivalents and property, plant, and equipment. |
| (d) | Revenues are attributed to countries based on selling location. |
| (e) | Prior-period amounts have been reclassified to conform to the 2010 presentation. |
| (f) | Represents property, plant, and equipment, net. |
| (g) | In general, export revenues are denominated in U.S. dollars. |
F-42
Table of Contents
| Kadant Inc. | 2010 Financial Statements |
Notes to Consolidated Financial Statements
F-43
| 13. | Earnings (Loss) per Share |
Basic and diluted earnings (loss) per share were calculated as follows:
| (In thousands, except per share amounts) |
2010 | 2009 | 2008 | |||||||||
| Amounts Attributable to Kadant: |
||||||||||||
| Income (Loss) from Continuing Operations |
$ | 18,409 | $ | (5,906 | ) | $ | (22,595 | ) | ||||
| Income (Loss) from Discontinued Operation |
98 | (18 | ) | 37 | ||||||||
| Net Income (Loss) |
$ | 18,507 | $ | (5,924 | ) | $ | (22,558 | ) | ||||
| Basic Weighted Average Shares |
12,339 | 12,331 | 13,527 | |||||||||
| Effect of Stock Options, Restricted Stock Units and Employee Stock Purchase Plan |
127 | – | – | |||||||||
| Diluted Weighted Average Shares |
12,466 | 12,331 | 13,527 | |||||||||
| Basic Earnings (Loss) per Share: |
||||||||||||
| Continuing Operations |
$ | 1.49 | $ | (.48 | ) | $ | (1.67 | ) | ||||
| Discontinued Operation |
.01 | – | – | |||||||||
| Net Income (Loss) per Basic Share |
$ | 1.50 | $ | (.48 | ) | $ | (1.67 | ) | ||||
| Diluted Earnings (Loss) per Share: |
||||||||||||
| Continuing Operations |
$ | 1.48 | $ | (.48 | ) | $ | (1.67 | ) | ||||
| Discontinued Operation |
– | – | – | |||||||||
| Net Income (Loss) per Diluted Share |
$ | 1.48 | $ | (.48 | ) | $ | (1.67 | ) | ||||
Options to purchase 99,300 shares, 44,000 shares, and 60,300 shares of common stock were not included in the computation of diluted earnings (loss) per share for 2010, 2009, and 2008, respectively, because the options’ exercise prices were greater than the average market price for the common stock and the effect would have been antidilutive. In addition, the dilutive effect of restricted stock units totaling 56,200 shares and 104,400 shares of common stock was not included in the computation of diluted loss per share in 2009 and 2008, respectively, as the effect would have been antidilutive.
| 14. | Accumulated Other Comprehensive Items |
Comprehensive income combines net income (loss) and other comprehensive items, which represent certain amounts that are reported as components of shareholders’ investment in the accompanying consolidated balance sheet, including foreign currency translation adjustments, deferred losses and unrecognized prior service cost associated with pension and other post-retirement plans, and deferred losses on hedging instruments.
Accumulated other comprehensive items in the accompanying consolidated balance sheet consist of the following:
| (In thousands) |
2010 | 2009 | ||||||
| Foreign Currency Translation Adjustments |
$ | 5,638 | $ | 8,902 | ||||
| Unrecognized Prior Service Cost |
(235 | ) | (179 | ) | ||||
| Deferred Loss on Pension and Other Post-Retirement Plans |
(7,749 | ) | (7,397 | ) | ||||
| Deferred Loss on Hedging Instruments |
(1,240 | ) | (1,074 | ) | ||||
| $ | (3,586 | ) | $ | 252 | ||||
Table of Contents
| Kadant Inc. | 2010 Financial Statements |
Notes to Consolidated Financial Statements
| 15. | Unaudited Quarterly Information |
| 2010 (In thousands, except per share amounts) |
First | Second | Third | Fourth | ||||||||||||
| Revenues |
$ | 61,121 | $ | 69,136 | $ | 66,516 | $ | 73,256 | ||||||||
| Gross Profit |
26,875 | 31,168 | 29,302 | 31,080 | ||||||||||||
| Amounts Attributable to Kadant: |
||||||||||||||||
| Income from Continuing Operations (a) |
3,615 | 5,225 | 4,502 | 5,067 | ||||||||||||
| (Loss) Income from Discontinued Operation |
(4 | ) | (5 | ) | (5 | ) | 112 | |||||||||
| Net Income |
$ | 3,611 | $ | 5,220 | $ | 4,497 | $ | 5,179 | ||||||||
| Basic Earnings per Share: |
||||||||||||||||
| Continuing Operations |
$ | .29 | $ | .42 | $ | .36 | $ | .42 | ||||||||
| Net Income |
$ | .29 | $ | .42 | $ | .36 | $ | .42 | ||||||||
| Diluted Earnings per Share: |
||||||||||||||||
| Continuing Operations |
$ | .29 | $ | .42 | $ | .36 | $ | .41 | ||||||||
| Net Income |
$ | .29 | $ | .42 | $ | .36 | $ | .42 | ||||||||
| 2009 (In thousands, except per share amounts) |
First | Second | Third | Fourth | ||||||||||||
| Revenues |
$ | 64,957 | $ | 50,132 | $ | 53,716 | $ | 56,760 | ||||||||
| Gross Profit |
24,640 | 20,784 | 21,940 | 23,442 | ||||||||||||
| Amounts Attributable to Kadant: |
||||||||||||||||
| Loss from Continuing Operations (b) |
(2,887 | ) | (1,188 | ) | (114 | ) | (1,717 | ) | ||||||||
| Loss from Discontinued Operation |
(4 | ) | (5 | ) | (5 | ) | (4 | ) | ||||||||
| Net Loss |
$ | (2,891 | ) | $ | (1,193 | ) | $ | (119 | ) | $ | (1,721 | ) | ||||
| Basic and Diluted Loss per Share: |
||||||||||||||||
| Continuing Operations |
$ | (.23 | ) | $ | (.10 | ) | $ | (.01 | ) | $ | (.14 | ) | ||||
| Net Loss |
$ | (.23 | ) | $ | (.10 | ) | $ | (.01 | ) | $ | (.14 | ) | ||||
| (a) | Includes a $0.3 million and $0.7 million pre-tax gain on sales of real estate in the first and third quarters of 2010, respectively. |
| (b) | Includes $0.8 million, $1.0 million, $0.5 million, and $2.1 million pre-tax restructuring costs in the first, second, third, and fourth quarters of 2009, respectively. |
F-44
Table of Contents
Kadant Inc.
Schedule II
Valuation and Qualifying Accounts
(In thousands)
| Description |
Balance at Beginning of Year |
Provision Charged to Expense |
Accounts Recovered |
Accounts Written Off |
Other (a) | Balance at End of Year |
||||||||||||||||||
| Allowance for Doubtful Accounts |
||||||||||||||||||||||||
| Year Ended January 1, 2011 |
$ | 2,493 | $ | 455 | $ | 111 | $ | (835 | ) | $ | (39 | ) | $ | 2,185 | ||||||||||
| Year Ended January 2, 2010 |
$ | 2,985 | $ | 305 | $ | 334 | $ | (1,225 | ) | $ | 94 | $ | 2,493 | |||||||||||
| Year Ended January 3, 2009 |
$ | 2,639 | $ | 1,252 | $ | 8 | $ | (830 | ) | $ | (84 | ) | $ | 2,985 | ||||||||||
| Description |
Balance at Beginning of Year |
Provision Charged to Expense |
Activity Charged to Reserve |
Currency Translation |
Balance at End of Year |
|||||||||||||||
| Accrued Restructuring Costs (b) |
||||||||||||||||||||
| Year Ended January 1, 2011 |
$ | 3,636 | $ | 247 | $ | (3,293 | ) | $ | (157 | ) | $ | 433 | ||||||||
| Year Ended January 2, 2010 |
$ | 2,872 | $ | 4,429 | $ | (3,653 | ) | $ | (12 | ) | $ | 3,636 | ||||||||
| Year Ended January 3, 2009 |
$ | 308 | $ | 3,697 | $ | (1,074 | ) | $ | (59 | ) | $ | 2,872 | ||||||||
| (a) | Primarily includes the effect of foreign currency translation. |
| (b) | The nature of the activity in this account is described in Note 8 to the consolidated financial statements. |
F-45