Attached files
| file | filename |
|---|---|
| 8-K - 8-K - MAINSOURCE FINANCIAL GROUP | a17-18590_18k.htm |
Exhibit 99.1
Creating a Leading Midwest Banking Franchise
2 Certain statements contained in this presentation which are not statements of historical fact constitute forward-looking statements within the meaning of the Private Securities Litigation Reform Act of 1955. Such statements include, but are not limited to, certain plans, expectations, goals, projections and benefits relating to the merger transaction among First Financial and MainSource, which are subject to numerous assumptions, risks and uncertainties. Words such as ‘‘believes,’’ ‘‘anticipates,’’ “likely,” “expected,” “estimated,” ‘‘intends’’ and other similar expressions are intended to identify forward-looking statements but are not the exclusive means of identifying such statements. Please refer to each of First Financial’s and MainSource’s Annual Report on Form 10-K for the year ended December 31, 2016, as well as their other filings with the SEC, for a more detailed discussion of risks, uncertainties and factors that could cause actual results to differ from those discussed in the forward-looking statements. Forward-looking statements are not historical facts but instead express only management’s beliefs regarding future results or events, many of which, by their nature, are inherently uncertain and outside of the management’s control. It is possible that actual results and outcomes may differ, possibly materially, from the anticipated results or outcomes indicated in these forward-looking statements. In addition to factors previously disclosed in reports filed by First Financial and MainSource with the SEC, risks and uncertainties for First Financial, MainSource and the combined company include, but are not limited to: the possibility that any of the anticipated benefits of the proposed merger will not be realized or will not be realized within the expected time period; the risk that integration of MainSource’s operations with those of First Financial will be materially delayed or will be more costly or difficult than expected; the inability to close the merger in a timely manner; the inability to complete the merger due to the failure of First Financial’s or MainSource’s shareholders to adopt the merger agreement; diversion of management's attention from ongoing business operations and opportunities; the failure to satisfy other conditions to completion of the merger, including receipt of required regulatory and other approvals; the failure of the proposed merger to close for any other reason; the challenges of integrating and retaining key employees; the effect of the announcement of the merger on First Financial’s, MainSource’s or the combined company's respective customer relationships and operating results; the possibility that the merger may be more expensive to complete than anticipated, including as a result of unexpected factors or events; and general competitive, economic, political and market conditions and fluctuations. All forward-looking statements included in this filing are made as of the date hereof and are based on information available at the time of the filing. Except as required by law, neither First Financial nor MainSource assumes no obligation to update any forward-looking statement. Proxy Solicitation First Financial, MainSource, their directors, executive officers and certain other persons may be deemed to be participants in the solicitation of proxies from First Financial’s and MainSource’s shareholders in favor of the approval of the merger. Information about the directors and executive officers of First Financial and their ownership of First Financial common stock is set forth in the proxy statement for First Financial’s 2017 annual meeting of shareholders, as previously filed with the SEC on April 13, 2017, and First Financial’s Annual Report on Form 10-K for the year ended December 31, 2016, as previously filed with the SEC on February 24, 2017. Information about the directors and executive officers of MainSource and their ownership of MainSource common stock is set forth in the proxy statement for MainSource’s 2017 annual meeting of shareholders, as previously filed with the SEC on March 24, 2017. Shareholders may obtain additional information regarding the interests of such participants by reading the registration statement and the proxy statement/prospectus when they become available. Forward Looking Statement Disclosure
3 This investor presentation is being made in respect of the proposed merger transaction between First Financial Bancorp. (“First Financial”) and MainSource Financial Group, Inc. (“MainSource”). First Financial intends to file a registration statement on Form S-4 with the Securities and Exchange Commission (the "SEC"), which will include a joint proxy statement of First Financial and MainSource and a prospectus of First Financial, and each party will file other documents regarding the proposed transaction with the SEC. A definitive joint proxy statement/prospectus will also be sent to the First Financial and MainSource shareholders seeking any required shareholder approvals. Before making any voting or investment decision, investors and security holders of First Financial and MainSource are urged to carefully read the entire registration statement and joint proxy statement/prospectus, when they become available, as well as any amendments or supplements to these documents, because they will contain important information about the proposed transaction. The documents filed by First Financial and MainSource with the SEC may be obtained free of charge at the SEC’s website at www.sec.gov. In addition, the documents filed by First Financial may be obtained free of charge at First Financial’s website at http://www.bankatfirst.com and the documents filed by MainSource may be obtained free of charge at MainSource’s website at https://www.mainsourcebank.com under the tab “Investor Relations”. Alternatively, these documents, when available, can be obtained free of charge from First Financial upon written request to First Financial Bancorp, Attention: Shannon M. Kuhl, Chief Legal Officer and Corporate Secretary, 255 E. Fifth Street, Suite 2900, Cincinnati, Ohio 45202 or by calling (877) 322-9530 or upon written request to MainSource Financial Group, Inc., 2105 North State Road 3 Bypass, Greensburg, Indiana 47240, Attention: James M. Anderson, Chief Financial Officer, or by calling (812) 663-6734. This presentation shall not constitute an offer to sell or the solicitation of an offer to buy securities nor shall there be any sale of securities in any jurisdiction in which such offer, solicitation or sale would be unlawful prior to registration or qualification under the securities laws of such jurisdiction. This communication is also not a solicitation of any vote in any jurisdiction pursuant to the proposed transactions or otherwise. No offer of securities or solicitation will be made except by means of a prospectus meeting the requirements of Section 10 of the Securities Act of 1933, as amended. The communication is not a substitute for the joint proxy statement/prospectus that First Financial and MainSource will file with the SEC. Non-GAAP Measures This investor presentation contains certain non-GAAP financial measures of First Financial and MainSource determined by methods other than in accordance with generally accepted accounting principles. We use non-GAAP financial measures to provide meaningful supplemental information regarding our performance. We believe these non-GAAP measures are beneficial in assessing our operating results and related trends, and when planning and forecasting future periods. These non-GAAP disclosures should be considered in addition to, and not as a substitute for or preferable to, financial results determined in accordance with GAAP. The non-GAAP financial measures we use may differ from the non-GAAP financial measures other financial institutions use to measure their results of operations. Reconciliations of these non-GAAP financial measures to the most directly comparable GAAP financial measures are included in the Appendix to this presentation. Important Additional Information About the Merger
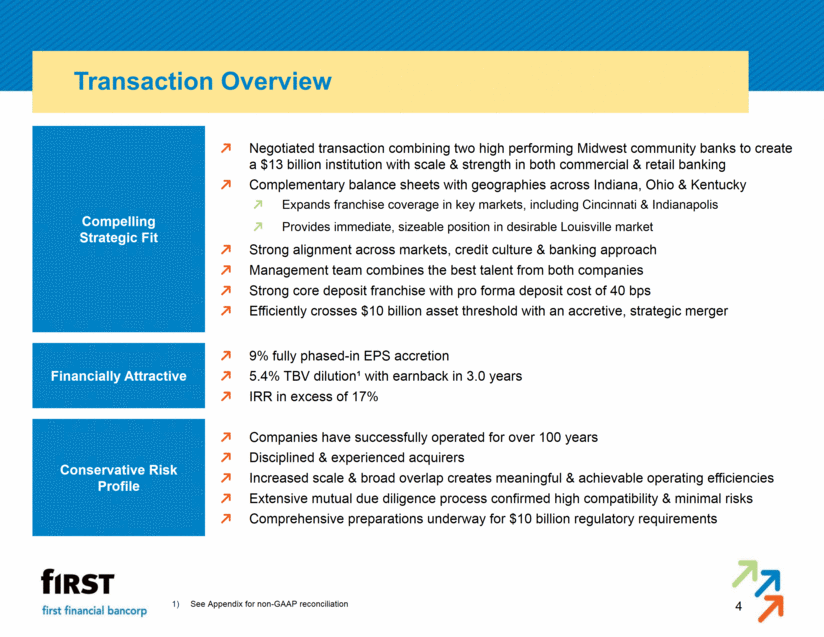
4 Transaction Overview Negotiated transaction combining two high performing Midwest community banks to create a $13 billion institution with scale & strength in both commercial & retail banking Complementary balance sheets with geographies across Indiana, Ohio & Kentucky Expands franchise coverage in key markets, including Cincinnati & Indianapolis Provides immediate, sizeable position in desirable Louisville market Strong alignment across markets, credit culture & banking approach Management team combines the best talent from both companies Strong core deposit franchise with pro forma deposit cost of 40 bps Efficiently crosses $10 billion asset threshold with an accretive, strategic merger Compelling Strategic Fit Financially Attractive 9% fully phased-in EPS accretion 5.4% TBV dilution¹ with earnback in 3.0 years IRR in excess of 17% Companies have successfully operated for over 100 years Disciplined & experienced acquirers Increased scale & broad overlap creates meaningful & achievable operating efficiencies Extensive mutual due diligence process confirmed high compatibility & minimal risks Comprehensive preparations underway for $10 billion regulatory requirements Conservative Risk Profile See Appendix for non-GAAP reconciliation
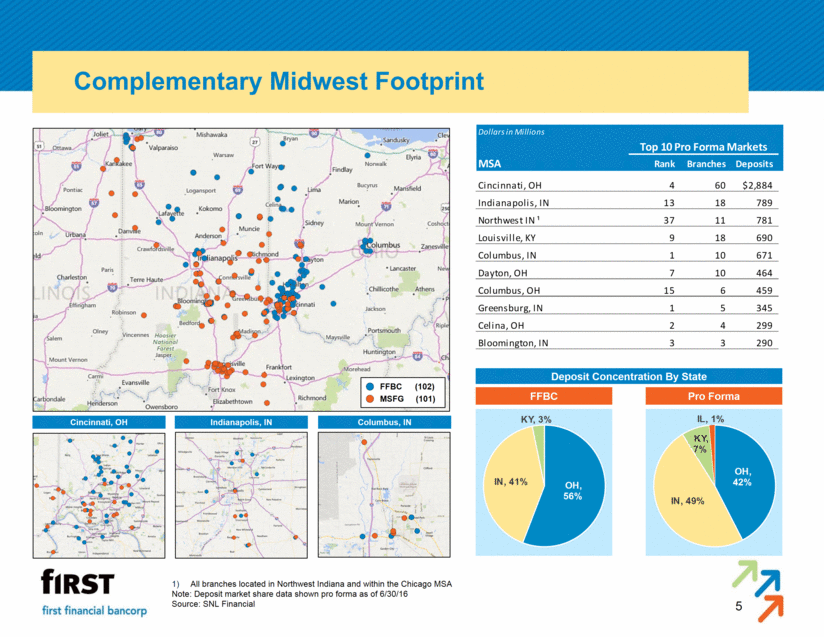
5 Complementary Midwest Footprint All branches located in Northwest Indiana and within the Chicago MSA Note: Deposit market share data shown pro forma as of 6/30/16 Source: SNL Financial Deposit Concentration By State FFBC Pro Forma Cincinnati, OH Indianapolis, IN FFBC (102) MSFG (101) Columbus, IN
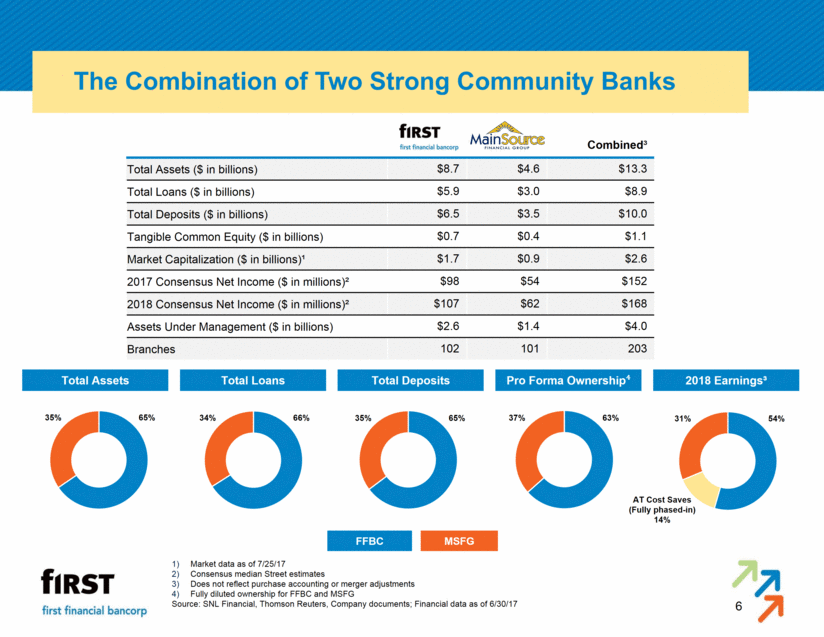
6 The Combination of Two Strong Community Banks Market data as of 7/25/17 Consensus median Street estimates Does not reflect purchase accounting or merger adjustments Fully diluted ownership for FFBC and MSFG Source: SNL Financial, Thomson Reuters, Company documents; Financial data as of 6/30/17 Combined³ Total Assets ($ in billions) $8.7 $4.6 $13.3 Total Loans ($ in billions) $5.9 $3.0 $8.9 Total Deposits ($ in billions) $6.5 $3.5 $10.0 Tangible Common Equity ($ in billions) $0.7 $0.4 $1.1 Market Capitalization ($ in billions)¹ $1.7 $0.9 $2.6 2017 Consensus Net Income ($ in millions)² $98 $54 $152 2018 Consensus Net Income ($ in millions)² $107 $62 $168 Assets Under Management ($ in billions) $2.6 $1.4 $4.0 Branches 102 101 203 Total Assets Total Loans Total Deposits Pro Forma Ownership4 2018 Earnings³ 35% 65% 34% 66% 35% 65% 37% 63% 31% 54% AT Cost Saves (Fully phased-in) 14% FFBC MSFG
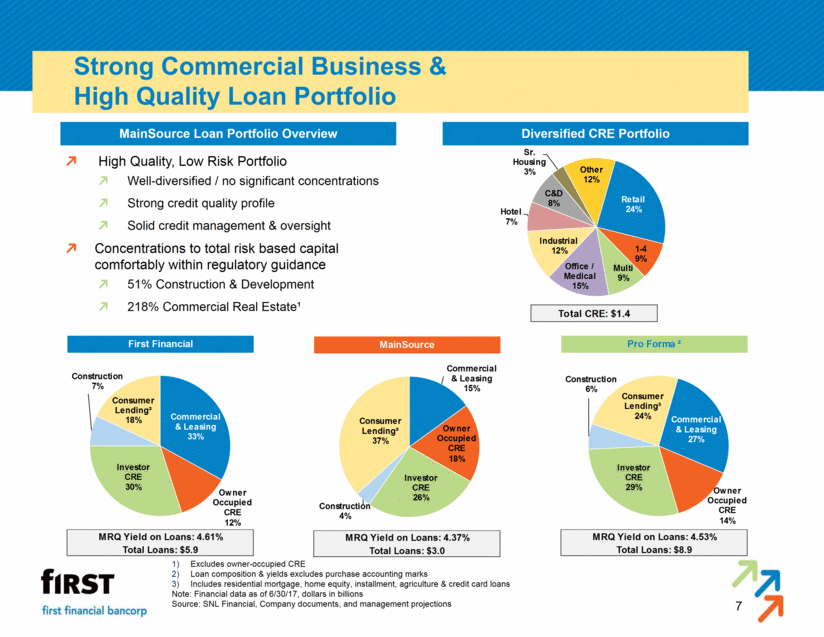
7 Strong Commercial Business & High Quality Loan Portfolio Excludes owner-occupied CRE Loan composition & yields excludes purchase accounting marks Includes residential mortgage, home equity, installment, agriculture & credit card loans Note: Financial data as of 6/30/17, dollars in billions Source: SNL Financial, Company documents, and management projections Diversified CRE Portfolio High Quality, Low Risk Portfolio Well-diversified / no significant concentrations Strong credit quality profile Solid credit management & oversight Concentrations to total risk based capital comfortably within regulatory guidance 51% Construction & Development 218% Commercial Real Estate¹ MainSource Loan Portfolio Overview
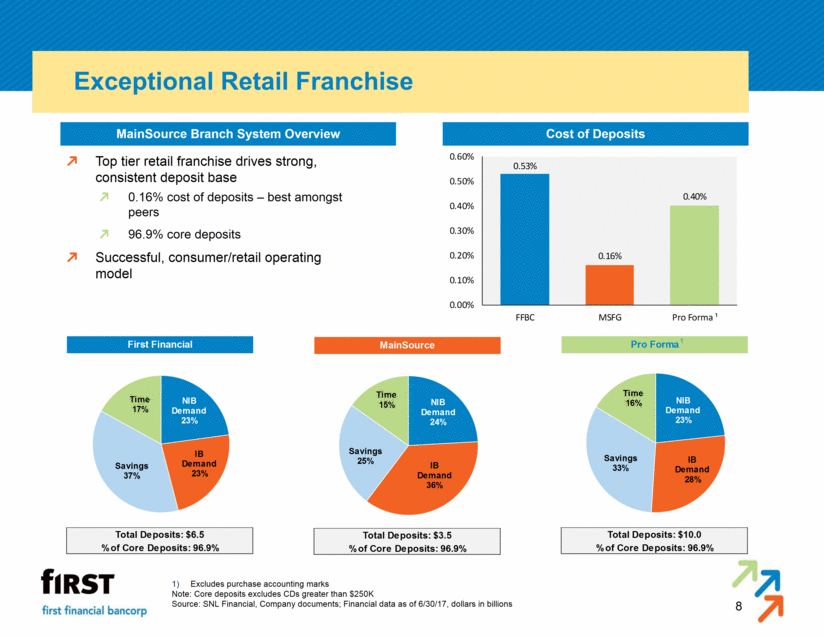
8 Exceptional Retail Franchise Excludes purchase accounting marks Note: Core deposits excludes CDs greater than $250K Source: SNL Financial, Company documents; Financial data as of 6/30/17, dollars in billions Cost of Deposits MainSource Branch System Overview Top tier retail franchise drives strong, consistent deposit base 0.16% cost of deposits – best amongst peers 96.9% core deposits Successful, consumer/retail operating model 1
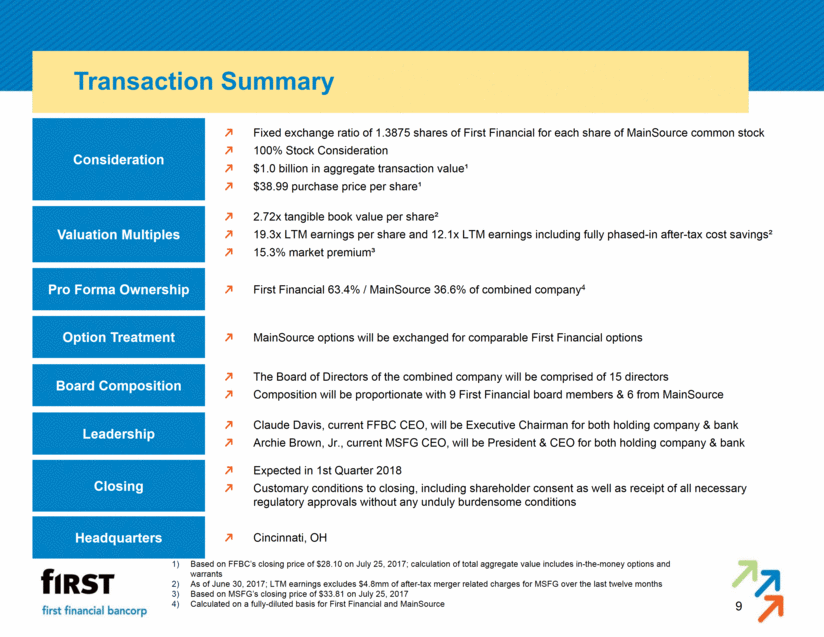
9 Transaction Summary Fixed exchange ratio of 1.3875 shares of First Financial for each share of MainSource common stock 100% Stock Consideration $1.0 billion in aggregate transaction value¹ $38.99 purchase price per share¹ MainSource options will be exchanged for comparable First Financial options First Financial 63.4% / MainSource 36.6% of combined company4 The Board of Directors of the combined company will be comprised of 15 directors Composition will be proportionate with 9 First Financial board members & 6 from MainSource Claude Davis, current FFBC CEO, will be Executive Chairman for both holding company & bank Archie Brown, Jr., current MSFG CEO, will be President & CEO for both holding company & bank Expected in 1st Quarter 2018 Customary conditions to closing, including shareholder consent as well as receipt of all necessary regulatory approvals without any unduly burdensome conditions Consideration Option Treatment Pro Forma Ownership Board Composition Leadership Closing Based on FFBC’s closing price of $28.10 on July 25, 2017; calculation of total aggregate value includes in-the-money options and warrants As of June 30, 2017; LTM earnings excludes $4.8mm of after-tax merger related charges for MSFG over the last twelve months Based on MSFG’s closing price of $33.81 on July 25, 2017 Calculated on a fully-diluted basis for First Financial and MainSource Headquarters Cincinnati, OH Valuation Multiples 2.72x tangible book value per share² 19.3x LTM earnings per share and 12.1x LTM earnings including fully phased-in after-tax cost savings² 15.3% market premium³
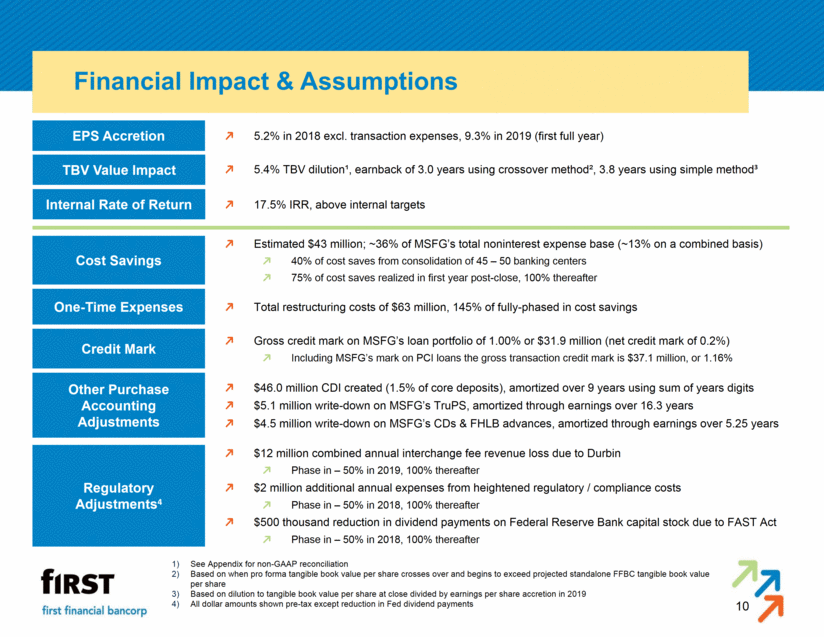
10 Financial Impact & Assumptions Estimated $43 million; ~36% of MSFG’s total noninterest expense base (~13% on a combined basis) 40% of cost saves from consolidation of 45 – 50 banking centers 75% of cost saves realized in first year post-close, 100% thereafter Gross credit mark on MSFG’s loan portfolio of 1.00% or $31.9 million (net credit mark of 0.2%) Including MSFG’s mark on PCI loans the gross transaction credit mark is $37.1 million, or 1.16% Cost Savings One-Time Expenses EPS Accretion TBV Value Impact Internal Rate of Return 5.2% in 2018 excl. transaction expenses, 9.3% in 2019 (first full year) 5.4% TBV dilution¹, earnback of 3.0 years using crossover method², 3.8 years using simple method³ 17.5% IRR, above internal targets Credit Mark Total restructuring costs of $63 million, 145% of fully-phased in cost savings See Appendix for non-GAAP reconciliation Based on when pro forma tangible book value per share crosses over and begins to exceed projected standalone FFBC tangible book value per share Based on dilution to tangible book value per share at close divided by earnings per share accretion in 2019 All dollar amounts shown pre-tax except reduction in Fed dividend payments $12 million combined annual interchange fee revenue loss due to Durbin Phase in – 50% in 2019, 100% thereafter $2 million additional annual expenses from heightened regulatory / compliance costs Phase in – 50% in 2018, 100% thereafter $500 thousand reduction in dividend payments on Federal Reserve Bank capital stock due to FAST Act Phase in – 50% in 2018, 100% thereafter $46.0 million CDI created (1.5% of core deposits), amortized over 9 years using sum of years digits $5.1 million write-down on MSFG’s TruPS, amortized through earnings over 16.3 years $4.5 million write-down on MSFG’s CDs & FHLB advances, amortized through earnings over 5.25 years Regulatory Adjustments4 Other Purchase Accounting Adjustments
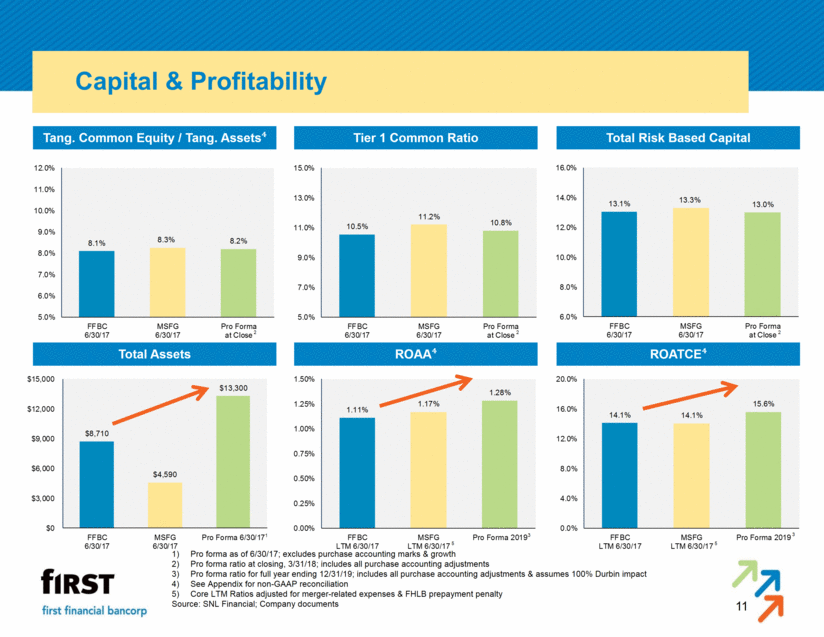
11 Capital & Profitability Total Assets Total Risk Based Capital ROAA4 ROATCE4 Tang. Common Equity / Tang. Assets4 Tier 1 Common Ratio Pro forma as of 6/30/17; excludes purchase accounting marks & growth Pro forma ratio at closing, 3/31/18; includes all purchase accounting adjustments Pro forma ratio for full year ending 12/31/19; includes all purchase accounting adjustments & assumes 100% Durbin impact See Appendix for non-GAAP reconciliation Core LTM Ratios adjusted for merger-related expenses & FHLB prepayment penalty Source: SNL Financial; Company documents 2 2 2 3 3 5 5 1
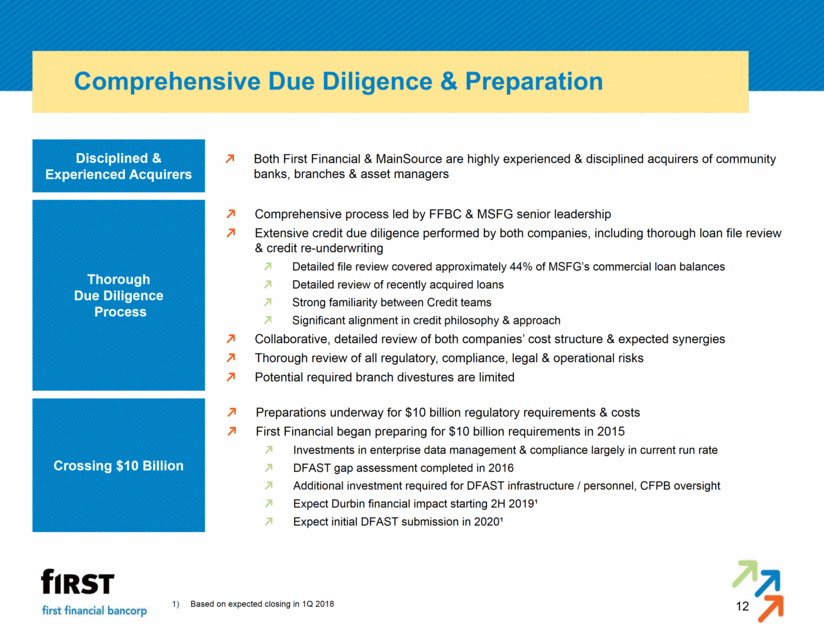
12 Comprehensive Due Diligence & Preparation Disciplined & Experienced Acquirers Thorough Due Diligence Process Crossing $10 Billion Both First Financial & MainSource are highly experienced & disciplined acquirers of community banks, branches & asset managers Comprehensive process led by FFBC & MSFG senior leadership Extensive credit due diligence performed by both companies, including thorough loan file review & credit re-underwriting Detailed file review covered approximately 44% of MSFG’s commercial loan balances Detailed review of recently acquired loans Strong familiarity between Credit teams Significant alignment in credit philosophy & approach Collaborative, detailed review of both companies’ cost structure & expected synergies Thorough review of all regulatory, compliance, legal & operational risks Potential required branch divestures are limited Preparations underway for $10 billion regulatory requirements & costs First Financial began preparing for $10 billion requirements in 2015 Investments in enterprise data management & compliance largely in current run rate DFAST gap assessment completed in 2016 Additional investment required for DFAST infrastructure / personnel, CFPB oversight Expect Durbin financial impact starting 2H 2019¹ Expect initial DFAST submission in 2020¹ Based on expected closing in 1Q 2018
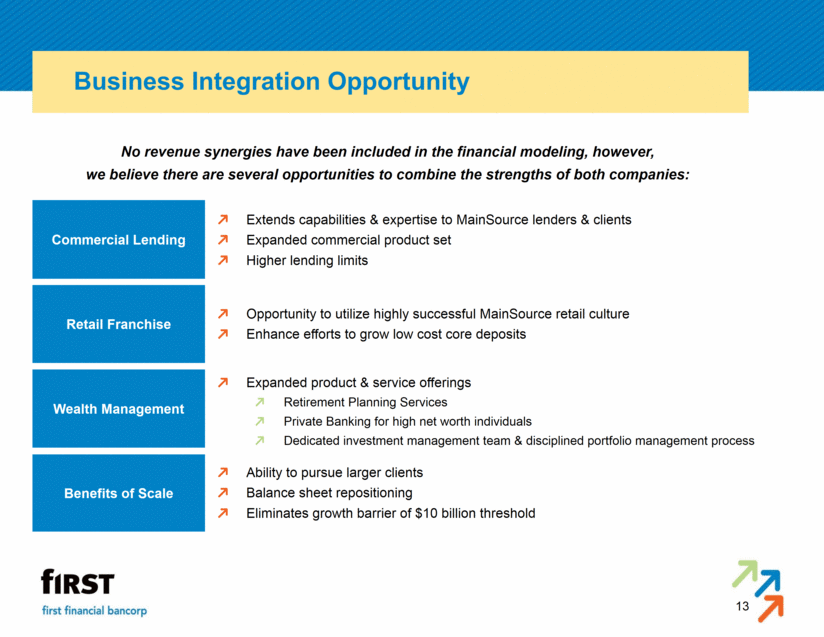
13 Business Integration Opportunity No revenue synergies have been included in the financial modeling, however, we believe there are several opportunities to combine the strengths of both companies: Extends capabilities & expertise to MainSource lenders & clients Expanded commercial product set Higher lending limits Commercial Lending Retail Franchise Benefits of Scale Opportunity to utilize highly successful MainSource retail culture Enhance efforts to grow low cost core deposits Wealth Management Expanded product & service offerings Retirement Planning Services Private Banking for high net worth individuals Dedicated investment management team & disciplined portfolio management process Ability to pursue larger clients Balance sheet repositioning Eliminates growth barrier of $10 billion threshold
14 Appendix

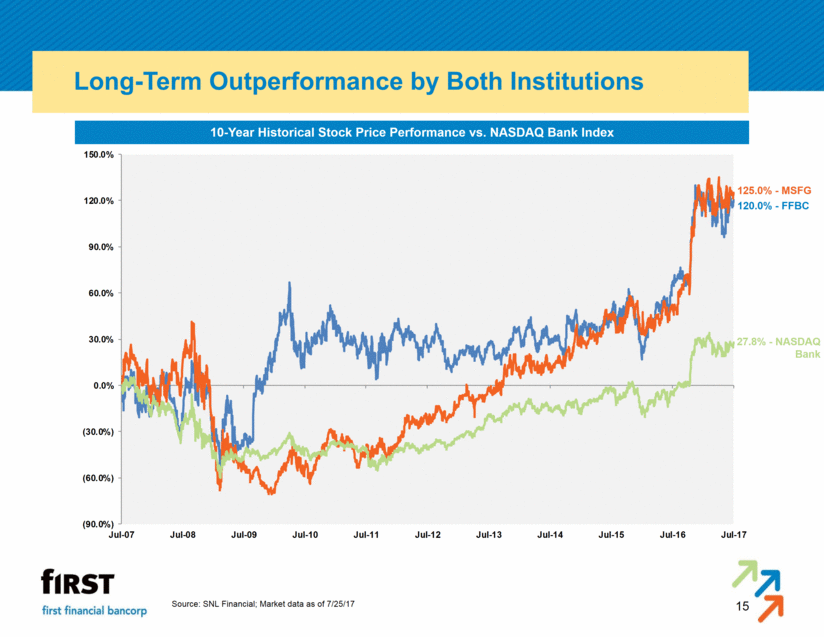
15 Long-Term Outperformance by Both Institutions Source: SNL Financial; Market data as of 7/25/17 10-Year Historical Stock Price Performance vs. NASDAQ Bank Index 27.8% - NASDAQ Bank 125.0% - MSFG 120.0% - FFBC
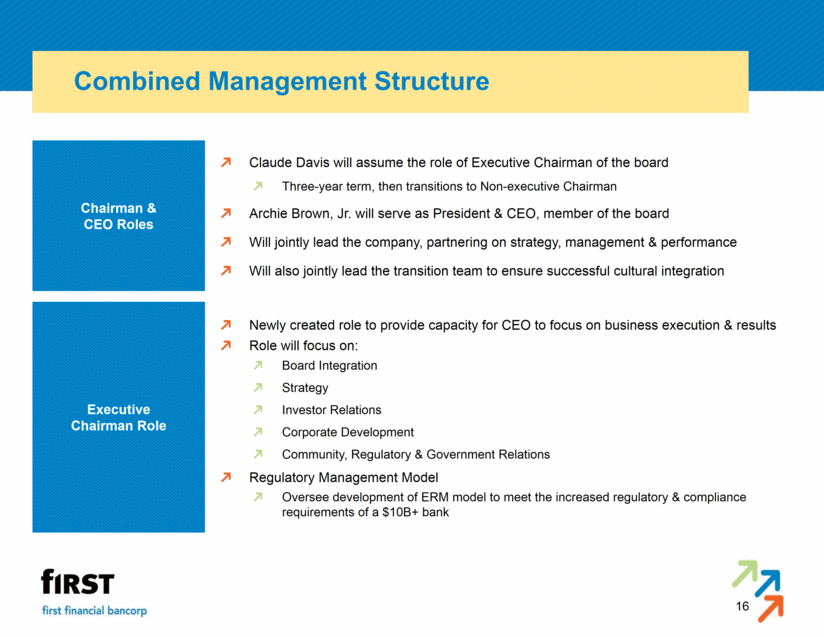
16 Combined Management Structure Claude Davis will assume the role of Executive Chairman of the board Three-year term, then transitions to Non-executive Chairman Archie Brown, Jr. will serve as President & CEO, member of the board Will jointly lead the company, partnering on strategy, management & performance Will also jointly lead the transition team to ensure successful cultural integration Chairman & CEO Roles Executive Chairman Role Newly created role to provide capacity for CEO to focus on business execution & results Role will focus on: Board Integration Strategy Investor Relations Corporate Development Community, Regulatory & Government Relations Regulatory Management Model Oversee development of ERM model to meet the increased regulatory & compliance requirements of a $10B+ bank
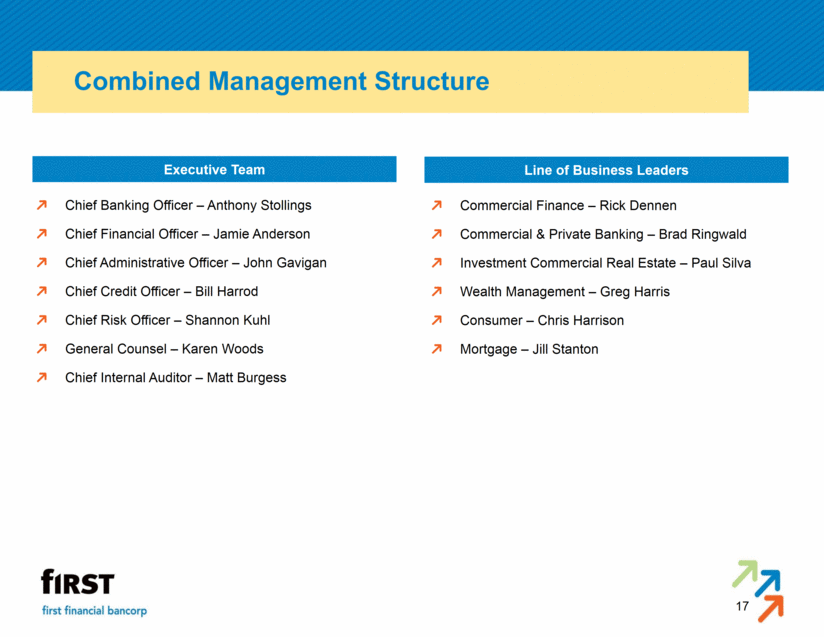
17 Combined Management Structure Chief Banking Officer – Anthony Stollings Chief Financial Officer – Jamie Anderson Chief Administrative Officer – John Gavigan Chief Credit Officer – Bill Harrod Chief Risk Officer – Shannon Kuhl General Counsel – Karen Woods Chief Internal Auditor – Matt Burgess Executive Team Line of Business Leaders Commercial Finance – Rick Dennen Commercial & Private Banking – Brad Ringwald Investment Commercial Real Estate – Paul Silva Wealth Management – Greg Harris Consumer – Chris Harrison Mortgage – Jill Stanton
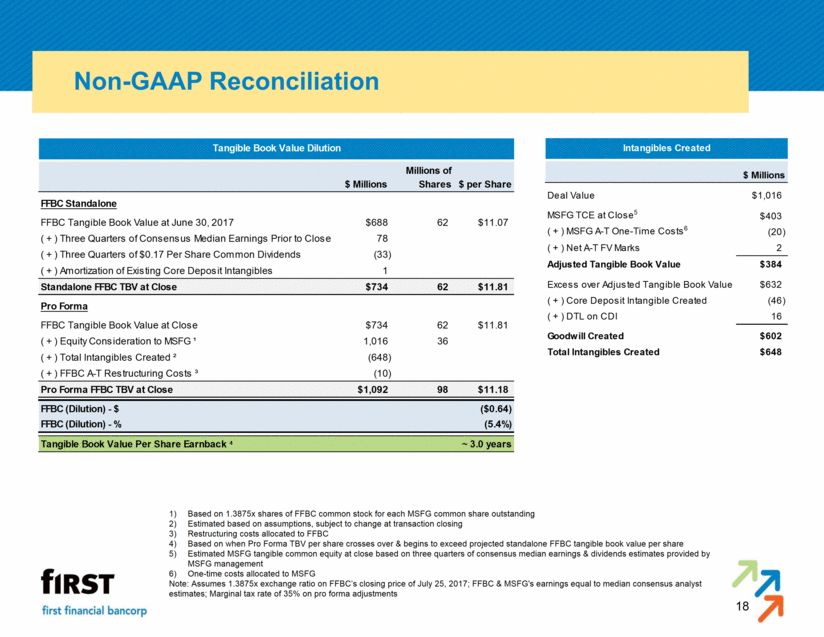
18 Non-GAAP Reconciliation Based on 1.3875x shares of FFBC common stock for each MSFG common share outstanding Estimated based on assumptions, subject to change at transaction closing Restructuring costs allocated to FFBC Based on when Pro Forma TBV per share crosses over & begins to exceed projected standalone FFBC tangible book value per share Estimated MSFG tangible common equity at close based on three quarters of consensus median earnings & dividends estimates provided by MSFG management One-time costs allocated to MSFG Note: Assumes 1.3875x exchange ratio on FFBC’s closing price of July 25, 2017; FFBC & MSFG's earnings equal to median consensus analyst estimates; Marginal tax rate of 35% on pro forma adjustments
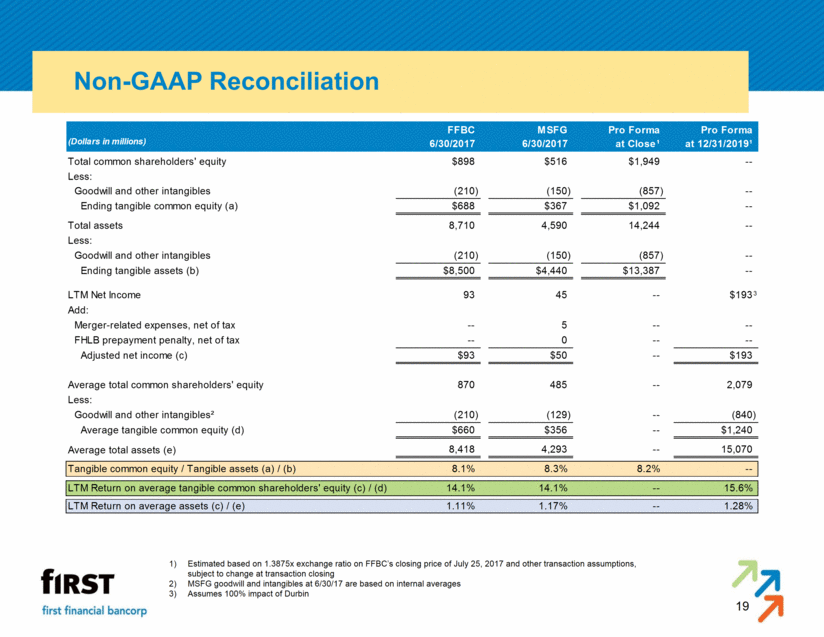
19 Non-GAAP Reconciliation Estimated based on 1.3875x exchange ratio on FFBC’s closing price of July 25, 2017 and other transaction assumptions, subject to change at transaction closing MSFG goodwill and intangibles at 6/30/17 are based on internal averages Assumes 100% impact of Durbin 3
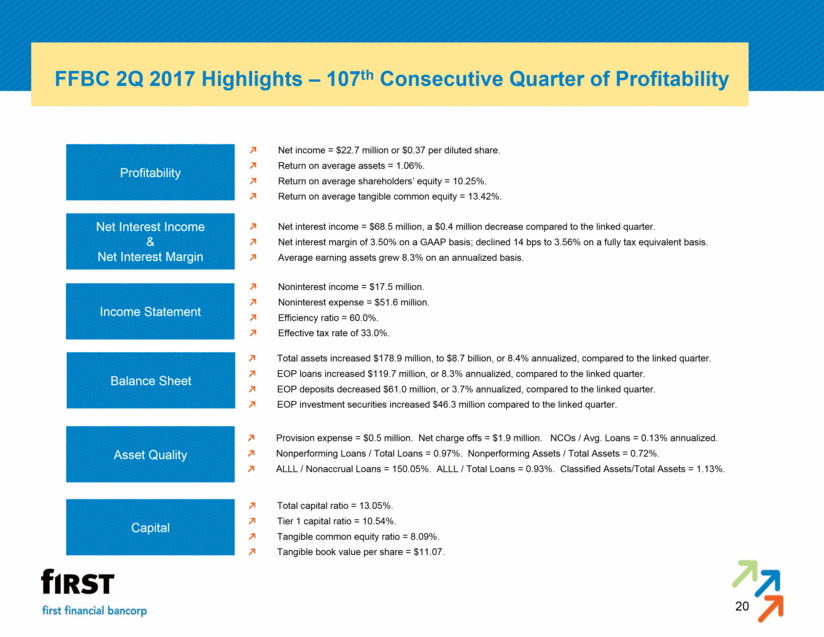
20 FFBC 2Q 2017 Highlights – 107th Consecutive Quarter of Profitability Total assets increased $178.9 million, to $8.7 billion, or 8.4% annualized, compared to the linked quarter. EOP loans increased $119.7 million, or 8.3% annualized, compared to the linked quarter. EOP deposits decreased $61.0 million, or 3.7% annualized, compared to the linked quarter. EOP investment securities increased $46.3 million compared to the linked quarter. Balance Sheet Profitability Asset Quality Net Interest Income & Net Interest Margin Income Statement Capital Noninterest income = $17.5 million. Noninterest expense = $51.6 million. Efficiency ratio = 60.0%. Effective tax rate of 33.0%. Net interest income = $68.5 million, a $0.4 million decrease compared to the linked quarter. Net interest margin of 3.50% on a GAAP basis; declined 14 bps to 3.56% on a fully tax equivalent basis. Average earning assets grew 8.3% on an annualized basis. Net income = $22.7 million or $0.37 per diluted share. Return on average assets = 1.06%. Return on average shareholders’ equity = 10.25%. Return on average tangible common equity = 13.42%. Provision expense = $0.5 million. Net charge offs = $1.9 million. NCOs / Avg. Loans = 0.13% annualized. Nonperforming Loans / Total Loans = 0.97%. Nonperforming Assets / Total Assets = 0.72%. ALLL / Nonaccrual Loans = 150.05%. ALLL / Total Loans = 0.93%. Classified Assets/Total Assets = 1.13%. Total capital ratio = 13.05%. Tier 1 capital ratio = 10.54%. Tangible common equity ratio = 8.09%. Tangible book value per share = $11.07.
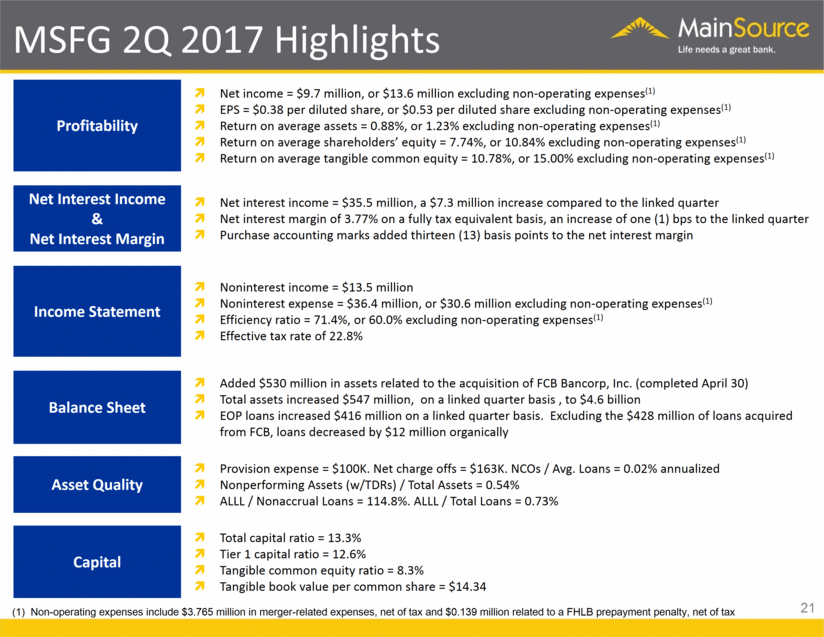
MSFG 2Q 2017 Highlights 21 Profitability Net Interest Income & Net Interest Margin Income Statement Balance Sheet Asset Quality Capital Net income = $9.7 million, or $13.6 million excluding non-operating expenses(1) EPS = $0.38 per diluted share, or $0.53 per diluted share excluding non-operating expenses(1) Return on average assets = 0.88%, or 1.23% excluding non-operating expenses(1) Return on average shareholders’ equity = 7.74%, or 10.84% excluding non-operating expenses(1) Return on average tangible common equity = 10.78%, or 15.00% excluding non-operating expenses(1) Net interest income = $35.5 million, a $7.3 million increase compared to the linked quarter Net interest margin of 3.77% on a fully tax equivalent basis, an increase of one (1) bps to the linked quarter Purchase accounting marks added thirteen (13) basis points to the net interest margin Noninterest income = $13.5 million Noninterest expense = $36.4 million, or $30.6 million excluding non-operating expenses(1) Efficiency ratio = 71.4%, or 60.0% excluding non-operating expenses(1) Effective tax rate of 22.8% Added $530 million in assets related to the acquisition of FCB Bancorp, Inc. (completed April 30) Total assets increased $547 million, on a linked quarter basis , to $4.6 billion EOP loans increased $416 million on a linked quarter basis. Excluding the $428 million of loans acquired from FCB, loans decreased by $12 million organically Provision expense = $100K. Net charge offs = $163K. NCOs / Avg. Loans = 0.02% annualized Nonperforming Assets (w/TDRs) / Total Assets = 0.54% ALLL / Nonaccrual Loans = 114.8%. ALLL / Total Loans = 0.73% Total capital ratio = 13.3% Tier 1 capital ratio = 12.6% Tangible common equity ratio = 8.3% Tangible book value per common share = $14.34 (1) Non-operating expenses include $3.765 million in merger-related expenses, net of tax and $0.139 million related to a FHLB prepayment penalty, net of tax
22