Attached files
| file | filename |
|---|---|
| 8-K - BANKWELL FINANCIAL GROUP, INC. 8-K - Bankwell Financial Group, Inc. | bwfg8k-72017.htm |

Bankwell Financial Group2Q’17 Investor Presentation

Safe Harbor This presentation may contain certain forward-looking statements about the Company. Forward-looking statements include statements regarding anticipated future events and can be identified by the fact that they do not relate strictly to historical or current facts. They often include words such as “believe,” “expect,” “would,” “should,” “could,” or “may.” Forward-looking statements, by their nature, are subject to risks and uncertainties. Certain factors that could cause actual results to differ materially from expected results include increased competitive pressures, changes in the interest rate environment, general economic conditions or conditions within the securities markets, and legislative and regulatory changes that could adversely affect the business in which the Company and its subsidiaries are engaged.

Bankwell Profile $1.76B asset Connecticut-based bank with key focus on CRE and C&I lending9 existing branches in Fairfield & New Haven Counties… actively pursuing core market expansionContinued strong performance in 2Q’17:10.0% Return on Equity YTD0.90% Return on Avg Assets YTD$19.89 Tangible Book ValueConsidered “Well Capitalized”; Capital Ratios exceeding required levels: 9.75% Tier 1 Leverage 10.91% CET 1 / RWA 12.16% Total Capital / RWA Company Overview NASDAQ: BWFG Footprint Existing branches (9)Branch application filed (1) Attractive core market of Fairfield County / Bridgeport-Stamford-Norwalk MSA2nd most affluent MSA & per capita personal income (PCPI) among highest in the USA18.3% of MSA households earn enough to rank in the top 5% all US householdsOpportunity to expand without risk of cannibalization
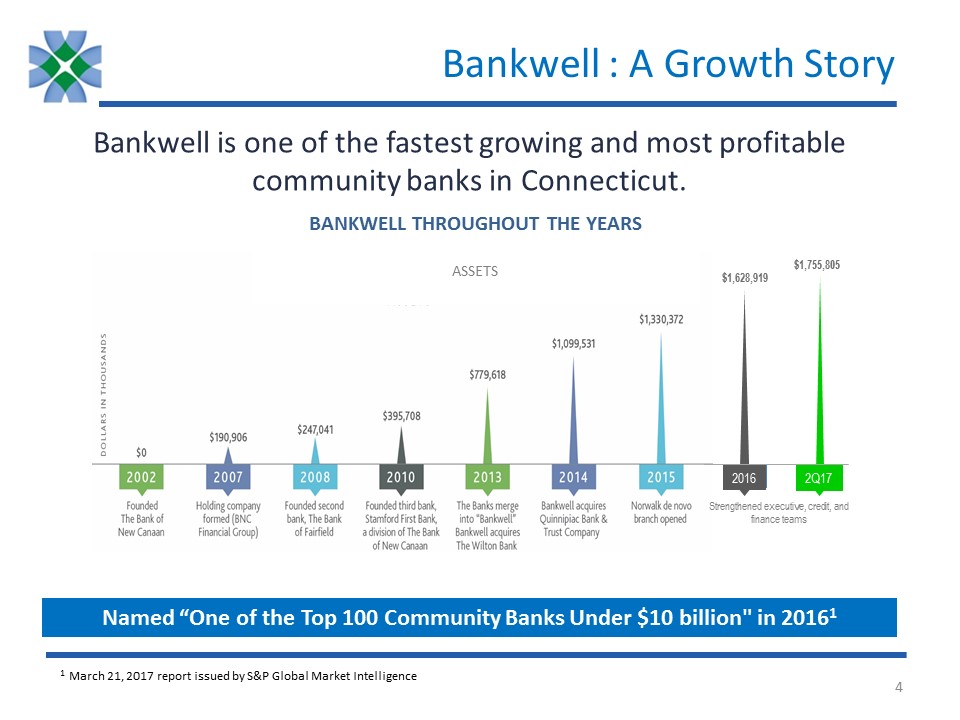
Bankwell : A Growth Story Bankwell is one of the fastest growing and most profitable community banks in Connecticut. Named “One of the Top 100 Community Banks Under $10 billion" in 20161 1 March 21, 2017 report issued by S&P Global Market Intelligence 2016 $1,628,919 Strengthened executive, credit, and finance teams 2Q17 $1,755,805 Bankwell Throughout The YearsAssets

Why Bankwell? Consistently strong performer in highly attractive markets
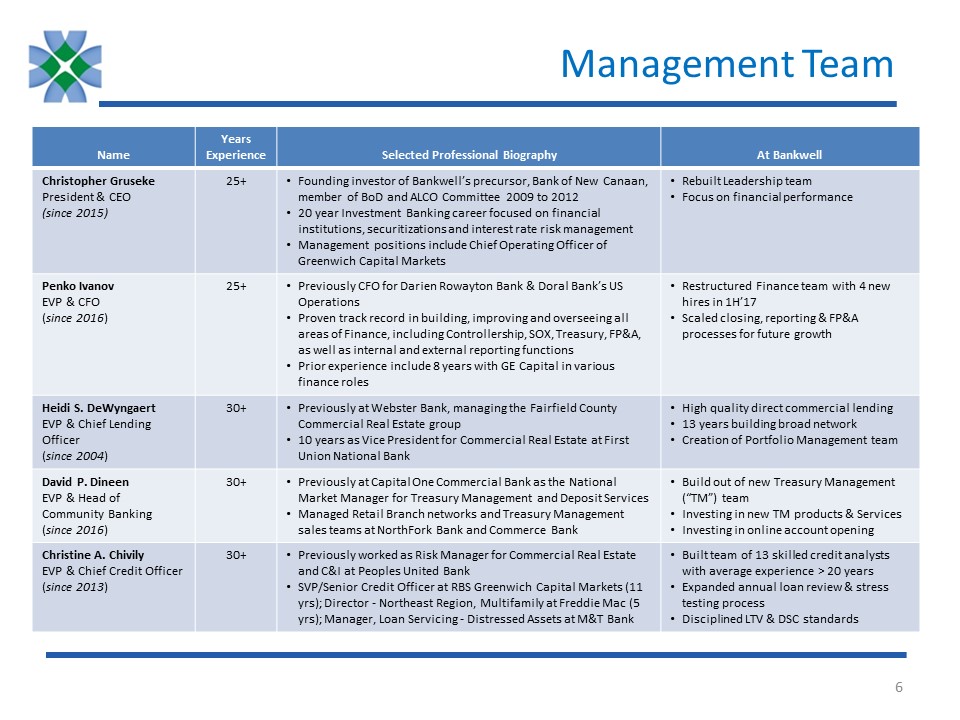
Management Team Name Years Experience Selected Professional Biography At Bankwell Christopher GrusekePresident & CEO(since 2015) 25+ Founding investor of Bankwell’s precursor, Bank of New Canaan, member of BoD and ALCO Committee 2009 to 201220 year Investment Banking career focused on financial institutions, securitizations and interest rate risk managementManagement positions include Chief Operating Officer of Greenwich Capital Markets Rebuilt Leadership teamFocus on financial performance Penko IvanovEVP & CFO(since 2016) 25+ Previously CFO for Darien Rowayton Bank & Doral Bank’s US OperationsProven track record in building, improving and overseeing all areas of Finance, including Controllership, SOX, Treasury, FP&A, as well as internal and external reporting functionsPrior experience include 8 years with GE Capital in various finance roles Restructured Finance team with 4 new hires in 1H’17Scaled closing, reporting & FP&A processes for future growth Heidi S. DeWyngaertEVP & Chief Lending Officer(since 2004) 30+ Previously at Webster Bank, managing the Fairfield County Commercial Real Estate group10 years as Vice President for Commercial Real Estate at First Union National Bank High quality direct commercial lending13 years building broad network Creation of Portfolio Management team David P. DineenEVP & Head of Community Banking(since 2016) 30+ Previously at Capital One Commercial Bank as the National Market Manager for Treasury Management and Deposit Services Managed Retail Branch networks and Treasury Management sales teams at NorthFork Bank and Commerce Bank Build out of new Treasury Management (“TM”) teamInvesting in new TM products & ServicesInvesting in online account opening Christine A. ChivilyEVP & Chief Credit Officer(since 2013) 30+ Previously worked as Risk Manager for Commercial Real Estate and C&I at Peoples United BankSVP/Senior Credit Officer at RBS Greenwich Capital Markets (11 yrs); Director - Northeast Region, Multifamily at Freddie Mac (5 yrs); Manager, Loan Servicing - Distressed Assets at M&T Bank Built team of 13 skilled credit analysts with average experience > 20 yearsExpanded annual loan review & stress testing processDisciplined LTV & DSC standards

Financial Performance Trends $MMs Year-to-date ROE of 10%Efficiently generating strong revenue & net income growth Net IncomeCAGR 45% RevenueCAGR 21%

Financial Highlights Dollars in thousands, except per share data 2014 2015 2016 1Q’17 2Q’17 Total assets $1,099,531 $1,330,372 $1,628,919 $1,672,242 $1,755,805 Loans, net $915,981 $1,129,748 $1,343,895 $1,406,407 $1,463,240 Loans to deposits 110.7% 109.1% 105.6% 107.2% 104.8% Efficiency ratio 68.7% 62.3% 56.5% 58.3% 54.7% Net interest margin 3.84% 3.77% 3.54% 3.35% 3.34% Total capital to risk weighted assets 13.55% 13.39% 12.85% 12.41% 12.16% Return on average equity 5.13% 6.76% 8.94% 10.12% 10.00% Tangible book value per share $16.35 $17.43 $18.98 $19.44 $19.89 Net interest income $31,660 $42,788 $49,092 $12,948 $13,642 Net income $4,568 $9,030 $12,350 $3,702 $3,769 EPS (fully diluted) $0.78 $1.21 $1.62 $0.48 $0.49 Quarterly ratios are year-to-date calculations
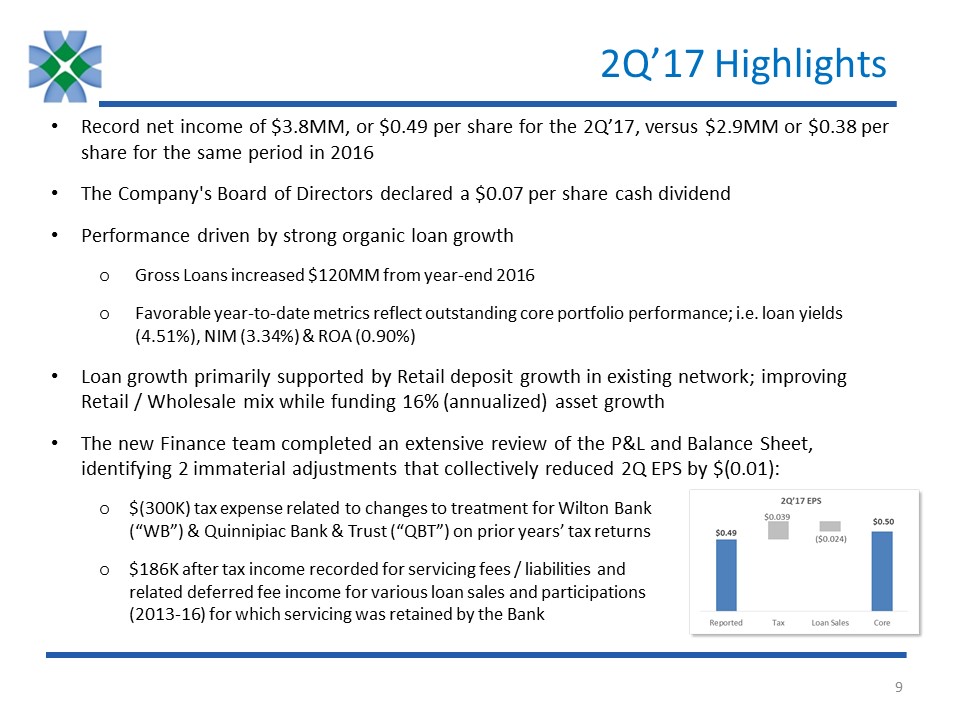
2Q’17 Highlights Record net income of $3.8MM, or $0.49 per share for the 2Q’17, versus $2.9MM or $0.38 per share for the same period in 2016The Company's Board of Directors declared a $0.07 per share cash dividendPerformance driven by strong organic loan growthGross Loans increased $120MM from year-end 2016Favorable year-to-date metrics reflect outstanding core portfolio performance; i.e. loan yields (4.51%), NIM (3.34%) & ROA (0.90%) Loan growth primarily supported by Retail deposit growth in existing network; improving Retail / Wholesale mix while funding 16% (annualized) asset growth The new Finance team completed an extensive review of the P&L and Balance Sheet, identifying 2 immaterial adjustments that collectively reduced 2Q EPS by $(0.01):$(300K) tax expense related to changes to treatment for Wilton Bank (“WB”) & Quinnipiac Bank & Trust (“QBT”) on prior years’ tax returns$186K after tax income recorded for servicing fees / liabilities and related deferred fee income for various loan sales and participations (2013-16) for which servicing was retained by the Bank

Consolidated Statement of Income 2Q’17 1Q’17 2Q’16Total Interest Income $17.7 $16.4 $14.7Total Interest Expense $4.0 $3.5 $2.8Net Interest Income $13.6 $12.9 $11.9Provision for Loan Losses $0.9 $0.5 $1.3Net Interest Income after Provision $12.7 $12.4 $10.6Non Interest Income $1.0 $1.3 $0.9Non Interest Expense $7.6 $8.2 $7.2Pre-Tax Income $5.8 $5.4 $4.2Tax Expense (Benefit) $2.4 $1.7 $1.3Reported Net Income (Loss) $3.8 $3.7 $2.9 Key drivers vs prior quarter (“PQ”)Net Interest Income growth driven by strong loan originations, partially offset from rising cost of fundsProvision for Loan Losses increase due to portfolio growth and changes in product mix Non Interest Income current quarter includes adjustment for servicing assets/liabilities while PQ includes gains on Loan & Security salesNon Interest Expense favorable to PQ due to one time charges relating to back office consolidation activity & increased Insurance expenseTax Expense includes $(300K) for adjustments to purchase accounting treatment for WB & QBT on prior year tax returns $MMs

Loan Portfolio CAGR 21% $1,429 $MMs $1,486

Loan Portfolio Concentration Commercial Real Estate Total Loan Portfolio Consumer/ Other 1 1 Includes Owner Occupied CRE June 2017 Product & Property Type Diversification Ongoing stratification and in-depth monitoring of concentration limits

Loan Portfolio Concentration: CRE Geography Distribution Measured Approach To ExpansionFollowing Existing Customers To New Locations Acquired The Wilton Bank.Acquired Quinnipiac Bank & Trust. (1) (2) CRE to Risk Based Capital Ratio Proven track record as CRE LenderStrong risk management practices in placeTeam of 13 skilled credit analysts with average experience > 20 years June 2017

Asset Quality 1 Negative values represent Net Recoveries2 Non-performing Assets to tangible equity and loan loss reserves NPL to Total Loans Texas Ratio 2 NPL $3.36 $3.79 $2.94 $5.30Net Charge Offs $(0.33) $(0.08) $0.10 $(0.17) $MMs 1 Allowance for Loan Loss NPA to Total Assets Uncompromising focus on credit
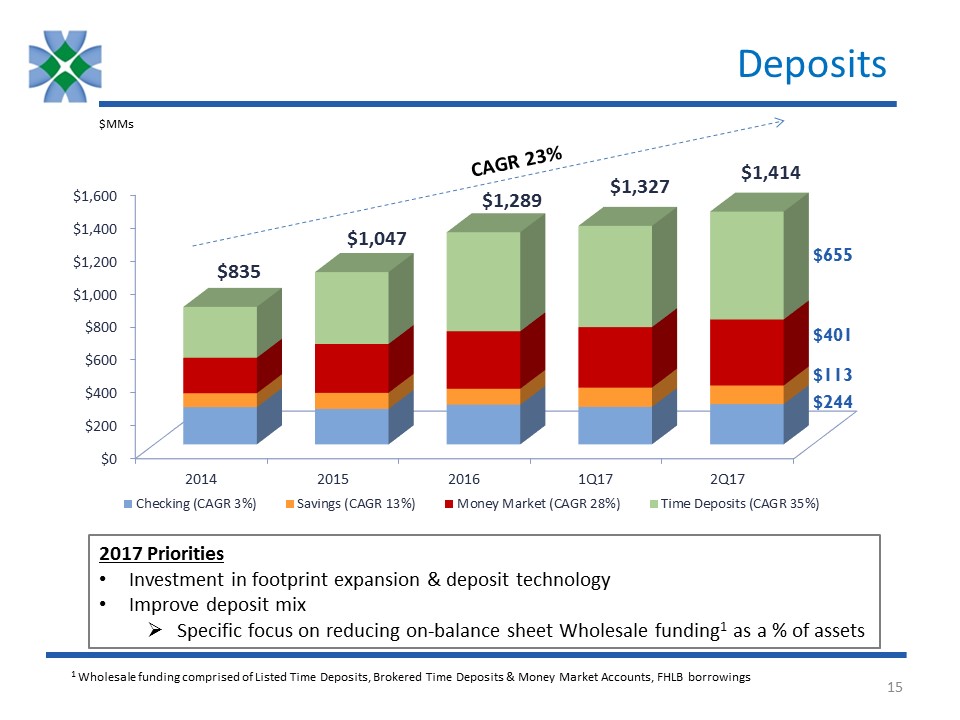
Deposits CAGR 23% $MMs $835 $1,047 $1,289 $1,327 $1,414 2017 Priorities Investment in footprint expansion & deposit technologyImprove deposit mixSpecific focus on reducing on-balance sheet Wholesale funding1 as a % of assets 1 Wholesale funding comprised of Listed Time Deposits, Brokered Time Deposits & Money Market Accounts, FHLB borrowings