Attached files
| file | filename |
|---|---|
| EX-99.1 - CAROLINA FINANCIAL CORP | e17347_ex99-1.htm |
| 8-K - CAROLINA FINANCIAL CORP | e17347_caro-8k.htm |

Second Quarter 2017 Earnings Release Investor Presentation NASDAQ: CARO July 21, 2017
2 Disclaimer Certain statements in this presentation contain “forward - looking statements” within the meaning of the Private Securities Litigation Reform Act of 1995 , such as statements relating to future plans and expectations, and are thus prospective . Such forward - looking statements include but are not limited to statements with respect to plans, objectives, expectations, and intentions and other statements that are not historical facts, and other statements identified by words such as “believes,” “expects,” “anticipates,” “estimates,” “intends,” “plans,” “targets,” and “projects,” as well as similar expressions . Such statements are subject to risks, uncertainties, and other factors which could cause actual results to differ materially from future results expressed or implied by such forward - looking statements . Although we believe that the assumptions underlying the forward - looking statements are reasonable, any of the assumptions could prove to be inaccurate . Therefore, we can give no assurance that the results contemplated in the forward - looking statements will be realized . The inclusion of this forward - looking information should not be construed as a representation by Carolina Financial Corporation (“Carolina Financial” or the “Company”) or any person that such future events, plans, or expectations will occur or be achieved . In addition to factors previously disclosed in the reports filed by Carolina Financial with the Securities and Exchange Commission (the “SEC”), additional risks and uncertainties may include, but are not limited to : ( 1 ) competitive pressures among depository and other financial institutions may increase significantly and have an effect on pricing, spending, third - party relationships and revenues ; ( 2 ) the strength of the United States economy in general and the strength of the local economies in which we conduct operations may be different than expected resulting in, among other things, a deterioration in the credit quality or a reduced demand for credit, including the resultant effect on the Company’s loan portfolio and allowance for loan losses ; ( 3 ) the rate of delinquencies and amounts of charge - offs, the level of allowance for loan loss, the rates of loan growth, or adverse changes in asset quality in our loan portfolio, which may result in increased credit risk - related losses and expenses ; ( 4 ) the risk that the preliminary financial information reported herein and our current preliminary analysis will be different when our review is finalized ; ( 5 ) changes in the U . S . legal and regulatory framework including, but not limited to, the Dodd - Frank Act and regulations adopted thereunder ; ( 6 ) adverse conditions in the stock market, the public debt market and other capital markets (including changes in interest rate conditions) could have a negative impact on the Company ; 7 ) the business related to acquisitions may not be integrated successfully or such integration may take longer to accomplish than expected ; ( 8 ) the expected cost savings and any revenue synergies from acquisitions may not be fully realized within expected timeframes ; and ( 9 ) disruption from acquisitions may make it more difficult to maintain relationships with clients, associates, or suppliers . Additional factors that could cause our results to differ materially from those described in the forward - looking statements can be found in the reports (such as our Annual Report on Form 10 - K, Quarterly Reports on Form 10 - Q and Current Reports on Form 8 - K) filed with the SEC and available at the SEC’s Internet site (http : //www . sec . gov) . All subsequent written and oral forward - looking statements concerning the Company or any person acting on its behalf is expressly qualified in its entirety by the cautionary statements above . We do not undertake any obligation to update any forward - looking statement to reflect circumstances or events that occur after the date the forward - looking statements are made . This presentation and the accompanying news release contain financial information determined by methods other than in accordance with generally accepted accounting principles (“GAAP”) . Such statements should be read along with the tables in the accompanying news release, which provide a reconciliation of non - GAAP measures to GAAP measures . This presentation and the accompanying news release discuss financial measures, such as core deposits, tangible book value, operating earnings and net income related to segments of the Company, which are non - GAAP measures . We believe that such non - GAAP measures are useful because they enhance the ability of investors and management to evaluate and compare the Company’s operating results from period to period in a meaningful manner . Non - GAAP measures should not be considered as an alternative to any measure of performance as promulgated under GAAP . Investors should consider the Company’s performance and financial condition as reported under GAAP and all other relevant information when assessing the performance or financial condition of the company . Non - GAAP measures have limitations as analytical tools, and investors should not consider them in isolation or as a substitute for analysis of the Company's results or financial condition as reported under GAAP .
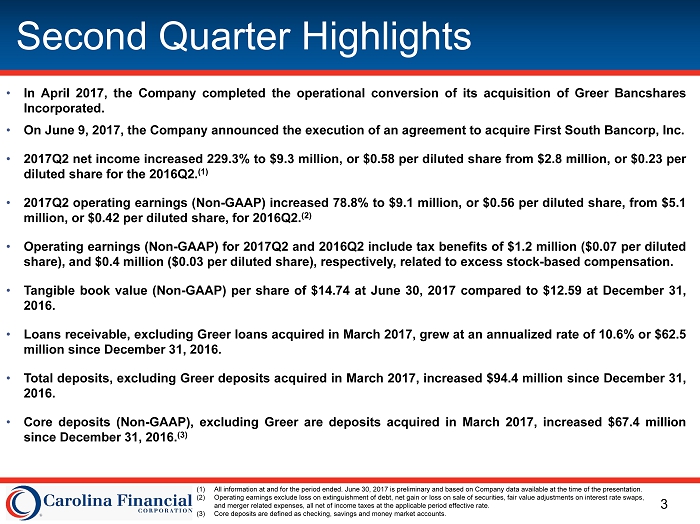
3 Second Quarter Highlights • In April 2017 , the Company completed the operational conversion of its acquisition of Greer Bancshares Incorporated . • On June 9 , 2017 , the Company announced the execution of an agreement to acquire First South Bancorp, Inc . • 2017 Q 2 net income increased 229 . 3 % to $ 9 . 3 million, or $ 0 . 58 per diluted share from $ 2 . 8 million, or $ 0 . 23 per diluted share for the 2016 Q 2 . ( 1 ) • 2017 Q 2 operating earnings (Non - GAAP) increased 78 . 8 % to $ 9 . 1 million, or $ 0 . 56 per diluted share, from $ 5 . 1 million, or $ 0 . 42 per diluted share, for 2016 Q 2 . ( 2 ) • O perating earnings (Non - GAAP) for 2017 Q 2 and 2016 Q 2 include tax benefits of $ 1 . 2 million ( $ 0 . 07 per diluted share), and $ 0 . 4 million ( $ 0 . 03 per diluted share), respectively, related to excess stock - based compensation . • Tangible book value (Non - GAAP) per share of $ 14 . 74 at June 30 , 2017 compared to $ 12 . 59 at December 31 , 2016 . • Loans receivable, excluding Greer loans acquired in March 2017 , grew at an annualized rate of 10 . 9 % or $ 62 . 5 million since December 31 , 2016 . • Total deposits, excluding Greer deposits acquired in March 2017 , increased $ 94 . 4 million since December 31 , 2016 . • Core deposits (Non - GAAP), excluding Greer are deposits acquired in March 2017 , increased $ 67 . 4 million since December 31 , 2016 . ( 3 ) (1) All information at and for the period ended. June 30, 2017 is preliminary and based on Company data available at the time of the presentation. (2) Operating earnings exclude loss on extinguishment of debt, net gain or loss on sale of securities, fair value adjustments on int erest rate swaps, and merger related expenses, all net of income taxes at the applicable period effective rate. (3) Core deposits are defined as checking, savings and money market accounts.

4 North Carolina 44% South Carolina 56% North Carolina 14% South Carolina 86% Overview of First South Bancorp, Inc. Acquisition – Pro Forma Franchise Source: SNL Financial Financial data as of or for the three months ended 3/31/17; deposit data as of 6/30/16; pricing data as of 6/9/17 (1) Community bank defined as an institution with total assets less than $10.0 billion (2) Excludes purchase accounting adjustments Pro Forma Highlights (1 ) Deposit Composition by State (2) CARO Standalone CARO + FSBK • Highly attractive opportunity that expands upon current footprint and M&A strategy • Creates the premier Carolinas Community Banking Franchise ‒ 2 nd largest Community Bank (1) • Ability to leverage solid core funding base ‒ FSBK MRQ cost of deposits: 0.34 % ‒ CARO MRQ cost of deposits: 0.51% North Carolina South Carolina Wilmington Myrtle Beach Winston-Salem Greensboro Asheville Charlotte Raleigh Florence Columbia Greenville Augusta Savannah Charleston Branch Loan Production Office First South Bancorp, Inc. Total Assets $3.2bn Gross Loans 2.2 Total Deposits 2.5 Market Cap 0.7 Branches 62

5 • Low double digit EPS accretion in 2019 • Minimal tangible book value dilution, earned back under 2.5 years • Enhances operating metrics • Pro forma institution to remain well capitalized • Comprehensive due diligence completed by senior CARO team • Approximately 47% of total portfolio reviewed • Comparable cultures and customer bases • Mature franchise with long term relationships • Limited integration risk due to CARO’s knowledge of the NC market • Market extension that provides core funding and economy of scale benefits • Creates 2 nd largest Community Bank (1) headquartered in the Carolinas • Experienced management team with deep ties to the local community • Builds on existing presence in attractive North Carolina markets • Combined entity operates in seven of the top 25 fastest growing Southeast MSAs Transaction Rationale Low Risk Financially Attractive Strategic Rationale (1) Community bank defined as an institution with total assets less than $10.0 billion

6 Top 25 Markets in the Southeast 9.8% 8.7% 8.7% 8.3% 8.2% 8.0% 7.9% 7.4% 7.2% 7.1% 7.1% 7.0% 6.9% 6.9% 6.8% 6.7% 6.7% 6.7% 6.5% 6.3% 6.1% 6.1% 5.8% 5.7% 5.5% 3.8% 0.0% 2.0% 4.0% 6.0% 8.0% 10.0% 12.0% Projected Population Growth (%) Source: SNL Financial Includes MSAs within the Southeast with a minimum population of 250,000 Note: Red bars denote market of operation for the pro forma company 2017 – 2022 Projected Population Growth (%)
7 Community Banking Segment

8 Community Banking Segment Results Bank Segment Earnings (1) • 2017Q2 Banking Segment net income of $8.4 million, or $0.52 per diluted share, versus $2.2 million for 2016Q2, or $0.18 per diluted share. • 2017Q2 Operating Banking Segment earnings (Non - GAAP) of $8.2 million, or $0.51 per diluted share, versus $4.4 million for 2016Q2, or $0.36 per diluted share. (2) • Banking Segment Return on Average Assets increased to 1.56% for 2017Q2 from 0.58% for 2016Q2. • Operating Bank Segment Return on Average Assets (Non - GAAP) increased to 1.52% for 2017Q2 from 1.18% for 2016Q2. ( 2) 2011Y 2012Y ($18.7) (1) Community banking segment earnings as reported in public filings (includes intersegment revenues and expenses and excludes ho ldi ng company expenses). The June 30, 2017 information is preliminary and based on Company data available at the time of the presentation. (2) Operating earnings exclude loss on extinguishment of debt, net gain or loss on sale of securities, fair value adjustments on interest rate swaps, and merger related expenses , all net of effective income tax rate for the applicable business segment. Operating bank segment EPS equals operating bank segment earni ngs divided by weighted average diluted shares.

9 Net Interest Margin (1) The June 30, 2017 information is preliminary and based on Company data available at the time of the presentation. (2) Net interest margin – tax - equivalent. Net interest margin expanded 39bps for 2017Q2 as compared to 2016Q2 due to the following: Average earning assets comprised of 73.0% in loans held for investment and loans held for sale in 2017Q2 versus 72.4% in 2016Q2. Accretion income from loans acquired was approximately $1.1 million, or 22bps for 2017Q2 compared to $372,000, or 10bps for 2017Q1. Yield on loans, excluding loan accretion income, increased 23bps over this same period. Tax - equivalent yield on securities increased to 3.31% in 2017Q2 compared to 3.17% in 2016Q2. A decrease in the cost of funds from 2016Q2 to 2017Q2. Yield on Loans (1) Net Interest Margin (2) Cost of Funds (1)

10 Bank Segment Operating Efficiencies • Operating Bank S egment n oninterest expenses as a percentage of average consolidated assets of 2.06% in 2017Q2 compared to 2.41% in 2016Q2. • Operating Bank S egment efficiency ratio improved to 50.5% in 2017Q2 from 61.3% in 2016Q2. Operating Bank Segment Noninterest Expenses/Avg. Assets (%) (1)(2)(3) (1) Bank segment operating figures include intersegment revenues and expense and exclude holding company expenses. (2) The June 30, 2017 information is preliminary and based on Company data available at the time of the presentation. (3) Operating bank segment ratios exclude loss on extinguishment of debt, net gain or loss on sale of securities, fair value adjustments on interest rate swaps, and merger related expenses. ( 2 ) Operating Bank Segment Efficiency Ratio (1)(2)(3)

11 Strong Balance Sheet Growth • Loans held for investment, excluding Greer loans acquired, grew at an annualized rate of 10.9% since 12 - 2016. • Total Deposits, excluding Greer deposits acquired, increased $94.4 million since 12 - 2016. • Loan growth in July 2017 is expected to be significantly above plan. Total Deposits ($MM) ( 1 )(2) Total Loans ($MM) (1)(2) Total Assets($MM) ( 1 )(2) (1) Includes assets acquired and liabilities assumed in acquisitions, net of fair value adjustments. (2) The June 30, 2017 information is preliminary and based on Company data available at the time of the presentation.
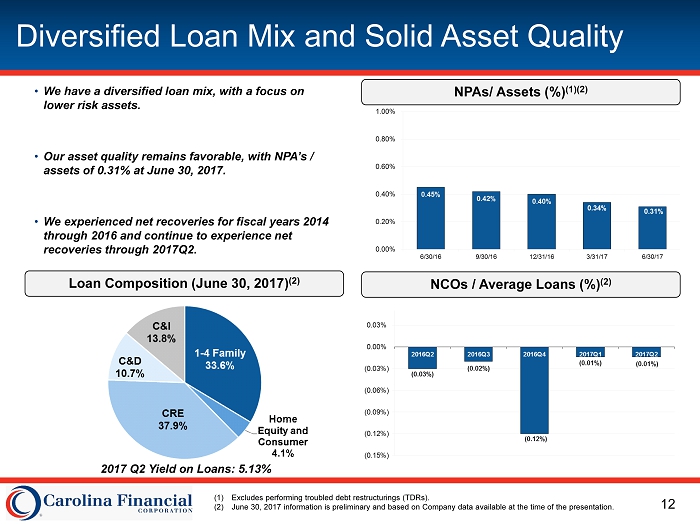
12 Diversified Loan Mix and Solid Asset Quality NPAs/ Assets (%) (1)(2) • We have a diversified loan mix, with a focus on lower risk assets. • Our asset quality remains favorable, with NPA’s / assets of 0.31% at June 30, 2017. • We experienced net recoveries for fiscal years 2014 through 2016 and continue to experience net recoveries through 2017Q2. (1) Excludes performing troubled debt restructurings (TDRs ). (2) June 30, 2017 information is preliminary and based on Company data available at the time of the presentation. NCOs / Average Loans (%) ( 2) Loan Composition (June 30, 2017) (2) 2017 Q2 Yield on Loans: 5.13%

13 Improving Deposit Mix Deposit Composition (6/30/2017) (1) Checking Accounts (2) • Focus on increasing checking accounts as evidenced by an annualized checking account growth rate of 11.0% since 12 - 2016, excluding Greer checking accounts acquired. 2017Q2 Cost of Deposits: 0.52% (1) The June 30, 2017 information is preliminary and based on Company data available at the time of the presentation. (2) Includes checking accounts from Greer deposits acquired in 2017Q1. (1)

14 Wholesale Mortgage Segment
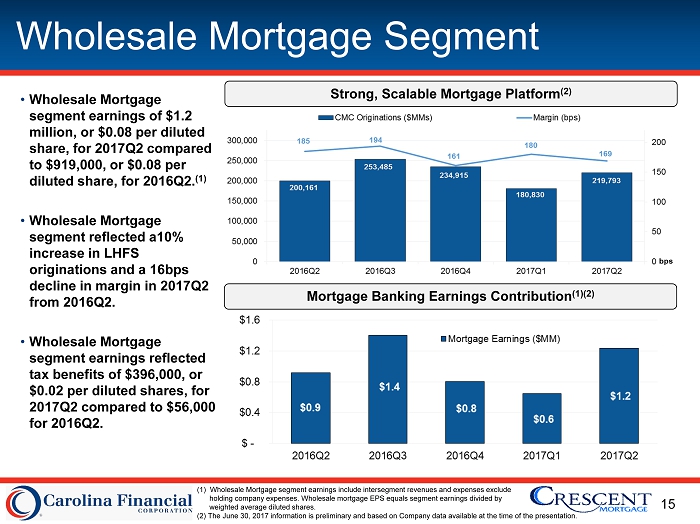
15 Wholesale Mortgage Segment Strong, Scalable Mortgage Platform (2 ) • Wholesale Mortgage segment earnings of $1.2 million, or $0.08 per diluted share, for 2017Q2 compared to $919,000, or $0.08 per diluted share, for 2016Q2. (1) • Wholesale Mortgage segment reflected a10% increase in LHFS originations and a 16bps decline in margin in 2017Q2 from 2016Q2. • Wholesale Mortgage segment earnings reflected tax benefits of $396,000, or $0.02 per diluted shares, for 2017Q2 compared to $56,000 for 2016Q2. Mortgage Banking Earnings Contribution (1)(2) (1) Wholesale Mortgage segment earnings include intersegment revenues and expenses exclude holding company expenses. Wholesale mortgage EPS equals segment earnings divided by weighted average diluted shares. (2) The June 30, 2017 information is preliminary and based on Company data available at the time of the presentation.

16 Focus on Shareholder Results • ROAA and ROATCE of 1.72% and 16.02%, respectively, for 2017Q2. • Operating ROAA and ROATCE (Non - GAAP) of 1.69% and 15.65%, respectively, for 2017Q2. • Diluted Earnings Per Share of $ 0.58 2017Q2 compared to $ 0.23 for 2016Q2. • Diluted Operating Earnings Per Share (Non - GAAP) of $ 0.56 for 2017Q2 compared to $ 0.42 for 2016Q2. Consolidated Operating ROAA & Operating ROATCE (1)(2) Tangible Book Value per Share & Operating Earnings per Share (1)(2) (1) The June 30, 2017 information is preliminary and based on Company data available at the time of the presentation. (2) Operating earnings exclude extinguishment of debt, net gain or loss on sale of securities, fair value adjustments on interest rate swaps, and merger related expenses , all net of income taxes at the applicable period rate .