Attached files
| file | filename |
|---|---|
| 8-K - 8-K - HD Supply Holdings, Inc. | a17-18094_18k.htm |
Exhibit 99.1
Investor Discussion Materials HD Supply July 19, 2017

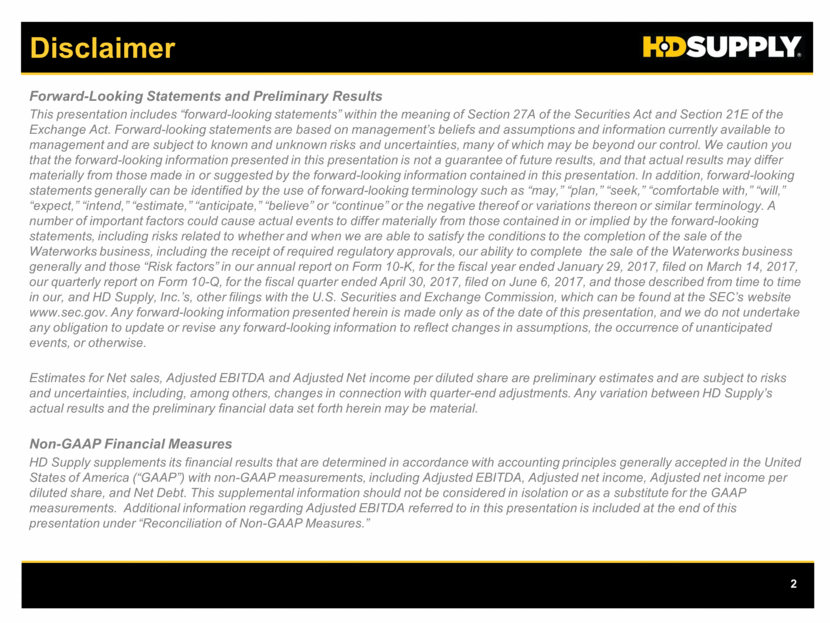
Disclaimer Forward-Looking Statements and Preliminary Results This presentation includes “forward-looking statements” within the meaning of Section 27A of the Securities Act and Section 21E of the Exchange Act. Forward-looking statements are based on management’s beliefs and assumptions and information currently available to management and are subject to known and unknown risks and uncertainties, many of which may be beyond our control. We caution you that the forward-looking information presented in this presentation is not a guarantee of future results, and that actual results may differ materially from those made in or suggested by the forward-looking information contained in this presentation. In addition, forward-looking statements generally can be identified by the use of forward-looking terminology such as “may,” “plan,” “seek,” “comfortable with,” “will,” “expect,” “intend,” “estimate,” “anticipate,” “believe” or “continue” or the negative thereof or variations thereon or similar terminology. A number of important factors could cause actual events to differ materially from those contained in or implied by the forward-looking statements, including risks related to whether and when we are able to satisfy the conditions to the completion of the sale of the Waterworks business, including the receipt of required regulatory approvals, our ability to complete the sale of the Waterworks business generally and those “Risk factors” in our annual report on Form 10-K, for the fiscal year ended January 29, 2017, filed on March 14, 2017, our quarterly report on Form 10-Q, for the fiscal quarter ended April 30, 2017, filed on June 6, 2017, and those described from time to time in our, and HD Supply, Inc.’s, other filings with the U.S. Securities and Exchange Commission, which can be found at the SEC’s website www.sec.gov. Any forward-looking information presented herein is made only as of the date of this presentation, and we do not undertake any obligation to update or revise any forward-looking information to reflect changes in assumptions, the occurrence of unanticipated events, or otherwise. Estimates for Net sales, Adjusted EBITDA and Adjusted Net income per diluted share are preliminary estimates and are subject to risks and uncertainties, including, among others, changes in connection with quarter-end adjustments. Any variation between HD Supply’s actual results and the preliminary financial data set forth herein may be material. Non-GAAP Financial Measures HD Supply supplements its financial results that are determined in accordance with accounting principles generally accepted in the United States of America (“GAAP”) with non-GAAP measurements, including Adjusted EBITDA, Adjusted net income, Adjusted net income per diluted share, and Net Debt. This supplemental information should not be considered in isolation or as a substitute for the GAAP measurements. Additional information regarding Adjusted EBITDA referred to in this presentation is included at the end of this presentation under “Reconciliation of Non-GAAP Measures.”
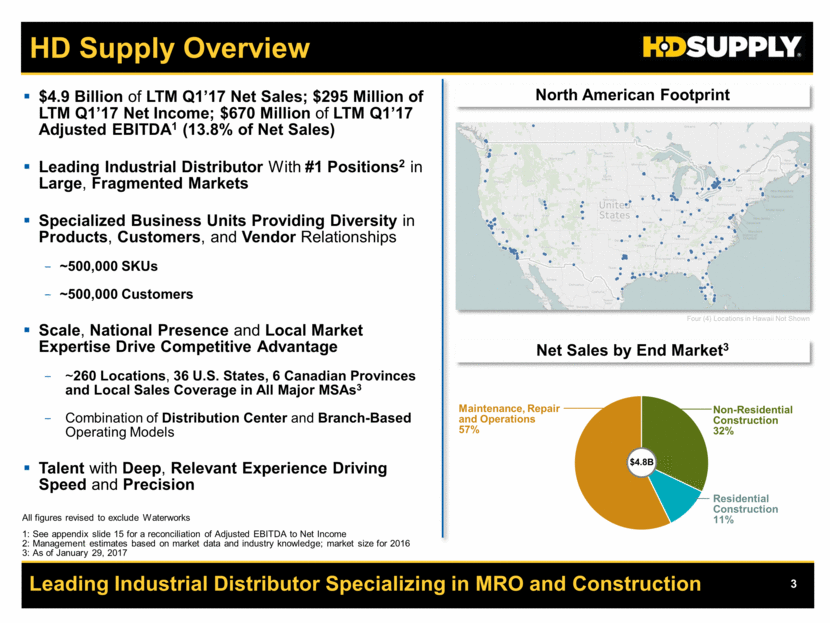
HD Supply Overview Leading Industrial Distributor Specializing in MRO and Construction $4.9 Billion of LTM Q1’17 Net Sales; $295 Million of LTM Q1’17 Net Income; $670 Million of LTM Q1’17 Adjusted EBITDA1 (13.8% of Net Sales) Leading Industrial Distributor With #1 Positions2 in Large, Fragmented Markets Specialized Business Units Providing Diversity in Products, Customers, and Vendor Relationships ~500,000 SKUs ~500,000 Customers Scale, National Presence and Local Market Expertise Drive Competitive Advantage ~260 Locations, 36 U.S. States, 6 Canadian Provinces and Local Sales Coverage in All Major MSAs3 Combination of Distribution Center and Branch-Based Operating Models Talent with Deep, Relevant Experience Driving Speed and Precision North American Footprint Net Sales by End Market3 Maintenance, Repair and Operations 57% Residential Construction 11% Non-Residential Construction 32% $4.8B All figures revised to exclude Waterworks 1: See appendix slide 15 for a reconciliation of Adjusted EBITDA to Net Income 2: Management estimates based on market data and industry knowledge; market size for 2016 3: As of January 29, 2017 Four (4) Locations in Hawaii Not Shown
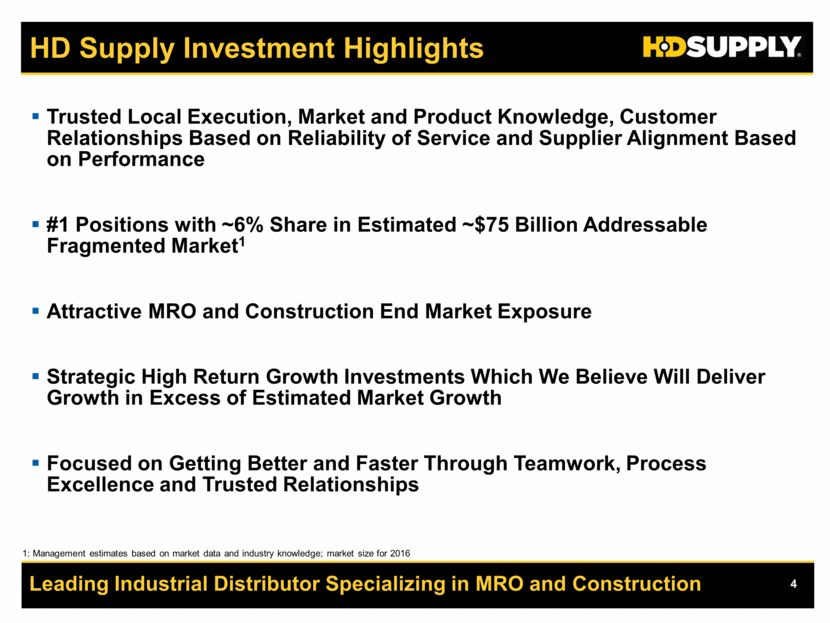
HD Supply Investment Highlights Leading Industrial Distributor Specializing in MRO and Construction Trusted Local Execution, Market and Product Knowledge, Customer Relationships Based on Reliability of Service and Supplier Alignment Based on Performance #1 Positions with ~6% Share in Estimated ~$75 Billion Addressable Fragmented Market1 Attractive MRO and Construction End Market Exposure Strategic High Return Growth Investments Which We Believe Will Deliver Growth in Excess of Estimated Market Growth Focused on Getting Better and Faster Through Teamwork, Process Excellence and Trusted Relationships 1: Management estimates based on market data and industry knowledge; market size for 2016
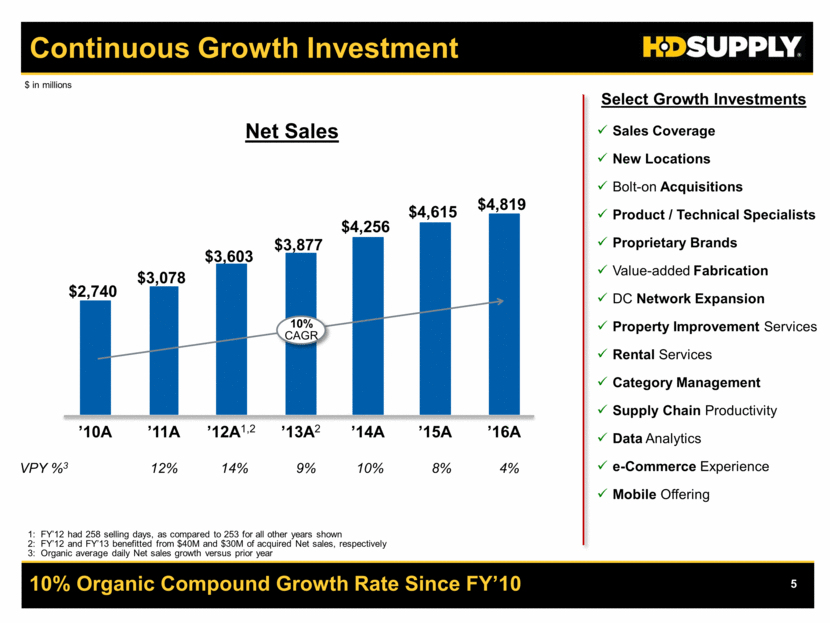
Continuous Growth Investment 10% Organic Compound Growth Rate Since FY’10 $ in millions 1: FY’12 had 258 selling days, as compared to 253 for all other years shown 2: FY’12 and FY’13 benefitted from $40M and $30M of acquired Net sales, respectively 3: Organic average daily Net sales growth versus prior year Net Sales VPY %3 $4,256 ’14A 10% $2,740 ’10A $4,819 ’16A 4% $4,615 ’15A 8% $3,603 ’12A1,2 14% $3,078 ’11A 12% $3,877 ’13A2 9% 10% CAGR Select Growth Investments Sales Coverage New Locations Bolt-on Acquisitions Product / Technical Specialists Proprietary Brands Value-added Fabrication DC Network Expansion Property Improvement Services Rental Services Category Management Supply Chain Productivity Data Analytics e-Commerce Experience Mobile Offering
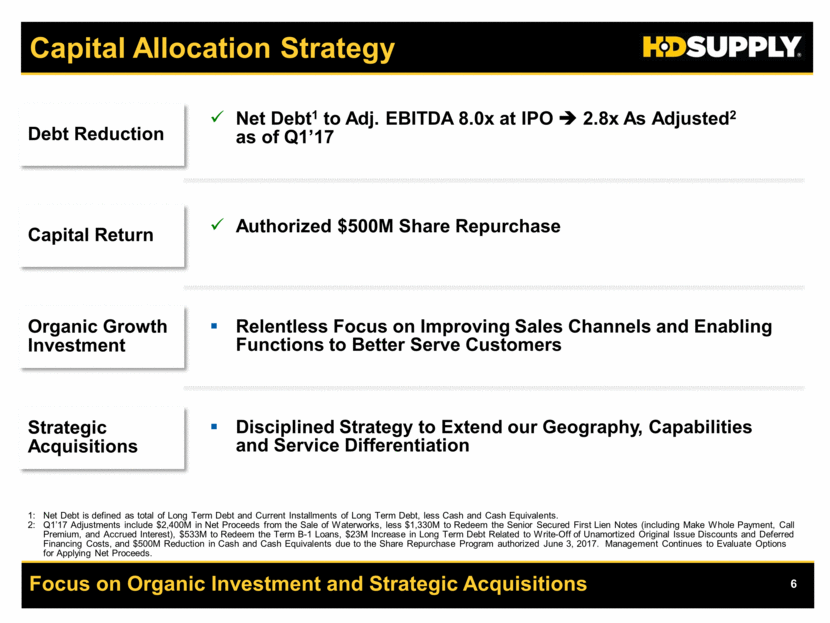
Capital Allocation Strategy Focus on Organic Investment and Strategic Acquisitions 1: Net Debt is defined as total of Long Term Debt and Current Installments of Long Term Debt, less Cash and Cash Equivalents. 2: Q1’17 Adjustments include $2,400M in Net Proceeds from the Sale of Waterworks, less $1,330M to Redeem the Senior Secured First Lien Notes (including Make Whole Payment, Call Premium, and Accrued Interest), $533M to Redeem the Term B-1 Loans, $23M Increase in Long Term Debt Related to Write-Off of Unamortized Original Issue Discounts and Deferred Financing Costs, and $500M Reduction in Cash and Cash Equivalents due to the Share Repurchase Program authorized June 3, 2017. Management Continues to Evaluate Options for Applying Net Proceeds. Debt Reduction Capital Return Organic Growth Investment Strategic Acquisitions Net Debt1 to Adj. EBITDA 8.0x at IPO 2.8x As Adjusted2 as of Q1’17 Authorized $500M Share Repurchase Relentless Focus on Improving Sales Channels and Enabling Functions to Better Serve Customers Disciplined Strategy to Extend our Geography, Capabilities and Service Differentiation
Business and Strategy Overview Facilities Maintenance
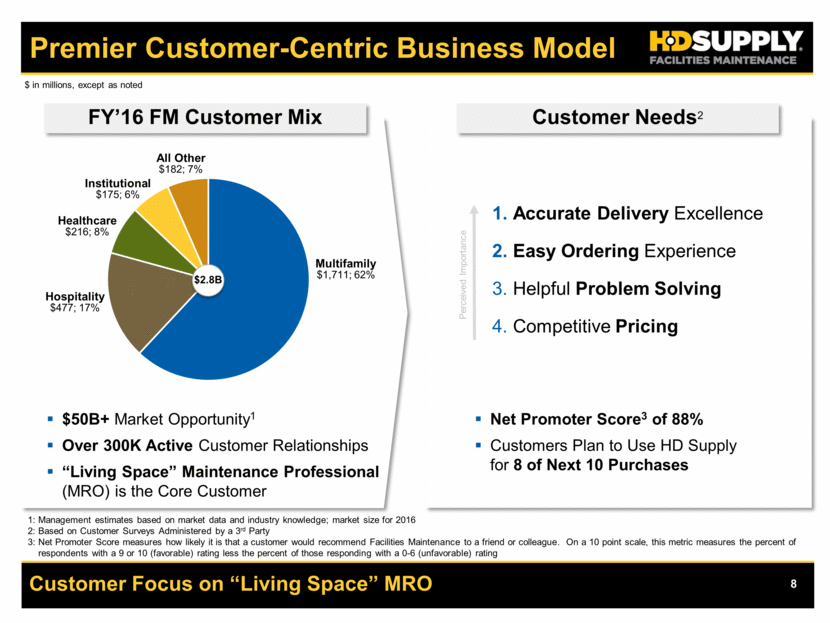
Customer Focus on “Living Space” MRO Premier Customer-Centric Business Model FY’16 FM Customer Mix 1: Management estimates based on market data and industry knowledge; market size for 2016 2: Based on Customer Surveys Administered by a 3rd Party 3: Net Promoter Score measures how likely it is that a customer would recommend Facilities Maintenance to a friend or colleague. On a 10 point scale, this metric measures the percent of respondents with a 9 or 10 (favorable) rating less the percent of those responding with a 0-6 (unfavorable) rating Multifamily $1,711; 62% Hospitality $477; 17% Healthcare $216; 8% Institutional $175; 6% All Other $182; 7% $ in millions, except as noted Customer Needs2 Accurate Delivery Excellence Easy Ordering Experience Helpful Problem Solving Competitive Pricing $50B+ Market Opportunity1 Over 300K Active Customer Relationships “Living Space” Maintenance Professional (MRO) is the Core Customer Perceived Importance Net Promoter Score3 of 88% Customers Plan to Use HD Supply for 8 of Next 10 Purchases $2.8B
Execution Focus to be Easy, Accurate, and Helpful for Our Customers FM Differentiated Advantage Value Statement Existing Service Capabilities Always Easy, Accurate, and Helpful for Our Customers Easy Seamless Ordering Choices Across Multiple Coordinated Channels Approximately 1,000 Product Authority Sales Professionals Personal Relationships with Over 300K Customers Approximately 400 On-shore Contact Center Associates Industry Leading Catalog and Reference Guide Solution Oriented Website and Mobile App Integrated and Customized Purchasing Platforms Accurate Trusted Next-day Delivery to 98% of the United States 44 Distribution Centers Approximately 850 Dedicated Fleet Delivery Vehicles Helpful Breadth of High-Quality Products, Support, Services and Fulfillment Over 80% Sales from Non-Consumable Categories 25K Stocked Products, Over 180K Total 15 Fabrication Centers (Blinds, Doors, Signage) ~2,400 Long-term Supplier Relationships Turnkey Property Improvement Services HVAC Installation Program In-House Credit Services Product Training and Certifications
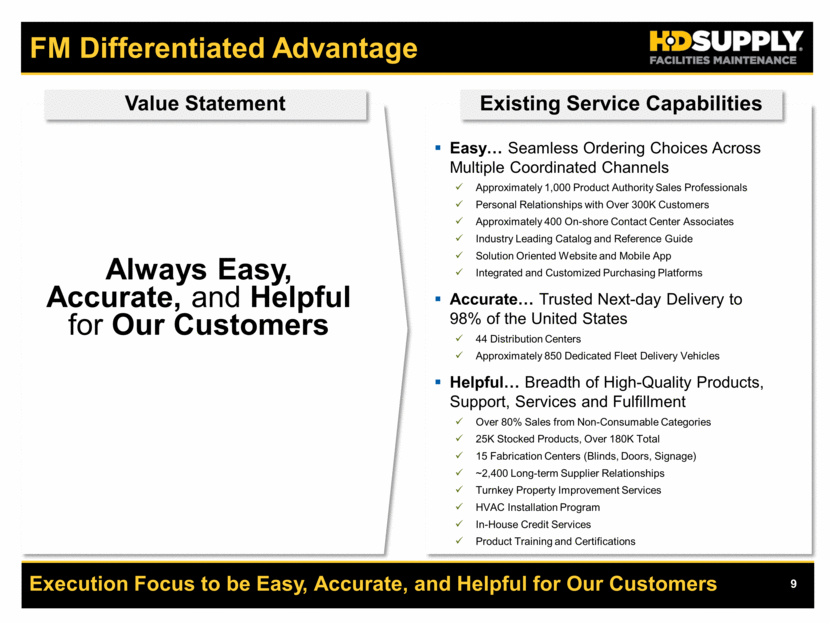
Always Acting to Enhance Our Value Industry Landscape Large Fragmented End Markets $50B+ Opportunity1 Attractive Long-term Megatrends 19 Million Multifamily Units, 5 Million Lodging Rooms, 3 Million Senior Care Units “Break-Fix” Demand Unplanned Purchase Increased Industry Consolidation Increased Customer Sophistication Focus on Property Maintenance Budgets Available Price Transparency “Consumerization” Influencing B2B Market Environment FM Focus Execution on Customer Promise Imperative to Always Be Easy, Accurate, and Helpful Diverse Selling Channels to Provide a Personalized Service Experience Innovative, Value-add Solutions to Enable Local Management to be More Efficient and Productive Salesforce Investments to Further Extend Customer Coverage and Service Disciplined Category Management to Extend Product Offering and Authority Continuous Supply Chain Improvements to Drive Quality, Efficiency, and Productivity 1: Management estimates based on market data and industry knowledge; market size for 2016
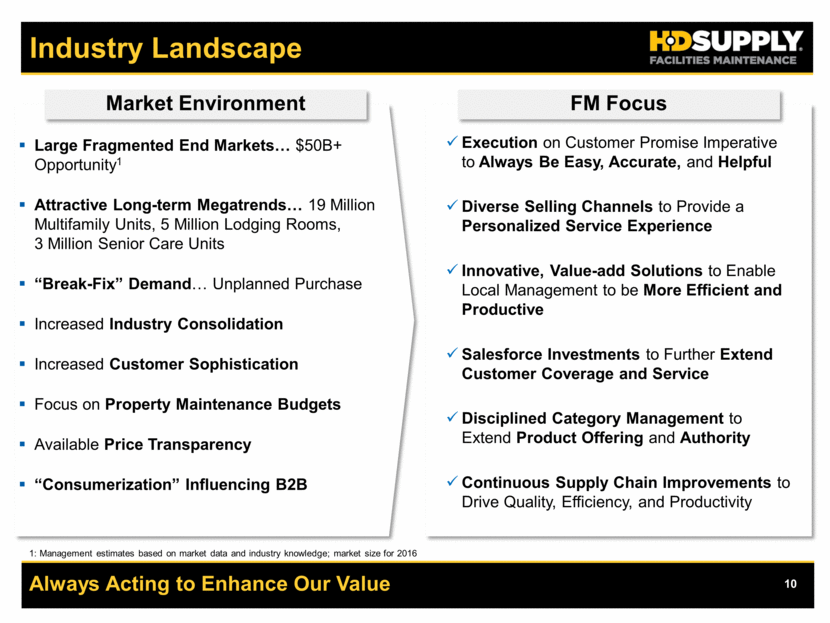
Strategic Investment Framework $10M - 20M Incremental SG&A Investment on Customer Experience and Extension of Existing Capabilities Selling Channels “Enablers” “Extend Customer Experience” “Enable Selling Channels” Definition Examples Extend the Customer Experience Across Each Selling Channel Field Sales Inside Sales Customer Care Catalog Web/Mobile Sales Tools for Field Sales Added Inside Sales Coverage Enhanced Website Functionality Catalog Enhancements Added Mobile Capabilities Build Out Dynamic Capabilities to Enable Selling Channels Data and Analytics Supply Chain Pricing & Product Assortment Talent Sales, Customer and Supply Chain Data Analytics and Visibility DC and Logistics Excellence Pricing Capabilities and Tools Next Generation Expert Talent
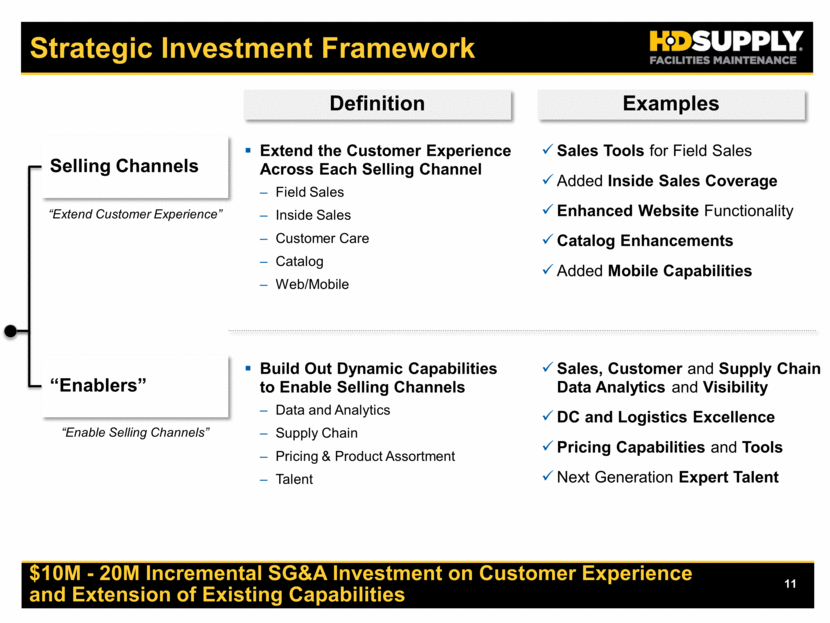
Disciplined Investment Strategic Investment Detail Active Selling Channel and Enabling Initiatives In Process $2M SG&A Investment in Q1’17, ~$3M SG&A Investment Expected in Q2’17 $10M - $20M Incremental SG&A Investment in Selling Channels and Enablers in 2H’17 through FY’18 Annual FY’17 Capex of 1.8% – 2.0% of Sales Adjusted for Sale of Waterworks and Including Incremental Investment Spend Targeting Sales Growth of ~300 Basis Points in Excess of Market Focused on Controllable Sales Execution Targeting Operating Leverage1 of 1.5x by the End of 2018 Incremental Investment Anniversary in 2018 Targeting Forward Investment within Existing Cost Structure 1: Operating Leverage is Defined as Adjusted EBITDA Growth Divided by Adjusted Net Sales Growth
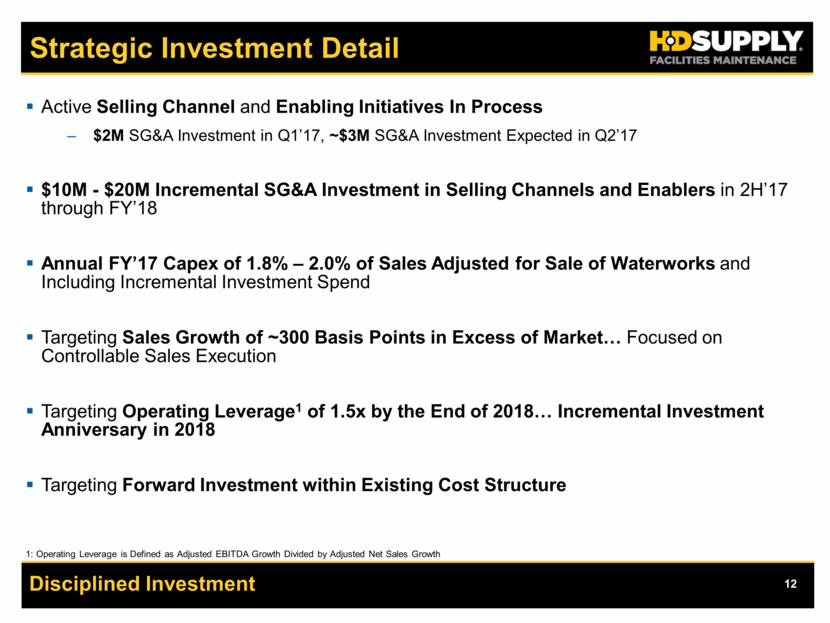
Q2’17 and FY’17 Guidance Reiterate Previously Provided Guidance Net Sales Adjusted EBITDA FY’17 $5,000M – $5,100M $700M – $730M Q2’17 $1,325M – $1,365M $200M – $210M Adj. Net Income per Diluted Share1 $2.02 – $2.17 $0.60 – $0.65 All Figures Revised to Exclude Waterworks. No reconciliation of the forecasted range for Adjusted EBITDA to Net income or Income from Continuing Operations and Adjusted net income per diluted share to Net income per diluted share or Income from Continuing Operations per diluted share for the second quarter and full year of fiscal 2017 is included in this presentation because we are unable to quantify certain amounts that would be required to be included in the GAAP measure without unreasonable efforts. In addition, the company believes such reconciliations would imply a degree of precision that would be confusing or misleading to investors. 1: Does Not Consider Impact of Share Repurchase Program $ in millions, except per share amounts
Appendix
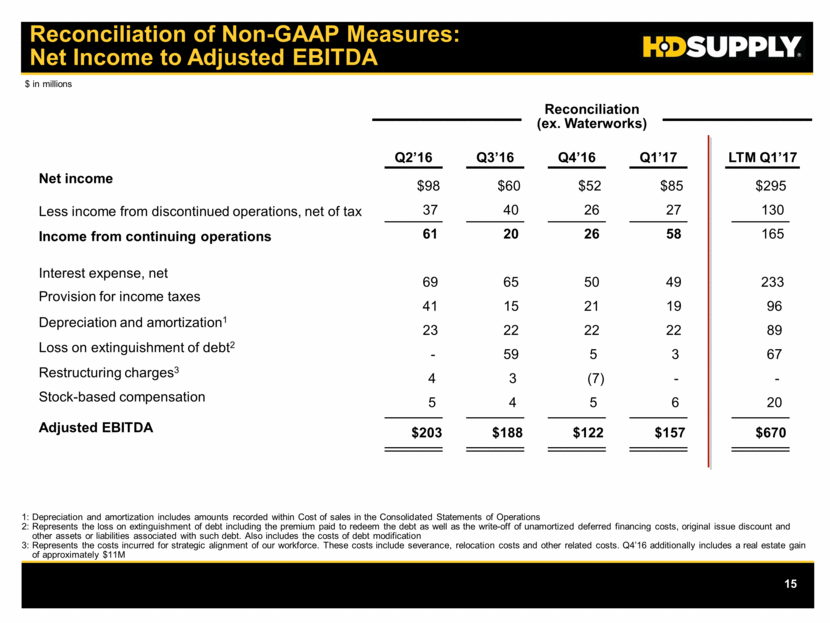
Reconciliation of Non-GAAP Measures: Net Income to Adjusted EBITDA 1: Depreciation and amortization includes amounts recorded within Cost of sales in the Consolidated Statements of Operations 2: Represents the loss on extinguishment of debt including the premium paid to redeem the debt as well as the write-off of unamortized deferred financing costs, original issue discount and other assets or liabilities associated with such debt. Also includes the costs of debt modification 3: Represents the costs incurred for strategic alignment of our workforce. These costs include severance, relocation costs and other related costs. Q4’16 additionally includes a real estate gain of approximately $11M Net income Less income from discontinued operations, net of tax Income from continuing operations Interest expense, net Provision for income taxes Depreciation and amortization1 Loss on extinguishment of debt2 Restructuring charges3 Stock-based compensation Adjusted EBITDA Reconciliation (ex. Waterworks) Q2’16 $98 37 61 69 41 23 - 4 5 $203 Q3’16 $60 40 20 65 15 22 59 3 4 $188 Q4’16 $52 26 26 50 21 22 5 (7) 5 $122 Q1’17 $85 27 58 49 19 22 3 - 6 $157 LTM Q1’17 $295 130 165 233 96 89 67 - 20 $670 $ in millions
