Attached files
| file | filename |
|---|---|
| EX-99.1 - HANCOCK WHITNEY CORP | hbhc2q17ez991.htm |
| 8-K - HANCOCK WHITNEY CORP | hbhc2q178-k.htm |
Exhibit 99.2


7/19/2017 Second Quarter 2017Earnings Conference Call
1
Important Cautionary Statement About Forward-Looking Statements This presentation contains forward-looking statements within the meaning of section 27A of the Securities Act of 1933, as amended, and section 21E of the Securities Exchange Act of 1934, as amended. Forward looking statements that we may make include statements regarding balance sheet and revenue growth, the provision for loans losses, loan growth expectations, management’s predictions about charge-offs for loans, including energy-related credits, the impact of changes in oil and gas prices on our energy portfolio, and the downstream impact on businesses that support the energy sector, especially in the Gulf Coast region, the impact of the First NBC transactions on our performance and financial condition, including our ability to successfully integrate the business, deposit trends, credit quality trends, net interest margin trends, future expense levels, success of revenue-generating initiatives, projected tax rates, future profitability, improvements in expense to revenue (efficiency) ratio, purchase accounting impacts such as accretion levels, and the financial impact of regulatory requirements. Also, any statement that does not describe historical or current facts is a forward-looking statement. These statements often include the words “believes,” “expects,” “anticipates,” “estimates,” “intends,” “plans,” “forecast,” “goals,” “targets,” “initiatives,” “focus,” “potentially,” “probably,” “projects,” “outlook” or similar expressions or future conditional verbs such as “may,” “will,” “should,” “would,” and “could.” Forward-looking statements are based upon the current beliefs and expectations of management and on information currently available to management. Our statements speak as of the date hereof, and we do not assume any obligation to update these statements or to update the reasons why actual results could differ from those contained in such statements in light of new information or future events. Forward-looking statements are subject to significant risks and uncertainties. Investors are cautioned against placing undue reliance on such statements. Actual results may differ materially from those set forth in the forward looking statements. Additional factors that could cause actual results to differ materially from those described in the forward-looking statements can be found in Part I, “Item 1A. Risk Factors” in our Annual Report on Form 10-K for the year ended December 31, 2016 and in other periodic reports that we file with the SEC.
2
Corporate Profile (as of June 30, 2017) $26.6 billion in Total Assets$18.5 billion in Total Loans$21.4 billion in Total DepositsTangible Common Equity (TCE) 7.65%Nearly 200 banking locations and 262 ATMs across our footprintApproximately 4,200 employees corporate-wideRated among the strongest,safest financial institutions in the country by BauerFinancial,Inc. for 111 consecutive quartersEarned top customer servicemarks with Greenwich Excellence AwardsMoody’s long-term issuer rating: Baa3S&P long-term issuer rating: BBB
3
(compared to first quarter 2017) Second Quarter 2017 Highlights Includes a full quarter impact from the FNBC I transaction (March 10, 2017) and a partial quarter’s impact from the FNBC II transaction (April 28, 2017)(see slides 24 and 25 for specifics on each transaction)Reached an agreement with the FDIC to terminate the 2009 loss share agreements for the Peoples First acquisition; expenses include a $6.6 million ($.05 per share) write-down of the indemnification assetReported earnings increased $3.3 million, or 7%Loans increased $269 million and deposits increased $1.5 billion linked-quarterAcquired approximately $1.6 billion of deposits and approximately $160 million in loans in the FNBC II transactionEnergy loans declined $59 million and comprise 6.7% of total loans, down from 7.1%; allowance for the energy portfolio totals $83.4 million, or 6.8% of energy loans Core pre-provision net revenue (PPNR) of $101.6 million, up $8.3 million or 9% Net interest margin (NIM) of 3.43% up 6 basis points (bps)Tangible common equity (TCE) ratio down 29 bps to 7.65%, mainly related to growth in assets and the addition of $44 million of intangible assets related to the FNBC II transaction ** Efficiency Ratio is noninterest expense to total net interest (TE) and noninterest income, excluding amortization of purchased intangibles and nonoperating items. *See slides 26-29 for non-GAAP reconciliations
4
Second Quarter EPS Highlights (includes a non-GAAP measure) Assumes a 35% tax rate
5
Termination of Loss Share Agreements In December 2009 the company acquired Peoples First Community Bank in Panama City, FL under loss-sharing agreements with the FDICThe non-single family portion of the agreement expired after 5 years and the single family portion would have expired after 10 yearsHancock reached an agreement with the FDIC to terminate the remaining portion of the loss share agreements (impact reflected in second quarter 2017)In the second quarter of 2017 the company wrote down the indemnification asset (IA) by $6.6 million to $3.2 millionQuarterly amortization of IA (contra to fee income) will be eliminated beginning in the third quarter of 2017; IA amortization was $1.3 million in the second quarter of 2017The remaining loan balances covered under the agreement totaled $154 million at June 30, 2017, with a reserve totaling $15 millionThe termination agreement states that the FDIC will no longer share in any losses or recoveries for the loans assumed in the original transaction
6
2Q17 vs. 2Q16 growth in core PPNR +19% $s in millions Core Pre-Provision Net Revenue (PPNR) Continues to Grow See slide 27 for non-GAAP reconciliation 2Q17 vs. 1Q17 growth in core PPNR +9%
7
Well-Diversified Loan Portfolio Loans totaled $18.5 billion at quarter-end, an increase of $269 million, or 1.5%, linked-quarterNet loan growth during the quarter was diversified across the footprint and also in areas identified as part of the company’s revenue-generating initiatives (mortgage, equipment finance)Reflects $59 million net decrease in energy-related loansIncludes approximately $160 million of mainly performing single family residential mortgages from the FNBC II transaction $s in millions
8
Energy Portfolio Overview Energy loans totaled $1.2 billion, or 6.7% of total loans, down $59 million linked-quarter and down $250 million from a year agoLinked-quarter change reflects $134 million in net reductions, offset by $75 million in net increases
9
Energy Portfolio Overview (cont’d) Net decrease in outstandings of $59 million linked-quarter and a $12 million decrease in total commitments$25 million linked-quarter decrease in upstream outstandings and a $13 million increase in total commitments $15 million linked-quarter decrease in midstream sector outstandings and a $14 million decrease in total commitments$19 million linked-quarter decrease in support sector outstandings and a $44 million reduction in total commitments$33 million linked-quarter increase in downstream sector total commitmentsReduction in nonaccrual energy loans of $27 million, or 18%Increase in accruing energy TDRs of $45 million linked-quarter *Includes accrual and nonaccrual loans
10
Energy Allowance and Category Trends Management continues to estimate that charge-offs from energy-related credits could approximate $65-$95 million over the duration of the cycleCharge-offs to-date for current energy cycle (Nov ‘14 – March ‘17) total $65 million; no energy charge-offs in 2Q17Reflects continued expectation of a lag in recovery for support services credits
11
Asset Quality Measures Reflect Impact Of Energy Cycle NPA ratio 1.88%, up 9 bps linked-quarter Nonperforming assets totaled $347 million, up $19.7 million from March 31, 2017Nonperforming energy loans totaled $208 million at June 30, 2017, up $14 million from last quarterProvision for loan losses was $15.0 million, down $1 million from 1Q17Non-PCI net charge-offs totaled $6.0 million, or 13 bps, down from $29.9 million, or 70 bps, in 1Q17Criticized commercial loans totaled $1.2 billion at June 30, 2017, down $36 million from 1Q17Criticized energy loans totaled $687 million at June 30, 2017, down $50 million linked-quarter
12
Adequate Reserve Coverage The allowance for loan losses (ALLL) was $221.9 million (1.20%) up $8 million from $213.6 million (1.17%) linked-quarterNo ALLL on FNBC portion of the portfolio; FNBC portfolios adjusted for the loan marksThe allowance maintained on the non-PCI portion of the loan portfolio increased $9.2 million linked-quarter, totaling $206.7 million, while the allowance on the FDIC acquired loan portfolio decreased $0.9 millionALLL for energy credits was $83.4 million, or 6.8%, at June 30, 2017, compared to $83.7 million, or 6.5% at March 31, 2017 The nonenergy ALLL is $138.5 million, or 0.80%, of the nonenergy loan portfolio as of June 30, 2017, up slightly from March 31, 2017
13
Securities Portfolio Portfolio totaled $5.7 billion, up $668 million, or 13%, linked-quarterReinvested approximately $220 million in acquired FNBC II securities portfolio, and invested a portion of the excess liquidity from the transaction, towards the end of the second quarterYield 2.52%, unchanged linked-quarterUnrealized net loss of $30.4 million on AFS50% HTM, 50% AFSDuration 4.84 years compared to 5.00 years at 3-31-17Premium amortization up $0.3 million linked-quarterBalance sheet is asset sensitive over a 2 year period to rising interest rates under various shock scenariosIRR modeling is based on conservative assumptionsFlat balance sheetLoan portfolio 52% variable56% of variable loans are LIBOR-based 93% of the LIBOR loans are tied to 1mo L7% of the LIBOR loans are tied to 3mo LApproximately 1/3 tied to Wall Street Journal PrimeModeled lag in deposit rate increasesConservative % DDA attrition for certain increases in ratesNo energy-related securities in the portfolio
14
Solid Levels Of Core Deposit Funding Total deposits $21.4 billion, up $1.5 billion, or 8% linked-quarter; the increase is mainly related to the deposits acquired in the FNBC II transactionNoninterest-bearing demand deposits (DDA) increased $166 millionInterest-bearing transaction and savings deposits increased $1.2 billionTime deposits increased $174 million Public fund deposits decreased $58 millionFunding mix remained strongDDA comprised 37% of total period-end depositsCost of funds up 7 bps to 44 bps
15
Continued NIM Expansion Reported net interest margin (NIM) 3.43%, up 6 bps linked-quarter Loan yield +20 bpsReflects full quarter impact from FNBC I loan portfolio and full quarter impact of March rate increaseYield on bond portfolio unchangedReinvested approximately $220 million of FNBC II securities portfolio and invested a portion of the excess liquidity from FNBC II transaction during the second quarter; expect full quarter impact in the third quarter of 2017Cost of funds +7 bpsReflects addition of approximately $1.6 billion in FNBC II deposits at just under 1%During the quarter the company used excess liquidity from the FNBC II transaction to pay down approximately $800 million of FHLB debt
16
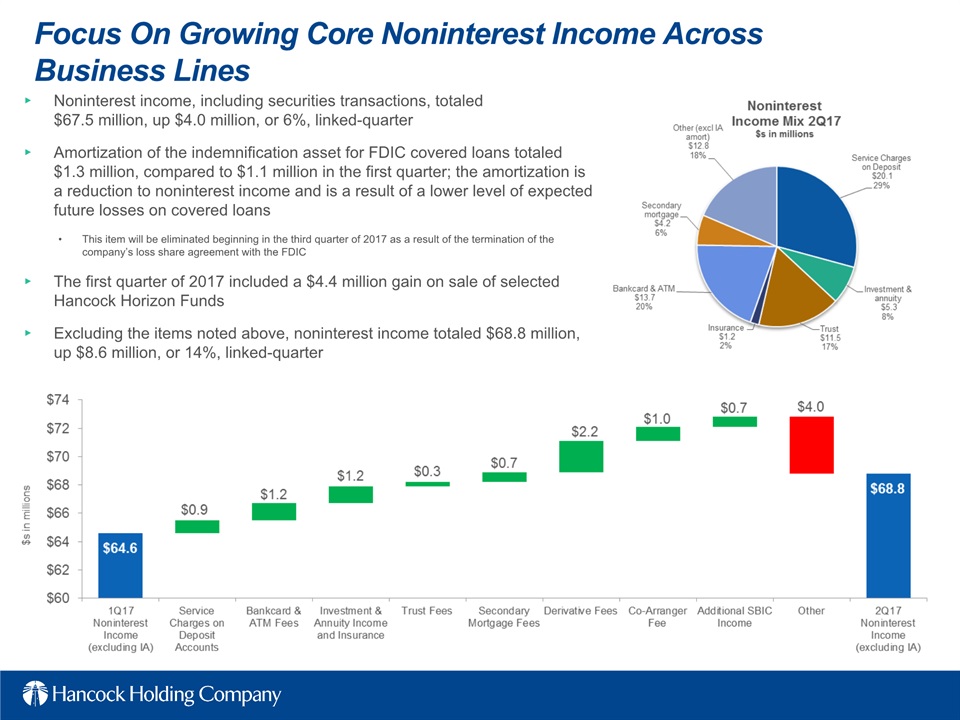
Focus On Growing Core Noninterest Income Across Business Lines Noninterest income, including securities transactions, totaled $67.5 million, up $4.0 million, or 6%, linked-quarterAmortization of the indemnification asset for FDIC covered loans totaled $1.3 million, compared to $1.1 million in the first quarter; the amortization is a reduction to noninterest income and is a result of a lower level of expected future losses on covered loansThis item will be eliminated beginning in the third quarter of 2017 as a result of the termination of the company’s loss share agreement with the FDICThe first quarter of 2017 included a $4.4 million gain on sale of selected Hancock Horizon FundsExcluding the items noted above, noninterest income totaled $68.8 million, up $8.6 million, or 14%, linked-quarter
17
Remain Focused On Expense Control Noninterest expenses totaled $183.5 million in 2Q17, up $19.9 million, or 12%, linked quarter; includes $10.6 million of nonoperating expenses (termination of loss share agreement and merger costs)Operating expense (noninterest expense excluding nonoperating items) totaled $172.9 million, up $15.8 million or 10%Personnel expense totaled $96.2 million, up $7.2 million, or 8%, linked-quarter, mainly up due to annual merit increase, higher incentive payments and additional personnel hired from the FNBC transactionsOccupancy and equipment totaled $16.8 million, up $2.3 million, or 16% linked-quarter related to operating the newer branches acquired in the FNBC I transactionAmortization of intangibles totaled $5.8 million for the second quarter of 2017, up $1.1 million or 22% linked-quarter. Net gains on ORE dispositions exceeded ORE expense by $1.0 million compared to $13 thousand in 1Q17; management does not expect this level of ORE expense to be sustainable in future quartersOther operating expense (excluding ORE) totaled $55.1 million in the second quarter of 2017, up $6.2 million, or 13%, from the first quarter of 2017; increase is partly related to the permanent expenses associated with the FNBC transactions
18
TCE ratio 7.65%, down 29 bps linked-quarterTangible asset growth -35 bpsIntangibles -18 bpsTangible net retained earnings +16 bpsOCI +6 bpsStock issuance & other +2 bpsWill continue to manage capital in the best interests of the Company and our shareholders Managing Our Capital… (e) estimated
19
Acquired approximately $2.6 billion in assets and liabilities in two transactions related to FNBC for $77 million transaction premium In-market, low-risk transactionsConsolidated 10 overlapping branches in FNBC IClosing 25 of 29 overlapping branches in FNBC IIExpect significant consolidation of the acquired back office and branches in FNBC IIFunding loans from FNBC I with deposits from FNBC IIExpect 2018 annual E.P.S. to approximate $.56 per share (for FNBC I & II combined) …With Financially Compelling Investments See slides 24 and 25 for information on FNBC I & II
20
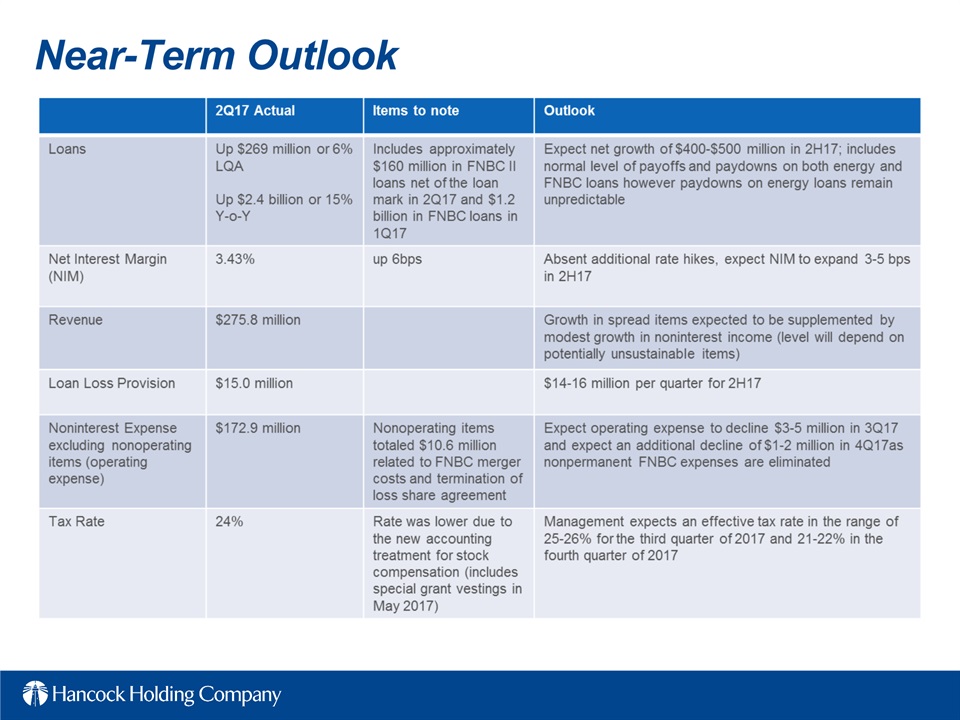
Near-Term Outlook
21
Long-Term Outlook Working to achieve objectives no later than 4Q18, if not soonerFNBC I & II help increase the potential for early achievement of long-term objectives 2017/18 Corporate Strategic Objectives (CSOs) Efficiency Ratio is noninterest expense to total net interest (TE) and noninterest income, excluding amortization of purchased intangibles and nonoperating items.
22
Appendix/Non-GAAP Reconciliations
23
FNBC I (Transaction with FNBC) Summary Signed an agreement on December 30, 2016 to purchase certain assets and liabilities, including 9 branches, from FNBC; the transaction closed on March 10, 2017Purchased select loans, 9 FNBC branches, including associated transaction and savings deposits and PP&E, and FHLB borrowings:Approximately $1.2 billion diversified and performing loan portfolio with a 5.28% average yield9 branches in the Greater New Orleans region, including 7 in the New Orleans MSAConsolidated 10 overlapping branchesApproximately $400 million in deposits at average cost of 0.95%Approximately $600 million in FHLB borrowings at average cost of 1.11%Paid a premium of just under $42 million to FNBCTransferred approximately $320 million in cash Premium is related to the earnings stream acquired
24
FNBC II (FDIC transaction) Summary On April 28, 2017 the Louisiana Office of Financial Institutions (OFI) closed First NBC Bank and appointed the FDIC as receiverWhitney Bank signed an agreement with the FDIC to acquire/assume certain assets and liabilities of First NBC BankApproximately $1.6 billion in deposits at average cost of 0.92%Approximately $160 million performing loan portfolio (mainly single-family residential mortgages) with a 4.50% average yieldApproximately $220 million in securities at average yield of 2.20%Approximately $550 million cash and other assetsWhitney Bank had the option to purchase (or assume the leases for) 29 branch locations (24 in Louisiana and 5 in Florida); consolidating 25 overlapping branchesNeither Hancock Holding Company nor Whitney Bank acquired any assets, common stock, preferred stock or debt, or assumed any other obligations, of First NBC Bank Holding CompanyPaid a premium of $35 million to the FDICReceived approximately $655 million in cash for the net liabilities assumedCDs not assumed by Whitney are being paid out in full with interest by the FDIC
25
Appendix: EPS Calculation and Non-GAAP Reconciliations See Note 13 in the most recent 10K for more details on the two-class method for E.P.S. calculation.
26
Appendix: Core PPNR Reconciliation
27
Appendix: Core Revenue Reconciliation
28
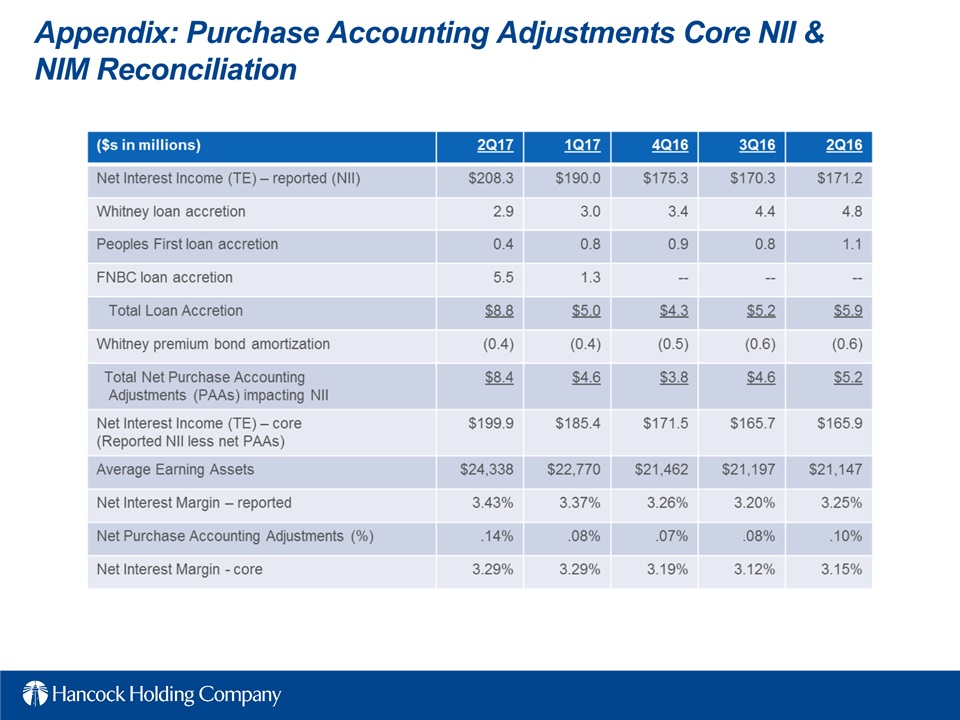
Appendix: Purchase Accounting Adjustments Core NII & NIM Reconciliation
29
Appendix: Core Revenue
30
Revenue Generating Initiatives - Fees $s in thousands
31
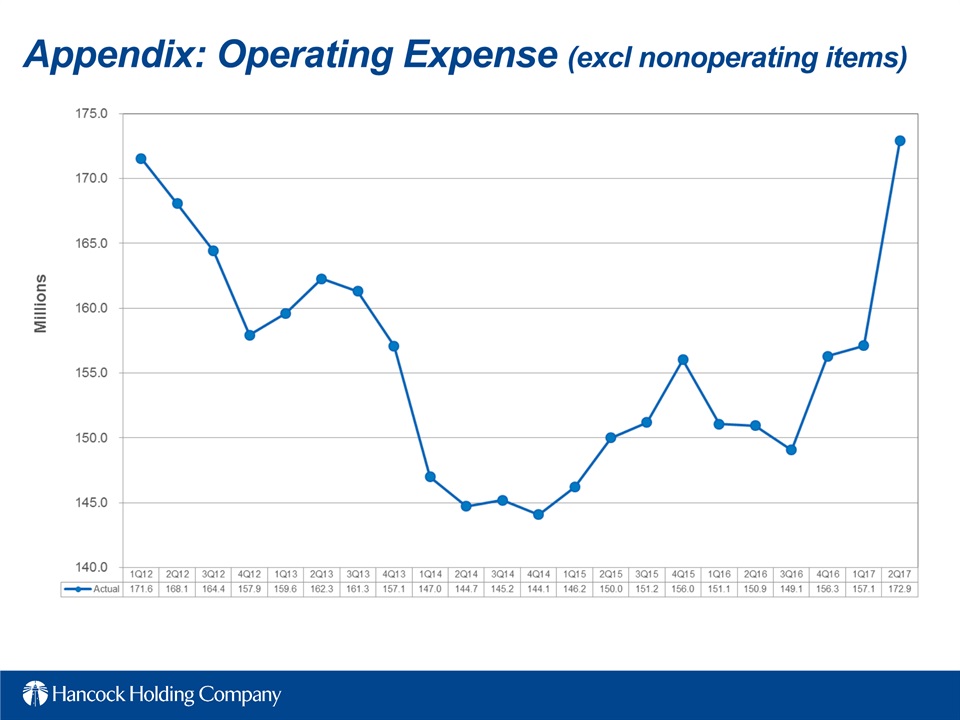
Appendix: Operating Expense (excl nonoperating items)
32
Appendix: Historical Energy Data $s in millions
33
Appendix: Energy Portfolio Support Services
34
Appendix: Glossary of Terms Linked-quarter – current quarter compared to previous quarterLoan Mark – Fair value discount on loans acquired in a business combinationLPO – Loan production officeLQA – Linked-quarter annualizedM&A – Mergers and acquisitionsNII – Net interest income NIM – Net interest marginNPA – Nonperforming assetsO&G – Oil and gasOperating – Net income excluding nonoperating itemsORE – Other real estatePAA – Purchase accounting adjustments from business combinations; including loan accretion, offset by any amortization of a bond portfolio premium, amortization of an indemnification asset and amortization of intangiblesPCI – Purchased credit impairedPPNR – Pre-provision net revenueRBL – Reserve-based lendingROA – Return on average assetsRR – Risk ratingSBIC – Small Business Investment CompanySNC – Shared National CreditTCE – Tangible common equity ratio (common shareholders’ equity less intangible assets divided by total assets less intangible assets)TDR – Troubled Debt Restructuring TE – Taxable equivalent (calculated using a federal income tax rate of 35%)Y-o-Y – Year over year 1Q17 – First Quarter of 20172H17 – Second Half of 2017 (3rd and 4th quarters)2Q17 – Second Quarter of 20173Q17 – Third Quarter of 20174Q17 – Fourth Quarter of 20174Q18 – Fourth Quarter of 2018AFS – Available for sale securitiesALLL – Allowance for loan and lease lossesAnnualized – Calculated to reflect a rate based on a full yearCDI – Core Deposit IntangibleCore – Excluding purchase accounting items and nonoperating itemsCore NIM – Reported net interest income (TE) excluding total net purchase accounting adjustments, annualized, as a percent of average earning assetsCore Revenue – Net interest income (TE) plus noninterest income excluding purchase accounting adjustments for both categoriesCurrent Energy Cycle – Refers to the energy cycle beginning in November of 2014 through the most recent quarter endDDA – Noninterest-bearing demands deposit accountsE&P – Exploration and Production (Oil & Gas)Efficiency ratio – noninterest expense to total net interest (TE) and noninterest income, excluding amortization of purchased intangibles and nonoperating items.EOP – End of periodEPS – Earnings per shareFNBC I – Acquired selected assets & liabilities from FNBC (see slide 24)FNBC II – Acquired selected assets & liabilities of FNBC from FDIC (see slide 25)HTM – Held to maturity securitiesIRR – Interest rate risk
35
7/19/2017 Second Quarter 2017Earnings Conference Call
36