Attached files
| file | filename |
|---|---|
| 8-K - 8-K - ZIONS BANCORPORATION, NATIONAL ASSOCIATION /UT/ | a20170622-dxfastresultsxmd.htm |

Zions Bancorporation & ZB, N.A.
Dodd-Frank Act Company-Run Capital Stress Test Disclosure
June 22, 2017
1

Table of Contents
Introduction 3
Process 4
Risks 4
Methodologies 5
Macroeconomic Scenario 6
Summary of Results 6
ZB, N.A. 11
Forward-Looking Statement 11
2

Introduction
Zions Bancorporation ("the Company" or "Zions") is one of the nation's premier financial services
companies with total assets of approximately $65 billion. Zions operates under local management teams
and unique brands in 11 western states: Arizona, California, Colorado, Idaho, Nevada, New Mexico,
Oregon, Texas, Utah, Washington and Wyoming. The company is a national leader in Small Business
Administration lending and public finance advisory services, and is a consistent top recipient of
Greenwich Excellence awards in banking. In addition, Zions is included in the S&P 500 and NASDAQ
Financial 100 indices. Investor information and links to local banking brands can be accessed at
zionsbancorp.com.
Incorporated in this disclosure are the annual stress test results of both Zions Bancorporation and ZB,
N.A. ("the Bank"), the Company’s banking subsidiary. The total assets of ZB, N.A. represent 99.7% of the
total assets of Zions Bancorp as of December 31, 2016. The risk profile between the two entities is
consistent and, unless specified, the results and analysis in this document apply to both entities.
Zions’ Dodd-Frank Act Stress Test (DFAST) results, based on the hypothetical Supervisory Severely
Adverse scenario identified by the Federal Reserve Board, indicate Zions Bancorporation would maintain
capital ratios at sufficient levels throughout the nine-quarter forecasting horizon.
In accordance with section 165(i)(2) of the Dodd-Frank Wall Street Reform and Consumer Protection Act
("Dodd-Frank Act"), bank holding companies (BHCs) with total consolidated assets of $50 billion or more
("Covered Companies") are annually required to create a set of forward-looking stress tests based upon
hypothetical economic scenarios issued by the Federal Reserve Board (in addition to internal
idiosyncratic economic scenarios). The estimated financial results of the stress test identify the
hypothetical projected capital position of a corporation under severely adverse economic conditions to
determine if there is sufficient capital to absorb losses and support operations.
For the DFAST forecasts, all BHCs are required to make uniform capital assumptions over the
nine-quarter planning period, which include (i) no issuances or redemptions of regulatory capital
instruments, (ii) quarterly common stock dividend distributions equal to the average of the prior
four quarters, and (iii) capital instrument payments that must be equal to the previously stated
expectations of dividends, interest, or principal payments.
Section 165(i)(2) of the Dodd-Frank Act also requires national banks and federal savings associations
with total consolidated assets of more than $10 billion to conduct annual stress tests. For 2017, Zions'
flagship affiliate, ZB, N.A., was subject to this rule. Accordingly, ZB, N.A. conducted a Dodd-Frank
company-run stress test under the supervisory scenarios and guidance provided by the Office of the
Comptroller of the Currency (OCC). These scenarios were the same as those promulgated by the
Federal Reserve.
Pursuant to CFR §252.148, the following summary is a disclosure of the results of the stress test of Zions
Bancorporation and ZB, N.A. Included is a discussion of the macroeconomic scenarios, a summary of
results, risks accounted for, and methodologies used in development of the stress testing. The
quantitative output included herein should not be viewed as forecasts of expected outcomes or capital
ratios or as a measure of the company's solvency or actual financial performance or condition.
3

Process
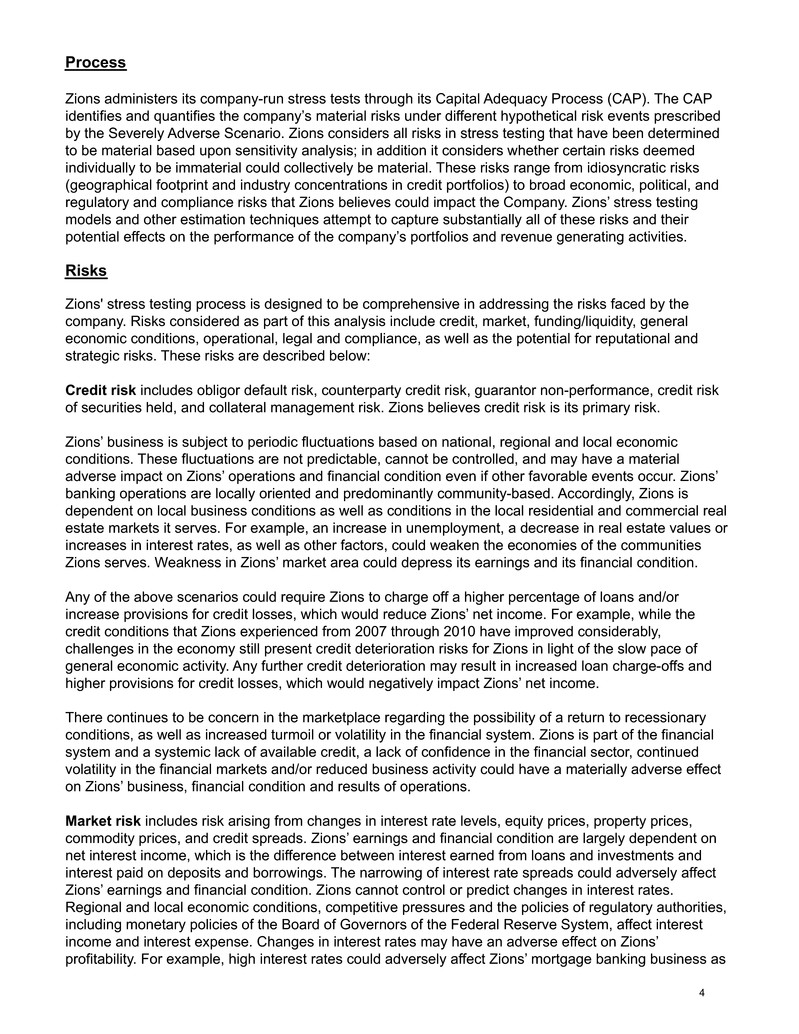
Zions administers its company-run stress tests through its Capital Adequacy Process (CAP). The CAP
identifies and quantifies the company’s material risks under different hypothetical risk events prescribed
by the Severely Adverse Scenario. Zions considers all risks in stress testing that have been determined
to be material based upon sensitivity analysis; in addition it considers whether certain risks deemed
individually to be immaterial could collectively be material. These risks range from idiosyncratic risks
(geographical footprint and industry concentrations in credit portfolios) to broad economic, political, and
regulatory and compliance risks that Zions believes could impact the Company. Zions’ stress testing
models and other estimation techniques attempt to capture substantially all of these risks and their
potential effects on the performance of the company’s portfolios and revenue generating activities.
Risks
Zions' stress testing process is designed to be comprehensive in addressing the risks faced by the
company. Risks considered as part of this analysis include credit, market, funding/liquidity, general
economic conditions, operational, legal and compliance, as well as the potential for reputational and
strategic risks. These risks are described below:
Credit risk includes obligor default risk, counterparty credit risk, guarantor non-performance, credit risk
of securities held, and collateral management risk. Zions believes credit risk is its primary risk.
Zions’ business is subject to periodic fluctuations based on national, regional and local economic
conditions. These fluctuations are not predictable, cannot be controlled, and may have a material
adverse impact on Zions’ operations and financial condition even if other favorable events occur. Zions’
banking operations are locally oriented and predominantly community-based. Accordingly, Zions is
dependent on local business conditions as well as conditions in the local residential and commercial real
estate markets it serves. For example, an increase in unemployment, a decrease in real estate values or
increases in interest rates, as well as other factors, could weaken the economies of the communities
Zions serves. Weakness in Zions’ market area could depress its earnings and its financial condition.
Any of the above scenarios could require Zions to charge off a higher percentage of loans and/or
increase provisions for credit losses, which would reduce Zions’ net income. For example, while the
credit conditions that Zions experienced from 2007 through 2010 have improved considerably,
challenges in the economy still present credit deterioration risks for Zions in light of the slow pace of
general economic activity. Any further credit deterioration may result in increased loan charge-offs and
higher provisions for credit losses, which would negatively impact Zions’ net income.
There continues to be concern in the marketplace regarding the possibility of a return to recessionary
conditions, as well as increased turmoil or volatility in the financial system. Zions is part of the financial
system and a systemic lack of available credit, a lack of confidence in the financial sector, continued
volatility in the financial markets and/or reduced business activity could have a materially adverse effect
on Zions’ business, financial condition and results of operations.
Market risk includes risk arising from changes in interest rate levels, equity prices, property prices,
commodity prices, and credit spreads. Zions’ earnings and financial condition are largely dependent on
net interest income, which is the difference between interest earned from loans and investments and
interest paid on deposits and borrowings. The narrowing of interest rate spreads could adversely affect
Zions’ earnings and financial condition. Zions cannot control or predict changes in interest rates.
Regional and local economic conditions, competitive pressures and the policies of regulatory authorities,
including monetary policies of the Board of Governors of the Federal Reserve System, affect interest
income and interest expense. Changes in interest rates may have an adverse effect on Zions’
profitability. For example, high interest rates could adversely affect Zions’ mortgage banking business as
4

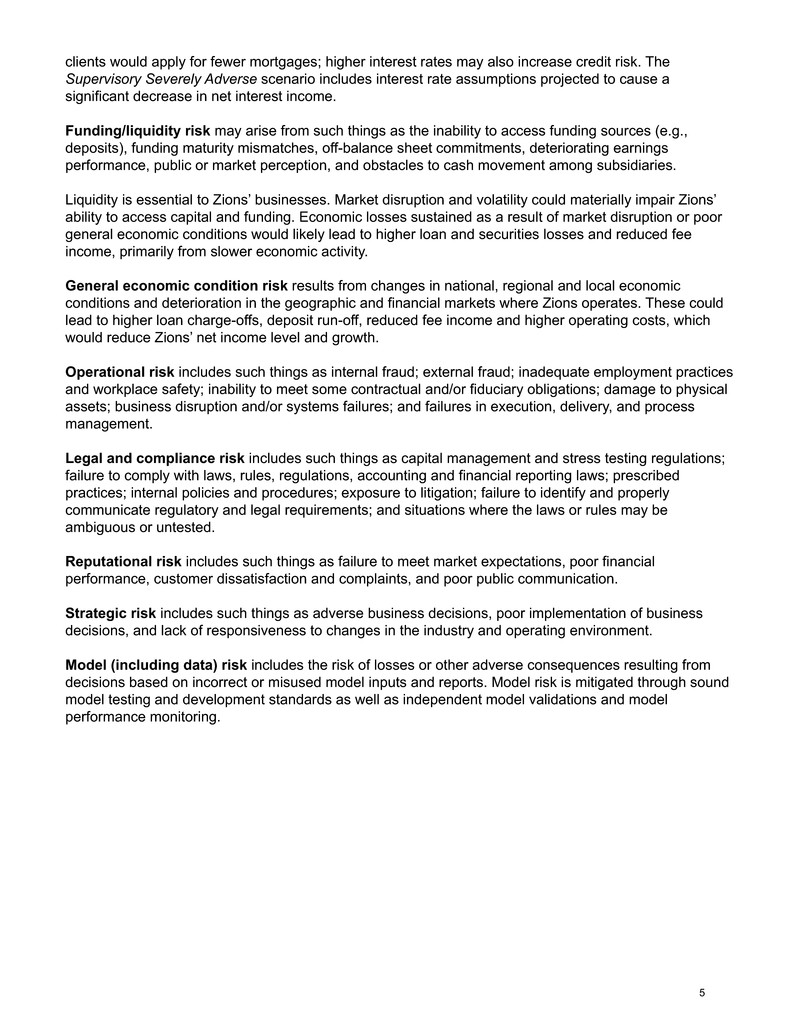
clients would apply for fewer mortgages; higher interest rates may also increase credit risk. The
Supervisory Severely Adverse scenario includes interest rate assumptions projected to cause a
significant decrease in net interest income.
Funding/liquidity risk may arise from such things as the inability to access funding sources (e.g.,
deposits), funding maturity mismatches, off-balance sheet commitments, deteriorating earnings
performance, public or market perception, and obstacles to cash movement among subsidiaries.
Liquidity is essential to Zions’ businesses. Market disruption and volatility could materially impair Zions’
ability to access capital and funding. Economic losses sustained as a result of market disruption or poor
general economic conditions would likely lead to higher loan and securities losses and reduced fee
income, primarily from slower economic activity.
General economic condition risk results from changes in national, regional and local economic
conditions and deterioration in the geographic and financial markets where Zions operates. These could
lead to higher loan charge-offs, deposit run-off, reduced fee income and higher operating costs, which
would reduce Zions’ net income level and growth.
Operational risk includes such things as internal fraud; external fraud; inadequate employment practices
and workplace safety; inability to meet some contractual and/or fiduciary obligations; damage to physical
assets; business disruption and/or systems failures; and failures in execution, delivery, and process
management.
Legal and compliance risk includes such things as capital management and stress testing regulations;
failure to comply with laws, rules, regulations, accounting and financial reporting laws; prescribed
practices; internal policies and procedures; exposure to litigation; failure to identify and properly
communicate regulatory and legal requirements; and situations where the laws or rules may be
ambiguous or untested.
Reputational risk includes such things as failure to meet market expectations, poor financial
performance, customer dissatisfaction and complaints, and poor public communication.
Strategic risk includes such things as adverse business decisions, poor implementation of business
decisions, and lack of responsiveness to changes in the industry and operating environment.
Model (including data) risk includes the risk of losses or other adverse consequences resulting from
decisions based on incorrect or misused model inputs and reports. Model risk is mitigated through sound
model testing and development standards as well as independent model validations and model
performance monitoring.
5

Methodologies
As part of its CAP, the Company projects the impact of its key exposures and material risks in several
scenarios including the Supervisory Severely Adverse scenario using a variety of modeling techniques.
Methodologies used include:
1. The Company models credit losses using separate loan-level loss models for Commercial &
Industrial (C&I), Small Business, Residential Real Estate (RRE), Energy, Commercial Real Estate
(CRE), Auto, Credit Card, Agriculture, and other loan portfolio. Portfolio level models for other
categories include municipal securities, Small Business Administration securities, and
counterparty credit risk.
2. Market risk is captured through interest rates used in Pre-Provision Net Revenue (PPNR) models;
equity prices through PPNR and credit models, and the private equity model; energy commodity
prices are directly stressed through the scenario design process that is a direct input into the
energy loss model; credit spreads impact the loan growth and pricing models; and real estate
prices are used in PPNR, CRE, RRE, and C&I models.
3. Liquidity risk is measured through liquidity stress test scenarios and the parent liquidity model;
asset/liability model; unfunded commitments included in credit loss models; and earnings impacts
through PPNR projections.
4. Operational risk is captured through the operational loss model via historical loss data and
scenario analysis.
5. Legal risk is captured through scenario analysis, the operational loss model, and specific litigation
expense buffers.
6. Reputational and strategic risks are difficult to quantify; however, their potential impacts on capital
are quantified using loss narratives and other techniques.
7. Potential model risk is captured through conservative model choices as well as overlays applied
after the review of results that address model weaknesses and limitations.
Macroeconomic Scenario
Results contained in this report are based on the Supervisory Severely Adverse scenario distributed by
regulatory agencies on February 10, 2017.1 In this hypothetical scenario there is a substantial weakening
of the world economy, with the U.S. economy experiencing increases in financial distress that are
significantly greater than under more common economic downturns and recessions. The unemployment
rate rises to 10% by the third quarter of 2017, and real GDP declines rapidly, with a maximum quarterly
(annualized) decline of 7.5%. Housing prices fall dramatically with a peak-to-trough drop of 25.0% and
commercial real estate prices fall further with a peak-to-trough drop of 34.6%. Interest rates on short-term
benchmark indices remain near zero while spreads between the yields on investment-grade corporate
bonds and the yields on long-term Treasury securities widen. In addition Zions stressed energy prices,
with oil prices reaching $33/barrel, a decline from the ~$50/barrel it had been in the months leading up to
the submission of the test. This is a similar percent decline Zions used in the 2016 DFAST submission.
1 For more information please see the scenario descriptions in the document "2017 Supervisory Scenarios for Annual Stress Tests Required
under the Dodd-Frank Act Stress Testing Rules and the Capital Plan Rule February 10, 2017" located at https://www.federalreserve.gov/
newsevents/pressreleases/files/bcreg20170203a5.pdf
6

Summary of Results
The following data are the results submitted by Zions in its 2017 DFAST submission for the Supervisory
Severely Adverse scenario. These results represent estimates of Zions’ capital position as of Q1 2019
under this scenario, as well as the minimum ratios during the nine-quarter period. This scenario is
considered unlikely to occur; therefore, these estimates do not represent forecasts of expected
results. The economic assumptions used to arrive at these results involve an economic outcome that is
significantly more adverse than current market expectations for the economy generally or for Zions
specifically. The company frequently uses highly conservative assumptions.
Projected Capital Ratios in the Supervisory Severely Adverse Stress Scenario
Actual
as of
Dec 31, 2016
Post-Stress
as of
March 31, 2019
Minimum ratio
during
hypothetical
period
Zions Bancorporation
Common Equity Tier 1 12.1% 9.6% 9.6%
Tier 1 Leverage Ratio 11.1% 8.0% 8.0%
Tier 1 Capital Ratio 13.5% 11.1% 11.1%
Total Risk-Based Capital Ratio 15.2% 12.8% 12.8%
Projected Net Loan Losses by Category1
December 31, 2016 through March 31, 2019
in the Hypothetical Supervisory Severely Adverse Stress Scenario
Cumulative
Amount
($ billions)
Cumulative
9-Qtr. Net
Loss Rates
Zions Bancorporation
Net Loan Losses 2.0 4.8%
Domestic closed-end first-lien
mortgages 0.1 1.4%
Domestic junior lien
mortgages and home equity
lines of credit 0.0 1.9%
Commercial and industrial 0.8 8.1%
Commercial real estate 0.9 4.7%
Credit card exposures 0.0 7.6%
Other consumer 0.0 2.9%
Other loans 0.1 3.3%
1 The table above utilizes regulatory classifications which vary from GAAP classifications
The total net loss rate of 4.8% compares to a 5.6% actual realized worst nine-quarter loss period,
experienced as a result of the 2008-2009 recession. The credit loss results of the 2017 stress test are
similar to the actual recent recession, although Zions has reduced risk materially by reducing
construction and land development loans by approximately $6 billion since December 2007. Therefore,
Zions believes the 2017 modeled results are conservative.
In addition to the scenario provided by the Federal Reserve, Zions applies assumptions that are
designed to capture risks that are unique or idiosyncratic to Zions’ business; among others, the most
notable is the price of oil, as Zions had $2.2 billion of loan balances outstanding that are classified as
7

direct exposure to the oil and natural gas industries. Zions used an average price of oil per barrel during
the nine-quarter period of $35, which resulted in elevated losses, primarily captured in the Commercial
and Industrial loan category, and thus explaining the elevated net loss rate for that category of 8.1%, as
compared to the actual worst nine-quarter loss rate of only 5.2%.
Earnings Impact on Regulatory Capital
December 31, 2016 through March 31, 2019
in the Supervisory Severely Adverse Stress Scenario
Cumulative
9-Quarter
Amount
($billions)
Zions Bancorp
Net interest income 4.1
Noninterest income 0.9
Operational risk expense 0.1
OREO Expense 0.2
Other Noninterest Expense 3.8
Pre-provision net revenue (PPNR) 0.8
Less:
Provision for loan and lease losses 2.3
Trading and counterparty losses 0.0
Realized losses/(gains) on AFS/HTM securities 0.0
Equals:
Net Income before taxes and extraordinary items (1) (1.5)
Income tax benefit (0.6)
Total Impact on Regulatory Capital from Net Income (0.9)
Goodwill impairment (2) 1.0
(1) Excludes goodwill impairment charges
(2) No impact to regulatory capital
8

In the Supervisory Severely Adverse scenario, the Company's capital position declines due to the impact
of the following:
Loan Loss Provision
During 2016, the Company recorded a provision for loan losses of $93 million. In the Supervisory
Severely Adverse scenario, the Company modeled an annualized provision of $1.0 billion, or a
cumulative $2.3 billion for the nine-quarter period. Such modeled provisions were primarily attributable to
modeled net loan losses of $2.0 billion, or an annualized $874 million. This compares to actual 2016 net
charge-offs of only $131 million.
Securities Losses
Zions' securities portfolio contains U.S. government, U.S. government agency, and municipal securities.
In the Supervisory Severely Adverse scenario, the Company modeled a cumulative $8 million loss for the
nine-quarter period.
Pre-Provision Net Revenue (PPNR)
Zions' PPNR for 2016 was $791 million (adjusts income before taxes by excluding the effect of the
provision for loan losses and net losses on securities). Under the Supervisory Severely Adverse
scenario, Zions' PPNR equaled an annualized $376 million, or $846 million for the nine-quarter period,
which reflected:
• Lower net interest income attributable to low short term rates. Zions’ earning assets are
skewed to shorter-duration instruments, the income from which is more adversely affected under
a falling rate scenario than assets that have longer duration. In 2016, Zions recorded net interest
income of $1.87 billion; under the Supervisory Severely Adverse scenario, Zions' projected
annualized net interest income is $1.84 billion. Zions projected that loan balances would decline
under a severely adverse stress scenario, and that interest income on loans would be negatively
impacted due to both lower balances and the low rate environment. Note that in 2016, Zions'
increased the duration of the asset base by funding an additional $6 billion in securities
purchases with excess cash. In addition, Zions' projection assumed an additional $3 billion
increase in securities in Q1 of the forecast. The interest income from these securities dampens
the decline in income that would otherwise be observed between the Supervisory Severely
Adverse scenario and actual experience in 2016.
• Lower non-interest income. Excluding net impairment losses on investment securities in 2016,
Zions realized $505 million of noninterest income. In the Supervisory Severely Adverse scenario,
Zions projected annualized non-interest income would be $399 million.
• Higher non-interest expenses. In 2016, excluding other real estate owned and credit-related
expenses and debt extinguishment expenses, Zions recognized $1.6 billion of non-interest
expenses. Under the Supervisory Severely Adverse scenario, Zions projected annualized non-
interest expense, excluding those same items, would be $1.7 billion.
• Higher other real estate owned and credit-related expenses. Compared to the 2016 amount
of $24 million, Zions estimated such expenses would run an annualized $156 million during the 9-
quarter period.
Risk-Weighted Assets (RWA)
Net risk-weighted assets decreased in the Supervisory Severely Adverse scenario from $49.9 billion at
Q4 2016 to $47.5 billion at Q1 2019. Loan balances decreased by $4.2 billion, mostly due to loan charge-
offs, which decreased RWA.
9

Significant Drivers of Changes to the Projected Common Equity Tier 1 Ratio under the
Supervisory Severely Adverse Scenario
The chart below shows material impacts to the Common Equity Tier 1 Ratio over the course of the nine-
quarter stress period. Per the DFAST rules, the forecast capital impacts shown below incorporate the
following assumptions: (i) no issuances or redemptions of regulatory capital instruments, (ii) quarterly
common stock dividend distributions equal to the average of the prior four quarters, and (iii) capital
instrument payments that must be equal to the previously stated expectations of dividends, interest, or
principal payments.
For Zions Bancorporation and ZB, N.A., credit losses are the main driver of capital deterioration in the Supervisory
Severely Adverse scenario forecast.
10

ZB, N.A.
The following data are the results submitted by ZB, N.A. in its 2017 DFAST submission for the
Supervisory Severely Adverse scenario. These results represent estimates of ZB, N.A.’s capital position
as of Q1 2019 under this scenario, as well as the minimum ratios during the nine-quarter period. This
scenario is considered unlikely to occur; therefore, these estimates do not represent forecasts of
expected results. The economic assumptions used to arrive at these results involve an economic
outcome that is significantly more adverse than current market expectations for the economy generally or
for ZB, N.A. specifically.
Projected Capital Ratios in the Supervisory Severely Adverse Stress scenario
Actual
as of
Dec 31, 2016
Post-Stress
as of
March 31, 2019
Minimum ratio
during
hypothetical
period
ZB, N.A.
Common Equity Tier 1 11.7% 9.8% 9.8%
Tier 1 Leverage Ratio 11.0% 8.3% 8.3%
Tier 1 Capital Ratio 13.4% 11.6% 11.6%
Total Risk-Based Capital Ratio 14.6% 12.8% 12.8%
Forward-Looking Statement
This disclosure contains statements relating to a stress test and analysis undertaken by Zions
Bancorporation pursuant to regulatory requirements. The stress test results are based upon the
hypothetical impact of unlikely future economic conditions on our capital, financial condition, and
earnings under certain financial models. The stress test results are not intended to reflect our
expectations about actual future conditions. Zions is constantly evaluating and refining the quality of its
models; such evaluation might cause our understanding of the stress test results to change. Additionally,
changes to the underlying economic assumptions that drive the stress test results may also cause Zions
understanding of the stress test results to change. Accordingly, the statements contained in this
disclosure are based on facts and circumstances as understood by management of the Company on the
date of this disclosure, which may change in the future. Except as required by law, Zions disclaims any
obligation to update any statements or to publicly announce the results of any revisions to any of the
forward-looking statements included herein to reflect future events, developments, determinations, or
understandings.
11
