Attached files
| file | filename |
|---|---|
| EX-32.2 - EXHIBIT 32.2 - HAIN CELESTIAL GROUP INC | hain-06302016xex322.htm |
| EX-32.1 - EXHIBIT 32.1 - HAIN CELESTIAL GROUP INC | hain-06302016xex321.htm |
| EX-31.2 - EXHIBIT 31.2 - HAIN CELESTIAL GROUP INC | hain-06302016xex312.htm |
| EX-31.1 - EXHIBIT 31.1 - HAIN CELESTIAL GROUP INC | hain-06302016xex311.htm |
| EX-23.1 - EXHIBIT 23.1 - HAIN CELESTIAL GROUP INC | hain-06302016xex231.htm |
| EX-21.1 - EXHIBIT 21.1 - HAIN CELESTIAL GROUP INC | hain-06302016xex211.htm |
UNITED STATES
SECURITIES AND EXCHANGE COMMISSION
Washington, D.C. 20549
___________________________________________
FORM 10-K
___________________________________________
(Mark One)
ý | Annual Report Pursuant to Section 13 or 15(d) of the Securities Exchange Act of 1934 |
For the Fiscal Year ended June 30, 2016
¨ | Transition Report pursuant to Section 13 or 15(d) of The Securities Exchange Act of 1934 |
for the transition period from to .
Commission File No. 0-22818
___________________________________________

THE HAIN CELESTIAL GROUP, INC.
(Exact name of registrant as specified in its charter)
___________________________________________
Delaware | 22-3240619 | |
(State or other jurisdiction of incorporation or organization) | (I.R.S. Employer Identification No.) | |
1111 Marcus Avenue Lake Success, New York | 11042 | |
(Address of principal executive offices) | (Zip Code) | |
Registrant’s telephone number, including area code: (516) 587-5000
Securities registered pursuant to Section 12(b) of the Act:
Title of Each Class | Name of Each Exchange on which registered | |
Common Stock, par value $.01 per share | The NASDAQ® Global Select Market | |
Securities registered pursuant to Section 12(g) of the Act: None
_______________________________________
Indicate by check mark whether the registrant is a well-known seasoned issuer, as defined in Rule 405 of the Securities Act.
Yes ¨ No ý
Indicate by check mark if the registrant is not required to file reports pursuant to Section 13 or Section 15(d) of the Act.
Yes ¨ No ý
Indicate by check mark whether the registrant (1) has filed all reports required to be filed by Section 13 or 15(d) of the Securities Exchange Act of 1934 during the preceding 12 months (or for such shorter period that the registrant was required to file such reports), and (2) has been subject to such filing requirements for the past 90 days.
Yes ¨ No ý
Indicate by check mark whether the registrant has submitted electronically and posted on its corporate Web site, if any, every Interactive Data File required to be submitted and posted pursuant to Rule 405 of Regulation S-T (section 232.405 of this chapter) during the preceding 12 months (or for such shorter period that the registrant was required to submit and post such files).
Yes ¨ No ý
Indicate by check mark if disclosure of delinquent filers pursuant to Item 405 of Regulation S-K is not contained herein, and will not be contained, to the best of registrant’s knowledge, in definitive proxy or information statements incorporated by reference in Part III of this Form 10-K or any amendment to Form 10-K. ý
Indicate by check mark whether the registrant is a large accelerated filer, an accelerated filer, a non-accelerated filer, smaller reporting company, or an emerging growth company. See the definitions of “large accelerated filer,” “accelerated filer,” “smaller reporting company,” and “emerging growth company” in Rule 12b-2 of the Exchange Act.
Large accelerated filer | ý | Accelerated filer | ¨ | |||
Non-accelerated filer (Do not check if a smaller reporting company) | ¨ | Smaller reporting company | ¨ | Emerging growth company | ¨ | |
If an emerging growth company, indicate by check mark if the registrant has elected not to use the extended transition period for complying with any new or revised financial accounting standards provided pursuant to Section 13(a) of the Exchange Act. ¨
Indicate by check mark whether the registrant is a shell company (as defined in Rule 12b-2 of the Act). Yes ¨ No ý
The aggregate market value of the voting and non-voting common equity held by non-affiliates of the registrant based upon the
closing price of the registrant’s stock, as quoted on the NASDAQ Global Select Market on December 31, 2015, the last business day of the registrant’s most recently completed second fiscal quarter, was $4,107,285,000.
As of June 16, 2017, there were 103,697,237 shares outstanding of the registrant’s Common Stock, par value $.01 per share.
DOCUMENTS INCORPORATED BY REFERENCE
None.
THE HAIN CELESTIAL GROUP, INC.
Table of Contents
Page | ||
PART I | ||
Item 1. | ||
Item 1A. | ||
Item 1B. | ||
Item 2. | ||
Item 3. | ||
Item 4. | ||
PART II | ||
Item 5. | ||
Item 6. | ||
Item 7. | ||
Item 7A. | ||
Item 8. | ||
Item 9. | ||
Item 9A. | ||
Item 9B. | ||
PART III | ||
Item 10. | ||
Item 11. | ||
Item 12. | ||
Item 13. | ||
Item 14. | ||
PART IV | ||
Item 15. | ||
Item 16. | ||
2
EXPLANATORY NOTE
As used in this Annual Report on Form 10-K, the terms the “Company”, “Hain Celestial”, “Hain”, “we”, “us” and “our” mean The Hain Celestial Group, Inc. and its subsidiaries.
As previously reported, we were unable to timely file our Annual Report on Form 10-K for our fiscal year ended June 30, 2016 (the “Form 10-K”) and our Quarterly Reports on Form 10-Q for the quarters ended September 30, 2016 (the “Q1 Form 10-Q”), December 31, 2016 (the “Q2 Form 10-Q”) and March 31, 2017 (the “Q3 Form 10-Q”). During the fourth quarter of fiscal 2016, the Company identified the practice of granting additional concessions to certain distributors in the United States and commenced an internal accounting review in order to (i) determine whether the revenue associated with those concessions was accounted for in the correct period and (ii) evaluate the Company’s internal control over financial reporting. The Audit Committee of the Company’s Board of Directors separately conducted an independent review of these matters and retained independent counsel to assist in their review. We delayed the filing of this Form 10-K and our Q1 Form 10-Q, Q2 Form 10-Q and Q3 Form 10-Q with the Securities and Exchange Commission (the “SEC”) in order to complete these reviews.
Completion of Reviews. On November 16, 2016, the Company announced the completion of the independent review conducted by the Audit Committee, which found no evidence of intentional wrongdoing in connection with the preparation of the Company’s financial statements. The Company also disclosed that it would not be in a position to release financial results until the completion of its internal accounting review and the audit process. We are now filing this Form 10-K as a result of the completion of the aforementioned reviews. Concurrent with the filing of this Form 10-K, we are also filing our Q1 Form 10-Q, Q2 Form 10-Q and Q3 Form 10-Q (collectively, our “Periodic Reports”). The Periodic Reports incorporate the findings from the aforementioned reviews and addresses the remediation of the immaterial errors and identified material weaknesses in our internal control over financial reporting that existed at June 30, 2016, September 30, 2016, December 31, 2016 and March 31, 2017. These material weaknesses, as well as the Company’s remediation of such material weaknesses, are discussed further under “Part II, Item 9A. Controls and Procedures” of this Form 10-K.
Notwithstanding the material weaknesses discussed under “Part II, Item 9A. Controls and Procedures” of this Form 10-K and based upon our internal accounting review and the independent review of our Audit Committee, our management has concluded that our consolidated financial statements included in this Form 10-K are fairly stated in all material respects in accordance with United States Generally Accepted Accounting Principles (“U.S. GAAP”).
Correction of Additional Immaterial Errors. Although the initial focus of the Company’s internal accounting review discussed above pertained to the timing of the recognition of revenue associated with the concessions granted to certain distributors, the Company subsequently expanded its internal accounting review and performed an analysis of previously-issued financial statements to identify and assess any other potential errors. Based upon this review, the Company identified certain immaterial errors relating to its previously-issued financial statements, which resulted in revisions to our previously-issued financial statements and are discussed in further detail under Note 2, Correction of Immaterial Errors to Prior Period Financial Statements, in the Notes to Consolidated Financial Statements included in Item 8 of this Form 10-K. Please also see our Periodic Reports, which are being filed concurrently with this Form 10-K.
Except as specifically set forth herein, the information contained in this Form 10-K is presented as of June 30, 2016 and the period then ended, and these financial results do not reflect events or results of operations that have occurred subsequent to June 30, 2016.
Unless otherwise indicated, references in this Form 10-K to 2016, 2015, 2014 or “fiscal” 2016, 2015, 2014 or other years refer to our fiscal year ended June 30 of that respective year, and references to 2017 or “fiscal” 2017 refer to our fiscal year ending June 30, 2017.
3
Cautionary Note Regarding Forward Looking Information
This Annual Report on Form 10-K contains forward-looking statements within the meaning of the Private Securities Litigation Reform Act of 1995, relating to our business and financial outlook, which are based on our current beliefs, assumptions, expectations, estimates, forecasts and projections about future events only as of the date of this Annual Report on Form 10-K, and are not statements of historical fact. We make such forward-looking statements pursuant to the “safe harbor” provisions of the Private Securities Litigation Reform Act of 1995.
Many of our forward-looking statements include discussions of trends and anticipated developments under the “Risk Factors” and “Management’s Discussion and Analysis of Financial Condition and Results of Operations” sections of this Annual Report on Form 10-K. In some cases, you can identify forward-looking statements by terminology such as the use of “may,” “will,” “should,” “expects,” “plans,” “anticipates,” “believes,” “estimates,” “projects,” “intends,” “predicts,” “potential,” or “continue” and similar expressions, or the negative of those expressions. These forward-looking statements include, among other things, our beliefs or expectations relating to our business strategy, growth strategy, market price, brand portfolio and product performance, the seasonality of our business, our results of operations and financial condition, our SEC filings, enhancing internal controls and remediating material weaknesses. These forward-looking statements are not guarantees of our future performance and involve risks, uncertainties, estimates and assumptions that are difficult to predict. Therefore, our actual outcomes and results may differ materially from those expressed in these forward-looking statements. You should not place undue reliance on any of these forward-looking statements. Further, any forward-looking statement speaks only as of the date hereof, unless it is specifically otherwise stated to be made as of a different date. We undertake no obligation to further update any such statement, or the risk factors described in Item 1A under the heading “Risk Factors,” to reflect new information, the occurrence of future events or circumstances or otherwise.
The forward-looking statements in this filing do not constitute guarantees or promises of future performance. Factors that could cause or contribute to such differences may include, but are not limited to, the impact of competitive products, changes to the competitive environment, changes to consumer preferences, general economic and financial market conditions, our ability to introduce new products and improve existing products, changes in relationships with customers, suppliers, strategic partners and lenders, legal proceedings and government investigations (including any potential action by the Division of Enforcement of the SEC and securities class action and stockholder derivative litigation), our ability to manage our financial reporting and internal control systems and processes, the Company’s non-compliance with certain Nasdaq Stock Market LLC listing rules, the expected sales of our products, our ability to identify and complete acquisitions or divestitures and integrate acquisitions, changes in raw materials, commodity costs and fuel, the availability of organic and natural ingredients, risks associated with our international sales and operations, risks relating to the protection of intellectual property, the reputation of our brands, changes to and the interpretation of governmental regulations, unanticipated expenditures, and other risks described in Part I, Item 1A, “Risk Factors” as well as in other reports that we file in the future.
4
PART I
THE HAIN CELESTIAL GROUP, INC.
Item 1. Business
Overview
The Hain Celestial Group, Inc., a Delaware corporation, was founded in 1993 and is headquartered in Lake Success, New York. The Company’s mission has continued to evolve since its founding, with health and wellness being the core tenet — to be the leading marketer, manufacturer and seller of organic and natural, “better-for-you” products by anticipating and exceeding consumer expectations in providing quality, innovation, value and convenience. The Company is committed to growing sustainably while continuing to implement environmentally sound business practices and manufacturing processes.
With a proven track record of strategic growth and profitability, the Company manufactures, markets, distributes and sells organic and natural products under brand names that are sold as “better-for-you” products, providing consumers with the opportunity to lead A Healthier Way of LifeTM. Hain Celestial is a leader in many organic and natural products categories, with many recognized brands in the various market categories it serves, including Almond Dream®, Arrowhead Mills®, Bearitos®, BluePrint®, Celestial Seasonings®, Coconut Dream®, Cully & Sully®, Danival®, DeBoles®, Earth’s Best®, Ella’s Kitchen®, Empire®, Europe’s Best®, Farmhouse Fare®, Frank Cooper’s®, FreeBird®, Gale’s®, Garden of Eatin’®, GG UniqueFiberTM, Hain Pure Foods®, Hartley’s®, Health Valley®, Imagine®, Johnson’s Juice Co.®, Joya®, Kosher Valley®, Lima®, Linda McCartney’s® (under license), MaraNatha®, Natumi®, New Covent Garden Soup Co.®, Plainville Farms®, Rice Dream®, Robertson’s®, Rudi’s Gluten-Free Bakery®, Rudi’s Organic Bakery®, Sensible Portions®, Spectrum Organics®, Soy Dream®, Sun-Pat®, SunSpire®, Terra®, The Greek Gods®, Tilda®, WestSoy® and Yves Veggie Cuisine®. The Company’s personal care products are marketed under the Alba Botanica®, Avalon Organics®, Earth’s Best®, JASON®, Live Clean® and Queen Helene® brands.
The Company sells its products through specialty and natural food distributors, supermarkets, natural foods stores, mass-market and e-commerce retailers, food service channels and club, drug and convenience stores in over 80 countries worldwide.
Our business strategy is to integrate our brands under one management team and employ uniform marketing, sales and distribution programs when attainable. We believe that by integrating our various brands, we will continue to achieve economies of scale and enhanced market penetration. We seek to capitalize on the equity of our brands and the distribution achieved through each of our acquired businesses with strategic introductions of new products that complement existing lines to enhance revenues and margins.
Project Terra
During fiscal year 2016, the Company commenced a strategic review, which it called “Project Terra,” that resulted in the Company redefining its core platforms starting with the United States segment for future growth based upon consumer trends to create and inspire A Healthier Way of Life™. The core platforms are defined by common consumer need, route-to-market or internal advantage and are aligned with the Company’s strategic roadmap to continue its leadership position in the organic and natural, better-for-you products industry. Beginning in fiscal year 2017, those core platforms within our United States segment are:
• | Better-for-You-Baby, which includes infant foods, infant formula, toddler and kids foods, diapers and wipe products that nurture and care for babies and toddlers, under the Earth’s Best® and Ella’s Kitchen® brands. |
• | Better-for-You-Pantry, which includes core consumer staples, such as Maranatha®, Arrowhead Mills®, Imagine® and Spectrum Organics® brands. |
• | Better-for-You-Snacking, which includes wholesome products for in-between meals, such as Terra®, Sensible Portions® and Garden of Eatin’® brands. |
• | Fresh Living, which includes yogurt, plant-based proteins and other refrigerated products, such as The Greek Gods® yogurt and Dream™ plant-based beverage brands. |
• | Pure Personal Care, which includes personal care products focused on providing consumers with cleaner and gentler ingredients, such as JASON®, Avalon Organics® and Alba Botanica® brands. |
• | Tea, which includes tea products marketed under the Celestial Seasonings® brand. |
In addition, beginning in fiscal 2017, the Company launched Cultivate Ventures (“Cultivate”), a venture unit with a threefold purpose: (i) to strategically invest in the Company’s smaller brands in high potential categories such as BluePrint® cold-pressed juices, SunSpire® chocolates and DeBoles® pasta by giving these products a dedicated, creative focus for refresh and relaunch; (ii) to incubate small acquisitions until they reach the scale required to migrate to the Company’s core platforms; and (iii) to invest in concepts, products and technology that focus on health and wellness.
5
Effective July 1, 2016, due to changes to the Company’s internal management and reporting structure resulting from the formation of Cultivate, certain brands previously included within the United States operating segment will be moved to a new operating segment called Cultivate. As a result, the Company will be managed in eight operating segments: the United States (excluding Cultivate), United Kingdom, Tilda Limited (“Tilda”), Hain Pure Protein Corporation (“HPPC”), EK Holdings, Inc. (“Empire”), Canada, Europe and Cultivate. The United States, excluding Cultivate, will be its own reportable segment. Cultivate will be combined with Canada and Europe and reported within the “Rest of World” reportable segment, as they do not currently meet the quantitative thresholds for segment reporting. There will be no changes to the United Kingdom and Hain Pure Protein reportable segments.
Another key initiative from Project Terra was the identification of global cost savings expected over the next three fiscal years, a portion of which the Company intends to reinvest into its brands. Additionally, the Company identified certain brands for divestment, which no longer fit into its core strategy for future growth. The disposal of these brands does not represent a strategic shift and is not expected to have a major effect on the Company's operations or financial results, as defined by ASC 205-20, Discontinued Operations; as a result, the disposals do not meet the criteria to be classified as discontinued operations.
Finally, in connection with Project Terra, the Company, with the assistance of outside consultants, engaged in an evaluation of its trade investment in the United States segment. Based on this assessment, the Company determined that its trade investment could be utilized more effectively, and therefore, beginning in fiscal 2017, the Company developed plans to shift from a model of investing in trade at the non-consumer facing level to more consumer facing activities.
Acquisitions and Investments
We have acquired numerous companies and brands since our formation and intend to seek future growth through internal expansion as well as the acquisition of complementary brands. We consider the acquisition of organic, natural and “better-for-you” product companies or product lines to be a part of our business strategy. During fiscal 2016, we acquired Orchard House Foods Limited (“Orchard House”), a leader in pre-cut fresh fruit, juices, fruit desserts and ingredients in the United Kingdom, and Formatio Beratungs- und Beteiligungs GmbH and its subsidiaries (“Mona”), a leader in plant-based foods and beverages under the Joya® brand with facilities in Germany and Austria. See Note 5, Acquisitions, in the Notes to Consolidated Financial Statements included in Item 8 of this Form 10-K.
During fiscal year 2016, we acquired a 14.9% interest in Chop’t Creative Salad Company LLC (“Chop’t”). Chop’t develops and operates fast-casual, fresh salad restaurants in the Northeast and Mid-Atlantic United States. See Note 14, Investments and Joint Ventures, in the Notes to Consolidated Financial Statements included in Item 8 of this Form 10-K.
Headcount
As of June 30, 2016, we employed a total of 7,700 full-time employees. Of these employees, 259 were in sales, and 5,952 were in production, with the remaining 1,489 employees in management, finance, marketing, operations, legal and clerical positions.
Products
During fiscal 2016, we primarily sold our organic, natural, and “better-for-you” products in the following categories: grocery; poultry/protein; snacks; personal care; and tea. We continuously evaluate our existing products for quality, taste, nutritional value and cost and make improvements where possible. We discontinue products or stock keeping units (“SKUs”) when sales of those items do not warrant further production. Our product categories consist of the following:
Grocery
Grocery products include infant formula, infant, toddler and kids foods, diapers and wipes, rice and grain-based products, plant-based beverages and frozen desserts (such as soy, rice, oat, almond and coconut), flour and baking mixes, breads, hot and cold cereals, pasta, condiments, cooking and culinary oils, granolas, cereal bars, canned, chilled fresh, aseptic and instant soups, Greek-style yogurts, chilis, packaged grains, chocolate, nut butters, juices including cold-pressed juice, hot-eating, chilled and frozen desserts, cookies, crackers, frozen pastas and ethnic meals, frozen fruit and vegetables, pre-cut fresh fruit, refrigerated and frozen plant-based meat-alternative products, tofu, seitan and tempeh products, jams, fruit spreads, jelly, honey, marmalade products as well as other food products. Grocery products accounted for approximately 62% of our consolidated net sales in 2016, 66% in 2015 and 78% in 2014.
6
Poultry/Protein
Our poultry and protein products are manufactured and marketed as antibiotic-free or organic, vegetarian fed and humanely raised. We manufacture and market kosher products under the Empire® and Kosher Valley® brands. A full range of turkey and chicken products are offered for fresh meat, deli, prepared and frozen foods. Poultry products accounted for approximately 17% of our consolidated net sales in 2016 and 13% in 2015. There were no sales of poultry and protein products included in our consolidated net sales for 2014 as the businesses in this product category were accounted for under either the equity method or cost method of accounting prior to fiscal 2015.
Snacks
Our snack products include a variety of potato, root vegetable and other exotic vegetable chips, straws, tortilla chips, whole grain
chips, pita chips, puffs and popcorn. Snack products accounted for approximately 11% of our consolidated net sales in 2016 and 2015 and 12% in 2014.
Personal Care
Our personal care products cover a variety of personal care categories including skin, hair and oral care, deodorants, baby care items, body washes, sunscreens and lotions. Personal care products accounted for approximately 6% of our consolidated net sales in 2016, 5% in 2015 and 4% in 2014.
Tea
Under the Celestial Seasonings® brand, we currently offer more than 70 varieties of herbal, green, black, wellness, rooibos and chai tea. Tea products accounted for approximately 4% of our consolidated net sales in 2016, 5% in 2015 and 6% in 2014.
Seasonality
Certain of our product lines have seasonal fluctuations. Hot tea, baking products, hot cereal, hot-eating desserts and soup sales are stronger in colder months, while sales of snack foods, sunscreen and certain of our prepared food and personal care products are stronger in the warmer months. Additionally, due to the nature of our acquisitions of HPPC, Empire and Tilda businesses, our net sales and earnings may further fluctuate based on the timing of holidays throughout the year. As such, our results of operations and our cash flows for any particular quarter are not indicative of the results we expect for the full year, and our historical seasonality may not be indicative of future quarterly results of operations. In recent years, net sales and diluted earnings per share in the first fiscal quarter have typically been the lowest of our four quarters.
Working Capital
For information relating to our cash flows from operations and working capital items, see “Management’s Discussion and Analysis of Financial Condition and Results of Operations” in Item 7 of this Form 10-K.
Capital Expenditures
During fiscal 2016, our aggregate capital expenditures were $77.3 million. We expect to spend approximately $70.0 million for capital projects in fiscal 2017.
Segments
We principally manage our business by geography in seven operating segments: the United States, United Kingdom, Tilda, Hain Pure Protein Corporation, Empire Kosher Poultry, Canada and Europe. In addition, we have four reportable segments: United States, United Kingdom, Hain Pure Protein and Rest of World. We have aggregated (based on economic similarities, the nature of their products, end-user markets and methods of distribution) the operating segments of the United Kingdom and Tilda into the United Kingdom reportable segment and the operating segments of Hain Pure Protein Corporation and Empire Kosher Poultry into the Hain Pure Protein reportable segment. Additionally, Canada and Europe do not currently meet the quantitative thresholds for segment reporting and are therefore combined and reported as “Rest of World.”
Each segment includes the results of operations attributable to its geographic location except that the United States segment includes the results of operations of the Ella’s Kitchen brand, which primarily conducts business in the United States and United Kingdom. The products included in the Hain Pure Protein segment are sold in the United States.
7
We use segment net sales and operating income to evaluate segment performance and to allocate resources. We believe this measure is most relevant in order to analyze segment results and trends. Segment operating income excludes certain general corporate expenses (which are a component of selling, general and administrative expenses), impairment and acquisition related expenses, restructuring and integration charges.
The following table presents the Company’s net sales by reportable segment for the fiscal years ended June 30, 2016, 2015, and 2014 (in thousands):
Fiscal Year ended June 30, | |||||||||||||||||
2016 | 2015 (Revised) | 2014 (Revised) | |||||||||||||||
United States | $ | 1,321,547 | 46 | % | $ | 1,325,996 | 51 | % | $ | 1,247,113 | 59 | % | |||||
United Kingdom (a) | 774,877 | 27 | % | 722,830 | 28 | % | 628,828 | 30 | % | ||||||||
Hain Pure Protein | 492,510 | 17 | % | 337,197 | 13 | % | — | — | |||||||||
Rest of World (a) | 296,440 | 10 | % | 223,590 | 8 | % | 231,881 | 11 | % | ||||||||
Total | $ | 2,885,374 | 100 | % | $ | 2,609,613 | 100 | % | $ | 2,107,822 | 100 | % | |||||
(a) | Net sales for the United Kingdom segment for fiscal 2016 and 2015 include sales of plant-based beverages in the United Kingdom that were previously reported in the Rest of World segment due to a change in the responsibilities for this business. |
See Note 1, Description of Business and Basis of Presentation, and Note 18, Segment Information, in the Notes to Consolidated Financial Statements included in Item 8 of this Form 10-K for additional information about our segments.
United States Segment:
Our products are sold throughout the United States. Our customer base consists principally of specialty and natural food distributors, supermarkets, natural food stores, mass-market and e-commerce retailers, food service channels and club, drug and convenience stores. Our products are sold through a combination of direct sales people, brokers and distributors. We believe that our direct sales people combined with brokers and distributors provide an effective means of reaching a broad and diverse customer base. Food brokers act as agents for us within designated territories, usually on a non-exclusive basis, and receive commissions. A portion of our direct sales force is organized into dedicated teams to serve our significant customers. Additionally, commencing in fiscal 2015, we began outsourcing our natural channel merchandising function.
A significant portion of the products marketed by us are sold through independent food distributors. Food distributors purchase products from us for resale to retailers.
The brands sold by the United States segment by category are:
Grocery
Our grocery products include Almond Dream®, Coconut Dream®, Rice Dream®, and Soy Dream®, Arrowhead Mills® flours, mixes and cereals, BluePrint® cold-pressed juice drinks, DeBoles® pasta, DreamTM non-dairy yogurt, Earth’s Best® infant formula, infant, toddler and kids foods, diapers and wipes, Ella’s Kitchen® infant, toddler and kids foods, Ethnic Gourmet® frozen meals, Hain Pure Foods® condiments, Health Valley® cereal, cereal bars and soups, Imagine® soups, stocks and gravies, MaraNatha® nut butters, Rudi’s Gluten-Free Bakery and Rudi’s Organic Bakery® breads, buns, bagels, tortillas and other related items, Spectrum® culinary oils, Spectrum Essentials® nutritional oils, SunSpire® chocolates, The Greek Gods® Greek-style yogurt and kefir, Walnut Acres® juice drinks and pasta sauces, Westbrae® vegetarian products, WestSoy® plant-based beverages, brand tofu, seitan and tempeh products, and Yves Veggie Cuisine® plant-based products.
Snacks
Our snack food products include Terra® varieties of root vegetable chips, potato chips and other exotic vegetable chips, Garden
of Eatin’® tortilla chip products, Sensible Portions® snack products including Garden Veggie Straws®, and Garden Veggie Chips, Apple Straws and Pita Bites®, Boston’s® popcorn and Bearitos® and other snacks.
8
Tea
Our tea products are marketed under the Celestial Seasonings® brand and include more than 70 varieties of herbal, green, black, wellness, rooibos and chai tea lattes, with well-known names and products such as Sleepytime®, Lemon Zinger®, Red Zinger®, Cinnamon Apple Spice, Bengal Spice® and Country Peach Passion®. We offer a selection of Celestial Seasonings® teas in K-Cup® portion packs for the Keurig® Single-Cup Brewing system (K-Cup® and Keurig® are registered trademarks of Keurig Green Mountain, Inc.).
Personal Care:
Our personal care products include skin, hair and oral care, deodorants and baby care items under the Alba Botanica®, Avalon Organics®, Earth’s Best®, JASON®, Live Clean® and Queen Helene® brands.
United Kingdom Segment:
In the United Kingdom, our products include frozen and chilled products, including but not limited to soups, fruits and juices, as well as jams, fruit spreads, jellies, honey, marmalades, nut butters, and plant-based products and premium rice and grain-based products.
The brands sold by our United Kingdom segment include New Covent Garden Soup Co.® chilled soups, Farmhouse Fare® and Lovetub® hot-eating desserts, Johnson’s Juice Co.® juices, Linda McCartney’s® chilled and frozen plant-based meals, Cully & Sully® chilled soups and ready meals, Hartley’s® jams, fruit spreads and jellies, Sun-Pat® nut butters, Gale’s® honey, Robertson’s® and Frank Cooper’s® marmalades and Tilda® rice and grain-based products. We also provide a comprehensive range of private label and retailer own-label products to many retailers, convenience stores and foodservice providers in the following categories: fresh soup, pre-cut fresh fruit, juice, smoothies, chilled and frozen desserts, meat-free meals and ambient grocery products.
Our products are principally sold throughout the United Kingdom, Ireland and other parts of the world. Our customer base consists principally of retailers, convenience stores, foodservice providers, business to business, natural food and ethnic specialty distributors, club stores and wholesalers.
Hain Pure Protein Segment:
Our Hain Pure Protein segment includes a full range of antibiotic-free, hormone-free and organic poultry products, including whole birds, fresh tray packs, frozen, deli, fully cooked and gluten-free products sold under the FreeBird®, Plainville Farms®, Empire® and Kosher Valley® brands. A range of private label and ingredient products are also provided to many customers.
Our products are sold in the United States through a combination of direct sales people, brokers and distributors. Our customer base consists principally of grocery and natural food retailers and certain club stores, as well as food service outlets including fast casual and white tablecloth venues, which feature food that is grown sustainably and without genetically modified organisms.
Rest of World Segment (Canada):
Our products are sold throughout Canada. Our customer base consists principally of grocery supermarkets, mass merchandisers, club stores, natural food distributors, personal care distributors, drug store chains and foodservice distributors. Our products are sold through our own retail direct sales force. We also utilize third-party brokers who receive commissions and sell to foodservice and club customers. We utilize a third party merchandising team for retail execution. As in the United States, a portion of the products marketed by us are sold through independent distributors.
Our major brands sold in Canada by category are:
9
Grocery
Our grocery products include Yves Veggie Cuisine® refrigerated and frozen meat-alternative products, vegetables and lentils, Europe’s Best® frozen fruits and vegetables, Earth’s Best® infant and toddler food, Casbah® packaged grains, MaraNatha® nut butters, Spectrum Essentials® cooking and culinary oils, Imagine® aseptic soups, Arrowhead Mills® pasta, Health Valley® cereal, cereal bars and canned soups, The Greek Gods® Greek-style yogurt, Robertson’s® marmalades, BluePrint® cold-pressed juice drinks and Tilda® rice and grain-based products. Our plant-based beverages include Rice Dream®, Soy Dream®, Oat Dream®, Coconut Dream® and Almond Dream®, Rice Dream® and Coconut Dream® in refrigerated format and Rice Dream® and Almond Dream® plant-based frozen desserts.
Tea
Our tea products are marketed under the Celestial Seasonings® brand and include more than 30 varieties of herbal and wellness teas, with familiar names like Sleepytime®, Lemon Zinger® and Cinnamon Apple Spice.
Snacks
Our snack food products consist of Terra® varieties of root vegetable chips and other exotic vegetable chips, Garden of Eatin’® tortilla chips and Sensible Portions® Garden Veggie Straws® and Pita Bites®.
Personal Care
Our personal care products include skin, hair and oral care, deodorants and baby care items under the Avalon Organics®, Alba
Botanica®, JASON® and Live Clean® brands.
Rest of World Segment (Europe):
Our products sold by the Europe segment include Danival®, Dream®, Joya®, Lima® and Natumi®. The Danival® brand includes organic cooked vegetables, prepared meals, sauces, fruit spreads and desserts. The Lima® brand includes a wide range of organic products such as soy sauce, plant-based beverages and grain cakes, as well as grains, pasta, cereals, miso, snacks, sweeteners, spreads, soups and condiments. Natumi® and Dream® produce and sell plant-based beverages, including rice, soy, oat and spelt. Our Joya® brand includes soy, oat, rice and nut-based drinks as well as plant-based yogurts, desserts, creamers, tofu and private label products. We also sell our Hartley’s® jams, fruit spreads and jellies, Terra® varieties of root vegetable and potato chips, and Celestial Seasonings® teas and Tilda® dry rice and ready-to-heat products in Europe as well.
Our products are sold in grocery stores and organic food stores throughout Europe. Our products are sold using our own direct sales force and local distributors.
Customers
Two of our customers accounted for 10% or more of our consolidated net sales in each of the last three fiscal years, respectively. United Natural Foods, Inc., a distributor, accounted for approximately 10%, 11% and 13% of our consolidated net sales for the fiscal years ended June 30, 2016, 2015, and 2014, respectively, which were primarily related to the United States segment. Likewise, Wal-Mart Stores, Inc. and its affiliates; Sam’s Club and ASDA, together accounted for approximately 10%, 10% and 11% of our consolidated net sales for the fiscal years ended June 30, 2016, 2015 and 2014, respectively, which were primarily related to the United States and United Kingdom segments. No other customer accounted for more than 10% of our net sales in the past three fiscal years.
Foreign Operations
We sell our products to customers in more than 80 countries. International sales represented approximately 40%, 39% and 44%
of our consolidated net sales in fiscal 2016, 2015 and 2014, respectively.
10
Marketing
We use a combination of trade and consumer promotions to market our products. We use trade advertising and promotion, including placement fees, cooperative advertising and feature advertising in distribution catalogs. Consumer advertising and sales promotions are also made via social media and trial use programs. We utilize in-store product demonstrations and sampling in the club store channel. Our investments in consumer spending are aimed at enhancing brand equity and increasing consumption. These consumer spending categories include, but are not limited to, coupons, direct mailing, e-consumer relationship programs and other forms of promotions. Additionally, we maintain separate websites and social media pages for many of our brands featuring product information regarding the particular brand.
We also utilize sponsorship programs to help create brand awareness. In the United States, our Earth’s Best® brand has an agreement
with PBS Kids and Sesame Workshop, and our Terra Blues® are the official snack of JetBlue Airways. Terra® chips and Sensible Portions® snacks are Official Partners of the New York Knicks along with other Hain Celestial brands featured at Madison Square Garden. In addition, Sensible Portions® products, Yves Veggie Cuisine® plant-based burgers and Terra® chips are advertised and sold at Citi Field. There is no guarantee that these promotional investments are or will be successful.
New Product Initiatives Through Research and Development
Innovation, including new product development, is a key component of our growth strategy. We continuously seek to understand our consumers and develop products that address their desire for organic, natural and better-for-you alternatives to conventional packaged foods and personal care products. We have a demonstrated track record of extending our product offerings into other product categories. A team of professional product developers, including microbiologists, nutritionists, food scientists, chefs and chemists, work to develop products to meet changing consumer needs. Our research and development staff incorporates product ideas from all areas of our business in order to formulate new products. In addition to developing new products, the research and development staff routinely reformulates and improves existing products based on advances in ingredients, packaging and technology. We incurred approximately $11.4 million in company-sponsored research and development activities, consisting primarily of personnel related costs, in 2016, $10.3 million in 2015 and $10.0 million in 2014. In addition to our company-sponsored research and development activities, in order to quickly and economically introduce our new products to market, we may partner with contract manufacturers that make our products according to our formulas or other specifications. The Company also partners with certain customers from time-to-time on exclusive customer initiatives. The Company’s research and development expenditures do not include the expenditures on such activities undertaken by co-packers and suppliers who develop numerous products on behalf of the Company and on their own initiative with the expectation that the Company will accept their new product ideas and market them under the Company’s brands.
Production
Manufacturing
During 2016, 2015 and 2014, approximately 65%, 61% and 57%, respectively, of our revenue was derived from products manufactured at our own facilities.
Our United States segment operates the following manufacturing facilities:
• | Boulder, Colorado, (four facilities) which produce Celestial Seasonings® specialty teas, Celestial Seasonings® Kombucha, WestSoy® fresh tofu, seitan and tempeh products, and Rudi’s Organic Bakery® organic breads, buns, bagels, tortillas, wraps and soft pretzels and Rudi’s Gluten-Free Bakery gluten-free products including breads, buns, pizza crusts, tortillas, snack bars and stuffing; |
• | Moonachie, New Jersey, which produces Terra® root vegetable and potato chips; |
• | Mountville, Pennsylvania, which produces Sensible Portions® snack products; |
• | Hereford, Texas, which produces Arrowhead Mills® cereals, flours and baking ingredients; |
• | Shreveport, Louisiana, which produces DeBoles® organic and gluten-free pastas; |
• | West Chester, Pennsylvania, which produces Earth’s Best® and Ella’s Kitchen® pouches, BluePrint® cold-pressed juice drinks, and Ethnic Gourmet® frozen meals; |
• | Ashland, Oregon, which produces MaraNatha® nut butters; and |
• | Culver City, California, which produces Alba Botanica®, Avalon Organics®, JASON®, Earth’s Best® and Live Clean® personal care products; |
11
Our United Kingdom segment operates the following manufacturing facilities:
• | Histon, England, which produces our ambient grocery products including Hartley’s®, Frank Cooper’s®, Robertson’s® and Gale’s®; |
• | Rainham, England, (two facilities) which produce our classic and ready-to-heat Tilda® rice and grain-based products; |
• | Grimsby, England, which produces our New Covent Garden Soup Co.® and Cully & Sully® chilled soups; |
• | Peterborough, England, which also produces New Covent Garden Soup Co.® chilled soups; |
• | Clitheroe, England, which produces our Farmhouse Fare® hot-eating desserts; |
• | Leeds, England, which prepares our fresh fruit products; |
• | Fakenham, England, which produces Linda McCartney’s® meat-free frozen foods, as well as chilled dessert products; |
• | Corby, England, (two facilities) which produces drinks and desserts and prepares fresh cut fruit; |
• | Gateshead, England, which also prepares fresh cut fruit; and |
• | Larvik, Norway, which produces our GG UniqueFiberTM products. |
Our Hain Pure Protein segment operates the following manufacturing facilities:
• | Mifflintown, Pennsylvania, which produces Empire® and Kosher Valley® poultry products; |
• | New Oxford, Pennsylvania, which produces Plainville Farms® poultry products; |
• | Fredericksburg, Pennsylvania (two facilities), which produces FreeBird® poultry products; and |
• | Liverpool, New York, which produces prepared poultry and related products. |
Our Rest of World segment operates the following manufacturing facilities:
• | Vancouver, British Columbia, which produces Yves Veggie Cuisine® plant-based products; |
• | Mississauga, Ontario, which produces our Live Clean® and other personal care products; |
• | Troisdorf, Germany, which produces Natumi®, Rice Dream®, Lima® and other plant-based beverages; |
• | Andiran, France, which produces our Danival® organic food products; |
• | Oberwart, Austria, which produces our Joya® plant-based foods and beverages; and |
• | Schwerin, Germany, which also produces our Joya® plant-based foods and beverages. |
See “Item 2: Properties” of this Form 10-K for more information on the manufacturing facilities that we own.
Co-Packers
In addition to the products manufactured in our own facilities, independent third-party manufacturers, who are referred to in our industry as “co-packers,” manufacture many of our products. In general, utilizing co-packers provides us with the flexibility to produce a large variety of products and the ability to enter new categories quickly and economically. Our contract manufacturers have been selected based on their production capabilities and their specific product category expertise, and we expect to continue to partner with them to improve and expand our product offerings. During 2016, 2015 and 2014, approximately 35%, 39% and 43%, respectively, of our revenue was derived from products manufactured by co-packers. Our co-packers are audited for quality assurance purposes and compliance with Good Manufacturing Practices. Additionally, the co-packers are required to ensure our products are manufactured in accordance with our quality and safety specifications and that they are compliant with all relevant regulations.
Suppliers of Ingredients and Packaging
Agricultural commodities and ingredients, including almonds, corn, dairy, fruit and vegetables, oils, rice, soybeans and wheat, are the principal inputs used in our products. Our certified organic and natural raw materials as well as our packaging materials are obtained from various suppliers around the world. The Company works with its suppliers to ensure the quality and safety of their ingredients and that such ingredients meet our specifications and comply with applicable regulations. These assurances are supported by our purchasing contracts, supplier expectations manual and quality assurance specification packets, including affidavits, certificates of analysis and analytical testing, where required. Our purchasers and quality team visit major suppliers around the world to procure competitively priced, quality ingredients that meet our specifications.
We maintain long-term relationships with many of our suppliers. Purchase arrangements with ingredient suppliers are generally made annually. Purchases are made through purchase orders or contracts, and price, delivery terms and product specifications vary.
12
Competition
We operate in a highly competitive environment. Our products compete with both large mainstream conventional packaged foods companies and natural and organic packaged foods companies. Many of these competitors enjoy significantly greater resources. Large mainstream conventional packaged foods competitors include Campbell Soup Company, Mondelez International, Inc., General Mills, Inc., Groupe Danone, The J.M. Smucker Company, Kellogg Company, The Kraft Heinz Company, Nestle S.A., PepsiCo, Inc. and Unilever PLC, and conventional personal care products companies, including but not limited to The Proctor & Gamble Company, Johnson & Johnson and Colgate-Palmolive Company. Certain of these large mainstream conventional packaged foods and personal care companies compete with us by selling both conventional products and natural and/or organic products. Natural and organic packaged foods competitors include Chobani LLC, Nature’s Bounty Inc., Clif Bar & Company and Amy’s Kitchen. In addition to these competitors, in each of our categories we compete with many regional and small, local niche brands. Given limited retailer shelf space and merchandising events, competitors actively support their respective brands with marketing, advertising and promotional spending. In addition, most retailers market similar items under their own private label, which compete for the same shelf space.
Competitive factors in the packaged foods industry include product quality and taste, brand awareness and loyalty, product variety, interesting or unique product names, product packaging and package design, shelf space, reputation, price, advertising, promotion and nutritional claims. We believe that we currently compete effectively with respect to each of these factors.
Trademarks
We believe that brand awareness is a significant component in a consumer’s decision to purchase one product over another in highly competitive consumer products industries. Our trademarks and brand names for the product lines referred to herein are registered in the United States, Canada, the United Kingdom and European Union and a number of other foreign countries, and we intend to keep these filings current and seek protection for new trademarks to the extent consistent with business needs. We also copyright certain of our artwork and package designs. We own the trademarks for our principal products, including Alba Botanica®, Arrowhead Mills®, Avalon Organics®, Bearitos®, BluePrint®, Casbah®, Celestial Seasonings®, Coconut Dream®, Cully & Sully®, Danival®, DeBoles®, Earth’s Best®, Earth’s Best TenderCare®, Ella’s Kitchen®, Empire®, Ethnic Gourmet®, Farmhouse Fare®, Frank Cooper’s®, FreeBird®, Gale’s®, Garden of Eatin’®, Hain Pure Foods®, Hartley’s®, Health Valley®, Imagine®, JASON®, Johnson’s Juice Co.®, Joya®, Kosher Valley®, Lima®, Live Clean®, MaraNatha®, Natumi®, New Covent Garden Soup Co.®, Nile Spice®, Plainville Farms®, Queen Helene®, Rice Dream®, Robertson’s®, Rosetto®, Rudi’s Organic Bakery®, Sensible Portions®, Soy Dream®, Spectrum Organics®, Sun-Pat®, SunSpire®, Terra®, The Greek Gods®, Tilda®, Walnut Acres Organic®, Westbrae®, WestSoy® and Yves Veggie Cuisine®. We also have trademarks for many of our best-selling Celestial Seasonings teas, including Country Peach Passion®, Lemon Zinger®, Mandarin Orange Spice®, Raspberry Zinger®, Red Zinger®, Sleepytime®, Tension Tamer® and Wild Berry Zinger®.
We also market products under brands licensed under trademark license agreements, including Linda McCartney’s®, the Sesame Street name and logo and other Sesame Workshop intellectual property on certain of our Earth’s Best® products, Cadbury® and Rose’s® brands.
Government Regulation
We are subject to extensive regulations in the United States by federal, state and local government authorities. In the United States, the federal agencies governing the manufacture, marketing and distribution of our products include, among others, the Federal Trade Commission (“FTC”), the United States Food & Drug Administration (“FDA”), the United States Department of Agriculture (“USDA”), the United States Environmental Protection Agency (“EPA”) and the Occupational Safety and Health Administration (“OSHA”). Under various statutes, these agencies prescribe and establish, among other things, the requirements and standards for quality, safety and representation of our products to the consumer in labeling and advertising.
Internationally, we are subject to the laws and regulatory authorities of the foreign jurisdictions in which we manufacture and sell our products, including the Food Standards Agency in the United Kingdom, the Canadian Food Inspection Agency in Canada and European Food Safety Authority which supports the European Commission, as well as individual country, province, state and local regulations.
Quality Control
We utilize a comprehensive food safety and quality management program, which employs strict manufacturing procedures, expert technical knowledge on food safety science, employee training, ongoing process innovation, use of quality ingredients and both internal and independent auditing.
13
In the United States, each of our own manufacturing facilities has a Food Safety Plan (“FSP”), which focuses on preventing food safety risks and is compliant with the requirements set forth under the Food Safety and Modernization Act (“FSMA”). In addition, each facility has at least one preventive controls qualified individual who has successfully completed training in the development and application of risk-based preventive controls at least equivalent to that received under a standardized curriculum recognized by the FDA.
A significant number of our co-packers are certified against a standard recognized by the Global Food Safety Initiative (“GFSI”) including SQF (Safe Quality Foods) and BRC (British Retail Consortium). These standards are integrated food safety and quality management protocols designed specifically for the food sector and offer a comprehensive methodology to manage food safety and quality. Certification provides an independent and external validation that a product, process or service complies with applicable regulations and standards.
In addition to third-party inspections of our co-packers, we have instituted audits to address topics such as allergen control; ingredient, packaging and product specifications; and sanitation. Under FSMA, each of our contract manufacturers is required to have a food safety plan or a hazard analysis critical control points plan that identifies critical pathways for contaminants and mandates control measures that must be used to prevent, eliminate or reduce relevant food-borne hazards.
Independent Certification
In the United States, our organic products are certified in accordance with the USDA’s National Organic Program through Quality Assurance International (“QAI”), a third party certifying agency. For products marketed as organic outside of the United States, we use accredited certifying agencies to ensure compliance with country-specific government regulations for selling organic products or reciprocity, where available.
The majority of our products are certified kosher under the supervision of accredited agencies including The Union of Orthodox Jewish Congregations, The Organized Kashruth Laboratories, The K’hal Adath Jeshurun, “KOF-K” Kosher Supervision, Star K Kosher Certification and Circle K.
We also work with other non-governmental organizations such as NSF International, which developed the NSF/ANSI 305 Standard for Personal Care Products Containing Organic Ingredients and provides third party certification through QAI for our personal care products in the absence of an established government regulation for these products. In addition, we work with other nongovernmental organizations such as the Gluten Free Intolerance Group, Whole Grain Council and the Non-GMO Project.
We are working with GFSI to certify all of our company-owned manufacturing facilities under accredited programs, including SQF (Safe Quality Foods), BRC (British Retail Consortium) and ISO (International Organization for Standardization).
We are also working with accredited Certification Bodies to certify all of our company-owned manufacturing facilities against the GFSI-recognized scheme of SQF. Of the 11 Hain owned facilities in North America, nine are SQF Level-III (the highest level) and two are SQF Level II.
Available Information
The following information can be found, free of charge, in the “Investor Relations” section of our corporate website at http://www.hain.com:
• | our annual report on Form 10-K, quarterly reports on Form 10-Q, current reports on Form 8-K, and all amendments to those reports as soon as reasonably practicable after such material is electronically filed with or furnished to the Securities and Exchange Commission (“SEC”); |
• | our policies related to corporate governance, including our Code of Business Conduct and Ethics (“Code of Ethics”) applying to our directors, officers and employees (including our principal executive officer and principal financial and accounting officers) that we have adopted to meet the requirements set forth in the rules and regulations of the SEC and Nasdaq; and |
• | the charters of the Audit, Compensation and Corporate Governance and Nominating Committees of our Board of Directors. |
In addition, copies of the Company’s annual report will be made available, free of charge, upon written request.
14
Item 1A. Risk Factors
Our business, operations and financial condition are subject to various risks and uncertainties. The most significant of these risks include those described below; however, there may be additional risks and uncertainties not presently known to us or that we currently consider immaterial. If any of the following risks and uncertainties develop into actual events, our business, financial condition or results of operations could be materially adversely affected. In such case, the trading price of our common stock could decline, and you may lose all or part of your investment. These risk factors should be read in conjunction with the other information in this Annual Report on Form 10-K and in the other documents that we file from time-to-time with the SEC.
Our markets are highly competitive.
We operate in highly competitive geographic and product markets. Numerous brands and products compete for limited retailer shelf space, where competition is based on product quality, brand recognition, brand loyalty, price, product innovation, promotional activity, availability and taste among other things. Retailers also market competitive products under their own private labels, which are generally sold at lower prices and compete with some of our products.
Some of our markets are dominated by multinational corporations with greater resources and more substantial operations than us. We may not be able to successfully compete for sales to distributors or retailers that purchase from larger competitors that have greater financial, managerial, sales and technical resources. Conventional food companies, including but not limited to Campbell Soup Company, Mondelez International, Inc., General Mills, Inc., Groupe Danone, The J.M. Smucker Company, Kellogg Company, The Kraft Heinz Company, Nestle S.A., PepsiCo, Inc. and Unilever PLC, and conventional personal care products companies, including but not limited to The Procter & Gamble Company, Johnson & Johnson and Colgate-Palmolive Company, may be able to use their resources and scale to respond to competitive pressures and changes in consumer preferences by introducing new products or reformulating their existing products, reducing prices or increasing promotional activities. We also compete with other organic and natural packaged food brands and companies, which may be more innovative and able to bring new products to market faster and better able to quickly exploit and serve niche markets. As a result of actual or perceived conflicts resulting from this competition, retailers may take actions that negatively affect us. Consequently, we may need to increase our marketing, advertising and promotional spending to protect our existing market share, which may result in an adverse impact on our profitability.
Consumer preferences for our products are difficult to predict and may change.
Our business is primarily focused on sales of organic, natural and “better-for-you” products which, if consumer demand for such categories were to decrease, could harm our business. While we continue to diversify our product offerings, developing new products entails risks, and demand for our products may not continue at current levels or increase in the future.
In addition, we have other product categories that are subject to evolving consumer preferences. Consumer demand could change based on a number of possible factors, including dietary habits and nutritional values, concerns regarding the health effects of ingredients and shifts in preference for various product attributes. A significant shift in consumer demand away from our products could reduce the sales of our brands or our market share, both of which could harm our business.
Consolidation of customers or the loss of a significant customer could negatively impact our sales and profitability.
Customers, such as supermarkets and food distributors in North America and the European Union, continue to consolidate. This consolidation has produced larger, more sophisticated organizations with increased negotiating and buying power that are able to resist price increases or demand increased promotional programs, as well as operate with lower inventories, decrease the number of brands that they carry and increase their emphasis on private label products, which could negatively impact our business. The consolidation of retail customers also increases the risk that a significant adverse impact on their business could have a corresponding material adverse impact on our business.
Two of our customers accounted for 10% or more of our consolidated net sales in each of the last three fiscal years, respectively. United Natural Foods, Inc., a distributor that redistributes products to natural foods supermarkets, independent natural retailers and other supermarkets and retailers, accounted for approximately 10%, 11% and 13% of our consolidated net sales for the fiscal years ended June 30, 2016, 2015, and 2014, respectively, which were primarily related to the United States segment. Likewise, Wal-Mart Stores, Inc. and its affiliates, Sam’s Club and ASDA, together accounted for approximately 10%, 10% and 11% of our consolidated net sales for the fiscal years ended June 30, 2016, 2015 and 2014, respectively, which were primarily related to the United States and United Kingdom segments. No other customer accounted for more than 10% of our net sales in the past three fiscal years.
15
The loss of any large customer, the reduction of purchasing levels or the cancellation of any business from a large customer for an extended length of time could negatively impact our sales and profitability.
We rely on independent distributors for a substantial portion of our sales.
In our United States segment, we rely upon sales made by or through a group of non-affiliated distributors to customers. Distributors purchase directly for their own account for resale. The loss of, or business disruption at, one or more of these distributors may harm our business. If we are required to obtain additional or alternative distribution agreements or arrangements in the future, we cannot be certain that we will be able to do so on satisfactory terms or in a timely manner. Our inability to enter into satisfactory distribution agreements may inhibit our ability to implement our business plan or to establish markets necessary to expand the distribution of our products successfully.
Our growth is dependent on our ability to introduce new products and improve existing products.
Our growth depends in part on our ability to generate and implement improvements to our existing products and to introduce new products to consumers. The success of our innovation and product improvement effort is affected by our ability to anticipate changes in consumers preferences, the level of funding that can be made available, the technical capability of our research and development staff in developing, formulating and testing product prototypes, including complying with governmental regulations, and the success of our management in introducing the resulting improvements in a timely manner. If we are unsuccessful in implementing product improvements or introducing new products that satisfy the demands of consumers, our business could be harmed.
Disruptions in the worldwide economy and the financial markets may adversely impact our business and results of operations.
Adverse and uncertain economic and market conditions, particularly in the locations in which we operate, may impact customer and consumer demand for our products and our ability to manage normal commercial relationships with our customers, suppliers and creditors. Consumers may shift purchases to lower-priced or other perceived value offerings during economic downturns, which may adversely affect our results of operations. Consumers may also reduce the number of organic and natural products that they purchase where there are conventional alternatives, given that organic and natural products generally have higher retail prices than do their conventional counterparts. In addition, consumers may choose to purchase private label products rather than branded products, which generally have lower retail prices than do their branded counterparts. Distributors and retailers may become more conservative in response to these conditions and seek to reduce their inventories. Our results of operations depend upon, among other things, our ability to maintain and increase sales volumes with existing customers, our ability to attract new customers, the financial condition of our customers and our ability to provide products that appeal to consumers at the right price.
Prolonged unfavorable economic conditions may have an adverse effect on any of these factors and, therefore, could adversely impact our sales and profitability.
We may be subject to significant liability should the consumption of any of our products cause illness or physical harm.
The sale of products for human use and consumption involves the risk of injury or illness to consumers. Such injuries may result from inadvertent mislabeling, tampering by unauthorized third parties or product contamination or spoilage. Under certain circumstances, we may be required to recall or withdraw products, suspend production of our products or cease operations, which may lead to a material adverse effect on our business. In addition, customers may cancel orders for such products as a result of such events. Even if a situation does not necessitate a recall or market withdrawal, product liability claims might be asserted against us. While we are subject to governmental inspection and regulations and believe our facilities and those of our co-packers and suppliers comply in all material respects with all applicable laws and regulations, if the consumption of any of our products causes, or is alleged to have caused, a health-related illness, we may become subject to claims or lawsuits relating to such matters. Even if a product liability claim is unsuccessful or is not fully pursued, the negative publicity surrounding any assertion that our products caused illness or physical harm, could adversely affect our reputation with existing and potential customers and consumers and our corporate and brand image. Moreover, claims or liabilities of this type might not be covered by our insurance or by any rights of indemnity or contribution that we may have against others. Although we maintain product liability and product insurance in an amount that we believe to be adequate, we cannot be sure that we will not incur claims or liabilities for which we are not insured or that exceed the amount of our insurance coverage. A product liability judgment against us or a product recall could have a material adverse effect on our business, consolidated financial condition, results of operations or liquidity.
16
Outbreaks of avian disease, such as avian influenza, or food-borne illnesses, could adversely affect our results of operations.
Demand for our poultry products can be adversely impacted by outbreaks of avian diseases, including avian influenza, or food-borne illnesses, such as E.coli or salmonella, which could have a significant impact on our financial results. We take reasonable precautions to ensure that our poultry flocks are healthy and that our processing plants and other facilities operate in a sanitary and environmentally sound manner. Nevertheless, outbreaks of diseases and food-borne illnesses, which may be beyond our control, could significantly affect demand for and the price of our poultry products, consumer perceptions of certain of our poultry products, the availability of poults for purchase by us and our ability to conduct our Hain Pure Protein segment. Moreover, an outbreak of disease could have a significant effect on the poults or poultry flocks we own by requiring us to, among other things, destroy any affected poults or poultry flocks.
Government investigations may require significant management time and attention, result in significant legal expenses or damages and cause our business, financial condition, results of operations and cash flows to suffer.
In August 2016, we voluntarily contacted the SEC to advise it of our delay in the filing of our periodic reports and the performance of the independent review conducted by the Company’s Audit Committee. We have continued to provide information to the SEC on an ongoing basis, including, among other things, the results of the independent review of the Audit Committee, as well as information in connection with the Company’s internal accounting review. On January 31, 2017, the SEC issued a subpoena to us seeking documents relevant to its investigation. We have cooperated with the SEC and expect to continue to do so. The amount of time needed to resolve this investigation is uncertain, and we cannot predict the outcome of this investigation or whether we will face additional government investigations, inquiries or other actions related to our accounting review, our delay in filing our periodic reports or otherwise. These matters could require us to expend significant management time and incur significant legal and other expenses and could result in civil and criminal actions seeking, among other things, injunctions against us and the payment of significant fines and penalties by us, which could have a material effect on our financial condition, business, results of operations and cash flow.
Lawsuits arising out of or related to the independent review of the Audit Committee, the Company’s internal accounting review and the delayed filing of our periodic reports could adversely affect the Company.
The matters which led to our Audit Committee’s independent review and our internal accounting review have exposed us to greater risks associated with litigation, regulatory proceedings and government enforcement actions. The Company, along with some of its officers and directors, have been named as parties to various lawsuits arising out of or related to these matters, and we cannot predict the outcome of this litigation. Furthermore, we and our officers and directors may, in the future, be subject to additional litigation relating to such matters. These lawsuits, and any other similar litigation that may be brought against us or our current or former officers and directors, could be time-consuming, result in significant expense and divert the attention and resources of our management and other key employees. Any unfavorable outcome could have a material adverse effect on our business, financial condition, results of operations and cash flows. Further, we could be required to pay damages or additional penalties or have other remedies imposed against us, or our current or former directors or officers, which could harm our reputation, business, financial condition, results of operations or cash flows.
Our potential indemnification obligations and limitations of our director and officer liability insurance could result in significant legal expenses or damages and cause our business, financial condition, results of operations and cash flows to suffer.
Both current and former officers and members of our Board of Directors, as individual defendants, are the subject of lawsuits related to the Company. Under Delaware law, our bylaws and certain indemnification agreements, we may have an obligation to indemnify both current and former officers and directors in relation to these matters. If the Company incurs significant uninsured indemnity obligations, our indemnity obligations could result in significant legal expenses or damages and cause our business, financial condition, results of operations and cash flow to suffer.
We have not been in compliance with the Nasdaq Global Select Stock Market’s requirements for continued listing and may continue to face compliance issues in the future. If we are unable to maintain compliance with applicable listing requirements, our common stock may be delisted from trading on the Nasdaq Global Select Stock Market, which could have a material adverse effect on us and our stockholders.
As a result of our inability to timely file this Form 10-K and our Q1 Form 10-Q, Q2 Form 10-Q and Q3 Form 10-Q, we have not been in compliance with the continued listing requirements of the Nasdaq Global Select Stock Market (“Nasdaq”) and were notified by Nasdaq that we would be subject to delisting unless we were able to regain compliance. Although we expect to regain compliance upon filing this Form 10-K and our Periodic Reports, our common stock may continue to be subject to delisting as a result of the Company’s inability to hold its Annual Meeting of Stockholders within the time period required under Nasdaq rules or if we are
17
unable to remain in compliance with the SEC’s reporting requirements. If our common stock is delisted, the market price of our common stock, the ability of our stockholders to trade our stock and our ability to raise capital could be materially adversely affected.
The delayed filing of some of our periodic SEC reports has made us currently ineligible to use a registration statement on
Form S-3 to register the offer and sale of securities, which could adversely affect our ability to raise future capital or complete acquisitions.
As a result of the delayed filing of some of our periodic reports with the SEC, we will not be eligible to register the offer and sale of our securities using a registration statement on Form S-3 until June 2018, at the earliest. Should we wish to register the offer and sale of our securities to the public prior to the time we are eligible to use Form S-3, both our transaction costs and the amount of time required to complete the transaction could increase, making it more difficult to execute any such transaction successfully and potentially harming our financial condition.
We have identified material weaknesses in our internal control over financial reporting. If we are unable to remediate these material weaknesses, or if we experience additional material weaknesses or deficiencies in the future or otherwise fail to maintain an effective system of internal controls, we may not be able to accurately or timely report our financial results, in which case our business may be harmed, investors may lose confidence in the accuracy and completeness of our financial reports and the price of our common stock may decline.
Our management is responsible for establishing and maintaining adequate internal control over financial reporting and for evaluating and reporting on our system of internal control. Our internal control over financial reporting is a process designed to provide reasonable assurance regarding the reliability of financial reporting and the preparation of financial statements for external purposes in accordance with U.S. GAAP. As a public company, we are required to comply with the Sarbanes-Oxley Act and other rules that govern public companies. In particular, we are required to certify our compliance with Section 404 of the Sarbanes-Oxley Act, which requires us to furnish annually a report by management on the effectiveness of our internal control over financial reporting. In addition, our independent registered public accounting firm is required to report on the effectiveness of our internal control over financial reporting.
In connection with our most recent year-end assessment of internal control over financial reporting, we identified material weaknesses in our internal control over financial reporting as of June 30, 2016. For a discussion of our internal control over financial reporting and a description of the identified material weaknesses, see Part II, Item 9A, “Controls and Procedures.”
As further described in Item 9A “Controls and Procedures - Management’s Report on Internal Control Over Financial Reporting and Remediation of the Material Weaknesses in Internal Control Over Financial Reporting,” we have undertaken steps to improve our internal control over financial reporting. We expect that we will need to improve existing operational and financial systems, procedures and controls, and implement new ones, to manage our future business effectively. However, we may not be successful in making the improvements necessary to remediate the material weaknesses identified by management or be able to do so in a timely manner, or be able to identify and remediate additional control deficiencies or material weaknesses in the future. Any implementation delays, or disruption in the transition to new or enhanced system, procedures or controls, could harm our ability to forecast sales, manage our supply chain and record and report financial and management information on a timely and accurate basis.
Pending and future litigation may lead us to incur significant costs.
We are, or may become, party to various lawsuits and claims arising in the normal course of business, which may include lawsuits or claims relating to contracts, intellectual property, product recalls, product liability, the marketing and labeling of products, employment matters, environmental matters or other aspects of our business as well as any securities class action and stockholder derivative litigation. Even when not merited, the defense of these lawsuits may divert our management’s attention, and we may incur significant expenses in defending these lawsuits. The results of litigation and other legal proceedings are inherently uncertain, and adverse judgments or settlements in some or all of these legal disputes may result in adverse monetary damages, penalties or injunctive relief against us, which could have a material adverse effect on our financial position, cash flows or results of operations. Any claims or litigation, even if fully indemnified or insured, could damage our reputation and make it more difficult to compete effectively or to obtain adequate insurance in the future.
Furthermore, while we maintain insurance for certain potential liabilities, such insurance does not cover all types and amounts of potential liabilities and is subject to various exclusions as well as caps on amounts recoverable. Even if we believe a claim is covered by insurance, insurers may dispute our entitlement to recovery for a variety of potential reasons, which may affect the timing and, if they prevail, the amount of our recovery.
18
Legal claims, government investigations or other regulatory enforcement actions could subject us to civil and criminal penalties.
We operate in a highly regulated environment with constantly evolving legal and regulatory frameworks. Consequently, we are subject to heightened risk of legal claims, government investigations or other regulatory enforcement actions. Although we have implemented policies and procedures designed to ensure compliance with existing laws and regulations, there can be no assurance that our employees, contractors, or agents will not violate our policies and procedures. Moreover, a failure to maintain effective control processes could lead to violations, unintentional or otherwise, of laws and regulations. Legal claims, government investigations or regulatory enforcement actions arising out of our failure or alleged failure to comply with applicable laws and regulations could subject us to civil and criminal penalties that could materially and adversely affect our product sales, reputation, financial condition, and operating results. In addition, the costs and other effects of defending potential and pending litigation and administrative actions against us may be difficult to determine and could adversely affect our financial condition and operating results.
Ineffective internal controls could impact the Company’s business and financial results.
Our internal control over financial reporting may not prevent or detect misstatements because of its inherent limitations, including the possibility of human error, the circumvention or overriding of controls or fraud. Even effective internal controls can provide only reasonable assurance with respect to the preparation and fair presentation of financial statements. If we fail to maintain adequate internal controls, including any failure to implement required new or improved controls, or if we experience difficulties in their implementation, we could fail to meet our financial reporting obligations and our business, financial results and reputation could be harmed.
We are dependent upon the services of our Chief Executive Officer and senior management team.
We are highly dependent upon the services of Irwin D. Simon, our Founder, Chairman of the Board, President and Chief Executive Officer. We believe Mr. Simon’s reputation as our Founder and his expertise and knowledge in the organic and natural products industry are critical factors in our continuing growth. His relationships with customers and suppliers are not easily found elsewhere in the organic and natural products industry. The loss of the services of Mr. Simon could harm our business.
Additionally, if we lose one or more members of our senior management team, our business, financial position, results of operations or cash flows could be harmed.
An impairment in the carrying value of goodwill or other acquired intangible assets could materially and adversely affect our consolidated results of operations and net worth.
As of June 30, 2016, we had goodwill of $1.06 billion and trademarks and other intangibles assets of $604.8 million, which represented 55% of our total consolidated assets. The net carrying value of goodwill represents the fair value of acquired businesses in excess of identifiable assets and liabilities as of the acquisition date (or subsequent impairment date, if applicable). The net carrying value of trademarks and other intangibles represents the fair value of trademarks, customer relationships and other acquired intangibles as of the acquisition date (or subsequent impairment date, if applicable), net of accumulated amortization. Goodwill and other acquired intangibles expected to contribute indefinitely to our cash flows are not amortized but must be evaluated by management at least annually for impairment. Amortized intangible assets are evaluated for impairment whenever events or changes in circumstances indicate that the carrying amounts of these assets may not be recoverable. For example, as noted in Note 8, Goodwill and Other Intangible Assets, in the Notes to the Consolidated Financial Statements in Item 8 of this Form 10-K, after completing its annual goodwill impairment analysis in the fourth quarter of fiscal 2016, the Company recognized a goodwill impairment charge of $84.5 million and an impairment charge of $39.7 million on certain of the Company’s tradenames in fiscal 2016. Impairments to goodwill and other intangible assets may be caused by factors outside our control, such as increasing competitive pricing pressures, changes in discount rates based on changes in cost of capital (interest rates, etc.), lower than expected sales and profit growth rates, changes in industry Earnings Before Interest Taxes Depreciation and Amortization (“EBITDA”) multiples, the inability to quickly replace lost co-manufacturing business, or the bankruptcy of a significant customer and could result in the incurrence of impairment charges and negatively impact our net worth and our consolidated earnings in the period of such charge.
19
Our acquisition strategy exposes us to risk, including our ability to integrate the brands that we acquire.
We intend to continue to grow our business in part through the acquisition of new brands, both in the United States and internationally. Our acquisition strategy is based on identifying and acquiring brands with products that complement our existing product mix and identifying and acquiring brands in new categories and in new geographies for purposes of expanding our business internationally. We may not be able to successfully identify suitable acquisition candidates, negotiate acquisitions of identified candidates on terms acceptable to us or integrate acquisitions that we complete.
We may encounter increased competition for acquisitions in the future, which could result in acquisition prices we do not consider acceptable. We are unable to predict whether or when any prospective acquisition candidate will become available or the likelihood that any acquisition will be completed. Furthermore, acquisition-related costs are required to be expensed as incurred even though the acquisition may not be completed.
The success of acquisitions we make will be dependent upon our ability to effectively integrate those brands, including our ability to realize potentially available marketing opportunities and cost savings, some of which may involve operational changes. Despite our due diligence investigation of each business that we acquire, there may be liabilities of the acquired companies that we fail to or are unable to discover during the diligence process and for which we, as a successor owner, may be responsible. We cannot be certain:
• | as to the timing or number of marketing opportunities or amount of cost savings that may be realized as the result of our integration of an acquired brand; |
• | that a business combination will enhance our competitive position and business prospects; |
• | that we will be successful if we enter categories or markets in which we have limited or no prior experience; |
• | that we will be able to coordinate a greater number of diverse businesses and businesses located in a greater number of geographic locations; |
• | that we will not experience difficulties with customers, personnel or other parties as a result of a business combination; |
• | that disputes with sellers will not arise; or |
• | that, with respect to our acquisitions outside the United States, we will not be affected by, among other things, exchange rate risk and risks associated with local regulatory regimes. |
Companies or brands acquired may not achieve the level of sales or profitability that justify the investment made. We may determine to discontinue products if, among other reasons, they do not meet our standards for quality or profitability or both, which may have a material adverse effect on sales relating to such acquisition.
We may not be successful in:
• | integrating an acquired brand’s distribution channels with our own; |
• | coordinating sales force activities of an acquired brand or in selling the products of an acquired brand to our customer base; or |
• | integrating an acquired brand into our management information systems or integrating an acquired brand’s products into our product mix. |
Additionally, integrating an acquired brand into our existing operations will require management resources and may divert management’s attention from our day-to-day operations. We may not respond quickly enough to the changing demands that acquired companies or brands will impose on management and our existing infrastructure, and changes to our operating structure may result in increased costs or inefficiencies that we cannot currently anticipate. Changes as a result of our growth may have a negative impact on the operation of our business, and cost increases resulting from our inability to effectively manage our growth could adversely impact our profitability. If we are not successful in integrating the operations of acquired brands, our business could be harmed.
We may not be able to successfully consummate proposed divestitures.
We may, from time to time, divest businesses that become less of a strategic fit within our core portfolio. For example, as part of our Project Terra strategic review discussed earlier, we have identified certain brands which no longer fit into our core strategy for future growth, and we intend to sell these brands. Our profitability may be impacted by gains or losses on the sales of such businesses, or lost operating income or cash flows from such businesses. Additionally, we may be required to record asset impairment or restructuring charges related to divested businesses, or indemnify buyers for liabilities, which may reduce our profitability and cash flows. We may also not be able to negotiate such divestitures on terms acceptable to us. Such potential
20
divestitures will require management resources and may divert management’s attention from our day-to-day operations. If we are not successful in divesting such businesses, our business could be harmed.
Our future results of operations may be adversely affected by the availability of organic ingredients.
Our ability to ensure a continuing supply of organic ingredients at competitive prices depends on many factors beyond our control, such as the number and size of farms that grow organic crops, climate conditions, changes in national and world economic conditions, currency fluctuations and forecasting adequate need of seasonal ingredients.
The organic ingredients that we use in the production of our products (including, among others, fruits, vegetables, nuts and grains) are vulnerable to adverse weather conditions and natural disasters, such as floods, droughts, water scarcity, temperature extremes, frosts, earthquakes and pestilences. Natural disasters and adverse weather conditions (including the potential effects of climate change) can lower crop yields and reduce crop size and crop quality, which in turn could reduce our supplies of organic ingredients or increase the prices of organic ingredients. If our supplies of organic ingredients are reduced, we may not be able to find enough supplemental supply sources on favorable terms, if at all, which could impact our ability to supply product to our customers and adversely affect our business, financial condition and results of operations.
We also compete with other manufacturers in the procurement of organic product ingredients, which may be less plentiful in the open market than conventional product ingredients. This competition may increase in the future if consumer demand for organic products increases. This could cause our expenses to increase or could limit the amount of product that we can manufacture and sell.
If we do not manage our supply chain effectively, our operating results may be adversely affected.
The inability of any supplier of raw materials, independent co-packer or third party distributor to deliver or perform for us in a timely or cost-effective manner could cause our operating costs to increase and our profit margins to decrease, especially as it relates to our products that have a short shelf life. We must continuously monitor our inventory and product mix against forecasted demand or risk having inadequate supplies to meet consumer demand as well as having too much inventory on hand that may reach its expiration date and become unsaleable. If we are unable to manage our supply chain efficiently and ensure that our products are available to meet consumer demand, our operating costs could increase, and our profit margins could decrease.
Our future results of operations may be adversely affected by volatile commodity costs.
Many aspects of our business have been, and may continue to be, directly affected by volatile commodity costs, including fuel. Agricultural commodities and ingredients, including almonds, corn, dairy, fruit and vegetables, oils, rice, soybeans and wheat, are the principal inputs used in our products. These items are subject to price volatility which can be caused by commodity market fluctuations, crop yields, seasonal cycles, weather conditions (including the potential effects of climate change), temperature extremes and natural disasters (including floods, droughts, water scarcity, frosts, earthquakes and hurricanes), pest and disease problems, changes in currency exchange rates, imbalances between supply and demand, natural disasters and government programs and policies among other factors. Volatile fuel costs translate into unpredictable costs for the products and services we receive from our third party providers including, but not limited to, distribution costs for our products and packaging costs. While we seek to offset the volatility of such costs with a combination of cost savings initiatives, operating efficiencies and price increases to our customers, we may be unable to manage cost volatility. If we are unable to fully offset the volatility of such costs, our financial results could be adversely affected.
Our ability to offset the impact of cost input inflation on our operations is partially dependent on our ability to implement and achieve targeted savings and efficiencies from cost reduction initiatives.
We continuously seek to put in place initiatives that are designed to control or reduce costs or that increase operating efficiencies in order to improve our profitability and offset many of the input cost increases that are outside of our control. For example, as discussed above, during fiscal 2016, the Company commenced a strategic review called “Project Terra,” which identified global cost savings over the next three fiscal years. Our success depends on our ability to execute and realize cost savings and efficiencies from our operations. If we are unable to identify and fully implement our productivity plans and achieve our anticipated efficiencies, including with respect to Project Terra, our profitability may be adversely impacted.
Our profit margins also depend on our ability to manage our inventory efficiently. As part of our effort to manage our inventory more efficiently, we carry out stock-keeping unit (“SKU”) rationalization programs from time-to-time, which may result in the discontinuation of numerous lower-margin or low-turnover SKUs. However, a number of factors, such as changes in customers’ inventory levels, access to shelf space and changes in consumer preferences, may lengthen the number of days we carry certain
21
inventories, hence impeding our effort to manage our inventory efficiently and thereby increasing our costs.
Interruption in, disruption of or loss of operations at one or more of our manufacturing facilities could harm our business.
For the fiscal years ended June 30, 2016, 2015 and 2014, approximately 65%, 61% and 57%, respectively, of our net sales was derived from products manufactured at our own manufacturing facilities. An interruption in, disruption of or the loss of operations at one or more of these facilities, which may be caused by work stoppages, governmental actions, disease outbreaks or pandemics, acts of war, terrorism, fire, earthquakes, flooding or other natural disasters at one or more of these facilities, could delay or postpone production of our products, which could have a material adverse effect on our business, results of operations and financial condition until such time as the interruption of operations is resolved or an alternate source of production is secured. In addition, if one or more of our manufacturing facilities are running at full capacity and we are unable to keep up with customer demand, we may not be able to fulfill orders on time or at all which could adversely impact our business.
Loss of one or more of our independent co-packers could adversely affect our business.
During fiscal 2016, 2015 and 2014, approximately 35%, 39% and 43%, respectively, of our net sales were derived from products manufactured at independent co-packers. In some cases, an individual co-packer may produce all of our requirements for a particular brand. The success of our business depends, in part, on maintaining a strong sourcing and manufacturing platform. We believe there are a limited number of competent, high-quality co-packers in the industry, and many of our co-packers produce products for other companies as well. If we were required to obtain additional or alternative co-packing agreements or arrangements in the future, we may not be able to do so on satisfactory terms or in a timely manner. Therefore, if we lose or need to change one or more co-packers, experience disruptions or delays at a co-packer or fail to retain co-packers for newly acquired products or brands, production of our products may be delayed or postponed and/or the availability of some of our products may be reduced or eliminated, which could have a material adverse effect on our business, results of operations and financial condition.
Disruption of our transportation systems could harm our business.
The success of our business depends, in large part, upon dependable transportation systems and a strong distribution network. A disruption in transportation services could result in an inability to supply materials to our or our co-packers’ facilities or finished products to our distribution centers or customers. We utilize distribution centers that are managed by third parties. Activity at these distribution centers could be disrupted by a number of factors, including labor issues, failure to meet customer standards, acts of war, terrorism, fire, earthquakes, flooding or other natural disasters or bankruptcy or other financial issues affecting the third party providers. Any extended disruption in the distribution of our products or an increase in the cost of these services could have a material adverse effect on our business.
We may face difficulties as we expand our operations into countries in which we have no prior operating experience.
We intend to continue to expand our global footprint in order to enter into new markets. This may involve expanding into countries other than those in which we currently operate. It may involve expanding into less developed countries, which may have less political, social or economic stability and less developed infrastructure and legal systems. It is costly to establish, develop and maintain international operations and develop and promote our brands in international markets. As we expand our business into new countries, we may encounter regulatory, personnel, technological and other difficulties that increase our expenses or delay our ability to become profitable in such countries, which may have a material adverse effect on our business.
We are subject to risks associated with our international sales and operations, including foreign currency risks.
Operating in international markets involves exposure to movements in currency exchange rates, which are volatile at times. The economic impact of currency exchange rate movements is complex because such changes are often linked to variability in real growth, inflation, interest rates, governmental actions and other factors. Consequently, isolating the effect of changes in currency does not incorporate these other important economic factors. These changes, if material, could cause adjustments to our financing and operating strategies.
We hold assets and incur liabilities, earn revenue and pay expenses in a variety of currencies other than the United States dollar, primarily the British Pound, Canadian Dollar, Indian Rupee and the Euro. Our consolidated financial statements are presented in United States Dollars, and therefore we must translate our assets, liabilities, revenue and expenses into United States dollars for external reporting purposes. As a result, changes in the value of the United States dollar during a period may unpredictably and adversely impact our consolidated operating results, our asset and liability balances and our cash flows in our consolidated financial statements, even if their value has not changed in their original currency.
22
During fiscal 2016, 40% of our consolidated net sales were generated outside the United States, while such sales outside the United States were 39% of net sales in 2015 and 44% in 2014. Sales from outside our U.S. markets may continue to represent a significant portion of our total net sales in the future, especially as we look to expand our operations into new countries. Our non-U.S. sales and operations are subject to risks inherent in conducting business abroad, many of which are outside our control, including:
• | periodic economic downturns and the instability of governments, including default or deterioration in the credit worthiness of local governments, geopolitical regional conflicts, terrorist activity, political unrest, civil strife, acts of war, public corruption, expropriation and other economic or political uncertainties; |
• | difficulties in managing a global enterprise, including staffing, collecting accounts receivable and managing distributors; |
• | compliance with United States laws affecting operations outside of the United States, such as the Foreign Corrupt Practices Act and the Office of Foreign Asset Control trade sanction regulations and anti-boycott regulations; |
• | compliance with antitrust and competition laws, data privacy laws and a variety of other local, national and multi-national regulations and laws in multiple regimes; |
• | pandemics, such as the flu, which may adversely affect our workforce as well as our local suppliers and customers; |
• | earthquakes, tsunamis, floods or other major disasters that may limit the supply of products that we purchase abroad; |
• | changes in tax laws, interpretation of tax laws, tax audit outcomes and potentially burdensome taxation; |
• | fluctuations in currency values, especially in emerging markets; |
• | changes in capital controls, including price and currency exchange controls; |
• | discriminatory or conflicting fiscal policies; |
• | varying abilities to enforce intellectual property and contractual rights; |
• | greater risk of uncollectible accounts and longer collection cycles; |
• | design and implementation of effective control environment processes across our diverse operations and employee base; |
• | tariffs, quotas, trade barriers, other trade protection measures and import or export licensing requirements imposed by governments that might negatively affect our sales; |
• | foreign currency exchange and transfer restrictions; |
• | increased costs, disruptions in shipping or reduced availability of freight transportation; |
• | differing labor standards; |
• | difficulties and costs associated with complying with United States laws and regulations applicable to entities with overseas operations; |
• | varying regulatory, tax, judicial and administrative practices in the jurisdictions where we operate; and |
• | difficulties associated with operating under a wide variety of complex foreign laws, treaties and regulations. |
In addition, the results of the referendum relating to the membership of the United Kingdom (U.K.) in the European Union (E.U.) (“Brexit”), advising for the exit of the U.K. from the E.U., has caused and may continue to cause disruptions to and create uncertainty surrounding our business, including affecting our relationships with our existing and future customers, suppliers and employees, which could have an adverse effect on our business, financial results and operations. The effects of Brexit will depend on any agreements the U.K. makes to retain access to E.U. markets either during a transitional period or more permanently. The measures could potentially disrupt the markets we serve and the tax jurisdictions in which we operate, adversely change tax benefits or liabilities in these or other jurisdictions and may cause us to lose customers, suppliers and employees. In addition, Brexit could lead to legal uncertainty and potentially divergent national laws and regulations as the U.K. determines which E.U. laws to replace or replicate.
Our inability to use our trademarks could have a material adverse effect on our business.
We believe that brand awareness is a significant component in a consumer’s decision to purchase one product over another in the highly competitive food, beverage and personal care industries. Although we endeavor to protect our trademarks and trade names, these efforts may not be successful, and third parties may challenge our right to use one or more of our trademarks or trade names. We believe that our trademarks and trade names are significant to the marketing and sale of our products and that the inability to utilize certain of these names could have a material adverse effect on our business, results of operations and financial condition.
In addition, we market products under brands licensed under trademark license agreements, including Linda McCartney’s®, the Sesame Street name and logo and other Sesame Workshop intellectual property on certain of our Earth’s Best® products, Cadbury® and Rose’s® brands. We believe that these trademarks have significant value and are instrumental in our ability to create and sustain demand for and to market those products offerings. We cannot assure you that these trademark license agreements will remain in effect and enforceable or that any license agreements, upon expiration, can be renewed on acceptable terms or at all. In addition, any future disputes concerning these trademark license agreements may cause us to incur significant litigation costs or force us to suspend use of the disputed trademarks and suspend sales of products using such trademarks.
23
If the reputation of one or more of our leading brands erodes significantly, it could have a material impact on our results of operations.
Our financial success is directly dependent on the consumer perception of our brands. The success of our brands may suffer if our marketing plans or product initiatives do not have the desired impact on a brand’s image or its ability to attract consumers. Further, our results could be negatively impacted if one of our brands suffers substantial damage to its reputation due to real or perceived quality issues or the Company is perceived to act in an irresponsible manner. In addition, it is possible for such information, misperceptions and opinions to be shared quickly and disseminated widely due to the continued growing use of social and digital media.
We are subject to U.S. and international regulations that could adversely affect our business and results of operations.
We are subject to extensive regulations in the United States, United Kingdom, Canada, Europe, Asia, including India, and any other countries where we manufacture, distribute and/or sell our products. Our products are subject to numerous food safety and other laws and regulations relating to the sourcing, manufacturing, storing, labeling, marketing, advertising and distribution of these products. Enforcement of existing laws and regulations, changes in legal requirements and/or evolving interpretations of existing regulatory requirements may result in increased compliance costs and create other obligations, financial or otherwise, that could adversely affect our business, financial condition or operating results.
In addition, with our expanding international operations, we could be adversely affected by violations of the U.S. Foreign Corrupt Practices Act (FCPA) and similar worldwide anti-bribery laws, which generally prohibit companies and their intermediaries from making improper payments to non-U.S. officials or other third parties for the purpose of obtaining or retaining business. While our policies mandate compliance with these anti-bribery laws, our internal control policies and procedures may not protect us from reckless or criminal acts committed by our employees, joint-venture partners or agents. Violations of these laws, or allegations of such violations, could disrupt our business and result in a material adverse effect on our results of operations, cash flows and financial condition.
We are subject to environmental laws and regulations relating to hazardous materials, substances and waste used in or resulting from our operations. Liabilities or claims with respect to environmental matters could have a significant negative impact on our business.
As with other companies engaged in similar businesses, the nature of our operations expose us to the risk of liabilities and claims with respect to environmental matters, including those relating to the disposal and release of hazardous substances. Furthermore, our operations are governed by laws and regulations relating to workplace safety and worker health which, among other things, regulate employee exposure to hazardous chemicals in the workplace. Any material costs incurred in connection with such liabilities or claims could have a material adverse effect on our business, consolidated financial condition, results of operations or liquidity. Any environmental or health and safety legislation or regulations enacted in the future, or any changes in how existing or future laws or regulations will be enforced, administered or interpreted may, lead to an increase in compliance costs or expose us to additional risk of liabilities and claims, which could have a material adverse effect on our business, consolidated financial condition, results of operations or liquidity.
We rely on independent certification for a number of our products.
We rely on independent third party certification, such as certifications of our products as “organic”, “Non-GMO” or “kosher,” to differentiate our products from others. We must comply with the requirements of independent organizations or certification authorities in order to label our products as certified organic. For example, we can lose our “organic” certification if a manufacturing plant becomes contaminated with non-organic materials, or if it is not properly cleaned after a production run. In addition, all raw materials must be certified organic. Similarly, we can lose our “kosher” certification if a manufacturing plant and raw materials do not meet the requirements of the appropriate kosher supervision organization. The loss of any independent certifications could adversely affect our market position as an organic and natural products company, which could harm our business.
A cybersecurity incident or other technology disruptions could negatively impact our business and our relationships with customers.
We use computers in substantially all aspects of our business operations. We also use mobile devices, social networking and other online activities to connect with our employees, suppliers, customers and consumers. Such uses give rise to cybersecurity risks, including security breach, espionage, system disruption, theft and inadvertent release of information. Our business involves the storage and transmission of numerous classes of sensitive and/or confidential information and intellectual property, including
24
customers’ and suppliers' information, private information about employees, and financial and strategic information about the Company and its business partners. Further, as we pursue our strategy to grow through acquisitions and to pursue new initiatives that improve our operations and cost structure, we are also expanding and improving our information technologies, resulting in a larger technological presence and corresponding exposure to cybersecurity risk. If we fail to assess and identify cybersecurity risks associated with acquisitions and new initiatives, we may become increasingly vulnerable to such risks. Additionally, while we have implemented measures to prevent security breaches and cyber incidents, our preventative measures and incident response efforts may not be entirely effective. The theft, destruction, loss, misappropriation, or release of sensitive and/or confidential information or intellectual property, or interference with our information technology systems or the technology systems of third parties on which we rely, could result in business disruption, negative publicity, brand damage, violation of privacy laws, loss of customers, potential liability and competitive disadvantage all of which could have a material adverse effect on our business, financial condition or results of operations.
Our business operations could be disrupted if our information technology systems fail to perform adequately.
The efficient operation of our business depends on our information technology systems. We rely on our information technology systems to effectively manage our business data, communications, supply chain, order entry and fulfillment, and other business processes. The failure of our information technology systems to perform as we anticipate could disrupt our business and could result in transaction errors, processing inefficiencies and the loss of sales and customers, causing our business and results of operations to suffer. In addition, our information technology systems may be vulnerable to damage or interruption from circumstances beyond our control, including fire, natural disasters, system failures and viruses. Any such damage or interruption could have a material adverse effect on our business.
We may be subject to significant liability that is not covered by insurance.
Although we believe that the extent of our insurance coverage is consistent with industry practice, any claim under our insurance policies may be subject to certain exceptions, may not be honored fully, in a timely manner, or at all, and we may not have purchased sufficient insurance to cover all losses incurred. If we were to incur substantial liabilities or if our business operations were interrupted for a substantial period of time, we could incur costs and suffer losses. Such inventory and business interruption losses may not be covered by our insurance policies. Additionally, in the future, insurance coverage may not be available to us at commercially acceptable premiums, or at all.
Joint ventures that we enter into present a number of risks and challenges that could have a material adverse effect on our business and results of operations.
As part of our business strategy, we have made minority interest investments and established joint ventures. These transactions typically involve a number of risks and present financial and other challenges, including the existence of unknown potential disputes, liabilities or contingencies and changes in the industry, location or political environment in which these investments are located, that may arise after entering into such arrangements. We could experience financial or other setbacks if these transactions encounter unanticipated problems, including problems related to execution by the management of the companies underlying these investments. Any of these risks could adversely affect our results of operations.
Global capital and credit market issues could negatively affect our liquidity, increase our costs of borrowing and disrupt the operations of our suppliers and customers.
We depend on stable, liquid and well-functioning capital and credit markets to fund our operations. Although we believe that our operating cash flows, financial assets, access to capital and credit markets and revolving credit agreement will permit us to meet our financing needs for the foreseeable future, future volatility or disruption in the capital and credit markets and the state of the economy, including the consumer staples industry, may impair our liquidity or increase our costs of borrowing. Such disruptions could require us to take measures to conserve cash until the markets stabilize or until alternative credit arrangements or other funding for our business needs can be arranged. Our business could also be negatively impacted if our suppliers or customers experience disruptions resulting from tighter capital and credit markets or a slowdown in the general economy.
Climate change may negatively affect our business and operations.
There is concern that carbon dioxide and other greenhouse gases in the atmosphere may have an adverse impact on global temperatures, weather patterns and the frequency and severity of extreme weather and natural disasters. In the event that such climate change has a negative effect on agricultural productivity, we may be subject to decreased availability or less favorable pricing for certain commodities that are necessary for our products, such as corn, oats, rice, wheat and various fruits and vegetables. As a result of climate change, we may also be subjected to decreased availability of water, deteriorated quality of water or less
25
favorable pricing for water, which could adversely impact our manufacturing and distribution operations.
Our ability to issue preferred stock may deter takeover attempts.
Our Board of Directors is empowered to issue, without stockholder approval, preferred stock with dividends, liquidation, conversion, voting or other rights, which could decrease the amount of earnings and assets available for distribution to holders of our common stock and adversely affect the relative voting power or other rights of the holders of our common stock. In the event of issuance, the preferred stock could be used as a method of discouraging, delaying or preventing a change in control. Our amended and restated certificate of incorporation authorizes the issuance of up to 5 million shares of “blank check” preferred stock with such designations, rights and preferences as may be determined from time-to-time by our Board of Directors. Although we have no present intention to issue any shares of our preferred stock, we may do so in the future under appropriate circumstances.
Item 1B. Unresolved Staff Comments
None.
26
Item 2. Properties
Our principal facilities, which are leased except where otherwise indicated, are as follows:
Primary Use | Location | Approximate Square Feet | Expiration of Lease | ||||
United States: | |||||||
Headquarters office | Lake Success, NY | 86,000 | 2029 | ||||
Manufacturing and offices (Tea) | Boulder, CO | 158,000 | Owned | ||||
Manufacturing and distribution (Flours and grains) | Hereford, TX | 136,000 | Owned | ||||
Manufacturing (Frozen foods, pouches and cold-pressed juice drinks) | West Chester, PA | 105,000 | Owned | ||||
Manufacturing (Snack products) | Moonachie, NJ | 75,000 | Owned | ||||
Manufacturing and distribution center (Snack products) | Mountville, PA | 100,000 | 2019 | ||||
Manufacturing and distribution (Pasta) | Shreveport, LA | 37,000 | Owned | ||||
Manufacturing (Personal care) | Culver City, CA | 24,000 | 2018 | ||||
Manufacturing (Meat-alternatives) | Boulder, CO | 21,000 | Owned | ||||
Manufacturing (Nut butters) | Ashland, OR | 13,000 | Owned | ||||
Distribution center (Grocery, snacks, and personal care products) | Ontario, CA | 375,000 | 2018 | ||||
Manufacturing and distribution (Tea) | Boulder, CO | 162,000 | 2020 | ||||
Distribution center (Meat-alternatives) | Boulder, CO | 45,000 | Month to month | ||||
Manufacturing and distribution (Breads, buns, and related products) | Boulder, CO | 69,000 | 2020 | ||||
United Kingdom: | |||||||
Manufacturing and offices (Ambient grocery products) | Histon, England | 303,000 | Owned | ||||
Manufacturing and offices (Classic rice products) | Rainham, England | 80,000 | Owned | ||||
Manufacturing and offices (Ready-to-heat rice products) | Rainham, England | 69,000 | Owned | ||||
Manufacturing (Hot-eating desserts) | Clitheroe, England | 38,000 | 2026 | ||||
Manufacturing (Fresh fruit and salads) | Leeds, England | 34,000 | 2022 | ||||
Manufacturing (Chilled soups) | Grimsby, England | 61,000 | 2029 | ||||
Manufacturing (Chilled soups) | Peterborough, England | 54,000 | 2020 | ||||
Manufacturing (Desserts and plant-based frozen products) | Fakenham, England | 101,000 | Owned | ||||
Manufacturing (Fresh prepared fruit products) | Corby, England | 45,000 | 2024 | ||||
Distribution and offices (Packaging and ingredients) | Corby, England | 22,500 | 2019 | ||||
Manufacturing, distribution and offices (Fresh prepared fruit products and drinks) | Corby, England | 89,500 | Owned | ||||
Manufacturing and offices (Fresh prepared fruit) | Gateshead, England | 46,000 | 2020 | ||||
Manufacturing and distribution (Crackers) | Larvik, Norway | 16,000 | 2019 | ||||
27
Primary Use | Location | Approximate Square Feet | Expiration of Lease | ||||
Hain Pure Protein: | |||||||
Manufacturing and offices (Poultry products) | Fredericksburg, PA | 58,000 | Owned | ||||
Manufacturing and offices (Poultry products) | Fredericksburg, PA | 60,000 | Owned | ||||
Distribution and offices (Poultry products) | New Oxford, PA | 20,000 | Owned | ||||
Manufacturing and offices (Poultry products) | New Oxford, PA | 130,000 | Owned | ||||
Manufacturing and offices (Poultry products) | Liverpool, NY | 15,000 | Owned | ||||
Manufacturing, distribution and offices (Kosher poultry products) | Mifflintown, PA | 240,000 | Owned | ||||
Manufacturing, distribution and offices (Feed mill) | Sellinsgrove, PA | 21,000 | Owned | ||||
Manufacturing and offices (Poultry hatchery) | Beaver Springs, PA | 32,500 | Owned | ||||
Rest of World: | |||||||
Manufacturing (Plant-based foods) | Vancouver, BC, Canada | 76,000 | Owned | ||||
Manufacturing and offices (Personal care) | Mississauga, ON, Canada | 61,000 | 2020 | ||||
Distribution (Personal care) | Mississauga, ON, Canada | 80,500 | 2022 | ||||
Manufacturing, distribution and offices (Plant-based beverages) | Troisdorf, Germany | 131,000 | 2027 | ||||
Manufacturing and offices (Organic food products) | Andiran, France | 39,000 | Owned | ||||
Distribution (Organic food products) | Nerrac, France | 18,000 | Owned | ||||
Manufacturing and offices (Plant-based foods and beverages) | Oberwart, Austria | 108,000 | Unlimited | ||||
Manufacturing (Plant-based foods and beverages) | Schwerin, Germany | 650,000 | Owned | ||||
We also lease space for other smaller offices and facilities in the United States, United Kingdom, Canada, Europe and other parts of the world.
In addition to the foregoing distribution facilities operated by us, we also utilize bonded public warehouses from which deliveries are made to customers.
For further information regarding our lease obligations, see Note 16, Commitments and Contingencies, in the Notes to Consolidated Financial Statements included in Item 8 of this Form 10-K. For further information regarding the use of our properties by segments, see “Item 1, Business - Production” of this Form 10-K.
Item 3. Legal Proceedings
Securities Class Actions Filed in Federal Court
On August 17, 2016, three securities class action complaints were filed in the Eastern District of New York against the Company alleging violations of Sections 10(b) and 20(a) of the Securities Exchange Act of 1934. The three complaints are: (1) Flora v. The Hain Celestial Group, Inc., et al., (the “Flora Complaint”); (2) Lynn v. the Hain Celestial Group, Inc., et al. (the “Lynn Complaint”); and (3) Spadola v. The Hain Celestial Group, Inc., et al. (the “Spadola Complaint” and, together with the Flora and Lynn Complaints, the “Securities Complaints”). The Securities Complaints allege that the Company and certain of its officers made materially false and misleading statements in press releases and SEC filings regarding the Company’s business, prospects and financial results. The Securities Complaints were brought on behalf of all persons who purchased or otherwise acquired Hain securities between November 5, 2015 and August 15, 2016. On October 17, 2016, six potential plaintiffs and their respective law firms moved to serve as lead plaintiff and counsel. On June 5, 2017, the Court issued an order for consolidation, appointment of Co-Lead Plaintiffs and approval of selection of co-lead counsel. Pursuant to this order, the Securities Complaints were consolidated under the caption In re The Hain Celestial Group, Inc. Securities Litigation, (the “Consolidated Securities Action”) and Rosewood Funeral Home and Salamon Gimpel were appointed as Co-Lead Plaintiffs. On June 21, 2017, the Company received notice that plaintiff Spadola
28
voluntarily dismissed his claims without prejudice to his ability to participate in the Consolidated Securities Action as an absent class member.
Stockholder Derivative Complaints Filed in State Court
On September 16, 2016, a stockholder derivative complaint, Paperny v. Heyer, et al. (the “Paperny Complaint”), was filed in New York State Supreme Court in Nassau County against the Board of Directors and certain officers of the Company alleging breach of fiduciary duty, unjust enrichment, lack of oversight and corporate waste. On December 2, 2016 and December 29, 2016, two additional stockholder derivative complaints were filed in New York State Supreme Court in Nassau County against the Board of Directors and certain officers under the captions Scarola v. Simon (the “Scarola Complaint”) and Shakir v. Simon (the “Shakir Complaint” and, together with the Paperny Complaint and the Scarola Complaint, the “Derivative Complaints”), respectively. Both the Scarola Complaint and the Shakir Complaint allege breach of fiduciary duty, lack of oversight and unjust enrichment. On February 16, 2017, the parties for the Derivative Complaints entered into a stipulation consolidating the matters under the caption In re The Hain Celestial Group (the “Consolidated Derivative Action”) in New York State Supreme Court in Nassau County, and the parties agreed to stay the Consolidated Derivative Action until November 2, 2017.
Additional Stockholder Class Action and Derivative Complaints Filed in Federal Court
On April 19, 2017 and April 26, 2017, two class action and stockholder derivative complaints were filed in the Eastern District of New York against the Board of Directors and certain officers of the Company under the captions Silva v. Simon, et al. (the “Silva Complaint”) and Barnes v. Simon, et al. (the “Barnes Complaint”), respectively. Both the Silva Complaint and the Barnes Complaint allege violation of securities law, breach of fiduciary duty, waste of corporate assets and unjust enrichment.
On May 23, 2017, an additional stockholder filed a complaint under seal in the Eastern District of New York against the Board of Directors and certain officers of the Company. The complaint alleges that the Company’s directors and certain officers made materially false and misleading statements in press releases and SEC filings regarding the Company’s business, prospects and financial results. The complaint also alleges that the Company violated its by-laws and Delaware law by failing to hold an Annual Stockholders Meeting and includes claims for breach of fiduciary duty, unjust enrichment and corporate waste.
SEC Investigation
As previously disclosed, the Company voluntarily contacted the SEC in August 2016 to advise it of the Company’s delay in the filing of its periodic reports and the performance of the independent review conducted by the Audit Committee. The Company has continued to provide information to the SEC on an ongoing basis, including, among other things, the results of the independent review of the Audit Committee as well as other information pertaining to its internal accounting review relating to revenue recognition. On January 31, 2017, the SEC issued a subpoena to the Company seeking documents relevant to its investigation. The Company is in the process of responding to the SEC’s requests for information and intends to cooperate fully with the SEC.
Other
In addition to the litigation described above, the Company is and may be a defendant in lawsuits from time to time in the normal course of business. While the results of litigation and claims cannot be predicted with certainty, the Company believes the reasonably possible losses of such matters, individually and in the aggregate, are not material. Additionally, the Company believes the probable final outcome of such matters will not have a material adverse effect on the Company’s consolidated results of operations, financial position, cash flows or liquidity.
Item 4. Mine Safety Disclosures
Not applicable.
29
PART II
Item 5. Market for Registrant’s Common Equity, Related Stockholder Matters and Issuer Purchases of Equity Securities
Outstanding shares of our common stock, par value $.01 per share, are listed on the Nasdaq Global Select Market under the ticker symbol “HAIN”. The following table sets forth the reported high and low sales prices for our common stock for each fiscal quarter from July 1, 2014 through June 30, 2016.
Common Stock | |||||||||||||||
Fiscal Year 2016 | Fiscal Year 2015 | ||||||||||||||
High | Low | High | Low | ||||||||||||
First Quarter | $ | 70.65 | $ | 51.19 | $ | 51.99 | $ | 40.83 | |||||||
Second Quarter | $ | 54.46 | $ | 38.12 | $ | 60.45 | $ | 48.31 | |||||||
Third Quarter | $ | 41.78 | $ | 33.12 | $ | 66.35 | $ | 51.95 | |||||||
Fourth Quarter | $ | 53.03 | $ | 40.50 | $ | 68.76 | $ | 57.61 | |||||||
Note: On December 29, 2014, we effected a two-for-one stock split of our common stock in the form of a 100% stock dividend to shareholders of record as of December 12, 2014. The reported high and low sales prices for our common stock prior to the effective date have been retroactively adjusted to reflect the stock split.
Holders
As of June 16, 2017, there were 264 holders of record of our common stock.
Dividends
We have not paid any cash dividends on our common stock to date. We intend to retain all future earnings for use in the development of our business and do not anticipate declaring or paying any dividends in the foreseeable future. The payment of all dividends will be at the discretion of our Board of Directors and will depend on, among other things, future earnings, operations, capital requirements, contractual restrictions, including restrictions under our credit facility, our general financial condition and general business conditions.
Issuance of Unregistered Securities
None.
Issuer Purchases of Equity Securities
The table below sets forth information regarding repurchases by the Company of its common stock during the periods indicated.
Period | (a) Total number of shares purchased (1) | (b) Average price paid per share | (c) Total number of shares purchased as part of publicly announced plans | (d) Maximum number of shares that may yet be purchased under the plans | ||||||||
April 1, 2016 - April 30, 2016 | 161 | $ | 41.88 | — | — | |||||||
May 1, 2016 - May 31, 2016 | 5,695 | 48.41 | — | — | ||||||||
June 1, 2016 - June 30, 2016 | 2,081 | 48.20 | — | — | ||||||||
Total | 7,937 | $ | 48.22 | — | — | |||||||
(1) | Shares surrendered for payment of employee payroll taxes due on shares issued under stockholder approved stock-based compensation plans. |
30
Stock Performance Graph
The following graph compares the performance of our common stock to the S&P 500 Index, S&P Smallcap 600 Index, and to the S&P Packaged Foods and Meats Index (in which we are included) for the period from June 30, 2011 through June 30, 2016. The comparison assumes $100 invested on June 30, 2011.
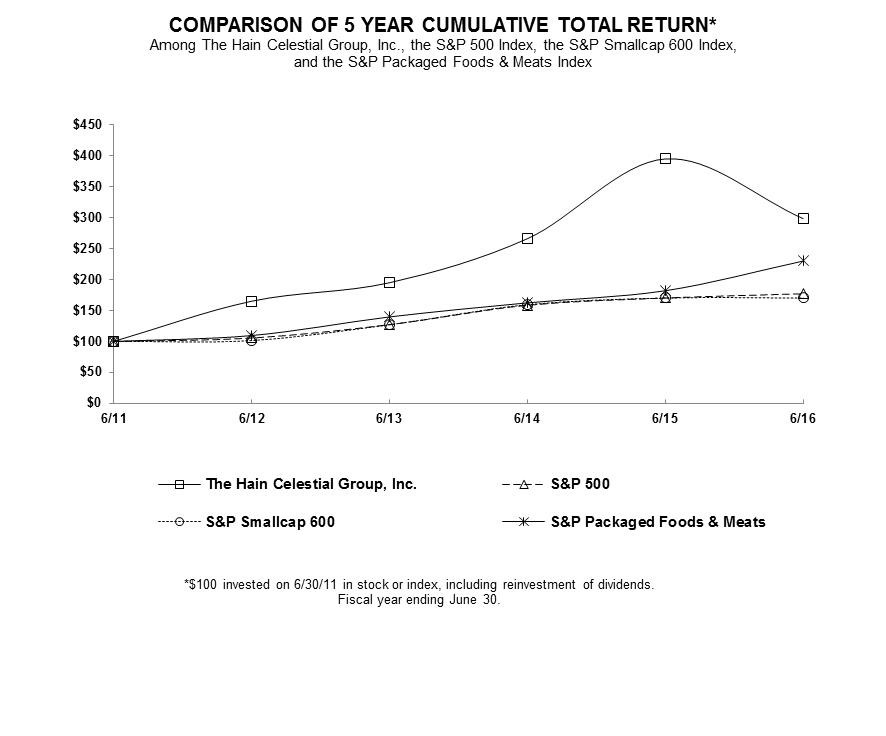
31
Item 6. Selected Financial Data
The following information has been summarized from our financial statements. The information set forth below is not necessarily indicative of results of future operations and should be read in conjunction with Item 7, “Management’s Discussion and Analysis of Financial Condition and Results of Operations” and the consolidated financial statements and related notes thereto included in Item 8 of this Form 10-K to fully understand factors that may affect the comparability of the information presented below, including the completion of several business combinations in recent years. Refer to Note 5, Acquisitions, in the Notes to Consolidated Financial Statements in Item 8 of this Form 10-K for additional information. The information presented in the following tables has been adjusted to reflect the correction of immaterial errors identified in prior periods, which is more fully described in the Explanatory Note on page 3 of this Form 10-K and in Note 2, Correction of Immaterial Errors to Prior Period Financial Statements, in the Notes to Consolidated Financial Statements included in Item 8 of this Form 10-K. Amounts are presented in thousands except per share amounts.
Fiscal Year ended June 30, | ||||||||||||||||||||
2016 (c) | 2015 (Revised) | 2014 (d) (Revised) | 2013 (e) (Revised) | 2012 (e) (Revised) | ||||||||||||||||
Operating results: | ||||||||||||||||||||
Net sales | $ | 2,885,374 | $ | 2,609,613 | $ | 2,107,822 | $ | 1,705,975 | $ | 1,354,867 | ||||||||||
Income from continuing operations (a) | $ | 47,429 | $ | 164,962 | $ | 131,551 | $ | 109,081 | $ | 94,083 | ||||||||||
Loss from discontinued operations, net of tax | $ | — | $ | — | $ | (1,629 | ) | $ | (5,137 | ) | $ | (14,989 | ) | |||||||
Net income | $ | 47,429 | $ | 164,962 | $ | 129,922 | $ | 103,944 | $ | 79,094 | ||||||||||
Basic net income (loss) per common share (b): | ||||||||||||||||||||
From continuing operations | $ | 0.46 | $ | 1.62 | $ | 1.35 | $ | 1.18 | $ | 1.06 | ||||||||||
From discontinued operations | — | — | (0.02 | ) | (0.06 | ) | (0.17 | ) | ||||||||||||
Net income per common share - basic | $ | 0.46 | $ | 1.62 | $ | 1.33 | $ | 1.13 | $ | 0.89 | ||||||||||
Diluted net income (loss) per common share (b): | ||||||||||||||||||||
From continuing operations | $ | 0.46 | $ | 1.60 | $ | 1.32 | $ | 1.15 | $ | 1.03 | ||||||||||
From discontinued operations | — | — | (0.02 | ) | (0.05 | ) | (0.16 | ) | ||||||||||||
Net income per common share - diluted | $ | 0.46 | $ | 1.60 | $ | 1.30 | $ | 1.09 | $ | 0.86 | ||||||||||
Financial position: | ||||||||||||||||||||
Working capital | $ | 543,206 | $ | 537,440 | $ | 358,345 | $ | 271,355 | $ | 224,815 | ||||||||||
Total assets | $ | 3,008,080 | $ | 3,099,408 | $ | 2,943,814 | $ | 2,242,098 | $ | 1,665,752 | ||||||||||
Long-term debt, less current portion | $ | 836,171 | $ | 812,608 | $ | 767,827 | $ | 653,464 | $ | 390,288 | ||||||||||
Stockholders’ equity | $ | 1,664,514 | $ | 1,727,667 | $ | 1,580,825 | $ | 1,170,659 | $ | 944,446 | ||||||||||
(a) Income from continuing operations and net income for fiscal 2016 include a goodwill impairment charge of $84.5 million and an impairment charge of $39.7 million on certain of the Company’s tradenames. See Note 8, Goodwill and Other Intangible Assets, in the Notes to Consolidated Financial Statements included in Item 8 of this Form 10-K.
(b) On December 29, 2014, we effected a two-for-one stock split of our common stock in the form of a 100% stock dividend to shareholders of record as of December 12, 2014. All per share information has been retroactively adjusted to reflect the stock split.
(c) Upon adoption of Accounting Standards Update (“ASU”) 2015-17, Income Taxes (Topic 740): Balance Sheet Classification of Deferred Taxes, deferred tax assets and liabilities previously classified as current are presented as non-current. Prior amounts have not been retrospectively adjusted.
32
(d) The following table reconciles the Company’s financial position as derived from the consolidated balance sheet as of June 30, 2014 from the previously reported amounts to the revised amounts:
Fiscal Year ended June 30, 2014 | ||||||||||||
Previously Reported | Adjustment | As Revised | ||||||||||
Financial position: | ||||||||||||
Working capital | $ | 379,439 | $ | (21,094 | ) | $ | 358,345 | |||||
Total assets | $ | 2,965,317 | $ | (21,503 | ) | $ | 2,943,814 | |||||
Long-term debt, less current portion | $ | 767,827 | $ | — | $ | 767,827 | ||||||
Stockholders’ equity | $ | 1,619,867 | $ | (39,042 | ) | $ | 1,580,825 | |||||
(e) The following table reconciles the Company’s consolidated statements of income for the fiscal years ended June 30, 2013 and 2012, and the Company’s financial position as derived from the consolidated balance sheets as of June 30, 2013 and 2012, from the previously reported amounts to the revised amounts:
Fiscal Year ended June 30, | ||||||||||||||||||||||||
2013 | 2012 | |||||||||||||||||||||||
Previously Reported | Adjustment | As Revised | Previously Reported | Adjustment | As Revised | |||||||||||||||||||
Operating results: | ||||||||||||||||||||||||
Net sales | $ | 1,734,683 | $ | (28,708 | ) | $ | 1,705,975 | $ | 1,378,247 | $ | (23,380 | ) | $ | 1,354,867 | ||||||||||
Income from continuing operations | $ | 119,793 | $ | (10,712 | ) | $ | 109,081 | $ | 94,214 | $ | (131 | ) | $ | 94,083 | ||||||||||
Loss from discontinued operations, net of tax | $ | (5,137 | ) | $ | — | $ | (5,137 | ) | $ | (14,989 | ) | $ | — | $ | (14,989 | ) | ||||||||
Net income | $ | 114,656 | $ | (10,712 | ) | $ | 103,944 | $ | 79,225 | $ | (131 | ) | $ | 79,094 | ||||||||||
Basic net income (loss) per common share (b): | ||||||||||||||||||||||||
From continuing operations | $ | 1.30 | $ | (0.12 | ) | $ | 1.18 | $ | 1.06 | $ | — | $ | 1.06 | |||||||||||
From discontinued operations | (0.06 | ) | — | (0.06 | ) | (0.17 | ) | — | (0.17 | ) | ||||||||||||||
Net income per common share - basic | $ | 1.24 | $ | (0.12 | ) | $ | 1.13 | $ | 0.89 | $ | — | $ | 0.89 | |||||||||||
Diluted net income (loss) per common share (b): | ||||||||||||||||||||||||
From continuing operations | $ | 1.26 | $ | (0.11 | ) | $ | 1.15 | $ | 1.03 | $ | — | $ | 1.03 | |||||||||||
From discontinued operations | (0.05 | ) | — | (0.05 | ) | (0.16 | ) | — | (0.16 | ) | ||||||||||||||
Net income per common share - diluted | $ | 1.21 | $ | (0.11 | ) | $ | 1.09 | $ | 0.86 | $ | — | $ | 0.86 | |||||||||||
Financial position: | ||||||||||||||||||||||||
Working capital | $ | 301,042 | $ | (29,687 | ) | $ | 271,355 | $ | 245,999 | $ | (21,184 | ) | $ | 224,815 | ||||||||||
Total assets | $ | 2,258,494 | $ | (16,396 | ) | $ | 2,242,098 | $ | 1,673,593 | $ | (7,841 | ) | $ | 1,665,752 | ||||||||||
Long-term debt, less current portion | $ | 653,464 | $ | — | $ | 653,464 | $ | 390,288 | $ | — | $ | 390,288 | ||||||||||||
Stockholders’ equity | $ | 1,201,555 | $ | (30,896 | ) | $ | 1,170,659 | $ | 964,602 | $ | (20,156 | ) | $ | 944,446 | ||||||||||
* Net income/(loss) per common share may not add in certain periods due to rounding
33
Item 7. Management’s Discussion and Analysis of Financial Condition and Results of Operations
This Management’s Discussion and Analysis of Financial Condition and Results of Operations should be read in conjunction with Item 1A and the Consolidated Financial Statements and the related notes thereto for the period ended June 30, 2016 included in Item 8 of this Form 10-K. Forward-looking statements in this Form 10-K are qualified by the cautionary statement included in this review under the sub-heading, “Cautionary Note Regarding Forward Looking Information,” at the beginning of this Form 10-K.
Revisions of Consolidated Financial Statements
As previously reported, we were unable to timely file our Annual Report on Form 10-K for our fiscal year ended June 30, 2016 (the “Form 10-K”) and our Quarterly Reports on Form 10-Q for the quarters ended September 30, 2016 (the “Q1 Form 10-Q”), December 31, 2016 (the “Q2 Form 10-Q”), and March 31, 2017 (the “Q3 Form 10-Q”). During the fourth quarter of fiscal 2016, the Company identified the practice of granting additional concessions to certain distributors in the United States and commenced an internal accounting review in order to (i) determine whether the revenue associated with those concessions was accounted for in the correct period and (ii) evaluate the Company’s internal control over financial reporting. The Audit Committee of the Company’s Board of Directors separately conducted an independent review of these matters and retained independent counsel to assist in their review. We delayed the filing of this Form 10-K and our Q1 Form 10-Q, Q2 Form 10-Q and Q3 Form 10-Q with the SEC in order to complete these reviews.
The following Management’s Discussion and Analysis of Financial Condition and Results of Operations reflects revisions to prior year balances due to corrections of the immaterial errors identified during these reviews. For a detailed discussion of the reviews and immaterial error corrections, see Explanatory Note on page 3 of this Form 10-K and Note 1, Description of Business and Basis of Presentation, and Note 2, Correction of Immaterial Errors to Prior Period Financial Statements, in the Notes to the Consolidated Financial Statements included in Item 8 of this Form 10-K.
Overview
The Hain Celestial Group, Inc., a Delaware corporation, and its subsidiaries (collectively, the “Company,” and herein referred to as “Hain Celestial,” “we,” “us,” and “our”) was founded in 1993 and is headquartered in Lake Success, New York. The Company’s mission has continued to evolve since its founding, with health and wellness being the core tenet — to be the leading marketer, manufacturer and seller of organic and natural, “better-for-you” products by anticipating and exceeding consumer expectations in providing quality, innovation, value and convenience. The Company is committed to growing sustainably while continuing to implement environmentally sound business practices and manufacturing processes. Hain Celestial sells its products through specialty and natural food distributors, supermarkets, natural food stores, mass-market and e-commerce retailers, food service channels and clubs, and drug and convenience stores in over 80 countries worldwide.
With a proven track record of strategic growth and profitability, the Company manufactures, markets, distributes and sells organic and natural products under brand names that are sold as “better-for-you” products, providing consumers with the opportunity to lead A Healthier Way of LifeTM. Hain Celestial is a leader in many organic and natural products categories, with many recognized brands in the various market categories it serves, including Almond Dream®, Arrowhead Mills®, Bearitos®, BluePrint®, Celestial Seasonings®, Coconut Dream®, Cully & Sully®, Danival®, DeBoles®, Earth’s Best®, Ella’s Kitchen®, Empire®, Europe’s Best®, Farmhouse Fare®, Frank Cooper’s®, FreeBird®, Gale’s®, Garden of Eatin’®, GG UniqueFiberTM, Hain Pure Foods®, Hartley’s®, Health Valley®, Imagine®, Johnson’s Juice Co.®, Joya®, Kosher Valley®, Lima®, Linda McCartney’s® (under license), MaraNatha®, Natumi®, New Covent Garden Soup Co.®, Plainville Farms®, Rice Dream®, Robertson’s®, Rudi’s Gluten-Free Bakery®, Rudi’s Organic Bakery®, Sensible Portions®, Spectrum Organics®, Soy Dream®, Sun-Pat®, SunSpire®, Terra®, The Greek Gods®, Tilda®, WestSoy® and Yves Veggie Cuisine®. The Company’s personal care products are marketed under the Alba Botanica®, Avalon Organics®, Earth’s Best®, JASON®, Live Clean® and Queen Helene® brands.
We principally manage our business by geography in seven operating segments: the United States, United Kingdom, Tilda, Hain Pure Protein Corporation, Empire Kosher Poultry, Canada and Europe. In addition, we have four reportable segments: United States, United Kingdom, Hain Pure Protein, and Rest of World. We have aggregated (based on economic similarities, the nature of their products, end-user markets and methods of distribution) the operating segments of the United Kingdom and Tilda into the United Kingdom reportable segment and the operating segments of Hain Pure Protein Corporation and Empire Kosher Poultry into the Hain Pure Protein reportable segment. Additionally, Canada and Europe do not currently meet the quantitative thresholds for segment reporting and are therefore combined and reported as “Rest of World.”
34
Our business strategy is to integrate our brands under one management team and employ uniform marketing, sales and distribution programs when attainable. We believe that by integrating our various brands, we will continue to achieve economies of scale and enhanced market penetration. We seek to capitalize on the equity of our brands and the distribution achieved through each of our acquired businesses with strategic introductions of new products that complement existing lines to enhance revenues and margins.
Project Terra
During fiscal year 2016, the Company commenced a strategic review, which it called “Project Terra,” that resulted in the Company redefining its core platforms starting with the United States segment for future growth based upon consumer trends to create and inspire A Healthier Way of Life™. The core platforms are defined by common consumer need, route-to-market or internal advantage and are aligned with the Company’s strategic roadmap to continue its leadership position in the organic and natural, better-for-you products industry. Beginning in fiscal year 2017, those core platforms within the United States segment are:
• | Better-for-You-Baby, which includes infant foods, infant formula, toddler and kids foods, diapers and wipe products that nurture and care for babies and toddlers, under the Earth’s Best® and Ella’s Kitchen® brands. |
• | Better-for-You-Pantry, which includes core consumer staples, such as Maranatha®, Arrowhead Mills®, Imagine® and Spectrum Organics® brands. |
• | Better-for-You-Snacking, which includes wholesome products for in-between meals, such as Terra®, Sensible Portions® and Garden of Eatin’® brands. |
• | Fresh Living, which includes yogurt, plant-based proteins and other refrigerated products, such as The Greek Gods® yogurt and Dream™ plant-based beverage brands. |
• | Pure Personal Care, which includes personal care products focused on providing consumers with cleaner and gentler ingredients, such as JASON®, Avalon Organics® and Alba Botanica® brands. |
• | Tea, which includes tea products marketed under the Celestial Seasonings® brand. |
In addition, the Company launched Cultivate Ventures, a venture unit with a threefold purpose: (i) to strategically invest in the Company’s smaller brands in high potential categories such as BluePrint® cold-pressed juices, SunSpire® chocolates and DeBoles® pasta by giving those products a dedicated, creative focus for a refresh and relaunch; (ii) to incubate small acquisitions until they reach the scale for the Company’s core platforms; and (iii) to invest in concepts, products and technology that focus on health and wellness.
Effective July 1, 2016, due to changes to the Company’s internal management and reporting structure resulting from the formation of Cultivate, certain brands previously included within the United States operating segment will be moved to a new operating segment called Cultivate. As a result, the Company will be managed in eight operating segments: the United States (excluding Cultivate), United Kingdom, Tilda, HPPC, Empire, Canada, Europe and Cultivate. The United States, excluding Cultivate, will be its own reportable segment. Cultivate will be combined with Canada and Europe and reported within the “Rest of World” reportable segment, as they do not currently meet the quantitative thresholds for segment reporting. There will be no changes to the United Kingdom and Hain Pure Protein reportable segments.
Another key initiative from Project Terra was the identification of global cost savings expected over the next three fiscal years, a portion of which the Company intends to reinvest into its brands. Additionally, the Company identified certain brands for divestment, which no longer fit into its core strategy for future growth. The disposal of these brands does not represent a strategic shift and is not expected to have a major effect on the Company's operations or financial results, as defined by ASC 205-20, Discontinued Operations; as a result, the disposals do not meet the criteria to be classified as discontinued operations.
Finally, in connection with Project Terra, the Company, with the assistance of outside consultants, engaged in an evaluation of its trade investment in the United States segment. Based on this assessment, the Company determined that its trade investment could be utilized more effectively, and therefore, beginning in fiscal 2017, the Company developed plans to shift from a model of investing in trade at the non-consumer facing level to more consumer facing activities.
Acquisitions and Investments
We have acquired numerous companies and brands since our formation and intend to seek future growth through internal expansion as well as the acquisition of complementary brands. We consider the acquisition of organic, natural and “better-for-you” products companies or product lines to be a part of our business strategy. During fiscal year 2016, we acquired Orchard House Foods Limited (“Orchard House”), a leader in prepared fruit, juices, fruit desserts and ingredients in the United Kingdom. The acquisition required formal clearance by the Competition and Markets Authority (“CMA”) in the United Kingdom and, as a result of the CMA’s review, the Company agreed to divest of its own-label juice business in the fourth quarter fiscal 2016. Also during fiscal 2016, we acquired Formatio Beratungs- und Beteiligungs GmbH and its subsidiaries (“Mona”), a leader in plant-based foods and
35
beverages under the Joya® brand with facilities in Germany and Austria. See Note 5, Acquisitions, in the Notes to Consolidated Financial Statements included in Item 8 of this Form 10-K.
During fiscal year 2016, we acquired a 14.9% interest in Chop’t Creative Salad Company LLC (“Chop’t”). Chop’t develops and operates fast-casual, fresh salad restaurants in the Northeast and Mid-Atlantic United States. See Note 14, Investments and Joint Ventures, in the Notes to Consolidated Financial Statements included in Item 8 of this Form 10-K.
Goodwill and Tradename Impairment
The Company completed its annual goodwill impairment analysis in the fourth quarter of fiscal 2016 in conjunction with its budgeting and forecasting process for fiscal 2017. There were no indicators of impairment at any of the Company’s reporting units with the exception of the Hain Daniels reporting unit within the United Kingdom segment (“Hain Daniels”). Projected long-term revenue growth rates and profitability levels for Hain Daniels are no longer expected to materialize as previously projected due to increased competition, changes in market trends, and the mix of products sold. With the assistance of a third party valuation firm, the Company recognized a goodwill impairment charge of $82.6 million during the fourth quarter of fiscal 2016 for Hain Daniels. See Note 8, Goodwill and Other Intangible Assets, in the Notes to the Consolidated Financial Statements in Item 8 of this Form 10-K.
Additionally, as part of the acquisition of Orchard House, a goodwill impairment charge of $1.9 million was recorded in the United Kingdom segment during the fourth quarter of fiscal 2016, related to the divestiture of certain portions of the Company’s own-label juice business. See Note 5, Acquisitions, in the Notes to the Consolidated Financial Statements in Item 8 of this Form 10-K.
Indefinite-lived intangible assets are evaluated on an annual basis, in conjunction with the Company’s evaluation of goodwill. The result of this assessment indicated that the fair value of certain of the Company’s tradenames were below their respective carrying values, and therefore an additional impairment charge of $39.7 million ($20.9 million in the United Kingdom segment and $18.8 million in the United States segment) was recognized during the fourth quarter of fiscal 2016. See Note 8, Goodwill and Other Intangible Assets, in the Notes to the Consolidated Financial Statements in Item 8 of this Form 10-K.
36
Results of Operations
Comparison of Fiscal Year ended June 30, 2016 to Fiscal Year ended June 30, 2015
Consolidated Results
The following table compares our results of operations, including as a percentage of net sales, on a consolidated basis, for the fiscal years ended June 30, 2016 and 2015 (amounts in thousands, other than percentages which may not add due to rounding):
Fiscal Year ended June 30, | Change in | |||||||||||||||||||
2016 | 2015 (Revised) | Dollars | Percentage | |||||||||||||||||
Net sales | $ | 2,885,374 | 100.0 | % | $ | 2,609,613 | 100.0 | % | $ | 275,761 | 10.6 | % | ||||||||
Cost of sales | 2,271,243 | 78.7 | % | 2,046,758 | 78.4 | % | 224,485 | 11.0 | % | |||||||||||
Gross profit | 614,131 | 21.3 | % | 562,855 | 21.6 | % | 51,276 | 9.1 | % | |||||||||||
Selling, general and administrative expenses | 303,763 | 10.5 | % | 302,827 | 11.6 | % | 936 | 0.3 | % | |||||||||||
Amortization of acquired intangibles | 18,869 | 0.7 | % | 17,846 | 0.7 | % | 1,023 | 5.7 | % | |||||||||||
Acquisition related expenses, restructuring and integration charges | 16,867 | 0.6 | % | 8,320 | 0.3 | % | 8,547 | 102.7 | % | |||||||||||
Goodwill impairment | 84,548 | 2.9 | % | — | — | 84,548 | n/a | |||||||||||||
Tradename impairment | 39,724 | 1.4 | % | — | — | 39,724 | n/a | |||||||||||||
Operating income | 150,360 | 5.2 | % | 233,862 | 9.0 | % | (83,502 | ) | (35.7 | )% | ||||||||||
Interest and other financing expense, net | 25,161 | 0.9 | % | 25,973 | 1.0 | % | (812 | ) | (3.1 | )% | ||||||||||
Other (income)/expense, net | 16,543 | 0.6 | % | 4,689 | 0.2 | % | 11,854 | 252.8 | % | |||||||||||
Gain on sale of business | — | — | (9,669 | ) | (0.4 | )% | 9,669 | (100.0 | )% | |||||||||||
Gain on fire insurance recovery | (9,752 | ) | (0.3 | )% | — | — | (9,752 | ) | n/a | |||||||||||
Income before income taxes and equity in earnings of equity-method investees | 118,408 | 4.1 | % | 212,869 | 8.2 | % | (94,461 | ) | (44.4 | )% | ||||||||||
Provision for income taxes | 70,932 | 2.5 | % | 48,535 | 1.9 | % | 22,397 | 46.1 | % | |||||||||||
Equity in net loss (income) of equity-method investees | 47 | — | (628 | ) | — | 675 | 107.5 | % | ||||||||||||
Net income | $ | 47,429 | 1.6 | % | $ | 164,962 | 6.3 | % | $ | (117,533 | ) | (71.2 | )% | |||||||
Adjusted EBITDA | $ | 379,062 | 13.1 | % | $ | 371,747 | 14.2 | % | $ | 7,315 | 2.0 | % | ||||||||
Net Sales
Net sales in fiscal 2016 were $2.89 billion, an increase of $275.8 million, or 10.6%, from net sales of $2.61 billion in fiscal 2015. Foreign currency exchange rates resulted in decreased net sales of $69.2 million as compared to the prior year. On a constant currency basis, net sales increased 13.2% from the prior year. The sales increase primarily resulted from the acquisitions of Orchard House in December 2015, Mona in July 2015, Empire in March 2015 and Belvedere in February 2015, which collectively accounted for approximately $317.5 million of net sales in fiscal 2016 and $57.1 million in the prior year. Additionally, in the prior year period, sales were negatively impacted by $15.8 million of sales returns related to the voluntary nut butter recall announced in August 2014, which did not impact net sales in fiscal 2016.
Gross Profit
Gross profit in fiscal 2016 was $614.1 million, an increase of $51.3 million, or 9.1%, from last year’s gross profit of $562.9 million.
The increase in gross profit in fiscal 2016 was due to the increased sales resulting from the aforementioned acquisitions as well as gross profit in fiscal 2015 being negatively impacted by $15.8 million of sales returns and $13.6 million of inventory write-offs and other cost of goods sold charges related to the voluntary nut butter recall in August 2014. Gross profit margin was 21.3% of sales, a decrease of 30 basis points year-over-year, when compared to gross profit margin in fiscal 2015 of 21.6%, which included the negative effect of the nut butter recall. Gross profit margin in fiscal 2016 was negatively impacted by foreign currency exchange rates, lower gross margins on acquisitions, competitive pricing on Spectrum coconut oils, BluePrint and certain HPPC products, factory start-up and chiller breakdown costs within our HPPC, as well as increased trade spending. This was partially offset by
37
fiscal 2016 incurring $0.7 million of start-up costs of certain lines in our chilled desserts factory in the United Kingdom compared to $10.7 million in the prior year.
Selling, General and Administrative Expenses
Selling, general and administrative expenses were $303.8 million, an increase of $0.9 million, or 0.3%, in fiscal 2016 from $302.8 million in fiscal 2015. Selling, general and administrative expenses increased primarily due to the incremental costs of $17.4 million brought on by the recent acquisitions of Orchard House, Mona and Empire, and $4.7 million of incremental spend related to our packaging launch and transition of K-cup products from Keurig Green Mountain, as well as an increase in selling expenses at Tilda of $2.7 million. These increases were offset by $15.2 million of reduced incentive compensation, savings from current and prior years headcount reductions and other benefit cost savings. Additionally, the prior year included costs related to the nut butter voluntary recall of $4.9 million as well as $5.7 million of charges related to a legal settlement. Selling, general and administrative expenses as a percentage of net sales was 10.5% in fiscal 2016 and 11.6% in the prior year, a decrease of 110 basis points, primarily attributable to the aforementioned items, as well as the achievement of additional operating leverage with the impact of acquisitions.
Amortization of Acquired Intangibles
Amortization of acquired intangibles was $18.9 million in fiscal 2016, an increase of $1.0 million, or 5.7%, from $17.8 million in fiscal 2015. The increase in amortization expense was due to the intangibles acquired as a result of the Company’s recent acquisitions.
Acquisition Related Expenses, Restructuring and Integration Charges
We incurred acquisition related expenses, restructuring and integration charges of $16.9 million in fiscal 2016, which consisted primarily of a long-lived asset impairment charge of $3.5 million related to the divestiture of certain portions of our own-label juice business in connection with our acquisition of Orchard House in the United Kingdom (see Note 5, Acquisitions), stamp duty and professional fees associated with the Orchard House and Mona acquisitions, $6.7 million of severance costs for a recent internal restructuring, most of which occurred in the United States, and additional contingent consideration expense for our Belvedere acquisition of $1.5 million.
We incurred acquisition related expenses, restructuring and integration charges aggregating to $8.3 million in fiscal 2015, which primarily related to professional fees, severance and other transaction costs associated with the three acquisitions completed in fiscal 2015, as well as a portion of the total costs incurred to complete the acquisition of Mona, which occurred in July 2015. Additionally, we wrote-off $1.0 million of leasehold improvements (a non-cash charge) due to the relocation of our New York based BluePrint manufacturing facility. Finally, we incurred $1.7 million of severance charges associated with the BluePrint manufacturing facility relocation as well as for the outsourcing of our natural channel merchandising function.
Goodwill Impairment
During the fourth quarter of fiscal 2016, we recorded a goodwill impairment charge of $82.6 million related to our Hain Daniels reporting unit in the United Kingdom. Additionally, as part of the acquisition of Orchard House and the related divestiture of certain portions of the Company’s own-label juice business, a goodwill impairment charge of $1.9 million was recorded during fiscal 2016. See Note 8, Goodwill and Other Intangible Assets, in the Notes to the Consolidated Financial Statements included in Item 8 of this Form 10-K.
Tradename Impairment
During the fourth quarter of fiscal 2016, we recorded a pre-tax impairment charge of $39.7 million ($20.9 million related to the United Kingdom segment and $18.8 million related to the United States segment) related to certain tradenames of the Company. There were no tradename impairment charges recorded in fiscal 2015. See Note 8, Goodwill and Other Intangible Assets, in the Notes to the Consolidated Financial Statements included in Item 8 of this Form 10-K.
Operating Income
Operating income in fiscal 2016 was $150.4 million, a decrease of $83.5 million, or 35.7%, from $233.9 million in fiscal 2015. Operating income as a percentage of net sales was 5.2% in fiscal 2016 compared with 9.0% in fiscal 2015. The decrease in operating income as a percentage of net sales resulted from the items described above.
38
Interest and Other Financing Expense, net
Interest and other financing expense, net totaled $25.2 million in fiscal 2016, a decrease of $0.8 million, or 3.1%, from $26.0 million in the prior year. Interest and other financing expense, net decreased primarily as a result of lower average borrowings under Tilda’s short-term borrowing arrangements, the redemption of our senior notes in the fourth quarter of fiscal 2016, as well as lower average interest rate on borrowings under our Credit Agreement starting in December 2014, when our Credit Agreement was amended.
Other (Income)/Expense, net
Other (income)/expense, net totaled $16.5 million of expense in fiscal 2016, an increase of $11.9 million, or 252.8% from $4.7 million of expense in the prior year. Included in other (income)/expense, net were net unrealized foreign currency losses, which were higher in the current year than the prior year principally due to the effect of foreign currency movements on the remeasurement of foreign currency denominated intercompany balances.
Gain on Sale of Business
The gain on sale of business for fiscal 2015 was the result of a $9.7 million non-cash gain on the Company’s pre-existing ownership interests in HPPC and Empire. See Note 5, Acquisitions, in the Notes to the Consolidated Financial Statements included in Item 8 of this Form 10-K. There were no such gains recorded during fiscal 2016.
Gain on Fire Insurance Recovery
The gain on fire insurance recovery of $9.8 million was the result of fixed assets purchased with insurance proceeds that exceeded the net book value of fixed assets destroyed in the fire that occurred at our Tilda rice milling facility in the second quarter of fiscal 2015.
Income Before Income Taxes and Equity in Earnings of Equity-Method Investees
Income before income taxes and equity in the after tax earnings of our equity-method investees for the fiscal years ended June 30, 2016 and 2015 was $118.4 million and $212.9 million, respectively. The decrease was due to the items discussed above.
Provision for Income Taxes
The provision for income taxes includes federal, foreign, state and local income taxes. Our income tax expense was $70.9 million in fiscal 2016 compared to $48.5 million in fiscal 2015.
Our effective income tax rate from continuing operations was 59.9% of pre-tax income in fiscal 2016 compared to 22.8% in fiscal 2015. The effective tax rate in fiscal 2016 was unfavorably impacted primarily by the impairment of goodwill related to our Hain Daniels reporting unit in the United Kingdom for which there is no income tax benefit, net valuation allowances for intangibles and net operating losses, non-deductible unrealized foreign exchange losses, offset by the geographical mix of earnings. The effective tax rate for fiscal 2016 was favorably impacted by a reduction in the U.K. statutory tax rate enacted in the second quarter of 2016 resulting in a $4.9 million decrease in U.K. deferred tax liabilities, as well as a $4.2 million decrease for the reversal of prior year foreign exchange losses on the restructure of our U.K. debt obligations. The effective tax rate for fiscal 2015 was favorably impacted by $20.7 million for a tax restructuring completed at the end of fiscal 2015 whereby we changed the United States tax status of our Canadian subsidiary. The effective rate for fiscal 2015 was also favorably impacted by $2.8 million for the non-taxable gain recorded on the pre-existing ownership interests in HPPC and Empire.
Our effective tax rate may change from period-to-period based on recurring and non-recurring factors including the geographical mix of earnings, enacted tax legislation, state and local income taxes and tax audit settlements. See Note 11, Income Taxes, in the Notes to Consolidated Financial Statements included in Item 8 of this Form 10-K.
39
Equity in Net Loss (Income) of Equity-Method Investees
Our equity in the net loss (income) from our equity method investments for the fiscal year ended June 30, 2016 was essentially break-even compared to income of $0.6 million for the fiscal year ended June 30, 2015. See Note 14, Investments and Joint Ventures, in the Notes to Consolidated Financial Statements included in Item 8 of this Form 10-K.
Net Income
Net income for the fiscal years ended June 30, 2016 and 2015 was $47.4 million and $165.0 million, or $0.46 and $1.60 per diluted share, respectively. The change was attributable to the factors noted above.
Adjusted EBITDA
Our consolidated Adjusted EBITDA was $379.1 million and $371.7 million in the fiscal years ended June 30, 2016 and 2015, respectively, as a result of the factors discussed above. See Reconciliation of Non-U.S. GAAP Financial Measures to U.S. GAAP Measures following the discussion of our results of operations for definitions and a reconciliation from our net income to Adjusted EBITDA.
Segment Results
The following table provides a summary of net sales and operating income by reportable segment for the fiscal years ended June 30, 2016 and 2015:
(dollars in thousands) | United States | United Kingdom | Hain Pure Protein | Rest of World | Corporate and Other | Consolidated | ||||||||||||||||||
Fiscal 2016 net sales | $ | 1,321,547 | $ | 774,877 | $ | 492,510 | $ | 296,440 | $ | — | $ | 2,885,374 | ||||||||||||
Fiscal 2015 net sales (Revised) | $ | 1,325,996 | $ | 722,830 | $ | 337,197 | $ | 223,590 | $ | — | $ | 2,609,613 | ||||||||||||
$ change | $ | (4,449 | ) | $ | 52,047 | $ | 155,313 | $ | 72,850 | n/a | $ | 275,761 | ||||||||||||
% change | (0.3 | )% | 7.2 | % | 46.1 | % | 32.6 | % | n/a | 10.6 | % | |||||||||||||
Fiscal 2016 operating income (loss) | $ | 209,099 | $ | 56,000 | $ | 31,558 | $ | 22,280 | $ | (168,577 | ) | $ | 150,360 | |||||||||||
Fiscal 2015 operating income (loss) (Revised) | $ | 188,054 | $ | 44,985 | $ | 28,685 | $ | 15,210 | $ | (43,072 | ) | $ | 233,862 | |||||||||||
$ change | $ | 21,045 | $ | 11,015 | $ | 2,873 | $ | 7,070 | $ | (125,505 | ) | $ | (83,502 | ) | ||||||||||
% change | 11.2 | % | 24.5 | % | 10.0 | % | 46.5 | % | 291.4 | % | (35.7 | )% | ||||||||||||
Fiscal 2016 operating income margin | 15.8 | % | 7.2 | % | 6.4 | % | 7.5 | % | n/a | 5.2 | % | |||||||||||||
Fiscal 2015 operating income margin (Revised) | 14.2 | % | 6.2 | % | 8.5 | % | 6.8 | % | n/a | 9.0 | % | |||||||||||||
United States
Our net sales in the United States in fiscal 2016 were $1.32 billion, a decrease of $4.4 million, or 0.3%, from net sales of $1.33 billion in fiscal 2015. The sales decrease was principally driven by overall increased competition for our Rudi’s, Spectrum and Earth’s Best brands, lower tea consumption related to a packaging change at Celestial Seasonings, as well as increased trade spend. Sales were also negatively impacted by foreign currency exchange rates of $5.2 million as compared to the prior year. Sales decreases were partially offset by continued consumption growth in our Sensible Portions®, Terra® and Garden of Eatin’® snacking brands and Avalon Organics®, Alba Botanica®, and JASON® personal care brands. Both fiscal 2016 and fiscal 2015 net sales benefited from certain concessions provided to our largest distributors, including payment terms beyond the customer’s standard terms, rights of return of product and post-sale concessions, most of which were associated with sales that occurred at the end of each respective quarter. Operating income in the United States in fiscal 2016 was $209.1 million, an increase of $21.0 million, or 11.2%, from operating income of $188.1 million in fiscal 2015. Fiscal 2015 was negatively impacted by charges totaling $34.3
40
million for the voluntary nut butter recall. During fiscal 2016, due to increased competition, we experienced competitive pricing with both Spectrum coconut oils and BluePrint juices, margin compression at Rudi’s Organic Bakery, Inc. (“Rudi’s”) due to sales mix, additional costs related to packaging changes at Celestial Seasonings and restructuring charges. These increases in expenses in 2016 were partially offset by $10.7 million of savings from reductions in headcount and incentive compensation as well as reduced amortization charges.
United Kingdom
Our net sales in the United Kingdom in fiscal 2016 were $774.9 million, an increase of $52.0 million, or 7.2%, from net sales of $722.8 million in fiscal 2015. Foreign currency exchange rates resulted in decreased net sales of $41.5 million as compared to the prior year. The increase in net sales was primarily due to the acquisition of Orchard House, acquired in the second quarter of fiscal 2016, which accounted for $88.6 million of net sales in current year, as well as growth in our chilled desserts business and incremental business in fruit and hot eating desserts, which was partially offset by decreased sales of a secondary rice brand. Operating income in the United Kingdom segment for fiscal 2016 was $56.0 million, an increase of $11.0 million, or 24.5%, from $45.0 million in fiscal 2015. The increase in operating income was due to the recent acquisition of Orchard House and a $9.9 million reduction of factory start-up costs at our chilled desserts facility in fiscal 2016 as compared to the prior year. Additionally, operating income increased at Tilda as a result of improved procurement of raw materials as compared to the prior year period.
Hain Pure Protein
Our net sales in the Hain Pure Protein segment were $492.5 million in fiscal 2016, an increase of $155.3 million, or 46.1%, from net sales of $337.2 million in fiscal 2015. The sales increase was primarily the result of our acquisition of Empire in March 2015, which accounted for $140.4 million of net sales in fiscal 2016, as compared to $46.6 million in the prior year. Additionally, our sales volume increased at HPPC due to a shortage of supply within poultry farms in the Midwest, for which Hain Pure Protein Corporation (“HPPC”) was not affected. Operating income in the segment for fiscal 2016 was $31.6 million, an increase of $2.9 million, or 10.0%, from $28.7 million in the prior year. The increase in operating income was the result of the aforementioned items, lower commodity prices and productivity initiatives, partially offset by $3.5 million related to a chiller breakdown and resultant temporary stop in production at one of our HPPC turkey facilities.
Rest of World
Our net sales in the Rest of World were $296.4 million in fiscal 2016, an increase of $72.9 million, or 32.6%, from net sales of $223.6 million in fiscal 2015. Foreign currency exchange rates resulted in decreased net sales of $22.5 million as compared to the prior year. The sales increase was primarily the result of the acquisitions of Mona and Belvedere, which collectively accounted for $88.5 million of net sales in the period, as compared to $10.4 million in the prior year. Operating income in the segment for fiscal 2016 was $22.3 million, an increase of $7.1 million, or 46.5%, from $15.2 million in fiscal 2015. Operating income increased primarily due to our acquisitions of Mona in the current fiscal year and Belvedere, which was acquired in the third quarter of fiscal 2015, offset partially by increased product costs of our United States dollar denominated purchases as well as the negative impact of foreign currency.
Corporate and Other
The Corporate and Other category consists of expenses related to the Company’s centralized administrative function which do not specifically relate to an operating segment. Such Corporate and Other expenses are comprised mainly of the compensation and related expenses of certain of the Company’s senior executive officers and other employees who perform duties related to our entire enterprise, as well as expenses for certain professional fees, facilities and other items which benefit the Company as a whole. Additionally, acquisition related expenses, restructuring and integration charges are included in Corporate and Other. Corporate and Other included $15.5 million and $8.2 million of acquisition related expenses, restructuring and integration charges for the fiscal years ended June 30, 2016 and 2015, respectively. Additionally, for fiscal 2016, the Corporate and Other category included a goodwill impairment charge of $84.5 million for the fiscal year ended June 30, 2016 related to the United Kingdom segment and an impairment charge of $39.7 million ($20.9 million related to the United Kingdom segment and $18.8 million related to the United States segment) on certain of the Company’s tradenames. See Note 8, Goodwill and Other Intangible Assets, in the Notes to Consolidated Financial Statements included in Item 8 of this Form 10-K.
Refer to Note 18, Segment Information, in the Notes to the Consolidated Financial Statements included in Item 8 of this Form 10-K for additional details.
41
Comparison of Fiscal Year ended June 30, 2015 to Fiscal Year ended June 30, 2014
Consolidated Results
The following table compares our results of operations, including as a percentage of net sales, on a consolidated basis, for the fiscal years ended June 30, 2015 and 2014 (amounts in thousands, other than percentages which may not add due to rounding):
Fiscal Year ended June 30, | Change in | |||||||||||||||||||
2015 (Revised) | 2014 (Revised) | Dollars | Percentage | |||||||||||||||||
Net sales | $ | 2,609,613 | 100.0 | % | $ | 2,107,822 | 100.0 | % | $ | 501,791 | 23.8 | % | ||||||||
Cost of sales | 2,046,758 | 78.4 | % | 1,579,540 | 74.9 | % | 467,218 | 29.6 | % | |||||||||||
Gross profit | 562,855 | 21.6 | % | 528,282 | 25.1 | % | 34,573 | 6.5 | % | |||||||||||
Selling, general and administrative expenses | 302,827 | 11.6 | % | 279,510 | 13.3 | % | 23,317 | 8.3 | % | |||||||||||
Amortization of acquired intangibles | 17,846 | 0.7 | % | 15,440 | 0.7 | % | 2,406 | 15.6 | % | |||||||||||
Acquisition related expenses, restructuring and integration charges | 8,320 | 0.3 | % | 10,187 | 0.5 | % | (1,867 | ) | (18.3 | )% | ||||||||||
Tradename impairment | — | — | 6,399 | 0.3 | % | (6,399 | ) | (100.0 | )% | |||||||||||
Operating income | 233,862 | 9.0 | % | 216,746 | 10.3 | % | 17,116 | 7.9 | % | |||||||||||
Interest and other financing expense, net | 25,973 | 1.0 | % | 24,366 | 1.2 | % | 1,607 | 6.6 | % | |||||||||||
Other (income)/expense, net | 4,689 | 0.2 | % | (4,780 | ) | (0.2 | )% | 9,469 | 198.1 | % | ||||||||||
Gain on sale of business | (9,669 | ) | (0.4 | )% | — | — | (9,669 | ) | n/a | |||||||||||
Income before income taxes and equity in earnings of equity-method investees | 212,869 | 8.2 | % | 197,160 | 9.4 | % | 15,709 | 8.0 | % | |||||||||||
Provision for income taxes | 48,535 | 1.9 | % | 69,608 | 3.3 | % | (21,073 | ) | (30.3 | )% | ||||||||||
Equity in net (income) of equity- method investees | (628 | ) | — | (3,999 | ) | (0.2 | )% | 3,371 | 84.3 | % | ||||||||||
Income from continuing operations | 164,962 | 6.3 | % | 131,551 | 6.2 | % | 33,411 | 25.4 | % | |||||||||||
(Loss) from discontinued operations | — | — | (1,629 | ) | (0.1 | )% | 1,629 | 100.0 | % | |||||||||||
Net income | $ | 164,962 | 6.3 | % | $ | 129,922 | 6.2 | % | $ | 35,040 | 27.0 | % | ||||||||
Adjusted EBITDA | $ | 371,747 | 14.2 | % | $ | 308,295 | 14.6 | % | $ | 63,452 | 20.6 | % | ||||||||
Net Sales
Net sales in fiscal 2015 were $2.61 billion, an increase of $501.8 million, or 23.8%, from net sales of $2.11 billion in fiscal 2014.
Foreign currency exchange rates resulted in decreased net sales of $55.8 million as compared to the prior year. On a constant currency basis, net sales increased 26.5% from the prior year. The sales increase primarily resulted from the acquisitions of Empire in March 2015, Belvedere in February 2015 and HPPC in July 2014, which collectively accounted for approximately $352.1 million of net sales in fiscal 2015 and included the acquired businesses’ growth under our ownership. Additionally, the acquisition of Tilda and Rudi’s, completed in January 2014 and April 2014, respectively, resulted in additional net sales of approximately $140.8 million during fiscal 2015, as Tilda and Rudi’s were included in our consolidated results for less than six months and two months, respectively, in the prior year. In addition, net sales were negatively impacted by $15.8 million of sales returns in fiscal 2015 related to our voluntary recall of certain nut butters.
Gross Profit
Gross profit in fiscal 2015 was $562.9 million, an increase of $34.6 million, or 6.5%, from gross profit of $528.3 million in the prior year. The increase in gross profit primarily resulted from sales from the aforementioned acquisitions and growth attributable to the increases in the volume of our products sold, which was offset partially by $29.3 million in pre-tax charges related to our voluntary recall of certain nut butters. Such charges in fiscal 2015 included the aforementioned $15.8 million of sales returns and $13.6 million of inventory write-offs and other cost of goods sold charges, which collectively negatively impacted gross margin
42
by approximately 100 basis points. Additionally, we incurred incremental costs totaling $10.7 million associated with start-up and ramp-up of certain lines in our chilled desserts factory in the United Kingdom, whereas the incremental costs in the prior year totaled $2.1 million. Gross margin was unfavorably impacted by our recent acquisitions, principally the Hain Pure Protein segment, which operates at lower gross margins, and the items discussed above. Tilda operates at higher margins than the other businesses in the United Kingdom segment, and the Hain Pure Protein segment operates at lower margins than the Company’s other segments.
Selling, General and Administrative Expenses
Selling, general and administrative expenses were $302.8 million, an increase of $23.3 million, or 8.3%, in fiscal 2015 from $279.5 million in fiscal 2014. Selling, general and administrative expenses increased primarily as a result of the costs brought on by the businesses we acquired. In addition, during fiscal 2015, we recorded $4.9 million of charges for consumer refunds and other administrative costs associated with the voluntary nut butter recall and $5.7 million of charges related to a legal settlement. Selling, general and administrative expenses as a percentage of net sales were 11.6% in fiscal 2015 and 13.3% in fiscal 2014, a decrease of 170 basis points primarily attributable to achieving additional operating leverage on our infrastructure as a result of higher sales volume and the impact of the Hain Pure Protein segment which has a lower selling, general and administrative expense base than the other businesses. In addition, in fiscal 2015, we modified certain employee compensation by shifting a portion of such compensation from cash to stock-based compensation in order to enhance employee retention and further align employees with shareholder interests. We expect this practice of employee compensation to continue in the future.
Amortization of Acquired Intangibles
Amortization of acquired intangibles in fiscal 2015 was $17.8 million, an increase of $2.4 million, or 15.6%, from $15.4 million in fiscal 2014. The increase in amortization expense was due to the intangibles acquired as a result of the Company’s recent acquisitions.
Acquisition Related Expenses, Restructuring and Integration Charges
We incurred acquisition related expenses, restructuring and integration charges aggregating to $8.3 million in fiscal 2015, which primarily related to professional fees, severance and other transaction costs associated with the three acquisitions completed in fiscal 2015, as well as a portion of the total costs incurred to complete the acquisition of Mona, which occurred in July 2015. Additionally, we wrote-off $1.0 million of leasehold improvements (a non-cash charge) due to the relocation of our New York based BluePrint manufacturing facility. Finally, we incurred $1.7 million of severance charges associated with the relocation of our BluePrint manufacturing facility, as well as for the outsourcing of our natural channel merchandising function.
We incurred acquisition related expenses, restructuring and integration charges aggregating to $10.2 million in fiscal 2014, of which $7.9 million related to professional fees and stamp duty associated with our recently completed acquisitions. Additionally, we recorded $8.3 million of integration and restructuring costs related to the ongoing integration of certain activities in the United Kingdom and a sales reorganization in the United States. These expenses were offset by a net reduction in expense of $4.1 million related to adjustments to the carrying amount of acquisition related contingent consideration liabilities.
Tradename Impairment
During the fourth quarter of fiscal 2014, we recorded a pre-tax impairment charge of $6.4 million, related to one of the Company’s tradenames in the United Kingdom. There were no tradename impairment charges recorded in fiscal 2015. See Note 8, Goodwill and Other Intangible Assets, in the Notes to the Consolidated Financial Statements included in Item 8 of this Form 10-K.
Operating Income
Operating income in fiscal 2015 was $233.9 million, an increase of $17.1 million, or 7.9%, from $216.7 million in fiscal 2014. Operating income as a percentage of net sales was 9.0% in fiscal 2015 compared with 10.3% in fiscal 2014. Operating income as a percentage of net sales was negatively impacted by approximately 130 basis points due to the voluntary nut butter recall and, to a lesser extent, the other items described above.
Interest and Other Financing Expense, net
Interest and other financing expense, net totaled $26.0 million in fiscal 2015, an increase of $1.6 million, or 6.6%, from $24.4 million in the prior year. The increase in interest and other financing expense, net primarily resulted from higher average borrowings under our Credit Agreement, the proceeds of which were used to fund the acquisition of Empire and the prior year acquisitions of Tilda and Rudi’s.
43
Other (Income)/Expense, net
Other (income)/expense, net totaled $4.7 million of expense in fiscal 2015, an increase of $9.5 million, or 198.1% from $4.8 million of income in the prior year. Included in other (income)/expense, net are net unrealized foreign currency losses, which were higher in fiscal 2015 than the prior year principally due to the effect of foreign currency movements on the remeasurement of foreign currency denominated intercompany balances.
Gain on Sale of Business
In fiscal 2015, the gain on sale of business was the result of a $9.7 million non-cash gain on the Company’s pre-existing ownership interests in HPPC and Empire. See Note 5, Acquisitions, and Note 10, Debt and Borrowings, in the Notes to the Consolidated Financial Statements included in Item 8 of this Form 10-K. There were no such gains recorded during fiscal 2014.
Income Before Income Taxes and Equity in Earnings of Equity-Method Investees
Income before income taxes and equity in the after tax earnings of our equity-method investees for the fiscal years ended June 30, 2015 and 2014 was $212.9 million and $197.2 million, respectively. The change was due to the items discussed above.
Provision for Income Taxes
The provision for income taxes includes federal, foreign, state and local income taxes. Our income tax expense was $48.5 million in fiscal 2015 compared to $69.6 million in fiscal 2014.
Our effective income tax rate from continuing operations was 22.8% of pre-tax income in fiscal 2015 compared to 35.3% in fiscal 2014. The effective tax rate in fiscal 2015 was favorably impacted principally by $20.7 million for a tax restructuring completed at the end of fiscal 2015 whereby we changed the United States tax status of our Canadian subsidiary. The effective rate for fiscal 2015 was also favorably impacted by $2.8 million for the non-taxable gain recorded on the pre-existing ownership interests in HPPC and Empire. The effective tax rate for fiscal 2014 was favorably impacted by $3.7 million due to a reduction in the U.K. statutory tax rate enacted in the first quarter of fiscal 2014. The amount for fiscal 2014 was offset by a $4.0 million increase in the reserve for unrecognized tax benefits and a $2.2 million valuation allowance on German net operating losses (“NOLs”) due to start-up costs on our new plant-based beverage factory.
Our effective tax rate may change from period to period based on recurring and non-recurring factors including the geographical mix of earnings, enacted tax legislation, state and local income taxes and tax audit settlements. See Note 11, Income Taxes, in the Notes to Consolidated Financial Statements included in Item 8 of this Form 10-K.
Equity in Net Income of Equity-Method Investees
Our equity in the net income from our equity-method investments for the fiscal year ended June 30, 2015 was $0.6 million compared to $4.0 million for the fiscal year ended June 30, 2014. HPPC earnings are reflected in operating income for fiscal 2015 rather than as equity earnings for fiscal 2014, which accounts for the decrease in equity earnings. See Note 5, Acquisitions, and Note 14, Investments and Joint Ventures, in the Notes to the Consolidated Financial Statements included in Item 8 of this Form 10-K.
Income From Continuing Operations
Income from continuing operations for the fiscal years ended June 30, 2015 and 2014 was $165.0 million and $131.6 million, respectively, or $1.60 and $1.32 per diluted share, respectively. The change was attributable to the factors noted above.
Loss From Discontinued Operations, Net of Tax
Our loss from discontinued operations for the fiscal year ended June 30, 2014 was $1.6 million, which primarily related to a $2.8 million loss on the sale of the Grains Noirs business in Europe in February 2014, offset partially by a gain of $1.1 million related to the finalization of a working capital adjustment on the sale of the private-label chilled ready meals business in the United Kingdom, which was completed in fiscal 2013.
44
Net Income
Net income for the fiscal years ended June 30, 2015 and 2014 was $165.0 million and $129.9 million, or $1.60 and $1.30 per diluted share, respectively. The change was attributable to the factors noted above.
Adjusted EBITDA
Our consolidated Adjusted EBITDA was $371.7 million and $308.3 million in the fiscal years ended June 30, 2015 and 2014, respectively, as a result of the factors discussed above. See Reconciliation of Non-U.S. GAAP Financial Measures to U.S. GAAP Measures following the discussion of our results of operations for definitions and a reconciliation from our net income to Adjusted EBITDA.
Segment Results
The following table provides a summary of net sales and operating income by reportable segment for the fiscal years ended June 30, 2015 and 2014:
(dollars in thousands) | United States | United Kingdom | Hain Pure Protein | Rest of World | Corporate and Other | Consolidated | ||||||||||||||||||
Fiscal 2015 net sales (Revised) | $ | 1,325,996 | $ | 722,830 | $ | 337,197 | $ | 223,590 | $ | — | $ | 2,609,613 | ||||||||||||
Fiscal 2014 net sales (Revised) | $ | 1,247,113 | $ | 628,828 | $ | — | $ | 231,881 | $ | — | $ | 2,107,822 | ||||||||||||
$ change | $ | 78,883 | $ | 94,002 | $ | 337,197 | $ | (8,291 | ) | n/a | $ | 501,791 | ||||||||||||
% change | 6.3 | % | 14.9 | % | n/a | (3.6 | )% | n/a | 23.8 | % | ||||||||||||||
Fiscal 2015 operating income (Revised) | $ | 188,054 | $ | 44,985 | $ | 28,685 | $ | 15,210 | $ | (43,072 | ) | $ | 233,862 | |||||||||||
Fiscal 2014 operating income (Revised) | $ | 201,063 | $ | 49,509 | $ | — | $ | 16,749 | $ | (50,575 | ) | $ | 216,746 | |||||||||||
$ change | $ | (13,009 | ) | $ | (4,524 | ) | $ | 28,685 | $ | (1,539 | ) | $ | 7,503 | $ | 17,116 | |||||||||
% change | (6.5 | )% | (9.1 | )% | n/a | (9.2 | )% | (14.8 | )% | 7.9 | % | |||||||||||||
Fiscal 2015 operating income margin (Revised) | 14.2 | % | 6.2 | % | 8.5 | % | 6.8 | % | n/a | 9.0 | % | |||||||||||||
Fiscal 2014 operating income margin (Revised) | 16.1 | % | 7.9 | % | n/a | 7.2 | % | n/a | 10.3 | % | ||||||||||||||
United States
Our net sales in the United States in fiscal 2015 were $1.33 billion, an increase of $78.9 million, or 6.3%, from net sales of $1.25 billion in fiscal 2014. The sales increase was principally driven by $70.2 million of base business growth through increased consumption and expanded distribution, which was negatively impacted by foreign currency exchange rates of $2.7 million as compared to the prior year. In particular, we experienced volume growth in many of our brands, including Sensible Portions, Earth’s Best, Terra, The Greek Gods, Garden of Eatin’, Avalon Organics, Alba Botanica and JASON. Additionally, fiscal 2015was impacted favorably by the acquisition of Rudi’s during the fourth quarter of fiscal 2014, which increased sales by $54.3 million during fiscal 2015 compared to the prior year. These increases were partially offset by $45.7 million of decreased nut butter sales during fiscal 2015 as compared to the prior year as a result of the our voluntary recall as well as an increased rate of trade spend. Both fiscal 2014 and fiscal 2015 net sales benefited from certain concessions provided to our largest distributors, including payment terms beyond the customer’s standard terms, rights of return of product and post-sale concessions, most of which were associated with sales that occurred at the end of the quarters. Operating income in the United States in fiscal 2015 was $188.1 million, a decrease of $13.0 million, or 6.5%, from operating income of $201.1 million in fiscal 2014. Operating income in fiscal 2015 was negatively impacted by charges totaling $34.3 million for the voluntary nut butter recall, including additional factory expenses
45
associated with bringing our nut butter production facility back to full operations, as well as $2.7 million of expenses associated with the restructuring and relocation of our New York based BluePrint manufacturing facility and the outsourcing of our natural channel merchandising function. These charges negatively impacted operating income percentage by approximately 260 basis points.
United Kingdom
Our net sales in the United Kingdom in fiscal 2015 were $722.8 million, an increase of $94.0 million, or 14.9%, from net sales of $628.8 million in fiscal 2014. Foreign currency exchange rates resulted in decreased net sales of $29.2 million as compared to the prior year period. The sales increase was primarily a result of the acquisition of Tilda in January 2014, which accounted for approximately $88.2 million of the increase. Additionally, net sales increased due to a shift in the responsibilities for certain plant-based beverage business from the management of the Europe operating segment to the United Kingdom operating segment, which increased the United Kingdom’s net sales by approximately $8.7 million. Operating income in the United Kingdom in fiscal 2015 was $45.0 million, a decrease of $4.5 million, or 9.1%, from $49.5 million in fiscal 2014. The change in operating income in fiscal 2015 was due to incremental costs totaling $10.7 million associated with start-up and ramp-up activities in our chilled desserts factory in the United Kingdom, whereas the incremental costs in the prior fiscal year totaled $3.1 million, which also included start-up costs of new lines at the Company’s soup manufacturing facility and additional costs at Tilda related to service fees from the India sourcing business prior to June 18, 2014, the date we acquired those sourcing assets and business. Additionally, during fiscal 2015, there was a fire at our Tilda milling facility that required us to temporarily use co-packers, which affected the timing and amount of product available to be sold. We were insured for the costs incurred as a result of the fire, and the milling facility was fully functional at the end of the third quarter of fiscal 2016.
Hain Pure Protein
Our net sales in the Hain Pure Protein segment were $337.2 million in fiscal 2015. The remaining 51.3% of HPPC that was not previously owned was acquired on July 17, 2014, and the remaining 81% of Empire that was not previously owned was acquired on March 4, 2015. Hain Pure Protein’s operating income for fiscal 2015 was $28.7 million. See Note 5, Acquisitions, in the Notes to Consolidated Financial Statements included in Item 8 of this Form 10-K.
Rest of World
Our net sales in the Rest of World were $223.6 million in fiscal 2015, a decrease of $8.3 million, or 3.6%, from fiscal 2014. Foreign currency exchange rates resulted in decreased net sales of $24.0 million as compared to the prior year. In Canada, we completed the acquisition of Belvedere in February 2015, which only resulted in a nominal amount of net sales in fiscal 2015 due to the timing of the acquisition. Canada was also negatively impacted by the disruption of business due to the voluntary nut butter recall. In Europe, net sales also changed due to a shift in the responsibilities for certain plant-based beverage business from the management of the Europe operating segment to the United Kingdom operating segment, which lowered Europe’s net sales by approximately $8.7 million. Additionally, during fiscal 2014, we disposed of the Grains Noirs business and a private label plant-based beverage business was discontinued. Operating income in the Rest of World in fiscal 2015 was $15.2 million, a decrease of $1.5 million, or 9.2%, from operating income of $16.7 million in fiscal 2014. The decrease was primarily due to the aforementioned items. Operating income in local currency, excluding the impact of the plant-based beverage withdrawal, increased as demand for our products in both Canada and Europe remained strong and we continued to leverage our existing expense base.
Corporate and Other
The Corporate and Other category consists of expenses related to the Company’s centralized administrative function which do not specifically relate to an operating segment. Such corporate expenses are comprised mainly of the compensation and related expenses of certain of the Company’s senior executive officers and other employees who perform duties related to our entire enterprise, as well as expenses for certain professional fees, facilities, and other items which benefit the Company as a whole. Additionally, acquisition related expenses, restructuring and integration charges are included in Corporate and Other. Corporate and Other includes $8.2 million and $7.1 million of acquisition related expenses, and restructuring and integration charges for the fiscal years ended June 30, 2015 and 2014, respectively. A non-cash impairment charge of $6.4 million for the fiscal year ended June 30, 2014 related to indefinite-lived intangible assets (tradenames) in the United Kingdom segment is also included in Corporate and Other.
Refer to Note 18, Segment Information, in the Notes to the Consolidated Financial Statements included in Item 8 of this Form 10-K for additional details.
46
Liquidity and Capital Resources
We finance our operations and growth primarily with the cash flows we generate from our operations and from both long-term fixed-rate borrowings and borrowings available to us under our credit agreement.
Our cash and cash equivalents balance decreased $39.0 million at June 30, 2016 to $127.9 million when compared to $166.9 million at June 30, 2015. Our working capital was $543.2 million at June 30, 2016, an increase of $5.8 million from $537.4 million at the end of fiscal 2015.
Liquidity is affected by many factors, some of which are based on normal ongoing operations of the Company’s business and some of which arise from fluctuations related to global economics and markets. The Company’s cash balances are held in the United States, United Kingdom, Canada, Europe and India. It is the Company’s current intent to indefinitely reinvest its foreign earnings outside the United States. As of June 30, 2016, approximately 66.2% ($84.7 million) of the total cash balance is held outside of the United States. Although a portion of the consolidated cash balances are maintained outside of the United States, the Company’s current plans do not demonstrate a need to repatriate these balances to fund its United States operations. If these funds were to be needed for the Company’s operations in the United States, it may be required to record and pay significant United States income taxes to repatriate these funds.
We maintain our cash and cash equivalents primarily in money market funds or their equivalent. As of June 30, 2016, all of our investments were expected to mature in less than three months. Accordingly, we do not believe that our investments have significant exposure to interest rate risk. Cash provided by (used in) operating, investing and financing activities is summarized below.
Fiscal Year ended June 30 | |||||||||||
(amounts in thousands) | 2016 | 2015 | 2014 | ||||||||
Cash flows provided by (used in): | |||||||||||
Operating activities | $ | 206,575 | $ | 185,482 | $ | 184,768 | |||||
Investing activities | (234,345 | ) | (151,300 | ) | (206,236 | ) | |||||
Financing activities | 69 | 17,167 | 100,821 | ||||||||
Effect of exchange rate changes on cash | (11,295 | ) | (8,178 | ) | 3,135 | ||||||
Net (decrease) increase in cash and cash equivalents | $ | (38,996 | ) | $ | 43,171 | $ | 82,488 | ||||
Net cash provided by operating activities was $206.6 million for the fiscal year ended June 30, 2016, compared to $185.5 million provided in fiscal 2015 and $184.8 million in fiscal 2014. The increase in cash provided by operating activities in fiscal 2016 primarily resulted from net income adjusted for non-cash charges offset in part by an increase in cash used to support working capital requirements of $54.1 million.
In the fiscal year ended June 30, 2016, $234.3 million of cash was used in investing activities. We used $157.1 million, net, of cash acquired in connection with our acquisitions, which was principally associated with the acquisitions of Orchard House and Mona, our investment in Chop’t and $77.3 million for capital expenditures as discussed further below. We used cash in investing activities of $151.3 million during the fiscal year ended June 30, 2015, which was principally for the acquisitions of HPPC, Empire and Belvedere and for capital expenditures. We used cash in investing activities of $206.2 million during the fiscal year ended June 30, 2014, principally for the acquisitions of Tilda and Rudi’s and capital expenditures, offset partially by repayments of borrowings from HPPC when it was an equity-method investment.
Net cash of $0.1 million was provided by financing activities for the fiscal year ended June 30, 2016. We had net borrowings of $323.9 million, which was primarily used to fund the acquisitions of Orchard House, Mona and Chop’t, partially offset by the repayment of our $150 million of senior notes outstanding using existing capacity under our revolving credit facility. Additionally, we paid $25.5 million during fiscal 2016 for stock repurchases to satisfy employee payroll tax withholdings and recognized $11.3 million of excess tax benefits from stock based compensation. Net cash of $17.2 million was provided by financing activities for the fiscal year ended June 30, 2015. We had proceeds from exercises of stock options and restricted stock awards of $18.6 million and related excess tax benefits of $25.7 million. We also had net borrowings of $92.0 million under our Credit Agreement, which was primarily used to fund the acquisition of Empire as well as subsequently repay HPPC’s acquired borrowings. We had net short-term borrowing repayments of $54.9 million, which were principally related to the aforementioned repayment of HPPC’s acquired borrowings as well as net repayments related to the timing of rice purchases. In addition, we paid $18.1 million during fiscal 2015 for stock repurchases to satisfy employee payroll tax withholdings. During fiscal 2014, net cash of $100.8 million was provided by financing activities which was primarily related to borrowings under our Credit Agreement used to fund the acquisitions of Tilda and Rudi’s.
47
Operating Free Cash Flow
Our operating free cash flow was $129.3 million for the fiscal year ended June 30, 2016, a decrease of $5.0 million from the fiscal year ended June 30, 2015. The decrease in operating free cash flow primarily resulted from an increase in our capital expenditures principally related to the purchase of a new factory location and production equipment at HPPC to accommodate the current demand in this segment, as well as the expansion of production lines at both our Tilda ready-to-heat rice facility in the United Kingdom and our plant-based beverage facilities in Europe to accommodate new products and increased volume. This decrease was offset partially by an increase in cash provided by operating activities due to an increase in net income adjusted for non-cash charges, offset by an increase in cash used to support working capital requirements of $54.1 million. We expect that our capital spending for the next fiscal year will be approximately $70.0 million. We refer the reader to the Reconciliation of Non-U.S. GAAP Financial Measures to U.S. GAAP Measures following the discussion of our results of operations for definitions and a reconciliation from our net cash provided by operating activities to operating free cash flow.
Credit Agreement
On December 12, 2014, we entered into the Second Amended and Restated Credit Agreement (the “Credit Agreement”) which provides us with a $1.0 billion revolving credit facility which may be increased by an additional uncommitted $350.0 million provided certain conditions are met. The Credit Agreement expires in December 2019. Loans under the Credit Agreement bear interest at a Base Rate or a Eurocurrency Rate (both of which are defined in the Credit Agreement) plus an applicable margin, which is determined in accordance with a leverage-based pricing grid, as set forth in the Credit Agreement. Borrowings may be used to provide working capital, finance capital expenditures and permitted acquisitions, refinance certain existing indebtedness and for other corporate purposes. As of June 30, 2016 and June 30, 2015, there were $827.9 million and $660.2 million of borrowings outstanding under the Credit Agreement, respectively.
The Credit Agreement is guaranteed by substantially all of our current and future direct and indirect domestic subsidiaries. We are required by the terms of the Credit Agreement to comply with certain financial and other customary affirmative and negative covenants for facilities of this nature.
On May 2, 2016, the Company utilized capacity under its existing revolving credit facility to redeem the $150.0 million of senior notes outstanding. As of June 30, 2016, there were $831.7 million of borrowings and letters of credit outstanding under the Credit Agreement and $168.3 million available, and the Company was deemed to be in compliance with all associated covenants due to certain limited waivers and extensions received by the Company in connection with its obligation to deliver timely financial information.
Tilda Short-Term Borrowing Arrangements
Tilda maintains short-term borrowing arrangements primarily used to fund the purchase of rice from India and other countries. The maximum borrowings permitted under all such arrangements are £52 million. Outstanding borrowings are collateralized by the current assets of Tilda, typically have six-month terms and bear interest at variable rates typically based on LIBOR plus a margin (weighted average interest rate of approximately 2.5% at June 30, 2016). As of June 30, 2016, there was $19.1 million of borrowings outstanding under these arrangements.
Other Borrowings
Other borrowings primarily relate to a cash pool facility in Europe. The cash pool facility provides our Europe operating segment with sufficient liquidity to support the Company’s growth objectives within this segment. The maximum borrowings permitted under the cash pool arrangement is €12.5 million. Outstanding borrowings bear interest at variable rates typically based on EURIBOR plus a margin of 1.1% (weighted average interest rate of approximately 1.1% at June 30, 2016).
We believe that our cash on hand of $127.9 million at June 30, 2016, as well as projected cash flows from operations and availability under our Credit Agreement are sufficient to fund our working capital needs in the ordinary course of business, anticipated fiscal 2017 capital expenditures of approximately $70 million, and the other expected cash requirements for at least the next twelve months.
Reconciliation of Non-U.S. GAAP Financial Measures to U.S. GAAP Measures
We have included in this report measures of financial performance that are not defined by U.S. GAAP. We believe that these measures provide useful information to investors, and include these measures in other communications to investors.
48
For each of these non-U.S. GAAP financial measures, we are providing below a reconciliation of the differences between the non-U.S. GAAP measure and the most directly comparable U.S. GAAP measure, an explanation of why our management and Board of Directors believes the non-U.S. GAAP measure provides useful information to investors and any additional purposes for which our management and Board of Directors uses the non-U.S. GAAP measure. These non-U.S. GAAP measures should be viewed in addition to, and not in lieu of, the comparable U.S. GAAP measure.
Constant Currency Presentation
We believe that this measure provides useful information to investors because it provides transparency to underlying performance in our consolidated net sales by excluding the effect that foreign currency exchange rate fluctuations have on year-to-year comparability given the volatility in foreign currency exchange markets. To present this information for historical periods, current period net sales for entities reporting in currencies other than the U.S. dollar are translated into U.S. dollars at the average monthly exchange rates in effect during the corresponding period of the prior fiscal year, rather than at the actual average monthly exchange rate in effect during the current period of the current fiscal year. As a result, the foreign currency impact is equal to the current year results in local currencies multiplied by the change in average foreign currency exchange rate between the current fiscal period and the corresponding period of the prior fiscal year.
A reconciliation between reported and constant currency sales growth is as follows:
(amounts in thousands) | Twelve Months Ended June 30, 2016 | Twelve Months Ended June 30, 2015 (As Revised) | |||||||||||
Change in consolidated net sales | $ | 275,761 | 10.6 | % | $ | 501,791 | 23.8 | % | |||||
Impact of foreign currency exchange | 69,219 | 2.6 | % | 55,822 | 2.7 | % | |||||||
Change in consolidated net sales on a constant-currency basis | $ | 344,980 | 13.2 | % | $ | 557,613 | 26.5 | % | |||||
Adjusted EBITDA
Adjusted EBITDA is defined as net income before income taxes, net interest expense, depreciation and amortization, impairment of long lived assets, equity in the earnings equity-method investees, stock based compensation, acquisition-related expenses, including integration and restructuring charges, and other non-recurring items. The Company’s management believes that this presentation provides useful information to management, analysts and investors regarding certain additional financial and business trends relating to its results of operations and financial condition. In addition, management uses this measure for reviewing the financial results of the Company and as a component of performance-based executive compensation. Adjusted EBITDA is a non-U.S. GAAP measure and may not be comparable to similarly titled measures reported by other companies.
We do not consider Adjusted EBITDA in isolation or as an alternative to financial measures determined in accordance with GAAP. The principal limitation of Adjusted EBITDA is that it excludes certain expenses and income that are required by GAAP to be recorded in our consolidated financial statements. In addition, Adjusted EBITDA is subject to inherent limitations as this metric reflects the exercise of judgment by management about which expenses and income are excluded or included in determining Adjusted EBITDA. In order to compensate for these limitations, management presents Adjusted EBITDA in connection with GAAP results.
49
A reconciliation of net income to Adjusted EBITDA is as follows:
Fiscal Year ended June 30 | |||||||||||
(amounts in thousands) | 2016 | 2015 (As Revised) | 2014 (As Revised) | ||||||||
Net income | $ | 47,429 | $ | 164,962 | $ | 129,922 | |||||
Provision for income taxes | 70,932 | 48,535 | 69,608 | ||||||||
Interest expense, net | 22,231 | 23,174 | 21,660 | ||||||||
Depreciation and amortization | 65,622 | 57,380 | 48,222 | ||||||||
Equity in net loss (income) of equity-method investees | 47 | (628 | ) | (3,999 | ) | ||||||
Stock-based compensation | 12,688 | 12,197 | 12,448 | ||||||||
Fixed asset impairment | 3,476 | 1,004 | 1,104 | ||||||||
Goodwill impairment | 84,548 | — | — | ||||||||
Intangibles impairment | 39,724 | — | 6,399 | ||||||||
Unrealized currency gains and losses | 14,831 | 5,324 | (3,178 | ) | |||||||
EBITDA | 361,528 | 311,948 | 282,186 | ||||||||
Acquisition, restructuring, integration, severance, and other charges | 12,393 | 11,884 | 17,630 | ||||||||
Contingent consideration expense | 1,511 | (253 | ) | (5,659 | ) | ||||||
Nut butter recall | — | 30,110 | 6,000 | ||||||||
European non-dairy beverage withdrawal | — | 2,187 | — | ||||||||
HPPC production interruption related to chiller breakdown and factory start-up costs | 4,705 | — | — | ||||||||
Inventory costs for products discontinued or redesigned packaging | 3,050 | — | — | ||||||||
Costs incurred due to co-packer default | 770 | — | — | ||||||||
Co-pack contract termination costs | — | — | 437 | ||||||||
U.K. deferred synergies due to CMA Board decision | 949 | — | — | ||||||||
Ashland factory and related expenses | — | 4,146 | — | ||||||||
U.K. factory start-up costs | 743 | 11,407 | 4,762 | ||||||||
U.S. warehouse consolidation project | 623 | — | — | ||||||||
Fakenham inventory allowance for fire | — | 900 | — | ||||||||
Foxboro roof collapse | — | 532 | — | ||||||||
Expenses related to third party sales of common stock | — | — | 224 | ||||||||
Litigation expenses | 1,200 | 7,203 | 1,614 | ||||||||
Celestial Seasonings marketing support and Keurig transition | 1,000 | — | — | ||||||||
Tilda fire insurance recovery costs and other start-up/integration costs | 342 | 1,666 | 982 | ||||||||
Gain on Tilda fire related fixes asset | (9,752 | ) | — | — | |||||||
Gain on pre-existing investment in HPPC and Empire | — | (9,669 | ) | (1,510 | ) | ||||||
Gain on disposal of investment held for sale | — | (314 | ) | — | |||||||
Gain or loss on sale of discontinued business | — | — | 1,629 | ||||||||
Adjusted EBITDA | $ | 379,062 | $ | 371,747 | $ | 308,295 | |||||
Operating Free Cash Flow
In our internal evaluations, we use the non-U.S. GAAP financial measure “operating free cash flow.” The difference between operating free cash flow and cash flow provided by operating activities, which is the most comparable U.S. GAAP financial measure, is that operating free cash flow reflects the impact of capital expenditures. Since capital spending is essential to maintaining our operational capabilities, we believe that it is a recurring and necessary use of cash. As such, we believe investors should also consider capital spending when evaluating our cash provided by operating activities. We view operating free cash flow as an
50
important measure because it is one factor in evaluating the amount of cash available for discretionary investments. We do not consider operating free cash flow in isolation or as an alternative to financial measures determined in accordance with U.S. GAAP.
A reconciliation from Cash flow provided by operating activities to operating free cash flow is as follows:
Fiscal Year Ended June 30, | |||||||||||
(amounts in thousands) | 2016 | 2015 | 2014 | ||||||||
Cash flow provided by operating activities | $ | 206,575 | $ | 185,482 | $ | 184,768 | |||||
Purchase of property, plant and equipment | (77,284 | ) | (51,217 | ) | (41,611 | ) | |||||
Operating free cash flow | $ | 129,291 | $ | 134,265 | $ | 143,157 | |||||
Contractual Obligations
Obligations for all debt instruments, capital and operating leases and other contractual obligations as of June 30, 2016 are as follows:
Payments Due by Period | |||||||||||||||||||
(amounts in thousands) | Total | Less than 1 year | 1-3 years | 3-5 years | 5+ years | ||||||||||||||
Long-term debt obligations (1) | $ | 916,689 | $ | 42,253 | $ | 32,209 | $ | 838,572 | $ | 3,655 | |||||||||
Operating lease obligations | 107,186 | 19,163 | 29,555 | 17,896 | 40,572 | ||||||||||||||
Purchase obligations (2) | 493,753 | 384,973 | 90,579 | 18,201 | — | ||||||||||||||
Other contractual obligations (3) | 12,023 | 5,751 | 6,174 | 73 | 25 | ||||||||||||||
Total contractual obligations | $ | 1,529,651 | $ | 452,140 | $ | 158,517 | $ | 874,742 | $ | 44,252 | |||||||||
(1) | Including debt and interest. |
(2) | Excludes amounts that may be payable upon termination to co-packers as we are not able to reasonably estimate such amounts. |
(3) | Amounts primarily include contingent consideration arrangements and employment contracts. Additionally, as of June 30, 2016, we had non-current unrecognized tax benefits of $16.0 million for which we are not able to reasonably estimate the timing of future cash flows. As a result, this amount has not been included in the table above. |
We believe that our cash on hand of $127.9 million at June 30, 2016 as well as projected cash flows from operations and availability under our Credit Agreement are sufficient to fund our working capital needs in the ordinary course of business, anticipated fiscal 2017 capital expenditures of approximately $70 million and other expected cash requirements for at least the next 12 months.
Off Balance Sheet Arrangements
At June 30, 2016, we did not have any off-balance sheet arrangements as defined in Item 303(a)(4) of Regulation S-K that have had or are likely to have a material current or future effect on our consolidated financial statements.
Critical Accounting Estimates
The discussion and analysis of our financial condition and results of operations is based on our consolidated financial statements, which are prepared in accordance with accounting principles generally accepted in the United States. Our significant accounting policies are described in Note 3, Summary of Significant Accounting Policies and Practices, in the Notes to the Consolidated Financial Statements included in Item 8 of this Form 10-K. The policies below have been identified as the critical accounting policies we use which require us to make estimates and assumptions and exercise judgment that affect the reported amounts of assets and liabilities at the date of the financial statements and amounts of income and expenses during the reporting periods presented. We believe in the quality and reasonableness of our critical accounting estimates; however, materially different amounts might be reported under different conditions or using assumptions, estimates or making judgments different from those that we have applied. Our critical accounting policies, including our methodology for estimates made and assumptions used, are as follows:
Revenue Recognition
51
Sales are recognized when the earnings process is complete, which occurs when products are shipped in accordance with terms of agreements, title and risk of loss transfer to customers, collection is probable and pricing is fixed or determinable. Sales includes shipping and handling charges billed to the customer and are reported net of discounts, trade promotions and sales incentives, consumer coupon programs and other costs, including estimated allowances for returns, allowances and discounts associated with aged or potentially unsalable product, and prompt pay discounts.
As discussed in Note 1, Description of Business and Basis of Presentation, management’s accounting review included consideration of certain side agreements and concessions provided to distributors in the United States, including payment terms beyond the customer’s standard terms, rights of return of product and post-sale concessions, most of which were associated with sales that occurred at the end of the quarter. It had been the Company’s policy to record revenue related to these distributors when title of the product transfers to the distributor. The Company concluded that its historical accounting policy for these distributors is appropriate as the sales price is fixed or determinable at the time ownership transfers to these distributors, based on the Company’s ability to make a reasonable estimate of future returns and certain concessions at the time of shipment.
Trade Promotions and Sales Incentives
We offer various trade promotions and sales incentive programs to customers and consumers, such as price discounts, slotting fees, in-store display incentives, cooperative advertising programs, new product introduction fees and coupons. Trade promotions and sales incentive accruals are subject to significant management estimates and assumptions, changes which could materially impact our financial condition or operating performance if actual results differ from such estimates and assumptions. The critical assumptions used in estimating the accruals for trade promotions and sales incentives include management’s estimate of customer costs. Actual costs incurred by the customer may differ significantly if factors such as the success of the customers’ programs, as well as customer participation levels differ from management estimates and expectations. Management exercises judgment in developing these assumptions. These assumptions are based upon historical performance of the retailer or distributor customers with similar types of promotions adjusted for current trends. The Company regularly reviews and revises, when deemed necessary, estimates of costs to the Company for these promotions and incentives based on what has been incurred by the customers. The terms of most of our promotion and incentive arrangements do not exceed a year and therefore do not require highly uncertain long-term estimates. Differences between estimated expense and actual promotion and incentive costs are normally insignificant and are recognized in earnings in the period such differences are determined. However, actual expenses may differ if the level of redemption rates and performance were to vary from estimates.
Valuation of Accounts and Chargeback Receivable
We perform routine credit evaluations on existing and new customers. We apply reserves for delinquent or uncollectible trade receivables based on a specific identification methodology and also apply an additional reserve based on the experience we have with our trade receivables aging categories. Credit losses have been within our expectations in recent years. While Wal-Mart Stores, Inc. and its affiliates; Sam’s Club and ASDA, together represented approximately 10%, and United Natural Foods, Inc. represented approximately 9% of our trade receivable balance at June 30, 2016, we believe there is no significant or unusual credit exposure at this time.
Based on cash collection history and other statistical analysis, we estimate the amount of unauthorized deductions that our customers have taken that we expect will be collectible and repaid in the near future and records a chargeback receivable. Differences between estimated collectible receivables and actual collections are recognized in earnings in the period such differences are determined.
We may not have the same experience with our receivables during different economic conditions, or with changes in business conditions, such as consolidation within the food industry and/or a change in the way we market and sell our products.
Accounting for Acquisitions
Our growth strategy has included the acquisition of numerous brands and businesses. The purchase price of these acquisitions has been determined after due diligence of the acquired business, market research, strategic planning and the forecasting of expected future results and synergies. Estimated future results and expected synergies are subject to judgment as we integrate each acquisition and attempt to leverage resources.
The accounting for the acquisitions we have made requires that the assets and liabilities acquired, as well as any contingent consideration that may be part of the agreement, be recorded at their respective fair values at the date of acquisition. This requires management to make significant estimates in determining the fair values, especially with respect to intangible assets, including estimates of expected cash flows, expected cost savings and the appropriate weighted average cost of capital. As a result of these significant judgments to be made we occasionally obtain the assistance of independent valuation firms. We complete these
52
assessments as soon as practical after the closing dates. Any excess of the purchase price over the estimated fair values of the identifiable net assets acquired is recorded as goodwill. Because the fair value and the estimated useful life of an intangible asset is a subjective estimate, it is reasonably likely that circumstances may cause the estimate to change. See Note 5, Acquisitions, in the Notes to Consolidated Financial Statements included in Item 8 of this Form 10-K.
Valuation of Long-lived Assets
Fixed assets and amortizable intangible assets are reviewed for impairment as events or changes in circumstances occur indicating that the carrying value of the asset may not be recoverable. Undiscounted cash flow analyses are used to determine if impairment exists. If impairment is determined to exist, the loss is calculated based on estimated fair value.
Goodwill and Intangible Assets
Goodwill and intangible assets deemed to have indefinite lives are not amortized but rather are tested at least annually for impairment, or more often if events or changes in circumstances indicate that more likely than not the carrying amount of the asset may not be recoverable.
Goodwill is tested for impairment at the reporting unit level. A reporting unit represents an operating segment or a component of an operating segment. Goodwill is tested for impairment by either performing a qualitative evaluation or a two-step quantitative test. The qualitative evaluation is an assessment of factors to determine whether it is more likely than not that the fair value of a reporting unit is less than its carrying amount, including goodwill. We may elect not to perform the qualitative assessment for some or all reporting units and perform a two-step quantitative impairment test. The estimate of the fair values of our reporting units are based on the best information available as of the date of the assessment. We generally use a blended analysis of the present value of discounted cash flows and the market valuation approach. The discounted cash flow model uses the present values of estimated future cash flows. Considerable management judgment is necessary to evaluate the impact of operating and external economic factors in estimating our future cash flows. The assumptions we use in our evaluations include projections of growth rates and profitability, our estimated working capital needs, as well as our weighted average cost of capital. The market valuation approach indicates the fair value of a reporting unit based on a comparison to comparable publicly traded firms in similar businesses. Estimates used in the market value approach include the identification of similar companies with comparable business factors. Changes in economic and operating conditions impacting the assumptions we made could result in additional goodwill impairment in future periods. If the carrying value of the reporting unit exceeds fair value, goodwill is considered impaired. The amount of the impairment is the difference between the carrying value of the goodwill and the “implied” fair value, which is calculated as if the reporting unit had just been acquired and accounted for as a business combination.
Indefinite-lived intangible assets consist primarily of acquired trade names and trademarks. We first assess qualitative factors to determine whether it is more likely than not that an indefinite-lived intangible asset is impaired. We measure the fair value of these assets using the relief from royalty method. This method assumes that the trade names and trademarks have value to the extent their owner is relieved from paying royalties for the benefits received. We estimate the future revenues for the associated brands, the appropriate royalty rate and the weighted average cost of capital.
The Company completed its annual goodwill impairment analysis as of April 1, 2016 in conjunction with its budgeting and forecasting process for fiscal year 2017 and concluded that no indicators of impairment existed at any of our reporting units except for our Hain Daniels reporting unit, located within the United Kingdom segment. Based on the step one analysis performed, the Company concluded that the fair value of the Hain Daniels reporting unit was below its carrying value, indicating the second step of the impairment test was necessary. The decline in the estimated fair value in the Hain Daniels reporting unit was primarily the result of lowered projected long-term revenue growth rates and profitability levels resulting from increased competition, changes in market trends, and the mix of products sold. To perform the second step of the impairment test, the Company, along with the help of a third party valuation firm, estimated the fair value of all of the Hain Daniels reporting unit’s individual assets and liabilities, including identifiable intangible assets. The goodwill value implied from this analysis resulted in a goodwill impairment charge of $82.6 million at June 30, 2016, which resulted in $1.1 billion of goodwill remaining as of June 30, 2016.
In conjunction with the Company’s review of goodwill impairment within its Hain Daniels reporting unit, for other long-lived assets, such as property, plant and equipment and finite-lived intangibles assets, namely customer relationships, the Company performed an assessment of the recoverability in accordance with the general valuation requirements set forth under ASC Topic 360 - Accounting for the Impairment of Long-Lived Assets. The result of this assessment indicated that no impairment existed for these assets.
53
Additionally, as part of the acquisition of Orchard House and the related divestiture of certain portions of the Company’s own-label juice business, a goodwill impairment charge of $1.9 million was recorded in the United Kingdom segment at June 30, 2016. See Note 5, Acquisitions, in the Notes to the Consolidated Financial Statements included in Item 8 of this Form 10-K.
Indefinite-lived intangible assets are evaluated on an annual basis, in conjunction with the Company’s evaluation of goodwill. In assessing fair value, the Company utilizes a “relief from royalty payments” methodology. This approach involves two steps: (i) estimating the royalty rates for each trademark and (ii) applying these royalty rates to a projected net sales stream and discounting the resulting cash flows to determine fair value. If the carrying value of the indefinite-lived intangible assets exceeds the fair value of the asset, the carrying value is written down to fair value in the period identified. The result of this assessment indicated that the fair value of certain of the Company’s tradenames was below their carrying value, and therefore an impairment charge of $39.7 million ($20.9 million in the United Kingdom segment and $18.8 million in the United States segment) was recorded at June 30, 2016.
As of June 30, 2016, the carrying value of goodwill was $1.1 billion, of which $191.6 million related to the Hain Daniels reporting unit. The carrying value of the Hain Daniels reporting unit represents fair value as a result of the impairment charge in 2016. As of the 2016 measurement, excluding the Hain Daniels reporting unit, the estimated fair value of each reporting unit exceeded its carrying value by at least 50%, with the exception of the Europe reporting unit and the Tilda reporting unit, whose fair value exceeded its carrying value by 20% and 16% respectively. Holding all other assumptions used in the 2016 fair value measurement constant, a 100-basis-point increase in the weighted average cost of capital would not result in the carrying value of any reporting unit, other than the Hain Daniels reporting unit, to be in excess of the fair value. The fair value was based on significant management assumptions. If assumptions are not achieved or market conditions decline, potential impairment charges could result.
See also Note 8, Goodwill and Other Intangibles, in the Notes to Consolidated Financial Statements included in Item 8 of this Form 10-K, for additional information.
There were no impairment charges recorded during fiscal 2015; however, during the fourth quarter of fiscal 2014, the Company recorded a non-cash partial impairment charge of $6.4 million.
Stock-based Compensation
The company records share-based payment awards exchanged for employee and non-employee directors services at fair value on the date of grant and expenses the awards in the consolidated statements of income over the requisite employee service period. Stock-based compensation expense related to awards with a market or performance condition, which cliff vest, are recognized over the vesting period on a straight line basis. Stock-based compensation awards with service conditions only are also recognized on a straight-line basis. The fair value of stock option awards is estimated on the date of grant using the Black-Scholes option pricing model and is recognized in expense over the vesting period of the options using the straight-line method. The Black-Scholes option pricing model requires various assumptions, including the expected volatility of our stock, the expected term of the option, the risk-free interest rate and the expected dividend yield. Expected volatility is based on historical volatility of our common stock. The risk-free rate for the expected term of the option is based on the United States Treasury yield curve in effect at the time of grant. The fair value of restricted stock awards is equal to the market value of the Company’s common stock on the date of grant and is recognized in expense over the vesting period using the straight-line method. For awards that contain a market condition, expense is recognized over the derived service period using a Monte Carlo simulation model. We recognize compensation expense for only that portion of stock-based awards that are expected to vest. We utilize historical employee termination behavior to determine our estimated forfeiture rates. If the actual forfeitures differ from those estimated by management, adjustments to compensation expense will be made in future periods.
Valuation Allowances for Deferred Tax Assets
Deferred tax assets arise when we recognize expenses in our financial statements that will be allowed as income tax deductions in future periods. Deferred tax assets also include unused tax net operating losses and tax credits that we are allowed to carry forward to future years. Accounting rules permit us to carry deferred tax assets on the balance sheet at full value as long as it is “more likely than not” the deductions, losses, or credits will be used in the future. A valuation allowance must be recorded against a deferred tax asset if this test cannot be met. Our determination of our valuation allowances are based upon a number of assumptions, judgments, and estimates, including forecasted earnings, future taxable income, and the relative proportions of revenue and income before taxes in the various jurisdictions in which we operate. Concluding that a valuation allowance is not required is difficult when there is significant negative evidence that is objective and verifiable, such as cumulative losses in recent years.
We have deferred tax assets related to foreign net operating losses, primarily in the United Kingdom and Germany, and to a lesser extent in Belgium, against which we have recorded valuation allowances. We also have deferred tax assets related to U.S. foreign
54
tax credits and certain U.K. intangibles which are capital in nature, against which we have recorded valuation allowances. The losses in the United Kingdom were recorded prior to the acquisition of Daniels and, in Germany, were the result of certain factory start-up costs incurred in prior years for the Company’s plant-based beverage facility. Under current tax law in these jurisdictions, our carryforward losses have no expiration. If the Company is able to realize any of these carryforward losses in the future, the provision for income taxes will be reduced by a release of the corresponding valuation allowance.
Recent Accounting Pronouncements
See Note 3, Summary of Significant Accounting Policies and Practices, in the Notes to the Consolidated Financial Statements included in Item 8 of this Form 10-K for information regarding recent accounting pronouncements.
55
Seasonality
Certain of our product lines have seasonal fluctuations. Hot tea, baking products, hot cereal, hot-eating desserts and soup sales are stronger in colder months, while sales of snack foods, sunscreen and certain of our prepared food and personal care products are stronger in the warmer months. Additionally, with our acquisitions of Hain Pure Protein Corporation (“HPPC”), EK Holdings, Inc. (“Empire”) and Tilda Limited (“Tilda”), our net sales and earnings may further fluctuate based on the timing of holidays throughout the year. As such, our results of operations and our cash flows for any particular quarter are not indicative of the results we expect for the full year, and our historical seasonality may not be indicative of future quarterly results of operations. In recent years, net sales and diluted earnings per share in the first fiscal quarter have typically been the lowest of our four quarters.
Item 7A. Quantitative and Qualitative Disclosures About Market Risk
Market Risk
The principal market risks (i.e., the risk of loss arising from adverse changes in market rates and prices) to which the Company is exposed are:
• | interest rates on debt and cash equivalents; |
• | foreign exchange rates, generating translation and transaction gains and losses; and |
• | ingredient inputs. |
Interest Rates
We centrally manage our debt and cash equivalents, considering investment opportunities and risks, tax consequences and overall financing strategies. Our cash equivalents consist primarily of money market funds or their equivalent. As of June 30, 2016, we had $827.9 million of variable rate debt outstanding under our Credit Agreement. Assuming current cash equivalents and variable rate borrowings, a hypothetical change in average interest rates of one percentage point would impact net interest expense by approximately $7.0 million over the next fiscal year.
Foreign Currency Exchange Rates
Operating in international markets involves exposure to movements in currency exchange rates, which are volatile at times, and the impact of such movements, if material, could cause adjustments to our financing and operating strategies.
During fiscal 2016, approximately 40% of our consolidated net sales were generated from sales outside the United States, while such sales outside the United States were 39% of net sales in 2015 and 44% of net sales in 2014. These revenues, along with related expenses and capital purchases, were conducted in British Pounds Sterling, Euros, Indian Rupees and Canadian Dollars. Sales and operating income would have decreased by approximately $57.0 million and $2.4 million, respectively, if average foreign exchange rates had been lower by 5% against the United States Dollar in fiscal 2016. These amounts were determined by considering the impact of a hypothetical foreign exchange rate on the sales and operating income of the Company’s international operations. We enter into forward contracts for the purpose of reducing the effect of exchange rate changes which we have designated as cash flow hedges. We had approximately $6.0 million in notional amounts of forward contracts at June 30, 2016. See Note 15, Financial Instruments Measured at Fair Value, in the Notes to Consolidated Financial Statements included in Item 8 of this Form 10-K.
Fluctuations in currency exchange rates may also impact the Stockholders’ Equity of the Company. Amounts invested in our non-United States subsidiaries are translated into United States dollars at the exchange rates as of the last day of each reporting period. Any resulting cumulative translation adjustments are recorded in Stockholders’ Equity as Accumulated Other Comprehensive Income. The cumulative translation adjustments component of Accumulated Other Comprehensive Loss increased by $129.9 million during the fiscal year ended June 30, 2016.
56
Ingredient Inputs Price Risk
The Company purchases ingredient inputs such as almonds, coconut oil, corn, dairy, fruit and vegetables, oils, rice, soybeans, oats and wheat, as well as packaging materials, to be used in its operations. These inputs are subject to price fluctuations that may create price risk. We do not attempt to hedge against fluctuations in the prices of the ingredients by using future, forward, option or other derivative instruments. As a result, the majority of our future purchases of these items are subject to changes in price. We may enter into fixed purchase commitments in an attempt to secure an adequate supply of specific ingredients. These agreements are tied to specific market prices. Market risk is estimated as a hypothetical 10% increase or decrease in the weighted-average cost of our primary inputs as of June 30, 2016. Based on our cost of goods sold during the 12 months ended June 30, 2016, such a change would have resulted in an increase or decrease to cost of sales of approximately $150 million. We attempt to offset the impact of input cost increases with a combination of cost savings initiatives and efficiencies and price increases.
57
Item 8. Financial Statements and Supplementary Data
The following consolidated financial statements of The Hain Celestial Group, Inc. and subsidiaries are included in Item 8:
Report of Independent Registered Public Accounting Firm
Consolidated Balance Sheets - June 30, 2016 and June 30, 2015
Consolidated Statements of Income - Fiscal Years ended June 30, 2016, 2015 and 2014
Consolidated Statements of Comprehensive Income (Loss) - Fiscal Years ended June 30, 2016, 2015 and 2014
Consolidated Statements of Stockholders’ Equity - Fiscal Years ended June 30, 2016, 2015 and 2014
Consolidated Statements of Cash Flows - Fiscal Years ended June 30, 2016, 2015 and 2014
Notes to Consolidated Financial Statements
The following consolidated financial statement schedule of The Hain Celestial Group, Inc. and subsidiaries is included in Item 15 (a):
Schedule II - Valuation and qualifying accounts
All other schedules for which provision is made in the applicable accounting regulation of the SEC are not required under the related instructions or are inapplicable and therefore have been omitted.
58
Report of Independent Registered Public Accounting Firm
The Stockholders and Board of Directors of
The Hain Celestial Group, Inc. and Subsidiaries
We have audited the accompanying consolidated balance sheets of The Hain Celestial Group, Inc. and Subsidiaries (the “Company”) as of June 30, 2016 and 2015, and the related consolidated statements of income, comprehensive income (loss), stockholders’ equity and cash flows for each of the three years in the period ended June 30, 2016. Our audits also included the financial statement schedule listed in the Index at Item 15(a). These financial statements and schedule are the responsibility of the Company’s management. Our responsibility is to express an opinion on these financial statements and schedule based on our audits.
We conducted our audits in accordance with the standards of the Public Company Accounting Oversight Board (United States). Those standards require that we plan and perform the audit to obtain reasonable assurance about whether the financial statements are free of material misstatement. An audit includes examining, on a test basis, evidence supporting the amounts and disclosures in the financial statements. An audit also includes assessing the accounting principles used and significant estimates made by management, as well as evaluating the overall financial statement presentation. We believe that our audits provide a reasonable basis for our opinion.
In our opinion, the financial statements referred to above present fairly, in all material respects, the consolidated financial position of The Hain Celestial Group, Inc. and Subsidiaries at June 30, 2016 and 2015, and the consolidated results of their operations and their cash flows for each of the three years in the period ended June 30, 2016, in conformity with U.S. generally accepted accounting principles. Also, in our opinion, the related financial statement schedule, when considered in relation to the basic financial statements taken as a whole, presents fairly in all material respects the information set forth therein.
We also have audited, in accordance with the standards of the Public Company Accounting Oversight Board (United States), The Hain Celestial Group, Inc. and Subsidiaries’ internal control over financial reporting as of June 30, 2016, based on criteria established in Internal Control-Integrated Framework issued by the Committee of Sponsoring Organizations of the Treadway Commission (2013 framework) and our report dated June 22, 2017 expressed an adverse opinion thereon.
/s/ Ernst & Young LLP
Jericho, New York
June 22, 2017
59
THE HAIN CELESTIAL GROUP, INC. AND SUBSIDIARIES
CONSOLIDATED BALANCE SHEETS
JUNE 30, 2016 AND JUNE 30, 2015
(In thousands, except par values)
June 30, | |||||||
2016 | 2015 | ||||||
ASSETS | |||||||
Current assets: | |||||||
Cash and cash equivalents | $ | 127,926 | $ | 166,922 | |||
Accounts receivable, less allowance for doubtful accounts of $936 and $896, respectively | 278,933 | 263,108 | |||||
Inventories | 408,564 | 397,319 | |||||
Deferred income taxes | — | 38,506 | |||||
Prepaid expenses and other current assets | 84,811 | 62,940 | |||||
Total current assets | 900,234 | 928,795 | |||||
Property, plant and equipment, net | 389,841 | 353,664 | |||||
Goodwill | 1,060,336 | 1,135,678 | |||||
Trademarks and other intangible assets, net | 604,787 | 646,392 | |||||
Investments and joint ventures | 20,244 | 2,305 | |||||
Other assets | 32,638 | 32,574 | |||||
Total assets | $ | 3,008,080 | $ | 3,099,408 | |||
LIABILITIES AND STOCKHOLDERS’ EQUITY | |||||||
Current liabilities: | |||||||
Accounts payable | $ | 251,712 | $ | 274,447 | |||
Accrued expenses and other current liabilities | 78,803 | 85,633 | |||||
Current portion of long-term debt | 26,513 | 31,275 | |||||
Total current liabilities | 357,028 | 391,355 | |||||
Long-term debt, less current portion | 836,171 | 812,608 | |||||
Deferred income taxes | 131,507 | 151,141 | |||||
Other noncurrent liabilities | 18,860 | 16,637 | |||||
Total liabilities | 1,343,566 | 1,371,741 | |||||
Commitments and contingencies (Note 16) | |||||||
Stockholders’ equity: | |||||||
Preferred stock - $.01 par value, authorized 5,000 shares; issued and outstanding: none | — | — | |||||
Common stock - $.01 par value, authorized 150,000 shares; issued: 107,479 and 105,841 shares, respectively; outstanding: 103,461 and 102,612 shares, respectively | 1,075 | 1,058 | |||||
Additional paid-in capital | 1,123,206 | 1,072,427 | |||||
Retained earnings | 801,392 | 753,963 | |||||
Accumulated other comprehensive loss | (172,111 | ) | (41,631 | ) | |||
1,753,562 | 1,785,817 | ||||||
Less: Treasury stock, at cost, 4,018 and 3,229 shares, respectively | (89,048 | ) | (58,150 | ) | |||
Total stockholders’ equity | 1,664,514 | 1,727,667 | |||||
Total liabilities and stockholders’ equity | $ | 3,008,080 | $ | 3,099,408 | |||
See notes to consolidated financial statements.
60
THE HAIN CELESTIAL GROUP, INC. AND SUBSIDIARIES
CONSOLIDATED STATEMENTS OF INCOME
FISCAL YEARS ENDED JUNE 30, 2016, 2015 AND 2014
(In thousands, except per share amounts)
Fiscal Year Ended June 30, | |||||||||||
2016 | 2015 | 2014 | |||||||||
Net sales | $ | 2,885,374 | $ | 2,609,613 | $ | 2,107,822 | |||||
Cost of sales | 2,271,243 | 2,046,758 | 1,579,540 | ||||||||
Gross profit | 614,131 | 562,855 | 528,282 | ||||||||
Selling, general and administrative expenses | 303,763 | 302,827 | 279,510 | ||||||||
Amortization of acquired intangibles | 18,869 | 17,846 | 15,440 | ||||||||
Acquisition related expenses, restructuring and integration charges | 16,867 | 8,320 | 10,187 | ||||||||
Goodwill impairment | 84,548 | — | — | ||||||||
Intangibles impairment | 39,724 | — | 6,399 | ||||||||
Operating income | 150,360 | 233,862 | 216,746 | ||||||||
Interest and other financing expense, net | 25,161 | 25,973 | 24,366 | ||||||||
Other (income)/expense, net | 16,543 | 4,689 | (4,780 | ) | |||||||
Gain on sale of business | — | (9,669 | ) | — | |||||||
Gain on fire insurance recovery | (9,752 | ) | — | — | |||||||
Income before income taxes and equity in earnings of equity-method investees | 118,408 | 212,869 | 197,160 | ||||||||
Provision for income taxes | 70,932 | 48,535 | 69,608 | ||||||||
Equity in net loss (income) of equity-method investees | 47 | (628 | ) | (3,999 | ) | ||||||
Income from continuing operations | 47,429 | 164,962 | 131,551 | ||||||||
Loss from discontinued operations, net of tax | — | — | (1,629 | ) | |||||||
Net income | $ | 47,429 | $ | 164,962 | $ | 129,922 | |||||
*Basic net income (loss) per common share: | |||||||||||
From continuing operations | $ | 0.46 | $ | 1.62 | $ | 1.35 | |||||
From discontinued operations | — | — | (0.02 | ) | |||||||
Net income per common share - basic | $ | 0.46 | $ | 1.62 | $ | 1.33 | |||||
*Diluted net income (loss) per common share: | |||||||||||
From continuing operations | $ | 0.46 | $ | 1.60 | $ | 1.32 | |||||
From discontinued operations | — | — | (0.02 | ) | |||||||
Net income per common share - diluted | $ | 0.46 | $ | 1.60 | $ | 1.30 | |||||
Shares used in the calculation of net income per common share: | |||||||||||
Basic | 103,135 | 101,703 | 97,750 | ||||||||
Diluted | 104,183 | 103,421 | 100,006 | ||||||||
*Note: Share and per share amounts for the fiscal year ended June 30, 2014 have been retroactively adjusted to reflect a two-for-one stock split of the Company’s common stock in the form of a 100% stock dividend.
See notes to consolidated financial statements.
61
THE HAIN CELESTIAL GROUP, INC. AND SUBSIDIARIES
CONSOLIDATED STATEMENTS OF COMPREHENSIVE INCOME (LOSS)
FISCAL YEARS ENDED JUNE 30, 2016, 2015 AND 2014
(In thousands)
Fiscal Year Ended June 30, 2016 | Fiscal Year Ended June 30, 2015 | Fiscal Year Ended June 30, 2014 | |||||||||||||||||||||||||||||||||
Pre-tax amount | Tax (expense) benefit | After-tax amount | Pre-tax amount | Tax (expense) benefit | After-tax amount | Pre-tax amount | Tax (expense) benefit | After-tax amount | |||||||||||||||||||||||||||
Net income | $ | 47,429 | $ | 164,962 | $ | 129,922 | |||||||||||||||||||||||||||||
Other comprehensive income (loss): | |||||||||||||||||||||||||||||||||||
Foreign currency translation adjustments | $ | (129,874 | ) | $ | — | (129,874 | ) | $ | (106,790 | ) | $ | 4,416 | (102,374 | ) | $ | 90,704 | $ | 69 | 90,773 | ||||||||||||||||
Change in deferred gains (losses) on cash flow hedging instruments | (788 | ) | 261 | (527 | ) | 2,093 | (512 | ) | 1,581 | (1,734 | ) | 330 | (1,404 | ) | |||||||||||||||||||||
Change in unrealized gain (loss) on available for sale investment | (129 | ) | 50 | (79 | ) | (1,575 | ) | 669 | (906 | ) | (3,058 | ) | 1,216 | (1,842 | ) | ||||||||||||||||||||
Total other comprehensive (loss) income | $ | (130,791 | ) | $ | 311 | $ | (130,480 | ) | $ | (106,272 | ) | $ | 4,573 | $ | (101,699 | ) | $ | 85,912 | $ | 1,615 | $ | 87,527 | |||||||||||||
Total comprehensive (loss) income | $ | (83,051 | ) | $ | 63,263 | $ | 217,449 | ||||||||||||||||||||||||||||
See notes to consolidated financial statements.
62
THE HAIN CELESTIAL GROUP, INC. AND SUBSIDIARIES
CONSOLIDATED STATEMENT OF STOCKHOLDERS’ EQUITY
FISCAL YEARS ENDED JUNE 30 2016, 2015 AND 2014
(In thousands, except par values)
Common Stock | Additional | Accumulated Other | |||||||||||||||||||||||||||
Amount | Paid-in | Retained | Treasury Stock | Comprehensive | |||||||||||||||||||||||||
Shares | at $.01 | Capital | Earnings | Shares | Amount | Income (Loss) | Total | ||||||||||||||||||||||
Balance at June 30, 2013 | 98,044 | $ | 980 | $ | 768,284 | $ | 459,079 | 2,672 | $ | (30,225 | ) | $ | (27,459 | ) | $ | 1,170,659 | |||||||||||||
Net income | 129,922 | 129,922 | |||||||||||||||||||||||||||
Other comprehensive income | 87,527 | 87,527 | |||||||||||||||||||||||||||
Issuance of common stock pursuant to compensation plans | 1,539 | 15 | 14,919 | (13 | ) | 156 | 15,090 | ||||||||||||||||||||||
Issuance of common stock in connection with acquisitions | 3,560 | 36 | 159,485 | 159,521 | |||||||||||||||||||||||||
Stock based compensation income tax effects | 15,681 | 15,681 | |||||||||||||||||||||||||||
Shares withheld for payment of employee payroll taxes due on shares issued under stock based compensation plans | 247 | (10,023 | ) | (10,023 | ) | ||||||||||||||||||||||||
Stock based compensation expense | 12,448 | 12,448 | |||||||||||||||||||||||||||
Balance at June 30, 2014 | 103,143 | $ | 1,031 | $ | 970,817 | $ | 589,001 | 2,906 | $ | (40,092 | ) | $ | 60,068 | $ | 1,580,825 | ||||||||||||||
Net income | 164,962 | 164,962 | |||||||||||||||||||||||||||
Other comprehensive loss | (101,699 | ) | (101,699 | ) | |||||||||||||||||||||||||
Issuance of common stock pursuant to compensation plans | 1,968 | 20 | 26,065 | 26,085 | |||||||||||||||||||||||||
Issuance of common stock in connection with acquisitions | 730 | 7 | 34,129 | 34,136 | |||||||||||||||||||||||||
Stock based compensation income tax effects | 29,219 | 29,219 | |||||||||||||||||||||||||||
Shares withheld for payment of employee payroll taxes due on shares issued under stock based compensation plans | 323 | (18,058 | ) | (18,058 | ) | ||||||||||||||||||||||||
Stock based compensation expense | 12,197 | 12,197 | |||||||||||||||||||||||||||
Balance at June 30, 2015 | 105,841 | $ | 1,058 | $ | 1,072,427 | $ | 753,963 | 3,229 | $ | (58,150 | ) | $ | (41,631 | ) | $ | 1,727,667 | |||||||||||||
Continued on next page
63
THE HAIN CELESTIAL GROUP, INC. AND SUBSIDIARIES
CONSOLIDATED STATEMENT OF STOCKHOLDERS’ EQUITY
FISCAL YEARS ENDED JUNE 30 2016, 2015 AND 2014
(In thousands, except par values)
Continued from previous page
Common Stock | Additional | Accumulated Other | |||||||||||||||||||||||||||
Amount | Paid-in | Retained | Treasury Stock | Comprehensive | |||||||||||||||||||||||||
Shares | at $.01 | Capital | Earnings | Shares | Amount | Income (Loss) | Total | ||||||||||||||||||||||
Balance at June 30, 2015 | 105,841 | $ | 1,058 | $ | 1,072,427 | $ | 753,963 | 3,229 | $ | (58,150 | ) | $ | (41,631 | ) | $ | 1,727,667 | |||||||||||||
Net income | 47,429 | 47,429 | |||||||||||||||||||||||||||
Other comprehensive loss | (130,480 | ) | (130,480 | ) | |||||||||||||||||||||||||
Issuance of common stock pursuant to compensation plans | 1,398 | 14 | 9,749 | 151 | (5,363 | ) | 4,400 | ||||||||||||||||||||||
Issuance of common stock in connection with acquisitions | 240 | 3 | 16,305 | 16,308 | |||||||||||||||||||||||||
Stock based compensation income tax effects | 12,037 | 12,037 | |||||||||||||||||||||||||||
Shares withheld for payment of employee payroll taxes due on shares issued under stock based compensation plans | 638 | (25,535 | ) | (25,535 | ) | ||||||||||||||||||||||||
Stock based compensation expense | 12,688 | 12,688 | |||||||||||||||||||||||||||
Balance at June 30, 2016 | 107,479 | $ | 1,075 | $ | 1,123,206 | $ | 801,392 | 4,018 | $ | (89,048 | ) | $ | (172,111 | ) | $ | 1,664,514 | |||||||||||||
Note: The common stock and additional paid-in capital amounts and the treasury shares for the fiscal year ended June 30, 2014 have been retroactively adjusted to reflect a two-for-one stock split of the Company’s common stock in the form of a 100% stock dividend.
See notes to consolidated financial statements.
64
THE HAIN CELESTIAL GROUP, INC. AND SUBSIDIARIES
CONSOLIDATED STATEMENTS OF CASH FLOWS
FISCAL YEARS ENDED JUNE 30, 2016, 2015 AND 2014
(In thousands)
Fiscal Year Ended June 30, | |||||||||||
2016 | 2015 | 2014 | |||||||||
CASH FLOWS FROM OPERATING ACTIVITIES | |||||||||||
Net income | $ | 47,429 | $ | 164,962 | $ | 129,922 | |||||
Adjustments to reconcile net income to net cash provided by operating activities: | |||||||||||
Depreciation and amortization | 65,622 | 57,380 | 48,222 | ||||||||
Deferred income taxes | 33,093 | (2,667 | ) | (2,612 | ) | ||||||
Equity in net loss (income) of equity-method investees | 47 | (628 | ) | (3,999 | ) | ||||||
Stock based compensation | 12,688 | 12,197 | 12,448 | ||||||||
Contingent consideration expense | 1,511 | (253 | ) | (983 | ) | ||||||
Gains on fire insurance recovery and other, net | (8,058 | ) | — | — | |||||||
Loss on sale of business | — | — | 1,629 | ||||||||
Gains on pre-existing ownership interests in HPPC and Empire | — | (9,669 | ) | — | |||||||
Impairment charges | 127,748 | — | 7,504 | ||||||||
Other non-cash items, net | 15,038 | (1,434 | ) | 1,175 | |||||||
Increase (decrease) in cash attributable to changes in operating assets and liabilities, net of amounts applicable to acquisitions: | |||||||||||
Accounts receivable | (12,886 | ) | (19,582 | ) | 12,595 | ||||||
Inventories | (15,739 | ) | (30,465 | ) | (24,819 | ) | |||||
Other current assets | (22,534 | ) | (15,308 | ) | (16,003 | ) | |||||
Other assets and liabilities | 3,281 | (3,964 | ) | (543 | ) | ||||||
Accounts payable and accrued expenses | (40,665 | ) | 34,913 | 20,232 | |||||||
Net cash provided by operating activities | 206,575 | 185,482 | 184,768 | ||||||||
CASH FLOWS FROM INVESTING ACTIVITIES | |||||||||||
Acquisitions of businesses, net of cash acquired and working capital settlements | (157,061 | ) | (104,633 | ) | (177,290 | ) | |||||
Purchases of property and equipment | (77,284 | ) | (51,217 | ) | (41,611 | ) | |||||
Repayments from equity-method investees, net | — | — | 8,288 | ||||||||
Proceeds from sale of investment | — | 2,851 | 4,377 | ||||||||
Proceeds from disposals of property and equipment | — | 1,699 | — | ||||||||
Net cash used in investing activities | (234,345 | ) | (151,300 | ) | (206,236 | ) | |||||
CASH FLOWS FROM FINANCING ACTIVITIES | |||||||||||
Proceeds from exercises of stock options | — | 18,643 | 7,320 | ||||||||
Borrowings under bank revolving credit facility | 323,904 | 92,000 | 158,713 | ||||||||
Repayments under bank revolving credit facility | (145,053 | ) | (43,049 | ) | (50,387 | ) | |||||
Repayments of senior notes | (150,000 | ) | — | — | |||||||
Repayments of other debt, net | (13,017 | ) | (54,853 | ) | (7,228 | ) | |||||
Excess tax benefits from stock based compensation | 11,317 | 25,701 | 14,226 | ||||||||
Acquisition related contingent consideration | (1,547 | ) | (3,217 | ) | (11,800 | ) | |||||
Shares withheld for payment of employee payroll taxes | (25,535 | ) | (18,058 | ) | (10,023 | ) | |||||
Net cash provided by financing activities | 69 | 17,167 | 100,821 | ||||||||
Effect of exchange rate changes on cash | (11,295 | ) | (8,178 | ) | 3,135 | ||||||
Net (decrease)/increase in cash and cash equivalents | (38,996 | ) | 43,171 | 82,488 | |||||||
Cash and cash equivalents at beginning of year | 166,922 | 123,751 | 41,263 | ||||||||
Cash and cash equivalents at end of year | $ | 127,926 | $ | 166,922 | $ | 123,751 | |||||
See notes to consolidated financial statements.
65
THE HAIN CELESTIAL GROUP, INC. AND SUBSIDIARIES
NOTES TO CONSOLIDATED FINANCIAL STATEMENTS
(Amounts in thousands, except par values and per share data)
1. DESCRIPTION OF BUSINESS AND BASIS OF PRESENTATION
Description of Business
The Hain Celestial Group, Inc., a Delaware corporation, and its subsidiaries (collectively, the “Company,” and herein referred to as “Hain Celestial,” “we,” “us,” and “our”) was founded in 1993 and is headquartered in Lake Success, New York. The Company’s mission has continued to evolve since its founding, with health and wellness being the core tenet — to be the leading marketer, manufacturer and seller of organic and natural, “better-for-you” products by anticipating and exceeding consumer expectations in providing quality, innovation, value and convenience. The Company is committed to growing sustainably while continuing to implement environmentally sound business practices and manufacturing processes. Hain Celestial sells its products through specialty and natural food distributors, supermarkets, natural food stores, mass-market and e-commerce retailers, food service channels and club, drug and convenience stores in over 80 countries worldwide.
With a proven track record of strategic growth and profitability, the Company manufactures, markets, distributes and sells organic and natural products under brand names that are sold as “better-for-you” products, providing consumers with the opportunity to lead A Healthier Way of LifeTM. Hain Celestial is a leader in many organic and natural products categories, with many recognized brands in the various market categories it serves, including Almond Dream®, Arrowhead Mills®, Bearitos®, BluePrint®, Celestial Seasonings®, Coconut Dream®, Cully & Sully®, Danival®, DeBoles®, Earth’s Best®, Ella’s Kitchen®, Empire®, Europe’s Best®, Farmhouse Fare®, Frank Cooper’s®, FreeBird®, Gale’s®, Garden of Eatin’®, GG UniqueFiberTM, Hain Pure Foods®, Hartley’s®, Health Valley®, Imagine®, Johnson’s Juice Co.®, Joya®, Kosher Valley®, Lima®, Linda McCartney’s® (under license), MaraNatha®, Natumi®, New Covent Garden Soup Co.®, Plainville Farms®, Rice Dream®, Robertson’s®, Rudi’s Gluten-Free Bakery®, Rudi’s Organic Bakery®, Sensible Portions®, Spectrum Organics®, Soy Dream®, Sun-Pat®, SunSpire®, Terra®, The Greek Gods®, Tilda®, Walnut Acres®, WestSoy® and Yves Veggie Cuisine®. The Company’s personal care products are marketed under the Alba Botanica®, Avalon Organics®, Earth’s Best®, JASON®, Live Clean® and Queen Helene® brands.
The Company’s reportable segments are the United States, United Kingdom, Hain Pure Protein and Rest of World. See Note 18, Segment Information.
Basis of Presentation
The Company’s consolidated financial statements include the accounts of the Company and its wholly-owned and majority-owned subsidiaries. Intercompany accounts and transactions have been eliminated in consolidation. Investments in affiliated companies in which the Company exercises significant influence, but which it does not control, are accounted for under the equity method of accounting. As such, consolidated net income includes the Company’s equity in the current earnings or losses of such companies.
On December 29, 2014, the Company effected a two-for-one stock split of its common stock in the form of a 100% stock dividend to shareholders of record as of December 12, 2014. All share and earnings per share information have been retroactively adjusted to reflect the stock split and the incremental par value of the newly issued shares was recorded with the offset to additional paid-in capital.
Unless otherwise indicated, references in these consolidated financial statements to 2016, 2015 and 2014 or “fiscal” 2016, 2015 and 2014 or other years refer to our fiscal year ended June 30 of that respective year and references to 2017 or “fiscal” 2017 refer to our fiscal year ending June 30, 2017.
Use of Estimates
The financial statements are prepared in accordance with accounting principles generally accepted in the United States (“U.S. GAAP”). The accounting principles we use require us to make estimates and assumptions that affect the reported amounts of assets and liabilities at the date of the financial statements and amounts of income and expenses during the reporting periods presented. These estimates include, among others, revenue recognition, trade promotions and sales incentives, valuation of accounts and chargeback receivables, accounting for acquisitions, valuation of long-lived assets, goodwill and intangible assets, stock-based compensation, and valuation allowances for deferred tax assets. We believe in the quality and reasonableness of our critical accounting estimates; however, materially different amounts may be reported under different conditions or using assumptions different from those that we have consistently applied.
66
Accounting Review
During the fourth quarter of fiscal 2016, the Company identified the practice of granting additional concessions to certain distributors in the United States and commenced an internal accounting review in order to (i) determine whether the revenue associated with those concessions was accounted for in the correct period and (ii) evaluate its internal control over financial reporting. The Audit Committee of the Company’s Board of Directors separately conducted an independent review of these matters and retained independent counsel to assist in their review. On November 16, 2016, the Company announced that the independent review of the Audit Committee was completed and that the review found no evidence of intentional wrongdoing in connection with the preparation of the Company’s financial statements. The aforementioned reviews identified material weaknesses in our internal control over financial reporting. We refer the reader to “Part II, Item 9A. Controls and Procedures,” for a description of these material weaknesses and management’s plan and implementation of remediation efforts to address these material weaknesses.
Management’s accounting review included consideration of certain side agreements and concessions provided to distributors in the United States, including payment terms beyond the customer’s standard terms, rights of return of product and post-sale concessions, most of which were associated with sales that occurred at the end of the quarter. It had been the Company’s policy to record revenue related to these distributors when title of the product transfers to the distributor. The Company concluded that its historical accounting policy for these distributors is appropriate as the sales price is fixed or determinable at the time ownership transfers to these distributors, based on the Company’s ability to make a reasonable estimate of future returns and certain concessions at the time of shipment.
Although the initial focus of the Company’s internal accounting review discussed above pertained to the evaluation of the timing of the recognition of the revenue associated with the practice of granting additional concessions to certain distributors, the Company subsequently expanded its internal accounting review and performed an analysis of previously-issued financial statements in order to identify and assess other potential errors. Based upon this review, the Company identified certain immaterial errors relating to its previously-issued financial statements which resulted in revisions to our previously-issued financial statements and are discussed in further detail under Note 2, Correction of Immaterial Errors to Prior Period Financial Statements.
Revisions
As discussed above, the Audit Committee’s independent review and the internal accounting review conducted by the Company identified immaterial errors that impacted our previously issued consolidated financial statements. Accordingly, prior period amounts presented in the consolidated financial statements and the related notes have been revised (referred to as the “Revision”). See Note 2, Correction of Immaterial Errors to Prior Period Financial Statements, for a more detailed description of the Revision and for comparisons of amounts previously reported to the revised amounts.
67
2. CORRECTION OF IMMATERIAL ERRORS TO PRIOR PERIOD FINANCIAL STATEMENTS
During the year ended June 30, 2016, the Company identified and corrected immaterial errors that affected previously issued consolidated financial statements. Based on an analysis of Accounting Standards Codification (“ASC”) 250 - Accounting Changes and Error Corrections (“ASC 250”), Staff Accounting Bulletin 99 - Materiality (“SAB 99”) and Staff Accounting Bulletin 108 - Considering the Effects of Prior Year Misstatements when Quantifying Misstatements in Current Year Financial Statements (“SAB 108”), the Company determined that these errors were immaterial to the previously-issued financial statements; however, a cumulative correction of these errors would have had a material effect on the financial results for the three and twelve months ended June 30, 2016. Accordingly, we have revised our presentation of certain amounts in the consolidated financial statements which are described further below.
Revenue Corrections
The Company recognizes revenue from the sale of products to its customers when ownership of the product transfers to the customer. Ownership transfers to the customer either upon shipment of the product to the customer or when the product is delivered to the customer. The Company has corrected errors in the timing of revenue recognition for customers whose ownership transferred when the product is delivered to the customer by reducing revenue by $26,144 and $630 for the years ended June 30, 2015 and 2014, respectively.
The Company also offers trade promotions and sales incentives to its customers and consumers to increase demand for its products. The accounting principles of ASC 605-50, Customer Payments and Incentives, requires that the cost of an incentive be recorded at the later of the date on which the related revenue is recognized or the date on which the sales incentive is offered. Revenue was reduced by $5,796 and $6,854 for the years ended June 30, 2015 and 2014, respectively, to correct for errors related to the appropriate timing of customer payments and incentives associated with trade promotions. The two previously described errors reduced income before income taxes and equity in earnings of equity-method investees by $6,214 and $5,982 for the years ended June 30, 2015 and 2014, respectively. The errors also were corrected in the related cost of sales, accounts receivable and inventory accounts.
In addition, the Company reclassified certain customer payments and incentives related to trade promotions from selling, general and administrative expense and cost of goods sold, to be presented as a reduction in revenue in accordance with the provisions of ASC 605-50. This correction reduced revenue by $46,962 and $38,305 for the years ended June 30, 2015 and 2014, respectively, but did not affect operating income in any period.
In total, these three revenue corrections reduced revenue $78,902 and $45,789 for the years ended June 30, 2015 and 2014, respectively.
Other Corrections
The Company corrected other immaterial errors which primarily relate to the timing of inventory impairment charges, certain accruals including freight, bonuses, severance and related personnel costs, and a change to the timing of a previously recorded United Kingdom tradename impairment. In addition, the Company recorded certain adjustments to income taxes, including reflecting the tax effect of the aforementioned adjustments. The following table summarizes the effect of the corrections on income before income taxes and equity in earnings of equity method investees on the consolidated statement of income for the years ended June 30, 2015 and 2014:
Fiscal Year Ended June 30, | |||||||||
2015 | 2014 | ||||||||
Effect of Revenue Corrections | $ | (6,214 | ) | $ | (5,982 | ) | |||
Timing of Tradename Impairment | 5,510 | (6,399 | ) | ||||||
Other Corrections | (1,717 | ) | 1,947 | ||||||
Effect of all corrections on income before income taxes and equity in earnings of equity-method investees | $ | (2,421 | ) | $ | (10,434 | ) | |||
68
Certain of the revenue and other corrections discussed above affected periods prior to fiscal 2014, and this effect has been reflected as a cumulative, net of tax adjustment to reduce retained earnings as of July 1, 2013 by $30,688. The effect of the Revision to the Company’s previously-issued fiscal 2014 and 2015 financial statements is illustrated in the tables below. Amounts throughout the consolidated financial statements and notes thereto have been adjusted to incorporate the revised amounts, where applicable.
69
REVISED CONSOLIDATED BALANCE SHEET
The following table reconciles the Company’s consolidated balance sheet at June 30, 2015 from the previously reported amounts to the revised amounts:
June 30, 2015 | |||||||||||
As Reported | Adjustment | As Revised | |||||||||
ASSETS | |||||||||||
Current assets: | |||||||||||
Cash and cash equivalents | $ | 166,922 | $ | — | $ | 166,922 | |||||
Accounts receivable, less allowance for doubtful accounts of $896 | 320,197 | (57,089 | ) | 263,108 | |||||||
Inventories | 382,211 | 15,108 | 397,319 | ||||||||
Deferred income taxes | 20,758 | 17,748 | 38,506 | ||||||||
Prepaid expenses and other current assets | 42,931 | 20,009 | 62,940 | ||||||||
Total current assets | 933,019 | (4,224 | ) | 928,795 | |||||||
Property, plant and equipment, net | 344,262 | 9,402 | 353,664 | ||||||||
Goodwill | 1,136,079 | (401 | ) | 1,135,678 | |||||||
Trademarks and other intangible assets, net | 647,754 | (1,362 | ) | 646,392 | |||||||
Investments and joint ventures | 2,305 | — | 2,305 | ||||||||
Other assets | 33,851 | (1,277 | ) | 32,574 | |||||||
Total assets | $ | 3,097,270 | $ | 2,138 | $ | 3,099,408 | |||||
LIABILITIES AND STOCKHOLDERS’ EQUITY | |||||||||||
Current liabilities: | |||||||||||
Accounts payable | $ | 251,999 | $ | 22,448 | $ | 274,447 | |||||
Accrued expenses and other current liabilities | 79,167 | 6,466 | 85,633 | ||||||||
Current portion of long-term debt | 31,275 | — | 31,275 | ||||||||
Total current liabilities | 362,441 | 28,914 | 391,355 | ||||||||
Long-term debt, less current portion | 812,608 | — | 812,608 | ||||||||
Deferred income taxes | 145,297 | 5,844 | 151,141 | ||||||||
Other noncurrent liabilities | 5,237 | 11,400 | 16,637 | ||||||||
Total liabilities | 1,325,583 | 46,158 | 1,371,741 | ||||||||
Stockholders’ equity: | |||||||||||
Preferred stock - $.01 par value, authorized 5,000 shares; issued and outstanding: none | — | — | — | ||||||||
Common stock - $.01 par value, authorized 150,000 shares; issued: 105,841 shares; outstanding: 102,612 shares | 1,058 | — | 1,058 | ||||||||
Additional paid-in-capital | 1,073,671 | (1,244 | ) | 1,072,427 | |||||||
Retained earnings | 797,514 | (43,551 | ) | 753,963 | |||||||
Accumulated other comprehensive loss | (42,406 | ) | 775 | (41,631 | ) | ||||||
1,829,837 | (44,020 | ) | 1,785,817 | ||||||||
Less: Treasury stock, at cost, 3,229 shares | (58,150 | ) | — | (58,150 | ) | ||||||
Total stockholders’ equity | 1,771,687 | (44,020 | ) | 1,727,667 | |||||||
Total liabilities and stockholders’ equity | $ | 3,097,270 | $ | 2,138 | $ | 3,099,408 | |||||
70
REVISED ANNUAL CONSOLIDATED STATEMENTS OF INCOME
The following tables reconcile the Company’s fiscal 2015 and 2014 annual consolidated statements of income from the previously reported amounts to the revised amounts:
Year Ended June 30, 2015 | Year Ended June 30, 2014 | ||||||||||||||||||||||
As Reported | Adjustment | As Revised | As Reported | Adjustment | As Revised | ||||||||||||||||||
Net sales | $ | 2,688,515 | $ | (78,902 | ) | $ | 2,609,613 | $ | 2,153,611 | $ | (45,789 | ) | $ | 2,107,822 | |||||||||
Cost of sales | 2,069,898 | (23,140 | ) | 2,046,758 | 1,586,418 | (6,878 | ) | 1,579,540 | |||||||||||||||
Gross profit | 618,617 | (55,762 | ) | 562,855 | 567,193 | (38,911 | ) | 528,282 | |||||||||||||||
Selling, general and administrative expenses | 348,517 | (45,690 | ) | 302,827 | 311,288 | (31,778 | ) | 279,510 | |||||||||||||||
Amortization of acquired intangibles | 17,985 | (139 | ) | 17,846 | 15,600 | (160 | ) | 15,440 | |||||||||||||||
Tradename impairment | 5,510 | (5,510 | ) | — | — | 6,399 | 6,399 | ||||||||||||||||
Acquisition related expenses, restructuring and integration charges | 8,860 | (540 | ) | 8,320 | 12,568 | (2,381 | ) | 10,187 | |||||||||||||||
Operating income | 237,745 | (3,883 | ) | 233,862 | 227,737 | (10,991 | ) | 216,746 | |||||||||||||||
Interest and other financing expense, net | 26,022 | (49 | ) | 25,973 | 24,691 | (325 | ) | 24,366 | |||||||||||||||
Other (income)/expense, net | 4,689 | — | 4,689 | (4,548 | ) | (232 | ) | (4,780 | ) | ||||||||||||||
Gain on sale of business | (8,256 | ) | (1,413 | ) | (9,669 | ) | — | — | — | ||||||||||||||
Income before income taxes and equity in earnings of equity-method investees | 215,290 | (2,421 | ) | 212,869 | 207,594 | (10,434 | ) | 197,160 | |||||||||||||||
Provision for income taxes | 47,883 | 652 | 48,535 | 70,099 | (491 | ) | 69,608 | ||||||||||||||||
Equity in net loss of equity-method investees | (489 | ) | (139 | ) | (628 | ) | (3,985 | ) | (14 | ) | (3,999 | ) | |||||||||||
Income from continuing operations | 167,896 | (2,934 | ) | 164,962 | 141,480 | (9,929 | ) | 131,551 | |||||||||||||||
Loss from discontinued operations, net of tax | — | — | — | (1,629 | ) | — | (1,629 | ) | |||||||||||||||
Net income | $ | 167,896 | $ | (2,934 | ) | $ | 164,962 | $ | 139,851 | $ | (9,929 | ) | $ | 129,922 | |||||||||
Basic net income (loss) per common share: | |||||||||||||||||||||||
From continuing operations | $ | 1.65 | $ | (0.03 | ) | $ | 1.62 | $ | 1.45 | $ | (0.10 | ) | $ | 1.35 | |||||||||
From discontinued operations | — | — | — | (0.02 | ) | — | (0.02 | ) | |||||||||||||||
Net income per common share - basic | $ | 1.65 | $ | (0.03 | ) | $ | 1.62 | $ | 1.43 | $ | (0.10 | ) | $ | 1.33 | |||||||||
Diluted net income (loss) per common share: | |||||||||||||||||||||||
From continuing operations | $ | 1.62 | $ | (0.03 | ) | $ | 1.60 | $ | 1.42 | $ | (0.10 | ) | $ | 1.32 | |||||||||
From discontinued operations | — | — | — | (0.02 | ) | — | (0.02 | ) | |||||||||||||||
Net income per common share - diluted | $ | 1.62 | $ | (0.03 | ) | $ | 1.60 | $ | 1.40 | $ | (0.10 | ) | $ | 1.30 | |||||||||
Shares used in the calculation of net income per common share: | |||||||||||||||||||||||
Basic | 101,703 | 101,703 | 101,703 | 97,750 | 97,750 | 97,750 | |||||||||||||||||
Diluted | 103,421 | 103,421 | 103,421 | 100,006 | 100,006 | 100,006 | |||||||||||||||||
Net income/(loss) per common share may not add in certain periods due to rounding
71
REVISED STATEMENTS OF COMPREHENSIVE INCOME (LOSS)
The following table reconciles the Company’s fiscal 2015 and 2014 annual consolidated statements of comprehensive income (loss) from the previously reported amounts to the revised amounts:
Fiscal Year Ended June 30, 2015 | Fiscal Year Ended June 30, 2014 | |||||||||||||||||||||||
As Reported | Adjustment | As Revised | As Reported | Adjustment | As Revised | |||||||||||||||||||
Net income | $ | 167,896 | $ | (2,934 | ) | $ | 164,962 | $ | 139,851 | $ | (9,929 | ) | $ | 129,922 | ||||||||||
Other comprehensive income (loss): | ||||||||||||||||||||||||
Foreign currency translation adjustments | (103,209 | ) | 835 | (102,374 | ) | 90,625 | 148 | 90,773 | ||||||||||||||||
Change in deferred gains (losses) on cash flow hedging instruments | 1,581 | — | 1,581 | (1,404 | ) | — | (1,404 | ) | ||||||||||||||||
Change in unrealized loss on available for sale investment | (906 | ) | — | (906 | ) | (1,842 | ) | — | (1,842 | ) | ||||||||||||||
Total other comprehensive (loss) income | (102,534 | ) | 835 | (101,699 | ) | 87,379 | 148 | 87,527 | ||||||||||||||||
Total comprehensive income | $ | 65,362 | $ | (2,099 | ) | $ | 63,263 | $ | 227,230 | $ | (9,781 | ) | $ | 217,449 | ||||||||||
REVISED CONSOLIDATED CASH FLOWS FROM OPERATIONS
The following table reconciles the Company’s fiscal 2015 and 2014 annual cash flows from operating activities from the previously reported amounts to the revised amounts:
Fiscal Year Ended June 30, 2015 | Fiscal Year Ended June 30, 2014 | ||||||||||||||||||||||
As Reported | Adjustment | As Revised | As Reported | Adjustment | As Revised | ||||||||||||||||||
Net income | $ | 167,896 | $ | (2,934 | ) | $ | 164,962 | $ | 139,851 | $ | (9,929 | ) | $ | 129,922 | |||||||||
Adjustments to reconcile net income to net cash provided by operating activities | |||||||||||||||||||||||
Depreciation and amortization | 56,587 | 793 | 57,380 | 48,040 | 182 | 48,222 | |||||||||||||||||
Deferred income taxes | (11,603 | ) | 8,936 | (2,667 | ) | (1,350 | ) | (1,262 | ) | (2,612 | ) | ||||||||||||
Equity in net income of equity-method investees | (489 | ) | (139 | ) | (628 | ) | (3,985 | ) | (14 | ) | (3,999 | ) | |||||||||||
Stock based compensation | 12,197 | — | 12,197 | 12,448 | — | 12,448 | |||||||||||||||||
Contingent consideration expense | 280 | (533 | ) | (253 | ) | (3,026 | ) | 2,043 | (983 | ) | |||||||||||||
Loss on sale of business | — | — | — | 1,629 | — | 1,629 | |||||||||||||||||
Gains on pre-existing ownership interests in HPPC and Empire | (8,256 | ) | (1,413 | ) | (9,669 | ) | — | — | — | ||||||||||||||
Impairment charges | 5,510 | (5,510 | ) | — | — | 7,504 | 7,504 | ||||||||||||||||
Other non-cash items, net | (1,428 | ) | (6 | ) | (1,434 | ) | 1,175 | — | 1,175 | ||||||||||||||
Increase (decrease) in cash attributable to changes in operating assets and liabilities, net | |||||||||||||||||||||||
Accounts receivable | (31,846 | ) | 12,264 | (19,582 | ) | 967 | 11,628 | 12,595 | |||||||||||||||
Inventories | (21,097 | ) | (9,368 | ) | (30,465 | ) | (22,775 | ) | (2,044 | ) | (24,819 | ) | |||||||||||
Other current assets | 7,699 | (23,007 | ) | (15,308 | ) | (7,948 | ) | (8,055 | ) | (16,003 | ) | ||||||||||||
Other assets and liabilities | (3,964 | ) | — | (3,964 | ) | (5,540 | ) | 4,997 | (543 | ) | |||||||||||||
Accounts payable and accrued expenses | 13,996 | 20,917 | 34,913 | 25,282 | (5,050 | ) | 20,232 | ||||||||||||||||
Net cash provided by operating activities | $ | 185,482 | $ | — | $ | 185,482 | $ | 184,768 | $ | — | $ | 184,768 | |||||||||||
There were no adjustments to cash balances and to cash flows from investing and financing activities for the fiscal years ended June 30, 2015 and 2014.
72
REVISED CONSOLIDATED STATEMENT OF STOCKHOLDERS’ EQUITY
The following table reconciles the Company’s fiscal 2013, 2014 and 2015 annual consolidated statements of stockholders’ equity from the previously reported amounts to the revised amounts:
Common Stock | Additional | Accumulated Other | |||||||||||||||||||||||||||
Amount | Paid-in | Retained | Treasury Stock | Comprehensive | |||||||||||||||||||||||||
Shares | at $.01 | Capital | Earnings | Shares | Amount | Income (Loss) | Total | ||||||||||||||||||||||
Balance at June 30, 2013, as reported | 98,044 | $ | 980 | $ | 768,284 | $ | 489,767 | 2,672 | $ | (30,225 | ) | $ | (27,251 | ) | $ | 1,201,555 | |||||||||||||
Adjustment | — | — | — | (30,688 | ) | — | — | (208 | ) | (30,896 | ) | ||||||||||||||||||
Balance at June 30, 2013, as revised | 98,044 | $ | 980 | $ | 768,284 | $ | 459,079 | 2,672 | $ | (30,225 | ) | $ | (27,459 | ) | $ | 1,170,659 | |||||||||||||
Balance at June 30, 2014, as reported | 103,143 | $ | 1,031 | $ | 969,182 | $ | 629,618 | 2,906 | $ | (40,092 | ) | $ | 60,128 | $ | 1,619,867 | ||||||||||||||
Adjustment | — | — | 1,635 | (40,617 | ) | — | — | (60 | ) | (39,042 | ) | ||||||||||||||||||
Balance at June 30, 2014, as revised | 103,143 | $ | 1,031 | $ | 970,817 | $ | 589,001 | 2,906 | $ | (40,092 | ) | $ | 60,068 | $ | 1,580,825 | ||||||||||||||
Balance at June 30, 2015, as reported | 105,841 | $ | 1,058 | $ | 1,073,671 | $ | 797,514 | 3,229 | $ | (58,150 | ) | $ | (42,406 | ) | $ | 1,771,687 | |||||||||||||
Adjustment | — | — | (1,244 | ) | (43,551 | ) | — | — | 775 | (44,020 | ) | ||||||||||||||||||
Balance at June 30, 2015, as revised | 105,841 | $ | 1,058 | $ | 1,072,427 | $ | 753,963 | 3,229 | $ | (58,150 | ) | $ | (41,631 | ) | $ | 1,727,667 | |||||||||||||
Note: The common stock and additional paid-in capital amounts and the treasury shares for the fiscal year ended June 30, 2014 have been retroactively adjusted to reflect a two-for-one stock split of the Company’s common stock in the form of a 100% stock dividend.
REVISED SEGMENT NET SALES AND OPERATING INCOME
The following table reconciles the Company’s fiscal 2015 and 2014 annual segment net sales and operating income data from the previously reported amounts to the revised amounts:
Fiscal Year Ended June 30, 2015 | Fiscal Year Ended June 30, 2014 | ||||||||||||||||||||||
As Reported | Adjustment | As Revised | As Reported | Adjustment | As Revised | ||||||||||||||||||
Net Sales: | |||||||||||||||||||||||
United States | $ | 1,367,388 | $ | (41,392 | ) | $ | 1,325,996 | $ | 1,282,175 | $ | (35,062 | ) | $ | 1,247,113 | |||||||||
United Kingdom | 735,996 | (13,166 | ) | 722,830 | 637,454 | (8,626 | ) | 628,828 | |||||||||||||||
Hain Pure Protein | 358,582 | (21,385 | ) | 337,197 | — | — | — | ||||||||||||||||
Rest of World | 226,549 | (2,959 | ) | 223,590 | 233,982 | (2,101 | ) | 231,881 | |||||||||||||||
$ | 2,688,515 | $ | (78,902 | ) | $ | 2,609,613 | $ | 2,153,611 | $ | (45,789 | ) | $ | 2,107,822 | ||||||||||
Operating Income: | |||||||||||||||||||||||
United States | $ | 199,901 | $ | (11,847 | ) | $ | 188,054 | $ | 205,864 | $ | (4,801 | ) | $ | 201,063 | |||||||||
United Kingdom | 46,222 | (1,237 | ) | 44,985 | 52,661 | (3,152 | ) | 49,509 | |||||||||||||||
Hain Pure Protein | 26,479 | 2,206 | 28,685 | — | — | — | |||||||||||||||||
Rest of World | 16,438 | (1,228 | ) | 15,210 | 16,931 | (182 | ) | 16,749 | |||||||||||||||
$ | 289,040 | $ | (12,106 | ) | $ | 276,934 | $ | 275,456 | $ | (8,135 | ) | $ | 267,321 | ||||||||||
Corporate and Other | (51,295 | ) | 8,223 | (43,072 | ) | (47,719 | ) | (2,856 | ) | (50,575 | ) | ||||||||||||
$ | 237,745 | $ | (3,883 | ) | $ | 233,862 | $ | 227,737 | $ | (10,991 | ) | $ | 216,746 | ||||||||||
73
3. SUMMARY OF SIGNIFICANT ACCOUNTING POLICIES AND PRACTICES
Cash and Cash Equivalents
The Company considers cash and cash equivalents to include cash in banks, commercial paper and deposits with financial institutions that can be liquidated without prior notice or penalty. The Company considers all highly liquid investments with an original maturity of three months or less to be cash equivalents.
Revenue Recognition
Sales are recognized when the earnings process is complete, which occurs when the product is shipped in accordance with the terms of agreements, title and risk of loss transfers to the customer, collection is probable and pricing is fixed or determinable. Net sales includes shipping and handling charges billed to the customer and are reported net of discounts, trade promotions and sales incentives, consumer coupon programs and other costs, including estimated allowances for returns, allowances and discounts associated with aged or potentially unsalable product, and prompt pay discounts.
Trade Promotions and Sales Incentives
Trade promotions and sales incentives include price discounts, slotting fees, in-store display incentives, cooperative advertising programs, new product introduction fees and coupons and are used to support sales of the Company’s products. These incentives are deducted from our net sales to determine reported net sales. The recognition of expense for these programs involves the use of judgment related to performance and redemption estimates. Differences between estimated expense and actual redemptions are normally insignificant and recognized as a change in estimate in the period such change occurs.
Trade Promotions. Accruals for trade promotions are recorded primarily at the time a product is sold to the customer based on expected levels of performance. Settlement of these liabilities typically occurs in subsequent periods primarily through an authorization process for deductions taken by a customer from amounts otherwise due to the Company.
Coupon Redemption. Coupon redemption costs are accrued in the period in which the coupons are offered, based on estimates of redemption rates that are developed by management. Management estimates are based on recommendations from independent coupon redemption clearing-houses as well as on historical information. Should actual redemption rates vary from amounts estimated, adjustments to accruals may be required.
Valuation of Accounts and Chargebacks Receivable and Concentration of Credit Risk
The Company routinely performs credit evaluations on existing and new customers. The Company applies reserves for delinquent or uncollectible trade receivables based on a specific identification methodology and also applies an additional reserve based on the experience the Company has with its trade receivables aging categories. Credit losses have been within the Company’s expectations in recent years. While one of the Company’s customers represented approximately 10% and 8% of trade receivables balances as of June 30, 2016 and 2015, respectively, and a second customer represented approximately 9% and 7% of trade receivable balances as of June 30, 2016 and 2015, respectively, the Company believes there is no significant or unusual credit
exposure at this time.
Based on cash collection history and other statistical analysis, the Company estimates the amount of unauthorized deductions customers have taken that we expect will be collected and repaid in the near future and records a chargeback receivable. Differences between estimated collectible receivables and actual collections are recognized in earnings in the period such differences are determined.
During the fiscal years ended June 30, 2016, 2015 and 2014, sales to one customer and its affiliates approximated 10%, 11% and 13% of consolidated net sales, respectively. Sales to a second customer and its affiliates approximated 10%, 10% and 11% during the fiscal years ended June 30, 2016, 2015, and 2014, respectively.
In addition, cash and cash equivalents are maintained with several financial institutions. Deposits held with banks may exceed the amount of insurance provided on such deposits. Generally these deposits may be redeemed upon demand.
74
Inventory
Inventory is valued at the lower of cost or market, utilizing the first-in, first-out method. The Company provides write-downs for finished goods expected to become non-saleable due to age and specifically identifies and provides for slow moving or obsolete raw ingredients and packaging.
Property, Plant and Equipment
Property, plant and equipment is carried at cost and depreciated or amortized on a straight-line basis over the estimated useful lives or lease term (for leasehold improvements), whichever is shorter. The Company believes the useful lives assigned to our property, plant and equipment are within ranges generally used in consumer products manufacturing and distribution businesses. The Company’s manufacturing plants and distribution centers, and their related assets, are reviewed when impairment indicators are present by analyzing underlying cash flow projections. At this time, the Company believes no impairment of the carrying value of such assets exists. Ordinary repairs and maintenance costs are expensed as incurred. The Company utilizes the following ranges of asset lives:
Buildings and improvements | 10 - 40 years | |
Machinery and equipment | 3 - 20 years | |
Furniture and fixtures | 3 - 15 years | |
Leasehold improvements are amortized over the shorter of the respective initial lease term or the estimated useful life of the assets, and generally range from 3 to 15 years.
Goodwill and Other Indefinite-Lived Intangible Assets
Goodwill and other intangible assets with indefinite useful lives are not amortized but rather are tested at least annually for impairment, or when circumstances indicate that the carrying amount of the asset may not be recoverable. The Company performs its annual test for impairment at the beginning of the fourth quarter of its fiscal year.
Goodwill is tested for impairment at the reporting unit level. A reporting unit is an operating segment or a component of an operating segment. Goodwill is tested for impairment by either performing a qualitative evaluation or a two-step quantitative test. The qualitative evaluation is an assessment of factors to determine whether it is more likely than not that the fair value of a reporting unit is less than its carrying amount, including goodwill. We may elect not to perform the qualitative assessment for some or all reporting units and perform a two-step quantitative impairment test. The impairment test for goodwill requires the Company to compare the fair value of a reporting unit to its carrying value, including goodwill. The Company uses a blended analysis of a discounted cash flow model and a market valuation approach to determine the fair values of its reporting units. If the carrying value of a reporting unit exceeds its fair value, the Company would then compare the carrying value of the goodwill to its implied fair value in order to determine the amount of the impairment, if any.
Indefinite-lived intangible assets are tested for impairment by comparing the fair value of the asset to the carrying value. Fair value is determined based on a relief from royalty method that include significant management assumptions such as revenue growth rates, weighted average cost of capital, and assumed royalty rates. If the fair value is less than the carrying value, the asset is reduced to fair value.
See Note 8, Goodwill and Other Intangible Assets, for information on intangible assets and impairment charges
Cost of Sales
Included in cost of sales are the cost of products sold, including the costs of raw materials and labor and overhead required to produce the products, warehousing, distribution, supply chain costs, as well as costs associated with shipping and handling of our inventory.
Foreign Currency Translation and Remeasurement
The assets and liabilities of international operations are translated at the exchange rates in effect at the balance sheet date. Revenue and expense accounts are translated at the monthly average exchange rates. Adjustments arising from the translation of the foreign currency financial statements of the Company's international operations are reported as a component of "Accumulated other
75
comprehensive loss" in the Company's consolidated balance sheets. Gains and losses arising from intercompany foreign currency transactions that are of a long-term nature are reported in the same manner as translation adjustments.
Gains and losses arising from intercompany foreign currency transactions that are not of a long-term nature and certain transactions of the Company’s subsidiaries which are denominated in currencies other than the subsidiaries’ functional currency are recognized as incurred in Other (income)/expense, net in the Consolidated Statements of Income.
Gain on Recovery of Insurance Proceeds
On October 25, 2014, a fire occurred at our Tilda rice milling facility in the United Kingdom. As a result, the Company recognized a gain of $9,752, representing the excess of the insurance proceeds over the net book value of fixed assets destroyed in the fire. As of June 30, 2016, the Company recorded a receivable of $4,234, representing the final settlement of the claim. The receivable is included in “Prepaid Expenses and Other Current Assets” on the Company’s Consolidated Balance Sheet; and the amount was collected in the first quarter of fiscal 2017. The milling facility was fully functional at the end of the third quarter of fiscal 2016.
Selling, General and Administrative Expenses
Included in selling, general and administrative expenses are advertising costs, promotion costs not paid directly to the Company’s customers, salary and related benefit costs of the Company’s employees in the finance, human resources, information technology, legal, sales and marketing functions, facility related costs of the Company’s administrative functions, research and development costs, and costs paid to consultants and third party providers for related services.
Research and Development Costs
Research and development costs are expensed as incurred and are included in selling, general and administrative expenses in the accompanying consolidated financial statements. Research and development costs amounted to $11,354 in fiscal 2016, $10,271 in fiscal 2015 and $10,049 in fiscal 2014; consisting primarily of personnel related costs. The Company’s research and development expenditures do not include the expenditures on such activities undertaken by co-packers and suppliers who develop numerous products on behalf of the Company and on their own initiative with the expectation that the Company will accept their new product ideas and market them under the Company’s brands.
Advertising Costs
Advertising costs, which are included in selling, general and administrative expenses, amounted to $26,968 in fiscal 2016, $26,061 in fiscal 2015 and $20,509 in fiscal 2014. Such costs are expensed as incurred.
Income Taxes
The Company follows the liability method of accounting for income taxes. Under the liability method, deferred taxes are determined based on the differences between the financial statement and tax bases of assets and liabilities at enacted rates in effect in the years in which the differences are expected to reverse. Valuation allowances are provided for deferred tax assets to the extent it is more likely than not that deferred tax assets will not be recoverable against future taxable income.
The Company recognizes liabilities for uncertain tax positions based on a two-step process prescribed by the authoritative guidance. The first step requires the Company to determine if the weight of available evidence indicates that the tax position has met the threshold for recognition; therefore, the Company must evaluate whether it is more likely than not that the position will be sustained on audit, including resolution of any related appeals or litigation processes. The second step requires the Company to measure the tax benefit of the tax position taken, or expected to be taken, in an income tax return as the largest amount that is more than 50% likely of being realized upon ultimate settlement. The Company reevaluates the uncertain tax positions each period based on factors including, but not limited to, changes in facts or circumstances, changes in tax law, effectively settled issues under audit, and new audit activity. Depending on the jurisdiction, such a change in recognition or measurement may result in the recognition of a tax benefit or an additional charge to the tax provision in the period. The Company records interest and penalties in the provision for income taxes.
Fair Value of Financial Instruments
The fair value of financial instruments is the amount at which the instrument could be exchanged in a current transaction between willing parties. At June 30, 2016 and 2015, the Company had $20,706 and $45,101 invested in money market funds, which are classified as cash equivalents. At June 30, 2016 and 2015, the carrying values of financial instruments such as accounts receivable,
76
accounts payable, accrued expenses and other current liabilities, as well as borrowings under our credit facility and other borrowings, approximate fair value based upon either the short-term maturities or market interest rates of these instruments.
Derivative Instruments
The Company utilizes derivative instruments, principally foreign exchange forward contracts, to manage certain exposures to changes in foreign exchange rates. The Company’s contracts are hedges for transactions with notional balances and periods consistent with the related exposures and do not constitute investments independent of these exposures. These contracts, which are designated and documented as cash flow hedges, qualify for hedge accounting treatment in accordance with ASC 815, Derivatives and Hedging. Exposure to counterparty credit risk is considered low because these agreements have been entered into with high quality financial institutions.
All derivative instruments are recognized on the balance sheet at fair value. The effective portion of changes in the fair value of derivative instruments that qualify for hedge accounting treatment are recognized in stockholders’ equity as a component of Accumulated other comprehensive income (loss) until the hedged item is recognized in earnings. Changes in the fair value of derivatives that do not qualify for hedge accounting treatment, as well as the ineffective portion of any hedges, are recognized currently in earnings as a component of Other (Income)/Expense, net.
Stock-Based Compensation
The Company has employee and director stock-based compensation plans. The fair value of employee stock options is determined on the date of grant using the Black-Scholes option pricing model. The Company has used historical volatility in its estimate of expected volatility. The expected life represents the period of time (in years) for which the options granted are expected to be outstanding. The risk-free interest rate is based on the United States Treasury yield curve. The fair value of restricted stock awards is equal to the market value of the Company’s common stock on the date of grant, or is estimated using a Monte Carlo simulation if the award contains a market condition.
The fair value of stock-based compensation awards is recognized as an expense over the vesting period using the straight-line method. For awards that contain a market condition, expense is recognized over the derived service period using a Monte Carlo simulation model. For restricted stock awards which include performance criteria, compensation expense is recorded when the achievement of the performance criteria is probable and is recognized over the performance and vesting service periods. Compensation expense is recognized for only that portion of stock based awards that are expected to vest. Therefore, estimated forfeiture rates that are derived from historical employee termination activity are applied to reduce the amount of compensation expense recognized. If the actual forfeitures differ from the estimate, additional adjustments to compensation expense may be required in future periods.
The Company receives an income tax deduction in certain tax jurisdictions for restricted stock grants when they vest and for stock options exercised by employees equal to the excess of the market value of our common stock on the date of exercise over the option price. Excess tax benefits (tax benefits resulting from tax deductions in excess of compensation cost recognized) are classified as a cash flow provided by financing activities in the accompanying Consolidated Statements of Cash Flows.
Valuation of Long-Lived Assets
The Company periodically evaluates the carrying value of long-lived assets, other than goodwill and intangible assets with indefinite lives, held and used in the business when events and circumstances occur indicating that the carrying amount of the asset may not be recoverable. An impairment test is performed when the estimated undiscounted cash flows associated with the asset or group of assets is less than their carrying value. Once such impairment test is performed, a loss is recognized based on the amount, if any, by which the carrying value exceeds the estimated fair value for assets to be held and used.
Net Income Per Share
Basic net income per share is computed by dividing net income by the weighted-average number of common shares outstanding for the period. Diluted net income per share reflects the potential dilution that would occur if securities or other contracts to issue common stock were exercised or converted into common stock.
77
Newly Adopted Accounting Pronouncements
In November 2015, the Financial Accounting Standards Board (“FASB”) issued Accounting Standards Update (“ASU”) 2015-17, Income Taxes (Topic 740): Balance Sheet Classification of Deferred Taxes. ASU No. 2015-17 requires that deferred tax assets and liabilities be classified as noncurrent on the balance sheet. ASU 2015-17 is effective for annual reporting periods beginning after December 15, 2016, and interim periods within those annual periods, with early adoption permitted. The Company elected to early adopt the provisions of ASU 2015-17 in the fourth quarter of fiscal 2016 and reclassified its deferred income tax assets and liabilities from current to noncurrent. The adoption of the new standard was applied prospectively for fiscal 2016. Current deferred income tax assets of $38,506 as of June 30, 2015 have not been retroactively adjusted.
In September 2015, the FASB issued ASU 2015-16, Business Combinations (Topic 805): Simplifying the Accounting for Measurement-Period Adjustments. ASU 2015-16 requires that an acquirer recognize adjustments to provisional amounts that are identified during the measurement period in the reporting period in which the adjustment amounts are determined. ASU 2015-16 is effective for annual reporting periods beginning after December 15, 2015 and for interim periods within such annual period. Early application is permitted for any interim and annual financial statements that have not yet been made available for issuance. The Company elected to early adopt the provisions of ASU 2015-16 at the beginning of fiscal 2016. The adoption of the new guidance did not materially impact the Company’s consolidated financial position or results of operations.
In April 2015, the FASB issued ASU 2015-03, Interest - Imputation of Interest (Subtopic 835-30): Simplifying the Presentation of Debt Issuance Costs. The amendments in ASU 2015-03 require that debt issuance costs related to a recognized debt liability be presented in the balance sheet as a direct deduction from the carrying amount of that debt liability. The recognition and measurement guidance for debt issuance costs are not affected by the amendments. ASU 2015-03 must be applied retrospectively and is effective for interim and annual periods beginning after December 15, 2015, with early adoption permitted. In August 2015, the FASB issued ASU 2015-15, Interest - Imputation of Interest (Subtopic 835-30): Presentation and Subsequent Measurement of Debt Issuance Costs Associated with Line-of-Credit Arrangements. ASU 2015-15 states that for debt issuance costs related to line-of-credit arrangements, the SEC staff would not object to an entity deferring and presenting such costs as an asset and subsequently amortizing the deferred debt issuance costs ratably over the term of the line-of-credit arrangement, regardless of whether there are any outstanding borrowings on the line-of-credit arrangement. The Company has elected to early adopt the provisions of ASU 2015-03 and ASU 2015-15 at the beginning of fiscal 2016. The adoption of the new guidance did not materially impact the Company’s consolidated financial position or results of operations.
In August 2014, the FASB issued ASU 2014-15, Presentation of Financial Statements - Going Concern (Subtopic 205-40), which requires management to evaluate, at each annual and interim reporting period, whether there are conditions or events that raise substantial doubt about the entity’s ability to continue as a going concern within one year after the date the financial statements are issued and provide related disclosures. ASU 2014-15 is effective for annual periods ending after December 15, 2016 and for annual periods and interim periods thereafter. Early adoption is permitted. The Company has elected to early adopt the provisions of ASU 2014-15 in the fourth quarter of fiscal 2016. The adoption of the new guidance did not impact the Company’s consolidated financial position or results of operations.
In June 2014, the FASB issued ASU 2014-12, Compensation - Stock Compensation (Topic 718): Accounting for Share-Based Payments When the Terms of an Award Provide That a Performance Target Could Be Achieved after the Requisite Service Period. ASU 2014-12 requires that a performance target that affects vesting and that could be achieved after the requisite service period be treated as a performance condition. As such, the performance target should not be reflected in estimating the grant date fair value of the award. ASU 2014-12 is effective for annual periods beginning after December 15, 2015 and for interim periods within such annual period, with early adoption permitted. The Company has elected to early adopt the provisions of ASU 2014-12 in the fourth quarter of fiscal 2016. The adoption of the new guidance did not impact the Company’s consolidated financial position
or results of operations.
Recently Issued Accounting Pronouncements Not Yet Effective
In May 2017, the FASB issued ASU 2017-09, Compensation - Stock Compensation (Topic 718): Scope of Modification Accounting, which provides guidance about which changes to the terms or conditions of a share-based payment award require an entity to apply modification accounting in Topic 718. The guidance is effective for annual periods beginning after December 15, 2017, with early adoption permitted, including adoption in any interim period for which financial statements have not yet been issued. The Company is currently evaluating the potential effects of adopting the provisions of ASU 2017-09.
In February 2017, the FASB issued ASU 2017-05, Other Income - Gains and Losses from the Derecognition of Nonfinancial Assets: Clarifying the Scope of Asset Derecognition Guidance and Accounting for Partial Sales of Nonfinancial Assets. The ASU was issued to clarify the scope of the previous standard and to add guidance for partial sales of nonfinancial assets. The ASU is
78
effective for fiscal years and interim periods within those years beginning after December 15, 2017. The Company is currently evaluating the potential effects of adopting the provisions of ASU 2017-05.
In January 2017, the FASB issued ASU 2017-04, Intangibles - Goodwill and Other (Topic 350). The amendments in this update simplify the test for goodwill impairment by eliminating Step 2 from the impairment test, which required the entity to perform procedures to determine the fair value at the impairment testing date of its assets and liabilities following the procedure that would be required in determining fair value of assets acquired and liabilities assumed in a business combination. The amendments in this update are effective for public companies for annual or any interim goodwill impairments tests in fiscal years beginning after December 15, 2019, with early adoption permitted. The Company is currently evaluating the potential effects of adopting the provisions of ASU 2017-04.
In January 2017, the FASB issued ASU 2017-01, Business Combinations (Topic 805): Clarifying the Definition of a Business. The amendments in this update clarify the definition of a business with the objective of adding guidance to assist entities with evaluating whether transactions should be accounted for as acquisitions (or disposals) of assets or businesses. The definition of a business affects many areas of accounting including acquisitions, disposals, goodwill and consolidation. The guidance is effective for annual periods beginning after December 15, 2017, including interim periods within those periods, with early adoption permitted. The Company is currently evaluating the potential effects of adopting the provisions of ASU 2017-01.
In October 2016, the FASB issued ASU 2016-17, Consolidation (Topic 810): Interests Held through Related Parties that are Under Common Control. ASU 2016-17 changes how a reporting entity considers indirect interests held by related parties under common control when evaluating whether it is the primary beneficiary of a variable interest entity (“VIE”). ASU 2016-17 is effective on a retrospective basis for fiscal years, and for interim periods within those fiscal years, beginning after December 15, 2016, with early adoption permitted. The Company is currently evaluating the potential effects of adopting the provisions of ASU 2016-17.
In October 2016, the FASB issued ASU 2016-16, Income Taxes (Topic 740): Intra-Entity Transfers of Assets Other Than Inventory. Currently, U.S. GAAP prohibits recognizing current and deferred income tax consequences for an intra-entity asset transfer until the asset has been sold to an outside party. ASU 2016-16 states that an entity should recognize the income tax consequences of an intra-entity transfer of an asset other than inventory when the transfer occurs. The new standard is effective for public companies in fiscal years beginning after December 15, 2017. Early adoption is permitted. The amendments should be applied on a modified retrospective basis through a cumulative-effect adjustment directly to retained earnings as of the beginning of the period of adoption.
The Company is currently evaluating the potential effects of adopting the provisions of ASU 2016-16.
In August 2016, the FASB issued ASU 2016-15, Statement of Cash Flows (Topic 230): Classification of Certain Cash Receipts and Cash Payments (A Consensus of the Emerging Issues Task Force). ASU 2016-15 provides guidance on the classification of certain cash receipts and payments in the statement of cash flows. The guidance must be applied retrospectively to all periods presented but may be applied prospectively if retrospective application would be impracticable. The new standard is effective for public companies in fiscal years beginning after December 15, 2017. Early adoption is permitted. The Company is currently evaluating the potential effects of adopting the provisions of ASU 2016-15.
In June 2016, the FASB issued ASU 2016-13, Financial Instruments-Credit Losses, which changes the impairment model for most financial assets and certain other instruments. For trade and other receivables, held-to-maturity debt securities, loans and other instruments, companies will be required to use a new forward-looking “expected loss” model that generally will result in the earlier recognition of allowances for losses. For available-for-sale debt securities with unrealized losses, companies will measure credit losses in a manner similar to what they do today, except that the losses will be recognized as allowances rather than as reductions in the amortized cost of the securities. Companies will have to disclose significantly more information, including information they use to track credit quality by year of origination for most financing receivables. Companies will apply the standard’s provisions as a cumulative-effect adjustment to retained earnings as of the beginning of the first reporting period in which the guidance is adopted. This standard is effective for years beginning after December 15, 2019, and interim periods therein. The Company is currently evaluating the potential effects of adopting the provisions of ASU 2016-13.
In March 2016, the FASB issued ASU 2016-09, Compensation - Stock Compensation (Topic 718): Improvements to Employee Share-Based Payment Accounting, which simplifies several aspects of the accounting for share-based payments, including immediate recognition of all excess tax benefits and deficiencies in the income statement, changing the threshold to qualify for equity classification up to the employees’ maximum statutory tax rates, allowing an entity-wide accounting policy election to either estimate the number of awards that are expected to vest or account for forfeitures as they occur and clarifying the classification on the statement of cash flows for the excess tax benefit and employee taxes paid when an employer withholds shares for tax-withholding purposes. The standard will be effective for the first interim period within annual periods beginning after December 15, 2016, with early adoption permitted. The Company is currently evaluating the potential effects of adopting the provisions of ASU 2016-09.
79
In March 2016, the FASB issued ASU 2016-07, Investments - Equity Method and Joint Ventures (Topic 323): Simplifying the Transition to the Equity Method of Accounting. ASU 2016-07 eliminates the requirement that an entity retroactively adopt the equity method of accounting if an investment qualifies for use of the equity method as a result of an increase in the level of ownership or degree of influence. The equity method investor is required to add the cost of acquiring the additional interest in the investee to the current basis of the investor’s previously held interest and adopt the equity method of accounting as of the date the investment becomes qualified for equity method accounting. ASU 2016-07 is effective for annual reporting periods beginning after December 15, 2016, and interim periods within those annual periods. The Company is currently evaluating the potential effects of adopting the provisions of ASU 2016-07.
In March 2016, the FASB issued ASU 2016-05, Derivatives and Hedging (Topic 815): Effect of Derivative Contract Novations on Existing Hedge Accounting Relationships. Under ASU 2016-05, the novation of a derivative contract (i.e., a change in the counterparty) in a hedge accounting relationship does not, in and of itself, require dedesignation of that hedge accounting relationship. The hedge accounting relationship could continue uninterrupted if all of the other hedge accounting criteria are met, including the expectation that the hedge will be highly effective when the creditworthiness of the new counterparty to the derivative contract is considered. The guidance is effective for fiscal years beginning after December 15, 2016, and interim periods therein. Early adoption is permitted. Entities may apply the guidance prospectively or on a modified retrospective basis. The Company is currently evaluating the potential effects of adopting the provisions of ASU 2016-05.
In February 2016, the FASB issued ASU 2016-02, Leases. ASU 2016-02 revises accounting for operating leases by a lessee, among other changes, and requires a lessee to recognize a liability to make lease payments and an asset representing its right to use the underlying asset for the lease term in the balance sheet. The standard is effective for the first interim and annual periods beginning after December 15, 2018, with early adoption permitted. The Company is currently evaluating the potential effects of adopting the provisions of ASU 2016-02.
In January 2016, the FASB issued ASU 2016-01, Financial Instruments-Overall (Subtopic 825-10): Recognition and Measurement of Financial Assets and Financial Liabilities. ASU 2016-01 requires that most equity investments be measured at fair value, with subsequent changes in fair value recognized in net income. The pronouncement also impacts financial liabilities under the fair value option and the presentation and disclosure requirements for financial instruments. ASU 2016-01 is effective for annual reporting periods beginning after December 15, 2017, and interim periods within those annual periods. The Company is currently evaluating the potential effects of adopting the provisions of ASU 2016-01.
In July 2015, the FASB issued ASU 2015-11, Inventory (Topic 330): Simplifying the Measurement of Inventory. ASU 2015-11 requires inventory measured using any method other than last-in, first out or the retail inventory method to be subsequently measured at the lower of cost or net realizable value, rather than at the lower of cost or market. ASU 2015-11 is effective for annual reporting periods beginning after December 15, 2016 and for interim periods within such annual period. Early application is permitted. The Company is currently evaluating the potential effects of adopting the provisions of ASU 2015-11.
In May 2014, the FASB issued ASU 2014-09, Revenue from Contracts with Customers (Topic 606). Under ASU 2014-09, an entity should recognize revenue when it transfers promised goods or services to customers in an amount that reflects the consideration to which the entity expects to be entitled in exchange for those goods or services. ASU 2014-09 also requires additional disclosure about the nature, amount, timing, and uncertainty of revenue and cash flows arising from customer contracts, including significant judgments and changes in judgments and assets recognized from costs incurred to obtain or fulfill a contract. Subsequent to the issuance of ASU 2014-09, the FASB has issued various additional ASUs clarifying and amending this new revenue guidance. These ASUs apply to all companies that enter into contracts with customers to transfer goods or services and are effective for public entities for interim and annual reporting periods beginning after December 15, 2017. Early adoption is permitted, but not before interim and annual reporting periods beginning after December 15, 2016. Entities have the choice to apply these ASUs either retrospectively to each reporting period presented or by recognizing the cumulative effect of applying these standards at the date of initial application and not adjusting comparative information. The Company is currently evaluating the provisions of ASU No. 2014-09 and assessing the impact on its financial statements. As part of our assessment work-to-date, we have formed an implementation work team, begun training on the new ASU’s revenue recognition model and are beginning to review our customer contracts. We are also evaluating the impact of the new standard on certain common practices currently employed by the Company and by other manufacturers of consumer products, such as slotting fees, co-operative advertising, rebates and other pricing allowances, merchandising funds and consumer coupons. We have not yet determined if the full retrospective or modified retrospective method will be applied.
80
4. EARNINGS PER SHARE
The following table sets forth the computation of basic and diluted earnings per share:
Fiscal Year Ended June 30, | |||||||||||
2016 | 2015 (Revised) | 2014 (Revised) | |||||||||
Numerator: | |||||||||||
Income from continuing operations | $ | 47,429 | $ | 164,962 | $ | 131,551 | |||||
Loss from discontinued operations, net of tax | — | — | (1,629 | ) | |||||||
Net income | $ | 47,429 | $ | 164,962 | $ | 129,922 | |||||
Denominator: | |||||||||||
Basic weighted average shares outstanding | 103,135 | 101,703 | 97,750 | ||||||||
Effect of dilutive stock options, unvested restricted stock and unvested restricted share units | 1,048 | 1,718 | 2,256 | ||||||||
Diluted weighted average shares outstanding | 104,183 | 103,421 | 100,006 | ||||||||
*Basic net income/(loss) per common share: | |||||||||||
From continuing operations | $ | 0.46 | $ | 1.62 | $ | 1.35 | |||||
From discontinued operations | — | — | (0.02 | ) | |||||||
Net income per common share - basic | $ | 0.46 | $ | 1.62 | $ | 1.33 | |||||
*Diluted net income/(loss) per common share: | |||||||||||
From continuing operations | $ | 0.46 | $ | 1.60 | $ | 1.32 | |||||
From discontinued operations | — | — | (0.02 | ) | |||||||
Net income per common share - diluted | $ | 0.46 | $ | 1.60 | $ | 1.30 | |||||
* Net income per common share may not add in certain periods due to rounding
Note: On December 29, 2014, the Company effected a two-for-one stock split of its common stock in the form of a 100% stock dividend to shareholders of record as of December 12, 2014. All share and per share information has been retroactively adjusted to reflect the stock split.
Basic earnings per share excludes the dilutive effects of stock options, unvested restricted stock and unvested restricted share units. Diluted earnings per share includes the dilutive effects of common stock equivalents such as stock options and unvested restricted stock awards. The Company used income from continuing operations as the control number in determining whether potential common shares were dilutive or anti-dilutive. The same number of potential common shares used in computing the diluted per share amount from continuing operations was also used in computing the diluted per share amounts from discontinued operations even if those amounts were anti-dilutive.
There were 282, 107 and 136 stock based awards excluded from our diluted earnings per share calculations for the fiscal years ended June 30, 2016, 2015 and 2014, respectively, as such awards were contingently issuable based on market or performance conditions, and such conditions had not been achieved during the respective periods.
81
5. ACQUISITIONS
The Company accounts for acquisitions in accordance with ASC 805, Business Combinations. The results of operations of the acquisitions have been included in the consolidated results from their respective dates of acquisition. The purchase price of each acquisition is allocated to the tangible assets, liabilities and identifiable intangible assets acquired based on their estimated fair values. Acquisitions may include contingent consideration, the fair value of which is estimated on the acquisition date as the present value of the expected contingent payments, determined using weighted probabilities of possible payments. The fair values assigned to identifiable intangible assets acquired were determined primarily by using an income approach which was based on assumptions and estimates made by management. Significant assumptions utilized in the income approach were based on company specific information and projections which are not observable in the market and are thus considered Level 3 measurements as defined by authoritative guidance. The excess of the purchase price over the fair value of the identified assets and liabilities has been recorded as goodwill.
The costs related to all acquisitions have been expensed as incurred and are included in “Acquisition related expenses, restructuring and integration charges” in the Consolidated Statements of Income. Acquisition-related costs of $3,724, $5,731 and $7,238 were expensed in the fiscal years ended June 30, 2016, 2015 and 2014, respectively. The expenses incurred during fiscal 2016 and 2015 primarily related to professional fees and other transaction related costs associated with our recent acquisitions and during fiscal 2014 primarily related to professional fees and stamp duty associated with the acquisition of Tilda (as defined below).
Fiscal 2016
On December 21, 2015, the Company acquired Orchard House Foods Limited (“Orchard House”), a leader in pre-cut fresh fruit, juices, fruit desserts and ingredients with facilities in Corby and Gateshead in the United Kingdom. Orchard House supplies leading retailers, on-the-go food outlets, food service providers and manufacturers in the United Kingdom. Consideration for the transaction consisted of cash, net of cash acquired, totaling £76,923 (approximately $114,113 at the transaction date exchange rate). The acquisition was funded with borrowings under the Credit Agreement (as defined in Note 10, Debt and Borrowings). Additionally, contingent consideration of up to £3,000 was potentially payable to the sellers based on the outcome of a review by the Competition and Markets Authority (“CMA”) in the United Kingdom. As a result of this review, the Company agreed to divest certain portions of its own-label juice business in the fourth quarter of fiscal 2016. On September 15, 2016, the contingent consideration obligation referenced above was settled in the amount of £1,500 ($2,225 at the transaction date exchange rate). Orchard House is included in the United Kingdom operating and reportable segment. Net sales and income before income taxes attributable to the Orchard House acquisition and included in our consolidated results were $88,580 and $4,622, respectively, for the fiscal year ended June 30, 2016.
On July 24, 2015, the Company acquired Formatio Beratungs- und Beteiligungs GmbH and its subsidiaries (“Mona”), a leader in plant-based foods and beverages with facilities in Germany and Austria. Mona offers a wide range of organic and natural products under the Joya® and Happy® brands, including soy, oat, rice and nut based drinks as well as plant-based yogurts, desserts, creamers, tofu and private label products, sold to leading retailers in Europe, primarily in Austria and Germany and eastern European countries. Consideration for the transaction consisted of cash, net of cash acquired, totaling €22,753 (approximately $24,948 at the transaction date exchange rate) and 240 shares of the Company’s common stock valued at $16,308. Also included in the acquisition was the assumption of net debt totaling €16,252. The cash portion of the purchase price was funded with borrowings under our Credit Agreement. Mona is included in the Europe operating segment which is part of the Rest of World reportable segment. Net sales and income before income taxes attributable to the Mona acquisition and included in our consolidated results were $58,767 and $3,464, respectively, for the fiscal year ended June 30, 2016.
82
The following table summarizes the components of the purchase price allocations for the fiscal 2016 acquisitions:
Mona | Orchard House | Total | |||||||||
Purchase Price: | |||||||||||
Cash paid, net of cash acquired | $ | 24,948 | $ | 114,113 | $ | 139,061 | |||||
Equity issued | 16,308 | — | 16,308 | ||||||||
Fair value of contingent consideration | — | 2,225 | 2,225 | ||||||||
$ | 41,256 | $ | 116,338 | $ | 157,594 | ||||||
Allocation: | |||||||||||
Current assets, excluding cash acquired | $ | 17,526 | $ | 18,960 | $ | 36,486 | |||||
Property, plant and equipment | 16,583 | 18,594 | 35,177 | ||||||||
Other long term assets | 226 | — | 226 | ||||||||
Identifiable intangible assets | 14,803 | 54,888 | 69,691 | ||||||||
Deferred taxes | (1,012 | ) | (9,463 | ) | (10,475 | ) | |||||
Assumed liabilities | (27,651 | ) | (23,660 | ) | (51,311 | ) | |||||
Goodwill | 20,781 | 57,019 | 77,800 | ||||||||
$ | 41,256 | $ | 116,338 | $ | 157,594 | ||||||
The fair values assigned to identifiable intangible assets acquired were based on assumptions and estimates made by management. Identifiable intangible assets acquired consisted of customer relationships valued at $58,726 with a weighted average estimated useful life of 15 years and trade names valued at $10,965 with indefinite lives. The goodwill represents the future economic benefits expected to arise that could not be individually identified and separately recognized, including use of the Company’s existing infrastructure to expand sales of the acquired business’ products and to expand sales of the Company’s existing products into new regions. The goodwill recorded as a result of these acquisitions is not expected to be deductible for tax purposes.
The following table provides unaudited pro forma results of continuing operations for the fiscal years ended June 30, 2016 and 2015, as if the acquisitions of Orchard House and Mona had been completed at the beginning of fiscal 2015. The information has been provided for illustrative purposes only and does not purport to be indicative of the actual results that would have been achieved by the Company for the periods presented or that will be achieved by the combined company in the future. The pro forma information has been adjusted to give effect to items that are directly attributable to the transactions and are expected to have a continuing impact on the combined results.
Fiscal Year Ended June 30, | |||||||
2016 | 2015 | ||||||
Net sales from continuing operations | $ | 2,973,872 | $ | 2,947,536 | |||
Net income from continuing operations | $ | 51,270 | $ | 177,435 | |||
Net income per common share from continuing operations - diluted | $ | 0.49 | $ | 1.71 | |||
Fiscal 2015
On July 17, 2014, the Company acquired the remaining 51.3% of Hain Pure Protein Corporation (“HPPC”) that it did not already own, at which point HPPC became a wholly-owned subsidiary. HPPC processes, markets and distributes antibiotic-free, organic and other poultry products. HPPC held a 19% interest in EK Holdings, Inc. (“Empire”), which grows, processes and sells kosher poultry and other products. Consideration in the transaction consisted of cash totaling $20,310, net of cash acquired, and 462,856 shares of the Company’s common stock valued at $19,690. The cash consideration paid was funded with then-existing cash balances. Additionally, HPPC’s existing bank borrowings were repaid on September 30, 2014 with proceeds from borrowings under the Credit Agreement . The carrying amount of the pre-existing 48.7% investment in HPPC as of June 30, 2014 was $29,327. Due to the acquisition of the remaining 51.3% of HPPC, the Company adjusted the carrying amount of its pre-existing investment to its fair value. This resulted in a gain of $6,747 recorded in “Gain on sale of business” in the Consolidated Statements of Income. HPPC is its own operating segment which is part of the Hain Pure Protein reportable segment. Net sales and income before income taxes attributable to the HPPC acquisition and included in our consolidated results were $290,593 and $26,649 respectively, for the fiscal year ended June 30, 2015.
83
On February 20, 2015, the Company acquired Belvedere International, Inc. (“Belvedere”), a leader in health and beauty care products including the Live Clean® brand with approximately 200 baby, body and hair care products as well as several mass market brands sold primarily in Canada and manufactured in a company facility in Mississauga, Ontario, Canada. Consideration in the transaction consisted of cash totaling C$17,454 ($13,988 at the transaction date exchange rate), net of cash acquired, which included debt that was repaid at closing, and was funded with then-existing cash balances. Additionally, contingent consideration of up to a maximum of C$4,000 was payable based on the achievement of specified operating results during the two consecutive one-year periods following the closing date. In both the fourth quarter of fiscal 2016 and 2017, the Company paid C$2,000 in settlement of the Belvedere contingent consideration obligation. Belvedere is included in our Canada operating segment, which is part of the Rest of World reportable segment. Net sales and income before income taxes attributable to the Belvedere acquisition and included in our consolidated results were not material in the fiscal year ended June 30, 2015.
On March 4, 2015, the Company acquired the remaining 81% of Empire that it did not already own, at which point Empire became a wholly-owned subsidiary. Consideration in the transaction consisted of cash totaling $57,595, net of cash acquired, which included debt that was repaid at closing. The acquisition was funded with borrowings under the Credit Agreement. The carrying amount of the pre-existing 19% investment in Empire as of March 4, 2015 was $6,864. Due to the acquisition of the remaining 81% of Empire, the Company adjusted the carrying amount of its pre-existing investment to its fair value. This resulted in a gain of $2,922 recorded in “Gain on sale of business” in the Consolidated Statements of Income. Empire is its own operating segment which is part of the Hain Pure Protein reportable segment. Net sales and income before income taxes attributable to the Empire acquisition and included in our consolidated results were $46,604 and $4,752 respectively, for the fiscal year ended June 30, 2015.
The following table summarizes the components of the purchase price allocations for the fiscal 2015 acquisitions (as revised):
HPPC | Belvedere | Empire | Total | ||||||||||||
Carrying value of pre-existing interest, after fair value adjustments: | $ | 36,074 | $ | — | $ | 9,786 | $ | 45,860 | |||||||
Purchase Price: | |||||||||||||||
Cash paid, net of cash acquired | 20,310 | 13,988 | 57,595 | 91,893 | |||||||||||
Equity issued | 19,690 | — | — | 19,690 | |||||||||||
Fair value of contingent consideration | — | 1,603 | — | 1,603 | |||||||||||
$ | 76,074 | $ | 15,591 | $ | 67,381 | $ | 159,046 | ||||||||
Allocation: | |||||||||||||||
Current assets, excluding cash acquired | $ | 50,464 | $ | 10,542 | $ | 19,774 | $ | 80,780 | |||||||
Property, plant and equipment | 29,599 | 2,598 | 12,334 | 44,531 | |||||||||||
Other assets | 7,288 | — | — | 7,288 | |||||||||||
Identifiable intangible assets | 20,700 | 5,850 | 34,800 | 61,350 | |||||||||||
Deferred taxes | 490 | (3,890 | ) | (14,764 | ) | (18,164 | ) | ||||||||
Assumed liabilities | (42,332 | ) | (1,825 | ) | (15,987 | ) | (60,144 | ) | |||||||
Goodwill | 9,865 | 2,316 | 31,224 | 43,405 | |||||||||||
$ | 76,074 | $ | 15,591 | $ | 67,381 | $ | 159,046 | ||||||||
The fair values assigned to identifiable intangible assets acquired were based on assumptions and estimates made by management. Identifiable intangible assets acquired consisted of customer relationships valued at $15,903 with a weighted average estimated useful life of 11 years, a patent valued at $1,700 with an estimated life of 9 years, and trade names valued at $43,747 with indefinite lives. The goodwill represents the future economic benefits expected to arise that could not be individually identified and separately recognized, including use of the Company’s existing infrastructure to expand sales of the acquired business’ products. The goodwill recorded as a result of these acquisitions is not expected to be deductible for tax purposes.
The following table provides unaudited pro forma results of continuing operations for the fiscal years ended June 30, 2015 and 2014, as if the acquisitions completed in fiscal 2015 (HPPC, Belvedere and Empire) had been completed at the beginning of fiscal year 2014. The information has been provided for illustrative purposes only and does not purport to be indicative of the actual results that would have been achieved by the Company for the periods presented or that will be achieved by the combined company in the future. The pro forma information has been adjusted to give effect to items that are directly attributable to the transactions and are expected to have a continuing impact on the combined results, which include amortization expense associated with acquired identifiable intangible assets and the impact of reversing our previously recorded equity in HPPC’s net income as prior to the date of acquisition, HPPC was accounted for under the equity-method of accounting.
84
Fiscal Year Ended June 30, | |||||||
2015 (Revised) | 2014 (Revised) | ||||||
Net sales from continuing operations | $ | 2,718,466 | $ | 2,512,384 | |||
Net income from continuing operations | $ | 168,196 | $ | 138,286 | |||
Net income per common share from continuing operations - diluted | $ | 1.63 | $ | 1.38 | |||
Fiscal 2014
On April 28, 2014, the Company acquired Charter Baking Company, Inc. and its subsidiary Rudi’s Organic Bakery, Inc. (“Rudi’s”), a leading organic and gluten-free company with facilities in Boulder, Colorado. Under the Rudi’s Organic Bakery® and Rudi’s Gluten-Free Bakery brands, Rudi’s offers a range of approximately 60 products including USDA certified organic breads, buns, bagels, tortillas, wraps and soft pretzels and various gluten-free products including breads, buns, pizza crusts, tortillas, snack bars and stuffing in the United States and Canada. Consideration in the transaction consisted of cash totaling $50,807, net of cash acquired, and 267,488 shares of the Company’s common stock valued at $11,168. The cash consideration paid was funded with borrowings under the Credit Agreement. Rudi’s is included in the United States operating and reportable segment. Net sales and income before income taxes attributable to the Rudi’s acquisition and included in our consolidated results were not material in the fiscal year ended June 30, 2014.
On January 13, 2014, the Company acquired Tilda Limited (“Tilda”), a leading premium 100% branded Basmati and specialty rice products company. Tilda offers a range of over 60 dry rice and ready-to-heat branded products under the Tilda® brand and other names to consumers in over 40 countries, principally in the United Kingdom, the Middle East and North Africa, Continental Europe, North America and India. On June 18, 2014, the Company also completed the acquisition of certain assets of Tilda Riceland Limited in India. Consideration in these transactions consisted of cash totaling $123,822, net of cash acquired and based on the exchange rates in effect at the respective transaction dates, 3,292,346 shares of the Company’s common stock valued at $148,353 and deferred consideration (the “Vendor Loan Note”) for £20,000 ($32,958 at the transaction date exchange rate) issued by the Company and payable within one year following completion of the acquisition, with a portion being payable in Company shares at the Company’s option. On January 13, 2015, the Company paid £10,000 ($15,114 at the transaction date exchange rate and which was funded with existing cash balances) and issued 266,984 shares of the Company’s common stock in full repayment of this obligation. As a result, the Company recorded a realized foreign currency gain of $3,397 which represents the change in foreign currency rates from the acquisition date through the repayment date. The gain is included as a component of “Other (income)/expense, net” on the Consolidated Statements of Income. The cash consideration paid for the initial purchase price was funded with borrowings under the Credit Agreement. Tilda is its own operating segment which is part of the United Kingdom reportable segment. Net sales and income before income taxes attributable to the Tilda acquisition and included in our consolidated results were $101,119 and $12,909 respectively, for the fiscal year ended June 30, 2014.
The following table summarizes the components of the purchase price allocations for the fiscal 2014 acquisitions (as revised):
Tilda | Rudi’s | Total | |||||||||
Purchase price: | |||||||||||
Cash paid, net of cash acquired | $ | 123,822 | $ | 50,807 | $ | 174,629 | |||||
Equity issued | 148,353 | 11,168 | 159,521 | ||||||||
Vendor Loan Note | 32,958 | — | 32,958 | ||||||||
$ | 305,133 | $ | 61,975 | $ | 367,108 | ||||||
Allocation: | |||||||||||
Current assets, excluding cash acquired | $ | 88,470 | $ | 8,158 | $ | 96,628 | |||||
Property, plant and equipment | 39,806 | 3,774 | 43,580 | ||||||||
Identifiable intangible assets | 124,549 | 27,514 | 152,063 | ||||||||
Assumed liabilities | (93,743 | ) | (6,690 | ) | (100,433 | ) | |||||
Deferred income taxes | (26,527 | ) | 1,932 | (24,595 | ) | ||||||
Goodwill | 172,578 | 27,287 | 199,865 | ||||||||
$ | 305,133 | $ | 61,975 | $ | 367,108 | ||||||
85
The fair values assigned to identifiable intangible assets acquired were based on assumptions and estimates made by management. Identifiable intangible assets acquired consist principally of customer relationships valued at $41,976 with a weighted average estimated useful life of 13 years and trade names valued at $110,087 with indefinite lives. The goodwill represents the future economic benefits expected to arise that could not be individually identified and separately recognized, including use of the Company’s existing infrastructure to expand sales of the acquired business’ products. The goodwill recorded as a result of the acquisitions is not expected to be deductible for tax purposes.
The following table provides unaudited pro forma results of continuing operations for the fiscal year ended June 30, 2014, as if the acquisitions completed in fiscal 2014 (Rudi’s and Tilda) had been completed at the beginning of fiscal year 2014. The information has been provided for illustrative purposes only and does not purport to be indicative of the actual results that would have been achieved by the Company for the periods presented or that will be achieved by the Company in the future. The pro forma information has been adjusted to give effect to items that are directly attributable to the transactions and are expected to have a continuing impact on the combined results, which include amortization expense associated with acquired identifiable intangible assets and interest expense associated with bank borrowings to fund the acquisitions.
Fiscal Year Ended June 30, 2014 (Revised) | |||
Net sales from continuing operations | $ | 2,264,751 | |
Net income from continuing operations | $ | 141,605 | |
Net income per common share from continuing operations - diluted | $ | 1.40 | |
6. INVENTORIES
Inventories consisted of the following:
June 30, 2016 | June 30, 2015 (Revised) | ||||||
Finished goods | $ | 238,184 | $ | 261,192 | |||
Raw materials, work-in-progress and packaging | 170,380 | 136,127 | |||||
$ | 408,564 | $ | 397,319 | ||||
7. PROPERTY, PLANT AND EQUIPMENT, NET
Property, plant and equipment, net consisted of the following:
June 30, 2016 | June 30, 2015 (Revised) | ||||||
Land | $ | 35,825 | $ | 36,386 | |||
Buildings and improvements | 102,086 | 88,507 | |||||
Machinery and equipment | 358,362 | 330,573 | |||||
Computer hardware and software | 48,829 | 36,346 | |||||
Furniture and fixtures | 14,165 | 10,272 | |||||
Leasehold improvements | 28,471 | 25,752 | |||||
Construction in progress | 14,495 | 10,340 | |||||
602,233 | 538,176 | ||||||
Less: Accumulated depreciation and amortization | 212,392 | 184,512 | |||||
$ | 389,841 | $ | 353,664 | ||||
Depreciation and amortization expense for the fiscal years ended June 30, 2016, 2015, and 2014 was $38,124, $32,293 and $26,245, respectively.
86
8. GOODWILL AND OTHER INTANGIBLE ASSETS
Goodwill
The following table shows the changes in the carrying amount of goodwill by business segment:
United States | United Kingdom | Hain Pure Protein | Rest of World | Total | |||||||||||||||
Balance as of June 30, 2014 (revised) (a): | $ | 610,228 | $ | 458,421 | $ | — | $ | 69,224 | $ | 1,137,873 | |||||||||
Acquisitions | 3,792 | (1,395) | 41,970 | 2,427 | 46,794 | ||||||||||||||
Translation and other adjustments, net | (3,275 | ) | (36,305 | ) | — | (9,409 | ) | (48,989 | ) | ||||||||||
Balance as of June 30, 2015 (revised) (a): | 610,745 | 420,721 | 41,970 | 62,242 | 1,135,678 | ||||||||||||||
Acquisitions | — | 57,019 | (881 | ) | 20,674 | 76,812 | |||||||||||||
Impairment charge | — | (84,548 | ) | — | — | (84,548 | ) | ||||||||||||
Translation and other adjustments, net | (5,043 | ) | (60,631 | ) | — | (1,932 | ) | (67,606 | ) | ||||||||||
Balance as of June 30, 2016 (b): | $ | 605,702 | $ | 332,561 | $ | 41,089 | $ | 80,984 | $ | 1,060,336 | |||||||||
(a) The total carrying value of goodwill is reflected net of $42,029 of accumulated impairment charges, of which $12,810 related to the Company’s United Kingdom operating segment and $29,219 related to the Company’s Europe operating segment.
(b) The total carrying value of goodwill is reflected net of $126,577 of accumulated impairment charges, of which $97,358 related to the Company’s United Kingdom operating segment and $29,219 related to the Company’s Europe operating segment.
The Company completed its annual goodwill impairment analysis in the fourth quarter of fiscal 2016, in conjunction with its budgeting and forecasting process for fiscal year 2017, and concluded that no indicators of impairment existed at any of its reporting units except for its Hain Daniels reporting unit, which is included in the United Kingdom segment. Based on the step one analysis performed, the Company concluded that the fair value of the Hain Daniels reporting unit was below its carrying value, indicating that the second step of the impairment test was necessary. The decline in the estimated fair value in the Hain Daniels reporting unit was primarily the result of lowered projected long-term revenue growth rates and profitability levels resulting from increased competition, changes in market trends and the mix of products sold. The goodwill value implied from this analysis resulted in a goodwill impairment charge of $82,614 recognized during the fiscal year ended June 30, 2016.
To perform the second step of the impairment test, the Company, along with the help of a third party valuation firm, estimated the fair value of all of the Hain Daniels reporting unit’s individual assets and liabilities, including identifiable intangible assets.
In conjunction with the Company’s review of goodwill impairment within its Hain Daniels reporting unit, for other long-lived assets, such as property, plant and equipment and finite-lived intangibles assets, namely customer relationships, the Company performed an assessment of the recoverability in accordance with the general valuation requirements set forth under ASC Topic 360 - Accounting for the Impairment of Long-Lived Assets. The result of this assessment indicated that no impairment existed for these assets.
Additionally, a goodwill impairment charge of $1,934 was recognized during the fiscal year ended June 30, 2016, related to the divestiture of certain portions of the Company’s own-label juice business in connection with the Orchard House acquisition, which was sold in the first quarter of fiscal 2017. See Note 5, Acquisitions, for details.
Additions during fiscal year ended June 30, 2016 were due to the acquisition of Orchard House and Mona on December 21, 2015 and July 24, 2015, respectively. The additions during fiscal year ended June 30, 2015, were due to the acquisitions of HPPC, Belvedere, and Empire on July 17, 2015, January 20, 2015 and March 4, 2015, respectively.
87
Other Intangible Assets
The following table sets forth balance sheet information for intangible assets, excluding goodwill, subject to amortization and intangible assets not subject to amortization:
June 30, 2016 | June 30, 2015 (Revised) | ||||||
Non-amortized intangible assets: | |||||||
Trademarks and tradenames (a) | $ | 441,140 | $ | 507,263 | |||
Amortized intangible assets: | |||||||
Other intangibles | 245,040 | 207,609 | |||||
Less: accumulated amortization | (81,393 | ) | (68,480 | ) | |||
Net carrying amount | $ | 604,787 | $ | 646,392 | |||
(a) The gross carrying value of trademarks and tradenames is reflected net of $46,123 and $6,399 of accumulated impairment charges for the fiscal years ended June 30, 2016 and 2015, respectively.
Indefinite-lived intangible assets, which are not amortized, consist primarily of acquired trade names and trademarks. Indefinite-lived intangible assets are evaluated on an annual basis, in conjunction with the Company’s evaluation of goodwill. In assessing fair value, the Company utilizes a “relief from royalty” methodology. This approach involves two steps: (i) estimating the royalty rates for each trademark and (ii) applying these royalty rates to a projected net sales stream and discounting the resulting cash flows to determine fair value. If the carrying value of the indefinite-lived intangible assets exceeds the fair value of the asset, the carrying value is written down to fair value in the period identified. The result of this assessment for the year ended June 30, 2016 indicated that the fair value of certain of the Company’s tradenames was below their carrying value, and therefore an impairment charge of $39,724 ($20,932 in the United Kingdom segment and $18,792 in the United States segment) was recognized during the fiscal year ended June 30, 2016. The result of this assessment performed during the year ended June 30, 2014 was the recognition of an impairment charge of $6,399 related to tradenames in the United Kingdom. There were no impairment charges recorded during fiscal 2015 related to indefinite-lived intangible assets.
Amortizable intangible assets, which are deemed to have a finite life, primarily consist of customer relationships and are being amortized over their estimated useful lives of 3 to 25 years. Amortization expense included in continuing operations was as follows:
Fiscal Year ended June 30, | |||||||||||
2016 | 2015 | 2014 | |||||||||
Amortization of intangible assets | $ | 18,869 | $ | 17,846 | $ | 15,440 | |||||
Expected amortization expense over the next five fiscal years is as follows:
Fiscal Year ending June 30, | |||||||||||||||||||
2017 | 2018 | 2019 | 2020 | 2021 | |||||||||||||||
Estimated amortization expense | $ | 19,036 | $ | 18,852 | $ | 16,214 | $ | 14,988 | $ | 14,539 | |||||||||
The weighted average remaining amortization period of amortized intangible assets is 11.0 years.
88
9. ACCRUED EXPENSES AND OTHER CURRENT LIABILITIES
Accrued expenses and other current liabilities consisted of the following:
June 30, 2016 | June 30, 2015 (Revised) | ||||||
Payroll, employee benefits and other administrative accruals | $ | 43,774 | $ | 51,979 | |||
Freight and warehousing accruals | 16,007 | 12,713 | |||||
Selling and marketing related accruals | 9,826 | 8,335 | |||||
Litigation accrual | 1,200 | 7,700 | |||||
Contingent consideration | 3,553 | — | |||||
Other accruals | 4,443 | 4,906 | |||||
$ | 78,803 | $ | 85,633 | ||||
10. DEBT AND BORROWINGS
Debt and borrowings consisted of the following:
June 30, 2016 | June 30, 2015 | ||||||
Credit Agreement borrowings payable to banks | $ | 827,860 | $ | 660,216 | |||
Senior Notes | — | 150,000 | |||||
Tilda short-term borrowing arrangements | 19,121 | 29,600 | |||||
Other borrowings | 15,703 | 4,067 | |||||
862,684 | 843,883 | ||||||
Short-term borrowings and current portion of long-term debt | 26,513 | 31,275 | |||||
Long-term debt, less current portion | $ | 836,171 | $ | 812,608 | |||
Credit Agreement
On December 12, 2014, the Company entered into the Second Amended and Restated Credit Agreement (the “Credit Agreement”) which provides for a $1,000,000 unsecured revolving credit facility which may be increased by an additional uncommitted $350,000, provided certain conditions are met. The Credit Agreement expires in December 2019. Borrowings under the Credit Agreement may be used to provide working capital, finance capital expenditures and permitted acquisitions, refinance certain existing indebtedness and for other lawful corporate purposes. The Credit Agreement provides for multicurrency borrowings in Euros, Pounds Sterling and Canadian Dollars as well as other currencies which may be designated. In addition, certain wholly-owned foreign subsidiaries of the Company may be designated as co-borrowers. The Credit Agreement contains restrictive covenants usual and customary for facilities of its type, which include, with specified exceptions, limitations on the Company’s ability to engage in certain business activities, incur debt, have liens, make capital expenditures, pay dividends or make other distributions, enter into affiliate transactions, consolidate, merge or acquire or dispose of assets, and make certain investments, acquisitions and loans. The Credit Agreement also requires the Company to satisfy certain financial covenants, such as maintaining a consolidated interest coverage ratio (as defined in the Credit Agreement) of no less than 4.0 to 1.0 and a consolidated leverage ratio (as defined in the Credit Agreement) of no more than 3.5 to 1.0. The consolidated leverage ratio is subject to a step-up to 4.0 to 1.0 for the four full fiscal quarters following an acquisition. Obligations under the Credit Agreement are guaranteed by certain existing and future domestic subsidiaries of the Company. As of June 30, 2016, there were $827,860 of borrowings and $3,868 letters of credit outstanding under the Credit Agreement and $168,272 available. The Company was deemed to be in compliance with all associated covenants due to certain limited waivers and extensions received by the Company in connection with its obligation to deliver financial information.
The Credit Agreement provides that loans will bear interest at rates based on (a) the Eurocurrency Rate, as defined in the Credit Agreement, plus a rate ranging from 0.875% to 1.70% per annum; or (b) the Base Rate, as defined in the Credit Agreement, plus a rate ranging from 0.00% to 0.70% per annum, the relevant rate being the Applicable Rate. The Applicable Rate will be determined in accordance with a leverage-based pricing grid, as set forth in the Credit Agreement. Swing line loans and Global Swing Line loans denominated in United States dollars will bear interest at the Base Rate plus the Applicable Rate and Global Swing Line loans denominated in foreign currencies shall bear interest based on the overnight Eurocurrency Rate for loans denominated in
89
such currency plus the Applicable Rate. The weighted average interest rate on outstanding borrowings under the Credit Agreement at June 30, 2016 was 1.81%. Additionally, the Credit Agreement contains a Commitment Fee, as defined in the Credit Agreement, on the amount unused under the Credit Agreement ranging from 0.20% to 0.30% per annum. Such Commitment Fee is determined in accordance with a leverage-based pricing grid, as set forth in the Credit Agreement.
The Company had $150,000 in aggregate principal amount of 10-year senior notes due May 2, 2016 issued in a private placement outstanding as of June 30, 2015. The notes bore interest at 5.98%, payable semi-annually on November 2 and May 2. On May 2, 2016, the Company utilized capacity under its existing revolving credit facility to redeem these notes. As of June 30, 2016, there were no senior notes outstanding.
Tilda Short-Term Borrowing Arrangements
Tilda maintains short-term borrowing arrangements primarily used to fund the purchase of rice from India and other countries. The maximum borrowings permitted under all such arrangements are £52,000. Outstanding borrowings are collateralized by the current assets of Tilda, typically have six-month terms and bear interest at variable rates typically based on LIBOR plus a margin (weighted average interest rate of approximately 2.5% at June 30, 2016).
Other Borrowings
Other borrowings primarily relate to a cash pool facility in Europe. The cash pool facility provides our Europe operating segment with sufficient liquidity to support the Company’s growth objectives within this segment. The maximum borrowings permitted under the cash pool arrangement are €12,500. Outstanding borrowings bear interest at variable rates typically based on EURIBOR plus a margin of 1.1% (weighted average interest rate of approximately 1.1% at June 30, 2016).
Maturities of all debt instruments at June 30, 2016, are as follows:
Due in Fiscal Year | Amount | |||
2017 | $ | 26,513 | ||
2018 | 838 | |||
2019 | 484 | |||
2020 | 829,625 | |||
2021 | 1,676 | |||
Thereafter | 3,548 | |||
$ | 862,684 | |||
Interest paid during the fiscal years ended June 30, 2016, 2015 and 2014 amounted to $24,288, $22,865 and $20,560, respectively.
11. INCOME TAXES
The components of income (loss) before income taxes and equity in earnings of equity-method investees were as follows:
Fiscal Year Ended June 30, | |||||||||||
2016 | 2015 (Revised) | 2014 (Revised) | |||||||||
Domestic | $ | 158,025 | $ | 170,884 | $ | 154,773 | |||||
Foreign | (39,617 | ) | 41,985 | 42,387 | |||||||
Total | $ | 118,408 | $ | 212,869 | $ | 197,160 | |||||
90
The provision (benefit) for income taxes consisted of the following:
Fiscal Year Ended June 30, | |||||||||||
2016 | 2015 (Revised) | 2014 (Revised) | |||||||||
Current: | |||||||||||
Federal | $ | 21,304 | $ | 32,910 | $ | 47,660 | |||||
State and local | 1,798 | 8,311 | 7,640 | ||||||||
Foreign | 14,737 | 9,981 | 16,920 | ||||||||
37,839 | 51,202 | 72,220 | |||||||||
Deferred: | |||||||||||
Federal | 30,711 | (912 | ) | 2,241 | |||||||
State and local | 5,017 | (1,069 | ) | (186 | ) | ||||||
Foreign | (2,635 | ) | (686 | ) | (4,667 | ) | |||||
33,093 | (2,667 | ) | (2,612 | ) | |||||||
Total | $ | 70,932 | $ | 48,535 | $ | 69,608 | |||||
Cash paid for income taxes, net of refunds, during the fiscal years ended June 30, 2016, 2015 and 2014 amounted to $44,225, $47,317 and $47,339, respectively.
The reconciliation of the U.S. Federal statutory rate to our effective rate on income before provision for income taxes was as follows:
Fiscal Year Ended June 30, | ||||||||||||||||||||||
2016 | % | 2015 (Revised) | % | 2014 (Revised) | % | |||||||||||||||||
Expected United States federal income tax at statutory rate | $ | 41,443 | 35.0 | % | $ | 74,504 | 35.0 | % | $ | 69,006 | 35.0 | % | ||||||||||
State income taxes, net of federal benefit | 5,447 | 4.6 | % | 4,795 | 2.2 | % | 4,862 | 2.5 | % | |||||||||||||
Domestic manufacturing deduction | (1,233 | ) | (1.0 | )% | (1,210 | ) | (0.6 | )% | (2,642 | ) | (1.3 | )% | ||||||||||
Foreign income at different rates | (2,861 | ) | (2.4 | )% | (9,515 | ) | (4.5 | )% | (295 | ) | (0.1 | )% | ||||||||||
Goodwill impairment | 23,172 | 19.6 | % | — | — | — | — | % | — | — | % | |||||||||||
Change in Valuation Allowance | 5,067 | 4.3 | % | 963 | 0.5 | % | — | — | % | |||||||||||||
Corporate tax reorganization | (4,173 | ) | (3.5 | )% | (20,670 | ) | (9.7 | )% | — | — | % | |||||||||||
Unrealized foreign exchange losses | 7,056 | 6.0 | % | — | — | % | — | — | % | |||||||||||||
Non-taxable gains on acquisition of pre-existing ownership interests in HPPC and Empire | — | — | % | (2,793 | ) | (1.3 | )% | — | — | % | ||||||||||||
Reduction of deferred tax liabilities resulting from change in United Kingdom tax rate | (4,942 | ) | (4.2 | )% | — | — | % | (3,739 | ) | (1.9 | )% | |||||||||||
Other | 1,956 | 1.5 | % | 2,461 | 1.2 | % | 2,416 | 1.1 | % | |||||||||||||
Provision for income taxes | $ | 70,932 | 59.9 | % | $ | 48,535 | 22.8 | % | $ | 69,608 | 35.3 | % | ||||||||||
91
Deferred income taxes reflect the net tax effects of temporary differences between the carrying amount of assets and liabilities for financial reporting purposes and the amounts for income tax purposes. Deferred tax assets and liabilities consisted of the following:
June 30, 2016 | June 30, 2015 (Revised) | ||||||
Current deferred tax assets(1): | |||||||
Basis difference on inventory | $ | — | $ | 13,730 | |||
Reserves not currently deductible | — | 22,804 | |||||
Other | — | 1,972 | |||||
Current deferred tax assets(1) | $ | — | $ | 38,506 | |||
Noncurrent deferred tax assets/(liabilities): | |||||||
Basis difference on inventory | $ | 11,232 | $ | — | |||
Reserves not currently deductible | 17,652 | — | |||||
Basis difference on intangible assets | (145,673 | ) | (154,009 | ) | |||
Basis difference on property and equipment | (25,933 | ) | (23,415 | ) | |||
Other comprehensive income | (4,623 | ) | (1,217 | ) | |||
Net operating loss and tax credit carryforwards | 25,340 | 28,875 | |||||
Stock based compensation | 4,632 | 6,828 | |||||
Other | 1,176 | 2,723 | |||||
Valuation allowances | (15,310 | ) | (10,926 | ) | |||
Noncurrent deferred tax liabilities, net | $ | (131,507 | ) | $ | (151,141 | ) | |
Total net deferred tax liabilities | $ | (131,507 | ) | $ | (112,635 | ) | |
(1) | Due to the Company’s adoption of ASU 2015-17, all deferred tax assets and liabilities are classified as noncurrent as of June 30, 2016. See Note 3, Summary of Significant Accounting Policies and Practices, for details. |
At June 30, 2016 and 2015, the Company had U.S. federal net operating loss (“NOL”) carryforwards of approximately $38,433 and $42,880, respectively, the majority of which will not expire until 2033. Certain of these federal loss carryforwards are subject to Internal Revenue Code Section 382 which imposes limitations on utilization following certain changes in ownership of the entity generating the loss carryforward. We had foreign NOL carryforwards of approximately $42,573 and $45,027 in the same respective years.
At June 30, 2016 and 2015, the Company had U.S. federal foreign tax credit carryforwards of approximately $877. These credit carryforwards have various expiration dates through 2020.
As of June 30, 2016, the Company has not provided for deferred taxes on the excess of financial reporting over the tax basis of investments in certain foreign subsidiaries in the amount of $411,000 as the Company plans to reinvest such earnings indefinitely outside the United States. If these earnings were repatriated in the future, additional income and withholding tax expense would be incurred. Due to complexities in the laws of the U.S. and foreign jurisdictions and the assumptions that would have to be made, it is not practicable to estimate the total amount of income taxes that would have to be provided on such earnings.
As required by the authoritative guidance on accounting for income taxes, the Company evaluates the realizability of deferred tax assets on a jurisdictional basis at each reporting date. Accounting for income taxes requires that a valuation allowance be established when it is more likely than not that all or a portion of the deferred tax assets will not be realized. In circumstances where there is sufficient negative evidence indicating that the deferred tax assets are not more likely than not realizable, we establish a valuation allowance. We have recorded valuation allowances in the amounts of $15,310 and $10,926 at June 30, 2016 and 2015, respectively.
92
The changes in valuation allowances against deferred income tax assets were as follows:
Fiscal Year Ended June 30, | |||||||
2016 | 2015 (Revised) | ||||||
Balance at beginning of year | $ | 10,926 | $ | 10,952 | |||
Additions charged to income tax expense | 7,484 | 963 | |||||
Reductions credited to income tax expense | (2,417 | ) | — | ||||
Currency translation adjustments | (683 | ) | (989 | ) | |||
Balance at end of year | $ | 15,310 | $ | 10,926 | |||
Unrecognized tax benefits activity, including interest and penalties, is summarized below:
Fiscal Year Ended June 30, | |||||||||||
2016 | 2015 (Revised) | 2014 (Revised) | |||||||||
Balance at beginning of year | $ | 10,759 | $ | 11,058 | $ | 2,507 | |||||
Additions based on tax positions related to the current year | 4,276 | 1,089 | 5,946 | ||||||||
Additions based on tax positions related to prior years | 1,404 | 202 | 3,511 | ||||||||
Reductions due to lapse in statute of limitations and settlements | (420 | ) | (1,590 | ) | (906 | ) | |||||
Balance at end of year | $ | 16,019 | $ | 10,759 | $ | 11,058 | |||||
As of June 30, 2016, the Company had $16,019 of unrecognized tax benefits, of which $10,826 represents the amount that, if recognized, would impact the effective tax rate in future periods. As of June 30, 2015 and 2014, the Company had $10,759 and $11,058, respectively, of unrecognized tax benefits of which $9,375 and $10,041, respectively, would impact the effective income tax rate in future periods. Accrued liabilities for interest and penalties were $650 and $353 at June 30, 2016 and 2015, respectively. Interest and penalties (expense and/or benefit) are recorded as a component of the provision (benefit) for income taxes in the consolidated financial statements. The Company believes that it is reasonably possible that its unrecognized tax benefits could decrease by $4,200 by June 30, 2017 due to settlements and expirations of statutes of limitations; all of which would reduce the income tax provision for continuing operations.
The Company and its subsidiaries file income tax returns in the U.S. federal jurisdiction, various U.S. state jurisdictions and several foreign jurisdictions. With few exceptions, the Company is no longer subject to U.S. federal, state and local, or non-U.S. income tax examinations by tax authorities for years prior to 2013. However, to the extent we generated NOLs or tax credits in closed tax years, future use of the NOL or tax credit carry forward balance would be subject to examination within the relevant statute of limitations for the year in which utilized. The Company is no longer subject to tax examinations in the United Kingdom for years prior to 2013. Given the uncertainty regarding when tax authorities will complete their examinations and the possible outcomes of their examinations, a current estimate of the range of reasonably possible significant increases or decreases of income tax that may occur within the next twelve months cannot be made. Although there are various tax audits currently ongoing, the Company does not believe the ultimate outcome of such audits will have a material impact on the Company’s consolidated financial statements.
12. STOCKHOLDERS’ EQUITY
Preferred Stock
The Company is authorized to issue “blank check” preferred stock of up to 5,000 shares with such designations, rights and preferences as may be determined from time to time by the Board of Directors. Accordingly, the Board of Directors is empowered to issue, without stockholder approval, preferred stock with dividends, liquidation, conversion, voting or other rights which could decrease the amount of earnings and assets available for distribution to holders of the Company’s Common Stock. At June 30, 2016 and 2015, no preferred stock was issued or outstanding.
93
Common Stock Issued
See Note 5, Acquisitions, for details surrounding issuance of the Company’s common stock in connection with recent acquisitions.
Accumulated Other Comprehensive Loss
The following tables present the changes in accumulated other comprehensive loss:
Fiscal Year Ended June 30, | |||||||
2016 | 2015 (Revised) | ||||||
Foreign currency translation adjustments: | |||||||
Other comprehensive loss before reclassifications (1) | $ | (129,874 | ) | $ | (102,374 | ) | |
Deferred gains/(losses) on cash flow hedging instruments: | |||||||
Other comprehensive income before reclassifications | 4,666 | 5,449 | |||||
Amounts reclassified into income (2) | (5,193 | ) | (3,868 | ) | |||
Unrealized gain on available for sale investment: | |||||||
Other comprehensive loss before reclassifications | (79 | ) | (595 | ) | |||
Amounts reclassified into income (3) | — | (311 | ) | ||||
Net change in accumulated other comprehensive loss | $ | (130,480 | ) | $ | (101,699 | ) | |
(1) | Foreign currency translation adjustments included intra-entity foreign currency transactions that were of a long-term investment nature of $107,221 and $65,185 for fiscal years ended June 30, 2016 and 2015, respectively. |
(2) | Amounts reclassified into income for deferred gains on cash flow hedging instruments are recorded in “Cost of sales” in the Consolidated Statements of Income and, before taxes, were $6,788 and $5,087 for the fiscal years ended June 30, 2016 and 2015, respectively. |
(3) | Amounts reclassified into income for gains on sale of available for sale investments were based on the average cost of the shares held (See Note 14, Investments and Joint Ventures). Such amounts are recorded in “Other (income)/expense, net” in the Consolidated Statements of Income. There was no tax expense associated with these gains reclassified into income in fiscal 2015 as the Company utilized capital losses to offset these gains. |
94
13. STOCK BASED COMPENSATION AND INCENTIVE PERFORMANCE PLANS
The Company has two shareholder-approved plans, the Amended and Restated 2002 Long-Term Incentive and Stock Award Plan and the 2000 Directors Stock Plan, under which the Company’s officers, senior management, other key employees, consultants and directors may be granted options to purchase the Company’s common stock or other forms of equity-based awards.
2002 Long-Term Incentive and Stock Award Plan, as amended
In November 2002, our stockholders approved the 2002 Long-Term Incentive and Stock Award Plan. An aggregate of 3,200 shares of common stock were originally reserved for issuance under this plan. At various Annual Meetings of Stockholders, including the 2014 Annual Meeting, the plan was amended to increase the number of shares issuable to 31,500 shares. The plan provides for the granting of stock options, stock appreciation rights, restricted stock, restricted share units, performance shares, performance share units and other equity awards to employees, directors and consultants. Awards denominated in shares of common stock other than options and stock appreciation rights will be counted against the available share limit as two and seven hundredths shares for every one share covered by such award. All of the options granted to date under the plan have been incentive or non-qualified stock options providing for the exercise price equal to the fair market price at the date of grant. Stock option awards granted under the plan expire seven years after the date of grant. Options and other stock-based awards vest in accordance with provisions set forth in the applicable award agreements. No awards shall be granted under this plan after November 20, 2024.
There were no options granted under this plan in fiscal years 2016, 2015 or 2014.
There were 498, 440 and 388 shares of restricted stock and restricted share units granted under this plan during fiscal years 2016, 2015 and 2014, respectively. Included in these grants during fiscal years 2016, 2015 and 2014 were 366, 365 and 353, respectively, of restricted stock and restricted share units granted under the Company’s long-term incentive programs, of which 284, 109 and 75, respectively, are subject to the achievement of minimum performance goals established under those programs (see “Long-term Incentive Plan,” in this Note 13) or market conditions.
At June 30, 2016, 220 options and 1,104 unvested restricted stock and restricted share units were outstanding under this plan, and there were 11,859 shares available for grant under this plan.
2000 Directors Stock Plan, as amended
In May 2000, our stockholders approved the 2000 Directors Stock Plan. The plan originally provided for the granting of stock options to non-employee directors to purchase up to an aggregate of 1,500 shares of our common stock. In December 2003, the plan was amended to increase the number of shares issuable to 1,900 shares. In March 2009, the plan was amended to permit the granting of restricted stock, restricted share units and dividend equivalents and was renamed. All of the options granted to date under this plan have been non-qualified stock options providing for the exercise price equal to the fair market price at the date of grant. Stock option awards granted under the plan expire seven years after the date of grant. No awards shall be granted under this plan after December 1, 2015.
There were no options granted under this plan in fiscal years 2016, 2015, or 2014.
There were no shares of restricted stock granted under this plan during fiscal year 2016. During fiscal years 2015 and 2014, 20 and 28 shares of restricted stock were granted under this plan, respectively. At June 30, 2016, 18 unvested restricted shares were outstanding, and there will be no further restricted shares or options granted under this plan.
Other Plans
At June 30, 2016, there were also 122 options outstanding that were granted under the prior Celestial Seasonings plan.
Although no further awards can be granted under the 2000 Directors Stock Plan, as amended, or the prior Celestial Seasonings plan, the options and restricted stock outstanding continue in accordance with the terms of the respective plans and grants.
There were 13,326 shares of common stock reserved for future issuance in connection with stock-based awards as of June 30, 2016.
Compensation cost and related income tax benefits recognized in the Consolidated Statements of Income for stock based compensation plans were as follows:
95
Fiscal Year Ended June 30, | |||||||||||
2016 | 2015 | 2014 | |||||||||
Compensation cost (included in selling, general and administrative expense) | $ | 12,688 | $ | 12,197 | $ | 12,448 | |||||
Related income tax benefit | $ | 4,758 | $ | 4,695 | $ | 4,787 | |||||
Stock Options
A summary of the stock option activity for the three fiscal years ended June 30 is as follows:
2016 | Weighted Average Exercise Price | 2015 | Weighted Average Exercise Price | 2014 | Weighted Average Exercise Price | |||||||||||||||
Outstanding at beginning of year | 1,249 | $ | 6.12 | 2,674 | $ | 9.83 | 3,558 | $ | 9.44 | |||||||||||
Exercised | (907 | ) | $ | 5.91 | (1,425 | ) | $ | 13.08 | (883 | ) | $ | 8.30 | ||||||||
Canceled and expired | — | $ | — | — | $ | — | (1 | ) | $ | 8.01 | ||||||||||
Outstanding at end of year | 342 | $ | 6.66 | 1,249 | $ | 6.12 | 2,674 | $ | 9.83 | |||||||||||
Options exercisable at end of year | 342 | $ | 6.66 | 1,249 | $ | 6.12 | 2,674 | $ | 9.83 | |||||||||||
Fiscal Year Ended June 30, | |||||||||||
2016 | 2015 | 2014 | |||||||||
Intrinsic value of options exercised | $ | 27,147 | $ | 62,213 | $ | 29,778 | |||||
Cash received from stock option exercises | $ | — | $ | 18,643 | $ | 7,320 | |||||
Tax benefit recognized from stock option exercises | $ | 10,587 | $ | 24,213 | $ | 11,584 | |||||
For options outstanding and exercisable at June 30, 2016, the aggregate intrinsic value (the difference between the closing stock price on the last day of trading in the year and the exercise price) was $14,721, and the weighted average remaining contractual life was 5.6 years. At June 30, 2016, there was no unrecognized compensation expense related to stock option awards.
96
Restricted Stock
Awards of restricted stock may be either grants of restricted stock or restricted share units that are issued at no cost to the recipient. For restricted stock grants, at the date of grant the recipient has all rights of a stockholder, subject to certain restrictions on transferability and a risk of forfeiture. For restricted share units, legal ownership of the shares is not transferred to the employee until the unit vests. Restricted stock and restricted share unit grants vest in accordance with provisions set forth in the applicable award agreements, which may include performance criteria for certain grants. The compensation cost of these awards is determined using the fair market value of the Company’s common stock on the date of the grant. Compensation expense for restricted stock awards with a service condition is recognized on a straight-line basis over the vesting term. Compensation expense for restricted stock awards with a performance condition is recorded when the achievement of the performance criteria is probable and is recognized over the performance and vesting service periods.
A summary of the restricted stock and restricted share units activity for the three fiscal years ended June 30 is as follows:
2016 | Weighted Average Grant Date Fair Value (per share) | 2015 | Weighted Average Grant Date Fair Value (per share) | 2014 | Weighted Average Grant Date Fair Value (per share) | |||||||||
Non-vested restricted stock and restricted share units - beginning of year | 1,145 | $32.30 | 1,259 | $25.44 | 1,547 | $21.22 | ||||||||
Granted | 416 | $24.54 | 311 | $54.11 | 225 | $41.39 | ||||||||
Vested | (408 | ) | $35.13 | (402 | ) | $26.86 | (476 | ) | $19.09 | |||||
Forfeited | (32 | ) | $45.83 | (23 | ) | $40.65 | (37 | ) | $28.72 | |||||
Non-vested restricted stock and restricted share units - end of year | 1,121 | $28.24 | 1,145 | $32.30 | 1,259 | $25.44 | ||||||||
Fiscal Year Ended June 30, | |||||||||||
2016 | 2015 | 2014 | |||||||||
Fair value of restricted stock and restricted share units granted | $ | 10,203 | $ | 16,462 | $ | 9,303 | |||||
Fair value of shares vested | $ | 18,917 | $ | 21,481 | $ | 19,905 | |||||
Tax benefit recognized from restricted shares vesting | $ | 7,139 | $ | 8,364 | $ | 7,535 | |||||
On July 3, 2012, the Company entered into a Restricted Stock Agreement (the “Agreement”) with Irwin D. Simon, the Company’s Chairman, President and Chief Executive Officer. The Agreement provides for a grant of 800 shares of restricted stock (the “Shares”), the vesting of which is both market and time-based. The market condition is satisfied in increments of 200 Shares upon the Company’s common stock achieving four share price targets. On the last day of any forty-five consecutive trading day period during which the average closing price of the Company’s common stock on the Nasdaq Global Select Market equals or exceeds the following prices: $31.25, $36.25, $41.25 and $50.00, respectively, the market condition for each increment of 200 Shares will be satisfied. The market conditions must be satisfied prior to June 30, 2017. Once each market condition has been satisfied, a tranche of 200 Shares will vest in equal amounts annually over a five-year period. Except in the case of a change of control, termination without cause, death or disability (each as defined in Mr. Simon’s Employment Agreement), the unvested Shares are subject to forfeiture unless Mr. Simon remains employed through the applicable market and time vesting periods. The grant date fair value for each tranche was separately estimated based on a Monte Carlo simulation that calculated the likelihood of goal attainment and the time frame most likely for goal attainment. The total grant date fair value of the Shares was estimated to be $16,151, which was expected to be recognized over a weighted-average period of approximately 4.0 years. On September 28, 2012, August 27, 2013, December 13, 2013 and October 22, 2014, the four respective market conditions were satisfied. As such, the four tranches of 200 Shares each are expected to vest in equal amounts over the five-year period commencing on the first anniversary of the date the market condition for the respective tranche was satisfied.
At June 30, 2016, $16,754 of unrecognized stock-based compensation expense, net of estimated forfeitures, related to non-vested restricted stock awards, inclusive of the Shares, was expected to be recognized over a weighted-average period of approximately 1.7 years.
97
Long-Term Incentive Plan
The Company maintains a long-term incentive program (the “LTI Plan”). The LTI Plan currently consists of a two-year performance-based long-term incentive plan (the “2015-2016 LTIP”) and a three-year performance-based long-term incentive plan (the “2016-2018 LTIP”) that provide for a combination of equity grants and performance awards that can be earned over the respective performance period. Participants in the LTI Plans include the Company’s executive officers, including the Chief Executive Officer, and certain other key executives.
The Compensation Committee administers the LTI Plans and is responsible for, among other items, establishing the target values of awards to participants and selecting the specific performance factors for such awards. The Compensation Committee determines the specific payout to the participants. Such awards may be paid in cash and/or unrestricted shares of the Company’s common stock at the discretion of the Compensation Committee, provided that any such stock-based awards shall be issued pursuant to and be subject to the terms and conditions of the Amended and Restated 2002 Long-Term Incentive and Stock Award Plan, as in effect and as amended from time to time.
Upon the adoption of the 2015-2016 LTIP, the Compensation Committee granted an initial award to each participant in the form of equity-based instruments (restricted stock or restricted share units), for a portion of the individual target awards (the “Initial Equity Grants”). These Initial Equity Grants are subject to time vesting requirements, and a portion are also subject to the achievement of minimum performance goals. The 2015-2016 LTIP awards contain an additional year of time-based vesting. The Initial Equity Grants are expensed over the respective vesting periods on a straight-line basis. The payment of the actual awards earned at the end of the applicable performance period, if any, will be reduced by the value of the Initial Equity Grants.
Upon adoption of the 2016-2018 LTIP, the Compensation Committee granted performance units to each participant, the achievement of which is dependent upon a defined calculation of relative total shareholder return over the period from July 1, 2015 to June 30, 2018 (the “TSR Grant”). The grant date fair value for these awards was separately estimated based on a Monte Carlo simulation that calculated the likelihood of goal attainment. Each performance unit translates into one unit of common stock. The TSR grant represents half of each participant’s target award. The other half of the 2016-2018 LTIP is based on the Company’s achievement of specified net sales growth targets over this three-year period and, if achieved, may be paid in cash and/or unrestricted shares of the Company’s common stock at the discretion of the Compensation Committee.
In October 2015, although the target values previously set under the LTI Plan covering 2014 and 2015 fiscal years (the “2014-2015 LTIP”) were fully achieved, the Compensation Committee exercised its discretion to reduce the awards due to the challenges faced by the Company in connection with the nut butter voluntary recall during fiscal year 2015. After deducting the value of the Initial Equity Grants, the reduced awards to participants related to the 2014-2015 LTIP totaled $4,400 (which were settled by the issuance of 82 unrestricted shares of the Company’s common stock in October 2015).
The Company has recorded expense (in addition to the stock based compensation expense associated with the Initial Equity Grants and the TSR Grant) of $4,967 and $9,495, for the fiscal years ended June 30, 2015 and 2014, respectively, and a reversal of expense of $2,037 for the fiscal year ended June 30, 2016, related to the LTI plans.
98
14. INVESTMENTS AND JOINT VENTURES
Equity method investments
In October 2009, the Company formed a joint venture, Hutchison Hain Organic Holdings Limited (“HHO”), with Hutchison China Meditech Ltd. (“Chi-Med”), a majority-owned subsidiary of CK Hutchison Holdings Limited, to market and distribute certain of the Company’s brands in Hong Kong, China and other surrounding markets. Voting control of the joint venture is shared equally between the Company and Chi-Med, although, in the event of a deadlock, Chi-Med has the ability to cast the deciding vote, and therefore, the investment is being accounted for under the equity method of accounting. At June 30, 2016 and June 30, 2015, the carrying value of the Company’s 50.0% investment in and advances to HHO were $1,729 and $1,109, respectively, and are included in the Consolidated Balance Sheet as a component of “Investments and joint ventures.”
On October 27, 2015, the Company acquired a 14.9% interest in Chop’t Creative Salad Company LLC (“Chop’t”). Chop’t develops and operates fast-casual, fresh salad restaurants in the Northeast and Mid-Atlantic United States. Chop’t markets and sells certain of the Company’s branded products and provides consumer insight and feedback. The investment is being accounted for as an equity method investment due to the Company’s representation on the Board of Directors, and its carrying value of $17,448 is included in the Consolidated Balance Sheet as a component of “Investments and joint ventures” at June 30, 2016. The Company’s current ownership percentage may be diluted in the future to 12.1%, pending the distribution of additional ownership interests.
Available-For-Sale Securities
The Company has a less than 1% equity ownership interest in Yeo Hiap Seng Limited (“YHS”), a Singapore-based natural food and beverage company listed on the Singapore Exchange, which is accounted for as an available-for-sale security. The Company sold 2,037 of its YHS shares during the fiscal year ended June 30, 2015, which resulted in a pre-tax gain of $311 on the sales, and is recognized as a component of “Other (income)/expense, net.” No shares were sold during the fiscal year ended June 30, 2016. The remaining shares held at June 30, 2016 totaled 1,035. The fair value of these shares held was $1,067 (cost basis of $1,291) at June 30, 2016 and $1,196 (cost basis of $1,291) at June 30, 2015 and is included in “Investments and joint ventures,” with the related unrealized gain or loss, net of tax, included in “Accumulated other comprehensive loss” in the Consolidated Balance Sheet.
The company concluded that the decline in its YHS investment below its cost basis is temporary and, accordingly, has not recognized a loss in the Consolidated Statements of Operations. In making this determination, the company considered its intent and ability to hold the investment until the cost is recovered, the financial condition and near-term prospects of YHS, the magnitude of the loss compared to the investment’s cost, and publicly available information about the industry and geographic region in which YHS operates.
99
15. FINANCIAL INSTRUMENTS MEASURED AT FAIR VALUE
The Company’s financial assets and liabilities measured at fair value are required to be grouped in one of three levels. The levels prioritize the inputs used to measure the fair value of the assets or liabilities. These levels are:
• | Level 1 – Unadjusted quoted prices in active markets that are accessible at the measurement date for identical, unrestricted assets or liabilities; |
• | Level 2 – Quoted prices in markets that are not active, or inputs which are observable, either directly or indirectly, for substantially the full term of the asset or liability; and |
• | Level 3 – Prices or valuation techniques that require inputs that are both significant to the fair value measurement and unobservable (i.e., supported by little or no market activity). |
The following table presents by level within the fair value hierarchy assets and liabilities measured at fair value on a recurring basis as of June 30, 2016:
Total | Quoted prices in active markets (Level 1) | Significant other observable inputs (Level 2) | Significant unobservable inputs (Level 3) | ||||||||||||
Assets: | |||||||||||||||
Cash equivalents | $ | 20,706 | $ | 20,706 | $ | — | $ | — | |||||||
Forward foreign currency contracts | 531 | — | 531 | — | |||||||||||
Available for sale securities | 1,067 | 1,067 | — | — | |||||||||||
$ | 22,304 | $ | 21,773 | $ | 531 | $ | — | ||||||||
Liabilities: | |||||||||||||||
Contingent consideration, current | $ | 3,553 | $ | — | $ | — | $ | 3,553 | |||||||
Total | $ | 3,553 | $ | — | $ | — | $ | 3,553 | |||||||
The following table presents by level within the fair value hierarchy assets and liabilities measured at fair value on a recurring basis as of June 30, 2015 (as revised):
Total | Quoted prices in active markets (Level 1) | Significant other observable inputs (Level 2) | Significant unobservable inputs (Level 3) | ||||||||||||
Assets: | |||||||||||||||
Cash equivalents | $ | 45,101 | $ | 45,101 | $ | — | $ | — | |||||||
Forward foreign currency contracts | 1,590 | — | 1,590 | — | |||||||||||
Available for sale securities | 1,196 | 1,196 | — | — | |||||||||||
$ | 47,887 | $ | 46,297 | $ | 1,590 | $ | — | ||||||||
Liabilities: | |||||||||||||||
Forward foreign currency contracts | $ | 274 | $ | — | $ | 274 | $ | — | |||||||
Contingent consideration, noncurrent | 1,636 | — | — | 1,636 | |||||||||||
Total | $ | 1,910 | $ | — | $ | 274 | $ | 1,636 | |||||||
Available for sale securities consist of the Company’s investment in YHS (see Note 14, Investments and Joint Ventures). Fair value is measured using the market approach based on quoted prices. The Company utilizes the income approach to measure fair value for its foreign currency forward contracts. The income approach uses pricing models that rely on market observable inputs such as yield curves, currency exchange rates and forward prices.
The Company estimates the original fair value of the contingent consideration as the present value of the expected contingent payments, determined using the weighted probabilities of the possible payments. The Company reassesses the fair value of contingent payments on a periodic basis. Although the Company believes its estimates and assumptions are reasonable, different assumptions, including those regarding the operating results of the respective businesses, or changes in the future may result in different estimated amounts.
100
In connection with the acquisitions of Belvedere in February 2015 and Cully & Sully in April 2012, payment of a portion of the respective purchase prices are contingent upon the achievement of certain operating results. Contingent consideration of up to a maximum of C$4,000 related to the Belvedere acquisition was payable based on the achievement of specified operating results during the two consecutive one-year periods following the closing date. In both the fourth quarter of fiscal 2016 and 2017, the Company paid C$2,000 in each quarter in settlement of the Belvedere contingent consideration obligation. During the fiscal year ended June 30, 2015, $5,477 was paid to the sellers in settlement of the contingent consideration obligation related to the Cully & Sully acquisition.
Additionally, in connection with the acquisition of Orchard House during fiscal 2016, contingent consideration of up to £3,000 was potentially payable to the sellers based on the outcome of a review by the CMA in the United Kingdom. As a result of this review, the Company agreed to divest certain portions of its own-label juice business in the fourth quarter of fiscal 2016, and on September 15, 2016, the Company settled the contingent consideration related to this acquisition for £1,500.
The following table summarizes the Level 3 activity:
Fiscal Year ended June 30, | |||||||
2016 | 2015 (Revised) | ||||||
Balance at beginning of year | $ | 1,636 | $ | 6,230 | |||
Fair value of initial contingent consideration | 2,225 | 1,603 | |||||
Contingent consideration adjustments | 1,511 | (253 | ) | ||||
Contingent consideration paid | (1,547 | ) | (5,477 | ) | |||
Translation adjustment | (272 | ) | (467 | ) | |||
Balance at end of year | $ | 3,553 | $ | 1,636 | |||
There were no transfers of financial instruments between the three levels of fair value hierarchy during the fiscal years ended June 30, 2016 or 2015.
The carrying amount of cash and cash equivalents, accounts receivable, net, accounts payable and certain accrued expenses and other current liabilities approximate fair value due to the short-term maturities of these financial instruments. The Company’s debt approximates fair value due to the debt bearing fluctuating market interest rates (See Note 10, Debt and Borrowings).
Derivative Instruments
The Company primarily has exposure to changes in foreign currency exchange rates relating to certain anticipated cash flows from its international operations. To reduce that risk, the Company may enter into certain derivative financial instruments, when available on a cost-effective basis, to manage such risk. Derivative financial instruments are not used for speculative purposes.
The Company utilizes foreign currency contracts to hedge forecasted transactions, including intercompany transactions, on certain foreign currencies and designates these derivative instruments as foreign currency cash flow hedges when appropriate. The Company also occasionally enters into fair value hedges to mitigate its foreign currency risk related to certain firm commitments. The notional and fair value amounts of the Company’s foreign exchange derivative contracts outstanding at June 30, 2016 were $6,000 and $531 of net assets, respectively. There were $47,202 of notional amount and $1,316 of net liabilities of foreign exchange derivative contracts outstanding at June 30, 2015. The fair value of these derivatives is included in prepaid expenses and other current assets and accrued expenses and other current liabilities in the Consolidated Balance Sheet. For these derivatives, which qualify as hedges of probable forecasted cash flows, the effective portion of changes in fair value is temporarily reported in accumulated other comprehensive income and recognized in earnings when the hedged item affects earnings. These foreign exchange contracts have maturities over the next five months.
The Company assesses effectiveness at the inception of the hedge and on a quarterly basis. These assessments determine whether derivatives designated as qualifying hedges continue to be highly effective in offsetting changes in the cash flows of hedged items. Any ineffective portion of change in fair value is not deferred in accumulated other comprehensive income and is included in current period results. For the fiscal years ended June 30, 2016 and 2015, the impact of hedge ineffectiveness on earnings was not significant. The Company will discontinue cash flow hedge accounting when the forecasted transaction is no longer probable of occurring on the originally forecasted date or when the hedge is no longer effective. There were no discontinued foreign exchange hedges for the fiscal years ended June 30, 2016 and 2015.
101
16. COMMITMENTS AND CONTINGENCIES
Lease commitments and rent expense
The Company leases office, manufacturing and warehouse space. These leases provide for additional payments of real estate taxes and other operating expenses over a base period amount.
The aggregate minimum future lease payments for these operating leases at June 30, 2016, are as follows:
Fiscal Year | |||
2017 | $ | 19,163 | |
2018 | 15,907 | ||
2019 | 13,648 | ||
2020 | 10,400 | ||
2021 | 7,496 | ||
Thereafter | 40,572 | ||
$ | 107,186 | ||
Rent expense charged to operations for the fiscal years ended June 30, 2016, 2015 and 2014 was $28,097, $27,028 and $20,567, respectively.
Off Balance Sheet Arrangements
At June 30, 2016, we did not have any off-balance sheet arrangements as defined in Item 303(a)(4) of Regulation S-K that have had, or are likely to have, a material current or future effect on our consolidated financial statements.
Legal Proceedings
Securities Class Actions Filed in Federal Court
On August 17, 2016, three securities class action complaints were filed in the Eastern District of New York against the Company alleging violations of Sections 10(b) and 20(a) of the Securities Exchange Act of 1934. The three complaints are: (1) Flora v. The Hain Celestial Group, Inc., et al., (the “Flora Complaint”); (2) Lynn v. the Hain Celestial Group, Inc., et al. (the “Lynn Complaint”); and (3) Spadola v. The Hain Celestial Group, Inc., et al. (the “Spadola Complaint” and, together with the Flora and Lynn Complaints, the “Securities Complaints”). The Securities Complaints allege that the Company and certain of its officers made materially false and misleading statements in press releases and SEC filings regarding the Company’s business, prospects and financial results. The Securities Complaints were brought on behalf of all persons who purchased or otherwise acquired Hain securities between November 5, 2015 and August 15, 2016. On October 17, 2016, six potential plaintiffs and their respective law firms moved to serve as lead plaintiff and counsel. On June 5, 2017, the Court issued an order for consolidation, appointment of Co-Lead Plaintiffs and approval of selection of co-lead counsel. Pursuant to this order, the Securities Complaints were consolidated under the caption In re The Hain Celestial Group, Inc. Securities Litigation, (the “Consolidated Securities Action”) and Rosewood Funeral Home and Salamon Gimpel were appointed as Co-Lead Plaintiffs. On June 21, 2017, the Company received notice that plaintiff Spadola voluntarily dismissed his claims without prejudice to his ability to participate in the Consolidated Securities Action as an absent class member.
Stockholder Derivative Complaints Filed in State Court
On September 16, 2016, a stockholder derivative complaint, Paperny v. Heyer, et al. (the “Paperny Complaint”), was filed in New York State Supreme Court in Nassau County against the Board of Directors and certain officers of the Company alleging breach of fiduciary duty, unjust enrichment, lack of oversight and corporate waste. On December 2, 2016 and December 29, 2016, two additional stockholder derivative complaints were filed in New York State Supreme Court in Nassau County against the Board of Directors and certain officers under the captions Scarola v. Simon (the “Scarola Complaint”) and Shakir v. Simon (the “Shakir Complaint” and, together with the Paperny Complaint and the Scarola Complaint, the “Derivative Complaints”), respectively. Both the Scarola Complaint and the Shakir Complaint allege breach of fiduciary duty, lack of oversight and unjust enrichment.
102
On February 16, 2017, the parties for the Derivative Complaints entered into a stipulation consolidating the matters under the caption In re The Hain Celestial Group (the “Consolidated Derivative Action”) in New York State Supreme Court in Nassau County, and the parties agreed to stay the Consolidated Derivative Action until November 2, 2017.
Additional Stockholder Class Action and Derivative Complaints Filed in Federal Court
On April 19, 2017 and April 26, 2017, two class action and stockholder derivative complaints were filed in the Eastern District of New York against the Board of Directors and certain officers of the Company under the captions Silva v. Simon, et al. (the “Silva Complaint”) and Barnes v. Simon, et al. (the “Barnes Complaint”), respectively. Both the Silva Complaint and the Barnes Complaint allege violation of securities law, breach of fiduciary duty, waste of corporate assets and unjust enrichment.
On May 23, 2017, an additional stockholder filed a complaint under seal in the Eastern District of New York against the Board of Directors and certain officers of the Company. The complaint alleges that the Company’s directors and certain officers made materially false and misleading statements in press releases and SEC filings regarding the Company’s business, prospects and financial results. The complaint also alleges that the Company violated its by-laws and Delaware law by failing to hold an Annual Stockholders Meeting and includes claims for breach of fiduciary duty, unjust enrichment and corporate waste.
SEC Investigation
As previously disclosed, the Company voluntarily contacted the SEC in August 2016 to advise it of the Company’s delay in the filing of its periodic reports and the performance of the independent review conducted by the Audit Committee. The Company has continued to provide information to the SEC on an ongoing basis, including, among other things, the results of the independent review of the Audit Committee as well as other information pertaining to its internal accounting review relating to revenue recognition. On January 31, 2017, the SEC issued a subpoena to the Company seeking documents relevant to its investigation. The Company is in the process of responding to the SEC’s requests for information and intends to cooperate fully with the SEC.
Other
On May 11, 2011, Rosminah Brown, on behalf of herself and all other similarly situated individuals, as well as a non-profit organization, filed a putative class action in the Superior Court of California, Alameda County against the Company. The complaint alleged that the labels of certain Avalon Organics® brand and JASON® brand personal care products used prior to the Company’s implementation of ANSI/NSF-305 certification in mid-2011 violated certain California statutes. Defendants removed the case to the United States District Court for the Northern District of California. The action was consolidated with a subsequently-filed putative class action containing substantially identical allegations concerning only the JASON® brand personal care products. The consolidated actions sought an award for damages, injunctive relief, costs, expenses and attorney’s fees. In July 2015, the Company reached an agreement in principle with the plaintiffs to settle the class action for $7,500 in addition to the distribution of consumer coupons up to a value of $2,000. In connection with the proposed settlement, the Company recorded a charge of $5,725 in the fourth quarter of fiscal 2015 (a separate charge of $1,975 was recorded in prior years). The parties finalized the settlement and the court granted preliminary approval in October 2015. The court granted final approval of the settlement and issued a judgment dismissing the case on February 17, 2016.
In addition to the litigation described above, the Company is and may be a defendant in lawsuits from time to time in the normal course of business. While the results of litigation and claims cannot be predicted with certainty, the Company believes the reasonably possible losses of such matters, individually and in the aggregate, are not material. Additionally, the Company believes the probable final outcome of such matters will not have a material adverse effect on the Company’s consolidated results of operations, financial position, cash flows or liquidity.
17. DEFINED CONTRIBUTION PLANS
We have a 401(k) Employee Retirement Plan (the “Plan”) to provide retirement benefits for eligible employees. All full-time employees of the Company and its wholly-owned domestic subsidiaries are eligible to participate upon completion of 30 days of service. On an annual basis, we may, in our sole discretion, make certain matching contributions. For the fiscal years ended June 30, 2016, 2015 and 2014, we made contributions to the Plan of $1,236, $1,090 and $586, respectively.
In addition, certain of our international subsidiaries maintain separate defined contribution plans for their employees, however the amounts are not significant to the consolidated financial statements.
103
18. SEGMENT INFORMATION
We principally manage our business by geography in seven operating segments: the United States, United Kingdom, Tilda, Hain Pure Protein Corporation, Empire Kosher Poultry, Canada and Europe. In addition, we have four reportable segments: United States, United Kingdom, Hain Pure Protein and Rest of World. We have aggregated (based on economic similarities, the nature of their products, end-user markets and methods of distribution) the operating segments of the United Kingdom and Tilda into the United Kingdom reportable segment and the operating segments of Hain Pure Protein Corporation and Empire Kosher Poultry into the Hain Pure Protein reportable segment. Additionally, Canada and Europe do not currently meet the quantitative thresholds for segment reporting and are therefore combined and reported as “Rest of World.”
Effective July 1, 2016, changes in the Company’s internal management and reporting structure resulted in a change in operating segments. Certain brands previously included within the United States operating segment were moved to a new operating segment called Cultivate. As a result, the Company will be managed in eight operating segments: the United States (excluding Cultivate), United Kingdom, Tilda, HPPC, Empire, Canada, Europe and Cultivate. The United States, excluding Cultivate, will be its own reportable segment. Cultivate will be combined with Canada and Europe and reported within the “Rest of World” reportable segment.
Net sales and operating income are the primary measures used by the Company’s Chief Operating Decision Maker (“CODM”) to evaluate segment operating performance and to decide how to allocate resources to segments. The CODM is the Company’s Chief Executive Officer. Expenses related to certain centralized administration functions that are not specifically related to an operating segment are included in “Corporate and Other.” Corporate and other expenses are comprised mainly of the compensation and related expenses of certain of the Company’s senior executive officers and other selected employees who perform duties related to the entire enterprise, as well as expenses for certain professional fees, facilities, and other items which benefit the Company as a whole. Additionally, acquisition related expenses, restructuring, impairment and integration charges are included in “Corporate and Other.” Expenses that are managed centrally but can be attributed to a segment, such as employee benefits and certain facility costs, are allocated based on reasonable allocation methods. Assets are reviewed by the CODM on a consolidated basis and therefore are not reported by operating segment.
The following tables set forth financial information about each of the Company’s reportable segments. Transactions between reportable segments were insignificant for all periods presented.
Fiscal Years ended June 30, | ||||||||||||
2016 | 2015 (Revised) | 2014 (Revised) | ||||||||||
Net Sales: (1) | ||||||||||||
United States | $ | 1,321,547 | $ | 1,325,996 | $ | 1,247,113 | ||||||
United Kingdom | 774,877 | 722,830 | 628,828 | |||||||||
Hain Pure Protein | 492,510 | 337,197 | — | |||||||||
Rest of World | 296,440 | 223,590 | 231,881 | |||||||||
$ | 2,885,374 | $ | 2,609,613 | $ | 2,107,822 | |||||||
Operating Income: | ||||||||||||
United States | $ | 209,099 | $ | 188,054 | $ | 201,063 | ||||||
United Kingdom | 56,000 | 44,985 | 49,509 | |||||||||
Hain Pure Protein | 31,558 | 28,685 | — | |||||||||
Rest of World | 22,280 | 15,210 | 16,749 | |||||||||
$ | 318,937 | $ | 276,934 | $ | 267,321 | |||||||
Corporate and Other (2) | (168,577 | ) | (43,072 | ) | (50,575 | ) | ||||||
$ | 150,360 | $ | 233,862 | $ | 216,746 | |||||||
(1) | One of our customers accounted for approximately 10%, 11% and 13% of our consolidated net sales for the fiscal years ended June 30, 2016, 2015 and 2014, respectively, which were primarily related to the United States segment. A second customer accounted for approximately 10%, 10%, and 11% of our consolidated net sales for the fiscal years ended June 30, 2016, 2015 and 2014, respectively, which were primarily related to the United States and United Kingdom segments. |
104
(2) | Corporate and Other includes $15,541, $8,248 and $7,088 of acquisition related expenses, restructuring and integration charges for the fiscal years ended June 30, 2016, 2015 and 2014, respectively. Corporate and Other also includes goodwill impairment charges of $84,548 for the fiscal year ended June 30, 2016 related to the United Kingdom segment and an impairment charge of $39,724 ($20,932 related to the United Kingdom segment and $18,792 related to the United States segment) related to certain of the Company’s tradenames. Lastly, a non-cash impairment charge of $6,399 for the fiscal year ended June 30, 2014 related to indefinite-lived intangible assets (tradenames) in the the United Kingdom segment is included in Corporate and Other. |
The Company’s net sales by product category are as follows:
Fiscal Year ended June 30, | ||||||||||||
2016 | 2015 (Revised) | 2014 (Revised) | ||||||||||
Grocery | $ | 1,800,640 | $ | 1,724,675 | $ | 1,634,070 | ||||||
Poultry/Protein | 492,510 | 337,197 | — | |||||||||
Snacks | 307,797 | 291,719 | 242,557 | |||||||||
Personal Care | 171,669 | 135,627 | 114,643 | |||||||||
Tea | 112,758 | 120,395 | 116,552 | |||||||||
Total | $ | 2,885,374 | $ | 2,609,613 | $ | 2,107,822 | ||||||
The Company’s net sales by geographic region, which are generally based on the location of the Company’s subsidiary, are as follows:
Fiscal Year ended June 30, | ||||||||||||
2016 | 2015 (Revised) | 2014 (Revised) | ||||||||||
United States | $ | 1,729,751 | $ | 1,582,553 | $ | 1,171,936 | ||||||
United Kingdom | 859,183 | 803,470 | 704,005 | |||||||||
All Other | 296,440 | 223,590 | 231,881 | |||||||||
Total | $ | 2,885,374 | $ | 2,609,613 | $ | 2,107,822 | ||||||
The Company’s long-lived assets, which primarily represent net property, plant and equipment, by geographic region are as follows:
June 30, 2016 | June 30, 2015 (Revised) | |||||||
United States | $ | 193,192 | $ | 156,195 | ||||
United Kingdom | 196,271 | 198,012 | ||||||
All Other | 53,260 | 34,336 | ||||||
Total | $ | 442,723 | $ | 388,543 | ||||
105
19. QUARTERLY FINANCIAL DATA (UNAUDITED)
A summary of the Company’s consolidated quarterly results of operations is as follows. The sum of the net income per share from continuing operations for each of the four quarters may not equal the net income per share for the full year, as presented, due to rounding. The Quarterly Financial Data reflects revisions to prior year balances due to the immaterial error corrections discussed in Note 1, Description of Business and Basis of Presentation, and Note 2, Correction of Immaterial Errors to Prior Period Financial Statements, in the Consolidated Financial Statements. See below for a reconciliation of the Company’s fiscal 2016 and 2015 quarterly consolidated statements of income from the previously reported amounts to the revised amounts.
Three Months Ended | |||||||||||||||
June 30, 2016 | March 31, 2016 | December 31, 2015 | September 30, 2015 | ||||||||||||
Net sales | $ | 737,547 | $ | 736,663 | $ | 743,437 | $ | 667,727 | |||||||
Gross profit | $ | 150,081 | $ | 159,908 | $ | 166,261 | $ | 137,881 | |||||||
Operating income (loss) | $ | (65,138 | ) | $ | 71,148 | $ | 90,078 | $ | 54,272 | ||||||
Income before income taxes and equity in earnings of equity-method investees | $ | (77,572 | ) | $ | 72,863 | $ | 80,713 | $ | 42,404 | ||||||
Net income (loss) | $ | (88,597 | ) | $ | 48,788 | $ | 58,080 | $ | 29,158 | ||||||
Net income (loss) per common share: | |||||||||||||||
Basic | $ | (0.86 | ) | $ | 0.47 | $ | 0.56 | $ | 0.28 | ||||||
Diluted | $ | (0.86 | ) | $ | 0.47 | $ | 0.56 | $ | 0.28 | ||||||
The quarter ended June 30, 2016 was impacted by goodwill impairment charges recorded of $84,548 in the United Kingdom, impairment charges of $39,724 ($30,772 net of tax) related to indefinite-lived intangible assets (tradenames), as well as a $3,476 ($2,855 net of tax) impairment charge related to long-lived assets associated with the divestiture of certain portions of our own-label juice business in connection with our acquisition of Orchard House in the United Kingdom.
The quarter ended March 31, 2016 was impacted by a $9,013 ($6,231 net of tax) gain on fire insurance recovery as a result of fixed assets purchased with insurance proceeds that exceeded the net book value of fixed assets destroyed in the fire that occurred at our Tilda rice milling facility in the second quarter of fiscal 2015.
Three Months Ended | |||||||||||||||
June 30, 2015 | March 31, 2015 | December 31, 2014 | September 30, 2014 | ||||||||||||
Net sales | $ | 680,565 | $ | 652,351 | $ | 679,759 | $ | 596,938 | |||||||
Gross profit | $ | 155,725 | $ | 149,609 | $ | 150,359 | $ | 107,162 | |||||||
Operating income | $ | 77,339 | $ | 68,154 | $ | 67,997 | $ | 20,372 | |||||||
Income before income taxes and equity in earnings of equity-method investees | $ | 76,265 | $ | 59,514 | $ | 59,183 | $ | 17,907 | |||||||
Net income | $ | 72,152 | $ | 38,001 | $ | 39,653 | $ | 15,155 | |||||||
Net income per common share: | |||||||||||||||
Basic | $ | 0.70 | $ | 0.37 | $ | 0.39 | $ | 0.15 | |||||||
Diluted | $ | 0.69 | $ | 0.37 | $ | 0.38 | $ | 0.15 | |||||||
The quarter ended June 30, 2015 was impacted by a $20,670 (after-tax) gain related to a tax restructuring, offset by $5,725 ($3,550 net of tax) for charges related to a legal settlement and $1,798 ($1,115 net of tax) for charges pertaining to the voluntary nut butter recall.
The quarters ended March 31, 2015, December 31, 2014, and September 30, 2014 were impacted by $742 ($460 net of tax), $7,267 ($4,506 after-tax) and $24,844 ($15,403 after-tax), respectively, for charges pertaining to the voluntary nut butter recall.
The quarter ended September 30, 2014 was impacted by a $6,747 gain ($4,183 after-tax) related to a pre-existing ownership interests in HPPC.
106
REVISED QUARTERLY CONSOLIDATED STATEMENTS OF INCOME
The following tables reconcile the Company’s fiscal 2016 and 2015 quarterly consolidated statements of income from the previously reported amounts to the revised amounts:
Three Months Ended | |||||||||||||||||||||||||||||||||||
March 31, 2016 | December 31, 2015 | September 30, 2015 | |||||||||||||||||||||||||||||||||
As Reported | Adjustment | As Revised | As Reported | Adjustment | As Revised | As Reported | Adjustment | As Revised | |||||||||||||||||||||||||||
Net sales | $ | 749,862 | $ | (13,199 | ) | $ | 736,663 | $ | 752,589 | $ | (9,152 | ) | $ | 743,437 | $ | 687,188 | $ | (19,461 | ) | $ | 667,727 | ||||||||||||||
Cost of sales | 576,653 | 102 | 576,755 | 575,026 | 2,150 | 577,176 | 535,141 | (5,295 | ) | 529,846 | |||||||||||||||||||||||||
Gross profit | 173,209 | (13,301 | ) | 159,908 | 177,563 | (11,302 | ) | 166,261 | 152,047 | (14,166 | ) | 137,881 | |||||||||||||||||||||||
Selling, general and administrative expenses | 93,915 | (15,025 | ) | 78,890 | 82,607 | (13,626 | ) | 68,981 | 86,254 | (10,704 | ) | 75,550 | |||||||||||||||||||||||
Amortization of acquired intangibles | 4,586 | (33 | ) | 4,553 | 4,736 | (32 | ) | 4,704 | 4,672 | (33 | ) | 4,639 | |||||||||||||||||||||||
Acquisition related expenses, restructuring and integration charges | 5,701 | (384 | ) | 5,317 | 2,498 | — | 2,498 | 3,653 | (233 | ) | 3,420 | ||||||||||||||||||||||||
Operating income | 69,007 | 2,141 | 71,148 | 87,722 | 2,356 | 90,078 | 57,468 | (3,196 | ) | 54,272 | |||||||||||||||||||||||||
Interest and other financing expense, net | 6,920 | — | 6,920 | 6,131 | — | 6,131 | 6,467 | — | 6,467 | ||||||||||||||||||||||||||
Other (income)/ expense, net | 378 | — | 378 | 3,234 | — | 3,234 | 5,401 | — | 5,401 | ||||||||||||||||||||||||||
Gain on fire insurance recovery | (9,013 | ) | — | (9,013 | ) | — | — | — | — | — | — | ||||||||||||||||||||||||
Income before income taxes and equity in earnings of equity- method investees | 70,722 | 2,141 | 72,863 | 78,357 | 2,356 | 80,713 | 45,600 | (3,196 | ) | 42,404 | |||||||||||||||||||||||||
Provision for income taxes | 21,576 | 2,338 | 23,914 | 21,379 | 1,223 | 22,602 | 14,382 | (1,052 | ) | 13,330 | |||||||||||||||||||||||||
Equity in net income of equity-method investees | 161 | — | 161 | 31 | — | 31 | (84 | ) | — | (84 | ) | ||||||||||||||||||||||||
Net income | $ | 48,985 | $ | (197 | ) | $ | 48,788 | $ | 56,947 | $ | 1,133 | $ | 58,080 | $ | 31,302 | $ | (2,144 | ) | $ | 29,158 | |||||||||||||||
Net income per common share: | |||||||||||||||||||||||||||||||||||
Basic | $ | 0.47 | $ | — | $ | 0.47 | $ | 0.55 | $ | 0.01 | $ | 0.56 | $ | 0.30 | $ | (0.02 | ) | $ | 0.28 | ||||||||||||||||
Diluted | $ | 0.47 | $ | — | $ | 0.47 | $ | 0.55 | $ | 0.01 | $ | 0.56 | $ | 0.30 | $ | (0.02 | ) | $ | 0.28 | ||||||||||||||||
Weighted average common shares outstanding: | |||||||||||||||||||||||||||||||||||
Basic | 103,265 | 103,265 | 103,265 | 103,017 | 103,017 | 103,017 | 102,807 | 102,807 | 102,807 | ||||||||||||||||||||||||||
Diluted | 104,087 | 104,087 | 104,087 | 104,161 | 104,161 | 104,161 | 104,258 | 104,258 | 104,258 | ||||||||||||||||||||||||||
* Net income/(loss) per common share may not add in certain periods due to rounding
107
Three Months Ended | |||||||||||||||||||||||
June 30, 2015 | March 31, 2015 | ||||||||||||||||||||||
As Reported | Adjustment | As Revised | As Reported | Adjustment | As Revised | ||||||||||||||||||
Net sales | $ | 698,136 | $ | (17,571 | ) | $ | 680,565 | $ | 662,739 | $ | (10,388 | ) | $ | 652,351 | |||||||||
Cost of sales | 530,439 | (5,599 | ) | 524,840 | 504,990 | (2,248 | ) | 502,742 | |||||||||||||||
Gross profit | 167,697 | (11,972 | ) | 155,725 | 157,749 | (8,140 | ) | 149,609 | |||||||||||||||
Selling, general and administrative expenses | 85,904 | (14,567 | ) | 71,337 | 83,068 | (10,558 | ) | 72,510 | |||||||||||||||
Amortization of acquired intangibles | 4,494 | (32 | ) | 4,462 | 4,679 | (32 | ) | 4,647 | |||||||||||||||
Tradename impairment | — | — | — | 5,510 | (5,510 | ) | — | ||||||||||||||||
Acquisition related expenses, restructuring and integration charges | 2,587 | — | 2,587 | 4,298 | — | 4,298 | |||||||||||||||||
Operating income | 74,712 | 2,627 | 77,339 | 60,194 | 7,960 | 68,154 | |||||||||||||||||
Interest and other financing expense, net | 6,420 | — | 6,420 | 6,298 | — | 6,298 | |||||||||||||||||
Other (income)/expense, net | (3,968 | ) | — | (3,968 | ) | 3,886 | — | 3,886 | |||||||||||||||
Gain on sale of business | (1,378 | ) | — | (1,378 | ) | (1,544 | ) | — | (1,544 | ) | |||||||||||||
Income before income taxes and equity in earnings of equity-method investees | 73,638 | 2,627 | 76,265 | 51,554 | 7,960 | 59,514 | |||||||||||||||||
Provision for income taxes | 2,740 | 1,547 | 4,287 | 18,147 | 3,353 | 21,500 | |||||||||||||||||
Equity in net income (loss) of equity-method investees | (174 | ) | — | (174 | ) | 13 | — | 13 | |||||||||||||||
Net income | $ | 71,072 | $ | 1,080 | $ | 72,152 | $ | 33,394 | $ | 4,607 | $ | 38,001 | |||||||||||
Net income per common share: | |||||||||||||||||||||||
Basic | $ | 0.69 | $ | 0.01 | $ | 0.70 | $ | 0.33 | $ | 0.05 | $ | 0.37 | |||||||||||
Diluted | $ | 0.68 | $ | 0.01 | $ | 0.69 | $ | 0.32 | $ | 0.04 | $ | 0.37 | |||||||||||
Weighted average common shares outstanding: | |||||||||||||||||||||||
Basic | 102,610 | 102,610 | 102,610 | 102,252 | 102,252 | 102,252 | |||||||||||||||||
Diluted | 104,005 | 104,005 | 104,005 | 103,796 | 103,796 | 103,796 | |||||||||||||||||
* Net income/(loss) per common share may not add in certain periods due to rounding
108
Three Months Ended | |||||||||||||||||||||||
December 31, 2014 | September 31, 2014 | ||||||||||||||||||||||
As Reported | Adjustment | As Revised | As Reported | Adjustment | As Revised | ||||||||||||||||||
Net sales | $ | 696,383 | $ | (16,624 | ) | $ | 679,759 | $ | 631,257 | $ | (34,319 | ) | $ | 596,938 | |||||||||
Cost of sales | 529,056 | 344 | 529,400 | 505,413 | (15,637 | ) | 489,776 | ||||||||||||||||
Gross profit | 167,327 | (16,968 | ) | 150,359 | 125,844 | (18,682 | ) | 107,162 | |||||||||||||||
Selling, general and administrative expenses | 88,621 | (10,377 | ) | 78,244 | 90,924 | (10,189 | ) | 80,735 | |||||||||||||||
Amortization of acquired intangibles | 4,303 | (36 | ) | 4,267 | 4,509 | (38 | ) | 4,471 | |||||||||||||||
Tradename impairment | — | — | — | — | — | — | |||||||||||||||||
Acquisition related expenses, restructuring and integration charges | 391 | (540 | ) | (149 | ) | 1,584 | — | 1,584 | |||||||||||||||
Operating income | 74,012 | (6,015 | ) | 67,997 | 28,827 | (8,455 | ) | 20,372 | |||||||||||||||
Interest and other financing expense, net | 6,542 | — | 6,542 | 6,762 | (49 | ) | 6,713 | ||||||||||||||||
Other expense, net | 2,272 | — | 2,272 | 2,499 | — | 2,499 | |||||||||||||||||
Gain on sale of business | — | — | — | (5,334 | ) | (1,413 | ) | (6,747 | ) | ||||||||||||||
Income before income taxes and equity in earnings of equity-method investees | 65,198 | (6,015 | ) | 59,183 | 24,900 | (6,993 | ) | 17,907 | |||||||||||||||
Provision for income taxes | 20,931 | (1,093 | ) | 19,838 | 6,065 | (3,154 | ) | 2,911 | |||||||||||||||
Equity in net loss of equity-method investees | (308 | ) | — | (308 | ) | (20 | ) | (139 | ) | (159 | ) | ||||||||||||
Net income | $ | 44,575 | $ | (4,922 | ) | $ | 39,653 | $ | 18,855 | $ | (3,700 | ) | $ | 15,155 | |||||||||
Net income per common share: | |||||||||||||||||||||||
Basic | $ | 0.44 | $ | (0.05 | ) | $ | 0.39 | $ | 0.19 | $ | (0.04 | ) | $ | 0.15 | |||||||||
Diluted | $ | 0.43 | $ | (0.05 | ) | $ | 0.38 | $ | 0.18 | $ | (0.04 | ) | $ | 0.15 | |||||||||
Weighted average common shares outstanding: | |||||||||||||||||||||||
Basic | 101,267 | 101,267 | 101,267 | 100,682 | 100,682 | 100,682 | |||||||||||||||||
Diluted | 103,226 | 103,226 | 103,226 | 102,656 | 102,656 | 102,656 | |||||||||||||||||
* Net income/(loss) per common share may not add in certain periods due to rounding
Item 9. Changes in and Disagreements with Accountants on Accounting and Financial Disclosure
None.
Item 9A. Controls and Procedures
Evaluation of Disclosure Controls and Procedures
Our disclosure controls and procedures (as defined in Rules 13a-15(e) and 15d-15(e) under the Securities Exchange Act of 1934, as amended (the “Exchange Act”)) are designed to ensure that information required to be disclosed in the reports that we file or submit under the Exchange Act is recorded, processed, summarized and reported within the time periods specified in the rules and forms of the Securities and Exchange Commission and to ensure that information required to be disclosed is accumulated and communicated to management, including our principal executive and financial officers, to allow timely decisions regarding disclosure. Any controls and procedures, no matter how well designed and operated, can provide only reasonable assurance of achieving the desired control objectives. The Chief Executive Officer (“CEO”) and the Chief Financial Officer (“CFO”), with assistance from other members of management, have reviewed the effectiveness of our disclosure controls and procedures as of June 30, 2016 and, based on their evaluation, have concluded that the disclosure controls and procedures were not effective as of such date due to material weaknesses in internal control over financial reporting described below.
While the material weaknesses described below did not result in a material misstatement to the Company’s consolidated financial statements for any period through and including the fiscal year ended June 30, 2015, or the unaudited condensed consolidated financial statements for the first three quarterly periods of fiscal year 2016, it did represent a material weakness as of June 30,
109
2016, since there existed a reasonable possibility that a material misstatement of the Company’s annual or interim financial statements would not be prevented or detected on a timely basis. Notwithstanding the identified material weaknesses, management, including our CEO and CFO, believes the consolidated financial statements included in this Form 10-K fairly represent in all material respects our financial condition, results of operations and cash flows at and for the periods presented in accordance with U.S. GAAP. In addition, as discussed below, the Company has taken steps to remediate the material weaknesses.
Management’s Report on Internal Control over Financial Reporting
The Company’s management is responsible for establishing and maintaining adequate internal control over financial reporting, as such term is defined in Rule 13a-15(f) of the Exchange Act. Internal control over financial reporting is a process designed to provide reasonable assurance regarding the reliability of financial reporting and the preparation of financial statements for external purposes in accordance with generally accepted accounting principles.
The Company’s internal control over financial reporting includes those policies and procedures that (1) pertain to the maintenance of records that, in reasonable detail, accurately and fairly reflect the transactions and dispositions of the assets of the Company; (2) provide reasonable assurance that transactions are recorded as necessary to permit preparation of financial statements in accordance with generally accepted accounting principles, and that receipts and expenditures of the Company are being made only in accordance with authorizations of the Company’s management and directors; and (3) provide reasonable assurance regarding prevention or timely detection of unauthorized acquisition, use or disposition of assets of the Company that could have a material effect on the financial statements.
Because of its inherent limitations, internal control over financial reporting may not prevent or detect misstatements. Also, projections of any evaluation of effectiveness to future periods are subject to the risk that controls may become inadequate because of changes in conditions, or that the degree of compliance with the policies or procedures may deteriorate.
Under the supervision and with the participation of our management, including the CEO and CFO, we conducted an evaluation of the effectiveness of our internal control over financial reporting as of June 30, 2016. In making this assessment, management used the criteria established in Internal Control-Integrated Framework (2013) issued by the Committee of Sponsoring Organizations of the Treadway Commission (“COSO”). Based on this assessment, management, including our CEO and CFO, has concluded that our internal control over financial reporting was not effective as of June 30, 2016 due to material weaknesses in our internal control over financial reporting, which are disclosed below.
A material weakness is a deficiency, or a combination of deficiencies, in internal control over financial reporting, such that there is a reasonable possibility that a material misstatement of the Company’s annual or interim financial statements will not be prevented or detected on a timely basis. In connection with the assessment of our internal control over financial reporting described above, management identified the following deficiencies that constituted individually, or in the aggregate, material weaknesses in our internal control over financial reporting as of June 30, 2016:
• | Ineffective Control Environment - The Company’s control environment did not sufficiently promote effective internal control over financial reporting, which contributed to the other material weakness described below. Principle contributing factors included: (i) an insufficient number of personnel appropriately qualified to perform control design, execution and monitoring activities; (ii) an insufficient number of personnel with an appropriate level of U.S. GAAP knowledge and experience and ongoing training in the application of U.S. GAAP commensurate with our financial reporting requirements; and (iii) in certain instances, insufficient documentation or basis to support accounting estimates. |
• | Revenue Recognition - The Company’s internal controls to identify, accumulate and assess the accounting impact of certain concessions or side agreements on whether the Company’s revenue recognition criteria had been met were not adequately designed or operating effectively. The Company’s controls were not effective to ensure (i) consistent standards in the level of documentation of agreements required to support accurate recording of revenue transactions, and (ii) that such documentation is retained, complete, and independently reviewed to ensure certain terms impacting revenue recognition were accurately reflected in the Company’s books and records. In addition, the Company did not design and maintain effective controls over the timing and classification of trade promotion spending. |
The errors arising from the underlying deficiencies are not material to the financial statements reported in any interim or annual period and therefore did not result in a restatement to previously filed financial statements. These control deficiencies, however, could result in misstatements of the aforementioned accounts and disclosures that would result in a material misstatement to the annual or interim consolidated financial statements that would not be prevented or detected in a timely manner. Accordingly, we have determined that these control deficiencies constitute material weaknesses. These errors resulted in immaterial adjustments to
110
our consolidated financial statements as of and for the years ended June 30, 2015 and 2014, which are discussed in further detail under Note 2, Correction of Immaterial Errors to Prior Period Financial Statements, in this Form 10-K.
The Company acquired Formatio Beratungs- und Beteiligungs GmbH and its subsidiaries (“Mona”) on July 24, 2015 and Orchard House Foods Limited (“Orchard House”) on December 21, 2015. We have excluded Mona and Orchard House from our assessment of and conclusion on the effectiveness of the Company’s internal control over financial reporting as of June 30, 2016. The acquired businesses accounted for 6.5% of our total assets and 8.5% of our total net assets as of June 30, 2016, and 5.1% of our revenues and 13.9% of our net income for the fiscal year then ended.
The effectiveness of the Company’s internal control over financial reporting as of June 30, 2016 has been audited by Ernst & Young LLP, an independent registered public accounting firm, as stated in their report which appears herein.
Remediation of the Material Weaknesses in Internal Control Over Financial Reporting
Management is committed to the planning and implementation of remediation efforts to address the material weaknesses. These remediation efforts, summarized below, which have been implemented or are in process of implementation, are intended to both address the identified material weaknesses and to enhance our overall financial control environment. In this regard, our initiatives include:
Organizational Enhancements - The Company has identified and begun to implement several organizational enhancements as follows: (i) the creation of a new position, Global Revenue Controller, which has been filled and will be responsible for all aspects of the Company's revenue recognition policies, procedures and the proper application of accounting to the Company’s sales arrangements; (ii) the identification and hiring of a new Controller for the Company’s United States segment, which has been filled, who is responsible for all accounting functions in the United States segment; (iii) the establishment of an internal audit function that reports directly to the Audit Committee; (iv) the bifurcation of the General Counsel and Chief Compliance Officer roles in order to have a more dedicated focus on establishing standards and implementing procedures to ensure that the compliance programs throughout the Company are effective and efficient in identifying, preventing, detecting and correcting noncompliance with applicable rules and regulations; and (v) the enhancement of the Company’s organizational structure over all finance functions and an increase of the Company’s accounting personnel with people that have the knowledge, experience, and training in U.S. GAAP to ensure that a formalized process for determining, documenting, communicating, implementing and monitoring controls over the period-end financial close and reporting processes is maintained.
Revenue Practices - The Company has evaluated its revenue practices and has begun implementing improvements in those practices, including: (i) the development of more comprehensive revenue recognition policies and improved procedures to ensure that such policies are understood and consistently applied; (ii) better communication among all functions involved in the sales process (e.g., sales, business unit, legal, accounting, finance); (iii) increased standardization of contract documentation and revenue analyses for individual transactions; and (iv) the development of a more comprehensive review process and monitoring controls over contracts with customers, customer payments and incentives, including corporate review of related accruals and presentation of trade promotions and incentives.
Training Practices - The Company has developed a comprehensive revenue recognition and contract review training program. This training is focused on senior-level management, customer-facing employees as well as finance, sales and marketing personnel.
While this remediation plan is being executed, the Company has also engaged additional external resources to support and supplement the Company’s existing internal resources.
When fully implemented and operational, we believe the measures described above will remediate the material weaknesses we have identified and strengthen our internal control over financial reporting. The material weaknesses in our internal control over financial reporting will not be considered remediated, however, until the remediated controls operate for a sufficient period of time and management has concluded, through testing, that these controls are operating effectively. We are working to have these material weaknesses remediated as soon as possible and significant progress has been made to date. We are committed to continuing to improve our internal control processes and will continue to diligently and vigorously review our financial reporting controls and procedures. As we continue to evaluate and work to improve our internal control over financial reporting, our management may determine to take additional measures.
111
Changes in Internal Control over Financial Reporting
Other than the ongoing remediation efforts described above, there was no change in our internal control over financial reporting that occurred during the fourth fiscal quarter of the period covered by this report that has materially affected, or is reasonably likely to materially affect, our internal control over financial reporting.
Inherent Limitations on Effectiveness of Controls
The Company’s management, including the Company’s CEO and CFO, recognizes that the Company’s disclosure controls and procedures and the Company’s internal control over financial reporting cannot prevent or detect all errors and all fraud. A control system, regardless of how well conceived and operated, can provide only reasonable, not absolute, assurance that the objectives of the control system will be met. These inherent limitations include the following:
• | Judgments in decision-making can be faulty, and control and process breakdowns can occur because of simple errors or mistakes. |
• | Controls can be circumvented by individuals, acting alone or in collusion with each other, or by management override. |
• | The design of any system of controls is based in part on certain assumptions about the likelihood of future events, and there can be no assurance that any design will succeed in achieving its stated goals under all potential future conditions. |
• | Over time, controls may become inadequate because of changes in conditions or deterioration in the degree of compliance with policies or procedures. |
Because of the inherent limitations in all control systems, no evaluation of controls can provide absolute assurance that all control issues and instances of fraud, if any, have been detected.
112
Report of Independent Registered Public Accounting Firm
The Stockholders and Board of Directors of
The Hain Celestial Group, Inc. and Subsidiaries
We have audited The Hain Celestial Group, Inc. and Subsidiaries’ internal control over financial reporting as of June 30, 2016, based on criteria established in Internal Control-Integrated Framework issued by the Committee of Sponsoring Organizations of the Treadway Commission (2013 framework) (the COSO criteria). The Hain Celestial Group, Inc. and Subsidiaries’ management is responsible for maintaining effective internal control over financial reporting, and for its assessment of the effectiveness of internal control over financial reporting included in the accompanying Management’s Report on Internal Control over Financial Reporting. Our responsibility is to express an opinion on the company’s internal control over financial reporting based on our audit.
We conducted our audit in accordance with the standards of the Public Company Accounting Oversight Board (United States). Those standards require that we plan and perform the audit to obtain reasonable assurance about whether effective internal control over financial reporting was maintained in all material respects. Our audit included obtaining an understanding of internal control over financial reporting, assessing the risk that a material weakness exists, testing and evaluating the design and operating effectiveness of internal control based on the assessed risk, and performing such other procedures as we considered necessary in the circumstances. We believe that our audit provides a reasonable basis for our opinion.
A company’s internal control over financial reporting is a process designed to provide reasonable assurance regarding the reliability of financial reporting and the preparation of financial statements for external purposes in accordance with generally accepted accounting principles. A company’s internal control over financial reporting includes those policies and procedures that (1) pertain to the maintenance of records that, in reasonable detail, accurately and fairly reflect the transactions and dispositions of the assets of the company; (2) provide reasonable assurance that transactions are recorded as necessary to permit preparation of financial statements in accordance with generally accepted accounting principles, and that receipts and expenditures of the company are being made only in accordance with authorizations of management and directors of the company; and (3) provide reasonable assurance regarding prevention or timely detection of unauthorized acquisition, use, or disposition of the company’s assets that could have a material effect on the financial statements.
Because of its inherent limitations, internal control over financial reporting may not prevent or detect misstatements. Also, projections of any evaluation of effectiveness to future periods are subject to the risk that controls may become inadequate because of changes in conditions, or that the degree of compliance with the policies or procedures may deteriorate.
As indicated in the accompanying Management’s Report on Internal Control over Financial Reporting, management’s assessment of and conclusion on the effectiveness of internal control over financial reporting did not include the internal controls of Formatio Beratungs- und Beteiligungs GmbH and its subsidiaries (“Mona”), acquired on July 24, 2015, and Orchard House Foods Limited (“Orchard House”), acquired on December 21, 2015, which are included in the fiscal 2016 consolidated financial statements of The Hain Celestial Group, Inc. and Subsidiaries and constituted 6.5 percent of total assets, 8.5 percent of net assets, 5.1 percent of revenues, and 13.9 percent of net income, respectively, for the year then ended. Our audit of internal control over financial reporting of The Hain Celestial Group, Inc. and Subsidiaries also did not include an evaluation of the internal control over financial reporting of Mona and Orchard House.
A material weakness is a deficiency, or combination of deficiencies, in internal control over financial reporting, such that there is a reasonable possibility that a material misstatement of the company’s annual or interim financial statements will not be prevented or detected on a timely basis. The following material weaknesses have been identified and included in management’s assessment. Management has identified material weaknesses in controls related to the lack of sufficient accounting and finance department resources, which contributed to the failure in the effectiveness of certain controls. In addition, the controls related to revenue recognition were not effective. We also have audited, in accordance with the standards of the Public Company Accounting Oversight Board (United States), the consolidated balance sheets of The Hain Celestial Group, Inc. and Subsidiaries as of June 30, 2016 and 2015, and the related consolidated statements of income, comprehensive income (loss), stockholders’ equity and cash flows for each of the three years in the period ended June 30, 2016. These material weaknesses were considered in determining the nature, timing and extent of audit tests applied in our audit of the June 30, 2016 financial statements, and this report does not affect our report dated June 22, 2017, which expressed an unqualified opinion on those financial statements.
113
In our opinion, because of the effect of the material weaknesses described above on the achievement of the objectives of the control criteria, The Hain Celestial Group, Inc. and Subsidiaries has not maintained effective internal control over financial reporting as of June 30, 2016, based on the COSO criteria.
/s/ Ernst & Young LLP
Jericho, New York
June 22, 2017
114
Item 9B. Other Information
Not applicable.
115
PART III
Item 10. Directors, Executive Officers and Corporate Governance
Identification of Directors and Business Experience.
The following information describes the background and business experience of our directors.
Irwin D. Simon, Founder, President, Chief Executive Officer and Chairman of the Board, Age 58
Irwin D. Simon is the Founder of The Hain Celestial Group, Inc. and has been our President and Chief Executive Officer (“CEO”) and a director since our inception in 1993. Mr. Simon was appointed Chairman of the Board of Directors in April 2000. Previously, Mr. Simon was employed in various marketing capacities at Slim-Fast Foods Company, a dietary food and beverage company, and The Haagen-Dazs Company, a frozen dessert company, then a division of Grand Metropolitan, PLC, a portfolio of luxury brands and companies. Mr. Simon currently serves as the lead director of MDC Partners Inc., a provider of marketing, activation and communications solutions and services. He also serves as the Vice Chair of the board of directors of Tulane University. During the last five years, Mr. Simon also served as a director of Jarden Corporation, a consumer products company, until its merger with Newell Rubbermaid Inc. and as an independent non-executive director of Yeo Hiap Seng Limited, a food and beverage company based in Singapore.
Key Attributes, Experience and Skills:
As our Founder, President and CEO since our inception in 1993, Mr. Simon brings to the Board unique perspectives and invaluable, in-depth knowledge of the Company, including strategic growth opportunities, personnel, relationships with key customers and suppliers, competitive positioning, history, culture, and all other aspects of its operations. In addition, Mr. Simon possesses a great depth of knowledge and experience regarding the organic and natural products industry on a global basis not easily found elsewhere. He is considered to be a prominent visionary and leader in the organic and natural products industry. In addition, Mr. Simon’s prior employment experience and other directorships bring him valuable insight into the broader consumer packaged goods industry.
Richard C. Berke, Director, Age 72
Richard C. Berke has been a director since April 2007 and is a member of the Compensation Committee and the Corporate Governance and Nominating Committee. Mr. Berke served from March 2007 to his retirement in January 2010 as Vice President, Human Resources for Broadridge Financial Solutions, Inc., an outsourcing provider to the global financial industry, formerly ADP Brokerage Services Group until its spin-off from Automatic Data Processing, Inc., a payroll and human resources services company (“ADP”) in March 2007. From January 1989 until its spin-off of Broadridge, Mr. Berke had served as Corporate Vice President of Human Resources with ADP. He held the position of President of ADP’s Benefits Services Division from January 1995 through December 1995.
Key Attributes, Experience and Skills:
With more than 35 years of experience as a human resources professional in positions of increasing responsibility, Mr. Berke has extensive knowledge and experience relating to human resources and executive compensation matters, which he brings to the Compensation Committee and the Board of Directors.
Andrew R. Heyer, Director, Age 59
Andrew R. Heyer has been a director since November 2012 and previously served as a director from November 1993 until November 2009. He currently serves as the lead independent director and is the chairperson of the Audit Committee. Mr. Heyer is the CEO and Founder of Mistral Equity Partners, a private equity fund. Prior to founding Mistral Equity Partners in 2007, from 2000 through 2007 he served as a Founding Managing Partner of Trimaran Capital Partners, L.L.C. Mr. Heyer was formerly a Vice Chairman of CIBC World Markets Corp. and co-head of CIBC Argosy Merchant Banking Funds. Prior to joining CIBC World Markets Corp. in 1995, Mr. Heyer was a founder and Managing Director of The Argosy Group L.P. Before Argosy, Mr. Heyer was a Managing Director at Drexel Burnham Lambert Incorporated, and previous to that, he worked at Shearman/American Express. Mr. Heyer currently serves as a director of Jamba, Inc. and Form Holdings. Mr. Heyer also serves as a member of the Executive Committee and Board of Trustees of the University of Pennsylvania and as Chair of the University of Pennsylvania Health System.
116
Key Attributes, Experience and Skills:
Mr. Heyer brings significant finance, investment, capital markets and consumer products experience to the Board. He has served on a number of public and private boards, which have provided him with a broad understanding of the operational, financial and strategic issues facing public and private companies. In addition, Mr. Heyer’s business, financial and investment experience in the consumer product and services industries makes him qualified for service on our Board.
Raymond W. Kelly, Director, Age 75
Raymond Kelly has been a director since August 2015 and is a member of the Corporate Governance and Nominating Committee. Mr. Kelly has been Vice Chairman of K2 Intelligence, an industry-leading investigative, compliance and cyber defense services firm, since November 2015. Prior to joining K2 Intelligence, Mr. Kelly was the President of Risk Management Services for Cushman and Wakefield, Inc., a commercial real estate service firm from March 2014 until November 2015. Prior to joining Cushman and Wakefield, Mr. Kelly served as the Police Commissioner of the City of New York from 1992 to 1994 and from 2002 to 2013. Mr. Kelly also served as Commissioner of the U.S. Customers Service and as Undersecretary for Enforcement at the U.S. Treasury Department, where he supervised the department’s enforcement bureaus including the U.S. Customs Service, the U.S. Secret Service, The Bureau of Alcohol, Tobacco and Firearms and the Federal Law Enforcement Training Center. Mr. Kelly holds a BBA from Manhattan College, a JD from St. John’s University School of Law, a LLM from New York University Graduate School of Law and an MPA from the Kennedy School of Government at Harvard University in addition to numerous honorary degrees.
Key Attributes, Experience and Skills:
With over 50 years in public service, Raymond Kelly brings extensive knowledge and experience to the Board relating to risk management, including physical and cyber security, crisis management and emergency preparedness. As Police Commissioner of the City of New York, Mr. Kelly managed over 54,000 employees and established the first counterterrorism bureau of any municipal police department in the country, as well as a global intelligence program. Mr. Kelly’s management and governance experience makes him a unique and valuable contributor to the Board.
Roger Meltzer, Director, Age 66
Roger Meltzer has been a director since December 2000. Mr. Meltzer has practiced corporate and securities law for more than 40 years, representing clients in a range of finance transactions, including mergers, acquisitions and dispositions, public offerings and public and private placements of debt and equity securities. In February 2007, Mr. Meltzer joined the law firm of DLA Piper LLP (US) as a partner, Global Chair of the Corporate and Finance practice, and a member of the firm’s executive committee. Mr. Meltzer is now a member of the Global Board of DLA Piper, Co-Chair of DLA Piper LLP (Americas), and Global Co-Chair. Prior to February 2007, he was a partner and a member of the executive committee of the law firm of Cahill Gordon & Reindel LLP.
Key Attributes, Experience and Skills:
The Company values the significant legal and financial expertise Mr. Meltzer brings to the Board through his extensive experience in corporate and securities laws as well as board governance matters. In addition, the Board values Mr. Meltzer’s experience as the Company continues to grow through strategic acquisitions. Finally, as the long-time legal advisor to the Company, Mr. Meltzer brings in-depth knowledge about the Company’s history to the Board.
Scott M. O’Neil, Director, Age 47
Scott M. O’Neil has been a director since January 2012 and is the chairperson of the Compensation Committee. Since July 2013, Mr. O’Neil has been the Chief Executive Officer of the Philadelphia 76ers, a professional basketball team, and since August 2013, he has also been the Chief Executive Officer of the New Jersey Devils, a professional hockey team, and the Prudential Center, a sports and entertainment arena. From July 2008 to September 2012, Mr. O’Neil was the President of Madison Square Garden (“MSG”) Sports. From 2005 to July 2008, Mr. O’Neil was a Senior Vice President for the National Basketball Association.
Key Attributes, Experience and Skills:
Mr. O’Neil is known and recognized for his brand-building and marketing expertise. During his tenure at MSG, Mr. O’Neil drove an unprecedented level of marketing partnerships with industry leading brands. Mr. O’Neil’s strong background in marketing, sales and business operations makes him a valuable contributor to the Board of a consumer packaged goods company.
117
Adrianne Shapira, Age 46
Adrianne Shapira has been a director since November 2014 and is a member of the Audit Committee and Compensation Committee. Ms. Shapira was the Chief Financial Officer of David Yurman Enterprises LLC, a designer jewelry company, from October 2012 to February 2016. From September 1999 to September 2012, Ms. Shapira was Managing Director at The Goldman Sachs Group, Inc., an investment banking firm, where she was an equity research analyst covering the discount, department store, dollar store, warehouse club, apparel manufacturer, luxury and grocery sectors. Prior to joining Goldman Sachs, Ms. Shapira worked as an equity analyst at Robertson Stephens, an investment banking firm, and Neuberger & Berman, an investment management company. Ms. Shapira currently serves as a director and a member of the governance and nominating committee of Kohl’s Corporation, an American department store retail chain. Ms. Shapira also previously served as a director of Gilt Groupe, an online luxury flash-sale shopping website.
Key Attributes, Experience and Skills:
Ms. Shapira’s status as a former Chief Financial Officer of a luxury consumer products company, coupled with her significant experience as an equity analyst in sectors related to the Company’s business makes her a valuable addition to our Board of Directors. Ms. Shapira has strong financial expertise, as well a broad understanding of the consumer products industry. In addition, her experience in e-commerce is an asset to the Company’s Board, as the Company continues to expand distribution in this area.
Lawrence S. Zilavy, Director, Age 66
Lawrence S. Zilavy has been a director since November 2002 and is the chairperson of the Corporate Governance and Nominating Committee and a member of the Audit Committee. Since September 2009, Mr. Zilavy has been employed by a private family investment and philanthropic office. From May 2006 until September 2009, Mr. Zilavy served as Senior Vice President of Barnes & Noble College Booksellers, Inc. Mr. Zilavy was Executive Vice President, Corporate Finance and Strategic Planning for Barnes & Noble, Inc. from May 2003 to November 2004 and was Chief Financial Officer of Barnes & Noble, Inc. from June 2002 through April 2003. Prior to joining Barnes & Noble, Inc., Mr. Zilavy worked as a banker for nearly 25 years. Mr. Zilavy is currently the lead director and a member of the audit committee and nominating and corporate governance committee of GameStop Corp. Mr. Zilavy also served as a director of Barnes & Noble, Inc. from 2006 to 2010.
Key Attributes, Experience and Skills:
Through his nearly 25 years of experience as a banker, coupled with his significant executive-level experience in a large retail company, Mr. Zilavy provides financial and operating expertise to the Board. In addition, Mr. Zilavy’s involvement on public company boards provides meaningful risk management insight and valuable governance skills, making him a valuable contributor to the Board.
Identification of Executive Officers and Business Experience.
The following information describes the background and business experience of our executive officers other than Mr. Simon.
John Carroll, Executive Vice President and Chief Executive Officer - Hain Celestial North America (through March 6, 2017), Age 56
Mr. Carroll was appointed Executive Vice President, Global Brands, Categories and New Business Ventures in March of 2017. Prior to such appointment, Mr. Carroll served as Executive Vice President and CEO - Hain Celestial North America from February 2015 to March 2017, and was appointed Executive Vice President and CEO - Hain Celestial United States in May 2008. He assumed the positions of Executive Vice President - Melville Business in February 2004, President of Grocery and Frozen in July 2004, President of Grocery and Snacks in September 2005 and President of Personal Care in August 2006. Prior to his employment with the Company, from April 2003 through July 2003, Mr. Carroll served as a consultant to the Company, providing due diligence services with respect to potential acquisitions. Prior to his consulting, Mr. Carroll was Managing Director, Heinz Frozen Foods at the H. J. Heinz Company, a global food company, where he served in positions of increasing responsibility from 1995 until 2003.
Pasquale Conte, Executive Vice President and Chief Financial Officer (effective September 8, 2015), Age 54
Mr. Conte was appointed Executive Vice President and Chief Financial Officer in September 2015. Prior to his appointment, he served as Senior Vice President, Finance and Treasurer from October 2014 to September 2015, and Vice President and Treasurer from July 2009 to October 2014. Prior to his employment with the Company, Mr. Conte served as a financial consultant to the Company from March 2009 to July 2009. Prior to joining Hain Celestial, he worked at Enterprise Mobility Solutions, a division
118
of Motorola, Inc. (formerly Symbol Technologies, Inc.) in a series of financial roles of increasing responsibilities including Tax Director, Vice President and Controller and ultimately, Chief Financial Officer. Mr. Conte, a Certified Public Accountant, previously worked at Colgate-Palmolive Company, NYNEX Corporation and Arthur Anderson, LLP.
Denise M. Faltischek, Executive Vice President and General Counsel, Chief Compliance Officer and Corporate Secretary, Age 44
Ms. Faltischek was appointed Executive Vice President and General Counsel, Chief Compliance Officer in November 2013. In addition, she was appointed as Corporate Secretary in January 2015. Prior to her appointment, she served as Senior Vice President and General Counsel from October 2010 to November 2013, General Counsel from October 2009 to October 2010, Senior Associate General Counsel from April 2009 until October 2009 and Associate General Counsel from July 2005 until April 2009. Prior to her employment with the Company, she was with the law firm of Ruskin Moscou Faltischek, P.C., where she practiced corporate and securities law.
Stephen J. Smith, Executive Vice President and Chief Financial Officer (through September 7, 2015), Age 57
Mr. Smith was appointed Executive Vice President and Chief Financial Officer in September 2013. Prior to his appointment at Hain Celestial, Mr. Smith served as Executive Vice President and Chief Financial Officer of Elizabeth Arden, Inc., a global prestige beauty products company, from May 2001 to September 2013. Previously, Mr. Smith, a certified public accountant, was with PricewaterhouseCoopers LLP, an international professional services firm, as partner from October 1993 until May 2001, and as manager from July 1987 until October 1993.
Corporate Governance.
Section 16(a) Beneficial Ownership Reporting Compliance.
Section 16(a) of the Exchange Act requires our executive officers and directors and persons who own more than 10% of a registered class of our equity securities to file initial reports of beneficial ownership and changes in such ownership with the SEC. Executive officers, directors and greater than 10% stockholders are also required by SEC regulations to furnish us with copies of all Section 16(a) forms they file. Based solely upon a review of the copies of such forms furnished to us and written representations from our executive officers and directors, the Company believes that all Section 16(a) filing requirements were met during the fiscal year ended June 30, 2016.
Website Access to Corporate Governance Documents
We have adopted a “Code of Ethics”, as defined in the regulations of the SEC, which applies to all of our directors and employees, including our principal executive officer and principal financial officer. Copies of the charters for the Audit Committee, the Compensation Committee, the Corporate Governance and Nominating Committee, as well as the Company’s Corporate Governance Guidelines and Code of Business Conduct and Ethics, are available free of charge on our website at www.hain.com or by writing to Investor Relations, The Hain Celestial Group, Inc., 1111 Marcus Avenue, Lake Success, NY 11042. We intend to satisfy the applicable disclosure requirements regarding amendments to, or waivers from, provisions of our Code of Ethics by posting such information on our website. The information contained on our website or connected to our website is not, and shall not be deemed to be, a part of this Annual Report or incorporated by reference into this Annual Report on Form 10-K and should not be considered part of this report.
The Audit Committee.
The Audit Committee’s principal duties include appointing, retaining and terminating our registered independent accountants, overseeing the work of and evaluating the independence of the registered independent accountants, reviewing with the registered independent accountants their reports as well as oversight responsibilities with respect to our financial statements, disclosure practices, accounting policies, procedures and internal controls and oversees the qualifications, independence and performance of the Company’s internal audit function.
Our Audit Committee is composed of Ms. Shapira and Messrs. Heyer and Zilavy, with Mr. Heyer acting as chairperson. The Board has determined that each member of the Audit Committee (1) is “independent” as defined by applicable SEC rules and the listing standards of Nasdaq, (2) has not participated in the preparation of our financial statements or those of any of our current subsidiaries at any time during the past three years and (3) is able to read and understand fundamental financial statements, including a balance sheet, income statement, and cash flow statement. In addition, the Board has determined that each of Ms. Shapira and Messrs. Heyer and Zilavy is an “audit committee financial expert” as defined by applicable SEC rules. Audit Committee members are not permitted to serve on the audit committees of more than two other public companies.
119
Item 11. Executive Compensation
Executive Compensation.
Compensation Discussion and Analysis
Introduction
Despite achieving over 10% growth in net sales and a nearly 10% increase in gross profits during fiscal 2016 compared to fiscal 2015, we made difficult compensation decisions during fiscal 2016, as evidenced by the Compensation Committee’s decision to make no awards to our named executive officers (“NEOs”) under the 2016 Annual Incentive Plan and to make no additional performance-based awards in connection with the 2015-2016 LTIP (as defined below). We made these decisions as a result of our failure to meet other financial targets and because we take seriously the alignment of our interests with the interests of our stockholders and the importance of rewarding strong performance over the long term. Further, we have implemented sustainable long-term-focused non-financial measures into our compensation decisions which we believe will further align pay with performance.
This Compensation Discussion and Analysis (“CD&A”) explains our overall compensation philosophy and our stockholder engagement initiatives, describes the material components of our executive compensation programs and details the determinations made by the Compensation Committee for the compensation awarded in the Company’s fiscal year ended June 30, 2016 to the following NEOs:
Executive | Position |
Irwin D. Simon................... | Founder, President, Chief Executive Officer and Chairman of the Board |
John Carroll........................ | Executive Vice President and Chief Executive Officer - Hain Celestial North America (through March 6, 2017) |
Pasquale Conte................... | Executive Vice President and Chief Financial Officer (commencing September 8, 2015) |
Denise M. Faltischek.......... | Executive Vice President and General Counsel, Chief Compliance Officer and Corporate Secretary |
Stephen J. Smith................. | Executive Vice President and Chief Financial Officer (through September 7, 2015) |
Mr. Smith, although no longer an employee of the Company, is included in this proxy statement as a NEO pursuant to applicable SEC disclosure requirements.
Executive Summary
Our mission and operating strategy require that our compensation philosophy recognizes both near-term financial and operational success as well as decision-making that supports long-term value growth. For these reasons, the Company’s executive compensation program has been designed to incentivize both near-term and long-term objectives by providing NEOs with both annual incentive and long-term incentive awards. On at least an annual basis, the Compensation Committee evaluates the Company’s executive compensation practices to ensure that they are designed to drive both short-term and long-term growth initiatives and are aligned with the performance of our business and the interests of our stockholders.
We believe that a significant portion of our executive compensation should be dependent on the continued growth and success of our Company so that our NEOs have even stronger motivation to work towards the long-term interests of our stockholders. Accordingly, a significant portion of executive compensation is designed to be “at risk”, and therefore, a significant portion of the compensation of our NEOs is annual and long-term incentive compensation, which is dependent on achieving performance goals.
In connection with the 2016 Annual Incentive Plan, the Compensation Committee noted that the Company did not achieve the requisite performance needed to exceed the threshold levels associated with payout under the plan. While the Company did exceed the threshold performance required for net sales, the Company failed to achieve threshold performance with respect to adjusted earnings per share and adjusted EBITDA; accordingly, the Compensation Committee concluded that there would be no awards to the NEOs under the 2016 Annual Incentive Plan. In addition, in connection with the 2015-2016 LTIP, the Compensation Committee evaluated the Company’s net sales and adjusted EBITDA achievement during the two-year performance period for fiscal years 2015 and 2016 and noted that the Company had exceeded its net sales performance target but did not achieve target performance in connection with the adjusted EBITDA performance measure. Based on the Company’s failure to achieve target performance in connection with the adjusted EBITDA performance measure along with Mr. Simon’s recommendation that there should be no additional awards made in connection with the 2015-2016 LTIP, the Compensation Committee determined not to make any additional awards in connection with the 2015-2016 LTIP.
120
Response to Say on Pay Vote
At our 2014 Annual Meeting of Stockholders, 50.5% of the votes cast supported our 2014 Say-on-Pay resolution and at our 2015 Annual Meeting of Stockholders, only 41% of the votes cast supported our 2015 Say-on-Pay resolution. Following the response at our 2014 Annual Meeting and, at the direction of our Compensation Committee, we launched a formal stockholder engagement initiative. In response to the feedback received from our stockholders during this initiative, our Compensation Committee made substantive changes to our executive compensation programs. As a result of the internal accounting review and the delay in our filings with the SEC, the Company was subject to a quiet period during the course of 2016, which restricted the Company from engaging in discussions regarding the Company and therefore, limited our stockholder engagement during this time. The Company intends to resume its stockholder engagement program now that the accounting review is complete and the Company is current with its SEC reporting obligations. However, this did not impede the Company from effectuating both compensation and corporate governance improvements during this period as the Company was able to draw upon the previous feedback it received from stockholders.
As part of this effort, we reached out to our 50 largest stockholders, who collectively held more than 66% of our issued and outstanding common stock, and offered to discuss and obtain feedback on our compensation programs, corporate governance and any other matters of interest. We had discussions with stockholders representing approximately 46% of our issued and outstanding common stock. These discussions were held with our Senior Vice President, Corporate Relations, our Senior Vice President, Human Resources, our Executive Vice President and General Counsel and our Associate General Counsel and, in certain instances, by the chairperson of our Compensation Committee. This effort supplemented the ongoing communications and meetings that we hold with our investors throughout the fiscal year and focused on executive compensation and corporate governance matters. Our goal was to understand better the concerns of our stockholders with respect to executive compensation and corporate governance so that we could develop and implement a plan to address these concerns. The feedback received was presented to our Compensation Committee. Stockholders were generally pleased with our business results and provided us with their concerns regarding our executive compensation plan design and practices. During those discussions, we heard several recurring themes that caused us to take the following compensation and governance actions:
121
WHAT WE HEARD | WHAT WE HAVE DONE IN RESPONSE | INTENDED OUTCOME | WHEN EFFECTIVE | |||
Net revenue and EBITDA were duplicative performance metrics in both the annual and long term incentive plans | Adopted a different performance measure, Relative TSR, for the long term incentive plan Eliminated EBITDA as a performance measure in the long term incentive plan | Provides stockholders with another basis on which to evaluate the Company’s performance | 2016-2018 Long-Term Incentive Plan (adopted in late calendar year 2015) | |||
The Company should consider adopting a performance measure that is relative so that stockholders can better evaluate the Company’s performance against its peers | Adopted Relative TSR as one of the measures for the long term incentive plan | Provides stockholders with the ability to evaluate the Company’s performance against a predetermined peer group and payouts are based on performance relative to peers | 2016-2018 Long-Term Incentive Plan | |||
The Company should consider increasing the performance period under the long term incentive plan from two years to three years | Increased the performance period under the long term incentive plan to three years | Incentives long term growth | 2016-2018 Long-Term Incentive Plan | |||
The Company should further align pay and performance | Eliminated the portion of the long term incentive award (25%) that was purely time-based | All awards under the long term incentive plan are 100% performance-based thereby increasing stockholder alignment | 2016-2018 Long Term Incentive Plan | |||
The Company should consider eliminating the use of a CEO Founder Peer Group | We are now using a single compensation peer group for all executive compensation decisions | Provides for clearer and more concise information | 2016 | |||
Proxy access is a right that is important to stockholders | The Board of Directors supported a stockholder proposal for proxy access in the 2015 proxy statement | Provides stockholders meeting certain requirements the right to nominate candidates for election to our Board and have their nominees included in our proxy statement | After our 2016 Annual Meeting (provided a majority of our stockholders approve the by-law amendments) | |||
122
Executive Compensation Practices at a Glance
What We Do ü | What We Do NOT Do û | ||
ü | DO align annual incentive pay and performance by linking 100% of annual incentive compensation to the achievement of a balanced mix of quantitative and qualitative, at-risk performance hurdles tied to Company strategic objectives | û | NO guaranteed cash incentives, equity compensation or salary increases for NEOs |
ü | DO align long-term incentive pay and performance by linking 100% of long term compensation to the achievement of quantitative, at-risk performance hurdles tied to the Company’s long-term strategic objectives and relative TSR performance | û | NO executive pension or executive retirement plans for any of our NEOs |
ü | DO promote executive officer retention by increasing the vesting period for any time-based restricted stock to three year pro rata vesting (increased from two-year vesting) | û | NO compensation or incentives that encourage unnecessary or excessive risk taking |
ü | DO strive to award incentive compensation to qualify as performance-based compensation under Section 162(m) of the Internal Revenue Code of 1986, as amended (the “Code”) | û | NO tax gross ups for our CEO or any executive officer entering into a change in control agreement since 2009 |
ü | DO cap payouts for awards under our Annual Incentive Award Plan and LTIP | û | NO pledging of any of our securities (adopted Anti-Pledging Policy) |
ü | DO maintain rigorous stock ownership guidelines (6x base salary for the CEO, 3x base salary for Executive Vice Presidents, 2x base salary for other executive officers and segment leaders, 1x base salary for all other LTIP participants and 5x annual cash compensation (excluding additional cash compensation to committee chairpersons) for non-employee directors) | û | NO hedging or derivative transactions involving our securities (adopted Anti-Hedging Policy) |
ü | DO maintain a clawback policy | û | NO “single-trigger” change in control agreements entered into with our CEO or any executive officer since 2009 |
ü | DO conduct annual compensation review and approval of our compensation philosophy and strategy | û | NO excessive perquisites or other benefits |
ü | DO appoint a Compensation Committee comprised solely of independent directors | û | NO repricing or buyouts of underwater stock options |
ü | DO use an independent compensation consultant engaged by our Compensation Committee | û | NO equity plan evergreen provisions |
ü | DO have a significant portion of executive compensation at risk based on corporate performance | ||
123
Compensation Philosophy
Our mission is to be the leading marketer, manufacturer and seller of organic and natural, better-for-you products. We are committed to growing sustainably while continuing to implement environmentally sound business practices and manufacturing processes. To achieve this, we strive to maximize growth in net sales, earnings and operating cash flow. This goal requires the Company to continue to introduce innovative new products and expand its distribution and geographical reach, maintain a strong financial position and manage its cost of goods and expenses. Our mission and operating strategy require that our compensation philosophy recognizes both near-term financial and operational success as well as decision-making that supports long-term value growth. This is accomplished through the adoption of annual incentive awards, which are tied to delivering performance consistent with our business plan and as reflected in our annual guidance as well as providing for non-financial performance goals that have longer term impact on the business, together with long term incentive awards, which are tied to delivering multi-year financial performance. Given the importance of long-term growth, a greater emphasis is placed on the value of long-term incentive awards in our NEOs’ total compensation.
We believe that a significant portion of our executive compensation should be dependent on the continued growth and success of our Company so that our NEOs have even stronger motivation to work towards the long-term interests of our stockholders. Accordingly, a significant portion of executive compensation is designed to be “at risk”, and therefore, except for base salary, 100% of our NEOs’ total direct compensation is dependent on achieving performance goals and provides for a significant portion to be paid in the form of equity compensation that will appreciate in value only to the extent that shares held by our stockholders also increase in value.
The Compensation Committee reviews our compensation design and philosophy on at least an annual basis to ensure that our executive compensation program continues to support the Company’s strategy, objectives and stockholder interest.
Executive Compensation Program Objectives
We provide a competitive total compensation package to our executive management team through a combination of base salary, annual incentives, long-term incentives and other compensation, including severance and change in control agreements.
The primary objectives of our executive compensation program are to:
• | Align the interests of our executives with the interests of our stockholders; |
• | Prioritize implementation of pay for performance; |
• | Promote the creation of long-term stockholder value; |
• | Attract, motivate and retain key employees with outstanding talent and ability; |
• | Structure executive compensation in a manner that promotes our strategic, financial and operating performance objectives; and |
• | Reward performance, with a meaningful portion of compensation tied to the Company’s financial and strategic goals. |
Our compensation elements are designed to achieve the objectives set forth above as follows:
• | Base salary and benefits are designed to attract and retain executives by providing regular and continued payments that are appropriate to their position, experience and responsibilities; |
• | Annual performance-based awards are designed to focus our executives on pre-set objectives each year that are generally operational and drive specific performance needed to foster short-term and long-term growth and profitability; |
• | Long-term incentives are designed to align our executives’ interests with those of our stockholders and to motivate executives to generate value for our stockholders over the long-term; and |
• | Severance and change-in-control plans are designed to mitigate the distraction of our key executives when faced with a potential change in control or other possible termination situations and to facilitate our ability to attract and retain executives as we compete for talented individuals in a marketplace where such protections are commonly offered. |
124
CEO Compensation
Discussion of our Fiscal 2016 Executive Compensation Program
This section provides a discussion of the Compensation Committee’s decisions regarding the compensation of our NEOs for fiscal year 2016.
Peer Group
Each year, the Compensation Committee evaluates the previously-selected peer group and determines which companies best reflect the Company’s competitors for customers, stockholders and talent. A key objective of our executive compensation program is to ensure that total direct compensation is competitive with the companies against which we compete for talent. The Compensation Committee engages Aon Hewitt as its independent compensation consultant to assist the Compensation Committee in developing and evaluating the peer group.
In order to examine the competitiveness of our overall compensation program, Aon Hewitt compared the total direct compensation of our NEOs (consisting of base salary, annual incentive compensation and long-term incentive compensation as determined under SEC rules but not including benefits and perquisites) during fiscal year 2015 to the publicly filed data of comparable companies in the consumer packaged goods industry.
Given the breadth of our business in the organic and natural industry, our Company has few direct business competitors, which makes it difficult to create a peer group based on industry codes, revenues or market capitalization alone. The process for choosing the companies used in the Aon Hewitt analysis report was based on the following screening criteria as instructed by the Compensation Committee: revenues, market capitalization, strong growth experience, significant international operations, focus on organic, natural and better-for-you food/beverage or consumer/household products, recognized for their industry leadership and brand recognition and viewed as competitors for executive talent. Our peer group for fiscal 2016 was as follows:
Ÿ | Chipotle Mexican Grill, Inc. | Ÿ | Nu Skin Enterprises, Inc. | |
Ÿ | Coach, Inc. | Ÿ | Panera Bread Company | |
Ÿ | Coty Inc. | Ÿ | Pinnacle Foods Inc. | |
Ÿ | Diamond Foods, Inc. | Ÿ | Post Holdings, Inc. | |
Ÿ | Flowers Foods, Inc. | Ÿ | Synder’s-Lance, Inc. | |
Ÿ | Keurig Green Mountain, Inc. | Ÿ | TreeHouse Foods, Inc. | |
Ÿ | lululemon athletica inc. | Ÿ | Under Armour, Inc. | |
Ÿ | McCormick & Company, Incorporated | Ÿ | United Natural Foods, Inc. | |
Ÿ | Mead Johnson Nutrition Company | Ÿ | The Estee Lauder Companies, Inc. | |
Ÿ | Molson Coors Brewing Company | Ÿ | The WhiteWave Foods Company | |
Ÿ | Monster Beverage Corporation | |||
The fiscal year 2016 peer group reflected certain changes that the Compensation Committee determined to make in the Fall of 2015 to the Company’s fiscal year 2015 peer group, with the assistance of Aon Hewitt:
• | J&J Snack Foods Corp. was removed due to its lower revenues and growth and the overall lack of competitiveness between the two companies. |
• | Under Armour, Inc. was added due to its strong growth and its leadership position in the athletic apparel industry. |
• | The Estee Lauder Companies Inc. was added in order to provide additional representation in the peer group in the personal care industry. |
• | The J.M. Smucker Company was removed due to the fact that its revenue was more than twice that of the Company. |
Compensation decisions for our executive officers are made by the Compensation Committee, with input from Aon Hewitt as well as Mr. Simon (except with respect to his own compensation). The Compensation Committee uses compensation data from our peer group as general guidance and as one of many factors that inform its judgment of appropriate compensation parameters for target compensation levels but does not set the executive compensation levels with reference to any particular percentile of the peer group or with an eye towards “matching” any particular element or mix of elements.
125
Base Salary
The base salaries of our NEOs are reviewed on an annual basis by Mr. Simon (other than with respect to his own salary which is reviewed and determined by our Compensation Committee) and our Compensation Committee, based on their experience setting salary levels. This review is supplemented by market data, as well as assessments of the performance of our executive officers by our Compensation Committee. We pay base salaries to our NEOs to compensate them for their day-to-day services. The salaries typically are used to recognize the experience, skills, knowledge, past performance and responsibilities of each NEO.
Following a year of strong TSR performance, for fiscal year 2016, the Compensation Committee approved the following salaries for the NEOs:
Name | Fiscal Year 2016 Salary | |
Irwin D. Simon.................................................................................... | $1,905,000 | |
John Carroll......................................................................................... | $713,000 | |
Pasquale Conte.................................................................................... | $500,000 | |
Denise M. Faltischek .......................................................................... | $600,000 | |
Mr. Smith did not receive an increase in base salary for fiscal year 2016. For fiscal year 2017, the NEOs did not receive any increases in base salary.
Annual Incentive Plan
A key executive compensation objective is to have a significant portion of each NEO’s compensation be tied to the Company’s operational and financial performance. To this end, the annual incentive plan, which is fully at-risk, is based on performance against pre-set key financial and non-financial objectives designed to drive the specific performance needed to foster both short-term and long-term growth and profitability.
At the beginning of fiscal 2016, the Board of Directors approved the Company’s fiscal year 2016 operating plan, which included performance objectives that were used to design each NEO’s annual incentive plan for fiscal year 2016. The Compensation Committee, in an effort to continue to motivate Mr. Simon and the other NEOs to further grow and develop our business, set rigorous performance targets for fiscal 2016 that it considered aggressive and attainable only with focused effort and execution by our NEOs. In addition to financial targets, the Compensation Committee also set sustainable long-term-focused non-financial targets. For fiscal year 2016, the Compensation Committee assigned a 50% weighting for financial targets and a 50% weighting for non-financial targets for each NEO. These weightings represented the Compensation Committee’s general view of the relative importance of the performance targets with respect to each NEO at the time the performance targets were adopted but are not determinative in making its final decision. While the Compensation Committee utilizes the pre-set performance targets in order to assess individual performance and determine individual annual incentive payments, the Compensation Committee does retain some degree of discretion over the final amount of the annual incentive payment and, as evidenced by this fiscal year, has authority to award no payments even if the targets for all performance measures are met.
The financial performance targets were designed to drive significant increases in net sales growth and profitability, which the Compensation Committee felt would increase stockholder value consistent with our overall growth strategy. The Compensation Committee considered the financial objectives to be significantly rigorous given that the target level of performance required the Company to achieve 13% net sales growth, 16.5% adjusted earnings per share growth and 15.2% adjusted EBITDA growth when compared to the previous year, especially when the natural food and beverage industry was growing at 9% in 2015 according to The Natural Foods Merchandiser, a leading natural products industry trade publication. The Compensation Committee acknowledged that these targets were lower than targets set for the previous year but believed that such targets were appropriate given the challenges facing the food and beverage industry overall.
126
Fiscal Year 2016 Annual Incentive Award Determinations
For fiscal year 2016, each of the NEOs had the opportunity to earn the following annual incentive awards as a percentage of base salary for threshold, target and maximum performance:
Name | Annual Incentive Threshold Award (% of Base Salary) | Annual Incentive Target Award (% of Base Salary) | Annual Incentive Maximum Award (% of Base Salary) |
Irwin D. Simon | 50% | 100% | 400% |
John Carroll | 50% | 100% | 200% |
Pasquale Conte | 50% | 100% | 100% |
Denise M. Faltischek | 50% | 100% | 100% |
Annual incentive awards are interpolated for performance between the threshold award and the maximum award.
Mr. Smith ceased being the CFO on September 7, 2015, and his employment with the Company terminated on September 30, 2015. Since Mr. Smith’s termination was prior to the determination and payout of the Annual Incentive Award, Mr. Smith was not eligible to receive an annual incentive award.
162(m) Funding
For fiscal year 2016, the Compensation Committee established the performance goal of adjusted EBITDA1 of $348 million, which must be met for a NEO’s Annual Incentive Plan to be funded under Section 162(m) of the Code.
As our fiscal year 2016 adjusted EBITDA of $364 million exceeded the established goal, the Compensation Committee then evaluated the performance of each individual NEO against the previously approved financial and non-financial performance targets as discussed below.
Compensation Committee Determination
For the 2016 fiscal year, in considering the awards to be made under the Annual Incentive Plan, the Compensation Committee noted that, despite each NEO’s achievements against his or her individual non-financial targets, the level of achievement associated with the Company’s financial targets under the 2016 Annual Incentive Plan failed to reach the target levels set for the NEOs, as discussed further below. In addition, the Compensation Committee took into account Mr. Simon’s recommendation that, given the failure to achieve target level performance with respect to the Company’s financial targets, there should be no awards under the 2016 Annual Incentive Plan. As a result of the foregoing, the Compensation Committee determined that, with respect to all NEOs, no awards would be paid in connection with the 2016 Annual Incentive Plan.
______________________________
1 Under the terms of the plan adopted by the Compensation Committee, adjusted EBITDA excludes the impact of non-cash compensation, currency fluctuations, impairment of long-lived assets, costs incurred in mergers and acquisitions, restructuring and integration charges, gains or losses from disposals of businesses and other non-cash and non-recurring items which may have been incurred during the fiscal year.
127
The following table shows the target awards and the awards as determined by the Compensation Committee and the percentage of the target payment represented by the award for each participating NEO:
Name | Target Award | Annual Incentive Award | Award as a Percentage of Target | |||
Irwin D. Simon.................................................................................... | $1,905,000 | $— | —% | |||
John Carroll......................................................................................... | $713,000 | $— | —% | |||
Pasquale Conte.................................................................................... | $500,000 | $— | —% | |||
Denise M. Faltischek........................................................................... | $600,000 | $— | —% | |||
The following are the financial measures and actual results that the Compensation Committee considered for Messrs. Simon and Conte and Ms. Faltischek for fiscal year 2016 (the financial measures and actual results for Mr. Carroll appear below):
Financial Measure2 | 50% of Target Award | Target | Maximum Target Award | Actual |
Adjusted Net Sales (FY2016 vs. FY2015)............................... | +10.4% | +13.0% | +15.6% | +11.2% |
Adjusted Earnings Per Share (FY2016 vs. FY2015)................................................................................ | +12.2% | +16.5% | +20.2% | -2.12% |
Adjusted EBITDA (FY2016 vs. FY2015)................................ | +11.5% | +15.2% | +18.9% | -3.0% |
The adjusted net sales measure was designed to reflect our objectives of growing top-line revenue by innovating new products and expanding distribution in new and existing channels and geographies. The adjusted earnings per share measure was designed to serve as an indicator of the Company’s profitability. To ensure that we efficiently develop and expand our markets, the adjusted EBITDA measure was intended to motivate Messrs. Simon and Conte and Ms. Faltischek to manage our costs and take into account the appropriate level of expenses expected with our growth. The Compensation Committee noted that the Company did not achieve threshold performance for the Adjusted Earnings Per Share and Adjusted EBITDA.
The financial measures for Mr. Carroll related to adjusted net sales and adjusted operating income with respect to the Company’s U.S operating segment, of which he was the CEO. In addition, Mr. Carroll had the same adjusted earnings per share financial measure as the other NEOs. For Mr. Carroll, the following are the financial measures and actual results that the Compensation Committee considered for him for fiscal year 2016:
______________________________
2 The “adjusted” financial measures referred to in this “Financial Measures” section are not defined under GAAP and are not deemed alternatives to measure performance under GAAP. We have presented information regarding these adjusted results solely to indicate the inputs to the Annual Incentive Plan, as considered by the Compensation Committee. The results for adjusted net sales for fiscal year 2015 were calculated using net sales, including sales recalled for the nut butter voluntary recall and non-dairy beverage withdrawal, and excluding any currency fluctuations. Net sales for fiscal year 2016 are presented on a GAAP basis. Adjusted earnings per share and adjusted EBITDA were calculated using the information presented by the Company in its earnings press release for the fiscal year ended June 30, 2016.
128
Financial Measure3 | 50% of Target Award | Target | Maximum Target Award | Actual |
Adjusted Net Sales (FY2016 vs. FY2015)...................................... | +5.0% | +7.9% | +11.4% | -5.7% |
Adjusted Earnings Per Share (FY2016 vs. FY2015)..................................................................................... | +12.2% | +16.5% | +20.2% | -2.12% |
Adjusted Operating Income (FY2016 vs. FY2015)......................... | +4.9% | +8.3% | +11.8% | -15.9% |
In addition to the above-referenced financial measures, the Compensation Committee adopted separate non-financial performance targets for each NEO. The non-financial performance targets are designed to incentivize performance against the Company’s longer term strategic initiatives and to provide recognition for significant contributions made to the overall performance of the Company.
Mr. Simon
The eight non-financial measures for Mr. Simon related to strengthening the Company’s management team and overall organization on a global basis, continuing to develop and implement the Company’s international infrastructure, entering into acquisitions, divestitures or strategic alliances, expanding into new product categories or geographies, working to continuously expand the Company’s customer base and enhance relationships with existing customers, working to continuously improve the Company’s corporate governance practices, strengthening and enhancing the Board of Directors through communications and educational programs and implementing a global campaign to enhance public awareness of the Company, including its sustainability strategy, The Healthier Way.
In evaluating Mr. Simon’s performance, the Compensation Committee noted that Mr. Simon had significantly over achieved his non-financial targets by successfully completing several strategic transactions. The acquisition of the Mona Group expanded our non-dairy offerings in Europe and expanded our geographical footprint in Eastern Europe. The acquisition of Orchard House Foods expanded our portfolio in the United Kingdom in fresh fruit and fruit desserts. The Compensation Committee also noted Mr. Simon’s work in the Company’s expansion into new channels of distribution as well as upgrading and strengthening the management team and organization on a global basis, including spearheading and overseeing the development of the Project Terra strategic plan, which included projected productivity savings globally over the next three fiscal years. Finally, the Compensation Committee noted that Mr. Simon worked to continuously improve the Company’s corporate governance practices and enhance the public awareness of the Company through increased media and conference appearances.
__________________________
3 Please refer to footnote 2 above for a discussion regarding adjusted net sales and adjusted EBITDA. The results of adjusted operating income were calculated using U.S. segment operating income presented by the Company in its earnings press release for the fiscal year ended June 30, 2016.
129
Mr. Carroll
The eleven non-financial measures for Mr. Carroll related to long-term strategic planning for the U.S. business and included increasing consumption growth within multi-outlet channels, developing a plan for SKU rationalization to improve growth, service levels and gross margin, the achievement of productivity savings, evaluating the current U.S. segment structure and beginning to implement the improved structure while enhancing culture and talent, developing a pricing strategy, successfully completing an acquisition for the Company’s U.S. segment, driving innovation and certain sales and supply chain initiatives.
The Compensation Committee noted that Mr. Carroll had achieved the performance required for Mr. Carroll to receive his target award for the non-financial performance measures in connection with evaluating the current U.S. segment structure and implementing the pillars identified in Project Terra, improving structure while enhancing culture and talent, driving innovation, delivering on certain e-commerce strategies and pricing strategies and increasing the distribution of products with the introduction of over 100 new products and the delivery of certain sales and supply chain initiatives with the attainment of productivity savings in excess of $35 million in the United States.
Ms. Faltischek
The nine non-financial measures for Ms. Faltischek related to assessing and identifying areas of continuous improvement relating to corporate governance, implementing a plan to outsource the Consumer Care department, continuously evaluating and improving processes relating to food safety, public company compliance and business continuity, quarterbacking all strategic transactions, developing the Corporate Sustainability plan and upgrading the processes and talent related to the legal, quality control and regulatory assurance departments.
In assessing whether Ms. Faltischek had been able to satisfy each of the non-financial performance measures attributed to her, the Compensation Committee noted that Ms. Faltischek had achieved the performance targets for Ms. Faltischek to receive at least her target award for all such goals and had over achieved the performance indicated in certain circumstances. In particular, the Compensation Committee noted that Ms. Faltischek had significantly over achieved her targets by restructuring the quality assurance and regulatory functions, successfully completing two acquisitions, overseeing the development of a plan for outsourcing the Consumer Care department and fully implementing such plan, and overseeing the full implementation of an enhanced food safety management system.
Mr. Conte
The ten non-financial measures for Mr. Conte related to assessing and strengthening the Company’s finance team, developing and standardizing financial operating metrics to better assess performance, developing an information technology strategy for the Company, developing and beginning to implement a plan for information technology integration in Europe, developing tax and debt structure strategies for a global organization, executing on plans for margin enhancement and cost savings, and ensuring Sarbanes-Oxley compliance at newly acquired companies.
In assessing whether Mr. Conte had been able to achieve each of the non-financial performance measures attributed to him, the Compensation Committee noted that Mr. Conte had achieved the performance required for Mr. Conte to receive his target award in connection such performance measures, except for the achievement of certain cost savings.
Long-Term Incentive Program
We believe that equity grants serve our compensation objectives by linking the compensation of our key employees to our long-term growth strategy and further align such employees with our stockholders since the value of equity awards will increase or decrease with the changes in the value of our common stock. Grants are generally made under a performance-based long-term incentive program (the “LTI Program”). In fiscal year 2016, the LTI Program consisted of two performance-based long-term incentive plans (the “2015-2016 LTIP” and the “2016-2018 LTIP”). The 2015-2016 LTIP provides for a combination of time-based equity grants and performance awards, which may be earned over a two-year performance period and paid in cash, stock, restricted stock, restricted stock units or other forms of stock-based awards, or any combination thereof.
130
2015-2016 LTIP
Award Levels, Performance Measures and Targets
For the 2015-2016 LTIP, each named executive officer had a threshold, target and maximum as a percentage of base salary as follows:
Name | Base Salary (1) | LTIP Threshold Award (% of Base Salary) | LTIP Target Award (% of Base Salary) | LTIP Maximum Award (% of Based Salary) | ||
Irwin D. Simon | $1,877,500 | 400% | 700% | 1,000% | ||
John Carroll | $703,000 | 143% | 250% | 358% | ||
Pasquale Conte | $409,000 | 48% | 85% | 122% | ||
Denise M. Faltischek | $575,000 | 171% | 300% | 429% | ||
________
(1) | The annual base salary is determined by taking the average of the annual base salaries for fiscal year 2015 and fiscal year 2016. |
In determining individual payouts, the Compensation Committee adopted two performance measures, adjusted net sales and adjusted EBITDA. The following are the performance levels and the actual results:
Financial Measure4
Threshold | Target | Maximum | Actual | |
Adjusted Net Sales (Average FY2016 and FY2015) | $2,535,975 | $2,817,750 | $3,381,300 | $2,851,111 |
Adjusted EBITDA (Average FY2016 and FY2015) | $361,159 | $401,288 | $481,545 | $380,056 |
The Compensation Committee evaluated the Company’s net sales and adjusted EBITDA achievement during the two-year performance period for fiscal years 2015 and 2016 and noted that the Company had exceeded its adjusted net sales performance target but did not achieve target performance in connection with the adjusted EBITDA performance measure. As a result of the foregoing, the Compensation Committee determined not to grant any additional awards to the NEOs under the 2015-2016 LTIP, taking into account Mr. Simon’s recommendation that such awards should not be paid given the results against the financial performance measures in the 2016 Annual Incentive Plans, as well as the failure to achieve target performance in connection with the adjusted EBITDA performance measure in the 2015-2016 LTIP.
___________________
4 The “adjusted” financial measures referred to in this “Financial Measures” section are not defined under GAAP and are not deemed alternatives to measure performance under GAAP. As explained in this section, the LTI Program is based in part on certain financial goals, which may be adjusted from the GAAP results by the Compensation Committee at its discretion. We have presented information regarding these adjusted results solely to indicate the inputs to the LTI Program, as considered by the Compensation Committee. The results for adjusted net sales for fiscal year 2015 were calculated using net sales, including sales recalled for the nut butter voluntary recall and non-dairy beverage withdrawal, and excluding any currency fluctuations. Net sales for fiscal year 2016 are presented on a GAAP basis. Adjusted EBITDA was calculated using the information presented by the Company in its earnings press release for the fiscal year ended June 30, 2016.
131
In November 2014, the NEOs received an equity grant having a value equal to 50% of the targeted award under the 2015-2016 LTIP. This award was comprised of 50% time-based restricted stock, vesting pro-rata over three years, and 50% performance-based awards, which would be forfeited if the NEOs did not achieve at least threshold performance against the adjusted net sales and adjusted EBITDA performance measures. Given that the NEOs achieved more than threshold performance against the adjusted net sales and adjusted EBITDA performance measures, the previously issued performance-based awards were not forfeited. The following table shows the target awards and the value of the award each NEO received under the 2015-2016 LTIP:
Name | Annual Base Salary (1) | LTIP Target Percent | LTIP Target Dollars | LTIP Award (2) | 50% of LTIP Target Dollars Previously Granted (3) | LTIP Award (4) | |||||
Irwin D. Simon | $1,877,500 | 700% | $13,142,500 | $— | $6,475,000 | $6,475,000 | |||||
John Carroll | $703,000 | 250% | $1,757,500 | $— | $866,250 | $866,250 | |||||
Pasquale Conte | $409,000 | 85% | $347,650 | $— | $135,150 | $135,150 | |||||
Denise M. Faltischek | $575,000 | 300% | $1,725,000 | $— | $825,000 | $825,000 | |||||
Stephen J. Smith (5) | $510,000 | 110% | $561,000 | $— | $— | $— | |||||
(1) | The annual base salary was determined by taking the average of the annual base salaries for fiscal year 2015 and fiscal year 2016. |
(2) | As discussed above, the Compensation Committee, in making its determination, placed significant weight on Mr. Simon’s recommendation and the level of achievement against the performance measures and determined that there would be no additional awards paid in connection with the 2015-2016 LTIP. |
(3) | On November 20, 2014, each of Messrs. Simon, Carroll, Conte and Smith and Ms. Faltischek received a grant of restricted stock having a value equal to 50% of their target awards under the 2015-2016 LTIP. The number of shares granted was determined using the closing market price of $106.14 on November 20, 2014. In each case, the NEO’s fiscal year 2015 salary was used to calculate the LTIP target. The NEOs achieved the requisite performance needed to not forfeit this amount. |
(4) | The amounts in this column differ slightly from the amounts listed in the Summary Compensation Table due to rounding to the nearest whole share. |
(5) | The performance period for the 2015-2016 LTIP was July 1, 2014 through June 30, 2016. As a result, Mr. Smith forfeited any amount he previously received under the 2015-2016 LTIP. Mr. Smith ceased being the CFO on September 7, 2015, and his employment with the Company terminated on September 30, 2015. |
2016-2018 LTIP
During the course of our stockholder engagement efforts, we heard several recurring themes relating to the design of our LTI Program including that the metrics of the LTI Program overlapped with those of the Annual Incentive Plan in that both net sales and EBITDA were performance measures of both plans, and, as a result, NEOs were being compensated under both plans for the same performance. Stockholders also expressed concern that the focus on net revenue and EBITDA was further exacerbated by the fact that the performance period of the LTI Program was two years, only one year longer than the Annual Incentive Plan. Stockholders also communicated that the Company should consider adopting a relative performance measure so that stockholders could evaluate the Company’s performance against its peers. In response to these recurring themes, and with the assistance of Aon Hewitt, the Company redesigned its LTI Program (commencing with the 2016-2018 LTIP) to provide performance-based awards only, which may be earned over a longer three-year performance period. In addition, the Compensation Committee adopted relative Total Shareholder Return (“TSR”) and net sales as the performance measures for determining individual payouts. The relative TSR measure was adopted based upon the feedback we had received from stockholders and enables our stockholders to assess stockholder returns relative to our peers. The net sales measure was designed to reflect our long-term strategic plan of continually growing top-line net sales year over year. Given the importance our stockholders place on net sales growth, the Compensation Committee retained it as a performance measure. For the 2016-2018 LTIP, the Compensation Committee assigned a 50% weighting for the relative TSR measure and a 50% weighting for the net sales measure. Participants in the LTI Program include our executive officers, including the NEOs, and certain other key employees.
162(m) Funding Target
For the 2016-2018 LTIP, the Compensation Committee established an overall performance goal of attaining a three-year average operating income5, of $354.5 million over the performance period of July 1, 2015 through June 30, 2018, which must be met for a NEO’s 2016-2018 LTIP to be funded under Section 162(m) of the Code. This overall performance goal must be met in order for the 2016-2018 LTIP to be funded at the maximum award level.
132
Award Levels, Performance Measures and Targets
For the 2016-2018 LTIP, each NEO had a threshold, target and maximum as a percentage of base salary as follows:
Name | Base Salary | LTIP Threshold Award (% of Base Salary) | LTIP Target Award (% of Base Salary) | LTIP Maximum Award (% of Base Salary)(1) |
Irwin D. Simon | $1,905,000 | 350% | 700% | 1050% |
John Carroll | $713,000 | 125% | 250% | 375% |
Pasquale Conte | $500,000 | 50% | 100% | 150% |
Denise M. Faltischek | $600,000 | 150% | 300% | 450% |
(1) | While the maximum award as a percentage of base salary has increased, the threshold award as a percentage of base salary has decreased compared to the 2015-2016 LTIP. |
The Compensation Committee makes its determination for each individual NEO award based on the achievement of the pre-determined performance measures of Relative TSR and net sales as described below. The threshold, target and maximum awards were set working in consultation with Aon Hewitt. Such awards may be paid in cash and/or full value shares. As we have not completed the performance period, therefore, individual awards have not yet been determined under this plan.
Equity Awards
In connection with the Relative TSR portion of the 2016-2018 LTIP, the NEOs each received a grant of performance-based restricted stock units in connection with the 50% of his or her award. Each performance-based restricted stock unit represents a right to receive one share of common stock of the Company on the settlement date of the award provided that the Company has achieved the requisite performance. The performance is based upon the Company’s Relative TSR in terms of percentile ranking as compared to the S&P Food & Beverage Select Industry peer group over the performance period beginning on July 1, 2015 and ending on June 30, 2018 in accordance with the schedule below:
Relative Total Shareholder Return Ranking over Performance Period | Award % Level |
0-24th Percentile | 0% |
25th - 49th Percentile | 50% |
50th - 74th Percentile | 100% |
75th Percentile or Higher | 150% |
The actual award percentage level shall be interpolated for performance above 25th Percentile, and increased by two (2) percentage points for every one (1) percentile point of improvement in Relative TSR. The maximum award percentage level that may be achieved shall not exceed 150% for a Relative TSR of 75th percentile and above. There shall be no awards for Relative TSR at 24% or below. If the Company’s absolute TSR over the performance period is negative, the awards shall be capped at target regardless of whether the Company percentile rank is greater.
______________
5 Under the terms of the plan adopted by the Compensation Committee, operating income is adjusted for the impact of non-cash compensation, currency fluctuations, impairment of long-lived assets, restructuring, integration and acquisition charges and other non-recurring items which may have been incurred during the performance period.
133
The grant date fair value of the performance-based restricted stock units issued was estimated based on a Monte Carlo simulation that calculates the likelihood of goal attainment. A Monte-Carlo simulation is a generally accepted statistical technique used to simulate a range of possible future unit prices for the Company and each member of the S&P Food & Beverage Select Industry peer group over the performance period.
Name | Annual Base Salary | LTIP Target Percentage | LTIP Target Dollars | 50% of LTIP Target Dollars | Number of Units | Grant Date Fair Value | |||||||
Irwin D. Simon.................................. | $1,905,000 | 700% | $13,335,000 | $6,667,500 | 162,345 | $2,378,354 | |||||||
John Carroll....................................... | $713,000 | 250% | $1,782,500 | $891,250 | 21,701 | $317,920 | |||||||
Pasquale Conte.................................. | $500,000 | 100% | $500,000 | $250,000 | 6,087 | $89,175 | |||||||
Denise M. Faltischek......................... | $600,000 | 300% | $1,800,000 | $900,000 | 21,914 | $321,040 | |||||||
Other Compensation and Perquisites
Our NEOs are eligible for the same level and offering of benefits that we make available to other employees, including our 401(k) plan, health care, dental and vision plans, life insurance plans and other employee benefit programs. In addition to the standard benefits offered to other employees, we reimburse Mr. Simon for expenses for health, prescription, dental and vision not covered by our insurance plan that are incurred by him and his dependents. In addition, in accordance with his employment agreement, we reimburse Mr. Simon for a portion of the premium associated with his life insurance policy and provide long-term disability coverage for the benefit of Mr. Simon and long-term care coverage for the benefit of Mr. Simon and his spouse with annual premiums of not more than $60,000, in the aggregate. We do not have any defined benefit pension plans or executive supplemental retirement programs.
We also provide either an automobile perquisite or a car allowance for each of the NEOs. In addition, we also provide Mr. Simon with the occasional use of a Company provided membership-based private aviation service and club dues. We believe the costs of these benefits constitute only a small portion of each NEO’s total compensation and are consistent with benefits offered by companies with whom we compete for talent for purposes of recruitment and retention. For additional information regarding other compensation and perquisites, see “Executive Compensation Tables-Summary Compensation Table.”
Impact of Tax Treatment
Section 162(m) of the Internal Revenue Code places a limit of $1 million on the amount of compensation that we may deduct in any one year with respect to each of our most highly paid executive officers (other than the chief financial officer). Although the Compensation Committee considers whether or not a compensation program would be subject to the Section 162(m) limit, in order to maintain flexibility in compensating executive officers in a manner designed to promote corporate goals, the Committee has not adopted a policy that all compensation must be tax deductible.
Severance and Change-in-Control Agreements
Mr. Simon’s employment agreement provides for severance in the event his employment is terminated for any reason (except if such employment is terminated with cause) or if his employment agreement is terminated for “non-renewal”. The severance benefit to Mr. Simon in connection with the non-renewal of his employment agreement has been in such agreement since 2003.
In addition, we have entered into change of control agreements with each of the other NEOs which provide for severance in the event of a change of control as defined in the change of control agreement. In addition, each of the other NEOs will receive severance in the event his or her employment is terminated without cause. The restricted stock agreements entered into with our NEOs provide for the immediate vesting of such stock grants upon a change in control. For a complete description of these severance and change in control agreements, see “Potential Payments Upon Termination or Change-in-Control” below.
The Compensation Committee believes that severance and change-in-control benefits are important for attracting and retaining executive talent and help to ensure that NEOs can remain focused during periods of uncertainty and neutralize the potential conflict of our key executives when faced with a potential change-in-control.
134
Executive Stock Ownership Guidelines
To further align the interests of senior management and stockholders, the Compensation Committee has adopted stock ownership guidelines that require key members of the Company’s management team to own minimum amounts of the Company’s common stock. The guidelines for senior management are set forth below:
Officer Level | Ownership Target | |
Chief Executive Officer................................................................................................................. | 6 times annual base salary | |
Executive Vice Presidents.............................................................................................................. | 3 times annual base salary | |
Other Executive Officers and Segment Leaders............................................................................ | 2 times annual base salary | |
All other LTIP participants............................................................................................................. | 1 times annual base salary | |
Members of management subject to the guidelines have until five years after appointment, or the implementation of the guidelines, whichever is later, to achieve the ownership target. All covered employees are currently in compliance with the guidelines or are expected to meet the stock ownership guidelines within the five-year period.
Compensation Recoupment Policy
We have adopted a clawback provision in connection with equity awards. The clawback provision provides that, if the Company is required to prepare an accounting restatement to correct an accounting error included in a report on Form 10-Q or 10-K caused by the misconduct of an employee, the employee shall return to the Company, or forfeit if not paid, any award arising out of the misconduct for or during such restated period.
135
Executive Compensation Tables
The following table sets forth the compensation paid by us for services rendered during the fiscal years ended June 30, 2016, June 30, 2015 and June 30, 2014 to or for the accounts of our NEOs:
Summary Compensation Table
Name and Principal Position | Fiscal Year | Salary | Bonus | Stock Awards (1) | Non-equity Incentive Plan Compensation | All Other Compensation (4) | Total | |||||||
Irwin D. Simon . . . . . . . . . . . Founder, President, CEO and Chairman of the Board | 2016 | $1,905,000 | $— | $2,378,354 | $— | $271,944 | $4,555,298 | |||||||
2015 | $1,850,000 | $— | $8,787,355 | $5,565,725 | $261,362 | $16,464,442 | ||||||||
2014 | $1,664,000 | $400,000 | $4,863,462 | $4,160,000 | $273,463 | $11,360,925 | ||||||||
John Carroll . . . . . . . . . . . . . . Former Executive Vice President and CEO - Hain Celestial North America | 2016 | $713,000 | $— | $317,920 | $— | $69,704 | $1,100,624 | |||||||
2015 | $693,000 | $— | $1,119,854 | $711,711 | $57,111 | $2,581,676 | ||||||||
2014 | $625,000 | $200,000 | $1,460,411 | $1,250,000 | $47,416 | $3,582,827 | ||||||||
Denise M. Faltischek . . . . . . Executive Vice President and General Counsel, Chief Compliance Officer and Corporate Secretary | 2016 | $600,000 | $— | $321,040 | $— | $13,003 | $934,043 | |||||||
2015 | $550,000 | $— | $1,168,760 | $550,000 | $12,940 | $2,281,700 | ||||||||
2014 | $450,000 | $115,000 | $648,725 | $360,000 | $12,443 | $1,586,168 | ||||||||
Pasquale Conte (2). . . . . . . . . . Executive Vice President and Chief Financial Officer | 2016 | $500,000 | $— | $89,175 | $— | $9,339 | $598,514 | |||||||
Stephen J. Smith (3) . . . . . . . . Former Executive Vice President and Chief Financial Officer | 2016 | $127,501 | $— | $— | $— | $1,151,194 | $1,278,695 | |||||||
2015 | $510,000 | $— | $280,528 | $— | $26,040 | $816,568 | ||||||||
2014 | $412,500 | $— | $672,239 | $495,000 | $19,997 | $1,599,736 | ||||||||
____________________
(1) With respect to the grants made in fiscal year 2016, the amounts reported represent the grant date fair value of the performance units issued on December 29, 2015, which were estimated based on a Monte Carlo simulation that calculate the likelihood of goal attainment and the probable outcome of the performance conditions. A Monte-Carlo simulation is a generally accepted statistical technique used to simulate a range of possible future unit prices for the Company and each member of the S&P Food & Beverage Select Industry peer group over the performance period. If the highest level of performance conditions is achieved, the value of the award would be $10,001,284 for Mr. Simon, $1,336,890 for Mr. Carroll, $1,350,012 for Ms. Faltischek and $374,990 for Mr. Conte. These amounts were calculated based on the maximum number of units that can be awarded and the $41.07 stock price on the date of grant. With respect to grants made in fiscal years 2014 and 2015, the amounts reported represent the aggregate grant date fair value of the stock awards granted with respect to the fiscal year and calculated in accordance with ASC Topic 718.
(2) | Mr. Conte was promoted to Executive Vice President and Chief Financial Officer on September 8, 2015. |
(3) | Mr. Smith ceased being the Chief Financial Officer on September 7, 2015, and his employment with the Company terminated on September 30, 2015. |
(4) | The table below details the components of this column: |
136
Name | Year | 401(k) Plan Match (a) | Unused Vacation (b) | Life and Other Insurance Premiums (c) | Car Allowance (d) | Supplemental Medical Benefit Premiums (e) | Personal Use Company Aircraft (f) | Other Perquisites (g) | Severance (h) | Total | ||||||||||
Irwin D. Simon | 2016 | $4,800 | $102,577 | $16,124 | $69,378 | $43,574 | $26,491 | $9,000 | $— | $271,944 | ||||||||||
John Carroll . . . . . . . . . . . . . | 2016 | $4,800 | $— | $1,003 | $63,901 | $— | $— | $— | $— | $69,704 | ||||||||||
Denise M. Faltischek . . . . . . | 2016 | $3,600 | $— | $1,003 | $8,400 | $— | $— | $— | $— | $13,003 | ||||||||||
Pasquale Conte . . . . . . . . . .. | 2016 | $— | $— | $939 | $8,400 | $— | $— | $— | $— | $9,339 | ||||||||||
Stephen J. Smith . . . . . . . . . | 2016 | $— | $23,538 | $251 | $2,100 | $— | $— | $— | $1,125,305 | $1,151,194 | ||||||||||
____________________
(a) | The Company’s 401(k) match is calculated based upon the plan year, which is a calendar year. The amounts provided for each of the above NEOs in 2016 represent a matching contribution by the Company on behalf of such officer under the Company’s 401(k) Plan for the 2015 plan year (January 1 through December 31, 2015). |
(b) | Represents an amount paid by the Company to Mr. Simon for his unused vacation days during the 2015 calendar year pursuant to the terms of his employment agreement. Represents the amount the Company paid to Mr. Smith for unused vacation in connection with his termination in accordance with Company policy. |
(c) | Represents an amount paid by the Company on behalf of employees for life, accidental death and dismemberment and long-term disability insurance. Pursuant to the terms of his employment agreement, Mr. Simon also receives an amount equal to $3,394 as reimbursement for 25% of the total premium for his life insurance policy, and long term care coverage for his spouse and him. |
(d) | Represents the aggregate incremental cost to the Company of providing Mr. Simon and Mr. Carroll with the use of a Company-owned vehicle. The calculation includes the book value of the vehicle, and the insurance, gas, tolls, parking, maintenance, registration and inspection fees and costs paid by the Company. With respect to Ms. Faltischek, Mr. Conte and Mr. Smith, the amount represents a car allowance. |
(e) | Represents the reimbursement of medical expenses for Mr. Simon. Mr. Simon and his dependents for any out-of-pocket medical expenses. |
(f) | Represents the incremental cost to the Company in connection with personal use by Mr. Simon of Company provided membership-based private aviation service in the amount of $26,491. |
(g) | Represents club dues. |
(h) | Represents the amount of severance paid to Mr. Smith during fiscal year 2016 in connection with his separation from the Company. |
137
Fiscal Year 2016 Grants of Plan-Based Awards
Grants of Plan-Based Awards | ||||||||||||||||||
Estimated Future Payouts Under Non-Equity Incentive Plan Awards (1) | Estimated Future Payouts Under Equity Incentive Plan Awards (2) | |||||||||||||||||
Name | Grant Date | Threshold ($) | Target ($) | Maximum ($) | Threshold ($) | Target ($) | Maximum ($) | All other stock awards: Number of shares of stock or units (#) (3) | Grant date fair value of stock and option awards (4) | |||||||||
Irwin D. Simon | n/a | $952,500 | $1,905,000 | $7,620,000 | $— | $— | $— | — | $— | |||||||||
12/29/2015 | $— | $— | $— | $6,667,500 | $13,335,000 | $20,002,500 | — | $2,378,354 | ||||||||||
John Carroll | n/a | $356,500 | $713,000 | $1,426,000 | $— | $— | $— | — | $— | |||||||||
12/29/2015 | $— | $— | $— | $891,250 | $1,782,500 | $2,673,750 | — | $317,920 | ||||||||||
Denise M. Faltischek | n/a | $300,000 | $600,000 | $600,000 | $— | $— | $— | — | $321,040 | |||||||||
12/29/2015 | $— | $900,000 | $1,800,000 | $2,700,000 | ||||||||||||||
Pasquale Conte | n/a | $250,000 | $500,000 | $500,000 | $— | $— | $— | — | $— | |||||||||
12/29/2015 | $— | $— | $— | $250,000 | $500,000 | $750,000 | — | $89,175 | ||||||||||
Stephen J. Smith (4) | n/a | $— | $— | $— | $— | $— | $— | — | $— | |||||||||
______________
(1) | The amounts shown as Estimated Future Payouts Under Non-Equity Incentive Plan Awards reflect the threshold, target and maximum amounts that may be earned by each individual during fiscal year 2016 under the Annual Incentive Plan. For more information, see “Compensation Discussion and Analysis-Annual Incentive Plan,” page 126. |
(2) | The amounts reflected in Estimated Future Payouts Under Equity Incentive Plan Awards columns reflect the threshold, target and maximum amounts that could be paid to each NEO under the 2016-2018 LTIP. The Compensation Committee has the discretion to adjust these amounts based upon its determination at the end of the 2016-2018 LTIP performance period. |
(3) | The amounts in the Grant Date Fair Value of Stock and Option Awards column were determined in accordance ASC Topic 718 and reflect the grant date fair value of the performance units issued on December 29, 2015 in connection with the adoption of the 2016-2018 Long Term Incentive Plan, which were estimated based on a Monte Carlo simulation that calculates the likelihood of goal attainment and the probable outcome of the performance conditions. Assumptions made in the calculation of these amounts are included in Note 13 to the Consolidated Financial Statements contained in the Company’s Annual Report on Form 10-K for the fiscal year ended June 30, 2016. |
(4) | As Mr. Smith was not a participant in the fiscal year 2016 Annual Incentive Plan and the 2016-2018 LTIP, he did not receive any plan-based awards in fiscal year 2016. |
138
Outstanding Equity Awards at Fiscal Year 2016 Year End
Option Awards | Stock Awards | ||||||||||
Name | Number of Securities Underlying Unexercised Options (#) - Exercisable | Number of Securities Underlying Unexercised Options (#) - Unexercisable | Equity Incentive Plan Awards: Number of Securities Underlying Unexercised Unearned Options (#) | Options Exercise Price ($) | Options Expiration Date (2) | Number of Shares or Units of Stock that have not Vested (#) | Market Value of Shares or Units of Stock that have not Vested ($) (1) | Equity Incentive Plan Awards: Number of Unearned Shares, Units or Other Rights that have not Vested (#) | Equity Incentive Plan Awards: Market or Payout Value of Unearned Shares, Units or Other Rights that have not Vested ($) (1) | ||
Irwin D. Simon | 219,666 | — | — | $9.10 | 11/19/2016 | — | — | — | — | ||
— | — | — | — | — | 480,000 | (3) | $23,880,000 | — | $— | ||
— | — | — | — | — | 82,406 | (4) | $4,099,699 | — | $— | ||
— | — | — | — | — | — | $— | 223,349 | (5) | $11,111,613 | ||
John Carroll | — | — | — | — | — | 10,777 | (6) | $536,156 | — | $— | |
— | — | — | — | — | — | $— | 29,863 | (7) | $1,485,684 | ||
Denise M. Faltischek | — | — | — | — | — | 9,304 | (8) | $462,874 | — | $— | |
— | — | — | — | — | — | $— | 29,688 | (9) | $1,476,978 | ||
Pasquale Conte | — | — | — | — | — | 1,550 | (10) | $77,113 | — | $— | |
— | — | — | — | — | — | $— | 7,361 | (11) | $366,210 | ||
Stephen J. Smith | |||||||||||
___________
(1) | The market value is based on the closing market price of the Company’s common stock on June 30, 2016, or $49.75 per share. |
(2) | On November 18, 2016, in connection with Mr. Simon's stock option exercise of 219,666 shares, the Company retained 145,426 shares to satisfy the exercise price and tax withholding obligations of Mr. Simon in connection with the exercise of such options consistent with the Company's practice for satisfying such U.S. withholding obligations. Mr. Simon retained the remaining shares. |
(3) | Shares relate to a special grant of restricted stock to Mr. Simon that are scheduled to vest in equal increments annually through October 22, 2019. |
(4) | 20,334 shares will vest on each of November 20, 2016 and November 20, 2017, and 20,869 shares will vest on each of October 5, 2016 and October 5, 2017. |
(5) | 61,004 shares and 162,345 shares will vest on November 20, 2017 and June 30, 2018, respectively, provided the Company achieves certain performance measures which were approved by the Compensation Committee. |
(6) | 2,720 shares will vest on each of November 20, 2016 and November 20, 2017 and 2,669 shares and 2,668 shares will vest on each of October 5, 2016 and October 5, 2017, respectively. |
(7) | 8,162 shares and 21,701 shares will vest on November 20, 2017 and June 30, 2018, respectively, provided the Company achieves certain performance measures which were approved by the Compensation Committee. |
(8) | 2,590 shares will vest on each of November 20, 2016 and November 20, 2017 and 2,062 shares will vest on each of October 5, 2016 and October 5, 2017. |
(9) | 7,774 shares and 21,914 shares will vest on November 20, 2017 and June 30, 2018, respectively, provided the Company achieves certain performance measures which were approved by the Compensation Committee. |
(10) | 424 shares will vest on each of November 20, 2016 and November 20, 2017 and 702 shares will vest on May 21, 2017. |
(11) | 1,274 shares and 6,087 shares will vest on November 20, 2017 and June 30, 2018, respectively, provided the Company achieves certain performance measures which were approved by the Compensation Committee. |
139
Fiscal Year 2016 Option Exercises and Stock Vested
Option Exercises and Stock Vested | ||||||||
Option Awards | Stock Awards | |||||||
Name | Number of Shares Acquired on Exercise (#) | Value Realized on Exercise ($) (1) | Number of Shares Acquired on Vesting (#) | Value Realized on Vesting ($) (2) | ||||
Irwin D. Simon. . . . . . . . . . . . . . . . . | 600,000 | $16,950,000 | 273,568 | (3) | $13,379,273 | |||
John Carroll . . . . . . . . . . . . . . . . . . . | 298,586 | $9,978,744 | 22,464 | (4) | $980,203 | |||
Denise M. Faltischek . . . . . . . . . . . . | — | $— | 15,781 | (5) | $726,869 | |||
Pasquale Conte . . . . . . . . . . . . . . . . . | — | $— | 5,731 | (6) | $265,985 | |||
Stephen J. Smith . . . . . . . . . . . . . . . . . | — | $— | 6,916 | (7) | $356,866 | |||
_______________________________
(1) | Represents the aggregate value realized with respect to all options to purchase Company common stock upon exercise during the fiscal year ended June 30, 2016. The value realized upon exercise is calculated by determining the difference between closing price of the Company’s common stock on the exercise date and the exercise price of the options. |
(2) | Represents the aggregate value realized with respect to all shares of common stock that have vested during the fiscal year ended June 30, 2016. The value realized in connection with each share on vesting is calculated by multiplying the number of shares of common stock that have vested by the closing price of the Company’s common stock on the vesting date. |
(3) | For Mr. Simon, the shares he acquired above vested as follows: (i) on August 27, 2015, 40,000 shares vested and the closing price of the Company’s common stock on such date was $61.96; (ii) on September 28, 2015, 40,000 shares vested and the closing price of the Company’s common stock on such date was $52.17; (iii ) on October 5, 2015, he received 43,352 fully vested shares and the closing price of the Company’s common stock on such date was $53.34; (iv) on October 22, 2015, 40,000 shares vested and the closing price of the Company’s common stock on such date was $52.09; (v) on November 19, 2015, 49,880 shares vested and the closing price of the Company’s common stock on such date was $41.02; (vi) on November 20, 2015, 20,336 shares vested and the closing price of the Company’s common stock on such date was $41.07; and (vii) on December 13, 2015, 40,000 shares vested and the closing price of the Company’s common stock on such date was $38.42. |
(4) | For Mr. Carroll, the shares he acquired above vested as follows: (i) on October 5, 2015, he received 4,756 fully vested shares and the closing price of the Company’s common stock on such date was $53.34; (ii) on November 19, 2015, 14,988 shares vested and the closing price of the Company’s common stock on such date was $41.02; and (iii) on November 20, 2015, 2,720 shares vested and the closing price of the Company’s common stock on such date was $41.07. |
(5) | For Ms. Faltischek, the shares she acquired above vested as follows: (i) on October 5, 2015, she received 6,445 fully vested shares and the closing price of the Company’s common stock on such date was $53.34; (ii) on November 19, 2015, 6,744 shares vested and the closing price of the Company’s common stock on such date was $41.02; and (iii) on November 20, 2015, 2,592 shares vested and the closing price of the Company’s common stock on such date was $41.07. |
(6) | For Mr. Conte, the shares he acquired above vested as follows: (i) on October 5, 2015, he received 2,087 fully vested shares and the closing price of the Company’s common stock on such date was $53.34; (ii) on November 19, 2015, 2,518 shares vested and the closing price of the Company’s common stock on such date was $41.02; (iii) on November 20, 2015, 424 shares vested and the closing price of the Company’s common stock on such date was $41.07; and (iv) on May 21, 2015, 702 shares vested and the closing price of the Company’s common stock on such date was $48.38. |
(7) | For Mr. Smith, the shares he acquired above vested as follows: on September 30, 2015, 6,916 shares vested and the closing price of the Company’s common stock on such date was $51.60. |
Potential Payments upon Termination or Change-in-Control
We believe that severance and change-in-control benefits are important for attracting and retaining executive talent and help to ensure that executive officers can remain focused during periods of uncertainty and neutralize the potential conflict of our key executives when faced with a potential change-in-control. These are particularly important in an environment where merger and acquisition activity is high.
Irwin D. Simon
In the event that Mr. Simon is terminated without cause, due to disability, he resigns for good reason, or he resigns not for good reason, he will be entitled to: (i) any base salary earned, but unpaid, for services rendered to the Company prior to the date of termination; (ii) three years’ annual salary and three years’ average annual bonus paid to Mr. Simon over the two immediately preceding fiscal years; (iii) his accrued annual bonus through the date of termination; (iv) three times the Long Term Incentive Award paid to Mr. Simon over the preceding fiscal year; (v) all options and other stock awards previously granted, but unvested, which will become fully vested; and (vi) continued participation in all of the Company’s medical, dental and vision plans until the third anniversary of his termination. If Mr. Simon’s employment had terminated on June 30, 2016, without cause, due to disability, he resigned for good reason, or he resigned not for good reason, Mr. Simon would have been entitled to severance and
140
other benefits having a value of approximately $80,150,00. Mr. Simon will only be entitled to such severance and other benefits in the case of termination not for good reason if he agrees to serve as Non-Executive Chairman of the Board during the three-year period following the termination not for good reason (such service being subject to Mr. Simon being appointed or elected Non-Executive Chairman of the Board and, if Mr. Simon is not so appointed or elected, Mr. Simon will provide consulting services of a similar nature and extent, to the extent the Company shall reasonably request).
Pursuant to Mr. Simon’s employment agreement: (i) a “termination without cause” means any termination of Mr. Simon’s employment other than a termination for cause (meaning a termination due to conviction of a felony or crime of moral turpitude or a willful and continued failure to perform material duties) or termination due to disability; (ii) a “termination for good reason” means a termination of his employment by Mr. Simon following a diminution of his position, duties and responsibilities, the removal of Mr. Simon from, or failure to re-elect Mr. Simon as, the Chairman of the Board or as CEO, a reduction in his base salary or following a change-in-control, Mr. Simon not being Chairman of the Board or CEO of any ultimate parent company resulting from the change-in-control or any material reduction in compensation opportunity (including achievability) or benefits provided under any compensation, incentive, employee benefit or welfare plan or program of the Company or any subsidiary in which Mr. Simon participated before the change in control; and (iii) a “termination not for good reason” means any termination of Mr. Simon’s employment by Mr. Simon other than a termination for good reason or a termination due to Mr. Simon’s disability or death.
A change-in-control is defined generally as one of the following events:
The acquisition by a person of beneficial ownership of more than 50% of the total voting power of the outstanding stock of the Company, however if any one person or group is considered to own more than 50% of the total fair market value or total voting power of the capital stock of the Company, the acquisition of additional stock by the same person or persons acting as a group is not considered to cause a change-in-control;
A majority of our Board of Directors is replaced during any 12-month period by directors whose appointment or election is not endorsed by a majority of the members of the Board prior to the date of the appointment or election;
The consummation of a merger, consolidation, recapitalization or reorganization of the Company or a subsidiary, reverse split of any class of voting stock, or an acquisition of securities or assets by the Company or a subsidiary, unless our stockholders prior to such event beneficially own more than 60% of the voting stock of the surviving or transferee entity in substantially the same proportions as their prior ownership; or
The consummation of a sale or disposition by the Company of all or substantially all of the Company’s assets.
In the event that Mr. Simon’s employment terminates due to death, he will be entitled to: (i) any base salary earned, but unpaid, for services rendered to the Company prior to the date of termination; (ii) two years’ annual salary and two years’ average annual bonus paid to Mr. Simon over the two immediately preceding fiscal years; (iii) his accrued annual bonus through the date of termination; (iv) two times the Long Term Incentive Award paid to Mr. Simon over the preceding fiscal year; (v) all options and other stock awards previously granted, but unvested, which will become fully vested; and (vi) continued participation of his dependents in all of the Company’s medical, dental and vision plans until the second anniversary of his termination. If Mr. Simon’s employment had terminated due to his death as of June 30, 2016, he would have been entitled to severance and other benefits having a value of approximately $66,537,000.
In the event that Mr. Simon’s employment terminates for cause he will be entitled to any base salary earned, but unpaid, for services rendered to the Company prior to the date of termination, and any amounts which are vested at the time of termination.
If Mr. Simon’s contract is not renewed at the end of its term on June 30, 2019 on equal or more favorable terms, Mr. Simon will be entitled to: (i) any base salary earned, but unpaid, for services rendered to the Company prior to the date of termination; (ii) three years’ annual salary and three years’ average annual bonus paid to Mr. Simon over the two immediately preceding fiscal years; (iii) three times the Long Term Incentive Award paid to Mr. Simon over the preceding fiscal year; (iv) all options and other stock awards previously granted, but unvested, which will become fully vested and (v) continued participation in all of the Company’s medical, dental and vision plans until the third anniversary of his termination. In this instance, Mr. Simon would be entitled to receive approximately $80,150,000.
Mr. Simon has also agreed not to compete with us for a period of three years following the termination of his employment, if such termination was a “termination without cause”, a “termination for good reason,” a “termination not for good reason,” or a non-renewal of Mr. Simon’s contract. Mr. Simon has agreed to customary provisions regarding confidentiality and proprietary rights.
141
Other NEOs
We have entered into a change-in-control agreement with Mr. Carroll that provides that in the event that, following a change-in-control of the Company, he is terminated without cause, experiences a diminution in duties or forced relocation, or he terminates his employment for any reason within 13 months of a change-in-control, he will be entitled to terminate his employment and receive: (i) three times the highest annual base salary paid to him during the thirty-six month period immediately preceding the month in which the change-in-control occurs; (ii) three times the highest annual bonus paid to him during the thirty-six month period immediately preceding the month in which the change-in-control occurs; (iii) all unpaid accrued vacation through the date of termination; (iv) up to three years’ benefits continuation; (v) immediate vesting of all outstanding options and reimbursement of certain tax obligations; (vi) the automobile allowance and other automobile benefits he was receiving immediately prior to the change-in-control for a period of twelve months following the date of termination and (vii) the cost of outplacement services.
Mr. Conte and Ms. Faltischek had a change-in-control agreement which provides for severance only if he or she was terminated without cause or experiences a diminution in duties or forced relocation following a change-in-control. For Mr. Conte, severance is equal to one times his annual base salary and one times the average annual bonus paid to him during the thirty-six month period prior to the change-in-control and up to one years of benefits continuation. For Ms. Faltischek, severance is equal to three times her annual base salary and three times the average annual bonus paid to her during the thirty-six month period prior to the change-in-control and up to three years of benefits continuation. In addition to the change in control agreements, our restricted stock agreements (including those with Messrs. Carroll and Conte and Ms. Faltischek) provide for immediate vesting of such stock grants upon a change-in-control.
A change-in-control is defined generally as one of the following events:
The acquisition by a person of beneficial ownership of more than 50% of the total voting power of the outstanding stock of the Company;
A majority of our Board of Directors is replaced by directors whose appointment or election is not endorsed by two-thirds of the members of the Board prior to the date of the appointment or election;
A reorganization, merger or consolidation, or sale or other disposition of all or substantially all of the assets of the Company unless (i) all or substantially all, of our stockholders prior to such event beneficially own more than 50% of the voting stock of the surviving entity in substantially the same proportions as their prior ownership, (ii) no person (other than the Company or the surviving entity) beneficially owns 50% or more of the combined voting power of the outstanding stock of the surviving entity and (iii) at least a majority of the members of the board of directors of the surviving entity were members of our Board of Directors; or
Stockholders approve (i) sale or disposition of all or substantially all of the assets of the Company (other than to a subsidiary) or (ii) a complete liquidation or dissolution of the Company provided, that if the agreement would cause the executive to incur an additional tax, penalty or interest under Section 409A of the Code, the Company and the executive will use reasonable best efforts to reform such provision.
If any payments or benefits to be provided to Mr. Carroll in connection with a change-in-control are subject to the excise tax imposed under Section 4999 of the United States Internal Revenue Code, he is entitled to an additional “gross-up” payment so that the net amount retained by him is equal to such payments and benefits. Mr. Conte and Ms. Faltischek are not entitled to such a “gross up” payment pursuant to the terms of their change-in-control agreements.
If Mr. Carroll’s employment had terminated on June 30, 2016 in accordance with the change-in-control agreement, Mr. Carroll would have been entitled to severance having a value of approximately $8,080,000. If Ms. Faltischek’s employment had terminated on June 30, 2016 in accordance with the change-in-control agreement, Ms. Faltischek would have been entitled to severance having a value of approximately $4,744,000. If Mr. Conte’s employment had terminated on June 30, 2016 in accordance with the change-in-control agreement, Mr. Conte would have been entitled to severance having a value of approximately $1,032,000. The amounts set forth in the preceding sentences do not include the cost of outplacement services.
Mr. Carroll and Ms. Faltischek each have the right to receive one year of severance in the event of a termination without cause, which is not in connection with a change-in-control.
Compensation of Directors
Each year, our Board of Directors and the Compensation Committee of the Board review and determine compensation for our non-employee directors. The Compensation Committee and our Board believe that compensation should fairly compensate
142
non-employee directors for work required in a company of our size and scope. Mr. Simon did not receive any compensation for his Board service. As detailed below, our non-employee directors receive cash compensation as well as restricted stock.
Name | Fees Earned or Paid in Cash (1) | Stock Awards (2) (3) | Total | |||
Richard C. Berke | $63,000 | $169,413 | $232,413 | |||
Andrew R. Heyer | $73,000 | $169,413 | $242,413 | |||
Raymond W. Kelly | $58,000 | $169,413 | $227,413 | |||
Roger Meltzer | $53,000 | $169,413 | $222,413 | |||
Scott O’Neil | $68,000 | $169,413 | $237,413 | |||
Adrianne Shapira | $63,000 | $169,413 | $232,413 | |||
Lawrence S. Zilavy | $68,000 | $169,413 | $237,413 | |||
____________
(1) | On November 19, 2015, the Compensation Committee determined that each non-employee director will continue to receive cash compensation of $53,000 per annum. In addition, the chairperson of the Audit Committee will receive additional cash compensation of $20,000 per annum, the chairperson of the Compensation Committee will receive additional cash compensation of $15,000 per annum, the chairperson of the Corporate Governance and Nominating Committee will receive additional cash compensation of $10,000 per annum, and each committee member, excluding the chairperson, will receive additional cash compensation of $5,000 per annum for their increased responsibilities. |
(2) | On November 19, 2015, the Compensation Committee recommended and the Board approved a grant of 4,130 shares of restricted common stock to each of the Company’s non-employee directors for service as a director. These shares will vest annually in equal installments over three years. The grant date fair value of these awards computed in accordance with Accounting Standards Codification (“ASC”) Topic 718 was $169,413. Please see Note 13 to the Consolidated Financial Statements contained in the Company’s Annual Report on Form 10-K for the fiscal year ended June 30, 2016 for more information. |
(3) | The following table shows the aggregate number of stock awards outstanding as of June 30, 2016: |
Name | Unvested Restricted Common Stock | |
Richard C. Berke........................................................................... | 7,662 | |
Andrew R. Heyer........................................................................... | 7,662 | |
Raymond W. Kelly......................................................................... | 4,130 | |
Roger Meltzer................................................................................. | 7,662 | |
Scott O’Neil................................................................................... | 7,662 | |
Adrianne Shapira........................................................................... | 6,330 | |
Lawrence S. Zilavy........................................................................ | 7,662 | |
143
Director Stock Ownership Guidelines
The Board strongly believes that the directors should have a meaningful ownership interest in the Company and, to that end, has implemented stock ownership guidelines for our directors. The ownership guidelines require directors to own, at a minimum, the value of five times the annual cash compensation (excluding additional cash compensation to committee chairpersons) in shares of Hain Celestial common stock within the later of five years after a director is first elected to the Board or five years after the implementation of the guidelines. All directors are currently in compliance with the guidelines or are expected to meet the stock ownership guidelines within the five-year period.
Board Role in Risk Oversight
Management is responsible for the Company’s day-to-day risk management, and the Board’s role is to engage in informed oversight of, and provide direction with respect to, such risk management. In its oversight role regarding risk management, the Board focuses on understanding the nature of our enterprise risks, including risk in our operations, finances and the strategic direction of the Company and reviews and approves the Company’s Annual Operating Plan. The Annual Operating Plan addresses, among other things, the risks and opportunities facing the Company. The Board receives regular updates regarding the Company’s progress against its Annual Operating Plan and reviews quarterly updates regarding the related risks and opportunities. The Board maintains control over significant transactions and decisions that require Board approval for certain corporate actions (including material acquisitions or divestitures).
The Board has delegated certain risk management oversight responsibilities to the Audit Committee and the Compensation Committee.
As part of its responsibilities as set forth in its charter, the Audit Committee is responsible for discussing with management the Company’s policies and guidelines regarding risk assessment and risk management as well as the Company’s major financial risk exposures and the steps management has taken to monitor and control those exposures.
The Compensation Committee reviews the risk and reward structure of executive compensation plans, policies and practices. Considered in this review are program attributes deemed to help mitigate risk, including: (i) the use of multiple performance measures, balanced between short- and long-term objectives; (ii) the Compensation Committee’s application of judgment when determining individual payouts; (iii) the presence of individual payout caps under plans and programs; and (iv) the Compensation Committee’s ability to clawback incentive compensation based on erroneous financial statements caused by misconduct. Based upon this review, the compensation programs and policies are not likely to lead to excessive risk taking that could have a material adverse effect on the Company.
The Compensation Committee.
The Compensation Committee’s duties include reviewing our compensation strategy on an annual basis to ensure that such strategy supports our objectives and stockholder interests and that executive officers are rewarded in a manner consistent with such strategy. The Compensation Committee is also responsible for, among other things, reviewing and approving annual and long-term performance measures relevant to executive officer compensation, evaluating the performance of the executive officers in light of these goals and objectives, approving the annual and long-term compensation awards for our executive officers, except to the extent that such awards are equity awards, then such awards are recommended by the Compensation Committee to the independent members of the Board for their approval, and reviewing and assessing the management succession plan for the CEO and other executive officers.
Our Compensation Committee is composed of Ms. Shapira and Messrs. Berke and O’Neil, with Mr. O’Neil acting as chairperson. The Board has determined that each member of the Compensation Committee is “independent” as defined by the listing standards of Nasdaq.
Our Compensation Committee is authorized to engage an independent compensation consultant with respect to executive and director compensation matters. In 2016, the Committee engaged Aon Hewitt to conduct a peer group review, provide executive compensation market data, assist with the design and implementation of the 2016-2018 Long Term Incentive Plan and to review the Compensation Discussion & Analysis section. In addition, in 2016 management engaged Aon Hewitt to provide consulting services regarding an annual bonus plan for employees other than the named executive officers.
The Compensation Committee believes that there was no conflict of interest between Aon Hewitt and the Company during fiscal year 2016. In reaching this conclusion, the Compensation Committee considered the factors set forth in the SEC rule regarding compensation advisor independence. Specifically, the Compensation Committee has analyzed whether the work of Aon Hewitt as compensation consultant raised any conflict of interest, taking into consideration the following factors: (i) the provision of other
144
services to the Company by the consultant; (ii) the amount of fees from the Company paid to the consultant as a percentage of the consultant’s total revenue; (iii) the policies and procedures of the consultant that are designed to prevent conflicts of interest; (iv) any business or personal relationship of the consultant or the individual compensation advisors employed by the consultant with an executive officer of the Company; (v) any business or personal relationship of the individual compensation advisors with any member of the Compensation Committee; and (vi) any stock of the Company owned by the consultant or the individual compensation advisors employed by the consultant.
The Board of Directors has adopted a written charter for the Compensation Committee, a current copy of which is available on our website at www.hain.com under Investor Relations-Corporate Governance.
Compensation Committee Interlocks and Insider Participation
During fiscal year 2016, the members of the Compensation Committee were Richard C. Berke, Adrianne Shapira and Scott M. O’Neil. None of the Compensation Committee members during fiscal year 2016 had any relationship required to be disclosed under this caption pursuant to the rules of the SEC.
Compensation Committee Report
The Compensation Committee has reviewed and discussed the materials under the caption “Compensation Discussion and Analysis” included in the Company’s proxy statement with the management of the Company. Based on such review and discussion, the Compensation Committee has recommended to the Board of Directors that such Compensation Discussion and Analysis be included in the Company’s proxy statement and be incorporated by reference into the Company’s Annual Report on Form 10-K for the year ended June 30, 2016.
The Compensation Committee
Scott M. O’Neil, Chairperson
Adrianne Shapira
Richard C. Berke
The foregoing Report is not soliciting material, is not deemed filed with the SEC and is not to be incorporated by reference in any filing of the Company under the Securities Act of 1933, as amended, or the Securities Exchange Act of 1934, as amended, whether made before or after the date hereof and irrespective of any general incorporation language in any such filing.
145
Item 12. Security Ownership of Certain Beneficial Owners and Management and Related Stockholder Matters
Securities Authorized for Issuance under Equity Compensation Plans
The following table sets forth, as of June 30, 2016, certain information related to our compensation plans under which shares of the Company’s common stock may be issued.
(A) | (B) | (C) | ||||
Plan Category | Number of Securities to be Issued Upon Exercise of Outstanding Options, Warrants and Rights | Weighted-Average Exercise Price of Outstanding Options, Warrants and Rights | Number of Securities Remaining Available for Future Issuance Under Equity Compensation Plans (excluding securities reflected in column (A) (1) | |||
Equity compensation plans approved by security holders | 341,610 | $6.66 | 11,860,200 | |||
Equity compensation plans not approved by security holders | None | None | None | |||
Total | 341,610 | $6.66 | 11,860,200 | |||
_______________
(1) Of the 11,860,200 shares available for future issuance under our equity compensation plans, 11,855,910 shares are available for grant under the Amended and Restated 2002 Long Term Incentive and Stock Award Plan and 4,290 shares are available for grant under the 2000 Directors Stock Plan.
146
Security Ownership of Certain Beneficial Owners and Management.
The following table sets forth certain information with respect to the beneficial ownership of our common stock as of May 31, 2017 for (1) each of our directors, director nominees and NEOs, (2) each person who is known by us to beneficially own more than five percent of the outstanding shares of our common stock and (3) all of our directors and executive officers as a group. The information set forth below is based upon information supplied or confirmed by the named individuals. Unless otherwise noted below, the address of each individual is c/o The Hain Celestial Group, Inc., 1111 Marcus Avenue, Lake Success, New York 11042.
Number of Shares | Percentage of Common Stock | |||||
Irwin D. Simon (1) (2) | 1,846,273 | 1.76 | % | |||
Richard C. Berke (2) (3) | 43,000 | * | ||||
Andrew R. Heyer (2) (4) | 127,010 | * | ||||
Raymond W. Kelly (2) (5) | 4,130 | * | ||||
Roger Meltzer (2) (4) | 17,762 | * | ||||
Scott M. O’Neil (2) (4) | 24,930 | * | ||||
Adrianne Shapira (2) (4) | 7,430 | * | ||||
Lawrence S. Zilavy (2) (4) | 52,930 | * | ||||
Pasquale Conte (6) | 18,314 | * | ||||
John Carroll (7) | 243,787 | * | ||||
Denise M. Faltischek (8) | 49,119 | * | ||||
Stephen J. Smith (9) | 22,341 | * | ||||
BlackRock Inc. (10) 55 East 52nd Street New York, NY 10022 | 8,025,714 | 7.67 | % | |||
The Vanguard Group (11) 100 Vanguard Blvd. Malvern, PA 19355 | 7,889,803 | 7.54 | % | |||
FMR LLC (12) 245 Summer Street Boston, Massachusetts 02210 | 5,640,869 | 5.39 | % | |||
All directors and executive officers as a group (eleven persons) (13) | 2,434,685 | 2.33 | % | |||
* Indicates less than 1%.
(1) Includes 443,076 shares of unvested restricted common stock granted under our 2002 Plan and 124,782 shares held
indirectly by a trust. Also includes 21,812 shares held by Mr. Simon’s wife, as to which Mr. Simon disclaims beneficial
ownership. Mr. Simon is our President, CEO and Chairman of the Board of Directors.
(2) Director of The Hain Celestial Group, Inc.
(3) Includes 1,100 shares of unvested restricted common stock granted under the 2000 Directors Stock Plan, 2,753 shares of
unvested restricted common stock granted under our 2002 Plan, and 70 shares held indirectly in trust for Mr. Berke’s child.
(4) Includes 1,100 shares of unvested restricted common stock granted under the 2000 Directors Stock Plan and 2,753 shares
of unvested restricted common stock granted under our 2002 Plan.
(5) Includes 2,753 shares of unvested restricted common stock granted under the 2002 Plan.
(6) Includes 1,698 shares of unvested restricted common stock granted under the 2002 Plan.
(7) Includes 16,219 shares of unvested restricted common stock granted under the 2002 Plan.
(8) Includes 14,888 shares of unvested restricted common stock granted under the 2002 Plan.
(9) There were no unvested shares of restricted common stock granted under the 2002 Plan.
(10) As of December 31, 2016, BlackRock, Inc. (“BlackRock”) had sole voting power over 7,652,068 shares and sole dispositive power over 8,025,714 shares, according to a Schedule 13G/A filed by BlackRock on January 24, 2017.
(11) | As of December 31, 2016, The Vanguard Group (“Vanguard”) had sole voting power over 60,314 shares, sole dispositive power over 7,822,324 shares, shared voting power over 12,254 shares, and shared dispositive power over 67,479 shares, according to a Schedule 13G/A filed by Vanguard on February 13, 2017. |
(12) | As of December 30, 2016, FMR LLC (“FMR”) had sole voting power over 304,351 shares and sole dispositive power over 5,640,869 shares, according to a Schedule 13G filed by FMR on February 14, 2017. |
(13) Includes 475,752 shares of unvested restricted stock and 1,958,933 shares held directly or indirectly. See Notes 1 through 8 above.
147
Item 13. Certain Relationships and Related Transactions, and Director Independence
Certain Relationships and Related Party Transactions.
Mr. Meltzer, who is nominated for re-election as a director, is a partner at the law firm DLA Piper LLP (US). DLA Piper LLP (US) provides legal services to us.
Mr. Simon’s spouse, Daryl Simon, has been the Director of International Sales of the Company since September 1996. During the fiscal year ended June 30, 2016, she earned a base salary of $123,842.31 and participated in the Company’s benefit programs for its employees. In addition, Mr. Simon’s brother-in-law, Geoffrey Goldberg, currently serves as Vice President - Corporate Services and has been employed by the Company since June 2000. During the fiscal year ended June 30, 2016, he earned a base salary of $191,576, a car allowance of $8,400 and participated in the Company’s benefit programs for its employees. On October 5, 2015, he was granted 184 shares of stock, which had a grant date value of approximately $9,815. On December 29, 2015, he was granted 583 performance-based restricted stock units, which had a grant date fair value of approximately $8,541.
Review, Approval or Ratification of Transactions with Related Persons.
We have adopted a written policy regarding the review, approval and ratification of related party transactions. The Related Party Transaction Policy and Procedures requires the approval or ratification by the Audit Committee of any “related party transaction,” which is defined as any transaction, arrangement or relationship in which (i) we are a participant, (ii) the amount involved exceeds $120,000 and (iii) one of our executive officers, directors, director nominees, 5% stockholders (or their immediate family members) or any entity with which any of the foregoing persons is an employee, general partner, principal or 5% stockholder, each of whom we refer to as a “related person,” has a direct or indirect interest as set forth in Item 404 of Regulation S-K. The policy provides that management must present to the Audit Committee for review and approval each proposed related party transaction (other than related party transactions involving compensation matters and certain ordinary course transactions). The Audit Committee must review the relevant facts and circumstances of the transaction, including if the transaction is on terms comparable to those that could be obtained in arms-length dealings with an unrelated third party and the extent of the related party’s interest in the transaction, take into account the conflicts of interest and corporate opportunity provisions of our Code of Conduct, and either approve or disapprove the related party transaction. If advance approval of a related party transaction requiring the Audit Committee’s approval is not feasible, the transaction may be preliminarily entered into by management upon prior approval of the transaction by the chair of the Audit Committee, subject to ratification of the transaction by the Audit Committee at its next regularly scheduled meeting. The Audit Committee will also review those transactions that would have been deemed a “related party transaction” but for the fact that the amount involved is $120,000 or less. No director may participate in approval of a related party transaction for which he or she is a related party.
Director Independence.
A majority of the current Board, consisting of Ms. Shapira and Messrs. Berke, Heyer, Kelly, Meltzer, O’Neil and Zilavy, are “independent directors” as defined in the listing standards of the Nasdaq Global Select Market (“Nasdaq”). Mr. Simon was determined not to be independent because he is our President and CEO.
148
Committees of the Board
The Board of Directors has three standing committees: the Audit Committee, the Compensation Committee and the Corporate Governance and Nominating Committee. All committee members of the Audit Committee, the Compensation Committee and the Corporate Governance and Nominating Committee are independent directors, as defined in the applicable rules for companies traded on Nasdaq. The Board of Directors has adopted a written charter for each of the Audit Committee, the Compensation Committee, and the Corporate Governance and Nominating Committee, a current copy of which is available on our website at www.hain.com under Investor Relations-Corporate Governance. The members of the committees are identified in the table below.
Director | Audit Committee | Compensation Committee | Corporate Governance and Nominating Committee | |||
Irwin D. Simon | — | — | — | |||
Richard C. Berke | — | ü | ü | |||
Andrew R. Heyer | Chair | — | — | |||
Raymond W. Kelly | — | — | ü | |||
Roger Meltzer | — | — | — | |||
Scott O’Neil | — | Chair | — | |||
Adrianne Shapira | ü | ü | — | |||
Lawrence S. Zilavy | ü | — | Chair | |||
149
Item 14. Principal Accountant Fees and Services
Fees Billed to the Company by Ernst & Young LLP
The following table sets forth the fees incurred to the Company’s independent registered public accounting firm, Ernst & Young LLP, related to the fiscal years ended June 30, 2016 and June 30, 2015.
Audit and Non-Audit Fees | |||||||||
2016 | 2015 | ||||||||
Audit Fees (1) | $ | 13,795,000 | $ | 3,164,000 | |||||
Audit Related Fees (2) | $ | 458,000 | $ | 305,000 | |||||
Tax Fees (3) | $ | 479,000 | $ | 286,000 | |||||
All Other Fees (4) | $ | — | $ | 8,000 | |||||
(1) Reflects the aggregate fees billed for each of the 2016 and 2015 fiscal years for professional services rendered by
Ernst & Young LLP for the audit of our annual financial statements and review of our quarterly financial statements, and services that are normally provided by Ernst & Young LLP in connection with statutory and regulatory filings or engagements. The amounts presented include costs associated with the internal accounting review of $10,450,000 for the 2016 fiscal year.
(2) Reflects the aggregate fees billed by Ernst & Young LLP in each of the 2016 and 2015 fiscal years for assurance and
related services by Ernst & Young LLP that are reasonably related to the performance of the audit or review of our financial statements and are not reported in the immediately preceding paragraph. The services comprising the fees disclosed under this category were principally related to due diligence in connection with acquisitions and accounting consultations.
(3) Reflects the aggregate fees billed in each of the 2016 and 2015 fiscal years for professional services rendered by Ernst &
Young LLP for tax advice, tax compliance and tax planning.
(4) Reflects fees billed by Ernst & Young LLP for 2015 fiscal year for corporate finance assistance related to a foreign legal
entity and an insurance cost assessment review.
The Audit Committee has considered whether the provision of the services described above in this section is compatible with maintaining Ernst & Young’s independence and has determined that it is.
The Audit Committee’s policy is to pre-approve all audit and permissible non-audit services provided by our registered independent accountants. Pre-approval is provided for up to one year, is detailed as to the particular service or category of services and is subject to a specific budget. The Audit Committee may also pre-approve particular services on a case-by-case basis. In assessing requests for services by the registered independent accountants, the Audit Committee considers whether such services are consistent with the registered independent accountants’ independence, whether the registered independent accountants are likely to provide the most effective and efficient service based on their familiarity with us, and whether the service could enhance our ability to manage or control risk or improve audit quality. The Audit Committee has delegated limited pre-approval authority to its chairman, who must report any decisions to the Audit Committee at its next scheduled meeting.
In fiscal years 2016 and 2015, all of the audit fees, audit related fees, tax fees and all other fees were pre-approved by the Audit Committee or its chairman.
150
PART IV
Item 15. Exhibits and Financial Statement Schedules
(a)(1) | Financial Statements. The following consolidated financial statements of The Hain Celestial Group, Inc. are filed as part of this report under Part II, Item 8 - Financial Statements and Supplementary Data: |
Report of Independent Registered Public Accounting Firm
Consolidated Balance Sheets - June 30, 2016 and 2015
Consolidated Statements of Income - Fiscal Years ended June 30, 2016, 2015 and 2014
Consolidated Statements of Comprehensive Income - Fiscal Years ended June 30, 2016, 2015 and 2014
Consolidated Statements of Stockholders’ Equity - Fiscal Years ended June 30, 2016, 2015 and 2014
Consolidated Statements of Cash Flows - Fiscal Years ended June 30, 2016, 2015 and 2014
Notes to Consolidated Financial Statements
(a)(2) | Financial Statement Schedules. The following financial statement schedule should be read in conjunction with the consolidated financial statements included in Part II, Item 8, of this Annual Report on Form 10-K. All other financial schedules are not required under the related instructions, or are not applicable and therefore have been omitted. |
The Hain Celestial Group, Inc. and Subsidiaries
Schedule II - Valuation and Qualifying Accounts
Column A | Column B | Column C | Column D | Column E | ||||||||||||||||
Additions | ||||||||||||||||||||
Balance at beginning of period | Charged to costs and expenses | Charged to other accounts - describe (i) | Deductions - describe (ii) | Balance at end of period | ||||||||||||||||
Fiscal Year Ended June 30, 2016: | ||||||||||||||||||||
Allowance for doubtful accounts | $ | 896 | $ | 208 | $ | 54 | $ | (222 | ) | $ | 936 | |||||||||
Valuation allowance for deferred tax assets | $ | 10,926 | $ | 7,484 | $ | — | $ | (3,100 | ) | $ | 15,310 | |||||||||
Fiscal Year Ended June 30, 2015: | ||||||||||||||||||||
Allowance for doubtful accounts | $ | 1,586 | $ | 791 | $ | 20 | $ | (1,501 | ) | $ | 896 | |||||||||
Valuation allowance for deferred tax assets | $ | 10,952 | $ | 963 | $ | — | $ | (989 | ) | $ | 10,926 | |||||||||
Fiscal Year Ended June 30, 2014: | ||||||||||||||||||||
Allowance for doubtful accounts | $ | 2,564 | $ | 51 | $ | 330 | $ | (1,359 | ) | $ | 1,586 | |||||||||
Valuation allowance for deferred tax assets | $ | 10,456 | $ | 1,483 | $ | — | $ | (987 | ) | $ | 10,952 | |||||||||
(i) | Represents the allowance for doubtful accounts of the business acquired during the fiscal year |
(ii) | Amounts written off and changes in exchange rates |
(a)(3) Exhibits. The exhibits filed as part of this Annual Report on Form 10-K are listed on the Exhibit Index immediately following the signature page hereto, which is incorporated herein by reference.
151
Item 16. Form 10-K Summary
None.
152
SIGNATURES
Pursuant to the requirements of Section 13 or 15(d) of the Securities Exchange Act of 1934, the Registrant has duly caused this report to be signed on its behalf by the undersigned, thereunto duly authorized.
THE HAIN CELESTIAL GROUP, INC. | ||
Date: | June 22, 2017 | /s/ Irwin D. Simon |
Irwin D. Simon, Chairman, President and Chief Executive Officer | ||
Date: | June 22, 2017 | /s/ Pasquale Conte |
Pasquale Conte, Executive Vice President and Chief Financial Officer | ||
153
Pursuant to the requirements of the Securities Exchange Act of 1934, this report has been signed below by the following persons on behalf of the Registrant and in the capacities and on the dates indicated.
Signature | Title | Date | ||
/s/ Irwin D. Simon | President, Chief Executive Officer and Chairman of the Board of Directors | June 22, 2017 | ||
Irwin D. Simon | ||||
/s/ Pasquale Conte | Executive Vice President and Chief Financial Officer | June 22, 2017 | ||
Pasquale Conte | ||||
/s/ Michael McGuinness | Senior Vice President and Chief Accounting Officer | June 22, 2017 | ||
Michael McGuinness | ||||
/s/ Richard C. Berke | Director | June 22, 2017 | ||
Richard C. Berke | ||||
/s/ Andrew R. Heyer | Director | June 22, 2017 | ||
Andrew R. Heyer | ||||
/s/ Raymond W. Kelly | Director | June 22, 2017 | ||
Raymond W. Kelly | ||||
/s/ Roger Meltzer | Director | June 22, 2017 | ||
Roger Meltzer | ||||
/s/ Scott M. O’Neil | Director | June 22, 2017 | ||
Scott M. O’Neil | ||||
/s/ Adrianne Shapira | Director | June 22, 2017 | ||
Adrianne Shapira | ||||
/s/ Lawrence S. Zilavy | Director | June 22, 2017 | ||
Lawrence S. Zilavy | ||||
154
EXHIBIT INDEX
Exhibit Number | Description | |
3.1 | Amended and Restated Certificate of Incorporation (incorporated by reference to Exhibit 3.1 of Amendment No. 1 to the Company’s Registration Statement on Form S-4 (Commission File No. 333-33830) filed with the Commission on April 24, 2000). | |
3.2 | Certificate of Amendment to Amended and Restated Certificate of Incorporation of The Hain Celestial Group, Inc. (incorporated by reference to Exhibit 3.2(b) of the Company’s Current Report on Form 8-K filed with the Commission on November 26, 2014). | |
3.3 | The Hain Celestial Group, Inc. Amended and Restated Bylaws (incorporated by reference to Exhibit 3.2(a) of the Company’s Current Report on Form 8-K filed with the Commission on November 26, 2014). | |
4.1 | Specimen of common stock certificate (incorporated by reference to Exhibit 4.1 of Amendment No. 1 to the Company’s Registration Statement on Form S-4 (Commission File No. 333-33830) filed with the Commission on April 24, 2000). | |
4.2 | Note Purchase Agreement, dated as of May 2, 2006, by and among the Company and the several purchasers named therein (incorporated by reference to Exhibit 10.2 of the Company’s Current Report on Form 8-K filed with the Commission on May 4, 2006). | |
4.3 | Form of Senior Note under Note Purchase Agreement dated as of May 2, 2006 (incorporated by reference to Exhibit 4.7 of the Company’s Annual Report on Form 10-K for the fiscal year ended June 30, 2006, filed with the Commission on September 13, 2006). | |
10.1 | Second Amended and Restated Credit Agreement, dated as of December 12, 2014, by and among The Hain Celestial Group, Inc., Bank of America, N.A., as Administrative Agent, Swing Line Lender and L/C Issuer, Bank of America Merrill Lynch International Limited, as Global Swingline Lender, Wells Fargo Bank, N.A., as Syndication Agent, JPMorgan Chase Bank, N.A., Citizens Bank, N.A. and Farm Credit East, ACA, as Documentation Agents, and the other lenders party thereto (incorporated by reference to Exhibit 10.1 of the Company’s Current Report on Form 8-K filed with the SEC on December 18, 2014). | |
10.2* | 2000 Directors Stock Plan (incorporated by reference to Annex A to the Company’s Notice of Annual Meeting of Stockholders and Proxy Statement dated February 18, 2009). | |
10.3* | The Hain Celestial Group, Inc. Amended and Restated 2002 Long Term Incentive and Stock Award Plan (incorporated by reference to Exhibit 10.2 of the Company’s Current Report on Form 8-K filed with the SEC on November 26, 2014). | |
10.4* | The Hain Celestial Group, Inc. 2015-2019 Executive Incentive Plan (incorporated by reference to Exhibit 10.1 of the Company’s Current Report on Form 8-K filed with the SEC on November 26, 2014). | |
10.5* | Employment Agreement between the Company and Irwin D. Simon, dated July 1, 2003 (incorporated by reference to Exhibit 10.1 of the Company’s Quarterly Report on Form 10-Q for the fiscal quarter ended September 30, 2003, filed with the Commission on November 14, 2003), as amended as described in the Company’s Current Report on Form 8-K filed with the Commission on November 3, 2006. | |
10.5.1* | Amendment to Employment Agreement between the Company and Irwin D. Simon, dated as of December 31, 2008 (incorporated by reference to Exhibit 10.1 to the Company’s Current Report on Form 8-K filed with the Commission on January 7, 2009). | |
10.5.2* | Amendment to Employment Agreement between the Company and Irwin D. Simon, dated as of July 1, 2009 (incorporated by reference to Exhibit 10.1 of the Company’s Current Report on Form 8-K, filed with the Commission on July 2, 2009). | |
10.5.3* | Amendment to Employment Agreement between the Company and Irwin D. Simon, dated as of June 30, 2012 (incorporated by reference to Exhibit 10.1 to the Company’s Current Report on Form 8-K, filed with the Commission on July 6, 2012). | |
155
10.5.4* | Amendment to Employment Agreement between the Company and Irwin D. Simon, dated November 2, 2012 (incorporated by reference to Exhibit 10.1 of the Company’s Current Report on Form 8-K filed with the Commission on November 2, 2012). | |
10.5.5* | Amendment to Employment Agreement between the Company and Irwin D. Simon dated September 23, 2014 (incorporated by reference to Exhibit 10.1 of the Company’s Current Report on Form 8-K filed with the Securities and Exchange Commission on September 29, 2014). | |
10.6* | Form of Indemnification Agreement (incorporated by reference to Exhibit 10.1 of the Company’s Quarterly Report on Form 10-Q for the fiscal quarter ended December 31, 2004, filed with the Commission on February 9, 2005). | |
10.7* | Form of Change in Control Agreement (incorporated by reference to Exhibit 10.2 of the Company’s Quarterly Report on Form 10-Q for the fiscal quarter ended December 31, 2004, filed with the Commission on February 9, 2005). | |
10.8* | Form of Option Agreement under the Company’s Amended and Restated 2002 Long Term Incentive and Stock Award Plan (incorporated by reference to Exhibit 10.1 to the Company’s Current Report on Form 8-K/A filed with the Commission on April 7, 2008). | |
10.9* | Form of Option Agreement with the Company’s Chief Executive Officer under the Company’s Amended and Restated 2002 Long Term Incentive and Stock Award Plan (incorporated by reference to Exhibit 10.2 to the Company’s Current Report on Form 8-K/A filed with the Commission on April 7, 2008). | |
10.10* | Form of Restricted Stock Agreement under the Company’s Amended and Restated 2002 Long Term Incentive and Stock Award Plan (incorporated by reference to Exhibit 10.3 to the Company’s Current Report on Form 8-K/A filed with the Commission on April 7, 2008). | |
10.11* | Form of Restricted Stock Agreement with the Company’s Chief Executive Officer under the Company’s Amended and Restated 2002 Long Term Incentive and Stock Award Plan (incorporated by reference to Exhibit 10.4 to the Company’s Current Report on Form 8-K/A filed with the Commission on April 7, 2008). | |
10.12* | Form of Notice of Grant of Restricted Stock Award under the Company’s Amended and Restated 2002 Long Term Incentive and Stock Award Plan (incorporated by reference to Exhibit 10.6 to the Company’s Current Report on Form 8-K/A filed with the Commission on April 7, 2008). | |
10.13* | Form of the Change in Control Agreement between the Company and John Carroll (incorporated by reference to Exhibit 10.2 to the Company’s Current Report on Form 8-K filed with the Commission on January 7, 2009). | |
10.14* | Form of the Offer Letter Amendments between the Company and John Carroll (incorporated by reference to Exhibit 10.3 to the Company’s Current Report on Form 8-K filed with the Commission on January 7, 2009). | |
10.15* | Form of Restricted Stock Agreement under the Company’s 2000 Directors Stock Plan (incorporated by reference to Exhibit 10.1 to the Company’s Current Report on Form 8-K filed with the Commission on March 17, 2009). | |
10.16* | Form of Notice of Grant of Restricted Stock Award under the Company’s 2000 Directors Stock Plan (incorporated by reference to Exhibit 10.2 to the Company’s Current Report on Form 8-K filed with the Commission on March 17, 2009). | |
10.17* | Form of Change in Control Agreement between the Company and each of Denise M. Faltischek and Pasquale Conte (incorporated by reference to Exhibit 10.3 to the Company’s Quarterly Report on Form 10-Q filed with the Commission on February 9, 2010). | |
10.18* | Form of Option Agreement under the Company’s Amended and Restated 2002 Long Term Incentive and Stock Award Plan (incorporated by reference to Exhibit 10.4 to the Company’s Quarterly Report on Form 10-Q filed with the Commission on February 9, 2010). | |
10.19* | Form of Restricted Stock Agreement with the Company’s Chief Executive Officer under the Company’s Amended and Restated 2002 Long Term Incentive and Stock Award Plan (2011-2012 Long Term Incentive Plan) (incorporated by reference to Exhibit 10.2(a) to the Company’s Quarterly Report on Form 10-Q filed with the Commission on February 9, 2011). | |
156
10.20* | Form of Restricted Stock Agreement with the Company’s non-CEO executive officers under the Company’s Amended and Restated 2002 Long Term Incentive and Stock Award Plan (2011-2012 Long Term Incentive Plan) (incorporated by reference to Exhibit 10.3(a) to the Company’s Quarterly Report on Form 10-Q filed with the Commission on February 9, 2011). | |
10.21* | Restricted Stock Agreement between the Company and Irwin D. Simon, dated as of July 3, 2012 (incorporated by reference to Exhibit 10.2(a) to the Company’s Current Report on Form 8-K filed with the Commission on July 6, 2012). | |
10.22 | Form of Performance Unit Agreement with the Company’s executive officers under the Company’s Amended and Restated 2002 Long Term Incentive and Stock Award Plan (2016-2018 Long Term Incentive Plan) (incorporated by reference to Exhibit 10.1 to the Company’s Quarterly Report on Form 10-Q filed with the Commission on February 9, 2016). | |
21.1 | Subsidiaries of Company. | |
23.1 | Consent of Independent Registered Public Accounting Firm - Ernst & Young LLP. | |
31.1 | Certification of Chief Executive Officer pursuant to Rule 13a-14(a) and Rule 15d-14(a) of the Securities Exchange Act, as amended. | |
31.2 | Certification of Chief Financial Officer pursuant to Rule 13a-14(a) and Rule 15d-14(a) of the Securities Exchange Act, as amended. | |
32.1 | Certification by CEO pursuant to 18 U.S.C. Section 1350, as adopted pursuant to Section 906 of the Sarbanes-Oxley Act of 2002. | |
32.2 | Certification by CFO pursuant to 18 U.S.C. Section 1350, as adopted pursuant to Section 906 of the Sarbanes-Oxley Act of 2002. | |
101 | The following materials from the Company’s Annual Report on Form 10-K for the fiscal year ended June 30, 2016, formatted in eXtensible Business Reporting Language (XBRL): (i) the Consolidated Balance Sheets, (ii) the Consolidated Statements of Income, (iii) the Consolidated Statements of Comprehensive Income, (iv) the Consolidated Statements of Stockholders’ Equity, (v) the Consolidated Statements of Cash Flows, (vi) Notes to Consolidated Financial Statements, and (vii) Financial Statement Schedule. | |
* | Indicates management contract or compensatory plan or arrangement. | |
The agreements and other documents filed as exhibits to this report are not intended to provide factual information or other disclosure other than with respect to the terms of the agreements or other documents themselves, and you should not rely on them for that purpose. In particular, any representations and warranties made by us in these agreements or other documents were made solely within the specific context of the relevant agreement or document and may not describe the actual state of affairs as of the date they were made or at any other time.
157