Attached files
| file | filename |
|---|---|
| 8-K - FORM 8-K - TABLE TRAC INC | v468700_8k.htm |
Exhibit 99.1

Table Trac , Inc. 2017 LD Micro Invitational June 7, 2017 Los Angeles

Certain statements that may be made today will be considered “forward looking” as that term is defined under the rules of the Securities and Exchange Commission (SEC), and are therefore subject to the safe harbor created by such rules . Although the Company believes the expectations reflected in any forward looking information and statements are reasonable, such forward looking information and statements involve risks and uncertainties that could lead actual results to differ from those contained in today’s presentation materials and discussion . The general factors impacting future results are discussed in detail in the Company’s SEC filings, The forward looking information and statements in this presentation speak only as of the date hereof and the Company undertakes no obligation to update the information contained in this report unless required by law . Table Trac , Inc. (OTCQB: TBTC) Safe Harbor Statement

Table Trac - Order of presentation 1. Who we are 2. Our Market and Opportunities 3. Competition 4. Technology 5. Our Business Model 6. Financial Presentation

Table Trac – Who We Are • Chad Hoehne – Founder, CTO, Majority Shareholder • 22 years in the gaming industry (June 1995) – Casino Management System provider – Software Development, Sales and Support • The software captures the accounting activity of the Casino floor • Player Club / Tracking of Casino Customers – We have designed the critical hardware needed to run our software. • Minnesota Headquarters – 23 Employees (14 at home office, 9 field) • Traded on the OTC QB
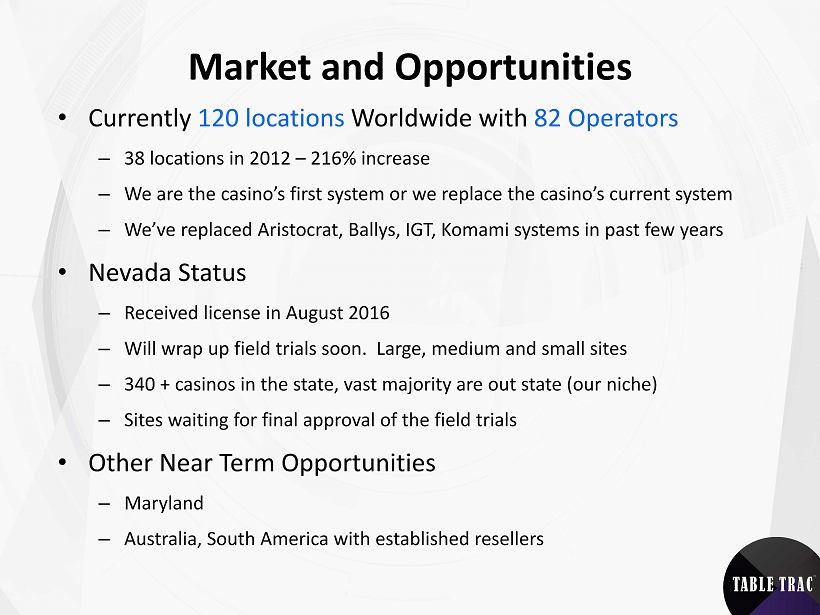
Market and Opportunities • Currently 120 locations Worldwide with 82 Operators – 38 locations in 2012 – 216% increase – We are the casino’s first system or we replace the casino’s current system – We’ve replaced Aristocrat, Ballys , IGT, Komami systems in past few years • Nevada Status – Received license in August 2016 – Will wrap up field trials soon. Large, medium and small sites – 340 + casinos in the state, vast majority are out state (our niche) – Sites waiting for final approval of the field trials • Other Near Term Opportunities – Maryland – Australia, South America with established resellers

Table Trac Competition • Slot Machine Manufacturers (4) and some Independent System Providers our size • How we stand out – Our technology is more reliable and easier to use – Better Interfaces to Point of Sale systems, Kiosks, Promotions Companies – Lower Total Cost of Ownership – Details to follow – Customer Support – 24/7 live tech (No India phone banks, no voicemail) – We are not trying to sell slot machines to the casino. No conflict of interest • Allows casino to stay objective on their slot machine decisions – We are highly recommended by our existing customers • Existing Customers routinely host site visits for our prospects

Technology • Casino Trac Owns 100% of its Technology • No 3 rd party dependencies, Control the technology end to end. • Designs, Builds and Programs its own tracking Hardware • System design and architecture • Streamline and portable • Highly Scalable without modifications • Casino System Version 4.4 is independent lab tested • Nevada Reg 14 functional testing completed in Sept 2016 • GLI standards 13 16 19 certified • One of only five systems to achieve this approval level • New Product Patent Pending May 2017 • Innovative patent operates in the space between your phone, and slot machine • CasinoTrac Systems openly connect with third party content • Sports team picking games / Daily Fantasy Sports / POS / Hospitality

Table Trac Business Model • We focus on 3 principles 1. Innovative Technology • Patents, 1 st capacitive touch screens, Software is continuous work in process 2. Modest Pricing – TCO is less with us • We don’t charge for significant software updates, unlike competitors • Build Casino loyalty by embedding the software update prices into the modest monthly maintenance fee 3. Customer Support • Daily Revenue Audit Specialists – Unique for our industry • We have 2 employees that analyze and consult in Casino Promotions, driving higher profits for our customers • Live tech support 24/7

2016 Financial Overview & Highlights • Signed and delivered 12 casino management systems in 2016 • Total revenue of $5.8 M in 2016 ( 54.9% Increase of $2.0 M) • Recurring Revenue of $ 3.8 M ( 26.7% Increase of $.8 M) • Gross Margins remained consistent at 71.6% • Deferred Revenue of $2.7 M at 12/31/16 ( steady from $2.9 M at 12/31/15) • Deferred Margin of $1.5 M at 12/31/16 ( steady from $1.6 M at 12/31/15) • Operating expenses $4.0 M versus $3.4 M in 2015 ( Increase of $.6 M) – Mostly related to licensing expenses in Nevada and Colorado • Essentially no debt (2 financed company vehicles) • Cash used to assist customer financing plans

Revenue Recognition 1. System Revenue Recognition A. Impact Sales • If 67% (or more) of the total system sale is invoiced in the first 12 months B. Month to Month Revenue Recognition • Payment plans that typically range from 24 - 36 months • B alance of the Purchase Agreement is in Deferred Revenue of Balance Sheet • Interest Income 2. Maintenance Revenue – Monthly revenue recognition

Revenues - Recurring vs. Impact - 1,000,000 2,000,000 3,000,000 4,000,000 5,000,000 6,000,000 2014 2015 2016 Recurring Revenue Total Impact Revenue $1.2 M $5.8 M $3.8 M $3.5 M $3.7 M $3.0 M $2.3 M $.8 M $2.1 M
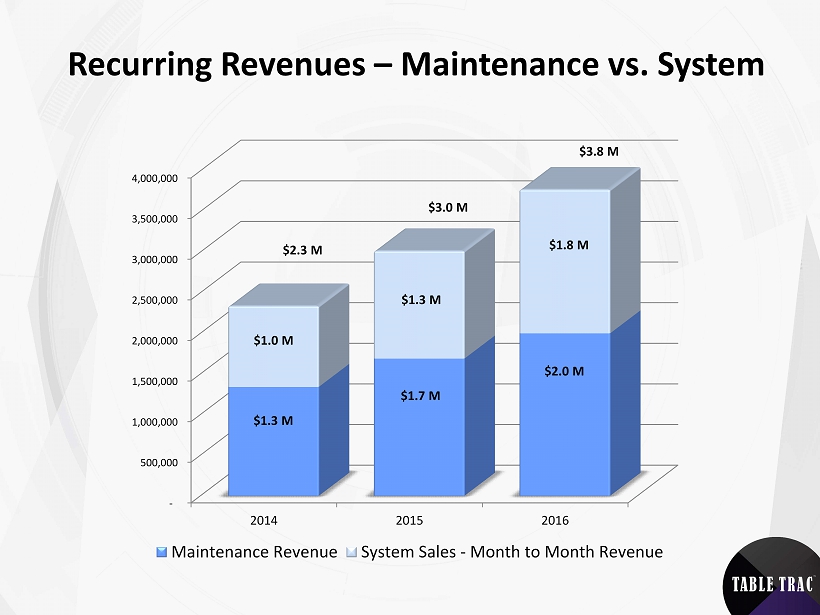
Recurring Revenues – Maintenance vs. System - 500,000 1,000,000 1,500,000 2,000,000 2,500,000 3,000,000 3,500,000 4,000,000 2014 2015 2016 Maintenance Revenue System Sales - Month to Month Revenue $1.3 M $ 3.0 M $1.8 M $1.3 M $1.0 M $2.0 M $1.7 M $ 3.8 M $2.3 M
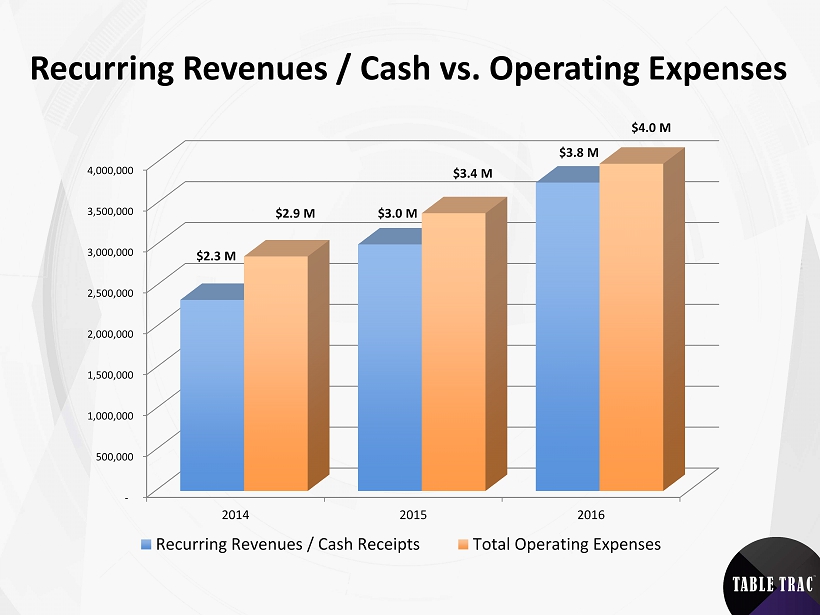
Recurring Revenues / Cash vs. Operating Expenses - 500,000 1,000,000 1,500,000 2,000,000 2,500,000 3,000,000 3,500,000 4,000,000 2014 2015 2016 Recurring Revenues / Cash Receipts Total Operating Expenses $2.3 M $ 3.0 M $2.9 M $ 3.4 M $4.0 M $ 3.8 M
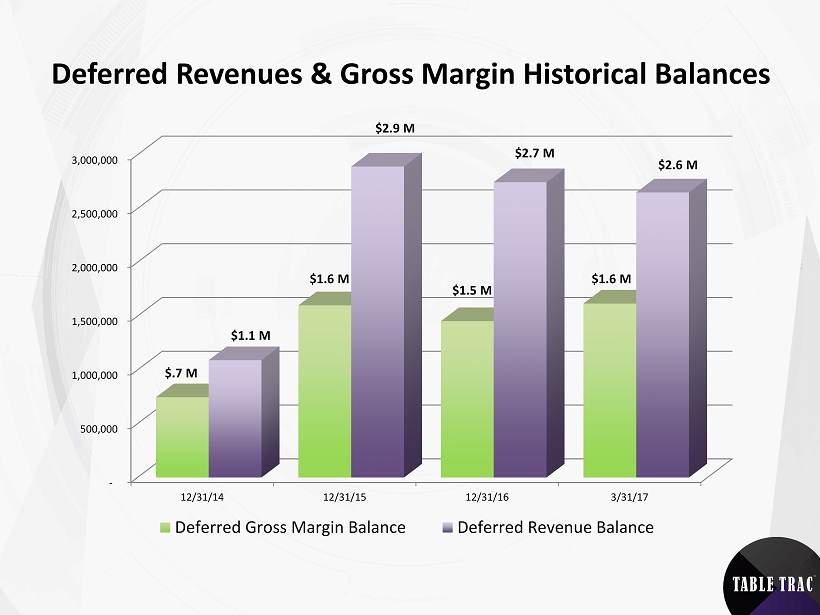
Deferred Revenues & Gross Margin Historical Balances - 500,000 1,000,000 1,500,000 2,000,000 2,500,000 3,000,000 12/31/14 12/31/15 12/31/16 3/31/17 Deferred Gross Margin Balance Deferred Revenue Balance $1.1 M $2.9 M $2.7 M $2.6 M $.7 M $1.6 M $1.5 M $1.6 M

Accounts Receivable Historical Balances $- $500,000 $1,000,000 $1,500,000 $2,000,000 $2,500,000 $3,000,000 $3,500,000 $4,000,000 $4,500,000 12/31/2014 12/31/2015 12/31/2016 3/31/2017 $2.9 M $4.2 M $4.0 M $3.9 M

Table Trac , Inc. 2017 LD Micro Invitationals - Questions - Thank You