Attached files
| file | filename |
|---|---|
| 8-K - 8-K - Bluerock Residential Growth REIT, Inc. | v468505_8k.htm |
Exhibit 99.1

NAREIT - June 2017

Forward - Looking Statements - 2 - The information in this presentation has been prepared solely for informational purposes by Bluerock Residential Growth REIT, Inc . (“BRG”) and does not constitute an offer to sell or the solicitation of an offer to purchase any securities . This presentation is not, and should not be assumed to be, complete . This presentation has been prepared to assist interested parties in making their own evaluation of BRG and does not purport to contain all of the information that may be relevant . In all cases, interested parties should conduct their own investigation and analysis of BRG and the data set forth in this presentation and other information provided by or on behalf of BRG . In addition, certain of the information contained herein may be derived from information provided by industry sources . BRG believes that such information is accurate and that the sources from which it has been obtained are reliable . BRG cannot guarantee the accuracy of such information, however, and has not independently verified such information . The information presented herein remains subject to change . Statements in this presentation are made as of the date of this presentation unless stated otherwise . This presentation also contains statements that, to the extent they are not recitations of historical fact, constitute “forward - looking statements . ” Forward - looking statements are typically identified by the use of terms such as “may,” “should,” “expect,” “could,” “intend,” “plan,” “anticipate,” “estimate,” “believe,” “continue,” “predict,” “potential” or the negative of such terms and other comparable terminology . The forward - looking statements included herein are based upon BRG’s current expectations, plans, estimates, assumptions and beliefs that involve numerous risks and uncertainties . Assumptions relating to the foregoing involve judgments with respect to, among other things, future economic, competitive and market conditions and future business decisions, all of which are difficult or impossible to predict accurately and many of which are beyond BRG’s control . Although BRG believes that the expectations reflected in such forward - looking statements are based on reasonable assumptions, BRG’s actual results and performance and the value of its securities could differ materially from those set forth in the forward - looking statements due to the impact of many factors including, but not limited to, the uncertainties of real estate development, acquisition and disposition activity, the ability of our joint venture partners to satisfy their obligations, the costs and availability of financing, the effects of local economic and market conditions, the effects of acquisitions and dispositions, the impact of newly adopted accounting principles on BRG’s accounting policies and on period - to - period comparisons of financial results, regulatory changes and other risks and uncertainties detailed in the “Risk Factors” in Item 1 . A . Risk Factors section of the Company’s Annual Report on Form 10 - K filed with the U . S . Securities and Exchange Commission on February 22 , 2017 , and other discussions of risk factors contained in BRG’s periodic filings . BRG claims the safe harbor protection for forward looking statements contained in the Private Securities Litigation Reform Act of 1995 . BRG undertakes no obligation to update or revise any such information for any reason after the date of this presentation, unless required by law .

- 3 - Company Highlights ▪ Building an Institutional Quality Portfolio in Growth Markets ▪ Partnering with Leading Real Estate Owners for Deal Access and Execution ▪ Focus on Creating Property Level Value ▪ Deep Experienced Management Team with 25+ Years Average Experience ▪ Internalization in process and expected to be completed in 2017 (1 ) ▪ Attractive Investment Metrics » Consistently Strong Same Store Results » Trading at a significant discount to NAV (2) (1) Management can provide no assurances as to the timing or completion of the internalization (2) See disclosure on slide 19 related to NAV estimates Notes - 3 - Arium Grandewood, Orlando, FL Park & Kingston, Charlotte, NC
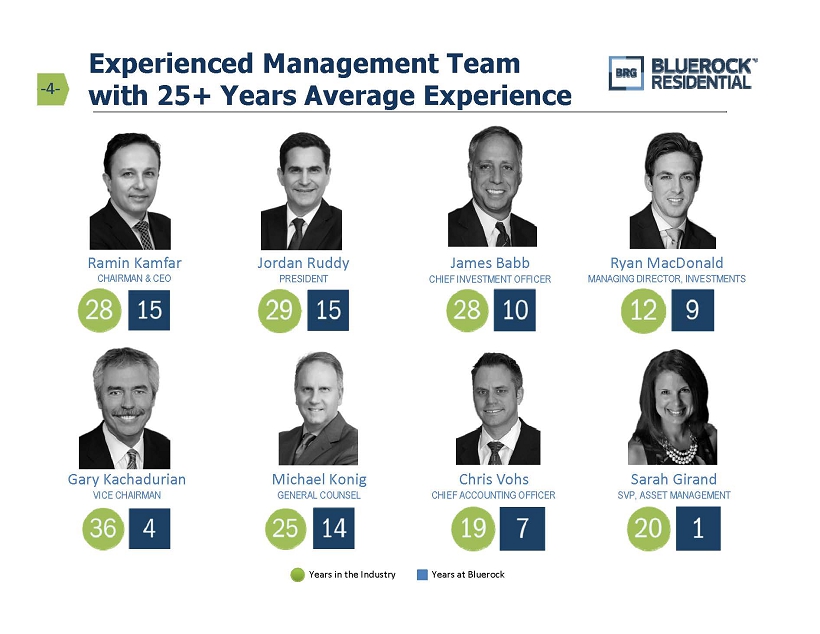
Experienced Management Team with 25+ Years Average Experience - 4 - Years at Bluerock Years in the Industry Ramin Kamfar CHAIRMAN & CEO Jordan Ruddy PRESIDENT James Babb CHIEF INVESTMENT OFFICER Gary Kachadurian VICE CHAIRMAN Michael Konig GENERAL COUNSEL Ryan MacDonald MANAGING DIRECTOR, INVESTMENTS Chris Vohs CHIEF ACCOUNTING OFFICER Sarah Girand SVP, ASSET MANAGEMENT
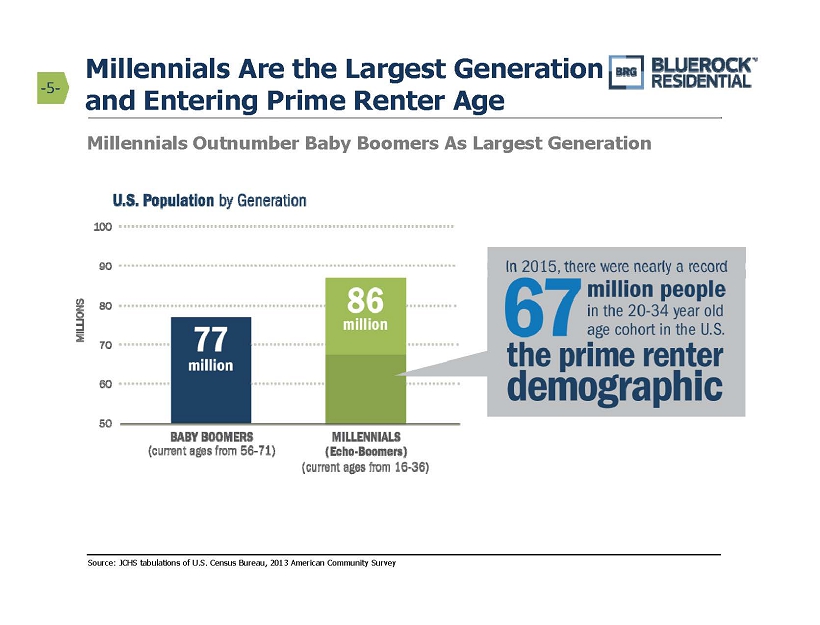
Millennials Are the Largest Generation and Entering Prime Renter Age - 5 - Millennials Outnumber Baby Boomers As Largest Generation Source: JCHS tabulations of U.S. Census Bureau, 2013 American Community Survey

Millennials to Drive Significant New Household Formation - 6 - Source: JCHS tabulations of U.S. Census Bureau, 2013 American Community Survey 30+ Million potential additional households over coming decade
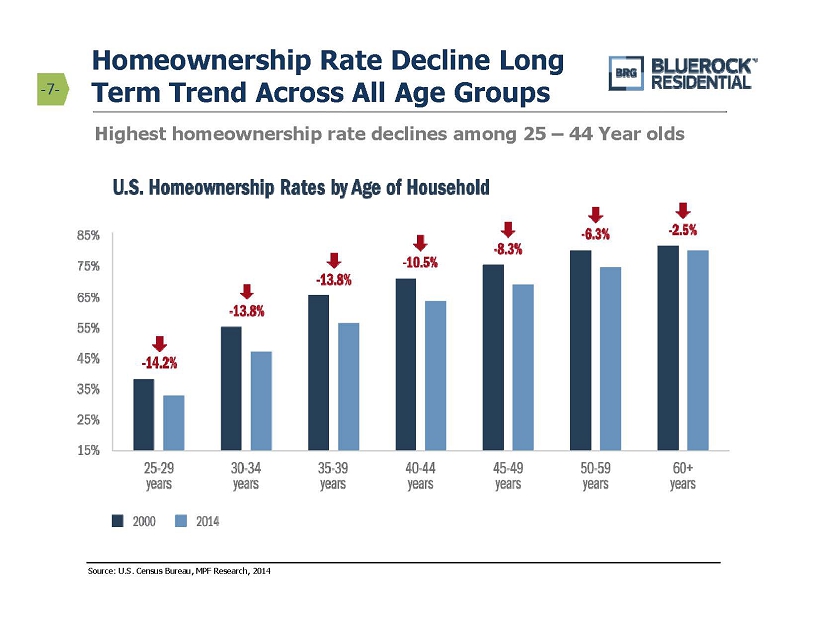
Homeownership Rate Decline Long Term Trend Across All Age Groups - 7 - Source: U.S. Census Bureau, MPF Research, 2014 Highest homeownership rate declines among 25 – 44 Year olds

Constrained Apartment Supply in Face of Increasing Demand - 8 - Source: U.S. Census Bureau, New Residential Construction Data, 2015 Despite the relative strength of multifamily construction, overall apartment starts remain near Historic Lows
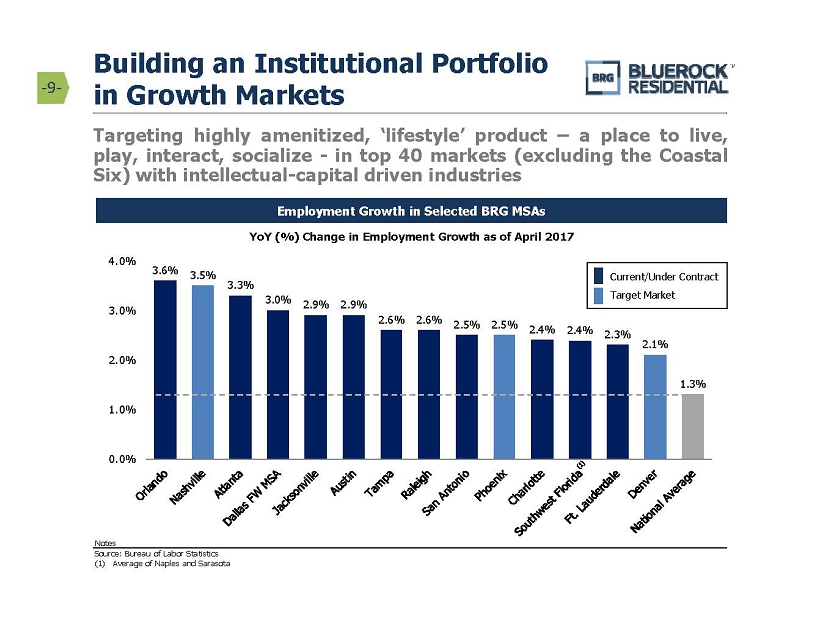
3.6% 3.5% 3.3% 3.0% 2.9% 2.9% 2.6% 2.6% 2.5% 2.5% 2.4% 2.4% 2.3% 2.1% 1.3% 0.0% 1.0% 2.0% 3.0% 4.0% YoY (%) Change in Employment Growth as of April 2017 Current/Under Contract Target Market Targeting highly amenitized, ‘lifestyle’ product – a place to live, play, interact, socialize - in top 40 markets (excluding the Coastal Six) with intellectual - capital driven industries Employment Growth in Selected BRG MSAs Building an Institutional Portfolio in Growth Markets - 9 - Source: Bureau of Labor Statistics (1) Average of Naples and Sarasota Notes

Building a New Institutional Quality Portfolio - 10 - Approximately 10,000 Primarily Newer - Build Class A Apartments (1) The properties pictured herein are jointly owned by BRG and are intended to represent properties intended to be owned by BRG in the future. Portfolio holdings are subject to change at any time. (1) Figure includes developments and pending Texas portfolio acquisition Park & Kingston Charlotte, NC • Built 2014 Arium Palms at World Gateway Orlando, FL • Built 2007 Whetstone Durham, NC • Built 2014 Sovereign Apartments Fort Worth, TX • Built 2015 Ashton Reserve Charlotte, NC • Built 2015 Preserve at Henderson Beach Destin, FL • Built 2010 Roswell City Walk Roswell, GA • Built 2016 Nevadan Atlanta, GA • Built 1990 Notes

Partnering with Leading Private Owner/Operators - 11 - Partners have (a) 25 + years of relationships across approximately 50 markets to access attractive, often off market transactions, and (b) 150 , 000 + units across the nation, providing plug and play execution ability without cost / logistical burden to BRG
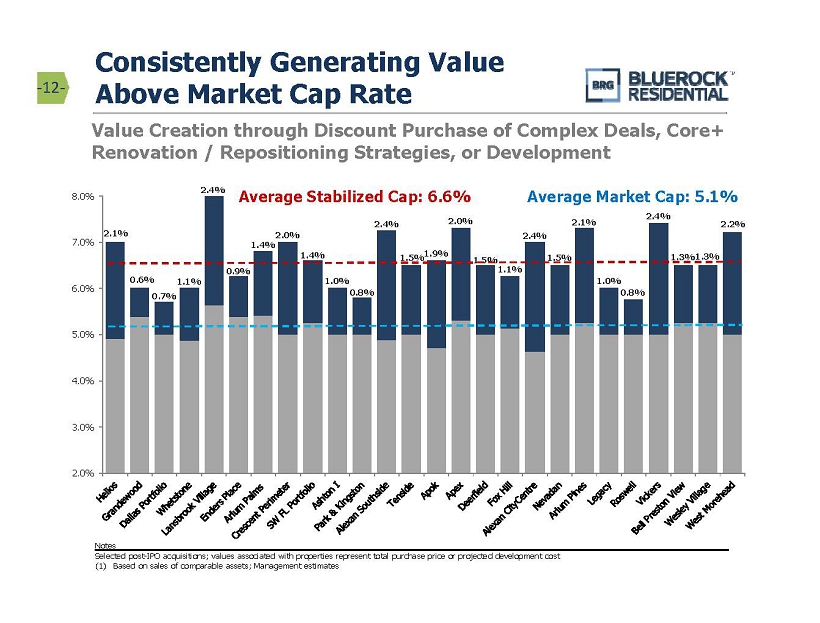
2.1% 0.6% 0.7% 1.1% 2.4% 0.9% 1.4% 2.0% 1.4% 1.0% 0.8% 2.4% 1.5% 1.9% 2.0% 1.5% 1.1% 2.4% 1.5% 2.1% 1.0% 0.8% 2.4% 1.3% 1.3% 2.2% 2.0% 3.0% 4.0% 5.0% 6.0% 7.0% 8.0% - 12 - Value Creation through Discount Purchase of Complex Deals, Core+ Renovation / Repositioning Strategies, or Development Consistently Generating Value Above Market Cap Rate Selected post - IPO acquisitions; values associated with properties represent total purchase price or projected development cost (1) Based on sales of comparable assets; Management estimates Notes Average Market Cap: 5.1% Average Stabilized Cap: 6.6%

0.0% 20.0% 40.0% 60.0% 80.0% BRG ESS UDR MAA AIV AVB CPT EQR MORE APTS Consistent Above Market Same Store Results Validate Execution - 13 - BRG has consistently delivered one of the highest Same Store NOI growth rates among all Multifamily REITs Notes: IRT excluded due to insufficient SS NOI data (1) Figures represent aggregate YoY Same Store NOI growth for the previous eight quarters (2Q’15 – 1Q’17) (2) 4Q’15 and 4Q’16 SS NOI growth not reported for APTS – 1Q – 3Q SS NOI growth average used as a proxy for 4Q figures Peer Average: 42.1% Cumulative Same Store NOI Growth 2Q’15 – 1Q’17 (1) Source: SNL Financial; Company filings (2)

Selected Dispositions Asset Location Deal Type IRR (1) Equity Multiple 23Hundred@Berry Hill Nashville, TN Development 60% 2.8x Grove at Waterford Hendersonville, TN Stabilized 85% 1.6x Estates at Perimeter Augusta, GA Stabilized 6% 1.2x Villas at Oak Crest Chattanooga, TN Preferred Equity 21% 1.3x North Park Towers Southfield, MI Recapitalization 40% 1.7x Springhouse Apartments Newport News, VA Stabilized 17% 1.8x EOS Orlando, FL Development 31% 1.8x Village Green of Ann Arbor Ann Arbor, MI Value-Add 38% 2.3x Lansbrook Village Palm Harbor, FL Fractured Condo 23% 1.5x Fox Hill Austin, TX Stabilized 26% 1.6x MDA City Apartments (2) Chicago, IL Recapitalization 23% 2.3x Weighted Average 33% 1.8x Disposition Returns Demonstrate Value Creation - 14 - (1) IRR and equity multiple calculated on BRG’s investment. Villas at Oak Crest returns are property level, excluding 1031 costs (2) MDA City Apartments sale is pending Notes

Delivering Strength in Operational Metrics - 15 - $791 $859 $963 $1,241 $1,346 $200 $600 $1,000 $1,400 $1,800 1Q'16 2Q'16 3Q'16 4Q'16 1Q'17 Asset Size ($MM) (1) 1Q’17 pro forma AFFO per share of $0.38 includes LTIPs (payment of management fees). For a reconciliation to GAAP measures and a discussion of pro forma assumptions, see Appendix A $16.6 $18.4 $19.6 $22.4 $26.7 $8 $12 $16 $20 $24 $28 1Q'16 2Q'16 3Q'16 4Q'16 1Q'17 Revenues ($MM) 10.3% 8.7% 8.1% 6.1% 10.9% 0% 4% 8% 12% 1Q'16 2Q'16 3Q'16 4Q'16 1Q'17 Same Store NOI Growth $0.26 $0.21 $0.21 $0.18 $0.18 $0.38 $0.00 $0.08 $0.16 $0.24 $0.32 $0.40 1Q'16 2Q'16 3Q'16 4Q'16 1Q'17 AFFO per Share (1) Dividend: $0.29 per share Notes

Property Location Units Year Built / Renovated Avg. Rent Sourcing Vickers (1) Atlanta, GA 79 Est. 2018 $3,176 off-market APOK Townhomes (1) Boca Raton, FL 90 Est. 2019 2,549 off-market Flagler Village (1) Ft. Lauderdale, FL 384 Est. 2020 2,481 off-market MDA Apartments Chicago, IL 190 2006 2,299 off-market Alexan CityCentre (1) Houston, TX 340 Est. 2017 2,144 off-market Alexan Southside (1) Houston, TX 270 Est. 2018 2,012 off-market Crescent Perimeter (1) Atlanta, GA 320 Est. 2019 1,749 off-market Enders Place at Baldwin Park Orlando, FL 220 2003 1,629 relationship West Morehead (1) Charlotte, NC 286 Est. 2019 1,507 off-market Helios (1) Atlanta, GA 282 Est. 2017 1,486 off-market Domain at Garland (1) Garland, TX 299 Est. 2019 1,469 off-market Arium Westside Atlanta, GA 336 2008 1,451 relationship Roswell City Walk Roswell, GA 320 2015 1,403 relationship The Preserve at Henderson Beach Destin, FL 340 2009 1,312 off-market Wesley Village Charlotte, NC 301 2010 1,299 relationship Lake Boone Trail (1) Raleigh, NC 245 Est. 2018 1,271 off-market Dallas Portfolio Dallas, TX 674 2015 1,260 off-market Arium Palms Orlando, FL 252 2008 1,240 off-market Arium Grandewood Orlando, FL 306 2005 1,232 off-market Arium Gulfshore Naples, FL 368 1986 / 2016 1,209 off-market Whetstone Durham, NC 204 2015 1,202 off-market Legacy at Southpark Austin, TX 250 2016 1,200 off-market Arium at Palmer Ranch Sarasota, FL 320 1989 / 2016 1,182 off-market Park & Kingston Charlotte, NC 168 2015 1,172 relationship The Brodie Austin, TX 324 2001 1,135 off-market Arium Pine Lakes Port St. Lucie, FL 320 2003 1,087 off-market Preston View Morrisville, NC 382 2000 1,060 relationship Nevadan Atlanta, GA 480 1990 1,057 relationship Ashton Reserve Charlotte, NC 473 2015 1,032 off-market Sub-Total (Current) 6,228 $1,251 Sub-Total (Pro Forma) (2) 8,823 $1,434 Texas Portfolio (3) Multiple MSA's 1,408 2007 - 2009 $1,202 off-market Sub-Total (Pipeline) 1,408 $1,202 Total (4) 10,231 $1,402 Young Institutional Portfolio in Growth Markets - 16 - Average rent figures as of 1Q’17; figures exclude Fox Hill and Lansbrook due to sale during 2Q’17 (1) This property is under development. Rent figures are projected or reflect current leasing estimates (2) Pro Forma includes Flagler Village, APOK Townhomes, Alexan CityCentre, Alexan Southside, West Morehead, Helios, Domain, Lake Boo ne Trail, Vickers and Crescent Perimeter projected rents / units (3) Pipeline average rent figures represent leased rent as of May 2017 (4) Total includes pipeline properties and projected rents / units for development properties Notes
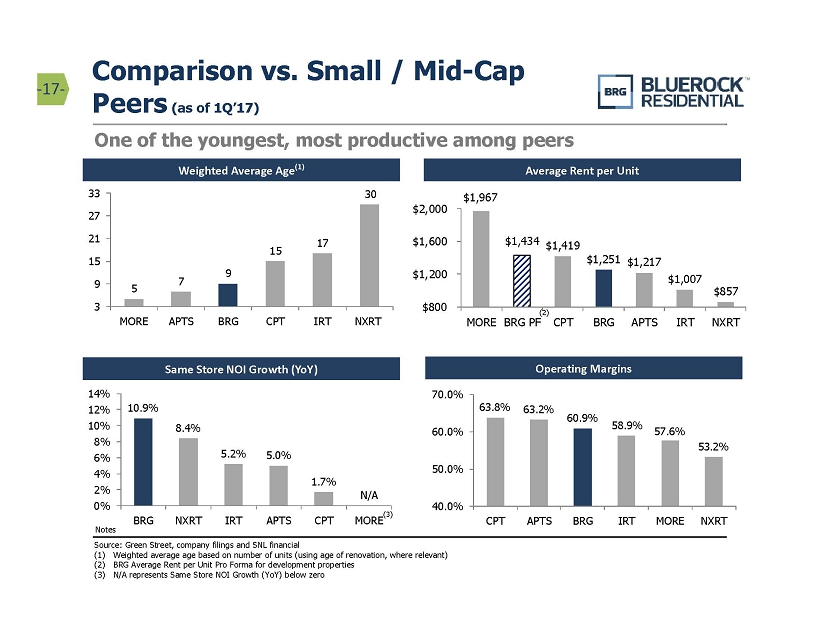
63.8% 63.2% 60.9% 58.9% 57.6% 53.2% 40.0% 50.0% 60.0% 70.0% CPT APTS BRG IRT MORE NXRT $1,967 $1,434 $1,419 $1,251 $1,217 $1,007 $857 $800 $1,200 $1,600 $2,000 MORE BRG PF CPT BRG APTS IRT NXRT 10.9% 8.4% 5.2% 5.0% 1.7% N/A 0% 2% 4% 6% 8% 10% 12% 14% BRG NXRT IRT APTS CPT MORE 5 7 9 15 17 30 3 9 15 21 27 33 MORE APTS BRG CPT IRT NXRT Comparison vs. Small / Mid - Cap Peers (as of 1Q’17) - 17 - Same Store NOI Growth (YoY) Weighted Average Age (1) Average Rent per Unit One of the youngest, most productive among peers Source: Green Street, company filings and SNL financial (1) Weighted average age based on number of units (using age of renovation, where relevant) (2) BRG Average Rent per Unit Pro Forma for development properties (3) N/A represents Same Store NOI Growth (YoY) below zero Notes Operating Margins (2) (3)
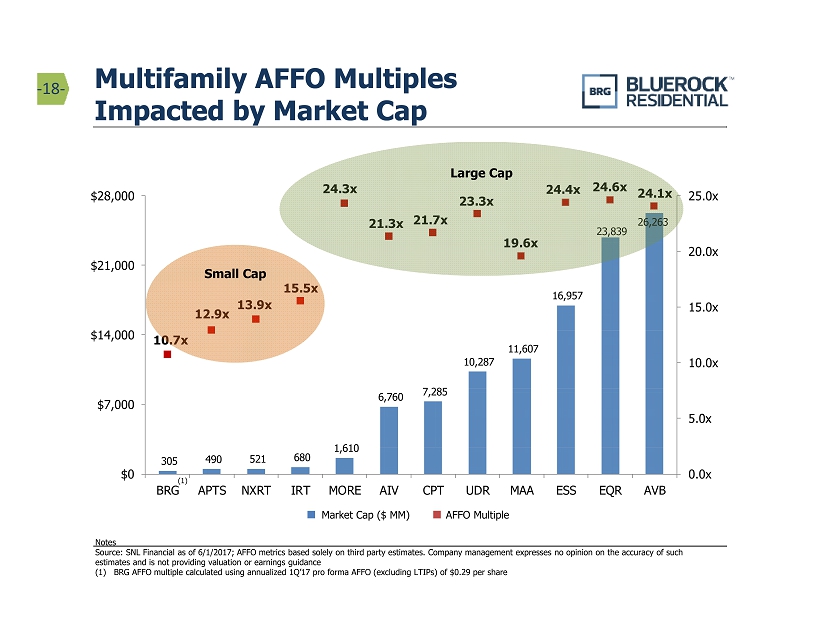
305 490 521 680 1,610 6,760 7,285 10,287 11,607 16,957 23,839 26,263 10.7x 12.9x 13.9x 15.5x 24.3x 21.3x 21.7x 23.3x 19.6x 24.4x 24.6x 24.1x 0.0x 5.0x 10.0x 15.0x 20.0x 25.0x $0 $7,000 $14,000 $21,000 $28,000 BRG APTS NXRT IRT MORE AIV CPT UDR MAA ESS EQR AVB Multifamily AFFO Multiples Impacted by Market Cap - 18 - Small Cap Large Cap Notes Source: SNL Financial as of 6/1/2017; AFFO metrics based solely on third party estimates. Company management expresses no opinion on the accuracy of such estimates and is not providing valuation or earnings guidance (1) BRG AFFO multiple calculated using annualized 1Q’17 pro forma AFFO (excluding LTIPs) of $0.29 per share Market Cap ($ MM) AFFO Multiple (1)

Ticker Market Cap ($MM) Avg. Unit Rent Wtd. Avg. Property Age Dividend Yield Price/ NAV (est.) Price/ 2017E AFFOx CPT $7,285 $1,419 15 Yrs 3.6% 93% 21.7x MORE $1,610 $1,967 5 Yrs 3.1% 82% 24.3x IRT $680 $1,007 17 Yrs 7.3% 95% 15.5x NXRT $521 $857 30 Yrs 3.6% 96% 13.9x APTS $490 $1,217 7 Yrs 6.0% 97% 12.9x Average $2,117 $1,293 15 Yrs 4.7% 93% 17.7x BRG $305 $1,434 9 Yrs 9.2% 73% 10.7x Trading at Attractive Metrics Relative to Peers - 19 - Notes Source: SNL Financial as of 6/1/2017; company filings; BRG 2017E AFFO multiple based on annualized 1Q’17 pro forma AFFO (excluding LTIPs) of $0.29 per share; BRG average unit rent is pro forma for development properties Financials as of 1Q’17, except per share metrics. NAV and AFFO metrics are based on estimates. Company management expresses n o o pinion in this presentation on the accuracy of such estimates and is not providing valuation or earnings guidance, including without limitation any update to pr evi ously rendered earnings guidance; 2017 AFFO metrics are pro forma and do not reflect actual or anticipated performance results. Readers should refer to the Company’s earnings supplement for the three months ended March 31, 2017 for underlying assumptions
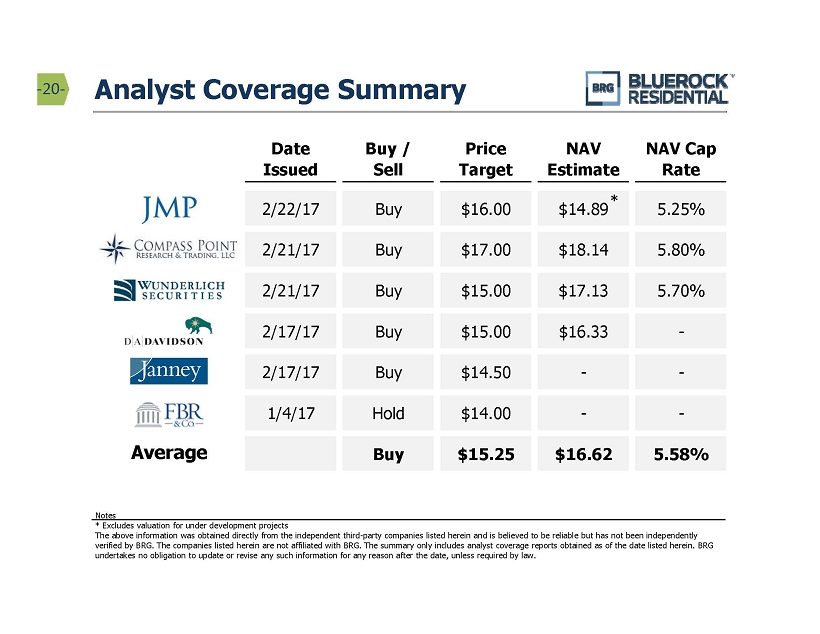
Analyst Coverage Summary - 20 - Notes * Excludes valuation for under development projects The above information was obtained directly from the independent third - party companies listed herein and is believed to be relia ble but has not been independently verified by BRG. The companies listed herein are not affiliated with BRG. The summary only includes analyst coverage reports obt ained as of the date listed herein. BRG undertakes no obligation to update or revise any such information for any reason after the date, unless required by law. Date Issued Buy / Sell Price Target NAV Estimate NAV Cap Rate JMP 2/22/17 Buy $16.00 $14.89 5.25% Compass Point 2/21/17 Buy $17.00 $18.14 5.80% Wunderlich 2/21/17 Buy $15.00 $17.13 5.70% DA Davidson 2/17/17 Buy $15.00 $16.33 - Janney 2/17/17 Buy $14.50 - - FBR 1/4/17 Hold $14.00 - - Average Buy $15.25 $16.62 5.58% * Average
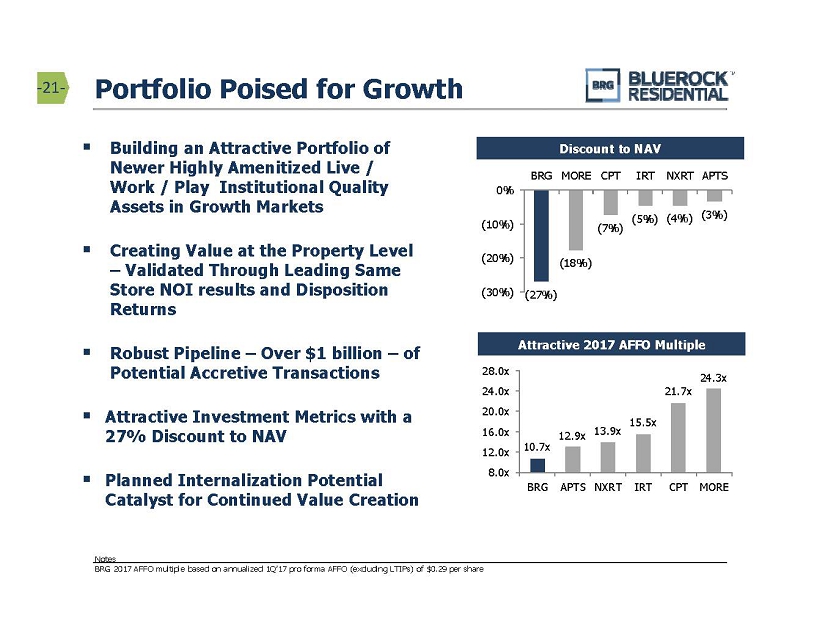
10.7x 12.9x 13.9x 15.5x 21.7x 24.3x 8.0x 12.0x 16.0x 20.0x 24.0x 28.0x BRG APTS NXRT IRT CPT MORE ▪ Building an Attractive Portfolio of Newer Highly Amenitized Live / Work / Play Institutional Quality Assets in Growth Markets ▪ Creating Value at the Property Level – Validated Through Leading Same Store NOI results and Disposition Returns ▪ Robust Pipeline – Over $1 billion – of Potential Accretive Transactions ▪ Attractive Investment Metrics with a 27% Discount to NAV ▪ Planned Internalization Potential Catalyst for Continued Value Creation Portfolio Poised for Growth Discount to NAV Attractive 2017 AFFO Multiple - 21 - Notes BRG 2017 AFFO multiple based on annualized 1Q’17 pro forma AFFO (excluding LTIPs) of $0.29 per share (27%) (18%) (7%) (5%) (4%) (3%) (30%) (20%) (10%) 0% BRG MORE CPT IRT NXRT APTS

APPENDIX A

FFO / AFFO - 23 - Funds from Operations and Adjusted Funds from Operations Funds from operations attributable to common stockholders (“FFO”), are non - GAAP financial measures that are widely recognized as a measure of REIT operating performance . We consider FFO attributable to common stockholders to be an appropriate supplemental measure of our operating performance as it is based on a net income analysis of property portfolio performance that excludes non - cash items such as depreciation . The historical accounting convention used for real estate assets requires straight - line depreciation of buildings and improvements, which implies that the value of real estate assets diminishes predictably over time . Since real estate values historically rise and fall with market conditions, presentations of operating results for a REIT, using historical accounting for depreciation, could be less informative . We define FFO, consistent with the National Association of Real Estate Investment Trusts, or (“NAREIT's”), definition, as net income, computed in accordance with GAAP, excluding gains (or losses) from sales of property, plus depreciation and amortization of real estate assets, plus impairment writedowns of depreciable real estate, and after adjustments for unconsolidated partnerships and joint ventures . Adjustments for unconsolidated partnerships and joint ventures will be calculated to reflect FFO on the same basis . In addition to FFO attributable to common stockholders, we use adjusted funds from operations attributable to common stockholders (“AFFO”) . AFFO is a computation made by analysts and investors to measure a real estate company's operating performance by removing the effect of items that do not reflect ongoing property operations . To calculate AFFO, we further adjust FFO by adding back certain items that are not added to net income in NAREIT's definition of FFO, such as acquisition expenses, equity based compensation expenses, and any other non - recurring or non - cash expenses, which are costs that do not relate to the operating performance of our properties, and subtracting recurring capital expenditures (and when calculating the quarterly incentive fee payable to our Manager only, we further adjust FFO to include any realized gains or losses on our real estate investments) . Our calculation of AFFO differs from the methodology used for calculating AFFO by certain other REITs and, accordingly, our AFFO may not be comparable to AFFO reported by other REITs . Our management utilizes FFO and AFFO as measures of our operating performance after adjustment for certain non - cash items, such as depreciation and amortization expenses, and acquisition expenses and pursuit costs that are required by GAAP to be expensed but may not necessarily be indicative of current operating performance and that may not accurately compare our operating performance between periods . Furthermore, although FFO, AFFO and other supplemental performance measures are defined in various ways throughout the REIT industry, we also believe that FFO and AFFO may provide us and our stockholders with an additional useful measure to compare our financial performance to certain other REITs . We also use AFFO for purposes of determining the quarterly incentive fee, if any, payable to our Manager . Neither FFO nor AFFO is equivalent to net income or cash generated from operating activities determined in accordance with GAAP . Furthermore, FFO and AFFO do not represent amounts available for management's discretionary use because of needed capital replacement or expansion, debt service obligations or other commitments or uncertainties . Neither FFO nor AFFO should be considered as an alternative to net income as an indicator of our operating performance or as an alternative to cash flow from operating activities as a measure of our liquidity .

Jun 30, Sep 30, Dec 31, Mar 31, Jun 30, Sep 30, Dec 31, Mar 31, 2015 2015 2015 2016 2016 2016 2016 2017 Net income (loss) attributable to common stockholders $ (582) $ (574) $ (1,523) $ (4,135) $ (5,043) $ (2,551) $ (7,260) $ (4,990) Common stockholders pro-rata share of: Real estate depreciation and amortization (1) 2,647 3,082 4,728 6,470 6,769 6,197 7,527 9,802 (Gain) loss on sale of joint venture interests 2 2 - - - - - - (Gain) loss on sale of real estate assets - - (2,640) - - (4,876) (1,828) (7,397) FFO Attributable to Common Stockholders (2) $ 2,067 $ 2,510 $ 565 $ 2,335 $ 1,726 $ (1,230) $ (1,561) $ (2,585) Common stockholders pro-rata share of: Amortization of non-cash interest expense 72 148 83 83 65 472 171 474 Acquisition and pursuit costs 210 682 2,008 1,147 227 619 2,130 3,006 Loss on early extinguishment of debt - - - - - 2,269 - - Normally recurring capital expenditures (184) (215) (147) (208) (208) (239) (252) (291) Management internalization process 63 475 Preferred stock accretion 123 166 271 320 333 Non-cash equity compensation 927 1,529 1,910 1,818 2,400 2,382 2,805 3,165 Non-cash tax abatement 85 - Non-recurring income - (289) (121) - - (231) (23) - AFFO Attributable to Common Stockholders (2) $ 3,092 $ 4,365 $ 4,298 $ 5,298 $ 4,376 $ 4,313 $ 3,738 $ 4,577 Weighted average common shares outstanding - diluted 16,353,209 (3) 20,181,656 (5) 20,447,381 (7) 20,534,974 (9) 20,688,631 (11) 20,909,727 (13) 21,102,894 (15) 24,990,282 (17) PER SHARE INFORMATION: FFO Attributable to Common Stockholders - diluted $ 0.13 $ 0.12 $ 0.03 $ 0.11 $ 0.08 $ (0.06) $ (0.07) $ (0.10) AFFO Attributable to Common Stockholders - diluted $ 0.19 $ 0.22 $ 0.21 $ 0.26 $ 0.21 $ 0.21 $ 0.18 $ 0.18 Pro forma AFFO Attributable to Common Stockholders - diluted $ 0.34 (4) $ 0.32 (6) $ 0.31 (8) 0.34$ (10) 0.38 (12) 0.40$ (14) 0.41$ (16) 0.38$ (18) Three Months Ended FFO / AFFO Reconciliation - 24 - See footnotes on p.26, 27 and 28

Jun 30, Sep 30, Dec 31, Mar 31, Jun 30, Sep 30, Dec 31, Mar 31, 2015 (1) 2015 (2) 2015 (3) 2016 (4) 2016 (5) 2016 (6) 2016 (7) 2017 (8) Net income (loss) attributable to common stockholders (582)$ (574)$ (1,523)$ (4,135)$ (5,043)$ (2,551)$ (7,260)$ (4,990)$ Add pro-rata share: Depreciation and amortization 2,647 3,082 4,728 6,470 6,769 6,197 7,527 9,802 Amortization of non-cash interest expense 71 148 83 83 65 472 171 474 Line of credit interest, net - - - - - - - - Management fees 701 890 1,144 1,197 1,394 1,839 1,987 2,737 Acquisition and pursuit costs 210 682 2,008 1,147 227 619 2,130 3,006 Loss on early extinguishment of debt - - - - - 2,269 - - Corporate operating expenses 732 1,245 1,166 1,269 1,666 1,169 1,680 1,433 Management internalization process - - - - - - 63 475 Preferred dividends - - 1,153 1,461 2,924 3,883 5,298 5,786 Preferred stock accretion - - - 123 166 271 320 333 Less pro-rata share: Other income 51 23 1 - - 26 - - Preferred returns and equity in income of unconsolidated real estate joint ventures 1,286 2,327 2,276 2,730 2,733 3,030 2,973 2,543 Interest income from related parties 17 1,506 Gain (loss) on sale of joint venture interest, net of fees (2) (2) - - - - - - Gain on sale of real estate assets - - 2,640 - - 4,876 1,828 7,397 Pro-rata share of properties' income (loss) 2,444 3,125 3,842 4,885 5,435 6,236 7,098 7,610 Add: Noncontrolling interest pro-rata share of property income 941 752 886 1,015 1,065 1,120 1,300 1,246 Other (income) loss related to JV/MM entities 36 14 44 - - - - - Total property income (loss) 3,421 3,891 4,772 5,900 6,500 7,356 8,398 8,856 Add: Interest expense 2,676 2,942 3,448 4,141 4,510 4,730 5,628 6,453 Net operating income 6,097 6,833 8,220 10,041 11,010 12,086 14,026 15,309 Less: Non-same store net operating income 2,454 2,082 3,647 4,805 4,768 6,338 7,606 7,031 Same store net operating income 3,643$ 4,751$ 4,573$ 5,236$ 6,242$ 5,748$ 6,420$ 8,278$ Three Months Ended Same Store NOI Reconciliation - 25 - See footnotes on p. 28 We believe that net operating income, or NOI, is a useful measure of our operating performance . We define NOI as total property revenues less total property operating expenses, excluding depreciation and amortization and interest . Other REITs may use different methodologies for calculating NOI, and accordingly, our NOI may not be comparable to other REITs . We believe that this measure provides an operating perspective not immediately apparent from GAAP operating income or net income . We use NOI to evaluate our performance on a same store and non - same store basis because NOI measures the core operations of property performance by excluding corporate level expenses and other items not related to property operating performance and captures trends in rental housing and property operating expenses . Same store properties are conventional multifamily residential apartments which were owned and operational for the entire periods presented, including each comparative period . NOI should only be used as an alternative measure of our financial performance . The following table reflects same store and non - same store contributions to consolidated NOI together with a reconciliation of NOI to net (loss) income attributable to common stockholders as computed in accordance with GAAP for the periods presented (unaudited and amounts in thousands) :

Reconciliation Footnotes - 26 - FFO / AFFO Reconciliation (p . 24 ) 1) The real estate depreciation and amortization amount includes our share of consolidated real estate - related depreciation and amortization of intangibles, less amounts attributable to noncontrolling interests, and our similar estimated share of unconsolidated depreciation and amortization, which is included in earnings of our unconsolidated real estate joint venture investments . 2) Individual line items included in FFO and AFFO calculations include results from discontinued operations where applicable . 3) Total weighted average shares for the three months ended June 30 , 2015 including OP units of 282 , 759 was 16 , 635 , 968 . AFFO related to the OP units is excluded from the calculation above . When including both, AFFO attributable to OP units and 282 , 759 of OP units in the weighted average share count, in the above calculation, AFFO is $ 0 . 13 per share . 4) Pro forma AFFO for the three months ended June 30 , 2015 assumes the following pipeline transactions had occurred on April 1 , 2015 : (i) investment of approximately $ 8 . 7 million in the second funding of the Alexan Southside Place in Houston, Texas ; (ii) investment of approximately $ 1 . 3 million to increase our ownership in our existing Fox Hill and Park & Kingston properties ; (iii) investment of approximately $ 15 . 0 million in convertible preferred equity in Cheshire Bridge, a Class A asset in Atlanta, Georgia ; (iv) investment of approximately $ 26 . 0 million in the acquisition of two Class A assets our Sponsor currently has under LOI in North Carolina ; and (v) investment of approximately $ 10 . 1 million in convertible preferred equity in a development asset our Sponsor currently has under LOI in a target Florida market . Pro forma AFFO does not include the impact of the May 2015 Follow - On Offering, i . e . it does not include the benefit from the investment of proceeds from the follow - on offering or the impact of the additional share issuance . The pro forma AFFO guidance is being presented solely for the purpose of illustrating the potential impact of these pipeline transactions as if they had occurred at April 1 , 2015 , based on information currently available to management . The Company is providing no assurances that any of the above transactions will close, and the failure of any of these transactions to close would significantly impact pro forma guidance . The actual timing of these investments, if and when made, will vary materially from the assumed timing reflected in the pro forma guidance, and actual quarterly results will differ significantly from the pro forma guidance shown above . 5) Total weighted average shares for the three months ended September 30 , 2015 including OP units of 282 , 759 was 20 , 464 , 415 . AFFO related to the OP units is excluded from the calculation above . When including both, AFFO attributable to OP units and 282 , 759 of OP units in the weighted average share count, in the above calculation, AFFO is $ 0 . 22 per share . 6) Pro forma AFFO for the three months ended September 30 , 2015 assumes the following pipeline transactions had occurred on July 1 , 2015 : (i) investment of approximately $ 21 million in the acquisition of two Class A assets the Company has under contract in North Carolina, (ii) investment of approximately $ 14 million in convertible preferred equity in a development asset the Company has under binding LOI in a target Florida market ; (iii) investment of approximately $ 16 million in convertible preferred equity in a development asset our Sponsor entity has under binding LOI in a target North Carolina market ; (iv) investment of approximately $ 13 million in a Class A asset the Company has under contract in Florida ; and (v) investment of approximately $ 30 million in the acquisition of two Class A assets our Sponsor entity has under LOI in Texas . The pro forma guidance is being presented solely for purposes of illustrating the potential impact of these pipeline transactions as if they had occurred at July 1 , 2015 , based on information currently available to management . The Company is providing no assurances that any of the above transactions will close, and the failure of any of these transactions to close would significantly impact pro forma guidance . The actual timing of these investments, if and when made, will vary materially from the assumed timing reflected in the pro forma guidance, and actual quarterly results will differ significantly from the pro forma guidance shown above . 7) Total weighted average shares for the three months ended December 31 , 2015 including OP units of 288 , 213 was 20 , 735 , 595 . AFFO related to the OP units is excluded from the calculation above . When including both, AFFO attributable to OP units and 288 , 213 of OP units in the weighted average share count, in the above calculation, AFFO is $ 0 . 21 per share . 8) Pro forma AFFO for the three months ended December 31 , 2015 assumes the following pipeline transactions had occurred on October 1 , 2015 : (i) investment of approximately $ 33 million to acquire a 95 % interest in Sorrel Phillips Creek Ranch Apartments and The Sovereign Apartments in Texas which closed on October 29 , 2015 , (ii) investment of approximately $ 8 million to acquire a Class A asset the Company has under contract in North Carolina, (iii) investment of approximately $ 10 million in convertible preferred equity in a development asset the Company has under binding LOI in a target North Carolina market ; (iv) investment of approximately $ 17 million in convertible preferred equity in a development asset our Sponsor entity has under binding LOI in a target North Carolina market ; (v) investment of approximately $ 9 million in convertible preferred equity in a development asset our Sponsor entity has under binding LOI in a target Texas market . Pro forma guidance also assumes that $ 69 . 2 million of net proceeds from the October 2015 Follow On Offering are invested 65 % in stabilized properties at a 5 . 75 % cap rate and 35 % invested in convertible preferred equity development assets . The pro forma guidance is being presented solely for purposes of illustrating the potential impact of these pipeline transactions, as well as future investments to be made with funds we have available for investment, as if they had occurred at October 1 , 2015 , based on information currently available to management and assumptions management has made with respect to our future pipeline . The Company is providing no assurances that any of the above transactions will close or that management will identify or acquire investments consistent with our pipeline assumptions, and the failure to do so would significantly impact pro forma guidance . The actual timing of these investments, if and when made, will vary materially from the assumed timing reflected in the pro forma guidance, and actual quarterly results will differ significantly from the pro forma guidance shown above . Investors should not rely on pro forma guidance as a forecast of the actual performance of the Company . 9) Total weighted average shares for the three months ended March 31 , 2016 including OP units of 305 , 568 was 20 , 840 , 542 . AFFO related to the OP units is excluded from the calculation above . When including both, AFFO attributable to OP units and 305 , 568 of OP units in the weighted average share count, in the above calculation, AFFO is $ 0 . 26 per share .
Reconciliation Footnotes - 27 - FFO / AFFO Reconciliation (p . 24 ), continued 10) Pro forma AFFO for the three months ended March 31 , 2016 assumes the investment of $ 76 million (consisting of available cash, deposits, and expected loan proceeds) had occurred on January 1 , 2016 : (i) investment of approximately $ 30 million to acquire a 95 % interest in the Citation Club at Palmer Ranch Apartments and Summerwind Apartments in Florida, which closed on January 5 , 2016 ; (ii) initial investment of approximately $ 12 million in convertible preferred equity in the West Morehead development asset in Charlotte, North Carolina, which closed on January 6 , 2016 ; (iii) investment of approximately $ 10 million in convertible preferred equity in the Domain development asset in Garland, Texas ; (iv) investment of approximately $ 7 million in the Flagler Village development asset in Ft . Lauderdale, Florida ; and (v) investment of approximately $ 17 million to acquire a 100 % interest in The Preserve at Henderson Beach in Destin, Florida, which closed on March 15 , 2016 . The pro forma guidance is being presented solely for purposes of illustrating the potential impact of these pipeline transactions, as well as future investments to be made with funds we have available for investment, as if they had occurred at January 1 , 2016 , based on information currently available to management and assumptions management has made with respect to our future pipeline . The Company is providing no assurances that any of the above transactions will close or perform as forecasted or that management will identify or acquire investments consistent with our pipeline assumptions, and the failure to do so would significantly impact pro forma guidance . The actual timing of these investments, if and when made, will vary materially from the assumed timing reflected in the pro forma guidance, and actual quarterly results will differ significantly from the pro forma guidance shown above . Investors should not rely on pro forma guidance as a forecast of the actual performance of the Company . 11) Total weighted average shares for the three months ended June 30 , 2016 including OP units of 305 , 568 was 20 , 994 , 199 . AFFO related to the OP units is excluded from the calculation above . When including both, AFFO attributable to OP units and 305 , 568 of OP units in the weighted average share count, in the above calculation, AFFO is $ 0 . 21 per share . 12) Pro forma AFFO for the three months ended June 30 , 2016 assumes the investment of $ 80 million (consisting of available cash, earnest money deposits, expected loan proceeds, and net offering proceeds) had occurred on April 1 , 2016 : (i) additional investment of approximately $ 2 million in the Lake Boone convertible preferred equity investment, (ii) investment of approximately $ 23 million in a convertible mezzanine loan structure in connection with a joint venture, which entitles us to invest in Jacksonville MSA ; (iii) investment of approximately $ 15 million in convertible preferred equity in a development asset in the Dallas MSA ; (iv) investment of approximately $ 14 million in a convertible mezzanine loan structure in connection with a joint venture, which entitles us to invest in Ft . Lauderdale, FL ; and (v) investment of approximately $ 9 million in a convertible mezzanine loan structure in a development asset an affiliate of the Company has under binding LOI in Boca Raton MSA . Pro forma guidance also assumes that $ 17 million is invested 65 % in stabilized properties at a nominal 5 . 75 % cap rate with interest expense at a rate of 3 . 75 % , and 35 % invested in convertible preferred equity development assets . The pro forma guidance is being presented solely for purposes of illustrating the potential impact of these pipeline transactions, as well as future investments to be made with funds we have available for investment, as if they had occurred at April 1 , 2016 , based on information currently available to management and assumptions management has made with respect to our future pipeline . The Company is providing no assurances that any of the above transactions are probable, or that they will close or that management will identify or acquire investments consistent with our pipeline assumptions, and the failure to do so would significantly impact pro forma guidance . The actual timing of these investments, if and when made, will vary materially from the assumed timing reflected in the pro forma guidance, and actual quarterly results will differ significantly from the pro forma guidance shown above . Investors should not rely on pro forma guidance as a forecast of the actual performance of the Company . 13) Total weighted average shares for the three months ended September 30 , 2016 including OP units of 304 , 816 was 21 , 214 , 543 . AFFO related to the OP units is excluded from the calculation above . When including both, AFFO attributable to OP units and 304 , 816 of OP units in the weighted average share count, in the above calculation, AFFO is $ 0 . 21 per share . 14) Pro forma AFFO for the three months ended September 30 , 2016 assumes the investment of $ 155 million (consisting of available cash, earnest money deposits, expected loan proceeds, and net offering proceeds) had occurred on July 1 , 2016 : (i) additional investment of approximately $ 2 million in the Lake Boone convertible preferred equity investment ; (ii) additional investment of approximately $ 17 million in the West Morehead convertible preferred equity investment ; (iii) investment of approximately $ 23 million in a convertible mezzanine loan structure in connection with a joint venture, which entitles us to invest in Jacksonville MSA ; (iv) investment of approximately $ 17 million in convertible preferred equity in the development asset in the Dallas MSA ; (v) investment of approximately $ 3 million in a convertible mezzanine loan structure in connection with a joint venture, which entitles us to invest in Ft . Lauderdale FL ; (vi) investment of approximately $ 9 million in a convertible mezzanine loan structure in a development asset the Company has under binding LOI in Boca Raton MSA ; (vii) investment of approximately $ 22 million in Tenside Apartments in Georgia which closed on July 14 , 2016 ; and (viii) investment of approximately $ 24 million in an operating asset located in the Atlanta MSA . Pro forma guidance also assumes that $ 38 million is invested 65 % in stabilized properties at a nominal 5 . 75 % cap rate with interest expense at a rate of 3 . 75 % , and 35 % invested in convertible preferred equity development assets . The pro forma guidance is being presented solely for purposes of illustrating the potential impact of these pipeline transactions, as well as future investments to be made with funds we have available for investment, as if they had occurred at July 1 , 2016 , based on information currently available to management and assumptions management has made with respect to our future pipeline . The Company is providing no assurances that any of the above transactions are probable, or that they will close or that management will identify or acquire investments consistent with our pipeline assumptions, and the failure to do so would significantly impact pro forma guidance . The actual timing of these investments, if and when made, will vary materially from the assumed timing reflected in the pro forma guidance, and actual quarterly results will differ significantly from the pro forma guidance shown above . Investors should not rely on pro forma guidance as a forecast of the actual performance of the Company . 15) Total weighted average shares for the three months ended December 31 , 2016 including OP units of 298 , 318 was 21 , 401 , 212 . AFFO related to the OP units is excluded from the calculation above . When including both, AFFO attributable to OP units and 298 , 318 of OP units in the weighted average share count, in the above calculation, AFFO is $ 0 . 18 per share .

Reconciliation Footnotes - 28 - FFO / AFFO Reconciliation (p . 24 ), continued 16) Pro forma AFFO for the three months ended December 31 , 2016 assumes the investment of the $ 209 million in estimated available cash had occurred on October 1 , 2016 : (i) additional investment of approximately $ 2 million in the Lake Boone preferred equity investment, (ii) additional investment of approximately $ 18 million in West Morehead and amending the investment to a mezzanine loan structure ; (iii) investment of approximately $ 24 million in a mezzanine loan structure in connection with a joint venture, which entitles us to invest in Jacksonville MSA ; (iv) additional investment of approximately $ 19 million in Domain and amending the investment to a mezzanine loan structure ; (v) investment of approximately $ 11 million in a mezzanine loan structure in connection with a joint venture, which entitles us to invest Boca Raton MSA ; (vi) investment of approximately $ 24 million in Nevadan Apartments in Georgia which closed on October 13 , 2016 ; (vii) investment of approximately $ 16 million in a Class B+ asset the Company has under agreement in Austin, Texas ; (viii) investment of approximately $ 11 million in APEX Apartments in Port St . Lucie, Florida which closed on October 31 , 2016 ; (ix) investment of approximately $ 26 million in a Class A asset the Company has under agreement in Georgia ; (x) investment of approximately $ 11 million in a Class A asset the Company has under agreement in Austin, Texas ; (xi) investment of approximately $ 20 million in mezzanine loan structure in a development asset in the Atlanta, Georgia ; (xii) investment of approximately $ 11 million in mezzanine loan structure in a development asset in the Atlanta, Georgia . Pro forma guidance also assumes that $ 16 million is invested in stabilized properties at a nominal 5 . 75 % cap rate with interest expense at a rate of 3 . 75 % . The pro forma guidance is being presented solely for purposes of illustrating the potential impact of these pipeline transactions, as well as future investments to be made with funds we have available for investment, as if they had occurred at October 1 , 2016 , based on information currently available to management and assumptions management has made with respect to our future pipeline . The Company is providing no assurances that any of the above transactions are probable, or that they will close or that management will identify or acquire investments consistent with our pipeline assumptions, and the failure to do so would significantly impact pro forma guidance . The actual timing of these investments, if and when made, will vary materially from the assumed timing reflected in the pro forma guidance, and actual quarterly results will differ significantly from the pro forma guidance shown above . Investors should not rely on pro forma guidance as a forecast of the actual performance of the Company . 17) Total weighted average shares for the three months ended March 31 , 2017 including OP units of 283 , 198 was 25 , 273 , 480 . AFFO related to the OP units is excluded from the calculation above . When including both, AFFO attributable to OP units and 283 , 198 of OP units in the weighted average share count, in the above calculation, AFFO is $ 0 . 18 per share . 18) Pro forma AFFO for the three months ended March 31 , 2017 assumes the investment of $ 150 million in estimated available cash had occurred on January 1 , 2017 : (i) additional investment of approximately $ 2 million in the Lake Boone preferred equity investment in Raleigh, North Carolina, (ii) additional investment of approximately $ 3 million in the West Morehead mezzanine loan in Charlotte, North Carolina ; (iii) investments totaling approximately $ 61 million in mezzanine loan identified developments in Dallas, Texas, Boca Raton, Jacksonville & Fort Lauderdale, Florida, and Atlanta, Georgia ; and (iv) investments totaling approximately $ 35 million in Class A assets in Morrisville, North Carolina and Charlotte, North Carolina . Pro forma guidance also assumes that $ 27 million is invested in stabilized properties at a 5 . 75 % nominal cap rate with interest expense at a rate of 3 . 75 % and that $ 22 million is invested in mezzanine loans . The pro forma guidance is being presented solely for purposes of illustrating the potential impact of these pipeline transactions, as well as future investments to be made with funds we have available for investment, as if they had occurred at January 1 , 2017 , based on information currently available to management and assumptions management has made with respect to our future pipeline . The Company is providing no assurances that any of the above transactions are probable, or that they will close or that management will identify or acquire investments consistent with our pipeline assumptions, and the failure to do so would significantly impact pro forma guidance . The actual timing of these investments, if and when made, will vary materially from the assumed timing reflected in the pro forma guidance, and actual quarterly results will differ significantly from the pro forma guidance shown above . Investors should not rely on pro forma guidance as a forecast of the actual performance of the Company . Same Store NOI Reconciliation (p . 25 ) 1) Same Store sales for the three months ended June 30 , 2015 related to the following properties : Springhouse at Newport News, Enders Place at Baldwin Park, MDA Apartments, Village Green of Ann Arbor and North Park Towers . 2) Same Store sales for the three months ended September 30 , 2015 related to the following properties : Springhouse at Newport News, Enders Place at Baldwin Park, MDA Apartments, Village Green of Ann Arbor, North Park Towers, and Lansbrook Village . 3) Same Store sales for the three months ended December 31 , 2015 related to the following properties : Springhouse at Newport News, Enders Place at Baldwin Park, MDA Apartments, Village Green of Ann Arbor, and Lansbrook Village . 4) Same Store sales for the three months ended March 31 , 2016 related to the following properties : Springhouse at Newport News, Enders Place at Baldwin Park, MDA Apartments, Village Green of Ann Arbor, Lansbrook Village, and ARIUM Grandewood . 5) Same Store sales for the three months ended June 30 , 2016 related to the following properties : Springhouse at Newport News, Enders Place at Baldwin Park, MDA Apartments, Village Green of Ann Arbor, Lansbrook Village, ARIUM Grandewood, Fox Hill, and Park & Kingston . 6) Same Store sales for the three months ended September 30 , 2016 related to the following properties : Enders Place at Baldwin Park, MDA Apartments, Village Green of Ann Arbor, Lansbrook Village, ARIUM Grandewood, Fox Hill, and Park & Kingston . 7) Same Store sales for the three months ended December 31 , 2016 related to the following properties : Enders Place at Baldwin Park, MDA Apartments, Village Green of Ann Arbor, Lansbrook Village, ARIUM Grandewood, Fox Hill, Park & Kingston, and ARIUM Palms . 8) Same Store sales for the three months ended March 31 , 2017 related to the following properties : Enders Place at Baldwin Park, MDA Apartments, Lansbrook Village, ARIUM Grandewood, Fox Hill, Park & Kingston, ARIUM Palms, Ashton Reserve, Sovereign, ARIUM at Palmer Ranch, and ARIUM Gulfshore .
