Attached files
| file | filename |
|---|---|
| 8-K - FORM 8-K ANNUAL MEETING RESULTS - MIDSOUTH BANCORP INC | midsouth-form8xkxsharehold.htm |

Annual Shareholder Meeting
May 24, 2017

2
Certain statements contained herein are forward-looking statements within the meaning of Section 27A of the Securities Act of 1933
and Section 21E of the Securities Exchange Act of 1934 and subject to the safe harbor provisions of the Private Securities Litigation
Reform Act of 1995, which involve risks and uncertainties. These statements include, among others, the expected performance of
new hires, performance in non-energy related lending, expected loan loss provision and other financial results.
Actual results may differ materially from the results anticipated in these forward-looking statements. Factors that might cause such a
difference include, among other matters, changes in interest rates and market prices that could affect the net interest margin, asset
valuation, and expense levels; changes in local economic and business conditions, including, without limitation, changes related to the
oil and gas industries, that could adversely affect customers and their ability to repay borrowings under agreed upon terms, adversely
affect the value of the underlying collateral related to their borrowings, and reduce demand for loans; the timing and ability to reach
any agreement to restructure nonaccrual loans; increased competition for deposits and loans which could affect compositions, rates
and terms; the timing and impact of future acquisitions, the success or failure of integrating operations, and the ability to capitalize on
growth opportunities upon entering new markets; loss of critical personnel and the challenge of hiring qualified personnel at
reasonable compensation levels; legislative and regulatory changes, including changes in banking, securities and tax laws and
regulations and their application by our regulators, changes in the scope and cost of FDIC insurance and other coverage; and other
factors discussed under the heading “Risk Factors” in MidSouth’s Annual Report on Form 10-K for the year ended December 31, 2016
filed with the SEC on March 16, 2017 and in its other filings with the SEC.
MidSouth does not undertake any obligation to publicly update or revise any of these forward-looking statements, whether to reflect
new information, future events or otherwise, except as required by law.
Forward Looking Statements

3
Headquarters: Lafayette, LA Total Assets: $1.9 billion
Founded: 1985 Gross Loans: $1.3 billion
Offices: 57 branch locations Total Deposits: $1.6 billion
Geography: 26 parishes / counties in Louisiana and Texas Total Shareholders’ Equity: $216.1 million
Tangible Common Equity: $128.4 million
Tangible Common Equity / Tangible Assets: 6.80%
Tier I Leverage Ratio: 10.27%
Total RBC Ratio: 14.40%
LTM Net Income / LTM EPS: $9.6 million / $0.56
LTM Efficiency Ratio: 72.5%
LTM ROAA: 0.50%
LTM ROATCE: 5.46%
Market Capitalization: $160.8 million
Total Common Shares Outstanding: 11,383,914 shares
Average Daily Trading Volume: 19,207 shares
Insider Ownership: 20.8%
Institutional Ownership: 37.0%
Q1 2017 Common Dividends per Share: $0.09
Note: Financial information as of March 31, 2017; market data as of May 18, 2017; Source: SNL Financial
Company Profile
Company Overview
Branch Footprint
Financial Highlights
Market Information
4
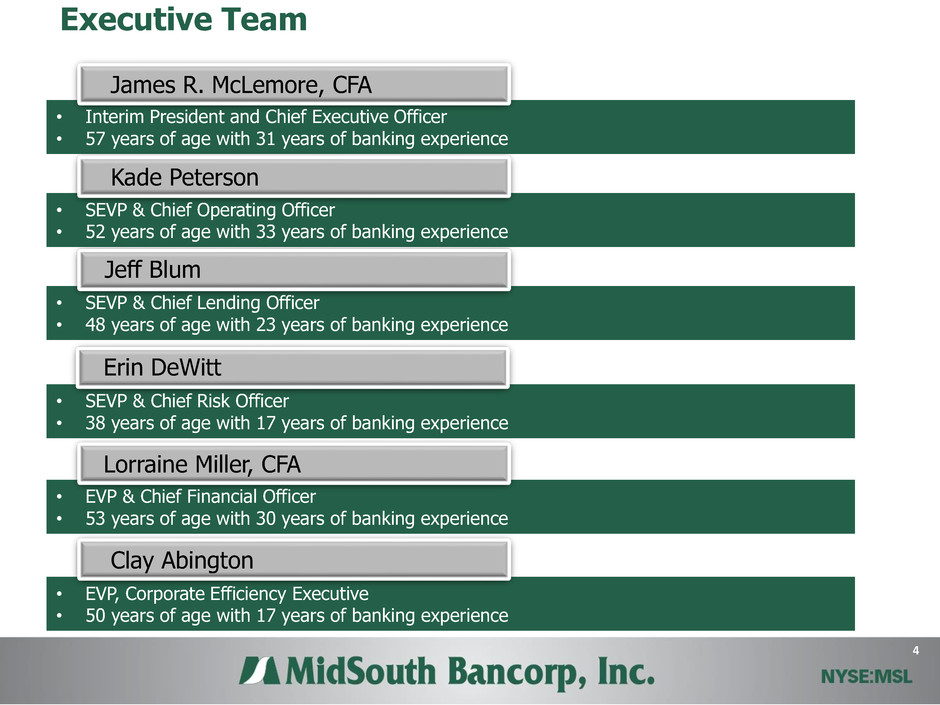
Executive Team
• Interim President and Chief Executive Officer
• 57 years of age with 31 years of banking experience
James R. McLemore, CFA
• SEVP & Chief Operating Officer
• 52 years of age with 33 years of banking experience
Kade Peterson
• SEVP & Chief Lending Officer
• 48 years of age with 23 years of banking experience
Jeff Blum
• SEVP & Chief Risk Officer
• 38 years of age with 17 years of banking experience
Erin DeWitt
• EVP & Chief Financial Officer
• 53 years of age with 30 years of banking experience
Lorraine Miller, CFA
• EVP, Corporate Efficiency Executive
• 50 years of age with 17 years of banking experience
Clay Abington
5
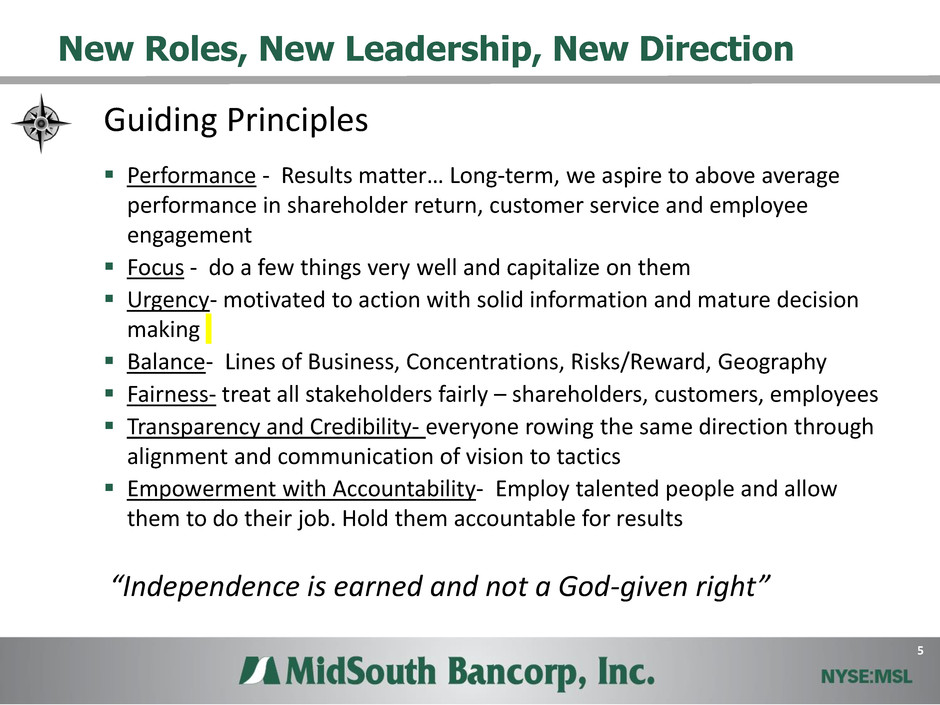
Performance - Results matter… Long-term, we aspire to above average
performance in shareholder return, customer service and employee
engagement
Focus - do a few things very well and capitalize on them
Urgency- motivated to action with solid information and mature decision
making
Balance- Lines of Business, Concentrations, Risks/Reward, Geography
Fairness- treat all stakeholders fairly – shareholders, customers, employees
Transparency and Credibility- everyone rowing the same direction through
alignment and communication of vision to tactics
Empowerment with Accountability- Employ talented people and allow
them to do their job. Hold them accountable for results
New Roles, New Leadership, New Direction
Guiding Principles
“Independence is earned and not a God-given right”

6
Peer Groups – Comparative Metrics
(1) Peer group is Major Exchange Banks with Total Assets $1.0 Billion - $4.0 Billion and Research Analyst Coverage of 3+ Analysts (43 Banks); Source: SNL Financial
0.90
0.98
0.56
0.49
0.00
0.20
0.40
0.60
0.80
1.00
1.20
2015Y 2016Y
ROAA (%)
8.77
9.21
5.16
4.34
0.00
1.00
2.00
3.00
4.00
5.00
6.00
7.00
8.00
9.00
10.00
2015Y 2016Y
ROAE (%)
3.71 3.72
4.34
4.14
0.00
1.00
2.00
3.00
4.00
5.00
2015Y 2016Y
Net Interest Margin (%)
64.8 63.8
68.4
72.0
0.0
20.0
40.0
60.0
80.0
100.0
2015Y 2016Y
Efficiency Ratio (%)
0.75 0.72
2.82
3.34
0.00
0.50
1.00
1.50
2.0
2.50
3.00
3.50
4.0
2015Y 2016Y
NPAs / Assets (%)
9.11 9.10
6.60 6.67
0.00
2.00
4.00
6. 0
8.00
10.00
12.00
2015Y 2016Y
TCE / TA (%)
Peer Group Median MSL
7
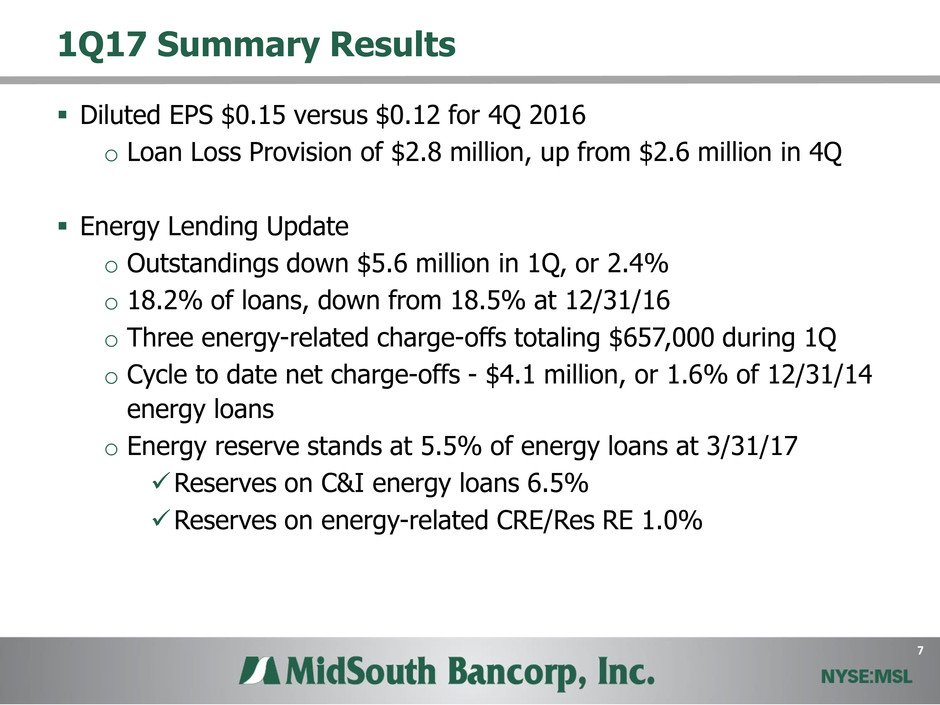
1Q17 Summary Results
Diluted EPS $0.15 versus $0.12 for 4Q 2016
o Loan Loss Provision of $2.8 million, up from $2.6 million in 4Q
Energy Lending Update
o Outstandings down $5.6 million in 1Q, or 2.4%
o 18.2% of loans, down from 18.5% at 12/31/16
o Three energy-related charge-offs totaling $657,000 during 1Q
o Cycle to date net charge-offs - $4.1 million, or 1.6% of 12/31/14
energy loans
o Energy reserve stands at 5.5% of energy loans at 3/31/17
Reserves on C&I energy loans 6.5%
Reserves on energy-related CRE/Res RE 1.0%

8
Attractive Core Deposits
Total deposits at 3/31/17 - $1.573 Billion
Interest
bearing
checking
31%
Money
market &
savings
32%
Time deposits
10%
Non-interest
bearing
checking
27%
Deposits by Type
Lafayette
30%
New Iberia -
Breaux Bridge
14%
Houma -
Thibodaux -
Morgan City
4%
Baton Rouge
5%
Alexandria -
Many -
Natchitoches -
Shreveport
22%
Lake Charles-
Sulphur-Jennings
7%
Houston -
Beaumont -
College Station
9%
Dallas - Fort
Worth - Tyler -
Texarkana
8%
Deposits by Region
LA 82% TX 18%
Q1 ‘17 Cost of Total Deposits: 0.24%
9
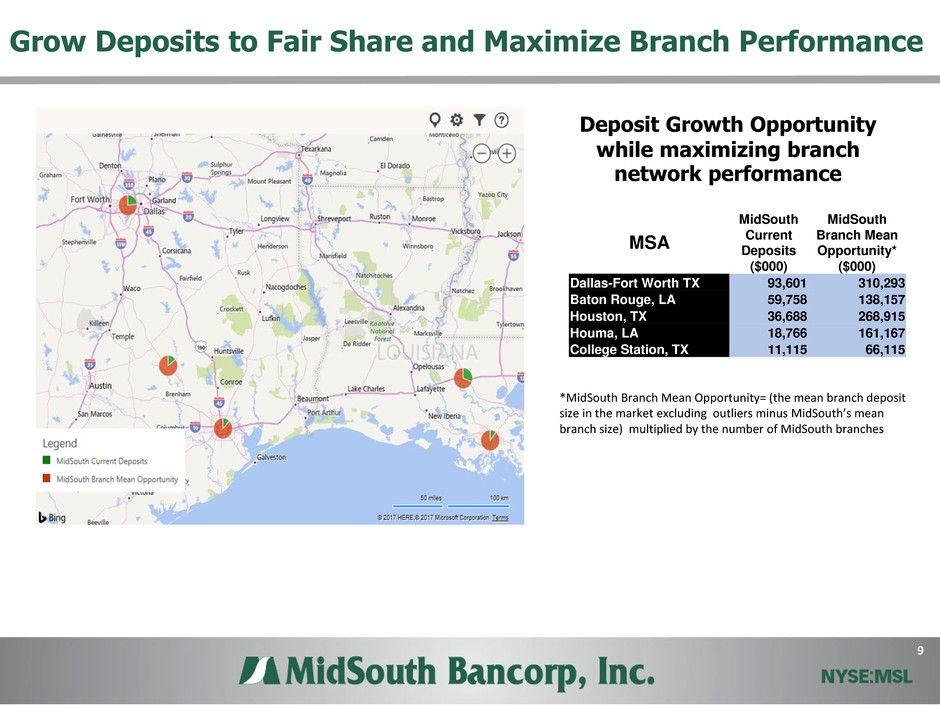
Grow Deposits to Fair Share and Maximize Branch Performance
MSA
MidSouth
Current
Deposits
($000)
MidSouth
Branch Mean
Opportunity*
($000)
Dallas-Fort Worth TX 93,601 310,293
Baton Rouge, LA 59,758 138,157
Houston, TX 36,688 268,915
Houma, LA 18,766 161,167
College Station, TX 11,115 66,115
*MidSouth Branch Mean Opportunity= (the mean branch deposit
size in the market excluding outliers minus MidSouth’s mean
branch size) multiplied by the number of MidSouth branches
Deposit Growth Opportunity
while maximizing branch
network performance
10
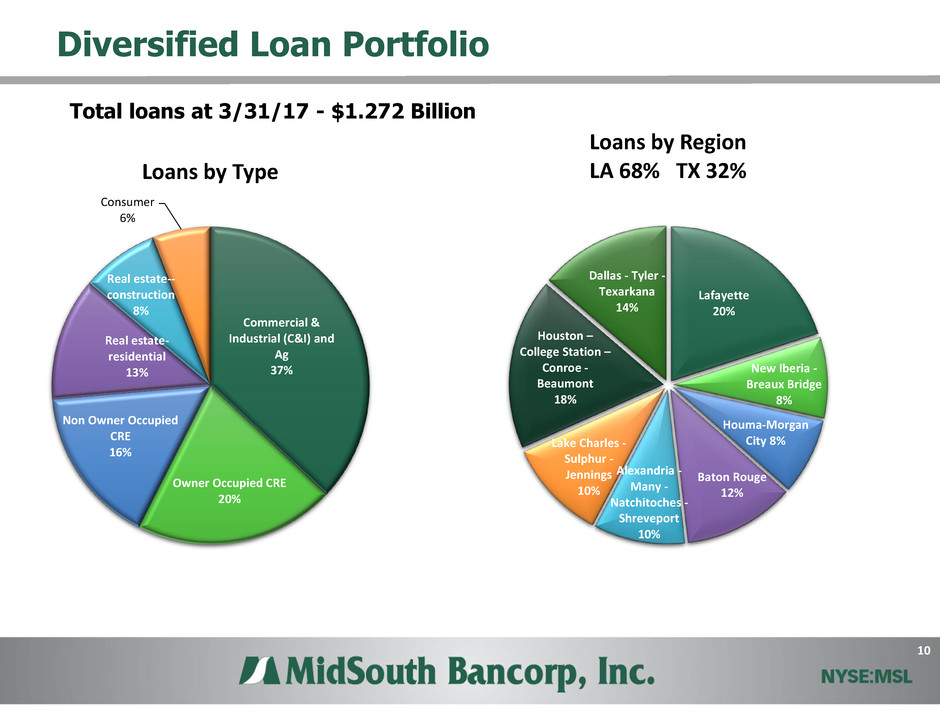
Diversified Loan Portfolio
Total loans at 3/31/17 - $1.272 Billion
Commercial &
Industrial (C&I) and
Ag
37%
Owner Occupied CRE
20%
Non Owner Occupied
CRE
16%
Real estate-
residential
13%
Real estate--
construction
8%
Consumer
6%
Loans by Type
Lafayette
20%
New Iberia -
Breaux Bridge
8%
Houma-Morgan
City 8%
Baton Rouge
12%
Alexandria -
Many -
Natchitoches -
Shreveport
10%
Lake Charles -
Sulphur -
Jennings
10%
Houston –
College Station –
Conroe -
Beaumont
18%
Dallas - Tyler -
Texarkana
14%
Loans by Region
LA 68% TX 32%

11
• Risk Reduction
• Energy/problem credit resolution
• Strengthen underwriting
• Efficiently manage capital position
• Focus on Relationship Banking
• Focus on quality loan growth throughout our markets
• Capitalize on lending opportunities in Houston, Dallas, Lake Charles,
Baton Rouge markets
• Tune the franchise for performance*
• Branch Structure
• Lines of business/products/expenses
• Improve and mature processes
• Improve efficiency of operations with a focus on excellent customer service
• Leverage technology to improve processes and customer experience
Short term Priorities
*some expense/revenue enhancement benefits will be redeployed to other initiatives
12
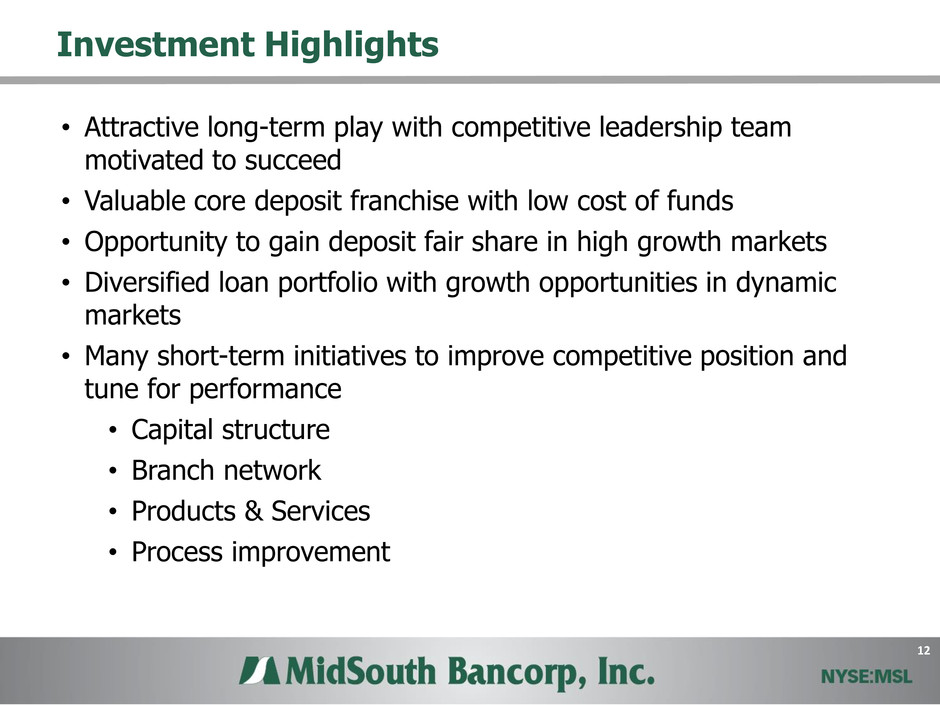
• Attractive long-term play with competitive leadership team
motivated to succeed
• Valuable core deposit franchise with low cost of funds
• Opportunity to gain deposit fair share in high growth markets
• Diversified loan portfolio with growth opportunities in dynamic
markets
• Many short-term initiatives to improve competitive position and
tune for performance
• Capital structure
• Branch network
• Products & Services
• Process improvement
Investment Highlights
