Attached files
| file | filename |
|---|---|
| 8-K - 8-K - SEARS HOMETOWN & OUTLET STORES, INC. | a51917-8k.htm |

1
SHO Performance and Strategy Update
May 24, 2017 Annual Meeting of Stockholders
2
2016 FINANCIAL RESULTS OVERVIEW

3
2016 Performance
($Millions) 2016 2015 2014
NET SALES 2,070$ 2,288$ 2,356$
Cost of sales and occupancy 1,661 1,769 1,803
Gross margin 409 519 553
Margin rate 19.7% 22.7% 23.5%
Selling and administrative 459 546 547
Selling and administrative expense % of sales 22.2% 23.9% 23.2%
Impairment of goodwill, property and equipment 9 4 168
Depreciation and amortization 13 11 9
Gain on the sale of assets (25) - -
Operating loss (48)$ (42)$ (171)$
NET LOSS (132)$ (27)$ (169)$
Net loss (132)$ (27)$ (169)$
Income tax (benefit) expense 81 (15) (3)
Other income (1) (3) (3)
Interest expense 4 3 4
Operating loss (48) (42) (171)
Depreciation and amortization 13 11 9
Gain on the sale of assets (25) - -
Impairment of goodwill, property and equipment 9 4 168
Severance and transition costs - 1 -
Initial franchise revenues net of provision for losses (1) 25 (4)
IT transformation investments 15 11 -
Accelerated closure of under-performing stores 17 - -
ADJUSTED EBITDA (19)$ 9$ 2$
FISCAL YEAR

4
Earnings Review
Results Overview (FY 2016 v. FY 2015):
Comparable store sales decreased 4.4%
Continued pricing pressure, particularly in Outlet, drove gross margin
decrease of 292 bps to 19.7%
Adjusted EBITDA decreased $27.9 million to $(18.5) million
Short-term borrowings decreased $41.5 million to $26.8 million at year-end
2016 compared to $68.3 million at year-end 2015
Performance Drivers:
Hyper-competitive promotional environment pushing down average selling
prices
Shift in customers choosing to purchase directly online with competitors
Accelerated the closure of 109 locations in the fourth quarter of 2016 to
make the best use of capital and lower costs resulting in store closing
charges of $17.7 million and approximately $25 million in net proceeds from
inventory liquidation
Sold San Leandro facility for $26.1 million resulting in gain of $25.2 million

5
Progress on Key Strategic Initiatives
Hometown Transactional Websites
Expanded our capabilities as an ecommerce retailer with the launch of three new transactional
websites for our Hometown segment in the third quarter and further enhanced the websites in
the fourth quarter with the ability to apply for the Sears credit card online with instant approval
and use at check-out
Lease-to-Own Program
Revenue up 20.5% due to increased emphasis on the program and execution of a new
contract with our Lease-to-Own services provider
America’s Appliance Experts
Converted 290 stores to AAE format in 2016 bringing total conversions to 470 stores since the
launch of the program in 2015. Since conversion, these stores have outperformed non-AAE
stores in Home Appliances (“HA”) sales and total sales by 346 bps and 190 bps, respectively;
additional 150 – 200 AAE conversions are planned for 2017
Outlet Sourcing
Completed renegotiation of all non-SHC HA supplier contracts through the first quarter of 2017
to significantly reduce the effective product costs of Outlet Out-of-Box appliances
IT Transformation and Operational Independence
In 2016, we (1) launched our Hometown transactional websites, (2) transitioned
human resources, payroll, and select finance functionalities, (3) paid commissions directly to
our dealers and franchisees, and (4) are now able to purchase directly via electronic data
interchange with many of our suppliers

6
2016 Sales Performance
Hometown
Home appliances comp sales were down 3.4%, impacted by average ticket erosion due to aggressive manufacturer sponsored
promotions
Lawn and garden experienced a 4.9% decline due to unfavorable weather conditions impacting the spring power lawn
equipment category and less snowfall resulting in lower sales of power snow removal equipment
Tools were down 2.5% impacted by reduced marketing spend by the Craftsman brand specific to direct response television
advertising and increased competitor promotional activity in the fourth quarter of 2016
Outlet
Home appliances were down 3.4% as the hyper-competitive environment for New-in-Box appliances drove down the average
ticket for Out-of-Box appliances by 5.9% in 2016.
Lawn and garden experienced an 8.5% decline due to unfavorable weather conditions and inventory availability in Outlet-
oriented mowers and tractors
Tools were down 0.5%, impacted by declines in Portable Power Tools and Mechanic’s Tool sets
-10.0%
-8.0%
-6.0%
-4.0%
-2.0%
0.0%
Hometown Outlet Consolidated
Per
cen
tag
e C
han
ge
2016 Comparable Store Sales
(Major Categories Performance)
Home Appliances Lawn and Garden Tools
-4.2%
-4.9%
-4.4%
-5.0%
-4.0%
-3.0%
Hometown Outlet Consolidated
Per
cen
tag
e C
han
ge
2016 Comparable Store Sales
(All Categories)

7
2016 Home Appliances Sales
We continued to see an increase in unit sales, but sales were
impacted by average ticket erosion due to the competitive promotional
pricing in the market
* Excluding accessories
Hometown Outlet Consolidated
HA Comparable Store Sales:
Dollars -3.4% -3.4% -3.4%
Units* 0.6% 0.6% 0.6%
HA Average Ticket:*
2016 vs 2015 -3.7% -5.9% -4.5%
2015 vs 2014 -0.5% -1.9% -0.8%

8
2016 Gross Margin Rate Performance
Hometown
Decrease primarily driven by $15.1M of store-closing costs, lower margin on
merchandise sales, higher occupancy costs due to an increase of the number of
Company-operated stores, and higher shrink
Outlet
Decrease primarily driven by lower gross profit rate on merchandise sales due to price
reductions needed to maintain competitiveness of Out-of-Box product in more
promotional environment for New-in-Box appliances, higher occupancy costs due to
more Company-operated locations, higher shrink expenses and $1.0M of closing store
costs
* Non-Core items include occupancy costs, store closing costs, and shrink
Hometown Outlet Consolidated
Gr ss Margin Rate:
2016 20.4% 18.2% 19.7%
2015 22.6% 22.9% 22.7%
YOY Change (bps) (216) (466) (292)
Impact of Non-Core Items* (bps):
2016 (285) (957) (490)
2015 (124) (645) (274)

9
Amendments to Agreements with Sears Holdings (SHC)
Primary SHO Benefits
Extension of services and merchandise agreement pricing through
February 1, 2020
Rights to operate transactional web-sites (in pre-defined territories for
Hometown Segment formats
Increased commissions on Protection Agreement sales
SHC will provide Supply Chain Services for SHO Purchased Products
upon implementation of our Business Process Outsourcing project
All remaining SHO stores available as customer pick-up locations on
Sears.com
Please refer to our 8-K filling dated 5/17/16 for details regarding the Amendments
10
2015-2016 Year-End Balance Sheet
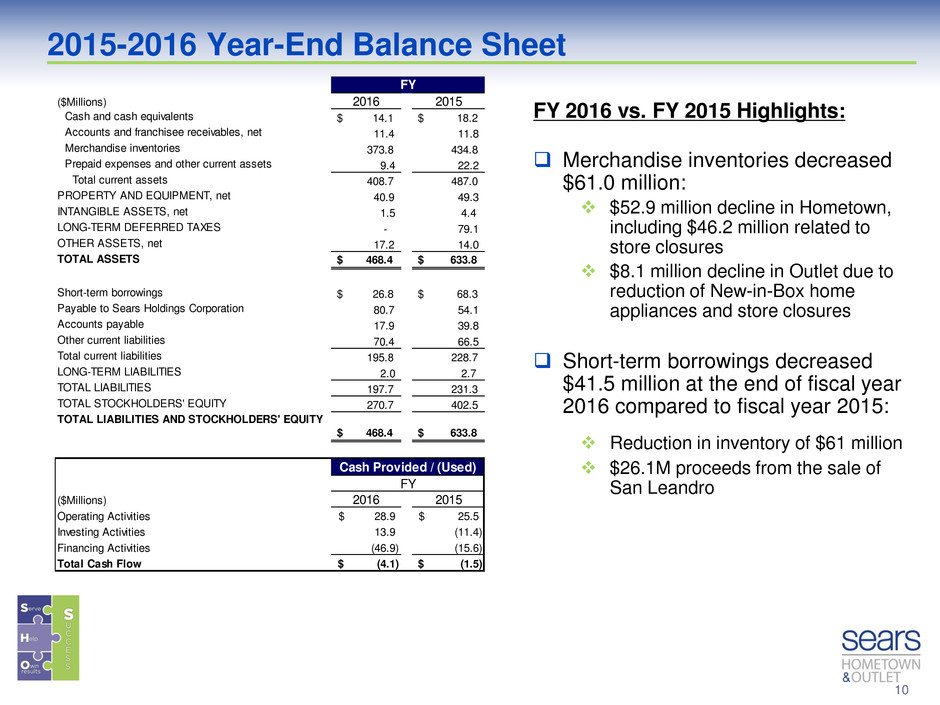
FY 2016 vs. FY 2015 Highlights:
Merchandise inventories decreased
$61.0 million:
$52.9 million decline in Hometown,
including $46.2 million related to
store closures
$8.1 million decline in Outlet due to
reduction of New-in-Box home
appliances and store closures
Short-term borrowings decreased
$41.5 million at the end of fiscal year
2016 compared to fiscal year 2015:
Reduction in inventory of $61 million
$26.1M proceeds from the sale of
San Leandro
($Millions) 2016 2015
Cash and cash equivalents $ 14.1 $ 18.2
Accounts and franchisee receivables, net 11.4 11.8
Merchandise inventories 373.8 434.8
Prepaid expenses and other current assets 9.4 22.2
Total current assets 408.7 487.0
PROPERTY AND EQUIPMENT, net 40.9 49.3
INTANGIBLE ASSETS, net 1.5 4.4
LONG-TERM DEFERRED TAXES - 79.1
OTHER ASSETS, net 17.2 14.0
TOTAL ASSETS $ 468.4 $ 633.8
Short-term borrowings $ 26.8 $ 68.3
Payable to Sears Holdings Corporation 80.7 54.1
Accounts payable 17.9 39.8
Other current liabilities 70.4 66.5
Total current liabilities 195.8 228.7
LONG-TERM LIABILITIES 2.0 2.7
TOTAL LIABILITIES 197.7 231.3
TOTAL STOCKHOLDERS' EQUITY 270.7 402.5
TOTAL LIABILITIES AND STOCKHOLDERS' EQUITY
$ 468.4 $ 633.8
($Millions) 2016 2015
Operating Activities 28.9$ 25.5$
Investing Activities 13.9 (11.4)
Financing Activities (46.9) (15.6)
Total Cash Flow (4.1)$ (1.5)$
Cash Provided / (Used)
FY
FY

11
SHO STRATEGY

12
SHO Strategy
SHO’s strategy is based on our fundamental belief
that SHO has two key competitive advantages that
can serve to enable the transformation of our business
model
SHO operates a large store base in rural America, with the
advantages of local ownership, a national brand, large
merchandise assortments, competitive prices and the ability to
assemble, deliver and install what we sell
SHO is by a wide margin the largest retailer of Outlet As-Is
appliances in the industry, with a network of product repair and
re-distribution capabilities that are difficult/costly to replicate
The key headwinds facing SHO are well understood
and provide guidance to the strategic initiatives we are
pursuing

13
SHO Strategy
Headwinds
Hyper-competitive promotional environment in Home Appliances is
eroding average selling prices and pressuring margin rates
Value proposition of Outlet As-Is appliances is being impacted by the price compression
in competitors’ New-in-Box appliances
Manufacturer sponsored promotional margin support is being directed to their name
brands and the Kenmore brand is not receiving the same levels of support
15-20% of the Home Appliance market has moved to direct online
purchases (based on manufacturers’ feedback/estimates) and until the
end of Q3 2016 SHO was unable to participate in the online channel in
our largest business, the Hometown Segment
We are perceived by potential investors, manufacturers, vendors and
financial institutions as being tied to SHC given our historical reliance on
them for services, systems and inventory
While there are many mutually beneficial aspects of this relationship, we firmly believe we
need to demonstrate the capabilities and capacity to operate independently
Appliances are
71.5% of SHO’s
Total Business
51.1% of SHO’s
Appliance Sales
in 2016 were
Kenmore
The Hometown
Segment
generates 69.5%
of SHO’s Total
Sales

14
SHO Strategy
The strategy we are pursuing is designed to address
the headwinds impacting our current business and
develop new customer channels to grow the business
Win
Online
Improve Core
Business Margins
Develop New
Customer Growth
Channels
Reduce Reliance on
SHC
SearsHometown
Stores.com Launch
and Development
SearsOutlet.com
Growth
Store Portfolio
Optimization
America’s Appliance
Experts
Outlet As-Is Appliance
Sourcing Improvement
Kenmore Strategic
Relationship
Lease-to-Own
Commercial Sales
Program
IT Systems
Transformation and
Business Process
Outsourcing
15
STORE PORTFOLIO

16
As of year-end 2016, SHO and its independent dealers and franchisees
operated a total of 1,020 stores across all 50 states, Puerto Rico, and
Bermuda.
Store Portfolio
During the past year we opened 18 new Hometown Dealer stores
We will continue to open new Hometown Dealer stores as part of our go-
forward strategy
New Dealer stores are productive and, on average, produce positive EBITDA
in the first year of operations
We will continue to focus our openings in closed Sears full-line store markets
where SHC chooses not to maintain a store presence
Year one Dealer store sales in closed Sears trade areas are 70% higher than openings in other
trade areas over the past 3 years and these stores generally have higher EBITDA
871
149
2016 Year End Store Count
38
789
44
Hometown
112
37
Outlet

17
For the 2016 fiscal year we closed 160 store locations
149 Hometown
11 Outlet
In the 4th quarter, we elected to accelerate the closing of 109 stores producing
insufficient financial returns
The closings resulted in one time charges of $16.2M in Q4 and $17.7M Full-Year
Store Portfolio
(millions)
Quarter 4 Fiscal Year
Count 109 160
139.0$ 181.2$
(9.9)$ (11.3)$
34.0$ 54.9$
Sales
Adjusted EBITDA
Inventory @ Cost

18
For fiscal 2017, we have initial plans to open 20-25 new Dealer
Hometown stores
We will continue to proactively evaluate our store portfolio and close
locations that generate unsatisfactory economic returns
The Hardware Stores and Home Appliance Showrooms are largely unprofitable
formats, impacted by a group of stores with unacceptable performance primarily driven
by high occupancy costs
Closing the unprofitable locations will improve EBITDA and reduce inventory working
capital
Store Portfolio
2
21
12
5 5
2 1
0
5
10
15
20
25
2017 2018 2019 2020 2021 2022 2023
HAS Stores by Lease End Year
2 2
8
3
7
1
2
1
0
2
4
6
8
10
2017 2018 2019 2020 2021 2022 2023 Owned
AHS Stores by Lease End Year

19
Average ticket decline in home appliances, driven by competitive pricing
pressures, has led to New-in-Box appliance pricing eroding the value
proposition of Outlet As-Is appliances
This has a direct impact on sales and margins in the Outlet business, since As-Is appliances
represent greater than 75% of Outlet appliance sales
As a result, we have a group of Outlet stores which are generating insufficient
economic returns and are weighing down the financial performance of this
business segment
We expect to close the unprofitable locations as leases expire, or earlier as conditions warrant,
to improve EBITDA and reduce inventory working capital
Store Portfolio
33
27 26
20
22
6
8
5
2
0
5
10
15
20
25
30
35
2017 2018 2019 2020 2021 2022 2023 2024 Owned
Outlet Stores by Lease End Year

20
LEASE-TO-OWN

21
U.S. Lease-to-Own industry is a ≈$10B market and is forecast to continue
growing through 2020
Appliance segment accounts for ≈$4B
This market is dominated by two companies with ≈63% combined market share:
Aaron’s and Rent-A-Center
SHO views this as an opportunity to take meaningful share, as we are currently a
very small part of this industry and have a customer value proposition unique in
the Lease-to-Own market
SHO offers a full assortment of new products (e.g. appliances, mattresses, furniture, lawn and garden,
tools) across most major brands, offers leasing customers the same retail price offered to other
customers, charges no leasing origination or administrative fees, provides multiple payment options,
operates locally owned stores well positioned in rural markets, and has trained sales personnel that offer
superior product knowledge and customer service
SHO’s product leasing sales grew 20.5% in 2016, and increased the percentage
of total sales by 45 bps to 2.33%
Lease-to-Own
Sources: Daedal Research – The US Rent-To-Own Market: Size, Trends & Forecasts (Aug ‘16); 2015 Aaron’s and Rent-
A-Center Annual Reports Appliance Balance-of-Sale Reporting

22
Lease-to-Own
Operating Tactics:
Negotiated and implemented a new agreement with an industry leading third-party leasing
provider
Includes volume based incentives for all Lease-to-Own sales completed by SHO
Dedicated field training staff for SHO supported by the leasing provider
Expanded leasing training program in all stores
Initiated rewards-incentive program for all store personnel (funded by leasing provider)
Launched inclusion of Lease-to-Own messaging in all print marketing
Deployed digital marketing plan to compete for share of voice with primary leasing competition
Deployed new in-store and exterior signing package (funded by leasing provider)
Integrated instant-approval product leasing capabilities into new SearsHometown.com websites
New point-of-sale and Outlet website integration will occur upon completion of IT
Transformation Project
Q1 2017
Leasing Sales
+82.8% and
Leasing Share
+263 bps YOY

23
Lease-to-Own
Lease-to-Own is a compelling growth channel for SHO, as Lease-to-Own sales are
more profitable and we view them as largely incremental to our current customer base:
Higher Protection Agreement penetration
No third party credit fees
Higher average ticket
Revenue share from third party leasing provider
31% of SHO leasing customers have repeat lease transactions with us within 12 months
2017 forecasted margin impact from revenue sharing: $3.0M to $3.5M
Through Q1 SHO is on a trajectory to more than double our Lease-to-Own sales in
2017; we believe this can be developed into a $200M channel by YE 2019

24
AMERICA’S APPLIANCE EXPERTS

25
America’s Appliance Experts
Initiative: Expand and optimize the America’s
Appliance Expert strategy, implementing a
comprehensive program designed to reinvent
the Home Appliance business, reinforcing SHO
as the market experts in our local communities
• Focus on market leading brands with significant
or emerging share
• Improve home appliance sales
• Improve home appliance margin rate
• Increase store owner income
We Are Here!
Wave 9: 6 stores completed in February 2017
Wave 10: 72 stores completed in March 2017
Wave 11: 76 stores completed in May 2017
Wave 12: 50 stores forecasted for August 2017 completion
2017: Waves 9-12
204 Stores
2016: Waves 5-8
290 Stores
2015: Waves 1-4
180 Stores
December 2014:
Pilot Dekalb, IL
180 Stores converted
YE 2015
470 Stores converted
YE 2016
Forecasting 674 Stores converted, 79% of
Hometown Segment store base by YE 2017
26
America’s Appliance Experts
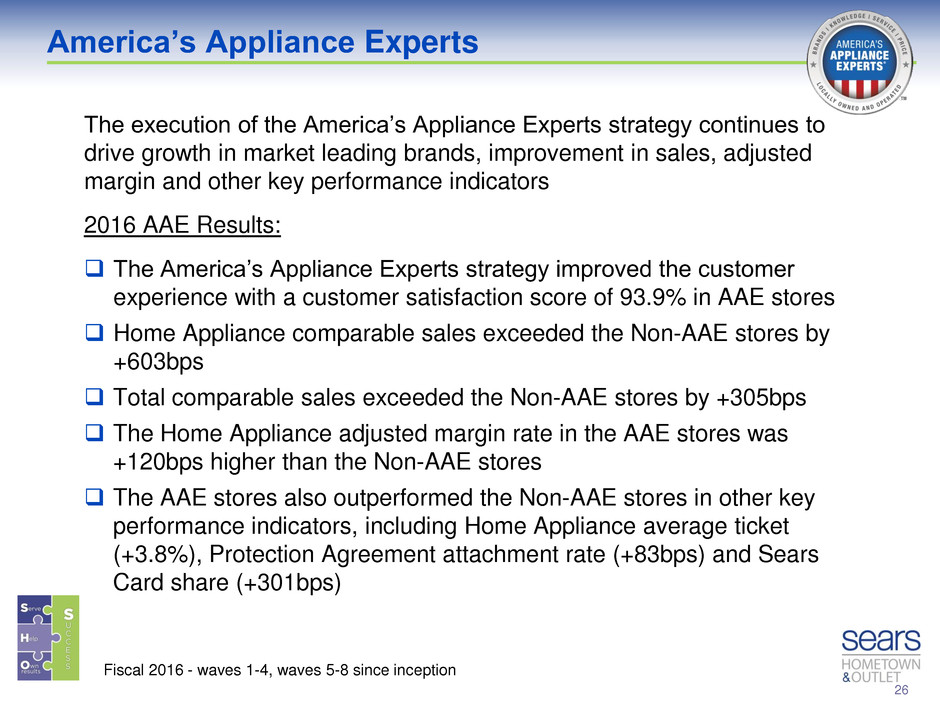
The execution of the America’s Appliance Experts strategy continues to
drive growth in market leading brands, improvement in sales, adjusted
margin and other key performance indicators
2016 AAE Results:
The America’s Appliance Experts strategy improved the customer
experience with a customer satisfaction score of 93.9% in AAE stores
Home Appliance comparable sales exceeded the Non-AAE stores by
+603bps
Total comparable sales exceeded the Non-AAE stores by +305bps
The Home Appliance adjusted margin rate in the AAE stores was
+120bps higher than the Non-AAE stores
The AAE stores also outperformed the Non-AAE stores in other key
performance indicators, including Home Appliance average ticket
(+3.8%), Protection Agreement attachment rate (+83bps) and Sears
Card share (+301bps)
Fiscal 2016 - waves 1-4, waves 5-8 since inception

27
SEARSHOMETOWNSTORES.COM

28
SearsHometownStores.com
Reached an agreement with SHC in May 2016 to secure eCommerce
rights for our Hometown segment
Developed and launched three new transactional websites at the end of
Q3 2016, three months ahead of schedule
Since launch through the first quarter of 2017, the sites have received
over 5.2M visitors
While behind our initial projections, online sales are steadily growing
both in dollars and as a percent of sales
W
ee
k 3
9
W
ee
k 4
0
W
ee
k 4
1
W
ee
k 4
2
W
ee
k 4
4
W
ee
k 4
5
W
ee
k 4
6
W
ee
k 4
7
W
ee
k 4
8
W
ee
k 4
9
W
ee
k 5
0
W
ee
k 5
1
W
ee
k 5
2
W
ee
k
1
W
ee
k
2
W
ee
k
3
W
ee
k
4
W
ee
k
5
W
ee
k
6
W
ee
k
7
W
ee
k
8
W
ee
k
9
W
ee
k 1
0
W
ee
k 1
1
W
ee
k 1
2
W
ee
k 1
3
SearsHometownStores.com Sales
S
H
S
.c
o
m
%
o
f
S
tore
Sale
s
SHS.com Sales
Trend line

29
2016 SearsHometownStores.com Opportunities
Our agreements with SHC limit our e-commerce capabilities and marketing to zip codes
representing 75% of each store’s historical sales. Currently 28% of customers adding products to
cart are not permitted to transact
SearsHometownStores.com
SearsHometownStores.com Improvements
We have tested free delivery online for home appliances with promising results. Free delivery
online will roll-out nationally in Q2 2017
We launched free shipping for orders over $49 and sales of shippable items have increased
significantly to pre-launch trends
Developed the capability to apply for a Sears card at checkout and use the same day
Product leasing functionality was added to the site in February 2017. Our presentation of
leasing payment options at the item level is unique for a site which is not primarily in the
Rent/Lease-to-Own business. We are experiencing a rapid increase in online leasing
penetration

30
SEARSOUTLET.COM

31
SearsOutlet.com is a unique website, with opportunities and facing challenges uncommon to other
online retailers.
SearsOutlet.com sells unique, single quantity items
Individual item conditions require images for each individual product
Individual item pricing requires the ability to display multiple prices for the same model by location
Over 70,000 unique home appliances are listed online at any given time
SearsOutlet.com fulfills the majority of transactions from our Outlet retail sales floors
SearsOutlet.com
Source: 1. http://www.statista.com/statistics
$

32
SearsOutlet.com
2016 SearsOutlet.com Opportunities
Increased competitive promotional pricing in the market for New-in-Box products
National Delivery (75+ miles) for home appliances was suspended for the majority of stores
and available only for limited categories in other stores from December 2015 to December
2016 due to logistic challenges resulting in poor financial performance in this channel.
Revenue from this fulfilment type dropped 35% YOY
SearsOutlet.com Improvements
National Delivery was relaunched with improved logistical execution in December 2016 for all
stores and product categories. Since re-launch through the end of Q1 2017, national delivery
revenue increased 19.1% YOY
Marketplace expansion has continued to grow rapidly. eBay revenue grew 776% YOY and
SHO launched on Amazon.com in March 2017
Revised pricing strategies and launched significantly improved product condition sorting tools
Sears.com Pick-up Location
At the beginning of the fiscal year, Sears Outlet stores were activated as a pick up point for
orders on Sears.com
SHO recognizes sales and margin on these orders with a commission paid to SHC. This new
revenue channel is expected to add $8-$10M of additional online originated sales in 2017

33
COMMERCIAL SALES PROGRAM

34
Commercial Sales Program
Commercial sales of home-related products to contractors and property managers
is a multi-billion dollar industry
SHO’s strength in appliances creates an opportunity to service a large segment of this
industry that we have not targeted in the past
Opportunity to service local rural markets that are not well supported by
commercial sales competitors by offering:
Competitive pricing
Local ownership with superior customer service
Physical location in the community
Local assembly, delivery and installation capability
Commercial sales program grew by 279% in 2016, adding $20M of incremental
sales, driven by increasing store program participation to 39% vs. 17% in 2015

35
Commercial Sales Program
Building on 2016 momentum, Q1 2017 Commercial Sales grew almost 50% to LY
and store participation continues to increase
Operating Tactics:
Improved the structural foundation of the program through enhanced operational processes
Implemented new commercial delivery and installation capabilities
Implemented an efficient sales quote process that ensures a profitable pricing structure
Developed and launched new financing options
Growing sales leads nationally through relationship with a third-party lead provider, while
simultaneously directly engaging local businesses
Improve store participation by providing additional training on B2B selling, and simplifying
core processes through the new point-of-sale and ERP system launch
Increase brand exposure through participation in trade shows with residential contractors,
apartment / multi-family managers, and property management companies
Integrating commercial sales capabilities into the Hometown segment websites, allowing
commercial customers the ability to access product, pricing, quotes, and sales support
online
We believe we can develop Commercial Sales into a $100M channel by YE 2019

36
OUTLET AS-IS APPLIANCE SOURCING

37
Outlet As-Is Appliance Sourcing
Aggressive pricing on New-in-Box appliances, driven by competitors and
supported by manufacturers, has impacted the value proposition for As-Is
appliances
The aggressive pricing on New-in-Box appliances has driven a material
decline in average unit selling price in our Outlet business
Deeper discounts are required to maintain the value proposition for As-Is
appliances, delivering unacceptable margin
Outlet Margin Improvement Initiatives:
All non-SHC Home Appliance manufacturers with whom we do business
have agreed to improve cost and/or provide subsidies consistent with the
support provided to retailers of New-in-Box appliances. This should improve
the value proposition and margin for As-Is appliances
Completed a new agreement to purchase repaired “sales floor ready” As-Is
appliances from a major retailer at attractive margins
2017 Forecast Margin Impact: $7.0M - $9.0M
Outlet Segment
2013 2014 2015 2016
Total Revenue $610.0 $663.7 $657.5 $630.5
Total Margin Rate 25.6% 23.7% 22.9% 18.2%
Appliance Average Unit Price $594.31 $580.53 $567.84 $535.00

38
KENMORE STRATEGIC RELATIONSHIP

39
Kenmore Strategic Relationship
SHO and the SHC Kenmore Business have developed a strong relationship that
is focused on:
Improving the profitability of the Kenmore brand across the Hometown and
Outlet Segments
Growing sales and market share in the Kenmore brand
Kenmore Profitability Improvement:
In 2017 Kenmore will provide material incremental subsidy to the Hometown
Segment to support promotional pricing and item transitions, consistent with
the type of support traditionally provided by other national appliance brands
Grow Kenmore Market Share:
Kenmore has positioned additional financial incentives that can be earned
quarterly in 2017 by achieving predetermined Hometown Segment sales and
Kenmore share targets
To improve the performance in the Outlet Segment in 2017, Kenmore has
offered meaningful royalty rebates to encourage the sale of Kenmore New-
in-Box appliances in Outlet
2017 Forecast Incremental Margin Impact: $3.0M - $5.0M

40
IT TRANSFORMATION AND BUSINESS PROCESS
OUTSOURCING

41
Our ability to improve profitability and achieve long-term growth is dependent upon systems
capabilities which evolve the customer experience, improve efficiencies in our processes
and eliminates many of our dependencies on SHC
SHO is migrating from our current systems environment provided through our agreements
with SHC, to new systems primarily provided by NetSuite, Just Enough, and Ultimate
Software
IT Transformation and Business Process Outsourcing
Strategic Fit
• Enables SHO
e-commerce websites
and omni-channel
platform
• Customized IT
Systems and
Business Processes
to support SHO
specific business
needs which may
differ from SHC
• Fosters a lean,
efficient home office
Service Levels
• True 3rd party service
providers
• Ability to rapidly adapt
and modify business
processes and
systems
• Access to continued
technology
enhancements
• Integrated systems
resulting in efficiencies
with suppliers and
service providers
Infrastructure
• Largely cloud-based,
asset-light approach
• Modern, best-in-class
technology
• Ability to choose most
cost-effective partners
• Shifts burden to
maintain IT systems to
a third-party

42
IT Transformation and Business Process Outsourcing
We have made considerable progress toward the implementation of our new Information
Technology platforms
We have significantly reduced (and will continue reducing) our reliance on existing SHC
systems
We expect this change will:
Provide greater strategic and operational flexibility
Reduce total cost of ownership over the term of the agreement
Reduce elements of risk relating to our relationship with SHC
Enable a robust omni-channel experience for both Hometown and Outlet
What has been accomplished so far?
Hometown ecommerce sites launched
Email marketing capabilities internalized
Merchandise procurement and purchasing capabilities developed and utilized
64 Vendors EDI Certified (10,000+ Purchase Orders Complete)
Human Resources and Payroll systems converted
Direct payment of commission payments to Dealers and Franchisees
Portions of finance and accounting (Accounts Receivable/Payable) transitioned
Role-based security access
Cloud based single sign-on

43
IT Transformation and Business Process Outsourcing
2017 Project Status – What’s Next:
Q2: New point-of-sale hardware deployment
Q2/Q3: Complete testing (Data, Systems Integration and User Acceptance)
Q3/Q4: Anticipated store deployment of new ERP and POS software and project
largely completed
Migrated many business support services previously provided by SHC to third party
providers or, on a limited-basis, internally into SHO
We plan to continue several mutually advantageous elements of our operating
relationship with SHC beyond the current term of our agreements, but have the
flexibility to further reduce or eliminate the relationship if necessary
SHO has made a significant IT investment in the future of our business:
2015 - $10.9 million
2016 - $15.0 million
2017 – Anticipate similar spend to prior year
We do not expect further material investments after 2017
44
Cautionary Statement
This presentation includes forward-looking statements. Statements preceded or followed by, or
that otherwise include, the words “believes,” “expects,” “anticipates,” “intends,” “project,”
“estimates,” “plans,” “forecast,” “is likely to,” and similar expressions or future or conditional verbs
such as “will,” “may,” “would,” “should,” and “could” are generally forward-looking in nature and
not historical facts. The forward-looking statements are subject to significant risks and
uncertainties that may cause our actual results, performance, timing, and achievements in the
future to be materially different from the future results, future performance, future timing, and
future achievements expressed or implied by the forward-looking statements. The forward-looking
statements include, without limitation, information concerning our future financial performance,
business strategy, plans, goals, beliefs, expectations, and objectives. The forward-looking
statements are based upon the current beliefs and expectations of our management.
The following factors, among others, could cause our actual results, performance, and
achievements to differ materially from those expressed in the forward-looking statements, and
one or more of the differences could have a material adverse effect on our ability to operate our
business and could have a material adverse effect on our results of operations, financial
condition, liquidity, and cash flows: the possible material adverse effects on us if SHC’ financial
condition were to significantly deteriorate, including if as a consequence SHC were to choose to
seek the protection of the U.S. bankruptcy laws; our ability to offer merchandise and services that
our customers want, including those branded with the Kenmore, Craftsman, and Diehard marks
(the “KCD Marks”); (continued on next slide)

45
Cautionary Statement
the Amended and Restated Merchandising Agreement between SHC and us provides that (1) if a
third party that is not an affiliate of SHC acquires the rights to one or more (but less than all) of
the KCD Marks SHC may terminate our rights to buy merchandise branded with any of the
acquired KCD Marks and (2) if a third party that is not an affiliate of SHC acquires the rights to all
of the KCD Marks SHC may terminate the Merchandising Agreement in its entirety, over which
events we have no control; the sale by SHC and its subsidiaries to other retailers that compete
with us of major home appliances and other products branded with one of the KCD Marks; the
willingness and ability of SHC to fulfill its contractual obligations to us; our ability to successfully
manage our inventory levels and implement initiatives to improve inventory management and
other capabilities; competitive conditions in the retail industry; worldwide economic conditions and
business uncertainty, the availability of consumer and commercial credit, changes in consumer
confidence, tastes, preferences and spending, and changes in vendor relationships; the fact that
our past performance generally, as reflected on our historical financial statements, may not be
indicative of our future performance as a result of, among other things, the consolidation of
Hometown and Outlet into a single business entity, the Separation, and operating as a standalone
business entity; the impact of increased costs due to a decrease in our purchasing power
following our separation from SHC in October 2012 (the “Separation”), and other losses of
benefits (such as a more effective and productive business relationship with SHC) that were
associated with having been wholly owned by SHC and its subsidiaries prior to the Separation;
our continuing reliance on SHC for most products and services that are important to the
successful operation of our business, and our potential need to rely on SHC for some products
and services beyond the expiration, or earlier termination by SHC, of our agreements with SHC;
(continued on next slide)

46
Cautionary Statement
the willingness of SHC’ appliance, lawn and garden, tools, and other vendors to continue to
supply to SHC, on terms (including vendor payment terms for SHC’ merchandise purchases) that
are acceptable to it and to us, merchandise that we would need to purchase from SHC to ensure
continuity of merchandise supplies for our businesses; the willingness of SHC’ appliance, lawn
and garden, tools, and other vendors to continue to pay to SHC merchandise-related subsidies
and allowances and cash discounts (some of which SHC is obligated to pay to us); our ability to
obtain the resolution, on commercially reasonable terms, of existing disputes and, when they
arise, future disputes with SHC regarding many of the material terms and conditions of our
agreements with SHC; our ability to establish information, merchandising, logistics, and other
systems separate from SHC that would be necessary to ensure continuity of merchandise
supplies for our businesses if vendors were to reduce, or cease, their merchandise sales to SHC
or if SHC were to reduce, or cease, its merchandise sales to us; if SHC’ sales of major appliances
and lawn and garden merchandise to its retail customers decline SHC’ sales to us of outlet-value
merchandise could decline; our ability to establish a more effective and productive business
relationship with SHC, particularly in light of the existence of pending, and the likelihood of future,
disputes with respect to the terms and conditions of our agreements with SHC; most of our
agreements related to the Separation and our continuing relationship with SHC were negotiated
while we were a subsidiary of SHC, and we may have received different terms from unaffiliated
third parties (including with respect to merchandise-vendor and service-provider indemnification
and defense for negligence claims and claims arising out of failure to comply with contractual
obligations); (continued on next slide)

47
Cautionary Statement
our reliance on SHC to provide computer systems to process transactions with our customers
(including the point-of-sale system for the stores we operate and the stores that our dealers and
franchisees operate, which point-of-sale system captures, among other things, credit-card
information supplied by our customers) and others, quantify our results of operations, and
manage our business (“SHO’s SHC-Supplied Systems”); SHO’s SHC-Supplied Systems could be
subject to disruptions and data/security breaches (Kmart, owned by SHC, announced in October
2014 that its payment-data systems had been breached), and SHC could be unwilling or unable
to indemnify and defend us against third-party claims and other losses resulting from such
disruptions and data/security breaches, which could have one or more material adverse effects
on SHO; limitations and restrictions in the Senior ABL Facility and related agreements governing
our indebtedness and our ability to service our indebtedness; our ability to obtain additional
financing on acceptable terms; our dependence on the ability and willingness of our independent
dealers and franchisees to operate their stores profitably and in a manner consistent with our
concepts and standards; our ability to sell profitably online all of our merchandise and services;
our dependence on sources outside the U.S. for significant amounts of our merchandise
inventories; fixed-asset impairment for long-lived assets; our ability to attract, motivate, and retain
key executives and other employees; our ability to maintain effective internal controls as a
publicly held company; our ability to realize the benefits that we expect to achieve from the
Separation; litigation and regulatory trends challenging various aspects of the franchisor-
franchisee relationship in the fast-food industry could expand to challenge or adversely affect our
relationships with our independent dealers and franchisees; low trading volume of our common
stock due to limited liquidity or a lack of analyst coverage; and the impact on our common stock
and our overall performance as a result of our principal stockholders’ ability to exert control over
us. (continued on next slide)
48
Cautionary Statement
The foregoing factors should not be understood as exhaustive and should be read in conjunction
with the other cautionary statements, including the “Risk Factors,” that are included in our Annual
Report on Form 10-K for our fiscal year ended January 28, 2017 and in our other filings with the
Securities and Exchange Commission and our other public announcements. While we believe
that our forecasts and assumptions are reasonable, we caution that actual results may differ
materially. If one or more of these or other risks or uncertainties materialize, or if our underlying
assumptions prove to be incorrect, actual results may vary materially from what we projected.
Consequently, actual events and results may vary significantly from those included in or
contemplated or implied by our forward-looking statements. The forward-looking statements
included in this presentation are made only as of the date of this presentation. We undertake no
obligation to publicly update or review any forward-looking statement made by us or on our
behalf, whether as a result of new information, future developments, subsequent events or
circumstances, or otherwise, except as required by law.

49
