Attached files
| file | filename |
|---|---|
| 8-K - FORM 8-K - AAC Holdings, Inc. | d403103d8k.htm |
Exhibit 99.1
INVESTOR PRESENTATION
MAY
2017
IMPORTANT PRESENTATION INFORMATION
Notice to We use market data and industry forecasts and projections throughout this presentation, including data from publicly available information and industry publications.
These sources generally state that the information they provide has been obtained from sources believed to be reliable, but that the accuracy and completeness of the Investors information are not guaranteed. The forecasts and projections are based
on industry surveys and the preparers’ experience in the industry, and there can be no assurance that any of the forecasts or projections will be achieved. We believe that the surveys and market research others have performed are reliable, but
we have not independently investigated or verified this information. Forecasts and other forward-looking information obtained from these sources are subject to the same qualifications and uncertainties as the other forward-looking statements
contained in this presentation.
Forward-Looking Some of the statements made in this presentation constitute forward-looking statements within the meaning of
federal securities laws. Forward-looking statements reflect our current views with respect to future events and performance. In some cases you can identify forward-looking statements by terminology such as “may,” Statements “might,
“will,” “should,” “could” or the negative thereof. Generally, the words “anticipate,” “believe,” “continues,” “expect,” “intend,” “estimate,”
“project,” “plan” and similar expressions identify forward-looking statements. In particular, statements about our pipeline, industry growth opportunities, disclosure of key performance indicators, business growth strategy and
financial guidance in this presentation are forward-looking statements.
We have based these forward-looking statements on our current expectations, assumptions,
estimates and projections. While we believe these expectations, assumptions, estimates and projections are reasonable, such forward-looking statements are only predictions and involve known and unknown risks, uncertainties and other factors, many of
which are outside of our control, which could cause our actual results, performance or achievements to differ materially from any results, performance or achievements expressed or implied by such forward-looking statements. For additional discussion
of risks, uncertainties and other factors, see the section titled “Risk Factors” in our Annual Report on Form 10-K and other filings with the Securities and Exchange Commission (the “SEC”).
Risks, uncertainties and other factors include, without limitation: (i) our inability to operate our facilities; (ii) our reliance on our sales and
marketing program to continuously attract and enroll clients; (iii) a reduction in reimbursement rates by certain third-party payors for inpatient and outpatient services and point of care and definitive lab testing; (iv) our failure to
successfully achieve growth through acquisitions and de novo expansions; (v) uncertainties regarding the timing of the closing of acquisitions; (vi) our failure to achieve anticipated financial results from prior acquisitions;
(vii) the possibility that a governmental entity may prohibit, delay or refuse to grant approval for the consummation of the acquisitions; (viii) a disruption in our ability to perform definitive drug testing services;
(ix) maintaining compliance with applicable regulatory authorities, licensure and permits to operate our facilities and lab; (x) a disruption in our business and reputation and potential economic consequences with the civil securities
claims brought by shareholders; (xi) our inability to agree on conversion and other terms for the balance of convertible debt; (xii) our inability to meet our covenants in our loan documents; (xiii) our inability to obtain senior
lender consent to exceed the current $50 million limit in unsecured subordinated debt; (xiv) our inability to integrate newly acquired facilities; and (xv) general economic conditions, as well as other risks discussed in the
“Risk Factors” section of the Company’s Annual Report on Form 10-K and other filings with the SEC.
Given
these risks and uncertainties, you are cautioned not to place undue reliance on such forward-looking statements. These risks and uncertainties may cause our actual future results to be materially different than those expressed in our forward-looking
statements. These forward-looking statements are made only as of the date of this presentation. We do not undertake and specifically decline any obligation to update any such statements or to publicly announce the results of any revisions to any
such statements to reflect future events or developments.
2
PRESENTERS 3
Founder and CEO of Foundations Recovery Network
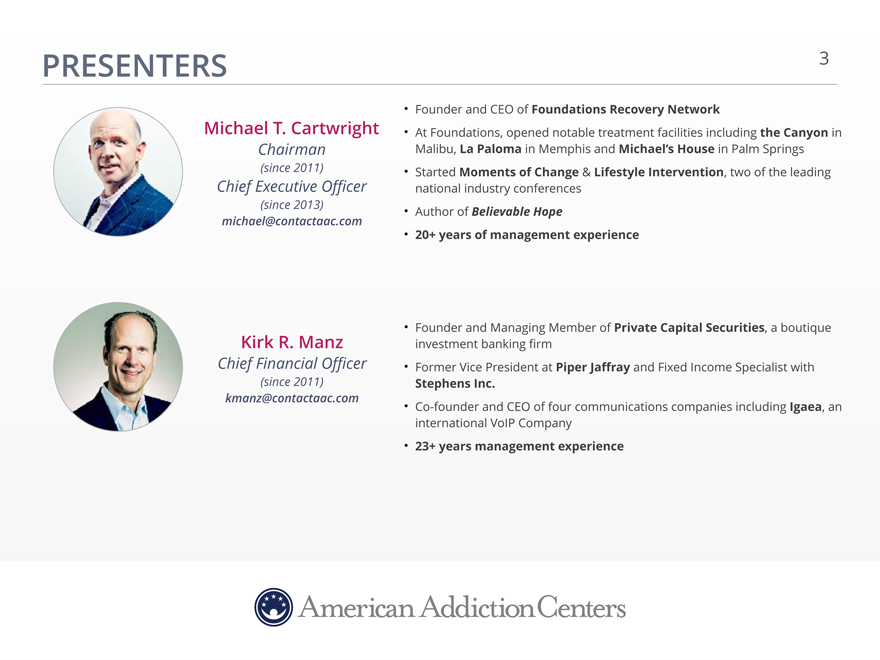
Michael T.
Cartwright At Foundations, opened notable treatment facilities including the Canyon in
Chairman Malibu, La Paloma
in Memphis and Michael’s House in Palm Springs
(since 2011) Started Moments of Change & Lifestyle Intervention, two of the
leading
Chief Executive Officer national industry conferences
(since 2013) Author of Believable Hope
michael@contactaac.com
20+
years of management experience
Founder and Managing Member of Private Capital Securities, a boutique
Kirk R. Manz investment banking firm
Chief Financial
Officer Former Vice President at Piper Jaffray and Fixed Income Specialist with
(since 2011) Stephens Inc.
kmanz@contactaac.com Co-founder and CEO of four communications companies including Igaea, an
international VoIP Company
23+ years management
experience
INDUSTRY PRIMER
4
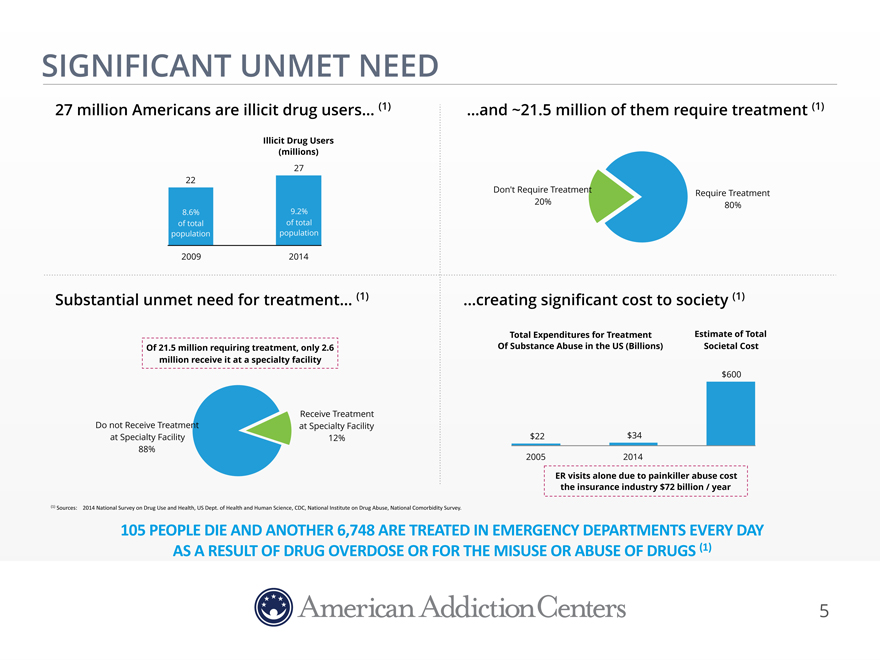
SIGNIFICANT UNMET NEED
27 million Americans are illicit drug users… (1) …and ~21.5 million of them require treatment (1)
Illicit Drug Users
(millions)
27
22
Don’t Require TreatmentRequire Treatment
20%80%
8.6% 9.2%
of total of total
population population
2009 2014
Substantial unmet need for treatment… (1) creating significant cost to society (1)
Total Expenditures for TreatmentEstimate of Total
Of 21.5 million requiring treatment,
only 2.6 Of Substance Abuse in the US (Billions) Societal Cost
million receive it at a specialty facility
$600
Receive Treatment
Do not Receive Treatment at Specialty Facility
at Specialty
Facility 12% $22$34
88%
20052014
ER visits alone due to painkiller abuse cost
the insurance industry $72 billion / year
(1)$Sources:$$$$2014$National$Survey$on$Drug$Use$and$Health,$US$Dept.$of$Health$and$Human$Science,$CDC,
$National$Institute$on$Drug$Abuse,$National$Comorbidity$Survey.$$
ARE
TREATED IN EMERGENCY DEPARTMENTS EVERY DAY
OR FOR THE MISUSE OR ABUSE OF DRUGS (1)
5
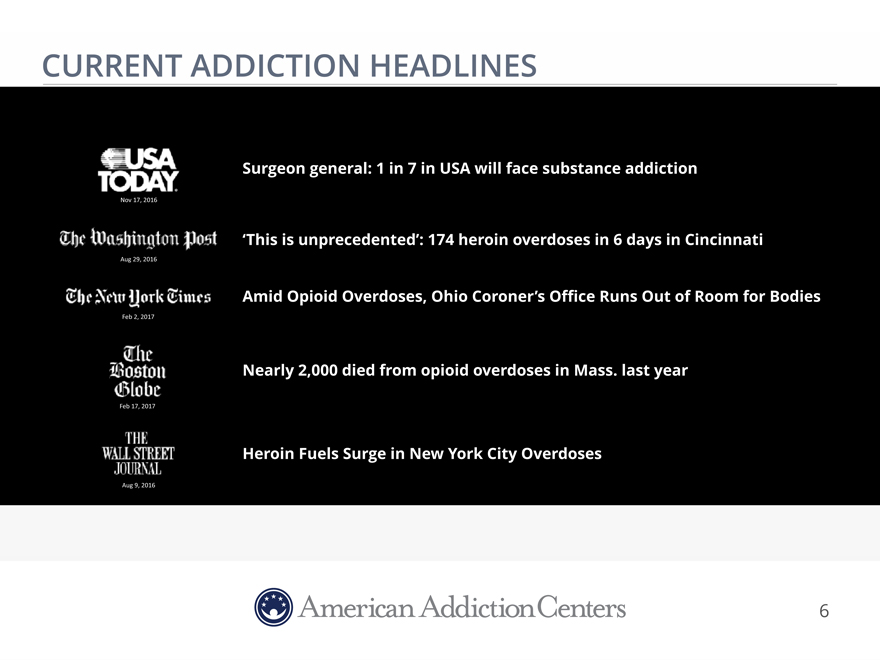
CURRENT ADDICTION HEADLINES
Surgeon general: 1 in 7 in USA will face substance addiction
Nov 17, 2016
‘This is unprecedented’: 174 heroin overdoses in 6 days in Cincinnati
Aug 29, 2016
Amid Opioid Overdoses, Ohio Coroner’s Office Runs Out of
Room for Bodies
Feb$2,$2017
Nearly 2,000 died from opioid overdoses in Mass.
last year
Feb$17,$2017
Heroin Fuels Surge in New York City Overdoses
Aug 9, 2016
6
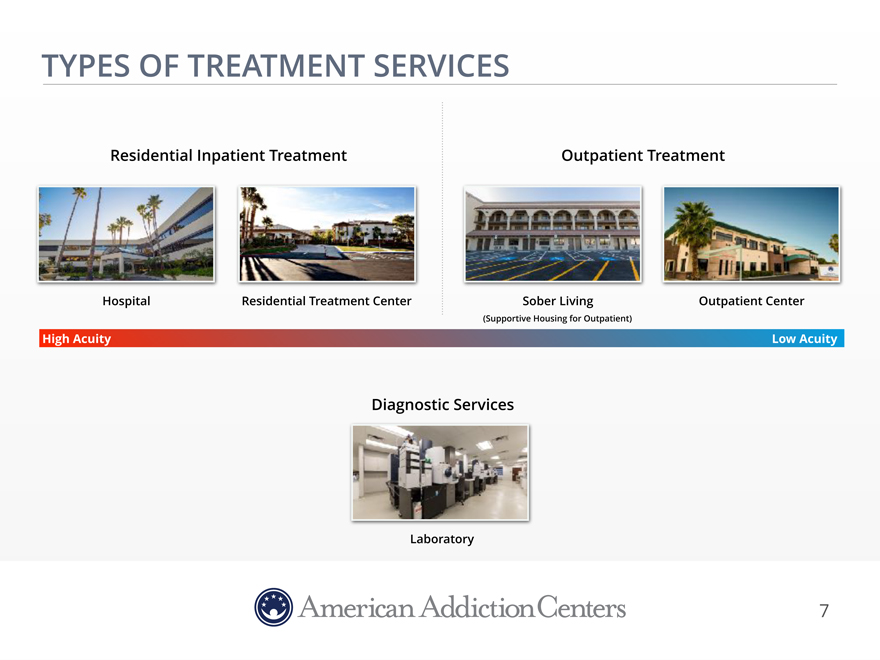
TYPES OF TREATMENT SERVICES
Residential Inpatient Treatment Outpatient Treatment
Hospital Residential
Treatment Center Sober Living Outpatient Center
(Supportive Housing for Outpatient)
High Acuity Low Acuity
Diagnostic Services
Laboratory
7
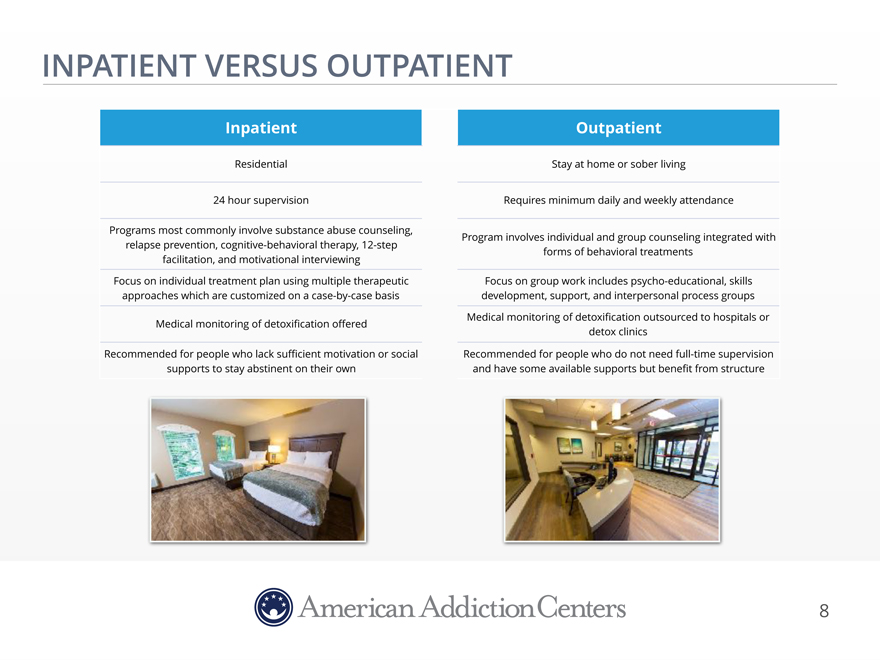
INPATIENT VERSUS OUTPATIENT
Inpatient Outpatient
Residential Stay at home or
sober living
24 hour supervision Requires minimum daily and weekly attendance
Programs most commonly involve substance abuse counseling, Program involves individual and group counseling integrated with
relapse prevention, cognitive-behavioral therapy, 12-step forms of behavioral treatments
facilitation, and motivational interviewing
Focus on individual
treatment plan using multiple therapeutic Focus on group work includes psycho-educational, skills
approaches which are customized on a case-by-case basis development, support, and interpersonal process groups
Medical monitoring of detoxification offered Medical monitoring of detoxification outsourced to hospitals or
detox clinics
Recommended for people who lack sufficient motivation or
social Recommended for people who do not need full-time supervision
supports to stay abstinent on their own and have
some available supports but benefit from structure
8
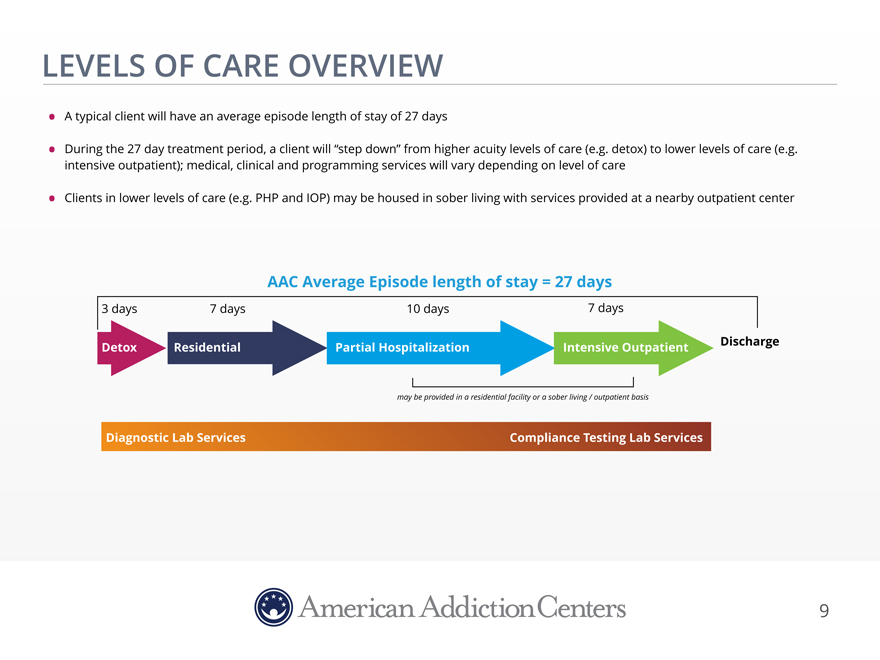
LEVELS OF CARE OVERVIEW
A
typical client will have an average episode length of stay of 27 days
During the 27 day treatment period, a client will “step down” from higher acuity
levels of care (e.g. detox) to lower levels of care (e.g. intensive outpatient); medical, clinical and programming services will vary depending on level of care
Clients in lower levels of care (e.g. PHP and IOP) may be housed in sober living with services provided at a nearby outpatient center
AAC Average Episode length of stay = 27 days
3 days 7 days 10 days 7 days
Detox Residential Partial Hospitalization Intensive Outpatient Discharge
may be provided in a
residential facility or a sober living / outpatient basis
Diagnostic Lab Services Compliance Testing Lab Services
9
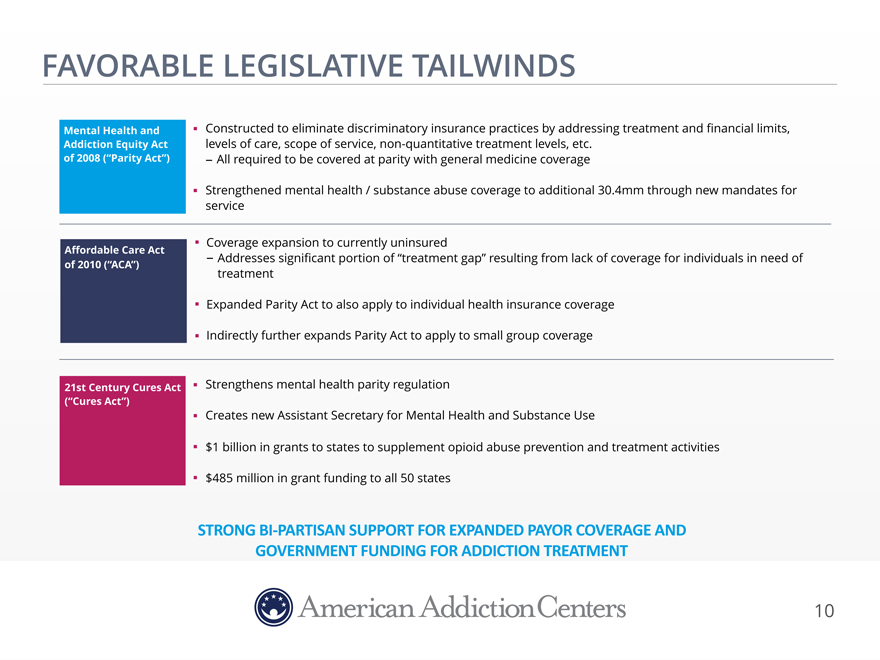
FAVORABLE LEGISLATIVE TAILWINDS
Mental Health and Constructed to eliminate discriminatory insurance practices by addressing treatment and financial limits,
Addiction Equity Act levels of care, scope of service, non-quantitative treatment levels, etc.
of 2008 (“Parity Act”) - All required to be covered at parity with general medicine coverage
Strengthened mental health / substance abuse coverage to additional 30.4mm through new mandates for
service
Coverage expansion to currently uninsured
Affordable Care Act - Addresses significant portion of “treatment gap” resulting from lack of coverage for individuals in need of
of 2010 (“ACA”) treatment
Expanded
Parity Act to also apply to individual health insurance coverage
Indirectly further expands Parity Act to apply to small group coverage
21st Century Cures Act Strengthens mental health parity regulation
(“Cures Act”)
Creates new Assistant
Secretary for Mental Health and Substance Use
$1 billion in grants to states to supplement opioid abuse prevention and treatment
activities
$485 million in grant funding to all 50 states
STRONG$BI-PARTISAN$SUPPORT$FOR$EXPANDED$PAYOR$COVERAGE$AND$
GOVERNMENT FUNDING FOR ADDICTION TREATMENT
10
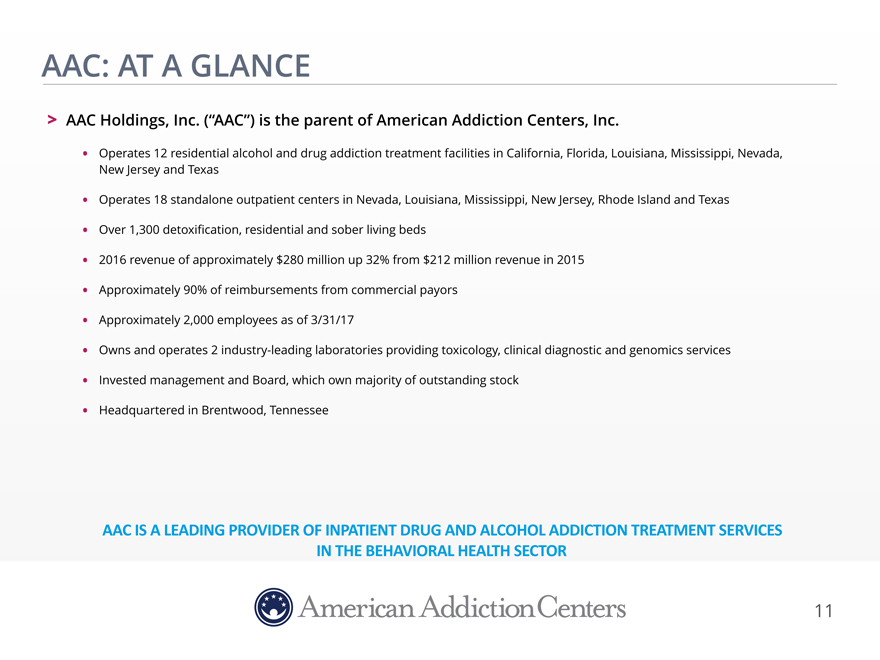
AAC: AT A GLANCE
AAC
Holdings, Inc. (“AAC”) is the parent of American Addiction Centers, Inc.
Operates 12 residential alcohol and drug addiction treatment facilities in
California, Florida, Louisiana, Mississippi, Nevada, New Jersey and Texas
Operates 18 standalone outpatient centers in Nevada, Louisiana, Mississippi, New Jersey,
Rhode Island and Texas
Over 1,300 detoxification, residential and sober living beds
2016 revenue of approximately $280 million up 32% from $212 million revenue in 2015
Approximately 90% of reimbursements from commercial payors
Approximately
2,000 employees as of 3/31/17
Owns and operates 2 industry-leading laboratories providing toxicology, clinical diagnostic and genomics services
Invested management and Board, which own majority of outstanding stock
Headquartered in
Brentwood, Tennessee
AAC IS A LEADING PROVIDER OF INPATIENT DRUG AND ALCOHOL ADDICTION TREATMENT SERVICES IN THE BEHAVIORAL HEALTH SECTOR
11
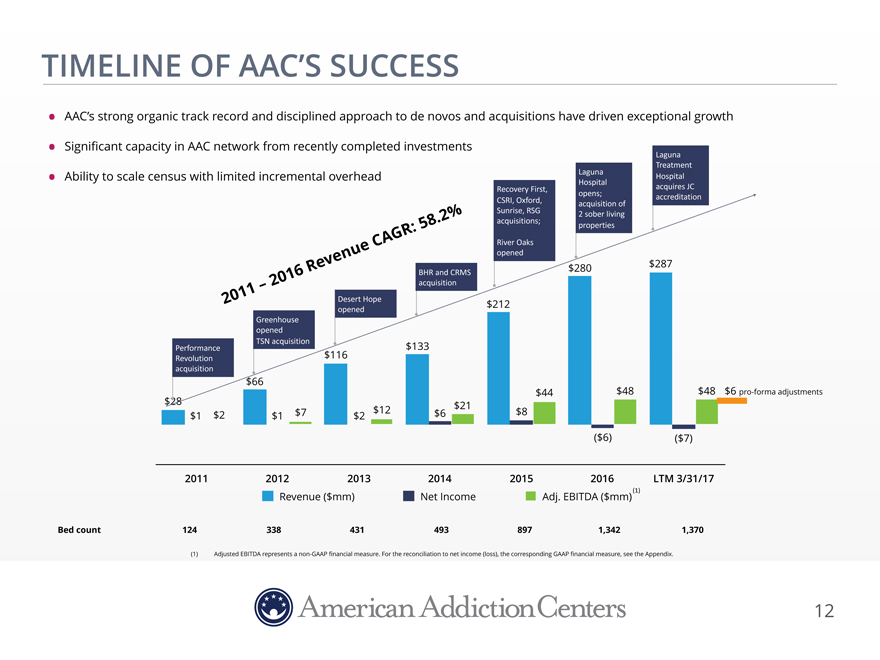
TIMELINE OF AAC’S SUCCESS
AAC’s strong organic track record and disciplined approach to de novos and acquisitions have driven exceptional growth
Significant capacity in AAC network from recently completed investments Laguna
Treatment
LagunaHospital$
Ability to scale census with limited incremental overhead
Hospital$
Recovery$First,$acquires$JC$
opens;$accreditation
CSRI,$Oxford,$acquisition$of$
Sunrise, RSG$2 sober living
:58.2%acquisitions;$properties
eCAG RRiver$Oaks$
Revenuopened$287
016BHR and$CRMS$$$280
acquisition
2011– 2Desert Hope$$212
opened
Greenhouse
opened
Performance$TSN$acquisition$133
Revolution$$116
acquisition
$66
$44$48$48 $6 pro-forma adjustments
$28$21
$1$2$1 $7$2 $12$6$8
($6)($7)
201120122013201420152016LTM 3/31/17
Revenue ($mm)Net IncomeAdj. EBITDA ($mm) (1)
Bed
count 1243384314938971,3421,370
(1)Adjusted EBITDA represents a non-GAAP financial measure. For the
reconciliation to net income (loss), the corresponding GAAP financial measure, see the Appendix.
12
Confidential
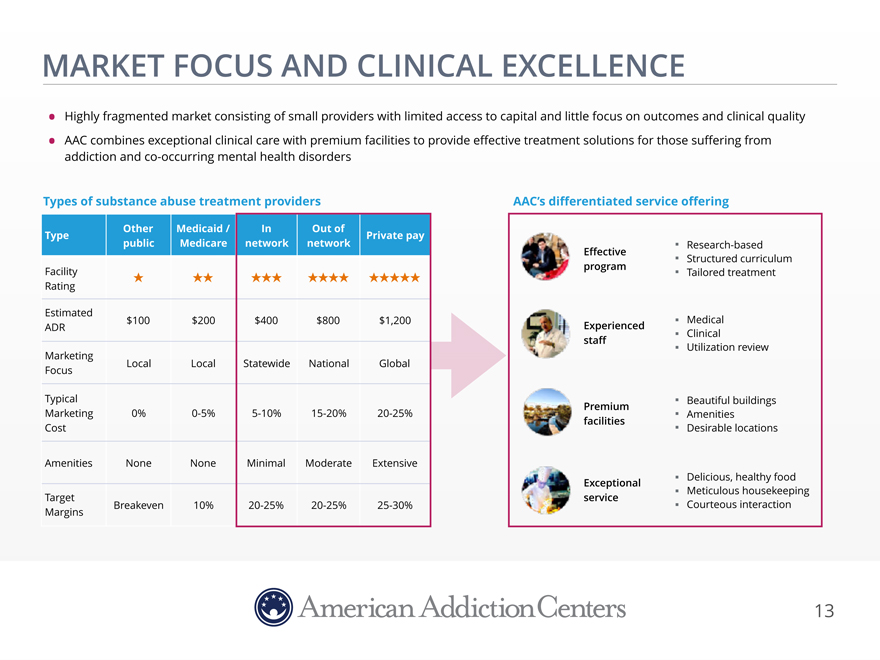
MARKET FOCUS AND CLINICAL EXCELLENCE
Highly fragmented market consisting of small providers with limited access to capital and little focus on outcomes and clinical quality
AAC combines exceptional clinical care with premium facilities to provide effective treatment solutions for those suffering from
addiction and co-occurring mental health disorders
Types of substance abuse treatment providers AAC’s differentiated service offering
OtherMedicaid /InOut of
Type Private pay
publicMedicarenetworknetwork Research-based
Effective Structured curriculum
Facility program Tailored treatment
Rating
Estimated $100 $200$400$800$1,200 Medical
ADR Experienced Clinical
staff Utilization review
Marketing
Focus Local
LocalStatewideNationalGlobal
Typical Beautiful buildings
Premium
Marketing 0% 0-5%5-10%15-20%20-25% Amenities
facilities
Cost Desirable locations
Amenities None NoneMinimalModerateExtensive
Exceptional Delicious, healthy food
Target service
Meticulous housekeeping
Margins Breakeven
10%20-25%20-25%25-30% Courteous interaction
13
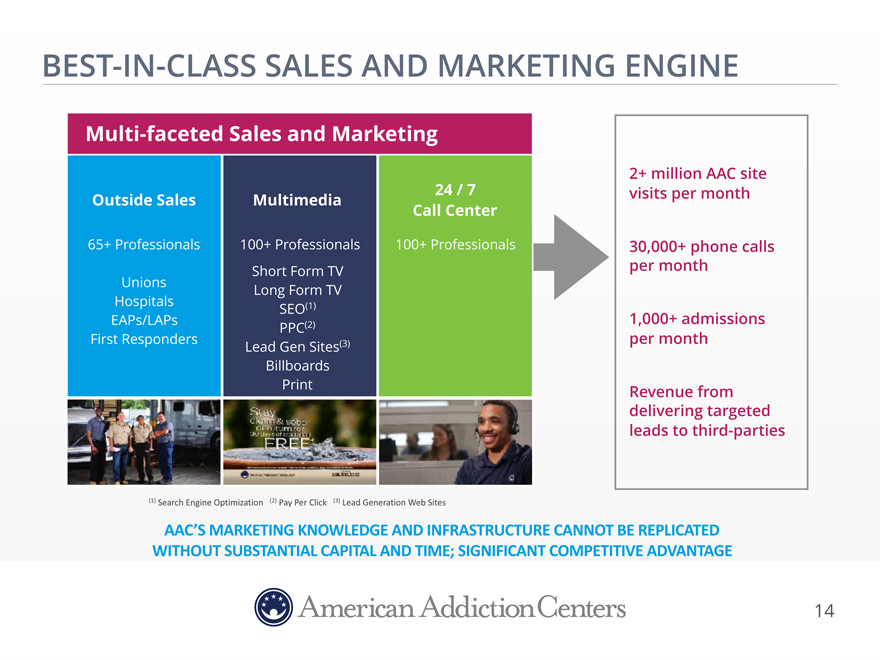
BEST-IN-CLASS SALES AND
MARKETING ENGINE
Multi-faceted Sales and Marketing
2+ million AAC site
Outside Sales Multimedia 24 / 7visits per month
Call Center
65+ Professionals 100+ Direct
Professionals 100+ Professionalsper 30,000+ month phone calls
Short Form TV
Hospitals Unions ReferLong FormalsTV
SEO(1)
EAPs/LAPs 1,000+ admissions
PPC(2)
First Responders per
month
Lead Gen Sites(3)
Billboards
Print Revenue from
delivering targeted
leads to third-parties
(1)$Search$Engine$Optimization$$$(2) Pay Per Click (3)$Lead$Generation$Web$Sites
AAC’S MARKETING KNOWLEDGE AND INFRASTRUCTURE CANNOT BE REPLICATED
WITHOUT SUBSTANTIAL CAPITAL AND TIME; SIGNIFICANT COMPETITIVE ADVANTAGE
14
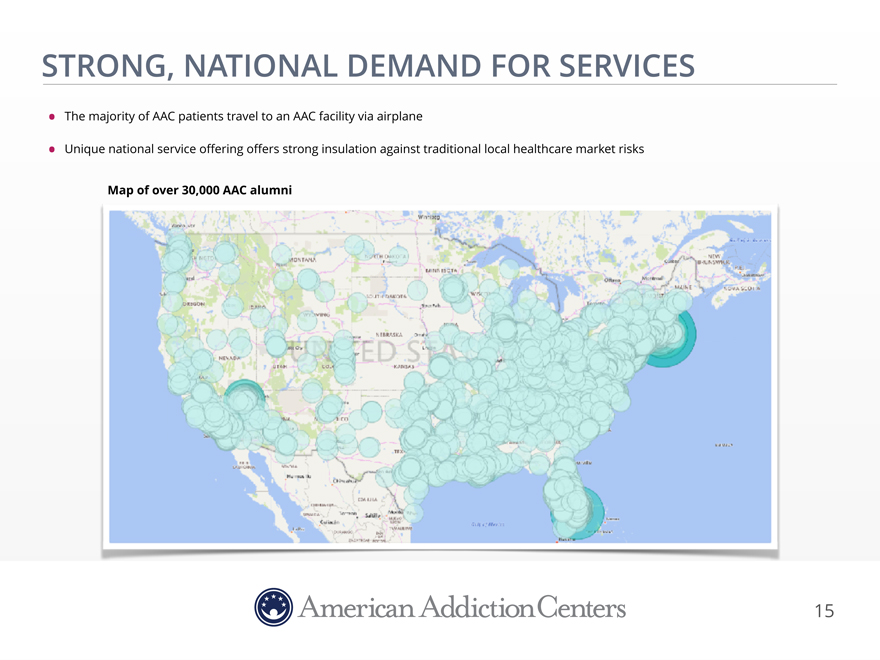
STRONG, NATIONAL DEMAND FOR SERVICES
The majority of AAC patients travel to an AAC facility via airplane
Unique national service
offering offers strong insulation against traditional local healthcare market risks
Map of over 30,000 AAC alumni
15
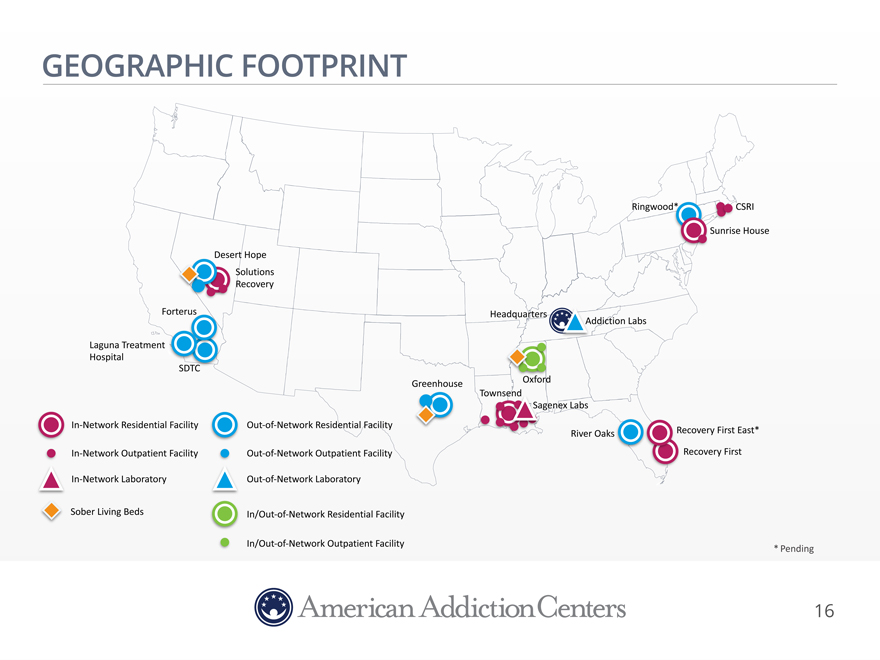
GEOGRAPHIC FOOTPRINT
Ringwood CSRI
Sunrise$House
Desert Hope Solutions$ Recovery
Forterus Headquarters ddiction$Labs Laguna Treatment$ Hospital
SD
Greenhouse Oxford Townsend agenex$Labs In-Network$Residential$Facility Out-of-Network$Residential$Facility
River$Oaks Recovery$First East*
In-Network$Outpatient Facility Out-of-Network$Outpatient Facility Recovery$First
In-Network$Laboratory Out-of-Network$Laboratory
Sober Living Beds In/Out-of-Network$Residential$Facility
In/Out-of-Network$Outpatient Facility $
* Pending
16
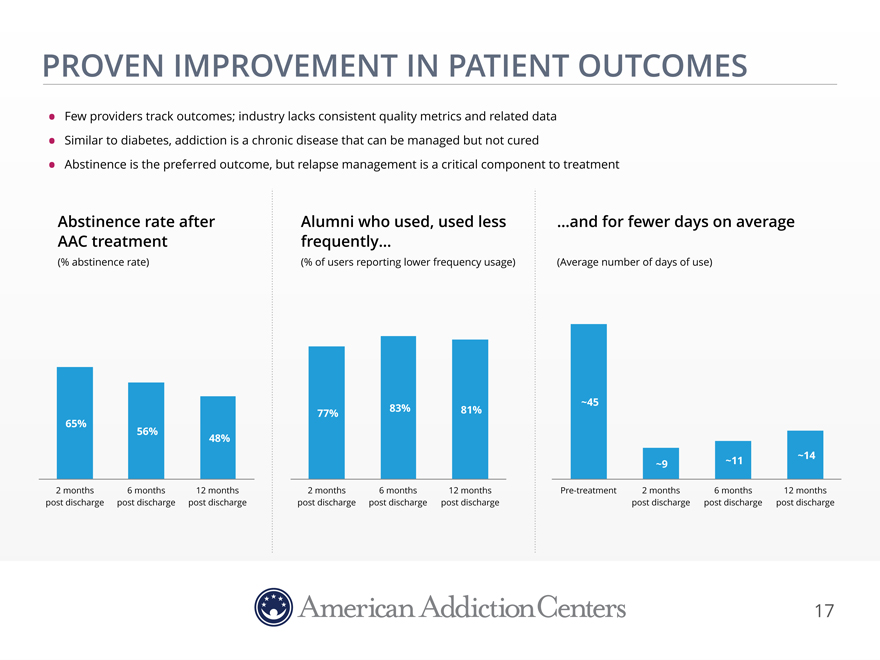
PROVEN IMPROVEMENT IN PATIENT OUTCOMES
Few providers track outcomes; industry lacks consistent quality metrics and related data
Similar to diabetes, addiction is a chronic disease that can be managed but not cured
Abstinence is the preferred outcome, but relapse management is a critical component to treatment
Abstinence rate after Alumni who used, used less…and for fewer days on average
AAC treatment frequently…
(% abstinence
rate) (% of users reporting lower frequency usage)(Average number of days of use)
77%83%81%~45
65%
56%48%
~9~11~14
2 months 6 months 12 months2 months6 months12 monthsPre-treatment2 months6 months12 months
post discharge post discharge post dischargepost
dischargepost dischargepost dischargepost dischargepost dischargepost discharge
17
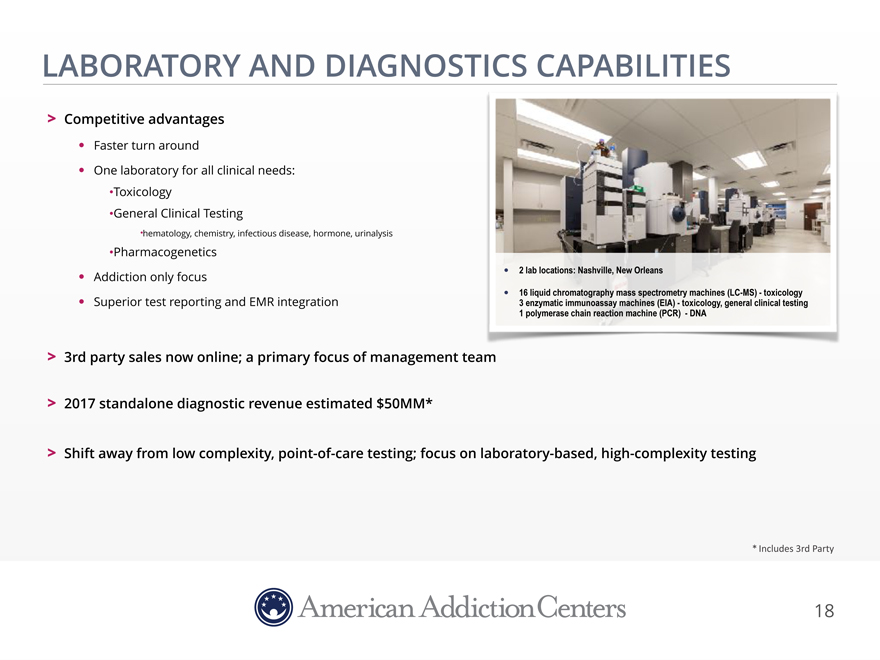
LABORATORY AND DIAGNOSTICS CAPABILITIES
Competitive advantages
Faster turn around
One laboratory for all clinical needs:
Toxicology
General Clinical Testing
hematology, chemistry, infectious disease, hormone, urinalysis
Pharmacogenetics
Addiction only focus 2 lab locations: Nashville, New Orleans
16 liquid chromatography mass spectrometry machines (LC-MS)—toxicology
Superior test reporting and EMR integration 3 enzymatic immunoassay machines (EIA)—toxicology, general clinical testing 1 polymerase chain reaction machine (PCR) —DNA
3rd party sales now online; a primary focus of management team
2017
standalone diagnostic revenue estimated $50MM*
Shift away from low complexity,
point-of-care testing; focus on laboratory-based, high-complexity testing
*$Includes$3rd$Party
18
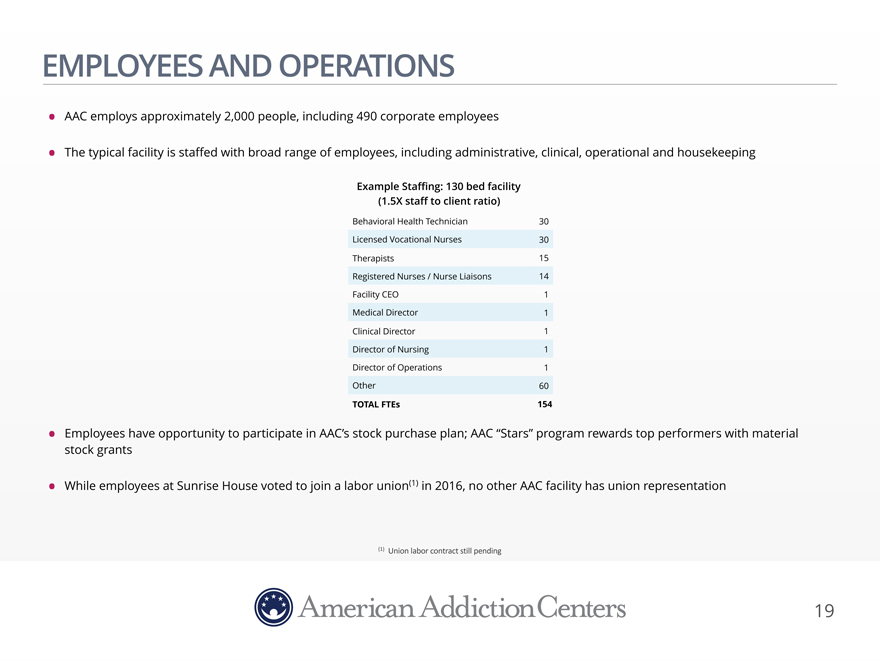
EMPLOYEES AND OPERATIONS
AAC employs approximately 2,000 people, including 490 corporate employees
The
typical facility is staffed with broad range of employees, including administrative, clinical, operational and housekeeping
Example Staffing: 130 bed facility
(1.5X staff to client ratio)
Behavioral Health Technician 30 Licensed Vocational Nurses 30 Therapists 15 Registered Nurses / Nurse Liaisons 14 Facility CEO 1
Medical Director 1 Clinical Director 1 Director of Nursing 1 Director of Operations 1 Other 60
TOTAL FTEs 154
Employees have opportunity to participate in AAC’s stock purchase plan; AAC “Stars” program rewards top performers with material stock grants
While employees at Sunrise House voted to join a labor union(1) in 2016, no other AAC facility has union representation
(1) Union$labor contract still$pending
19
COMPLIANCE PROGRAM
AAC’s compliance program reviews regulatory compliance procedures and policies across its facilities
Executive management is responsible for oversight and operation of the compliance program
Periodic and comprehensive training programs to all personnel
All AAC
treatment facilities are licensed under applicable state laws and accredited by the primary accrediting bodies in the industry
All treatment facilities have
obtained or in process of obtaining accreditation from CARF and/or The Joint Commission
Both labs hold CLIA certificates of accreditation, certifying them for
complex testing, are accredited by COLA and participate in the CAP proficiency program
Sentinel events unfortunately occur in the substance abuse treatment
industry
AAC’s sentinel event rate is approximately 10% of the industry average (1)
(1) According to SAMHSA, during 2010 and 2011, deaths occurred while in treatment at a rate of one death for every 422 client discharges. AAC experienced 1 death per 4,252 client
discharges from 2011—2015
20
RECENT EXPENSE REDUCTION INITIATIVES
Work Force Reduction—approximately $8.6MM in expected annualized savings
5% work force
reduction completed in February 2017
108 positions eliminated across the Company
Expected $8.6MM of annualized savings ($8.2MM of the $8.6MM will be recognized in fiscal year 2017)
Positions eliminated included:
Non-essential positions
at the corporate office
Achievement of synergies at recently acquired facilities (e.g., Solutions, Townsend, and Sunrise House)
Reductions to align staffing levels with occupancy
21
RECENT DEVELOPMENTS AND COMPANY UPDATES
Laguna Joint Commission accreditation on February 14th
AAC benefitting from 50%+ increase in
census in first 90 days
Oxford expansion of 48 residential and detox beds
Represents $7.5 million annual revenue and $1.5 million AEBITDA opportunity (85% occupancy @ $500 ADR and 20% net margin)
New Orleans East Hospital progress
36 leased hospital beds pending licensure
Pending consolidation of Southern Florida operations (Summer 2017)
Consolidation of Recovery
First West Palm and Recovery First will provide more efficient operations and stronger financial performance
AAC has assumed the operating leases and assets of the
former Recovery Place located in Ft. Lauderdale
Clients and staff will transition from Recovery First West Palm to new Ft. Lauderdale location by July 1st
Represents a net pick up of 19 in-network beds
22
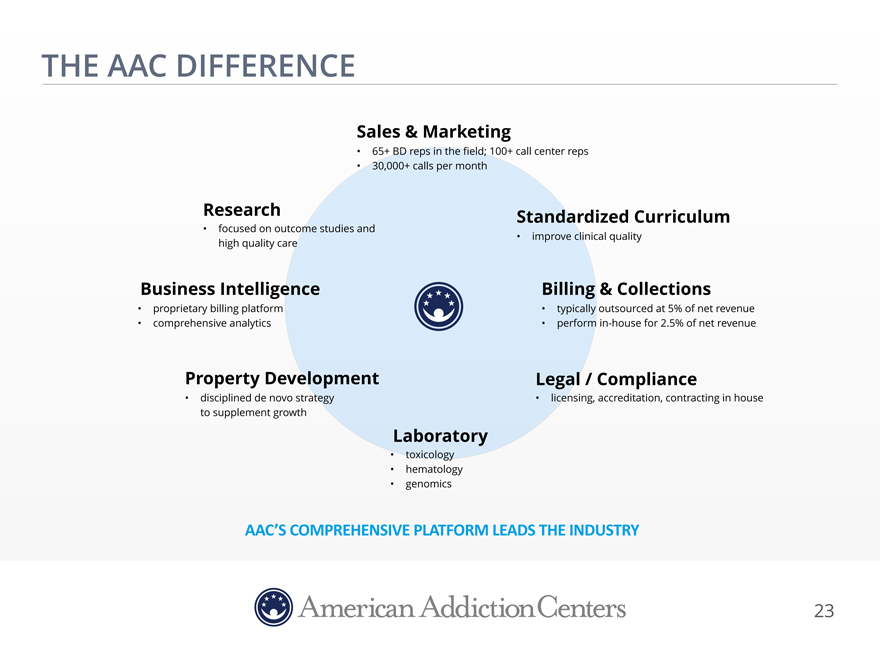
THE AAC DIFFERENCE
Sales & Marketing
65+ BD reps in the field; 100+ call center reps
30,000+ calls per month
Research Standardized Curriculum
focused on outcome studies and
improve clinical quality high quality care
Business Intelligence Billing & Collections
proprietary billing platform typically
outsourced at 5% of net revenue comprehensive analytics perform in-house for 2.5% of net revenue
Property Development Legal
/ Compliance
disciplined de novo strategy licensing, accreditation, contracting in house to supplement growth
Laboratory
toxicology hematology genomics
AAC’S COMPREHENSIVE PLATFORM LEADS THE INDUSTRY
23

GREENHOUSE
FINANCIAL
UPDATE
24
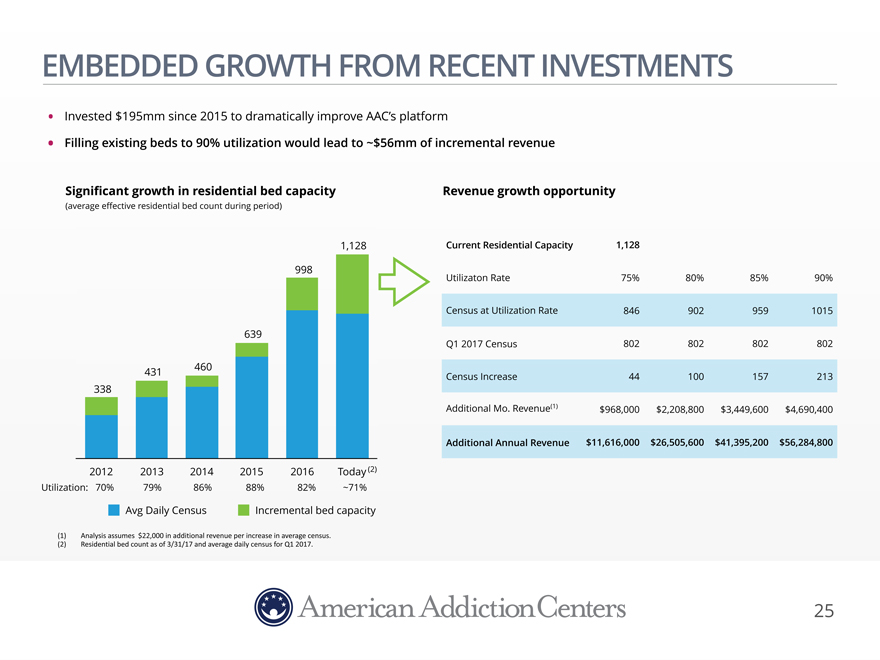
EMBEDDED GROWTH FROM RECENT INVESTMENTS
Invested $195mm since 2015 to dramatically improve AAC’s platform
Filling existing beds
to 90% utilization would lead to ~$56mm of incremental revenue
Significant growth in residential bed capacity
(average effective residential bed count during period)
1,128
998
639
431 460
338
2012 2013 2014 2015 2016 Today (2)
Utilization: 70% 79% 86% 88% 82% ~71%
Avg Daily Census Incremental bed capacity
(1)$
Analysis$assumes$$$22,000$in$additional$revenue$per$increase$in$average$census.
(2)$ Residential$bed$count as$of$3/31/17$and$average$daily$census$for$Q1$2017.
Revenue growth opportunity
Current Residential Capacity 1,128
Utilizaton Rate 75% 80% 85% 90%
Census at Utilization Rate 846 902 959 1015
Q1 2017 Census 802 802 802 802
Census Increase 44 100 157 213
Additional Mo. Revenue(1) $968,000 $2,208,800 $3,449,600 $4,690,400
Additional Annual Revenue
$11,616,000 $26,505,600 $41,395,200 $56,284,800
25
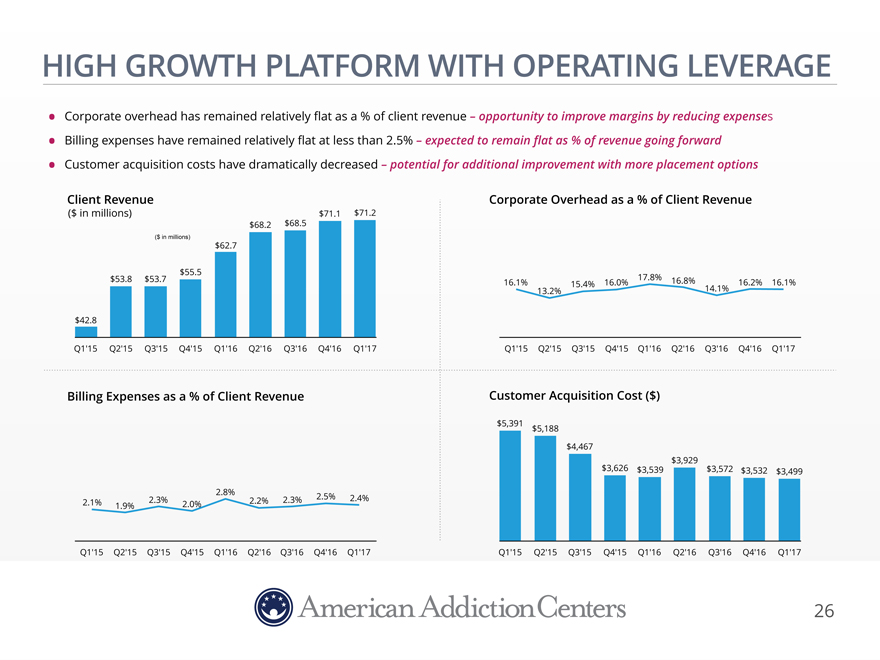
HIGH GROWTH PLATFORM WITH OPERATING LEVERAGE
Corporate overhead has remained relatively flat as a % of client revenue – opportunity to improve margins by reducing expenses
Billing expenses have remained relatively flat at less than 2.5% – expected to remain flat as % of revenue going forward
Customer acquisition costs have dramatically decreased – potential for additional improvement with more placement options
Client Revenue Corporate Overhead as a % of Client Revenue
($ $71.1 $71.2
$68.2 $68.5
($ in millions)
$62.7
$55.5
$53.8 $53.716.1%15.4% 16.0%17.8%16.8%16.2%16.1%
13.2%14.1%
$42.8
Q1’15 Q2’15 Q3’15 Q4’15 Q1’16 Q2’16 Q3’16 Q4’16 Q1’17Q1’15 Q2’15 Q3’15
Q4’15Q1’16Q2’16 Q3’16 Q4’16Q1’17
Billing Expenses as a % of Client Revenue Customer Acquisition Cost ($)
$5,391 $5,188
$4,467
$3,929
$3,626$3,539$3,572 $3,532$3,499
2.8%2.5%
2.1% 1.9% 2.3% 2.0%2.2% 2.3%2.4%
Q1’15 Q2’15 Q3’15 Q4’15 Q1’16 Q2’16 Q3’16 Q4’16 Q1’17 Q1’15 Q2’15 Q3’15
Q4’15Q1’16Q2’16 Q3’16 Q4’16Q1’17
26
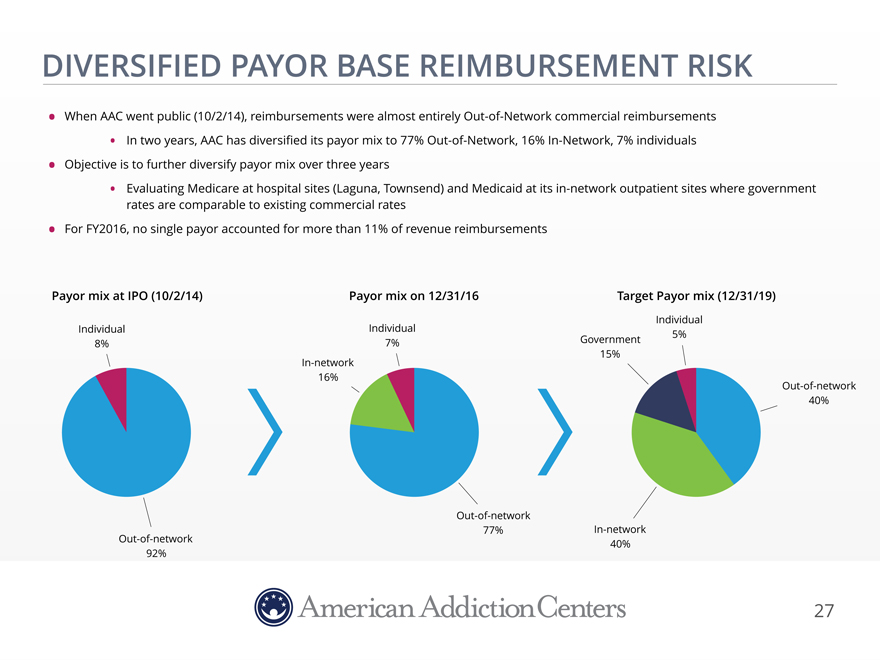
DIVERSIFIED PAYOR BASE REIMBURSEMENT RISK
When AAC went public (10/2/14), reimbursements were almost entirely Out-of-Network commercial
reimbursements
In two years, AAC has diversified its payor mix to 77%
Out-of-Network, 16% In-Network, 7% individuals
Objective is to further diversify payor mix over three years
Evaluating Medicare at hospital sites (Laguna, Townsend) and Medicaid at its in-network outpatient
sites where government
rates are comparable to existing commercial rates
For
FY2016, no single payor accounted for more than 11% of revenue reimbursements
Payor mix at IPO (10/2/14) Payor mix on 12/31/16
Individual
Individual Individual5%
8% 7%Government
15%
In-network
16%
Out-of-network
40%
Out-of-network
77%In-network
Out-of-network 40%
92%
27
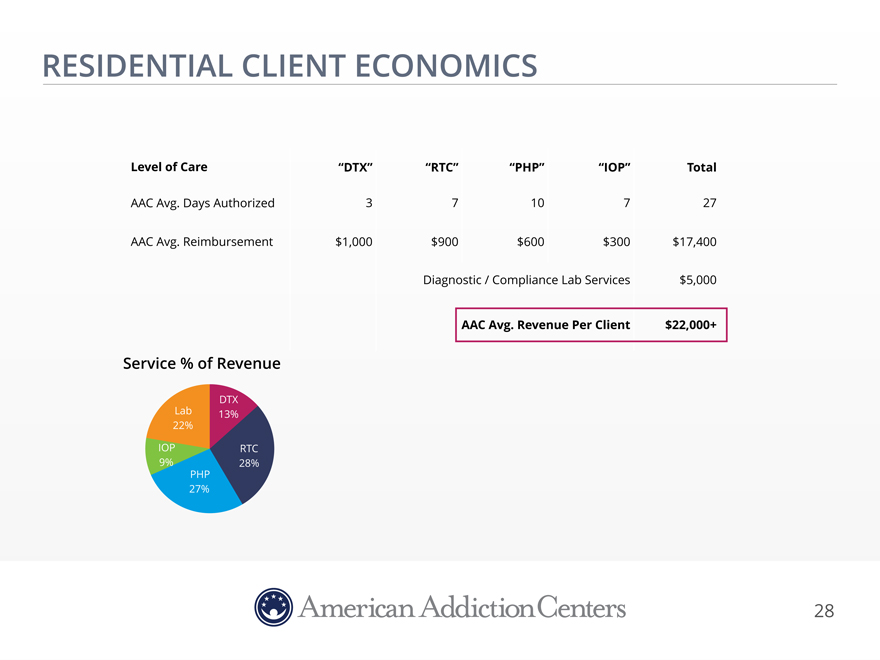
RESIDENTIAL CLIENT ECONOMICS
Level of Care “DTX”“RTC”“PHP”“IOP”Total
AAC Avg. Days Authorized 3 710727
AAC Avg.
Reimbursement $1,000 $900$600$300$17,400
Diagnostic / Compliance Lab Services$5,000
AAC Avg. Revenue Per Client$22,000+
Service % of Revenue
DTX
Lab 13%
22%
IOP RTC
9% 28%
PHP
27%
28
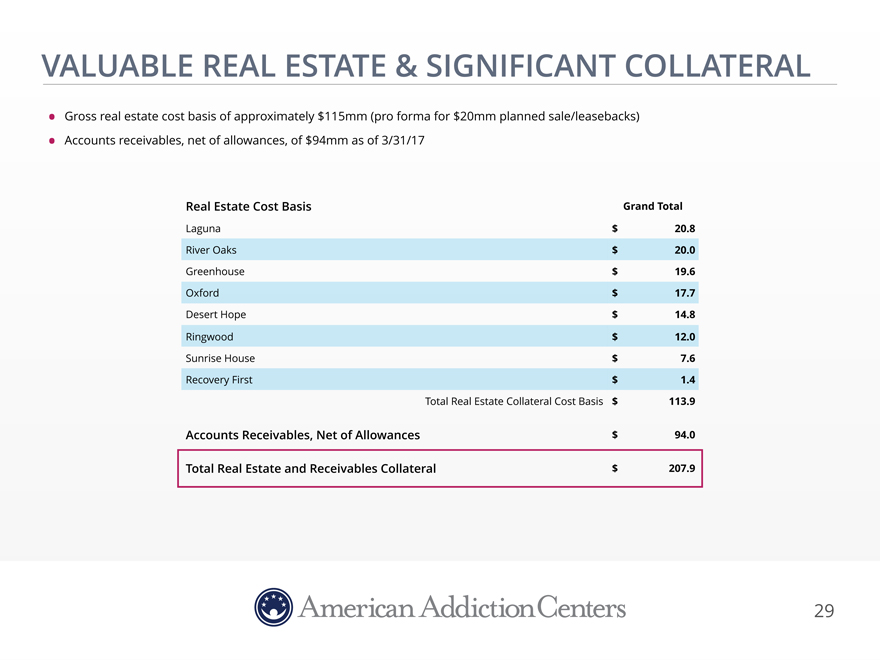
VALUABLE REAL ESTATE & SIGNIFICANT COLLATERAL
Gross real estate cost basis of approximately $115mm (pro forma for $20mm planned sale/leasebacks)
Accounts receivables, net of allowances, of $94mm as of 3/31/17
Real Estate Cost Basis Grand
Total
Laguna $ 20.8 River Oaks $ 20.0 Greenhouse $ 19.6 Oxford $ 17.7 Desert Hope $ 14.8 Ringwood $ 12.0 Sunrise House $ 7.6 Recovery First $ 1.4 Total Real Estate
Collateral Cost Basis $ 113.9
Accounts Receivables, Net of Allowances $ 94.0
Total Real Estate and Receivables Collateral $ 207.9
29
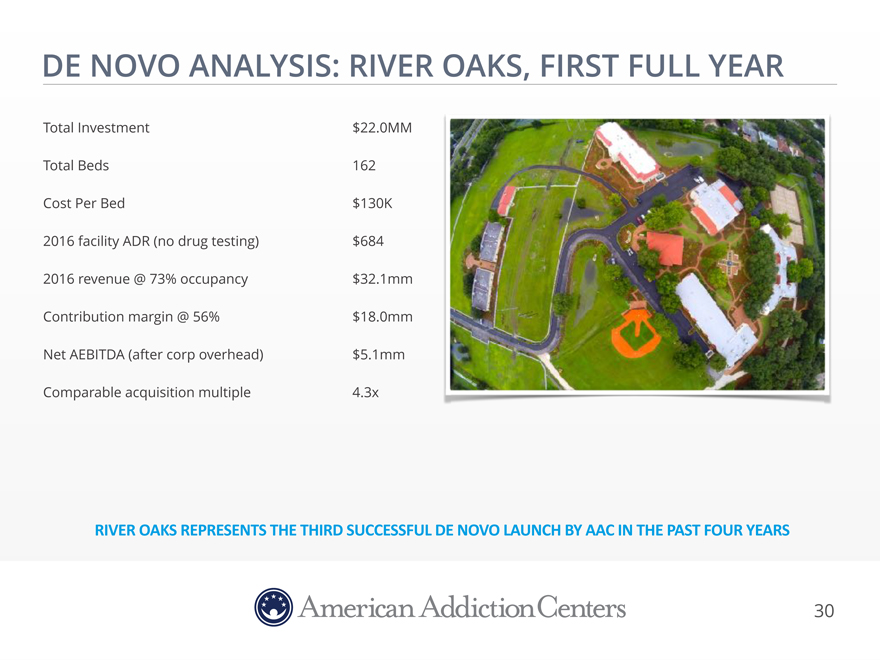
DE NOVO ANALYSIS: RIVER OAKS, FIRST FULL YEAR
Total Investment $22.0MM Total Beds 162 Cost Per Bed $130K 2016 facility ADR (no drug testing) $684 2016
revenue @ 73% occupancy $32.1mm Contribution margin @ 56% $18.0mm Net AEBITDA (after corp overhead) $5.1mm Comparable acquisition multiple 4.3x
RIVER OAKS REPRESENTS THE THIRD SUCCESSFUL DE NOVO LAUNCH BY AAC IN THE PAST FOUR YEARS
30
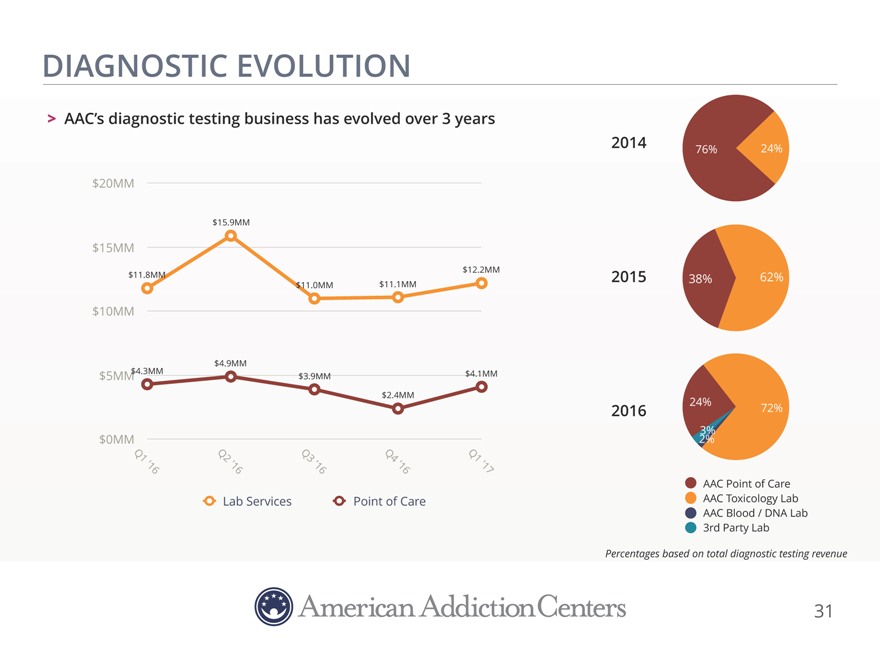
DIAGNOSTIC EVOLUTION
AAC’s diagnostic testing business has evolved over 3 years
2014 76% 24%
$20MM
$15.9MM
$15MM
$12.2MM $11.8MM $11.1MM 2015 38% 62% $11.0MM
$10MM
$4.9MM
$4.3MM $4.1MM $5MM $3.9MM
$2.4MM
24%
2016 72%
3% $0MM 2%
Q1 Q2 Q3 Q4 Q1
‘16 ‘16 ‘16 ‘16 ‘17
AAC Point of Care
Lab Services Point of Care AAC Toxicology Lab AAC Blood / DNA Lab 3rd Party
Lab
Percentages based on total diagnostic testing revenue
31
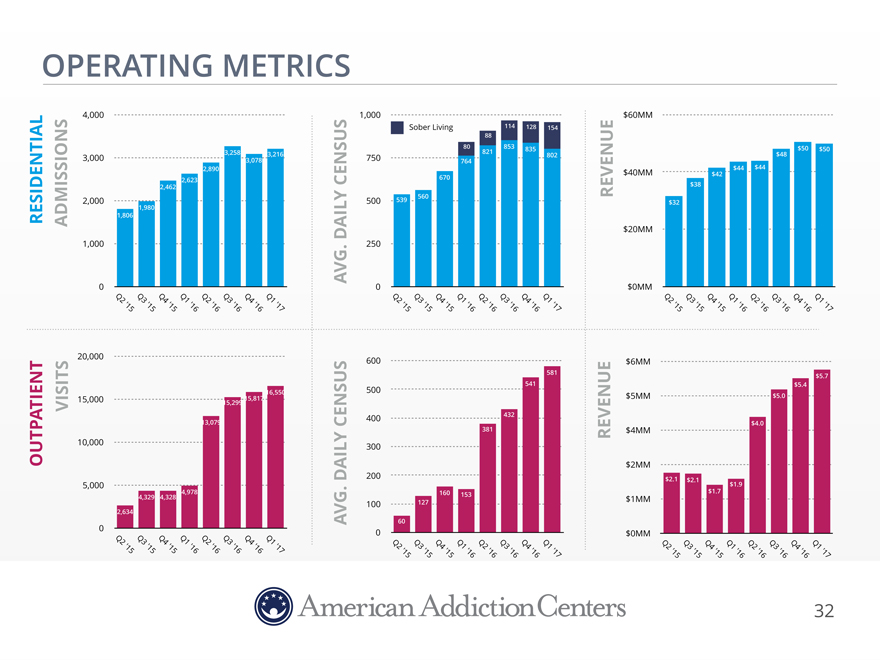
OPERATING METRICS
4,000 1,000$60MM
Sober Living114128154
88
80853835$50 $50
3,000 3,258 3,0783,216750821802$48
764
2,890$40MM$42 $44 $44
2,623 670
2,462 $38
2,000 500539560$32
1,980
RESIDENTIAL ADMISSIONS 1,806
CENSUSREVENUE
DAILY$20MM
1,000 .250
AVG
0 0$0MM
Q2 Q3 Q4 Q1 Q2 Q3 Q4Q1Q2Q3 Q4 Q1Q2Q3Q4Q1Q2Q3 Q4 Q1 Q2 Q3 Q4 Q1
‘15
‘15 ‘15 ‘16 ’16 ‘16 ‘16’17’15’15 ‘15 ‘16’16’16’16’17’15’15 ‘15 ‘16 ‘16 ‘16 ‘16 ‘17
20,000 600$6MM
581$5.7
541$5.4
16,550500$5MM
15,000 15,299 15,817$5.0
400432
VISITS 13,079CENSUS$4.0
381$4MM
OUTPATIENT 10,000 300REVENUE
$2MM
DAILY200$2.1$2.1
5,000 $1.9
4,978 .160 153$1.7
4,329 4,328 $1MM
100127
2,634
AVG60
0 0$0MM
Q2 ‘15 Q3 ‘15 Q4 ‘15 Q1 ‘16 Q2 ‘16 Q3 ‘16 Q4 ‘16 Q1 ‘17Q2 ‘15Q3 ‘15 Q4 ‘15 Q1 ‘16 Q2 ‘16Q3
‘16Q4 ‘16Q1 ‘17Q2Q3 Q4 Q1 Q2 Q3 Q4 Q1
‘15’15 ‘15 ‘16 ‘16 ‘16 ‘16 ‘17
32
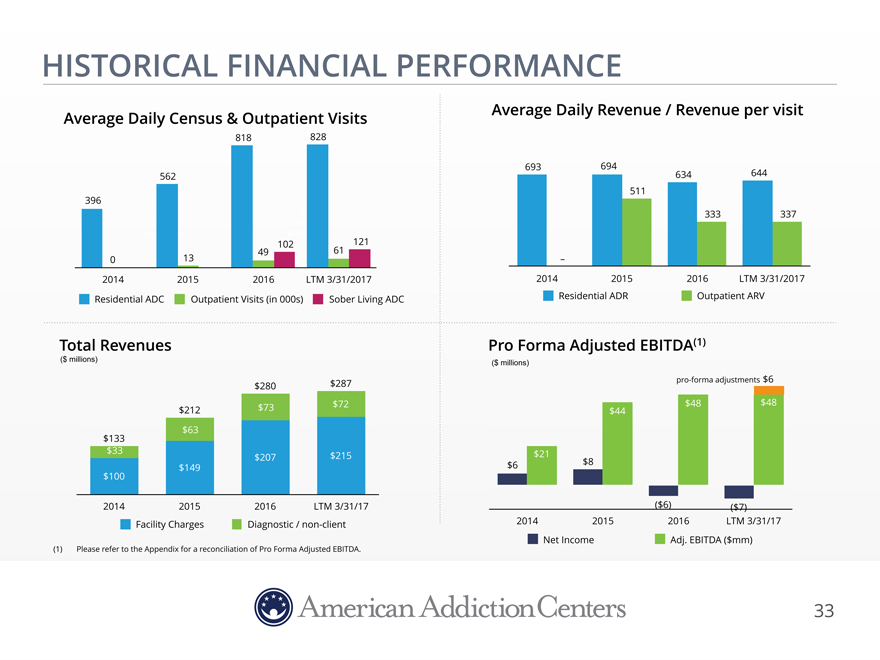
HISTORICAL FINANCIAL PERFORMANCE
Average Daily Census & Outpatient Visits
818 828
562
396
102 121
0 13 49 61
2014 2015 2016 LTM 3/31/2017
Residential ADC Outpatient Visits (in 000s) Sober Living ADC
Total Revenues
($ millions)
$280 $287
$212 $73 $72
$63
$133
$33 $207 $215
$149
$100
2014 2015 2016 LTM 3/31/17
Facility Charges Diagnostic / non-client
(1) Please refer to the Appendix for a reconciliation
of Pro Forma Adjusted EBITDA.
33
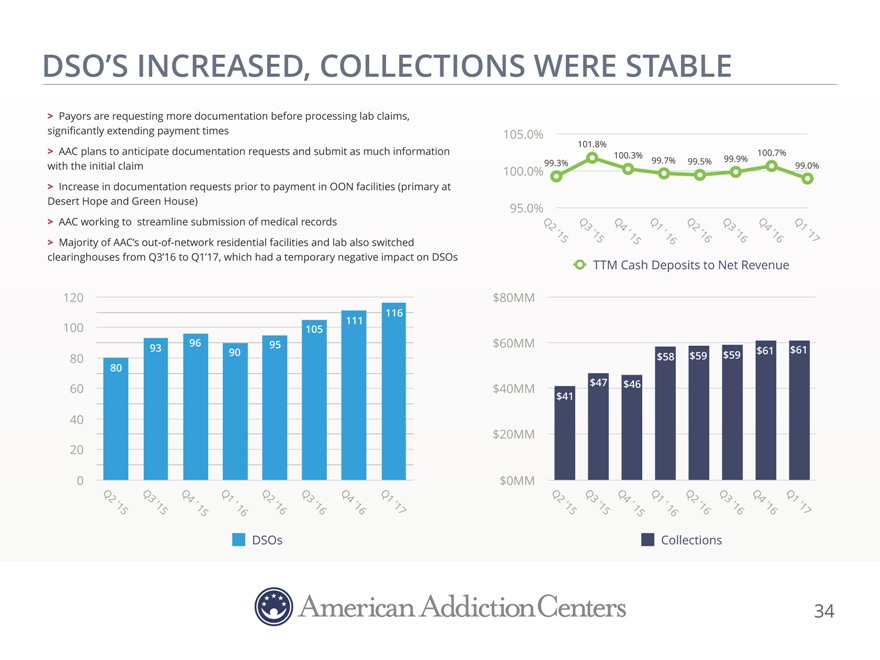
DSO’S INCREASED, COLLECTIONS WERE STABLE
Payors are requesting more documentation before processing lab claims,
significantly extending
payment times 105.0%
101.8%
AAC plans to anticipate
documentation requests and submit as much information 100.3%100.7%
with the initial claim 100.0% 99.3%99.7%99.5%99.9%99.0%
Increase in documentation requests prior to payment in OON facilities (primary at
Desert Hope
and Green House) 95.0%
AAC working to streamline submission of medical records Q2Q3Q4Q1Q2Q3Q4Q1
Majority of AAC’s out-of-network residential facilities and lab also switched
‘15’15’ 15’ 16’16’16’16’17
clearinghouses from Q3’16 to Q1’17, which had a temporary negative impact on
DSOs TTM Cash Deposits to Net Revenue
120 $80MM
116
100 105111
93969095$60MM$61$61
80 $58$59$59
80
60 $40MM$47$46
$41
40
$20MM
20
0 $0MM
Q2 Q3Q4Q1 ‘Q2Q3Q4Q1Q2Q3Q4 ‘Q1
‘Q2Q3Q4Q1
‘15 ’15’ 1516’16’16’16’17’15’151516’16’16’16’17
DSOsCollections
34
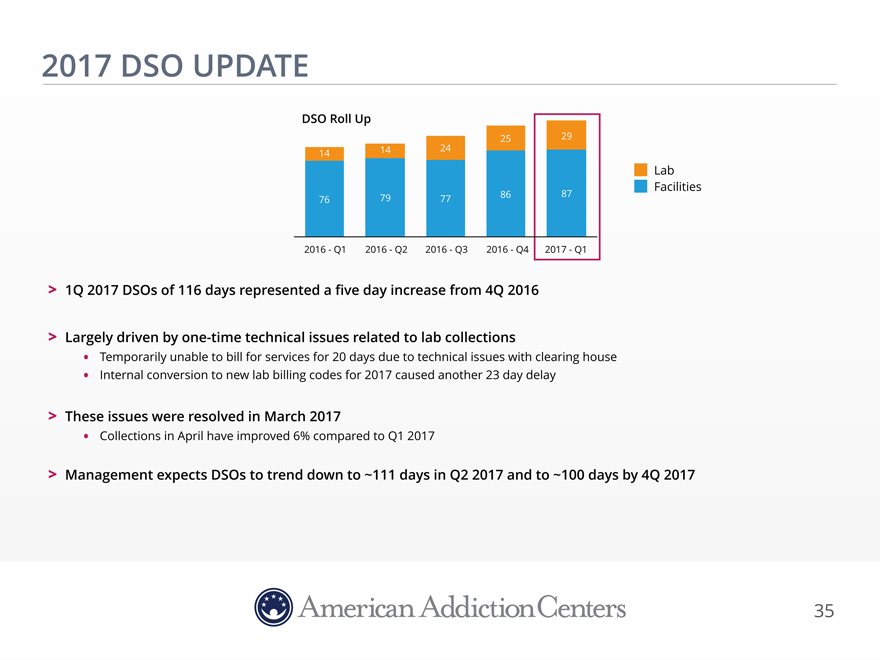
2017 DSO UPDATE
DSO Roll
Up
25 29
14 24 14
Lab Facilities
79 86 87
76 77
2016—Q1 2016—Q2 2016—Q3 2016—Q4 2017—Q1
1Q 2017 DSOs of 116 days represented a five day increase from 4Q 2016
Largely driven by one-time technical issues related to lab collections
Temporarily unable to bill for services for 20 days due to technical issues
with clearing house
Internal conversion to new lab billing codes for 2017 caused another 23 day delay
These issues were resolved in March 2017
Collections in April have improved 6% compared to Q1
2017
Management expects DSOs to trend down to ~111 days in Q2 2017 and to ~100 days by 4Q 2017
35
DESERT HOPE
APPENDIX
36
APPENDIX: NON-GAAP FINANCIAL MEASURES Adjusted EBITDA and Adjusted Pro Forma Adjusted EBITDA, (herein collectively referred to as “Non-GAAP Disclosures”) are “non-GAAP financial measures” as defined under the rules and regulations promulgated by the U.S. Securities and Exchange Commission, which is defined below. Management believes the Non- GAAP Disclosures provide investors with additional meaningful financial information that should be considered when assessing our underlying business performance and trends. We believe the Non-GAAP Disclosures also enhance investors’ ability to compare period-to-period financial results. The Non-GAAP Disclosures should not be considered as measures of financial performance under U.S. generally accepted accounting principles (“GAAP”). The items excluded from the Non-GAAP Disclosures are significant components in understanding and assessing our financial performance and should not be considered as an alternative to net income (loss) or other financial statement items presented in the condensed consolidated financial statements. Because the Non-GAAP Disclosures are not a measure determined in accordance with GAAP, the Non-GAAP Disclosures may not be comparable to other similarly titled measures of other companies. Management defines Adjusted EBITDA as net income (loss) adjusted for interest expense, depreciation and amortization expense, income tax expense (benefit), stock-based compensation and related tax reimbursements, litigation settlement and California matter related expense, acquisition-related expense (which includes professional services for accounting, legal, valuation services and licensing expenses), de novo start-up and other expenses, facility closure operating losses and expense (associated with The Academy and FitRx), gain on contingent consideration associated with our acquisition of Townsend, and bargain purchase gain associated with our acquisition of Sunrise House in the fourth quarter of 2015. Management defines Adjusted Pro Forma EBITDA as net income (loss) adjusted for interest expense, depreciation and amortization expense, income tax expense (benefit), stock-based compensation and related tax reimbursements, litigation settlement and California matter related expense, acquisition-related expense (which includes professional services for accounting, legal, valuation services and licensing expenses), de novo start-up and other expenses, facility closure operating losses and expense (associated with The Academy and FitRx), gain on contingent consideration associated with our acquisition of Townsend, bargain purchase gain associated with our acquisition of Sunrise House in the fourth quarter of 2015, increased rent expense based upon contemplated sale/leaseback, effect of Q1 2017 workforce reduction, and run rate adjustment for Solutions acquisition. 37 Confidential
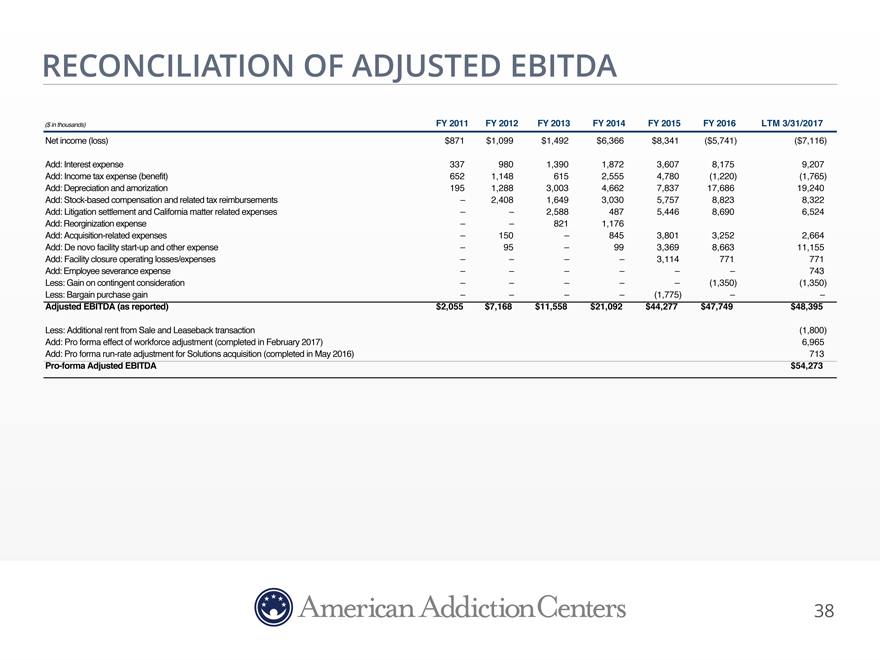
RECONCILIATION OF ADJUSTED EBITDA
($ in thousands) FY 2011 FY 2012FY 2013FY 2014FY 2015FY 2016LTM 3/31/2017
Net income (loss) $871 $1,099$1,492$6,366$8,341($5,741)($7,116)
Add: Interest expense 337 9801,3901,8723,6078,1759,207
Add: Income tax
expense (benefit) 652 1,1486152,5554,780(1,220)(1,765)
Add: Depreciation and amorization 195
1,2883,0034,6627,83717,68619,240
Add: Stock-based compensation and related tax reimbursements – 2,4081,6493,0305,7578,8238,322
Add: Litigation settlement and California matter related expenses – –2,5884875,4468,6906,524
Add: Reorginization expense – –8211,176
Add:
Acquisition-related expenses – 150–8453,8013,2522,664
Add: De novo facility start-up and
other expense – 95–993,3698,66311,155
Add: Facility closure operating losses/expenses –
–––3,114771771
Add: Employee severance expense – –––––743
Less: Gain on contingent consideration – ––––(1,350)(1,350)
Less: Bargain purchase gain – –––(1,775)––
Adjusted EBITDA (as reported) $2,055 $7,168$11,558$21,092$44,277$47,749$48,395
Less: Additional rent from Sale and Leaseback transaction (1,800)
Add:
Pro forma effect of workforce adjustment (completed in February 2017) 6,965
Add: Pro forma run-rate
adjustment for Solutions acquisition (completed in May 2016) 713
Pro-forma Adjusted
EBITDA $54,273
38
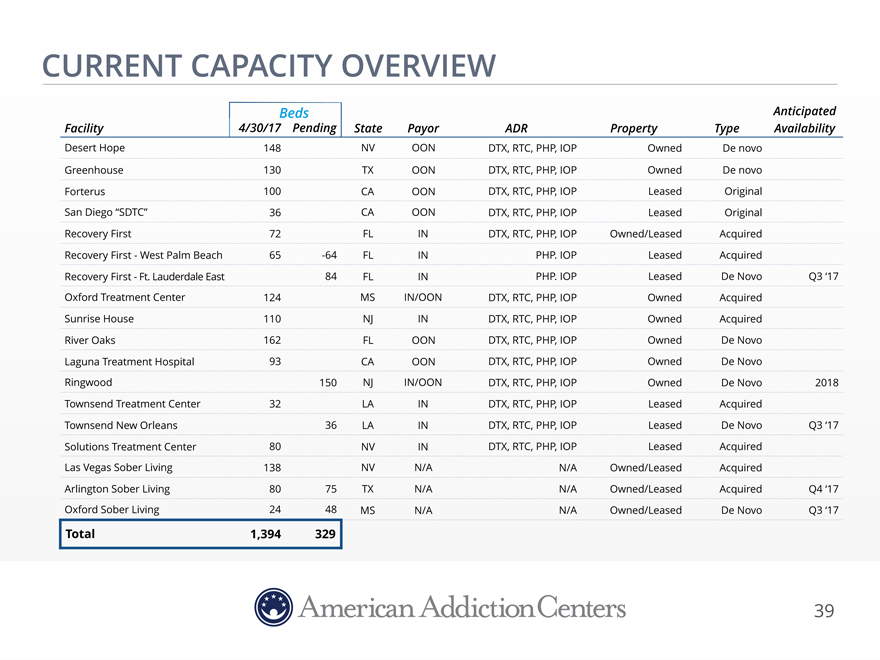
CURRENT CAPACITY OVERVIEW
Beds Anticipated
Facility 4/30/17
PendingStatePayorADRPropertyTypeAvailability
Desert Hope 148 NVOONDTX, RTC, PHP, IOPOwnedDe novo
Greenhouse 130 TXOONDTX, RTC, PHP, IOPOwnedDe novo
Forterus 100 CAOONDTX, RTC, PHP, IOPLeasedOriginal
San
Diego “SDTC” 36 CAOONDTX, RTC, PHP, IOPLeasedOriginal
Recovery First 72 FLINDTX, RTC, PHP,
IOPOwned/LeasedAcquired
Recovery First—West Palm Beach 65 -64FLINPHP. IOPLeasedAcquired
Recovery First—Ft. Lauderdale East 84FLINPHP. IOPLeasedDe NovoQ3 ‘17
Oxford Treatment Center 124 MSIN/OONDTX, RTC, PHP, IOPOwnedAcquired
Sunrise House 110 NJINDTX, RTC, PHP, IOPOwnedAcquired
River Oaks 162 FLOONDTX, RTC, PHP, IOPOwnedDe Novo
Laguna Treatment Hospital 93 CAOONDTX, RTC, PHP, IOPOwnedDe Novo
Ringwood 150NJIN/OONDTX, RTC, PHP, IOPOwnedDe Novo2018
Townsend
Treatment Center 32 LAINDTX, RTC, PHP, IOPLeasedAcquired
Townsend New Orleans 36LAINDTX, RTC, PHP, IOPLeasedDe
NovoQ3 ‘17
Solutions Treatment Center 80 NVINDTX, RTC, PHP, IOPLeasedAcquired
Las Vegas Sober Living 138 NVN/AN/AOwned/LeasedAcquired
Arlington Sober
Living 80 75TXN/AN/AOwned/LeasedAcquiredQ4 ‘17
Oxford Sober Living 24 48MSN/AN/AOwned/LeasedDe NovoQ3 ‘17
Total 1,394 329
39