Attached files
| file | filename |
|---|---|
| 8-K - FORM 8-K - FIRST UNITED CORP/MD/ | v467291_8k.htm |
Exhibit 99.1
Slide 1: Montage of Pictures
Slide 2: Commercial #1
Slide 3: Cover Slide
FIRST UNITED CORPORATION
2017 Annual Meeting of Shareholders’ Presentation
May 18, 2017
CARISSA RODEHEAVER
Slide 4: Carissa Rodeheaver
Good Morning fellow shareholders, and welcome to the 2017 Shareholders Meeting. I appreciate your interest in attending and for your support over the last year.
Slide 5: Forward-Looking Statements
Before we begin our presentation, I would like to direct your attention to the Forward-Looking Statement Disclosure, which is displayed on the screen for your review.
Slide 6: Mission
The mission for our Company remains the same, to enrich the lives of our associates, customers, communities and shareholders through uncommon service and effective financial solutions. Today, I will update you on the progress that we made in 2016 and thus far in 2017 as we remain focused on fulfilling this mission.
Slide 7: Logo
During 2016, we took the promise of enriching the lives of our customers to new heights as we introduced a new look and feel for First United Bank & Trust. As I stated in my annual shareholders’ letter, we recognize that customers have many options when it comes to choosing their financial service providers. To effectively compete, we must remain relevant to all customers across all demographics, whether they bank in our community offices, through internet banking, or through the use of our mobile banking applications. We are working to deliver the perfect blend of personalized customer service and enhanced technology, making the banking experience for our customers both efficient and welcoming. We may be 117 years old, but we now have a bold new look and a renewed passion for knowing and understanding our customers and providing unique, customized financial solutions.
| 2 |
As we explored our branding options, we held focus groups comprised of our existing customers, prospective customers, associates and shareholders to learn what they believe is important for banking now and in the future. We listened to what they told us and incorporated their suggestions into our refreshing new logo, bright colors and the re-branding of our Bank.
Slide 8: Cannery Branch Picture
In April of 2016, we consolidated two of our locations in Frederick, Maryland into a new location on East Street at the Gateway to Frederick. This office, located in the historic Cannery building, was our first branch to incorporate our new look and functionality. This new branch design facilitates a more comfortable, engaging dialogue between our customers and our associates. It is designed to allow our associates the time, and to provide the equipment and technology, to educate customers on our electronic transactions. But for those traditional customers not yet ready to engage electronically, we are ready and willing to provide the hands-on customer experience they are accustomed to receiving.
| 3 |
The Cannery office is just the beginning. We have plans to update all our offices, customized to the needs of each of our different geographic market areas. Our community office network is an investment and to increase our return on this investment, we must be diligent and thoughtful about the modernization plan. We do recognize that the need for traditional brick and mortar branches has declined, allowing us to consolidate offices and create efficiencies which in turn should provide the financial means for us to renovate, update and expand into more profitable market areas.
We certainly believe the new look is bold, bright and shows the Bank’s ability to evolve with the changing technologies and the changing demographics of our communities. The feedback that we have received from our customers and the investment community has been very positive. The Cannery office has exceeded our growth expectations, giving us every reason to believe that our branding efforts and branch transformations will provide growth opportunities in all markets.
| 4 |
Slide 9: MyBank Story
Besides creating a bright, technology enhanced experience for our customers, the re-branding effort has also re-energized our associates. They are excited and motivated to proactively build relationships that leverage our unique team sales approach and specialist knowledge, offering a broad range of innovative service packages that enable our clients to meet or exceed their personal and business-related financial goals. We have identified those values that are important to us and we are basing our hiring practices, evaluation processes and training sessions on these values. Our associates are curious and caring, taking time to listen and help our customers. They are trustworthy and have a true passion for our community oriented business owners and our communities. To put it simply, we have a renewed passion to provide an uncommon commitment to service and solutions.
| 5 |
Slide 10: Community and Family
This renewed passion extends beyond our offices and into our communities as we are among the first to voluntarily serve non-profit organizations, coach the school and community teams and to further financial education by presenting at community events and teaching classes on investing and financial management. Last year, we provided 650 combined hours of community education outreach, collected 15,500 pounds of food to be donated to local food shelters, donated thousands of water bottles to assist with the West Virginia flood relief, raised over $6,500 for the Morgantown, West Virginia Ronald McDonald House, sponsored our annual golf tournament raising $23,000 for the United Way and donated $200,000 to local hospitals, colleges, fire departments, Hospice, and to Friends Aware, just to name a few. We believe this is what a community bank does – provide personal service and support to our communities. We also recognize that the success of our bank is rooted in family values. For this reason, we held our first annual First United picnic in 2016, welcoming over 700 people including our associates and their families for a day of fun, food, fellowship and games.
| 6 |
Slide 11: Stock Chart
Our strategies, goals and action plans are designed to culminate in an improved total return to you, our shareholders. As we improve and enhance our products and delivery methods, you will benefit from a growing customer base, more profitable accounts and innovative delivery methods resulting in an increase in the value of our Company. I am very pleased to report that our 2016 financial results reflected our commitment to improving shareholder return. Tonya will provide detailed information on how we improved our core income during 2016 and the great start that we have in 2017.
This chart shows that during the past two years, First United Corporation stock has consistently grown at a faster pace than the KBW Nasdaq Bank Index. Our stock price improved from $11.70 at December 31, 2015 to $15.95 at December 30, 2016, a 36% increase. Some of this increase was attributable to the results of the November 8th election as the investment world saw an increased likelihood of higher interest rates, lower corporate tax rates and a less onerous regulatory regime, resulting in higher stock prices for the banking sector. However, the industry saw a decline in prices during the first quarter as investors took a pause, waiting for fundamentals to catch up with increased bank stock valuations. Our stock price followed the market, settling back to the low to mid-$14 range where we are currently trading.
| 7 |
Slide 12: Rights Offering
During this same time period, your Company announced a rights offering to all of its shareholders of record as of November 27, 2016. The offering closed on March 20, 2017. We were very pleased with the successful outcome of the rights offering. The participation of our long-time shareholders, including associates, executives and directors, was remarkable. We received oversubscriptions totaling almost three times the number of offered shares. We exceeded our objective of raising at least $7.0 million and used the net proceeds of $9.2 million to offset our redemption of $10.0 million of our Series A Preferred Stock and repayment of $10.8 million of our junior subordinated debentures. The redemption of the Series A Preferred Stock will reduce future preferred dividend expense by approximately $900,000 per year, and the repayment of the junior subordinated debentures will reduce future interest expense by approximately $1.1 million per year.
| 8 |
From a shareholder perspective, the timing of this stock raise was intentional and well-planned. The result using 2016 actual performance, was an increase of 783,626 shares and a decrease in dividend and interest expense of approximately $2 million. The raise was accretive to future earnings per share by approximately 12.9% and was only slightly dilutive to tangible book value by only 1.6%. As I have previously discussed, changing the mix in our capital structure from the higher cost trust preferred and preferred stock to common equity has brought us one step closer to resuming payment of our dividend. It is our intention to repay the final $10 million of preferred stock from our 2017 earnings and resume payment of our common stock dividend in 2018, provided earnings continue to grow as projected. I will now introduce Tonya Sturm, Senior Vice President and Chief Financial Officer, who will provide additional detail on our financial performance.
| 9 |
TONYA STURM
Slide 13: Tonya Sturm
Thank you, Carissa.
Good Morning!
Slide 14: Deliver Market Return
Last year, we told you that one of our long-term strategies is to deliver a total market return to our shareholders through efficient and effective delivery channels.
Slide 15: Strategic Initiatives
At last year’s meeting, we discussed our strategic initiatives, which are to profitably grow high quality assets and improve our capital ratios while strengthening core earnings and fee income, all of which should provide a higher return to shareholders. Today, I will highlight our 2016 financial performance as well as our performance for the first quarter of 2017, which was released last week. For more details, I encourage you to read the discussion of our financial condition and results of operations in our 2016 Annual Report on Form 10-K and our most recent earnings release for the first quarter of 2017, which are available to all shareholders on our website.
| 10 |
Slide 16: Trend in Total Assets
The balance sheet is most impacted by the first two initiatives of profitably growing high quality assets and improving capital ratios.
Margin and core earnings are strongly influenced by asset growth and the composition of our asset mix. As indicated on this chart, total assets remained stable from 2015 through 2016. As we discussed last year, we used the cash flow from the investment portfolio to fund the loan growth. We continued this focus in 2016 as one of our strategies which, we believe, will help increase the net interest margin by replacing the cash flow from lower earning investments into higher yielding loans.
| 11 |
Slide 17: Balance Sheet- Asset Mix
This next slide shows the composition, or asset mix. As we continue to see, the Bank is predominantly invested in loans. This can be seen in the blue section of this chart. In 2016, we utilized the maturing cash flows from investments to provide funding for higher yielding loans, which reduced the percentage of investments slightly from 2015.
Slide 18: Trend in Loan Balances
We saw moderate loan growth in 2016 in both the mortgage loan and commercial loan portfolios.
Residential mortgage loans, including home equity loans, grew by $4.7 million. Despite the Fed rate increase in December 2015 and fear of additional rate increases throughout 2016, we continued to book mortgage loans in our adjustable rate loan programs. And, for the longer-term, fixed rate loans, we continued to sell to Fannie Mae. Growth in our commercial loan portfolio was $39 million before strategic payoffs of $30 million, resulting in net growth of $9 million. For the first quarter 2017, loan growth was relatively flat compared to December 2016 although both the residential mortgage and commercial production continue to be positive as we move into the second quarter.
| 12 |
Slide 19: Loan Portfolio Composition
The composition of the loan portfolio is made up of residential mortgage and other consumer loans at 47% of total loans, or the dark red and blue sections. The Commercial portfolio, at 53% of total loans, is diversified in commercial real estate, commercial and industrial, and acquisition and development loans, or the gold, red and gray sections in the chart.
| 13 |
Slide 20: Trends in Adversely Classified Assets
The main ratio we monitor with respect to asset quality is the coverage ratio. This ratio compares our exposure to substandard loans, investments, and other real estate owned, or OREO, to our tier one capital plus capital that has been set aside in the allowance for loan losses. It is essentially a measure of the risk that these adversely classified assets pose to our capital and is the red line represented on this chart. As a result of reducing each of the substandard asset classes, we have successfully reduced our adversely classified assets as a percentage of capital from a high of 162% in 2010 to just under 30% as of December 31, 2016. The gold portion of each bar represents substandard loans, the blue represents other real estate owned and the red represents substandard investments in collateralized debt obligations. As of April 1, 2017, all of these investments are pass rated.
| 14 |
Slide 21: Trend in Deposits
Total deposits increased $15.4 million in 2016. For the past couple of years, we have discussed our strategic focus of shifting our mix of deposits from high cost certificates of deposit to lower cost core money market and demand deposit accounts. We continued to see this shift in 2016. On this slide, this shift can be seen as the retail CDs and brokered deposits, or the gold and blue portions of the bars, have decreased from earlier years, and the core retail deposits, or the red portion of the bars, have increased. The result of shifting the deposit mix was a lower cost of funds.
For first quarter 2017, we reported $12.6 million in deposit growth. This growth continued to be in lower cost core accounts.
| 15 |
Slide 22: Capital Ratios
We are pleased to report that all our capital ratios continued to exceed regulatory standards at the end of 2016. Prior to 2015, the levels of capital considered to be “well-capitalized” by the banking regulators are represented by the red lines on this chart. Beginning in 2015, new regulatory guidelines required by BASEL III were implemented. In addition to a new capital measurement – Common Equity Tier 1, represented by the red bars, the banking regulators began using new increased benchmarks, represented by the black lines, that include a capital conservation buffer. As can be seen on this chart, all our capital ratios have consistently exceeded regulatory guidelines, even as we have re-paid portions of our hybrid capital.
Slide 23: Components of Capital
As Carissa mentioned earlier, we continue to be focused on shifting the mix in our capital composition to higher levels of tangible common equity, which is represented by the red portion of this chart. The blue and gray portions identify the qualifying trust preferred debentures and the Series A Preferred Stock.
| 16 |
In March 2017, we used the net proceeds of $9.2 million from the Rights Offering to redeem $10.0 million of Series A Preferred Stock and repay $10.8 million of trust preferred debentures. The effect of these actions was to increase common equity, the red portion, from 56% to 63% and decrease the Series A Preferred Stock, the gray portion, from 10% to 5%, and decrease the qualifying trust preferred debentures included in Tier 2 capital, or dark red portion, from 9% to 6%.
Slide 24: Net Interest Income
Our third initiative is to strengthen core earnings and increase fee income. The largest component with the biggest impact is net interest income which is interest earned on loans and investments less interest paid on deposits and borrowings.
| 17 |
Net interest income is measured by the net interest margin. In 2016, we continued to see improvement in our net interest margin. With one Fed rate increase in December 2015 and the early bookings of loan production in the first quarter of 2016 at slightly higher rates, we recorded higher interest income. We continued to see the shift in deposits from higher cost certificates of deposit to lower cost core accounts and continued our focus on empowerment pricing for the full relationship customer. In December 2015, we restructured some of our higher rate FHLB advances with lower rates which reduced the cost on these long- term borrowings in 2016. These efforts resulted in an increase to the net interest margin to 3.19% at December 31, 2016 compared to 3.04% at December 31, 2015.
As we continued these efforts into 2017, combined with another Fed rate increase, we reported an increase in the net interest margin to 3.27% at March 31, 2017.
| 18 |
We believe we can continue the momentum by focusing our efforts on changing the asset mix to higher earning assets while controlling the cost of deposits through deepening our relationships with our customers.
Slide 25: Providing for Loan Losses
Higher net charge-offs, resulting from the ongoing evaluation of our classified assets, as indicated by the gold bar, drove the higher provision expense in 2016. We believe that our continued recognition of losses in our portfolio, our early identification of problem loans and our solid allowance for loan loss methodology signify the reduced risk in our portfolio and that our capital levels provide sufficient protection for the identified risk and potential risk in our balance sheet.
Slide 27: Other Operating Income
Another core component of our earnings is other operating income, which includes wealth management income and service charge income. Other operating income for 2016 increased when compared to 2015, excluding gains and losses booked on the sale of investments and other real estate owned, and excluding the $11.6 million arbitration award received in the fourth quarter of 2015. In 2016, we experienced increases in our wealth management income, service charge income, and BOLI income.
| 19 |
Slide 28: Wealth Management Income
Our Wealth Management department posted a slight increase in revenues of $6.7 million in 2016. Wealth Management income will continue to be a focus in 2017.
Slide 29: Wealth Management Assets
Revenue in Wealth Management is primarily attributable to assets under management. The growth in market values and successful sales from our Wealth Management sales team increased assets under management to $740 million in Trust and $257 million in Investment Services.
| 20 |
Slide 30: Operating Expense
The final component of our earnings is operating expense. Operating expenses decreased in 2016, due to decreases in salaries and benefits primarily from decreased health care costs, and a decrease in legal expenses. We also saw decreases in FDIC premiums, data processing expenses and other real estate owned expenses. These decreases were partially offset by an increase in other miscellaneous expenses due to increased trust expenses, reserves for litigation claims, miscellaneous loan fees and debit card fraud expenses.
Slide 31: Net Income Available to / Net (Loss) Attributable to Common Shareholders
Consolidated net income available to common shareholders for 2016 was $5.3 million compared to the net income available to common shareholders of $10.3 million in 2015. As discussed last year, 2015’s results were impacted by an $11.6 million recovery from an arbitration settlement received as a result of litigation proceedings relating to the impairment charges taken in prior years on the CDO investments. This settlement was a partial recovery of $14.4 million of losses recorded in 2010.
| 21 |
Last week, your Company announced earnings of $1.4 million for the quarter ended March 31, 2017, which resulted from maintaining net interest income, increased other operating income and reductions in operating expenses. For more details on the first quarter of 2017 results, I encourage you to read the Quarterly Report on Form 10-Q which is posted on our website.
At this time, I will turn the remainder of the presentation over to Carissa.
Thank you!
| 22 |
CARISSA RODEHEAVER
Slide 32: Carissa Rodeheaver
Thank you, Tonya!
Slide 33: 2017 Initiatives
As you have seen, 2016 was a pivotal year as your Bank transitioned our balance sheet to include higher yielding loans, lower cost capital and continued to improve core earnings. In 2017, we will continue to build on this foundation, proactively building relationships, growing our low-cost core deposits, producing high quality loans and growing our earnings through increased net interest margin and a focus on improved fee income through our wealth management and treasury management services. We will also continue to manage our expenses, even as we enhance our community office network, promote our new brand and expand into growth markets. Our goal is to enhance shareholder return by proactively building relationships that leverage our unique team sales approach and specialist knowledge, offering a broad range of innovative service packages that enable our clients to meet or exceed their personal and business-related financial goals.
| 23 |
Slide 34: My Bank is First United
As we conclude our meeting today, I would like to publicly thank your Board of Directors, your management team and every associate at First United Bank & Trust for their commitment to both the Bank and to the communities that we serve. I continue to believe that it is the people who make the difference in community banking. After all, our passion for helping people achieve their financial goals is why we come to work every day. We want all our customers to say, “My bank is First United!” My helpful, trusted partner for life.
Slide 35: Commercial #2
Slide 36: Thank You
Thank you for your attendance today and your confidence in First United Corporation!
| 24 |

Beginning Montage (Video)

First Commercial (Video)

First United Corporation Annual Shareholders’ Meeting May 18, 2017

Carissa Rodeheaver 4 Chief Executive Officer and Chairman of the Board

Forward - Looking Statements 5 Forward - looking statements in this presentation relating to First United Corporation’s plans, strategies, objectives, expectations, intentions and adequacy of resources, are made pursuant to the safe harbor provisions of the Private Securities Litigation Reform Act of 1995. The information contained herein should be read in conjunction with First United Corporation’s 2016 Annual Report on Form 10 - K filed with the Securities and Exchange Commission (“SEC”), which is available on the SEC’s website www.sec.gov or at First United Corporation’s website www.mybank.com . Investors are cautioned that forward - looking statements, which are not historical fact, involve risks and uncertainties, including those detailed in First United Corporation’s 2016 Annual Report on Form 10 - K filed with the SEC under the section, ‘Risk Factors’ in Part 1, Item 1A. Such statements are subject to important factors that could cause actual results to differ materially from those contemplated by such statements. First United Corporation does not assume any duty to update any forward - looking statements.

Our Mission 6 To enrich the lives of our associates, customers, communities, and shareholders through uncommon service and effective financial solutions.

Relevant Personalized Efficient 7

8

9 Team Innovative Curious Trustworthy Caring

10 6,500 Dollars raised for the charity Ronald McDonald House0 15,500 Pounds of food donated to the MBA Embrace Life, Nurture Success Food Drive 200,000 Dollars in contributions to our local communities 650 Combined hours of community education outreach 650 Combined hours of community education outreach 9,600 Cases of water donated to West Virginia flood relief 6,500 Dollars raised for the charity Ronald McDonald House 23,000 Dollars raised for United Way through Annual First United Golf Tournament 9,600 Cases of water donated to West Virginia flood relief 15,500 Pounds of food donated to the MBA Embrace Life, Nurture Success Food Drive 23,000 Dollars raised for United Way through Annual First United Golf Tournament

11 This image cannot currently be displayed.

Stock Price % Change: FUNC vs. KBW Nasdaq Bank Index 12 $11.70 at 12/31/15 $15.95 at 12/31/16 $14.26 at 5/11/17
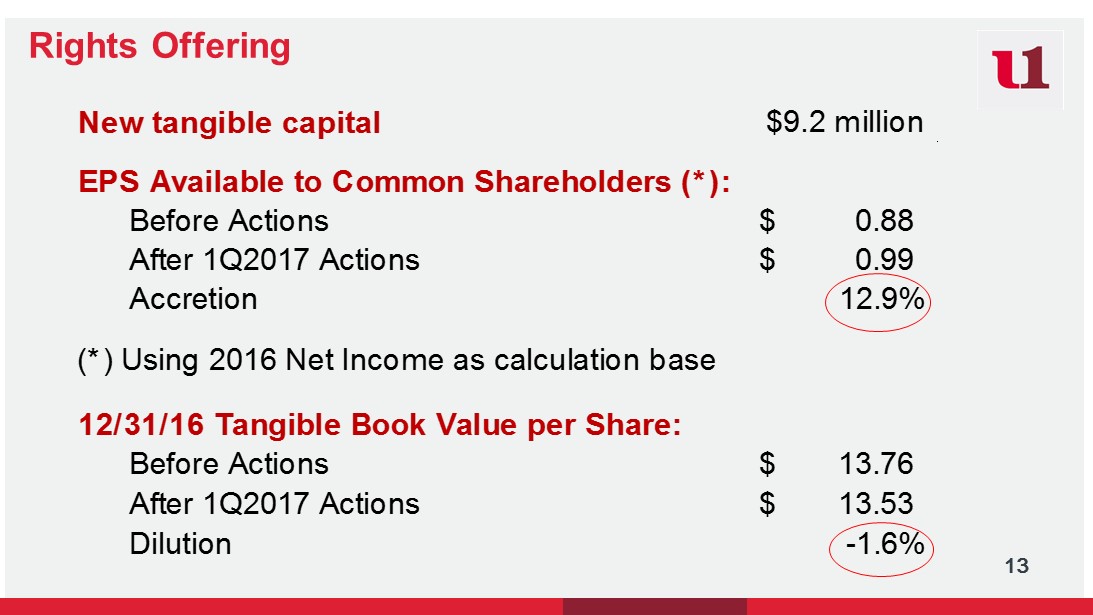
Rights Offering 13 New tangible capital $9.2 million 12/31/16 Tangible Book Value per Share: Before Actions 13.76$ After 1Q2017 Actions 13.53$ Dilution -1.6% EPS Available to Common Shareholders (*): Before Actions 0.88$ After 1Q2017 Actions 0.99$ Accretion 12.9% (*) Using 2016 Net Income as calculation base

Tonya Sturm 14 Senior Vice President and Chief Financial Officer

Deliver a total market return to shareholders through efficient and effective delivery channels 15

2016 Initiative Review 16 Profitably grow high quality assets Improve capital ratios Strengthen core earnings and increase fee income Higher return to Shareholders

17 Trend in Total Assets $300 $500 $700 $900 $1,100 $1,300 $1,500 2012 2013 2014 2015 2016 $1,321 $1,334 $1,332 $1,323 $1,318 Millions

18 Balance Sheet – Asset Mix 5% 18% 67% 10% Cash and cash equivalents Investment securities and FHLB stock Loans Other assets December 2016

19 Trend in Net Loan Balances $300 $400 $500 $600 $700 $800 $900 $1,000 $1,100 2012 2013 2014 2015 2016 $859 $797 $828 $867 $882 Millions

20 Loan Portfolio Composition 33% 12% 8% 44% 3% Commercial Real Estate Acquisition and Development Commercial and Industrial Residential Mortgage Consumer Installment December 2016

21 Trends in Adversely Classified Assets 0% 20% 40% 60% 80% 100% 120% 140% 160% 180% $0 $50 $100 $150 $200 $250 $300 2010 2012 2014 2016 Adversely Classified Assets (millions) Adv Classified Loans Other Real Estate Owned Adv Classified CDOs Corp Coverage Ratio

Trend in Deposits 22 $0 $200 $400 $600 $800 $1,000 $1,200 2012 2013 2014 2015 2016 Millions Core Retail CDs Brokered $977 $977 $981 $999 $1,014
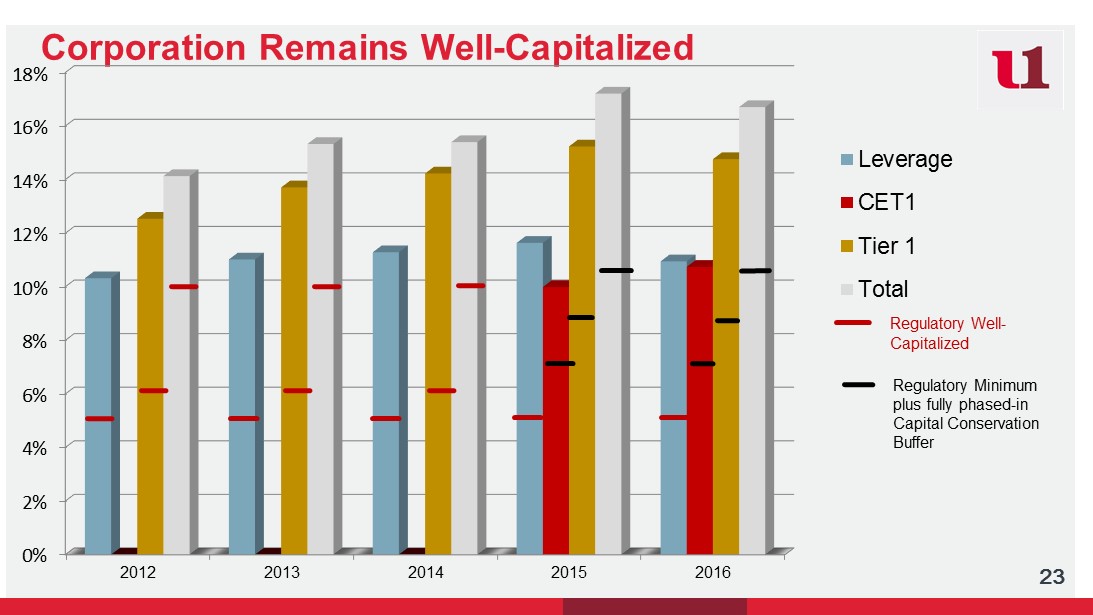
Corporation Remains Well - Capitalized 23 0% 2% 4% 6% 8% 10% 12% 14% 16% 18% 2012 2013 2014 2015 2016 Leverage CET1 Tier 1 Total Regulatory Well - Capitalized Regulatory Minimum plus fully phased - in Capital Conservation Buffer

Components of Capital 24 56% 15% 10% (9)% 9% Tier 1: Common Equity, before AOCI Tier 1: Qualifying TRUPs Tier 1: Series A Preferred Stock Tier 1 Reductions: Goodwill, Disallowed Deferred Tax Asset Tier 2: Qualifying ALL, excess TRUPs December 2016 March 2017 63% 15% 5% (9)% 6%

Net Interest Income 25 $39.1 $38.2 $35.5 $35.6 $37.6 3.30% 3.25% 3.00% 3.04% 3.19% 2.9% 2.9% 3.0% 3.0% 3.1% 3.1% 3.2% 3.2% 3.3% 3.3% 3.4% $0 $10 $20 $30 $40 $50 2012 2013 2014 2015 2016 Net Interest Income (millions) Net Interest Income Net Interest Margin

Providing for Loan Losses 26 $0 $2 $4 $6 $8 $10 $12 $14 $16 $18 2011 2012 2013 2014 2015 2016 Millions Provision Net Charge-offs Allowance for Loan Losses

Other Operating Income* 27 $8 $10 $12 $14 2012 2013 2014 2015 2016 $13.7 $13.1 $12.9 $13.4 $14.1 Millions * Excluding gains/(losses), securities impairment, arbitration recovery

Wealth Management Revenue 28 $0.0 $1.0 $2.0 $3.0 $4.0 $5.0 $6.0 $7.0 2012 2013 2014 2015 2016 $5.4 $5.8 $6.1 $6.5 $6.7 Millions

Wealth Management Assets Under Management 29 $0 $100 $200 $300 $400 $500 $600 $700 $800 2012 2013 2014 2015 2016 $637 $675 $702 $718 $740 $215 $234 $237 $240 $257 Millions Trust Assets Investment Assets
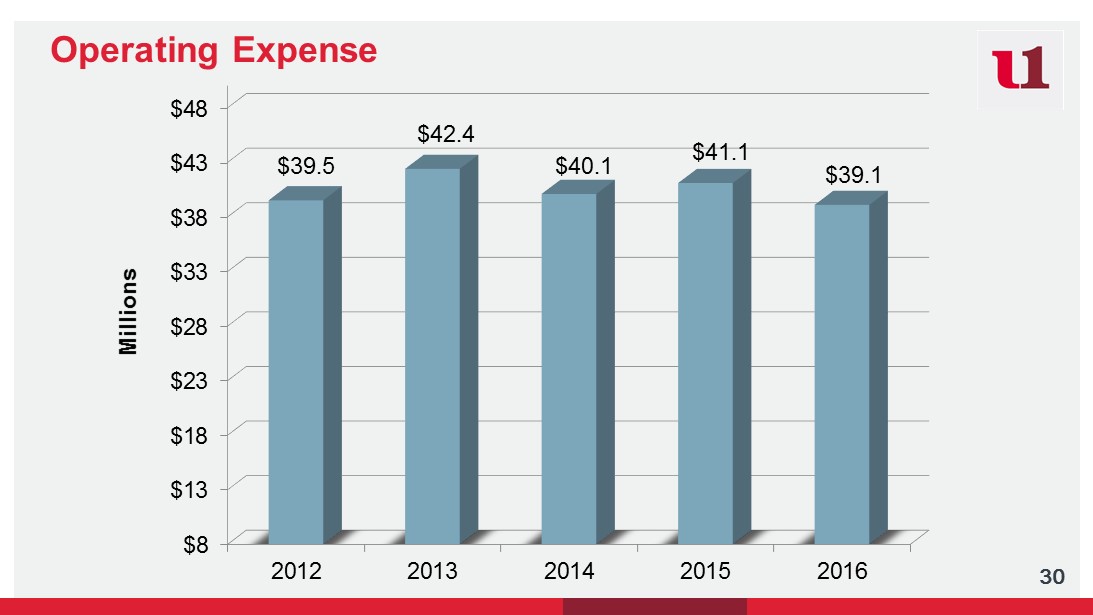
Operating Expense 30 $8 $13 $18 $23 $28 $33 $38 $43 $48 2012 2013 2014 2015 2016 $39.5 $42.4 $40.1 $41.1 $39.1 Millions

Net Income Available to / Net (Loss) Attributable to Common Shareholders 31 -$15 -$10 -$5 $0 $5 $10 $15 2010 2011 2012 2013 2014 2015 2016 - $11.8 $2.0 $3.0 $4.7 $3.0 $10.3 $5.3 Millions

Carissa Rodeheaver 32 Chief Executive Officer and Chairman of the Board
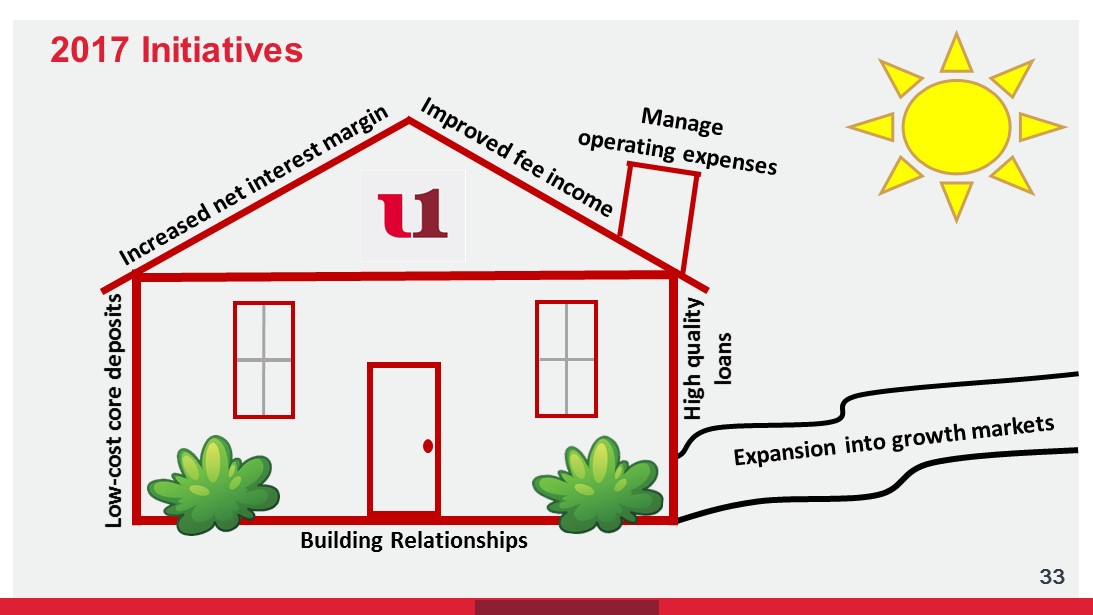
2017 Initiatives 33 Building Relationships Low - cost core deposits High quality loans

“My bank is First United!” 34

Second Commercial (Video)

Thank You! 36