Attached files
| file | filename |
|---|---|
| 8-K - 8-K - LAKE SHORE BANCORP, INC. | lsbk-20170517x8k.htm |
 Annual Shareholders’ Meeting May 17, 2017 Annual Shareholders’ Meeting May 17, 2017
 .Call to Order - Gary W. Winger, Chairman .Introduction of Officers, Directors and Director Nominees .Secretary’s Report .Presentation of Proposals .Executive Management Report to Shareholders .Vote Report .Adjournment 2 Agenda
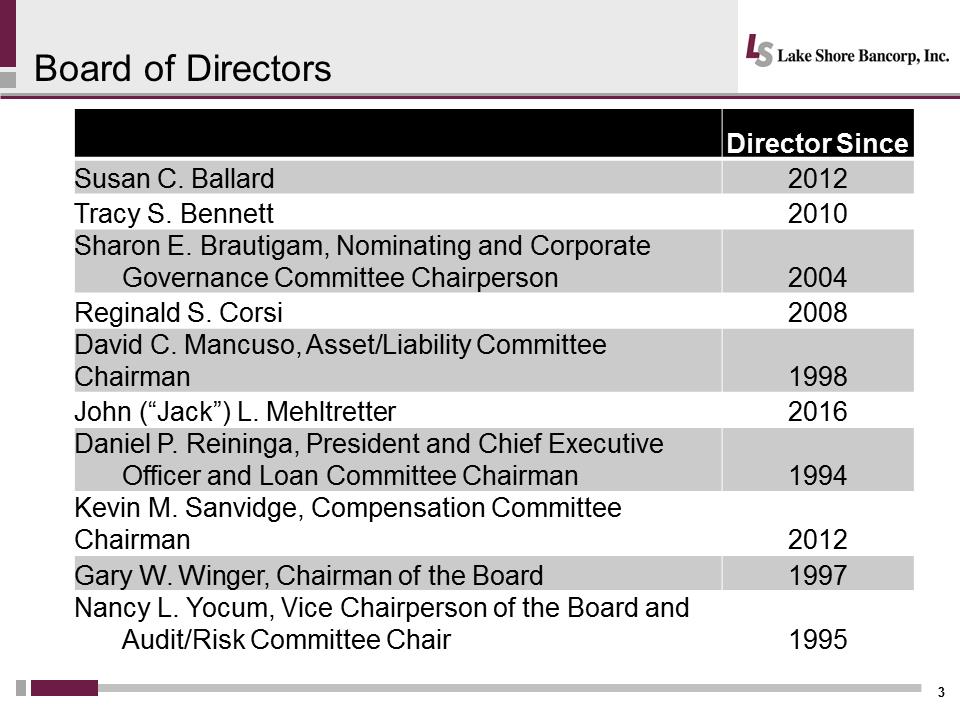 irector Since Susan C. Ballard 2012 Tracy S. Bennett 2010 Sharon E. Brautigam, Nominating and Corporate Governance Committee Chairperson 2004 Reginald S. Corsi 2008 David C. Mancuso, Asset/Liability Committee Chairman 1998 John (“Jack”) L. Mehltretter 2016 Daniel P. Reininga, President and Chief Executive Officer and Loan Committee Chairman 1994 Kevin M. Sanvidge, Compensation Committee Chairman 2012 Gary W. Winger, Chairman of the Board 1997 Nancy L. Yocum, Vice Chairperson of the Board and Audit/Risk Committee Chair 1995 3 Board of Directors
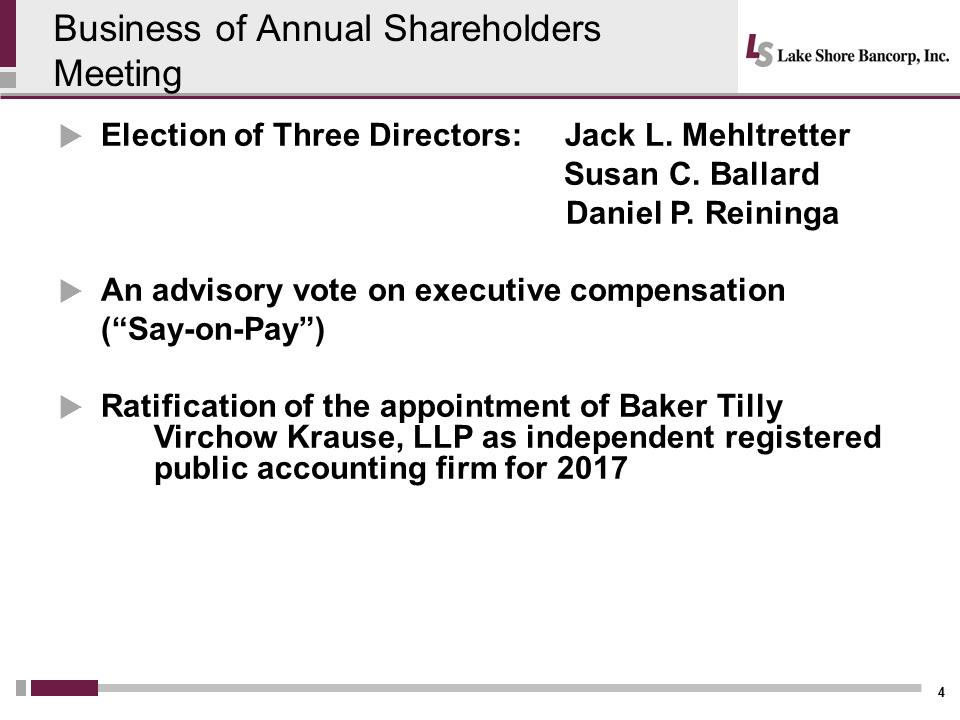 Business of Annual Shareholders Meeting .Election of Three Directors: Jack L. Mehltretter Susan C. Ballard Daniel P. Reininga .An advisory vote on executive compensation (“Say-on-Pay”) .Ratification of the appointment of Baker Tilly Virchow Krause, LLP as independent registered public accounting firm for 2017 4
 Daniel P. Reininga, President and Chief Executive Officer 5 Executive Management Presentation
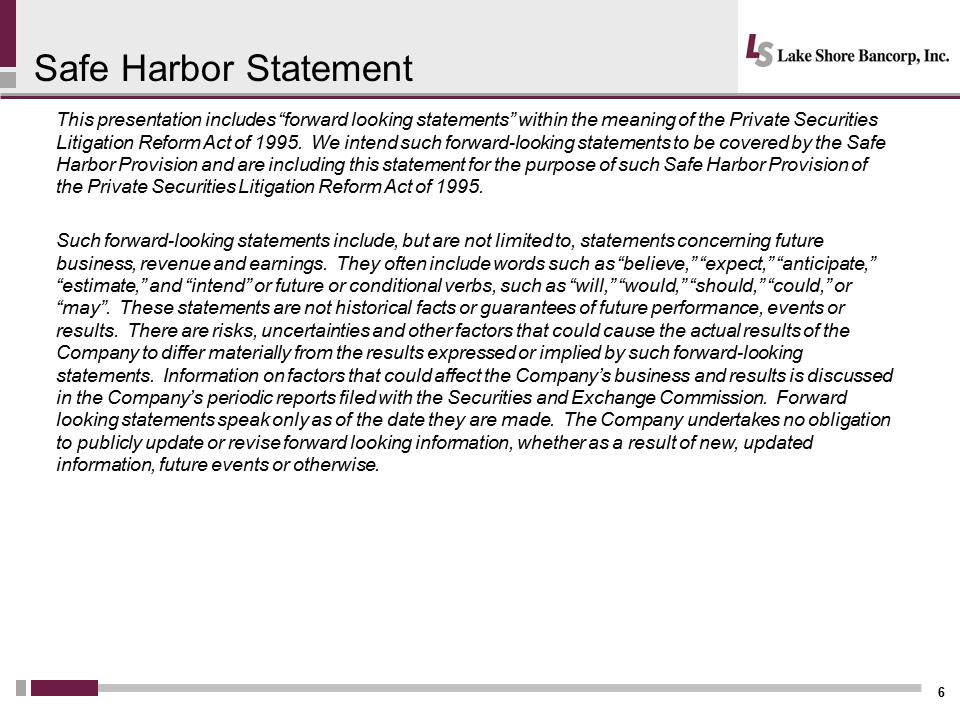 Safe Harbor Statement This presentation includes “forward looking statements” within the meaning of the Private Securities Litigation Reform Act of 1995. We intend such forward-looking statements to be covered by the Safe Harbor Provision and are including this statement for the purpose of such Safe Harbor Provision of the Private Securities Litigation Reform Act of 1995. Such forward-looking statements include, but are not limited to, statements concerning future business, revenue and earnings. They often include words such as “believe,” “expect,” “anticipate,” “estimate,” and “intend” or future or conditional verbs, such as “will,” “would,” “should,” “could,” or “may”. These statements are not historical facts or guarantees of future performance, events or results. There are risks, uncertainties and other factors that could cause the actual results of the Company to differ materially from the results expressed or implied by such forward-looking statements. Information on factors that could affect the Company’s business and results is discussed in the Company’s periodic reports filed with the Securities and Exchange Commission. Forward looking statements speak only as of the date they are made. The Company undertakes no obligation to publicly update or revise forward looking information, whether as a result of new, updated information, future events or otherwise.
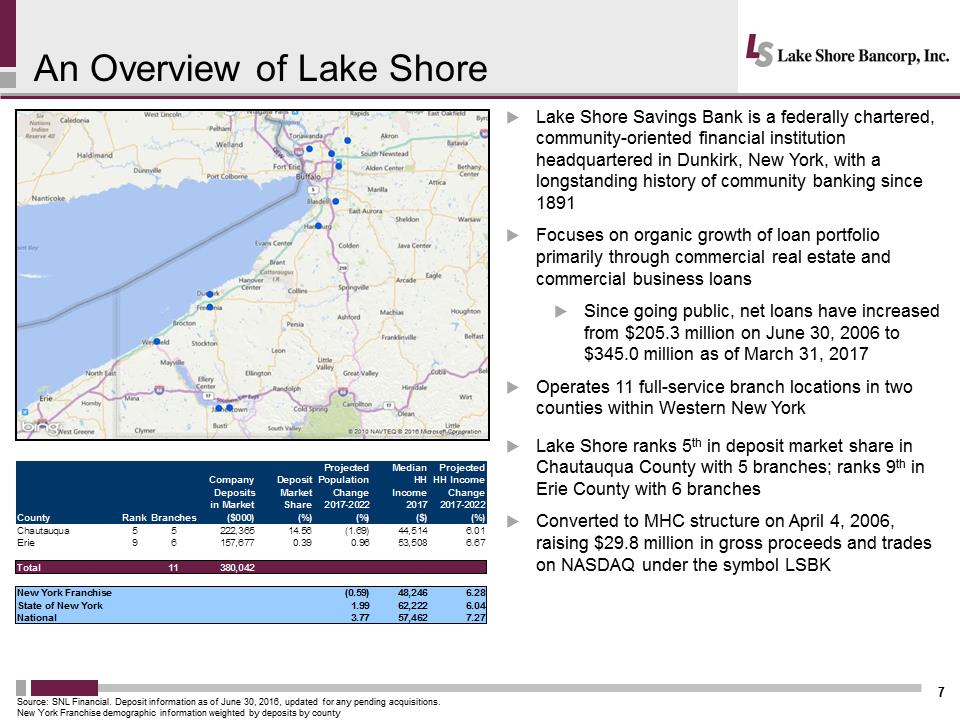 An Overview of Lake Shore 7 .Lake Shore Savings Bank is a federally chartered, community-oriented financial institution headquartered in Dunkirk, New York, with a longstanding history of community banking since 1891 .Focuses on organic growth of loan portfolio primarily through commercial real estate and commercial business loans .Since going public, net loans have increased from $205.3 million on June 30, 2006 to $345.0 million as of March 31, 2017 .Operates 11 full-service branch locations in two counties within Western New York .Lake Shore ranks 5th in deposit market share in Chautauqua County with 5 branches; ranks 9th in Erie County with 6 branches .Converted to MHC structure on April 4, 2006, raising $29.8 million in gross proceeds and trades on NASDAQ under the symbol LSBK Source: SNL Financial. Deposit information as of June 30, 2016, updated for any pending acquisitions. New York Franchise demographic information weighted by deposits by county http://www.oritani.com/images/map_locations.gif http://www.oritani.com/images/map_locations.gif CountyRankBranchesCompanyDepositsin Market($000) DepositMarketShare(%) ProjectedPopulationChange2017-2022(%) MedianHHIncome2017($) ProjectedHH IncomeChange2017-2022(%) Chautauqua55222,36514.56(1.69)44,5146.01Erie96157,6770.390.9653,5086.67Total11380,042New York Franchise(0.59)48,2466.28State of New York1.9962,2226.04National3.7757,4627.27https://maps.snl.com/arcgisoutput/Utilities/PrintingTools_GPServer/_ags_5648a30321784a39a89ed894a10948f2.jpg
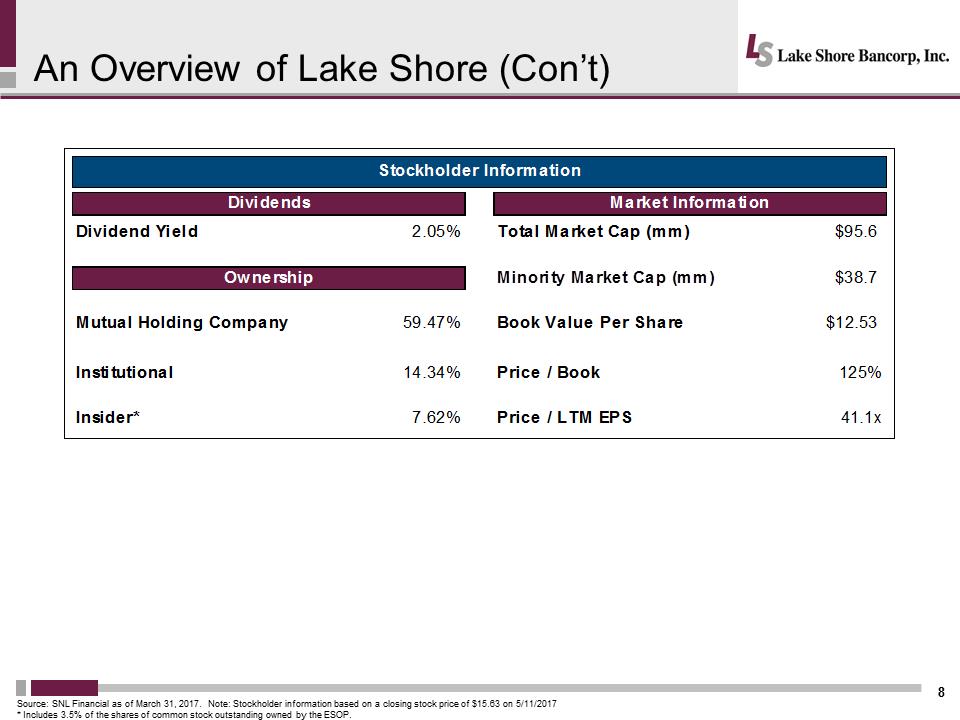 An Overview of Lake Shore (Con’t) 8 Source: SNL Financial as of March 31, 2017. Note: Stockholder information based on a closing stock price of $15.63 on 5/11/2017 * Includes 3.5% of the shares of common stock outstanding owned by the ESOP. Stockholder InformationDividendsMarket InformationDividend Yield2.05%Total Market Cap (mm)$95.6OwnershipMinority Market Cap (mm)$38.7Mutual Holding Company59.47%Book Value Per Share$12.53Institutional14.34%Price / Book125% Insider*7.62%Price / LTM EPS41.1x
 HERE THEN. TODAY. TOMORROW. 9 Celebrated 125 Years of Service in 2016 125 Years
 HERE THEN STRENGTH – CHARACTER – VALUES HERE TODAY EXPERIENCE – COMMITMENT – FOCUS HERE TOMORROW GROWTH – TECHNOLOGY – INNOVATION 10 Preparing for the Next 125 Years
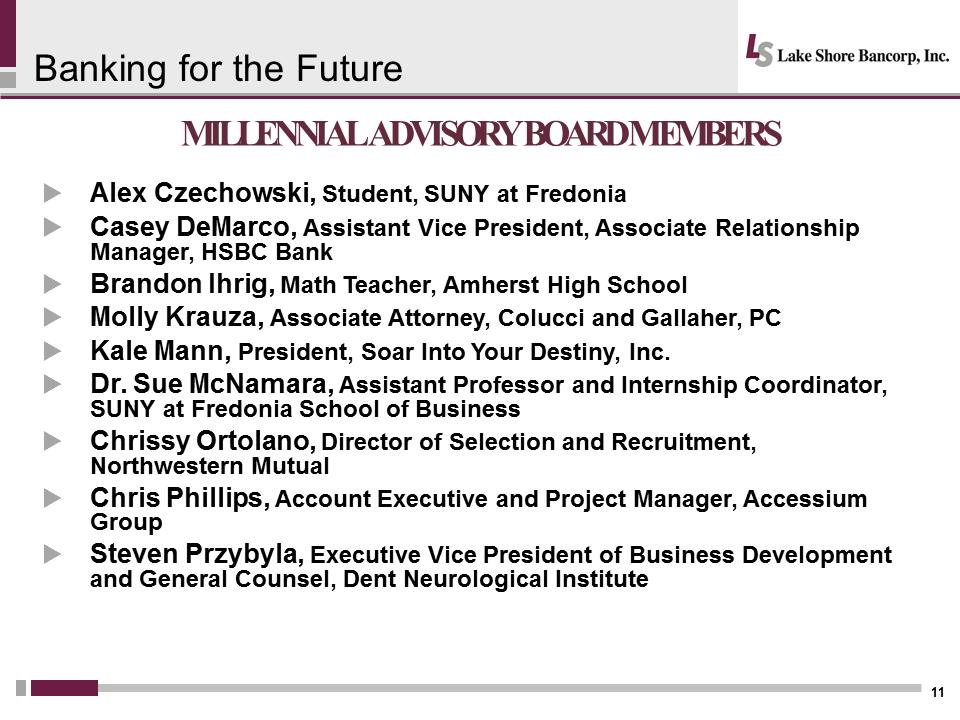 MILLENNIAL ADVISORY BOARD MEMBERS .Alex Czechowski, Student, SUNY at Fredonia .Casey DeMarco, Assistant Vice President, Associate Relationship Manager, HSBC Bank .Brandon Ihrig, Math Teacher, Amherst High School .Molly Krauza, Associate Attorney, Colucci and Gallaher, PC .Kale Mann, President, Soar Into Your Destiny, Inc. .Dr. Sue McNamara, Assistant Professor and Internship Coordinator, SUNY at Fredonia School of Business .Chrissy Ortolano, Director of Selection and Recruitment, Northwestern Mutual .Chris Phillips, Account Executive and Project Manager, Accessium Group .Steven Przybyla, Executive Vice President of Business Development and General Counsel, Dent Neurological Institute 11 Banking for the Future
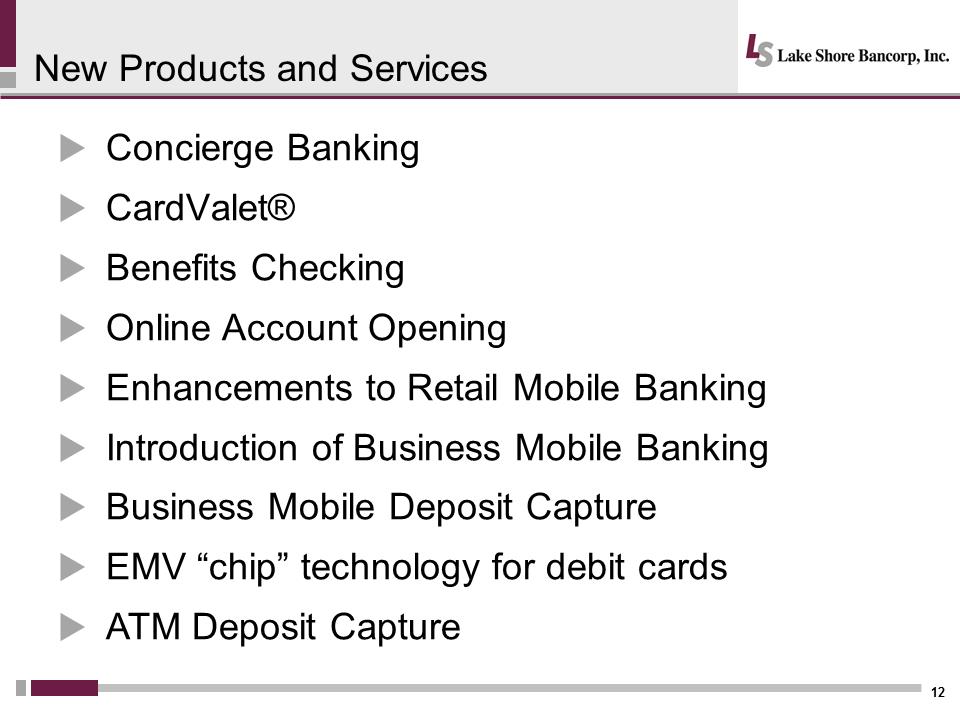 .Concierge Banking .CardValet® .Benefits Checking .Online Account Opening .Enhancements to Retail Mobile Banking .Introduction of Business Mobile Banking .Business Mobile Deposit Capture .EMV “chip” technology for debit cards .ATM Deposit Capture 12 New Products and Services
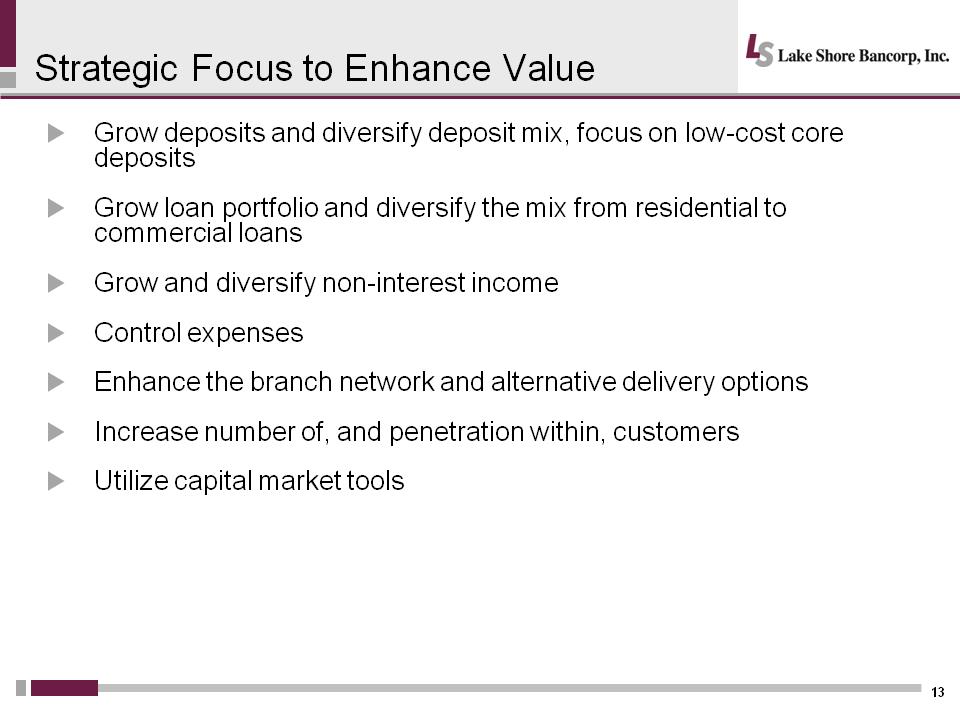 13 .Grow deposits and diversify deposit mix, focus on low- cost core deposits .Grow loan portfolio and diversify the mix from residential to commercial loans .Grow and diversify non-interest income .Control expenses .Enhance the branch network and alternative delivery options .Increase number of, and penetration within, customers .Utilize capital market tools Strategic Focus to Enhance Value
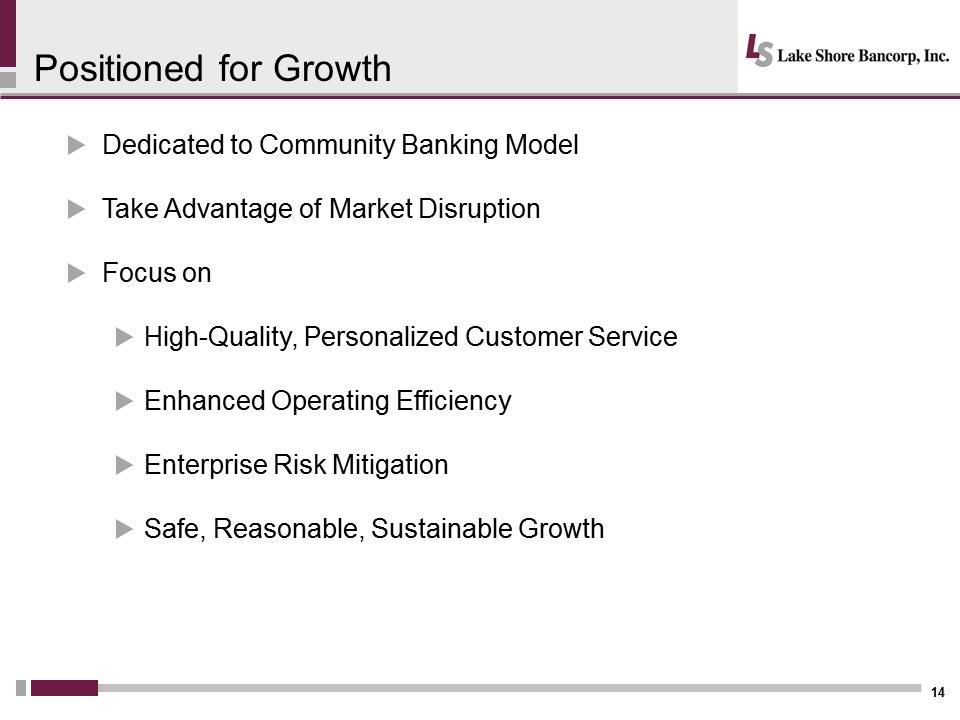 .Dedicated to Community Banking Model .Take Advantage of Market Disruption .Focus on .High-Quality, Personalized Customer Service .Enhanced Operating Efficiency .Enterprise Risk Mitigation .Safe, Reasonable, Sustainable Growth 14 Positioned for Growth
 After 125 years in business, we continue to be a local bank that cares about its customers and communities. At Lake Shore Savings, that has always meant “Putting People First”. We will continue to put our customers, communities and shareholders “First” during the next 125 years, as we adopt new technology, products and services to meet the future needs of our customers. 15 Summary
 Rachel A. Foley, Chief Financial Officer and Treasurer 16 Financial Highlights
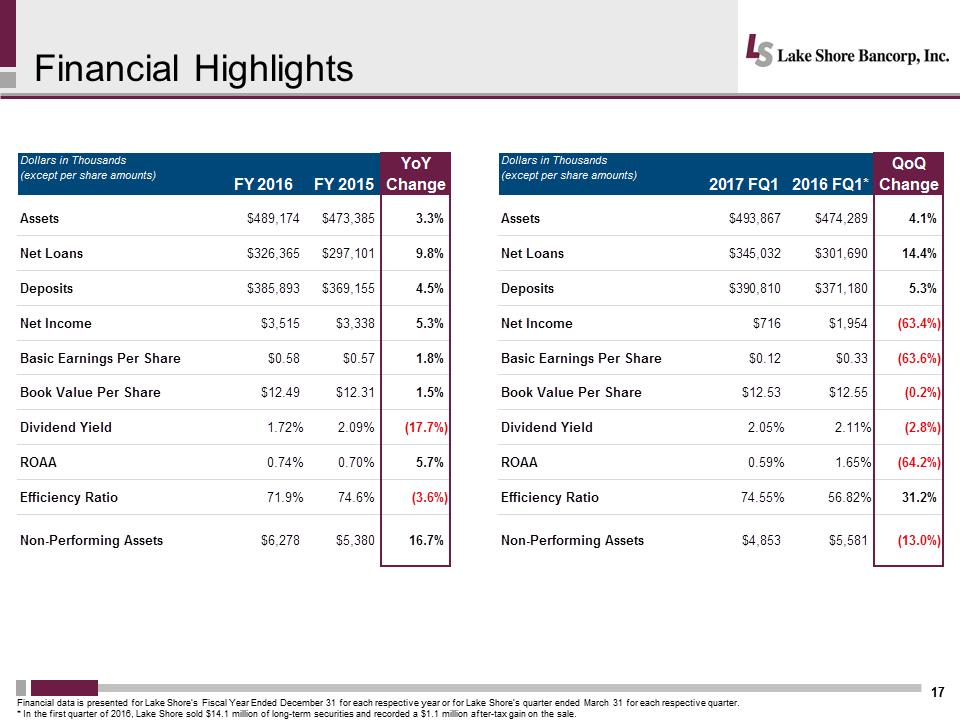 Financial Highlights 17 Financial data is presented for Lake Shore’s Fiscal Year Ended December 31 for each respective year or for Lake Shore’s quarter ended March 31 for each respective quarter. * In the first quarter of 2016, Lake Shore sold $14.1 million of long-term securities and recorded a $1.1 million after-tax gain on the sale. Dollars in Thousands(except per share amounts) FY 2016FY 2015YoY ChangeAssets$489,174$473,3853.3% Net Loans$326,365$297,1019.8% Deposits$385,893$369,1554.5% Net Income$3,515$3,3385.3% Basic Earnings Per Share $0.58$0.571.8% Book Value Per Share$12.49$12.311.5% Dividend Yield1.72%2.09%(17.7%) ROAA0.74%0.70%5.7% Efficiency Ratio71.9%74.6%(3.6%) Non-Performing Assets$6,278$5,38016.7% Dollars in Thousands(except per share amounts) 2017 FQ12016 FQ1* QoQ ChangeAssets$493,867$474,2894.1% Net Loans$345,032$301,69014.4% Deposits$390,810$371,1805.3% Net Income$716$1,954(63.4%) Basic Earnings Per Share $0.12$0.33(63.6%) Book Value Per Share$12.53$12.55(0.2%) Dividend Yield2.05%2.11%(2.8%) ROAA0.59%1.65%(64.2%) Efficiency Ratio74.55%56.82%31.2% Non-Performing Assets$4,853$5,581(13.0%)
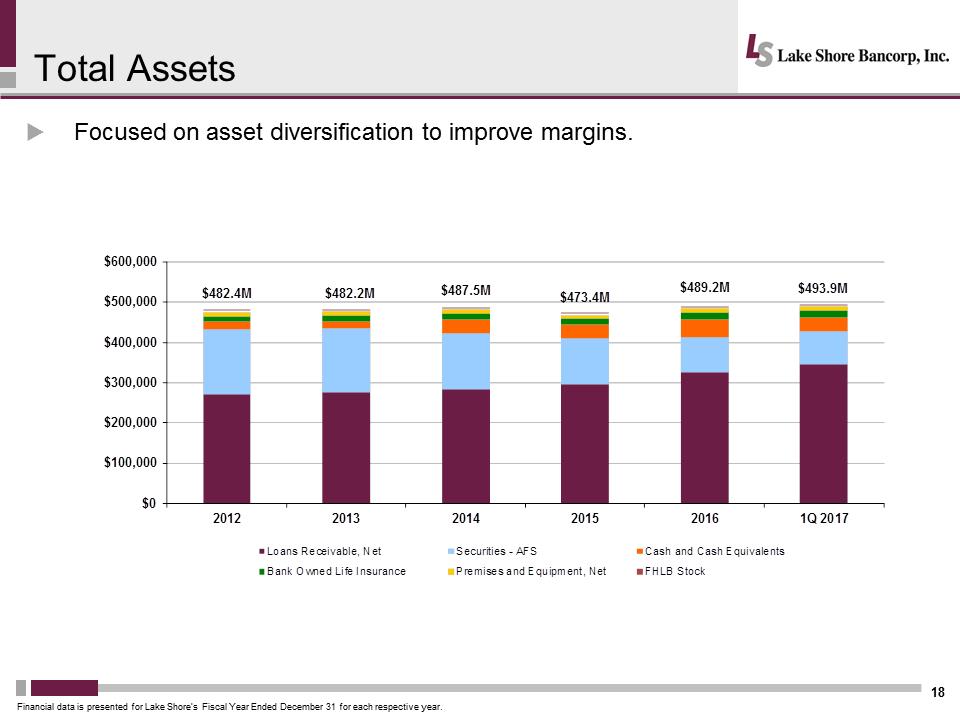 Total Assets 18 .Focused on asset diversification to improve margins. Financial data is presented for Lake Shore’s Fiscal Year Ended December 31 for each respective year. $482.4M$482.2M$487.5M$473.4M$489.2M$493.9M$0$100,000$200,000$300,000$400,000$500,000$600,000201220132014201520161Q 2017Loans Receivable, NetSecurities - AFSCash and Cash EquivalentsBank Owned Life InsurancePremises and Equipment, NetFHLB Stock
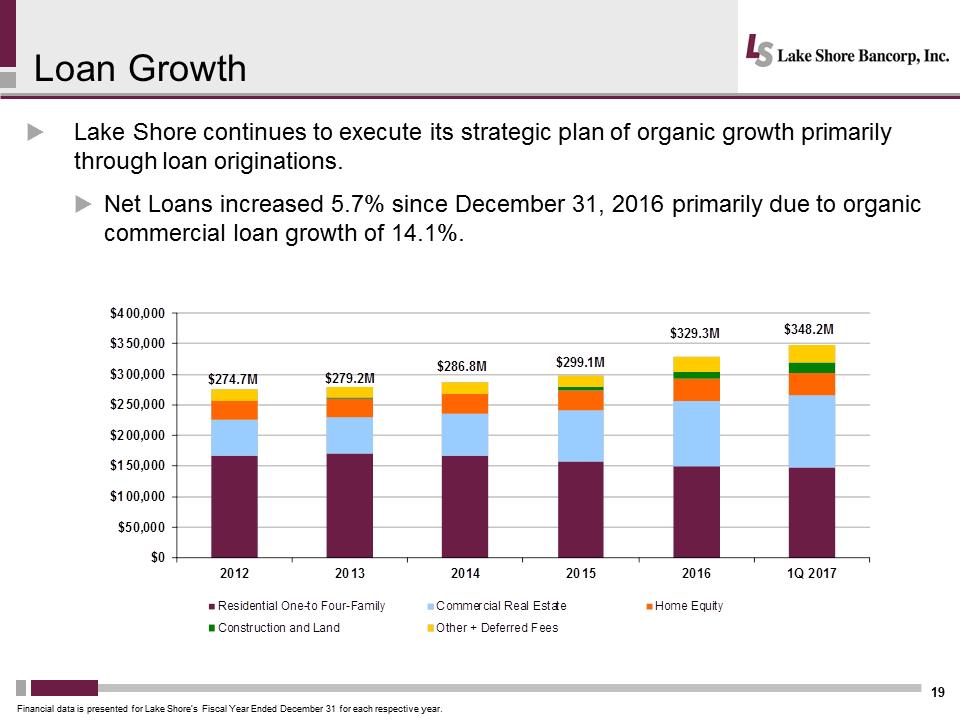 Loan Growth 19 .Lake Shore continues to execute its strategic plan of organic growth primarily through loan originations. .Net Loans increased 5.7% since December 31, 2016 primarily due to organic commercial loan growth of 14.1%. Financial data is presented for Lake Shore’s Fiscal Year Ended December 31 for each respective year. $274.7M$279.2M$286.8M$299.1M$329.3M$348.2M$0$50,000$100,000$150,000$200,000$250,000$300,000$350,000$400,000201220132014201520161Q 2017Residential One-to Four-FamilyCommercial Real EstateHome EquityConstruction and LandOther + Deferred Fees
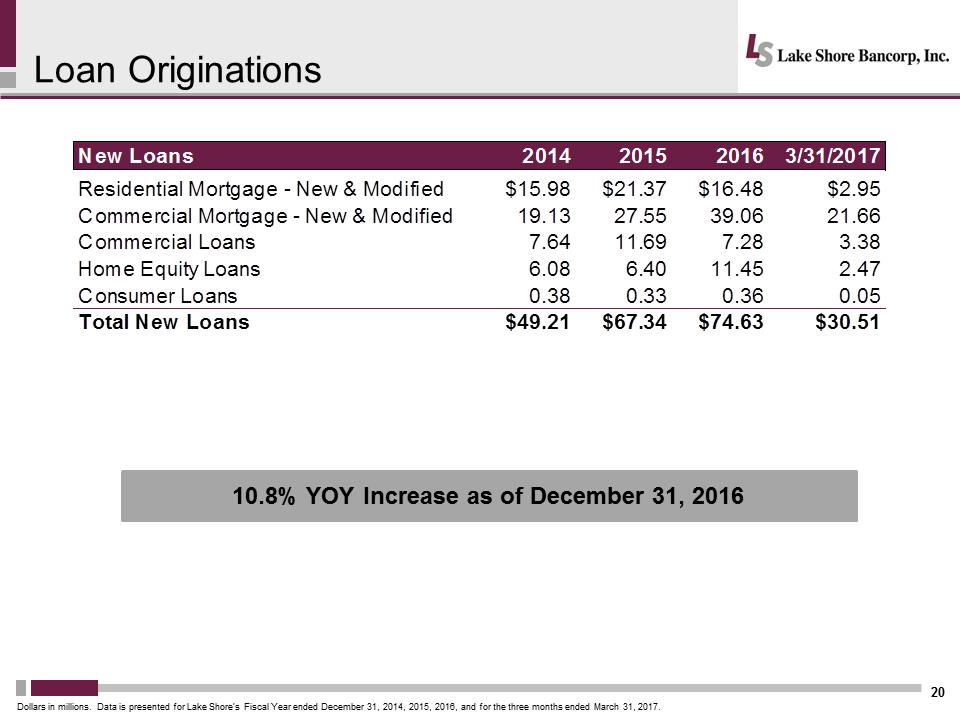 Loan Originations 20 10.8% YOY Increase as of December 31, 2016 Dollars in millions. Data is presented for Lake Shore’s Fiscal Year ended December 31, 2014, 2015, 2016, and for the three months ended March 31, 2017. New Loans2014201520163/31/2017Residential Mortgage - New & Modified$15.98$21.37$16.48$2.95Commercial Mortgage - New & Modified19.1327.5539.0621.66Commercial Loans7.6411.697.283.38Home Equity Loans6.086.4011.452.47Consumer Loans0.380.330.360.05Total New Loans$49.21$67.34$74.63$30.51
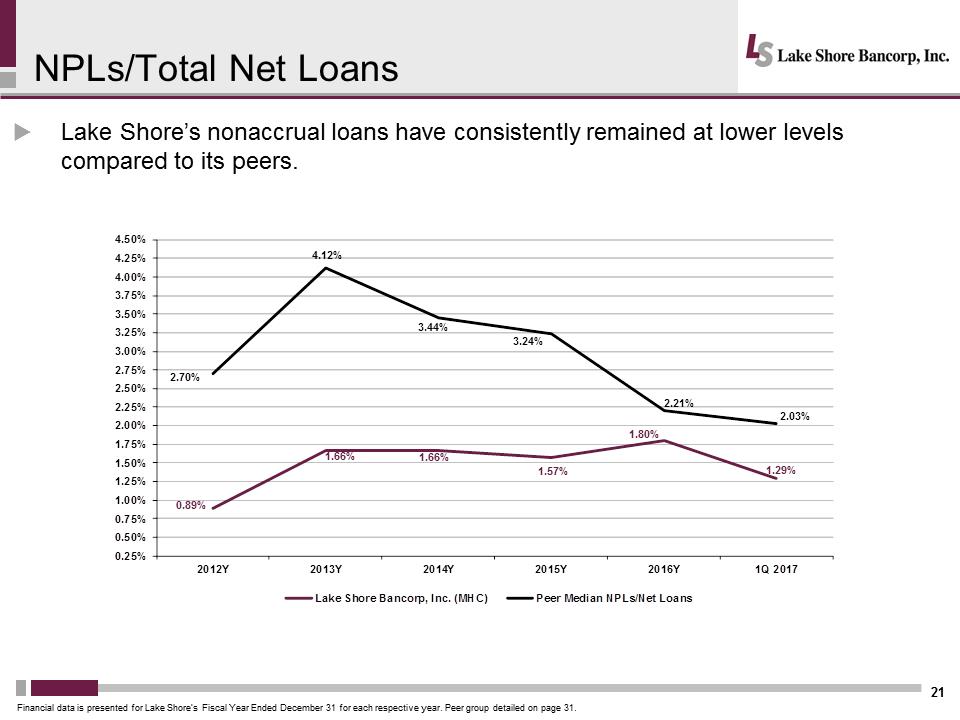 NPLs/Total Net Loans 21 .Lake Shore’s nonaccrual loans have consistently remained at lower levels compared to its peers. Financial data is presented for Lake Shore’s Fiscal Year Ended December 31 for each respective year. Peer group detailed on page 31. 0.89% 1.66%1.66% 1.57% 1.80% 1.29% 2.70% 4.12% 3.44% 3.24% 2.21% 2.03% 0.25% 0.50% 0.75% 1.00% 1.25% 1.50% 1.75% 2.00% 2.25% 2.50% 2.75% 3.00% 3.25% 3.50% 3.75% 4.00% 4.25% 4.50% 2012Y2013Y2014Y2015Y2016Y1Q 2017Lake Shore Bancorp, Inc. (MHC)Peer Median NPLs/Net Loans
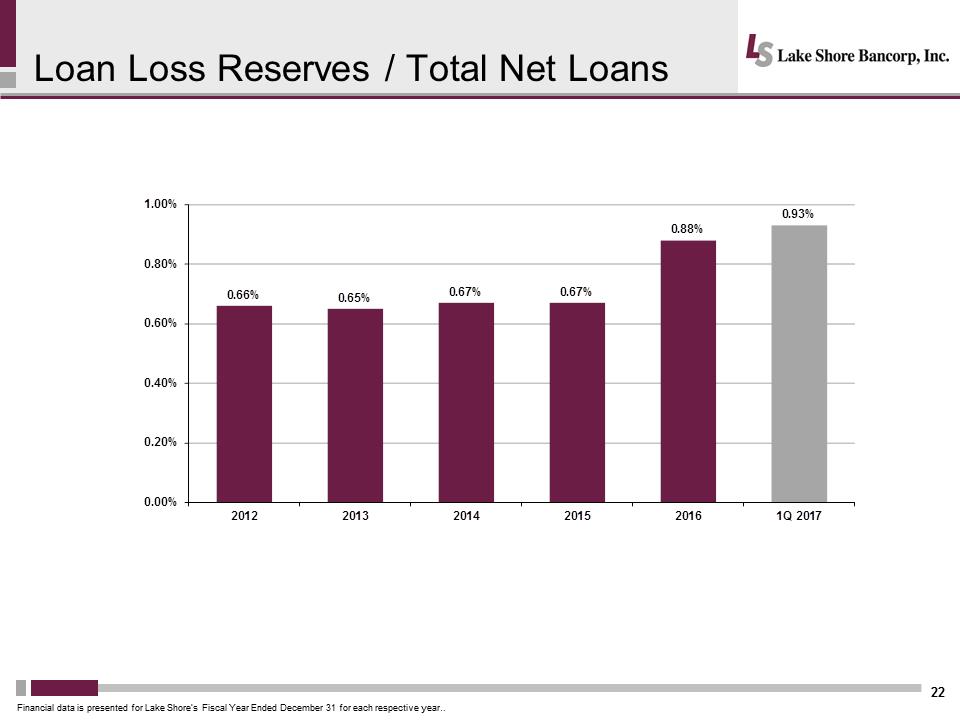 Loan Loss Reserves / Total Net Loans 22 Financial data is presented for Lake Shore’s Fiscal Year Ended December 31 for each respective year.. 0.66%0.65% 0.67%0.67% 0.88% 0.93% 0.00% 0.20% 0.40% 0.60% 0.80% 1.00% 201220132014201520161Q 2017Continued Focus on Deposit Growth
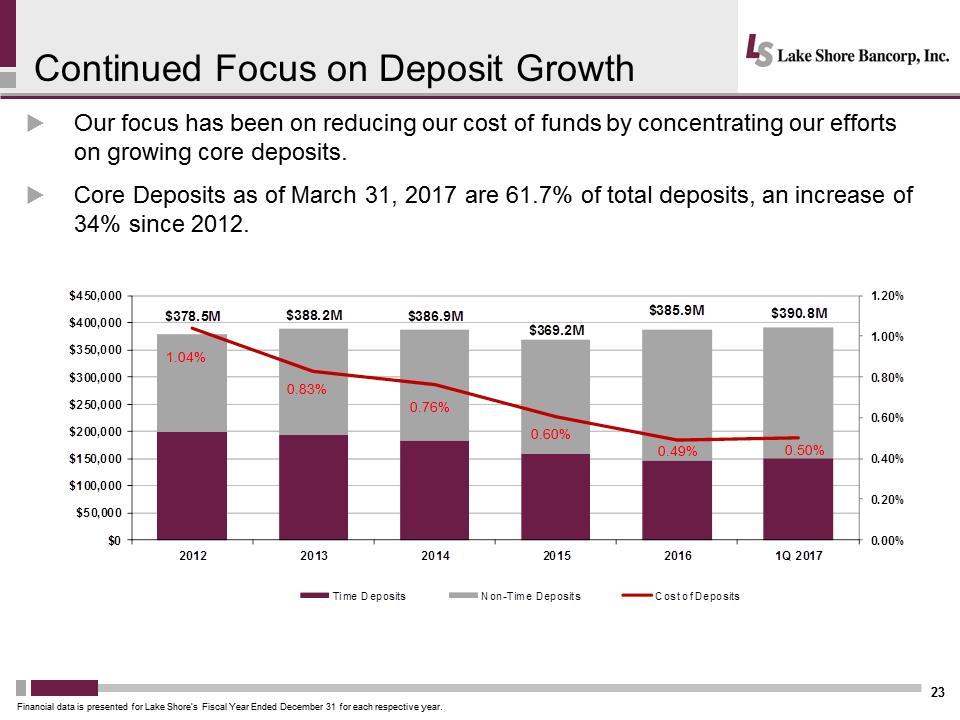 23 .Our focus has been on reducing our cost of funds by concentrating our efforts on growing core deposits. .Core Deposits as of March 31, 2017 are 61.7% of total deposits, an increase of 34% since 2012. Financial data is presented for Lake Shore’s Fiscal Year Ended December 31 for each respective year. $378.5M$388.2M$386.9M$369.2M$385.9M$390.8M1.040.83% 0.76% 0.60% 0.49%0.50% 0.00% 0.20% 0.40% 0.60% 0.80% 1.00% 1.20% $0$50,000$100,000$150,000$200,000$250,000$300,000$350,000$400,000$450,000201220132014201520161Q 2017Time DepositsNon-Time DepositsCost of Deposits
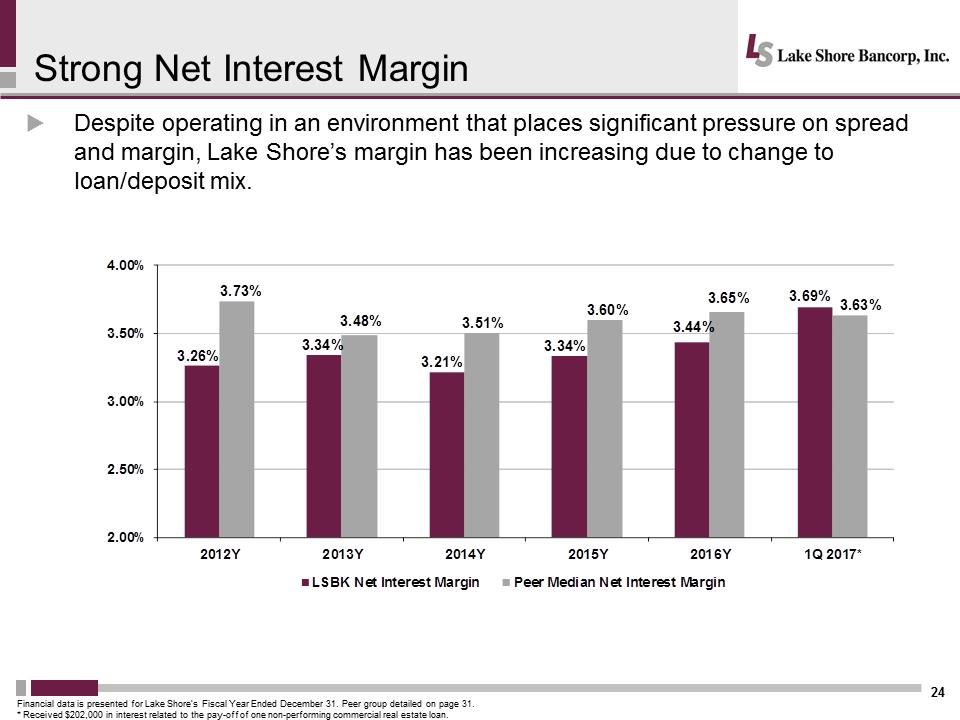 Strong Net Interest Margin 24 .Despite operating in an environment that places significant pressure on spread and margin, Lake Shore’s margin has been increasing due to change to loan/deposit mix. Financial data is presented for Lake Shore’s Fiscal Year Ended December 31. Peer group detailed on page 31. * Received $202,000 in interest related to the pay-off of one non-performing commercial real estate loan. 3.26% 3.34% 3.21% 3.34% 3.44% 3.69%3.73% 3.48%3.51% 3.60% 3.65%3.63% 2.00% 2.50% 3.00% 3.50% 4.00% 2012Y2013Y2014Y2015Y2016Y1Q 2017* LSBK Net Interest MarginPeer Median Net Interest Margin
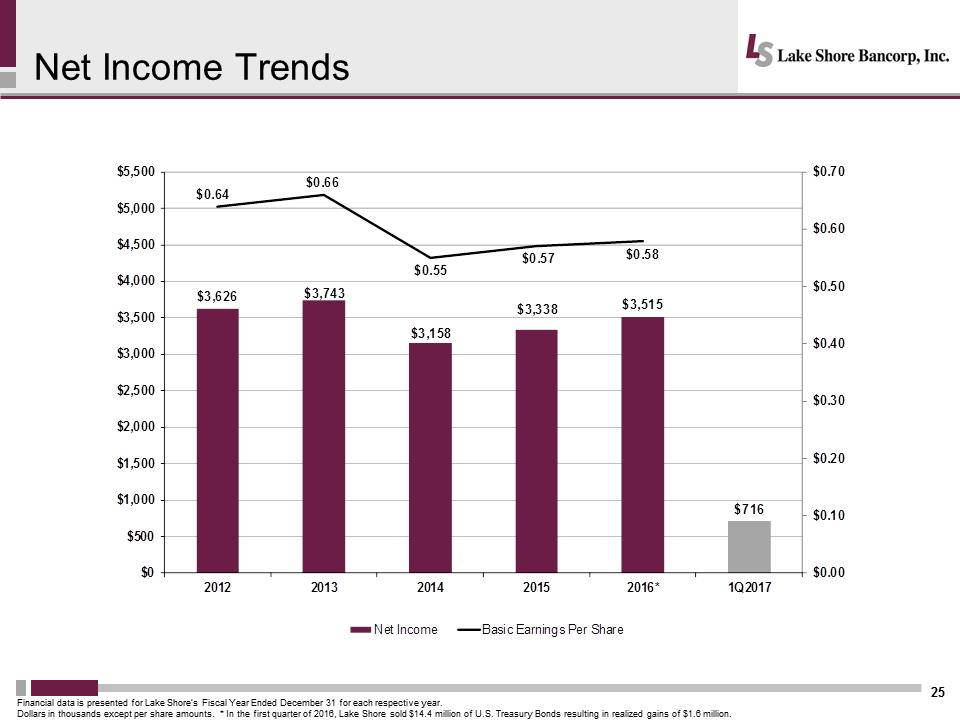 Net Income Trends 25 Financial data is presented for Lake Shore’s Fiscal Year Ended December 31 for each respective year. Dollars in thousands except per share amounts. * In the first quarter of 2016, Lake Shore sold $14.4 million of U.S. Treasury Bonds resulting in realized gains of $1.6 million. $3,626$3,743$3,158$3,338$3,515$716$0.64$0.66$0.55$0.57$0.58$0.00$0.10$0.20$0.30$0.40$0.50$0.60$0.70$0$500$1,000$1,500$2,000$2,500$3,000$3,500$4,000$4,500$5,000$5,50020122013201420152016*1Q2017Net IncomeBasic Earnings Per Share
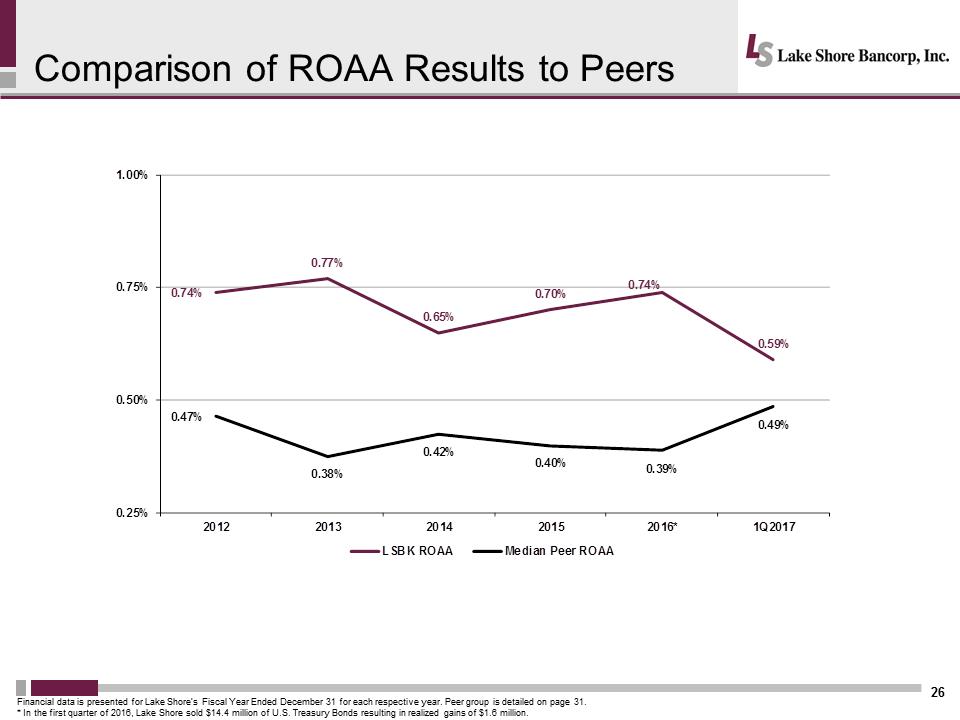 Comparison of ROAA Results to Peers 26 Financial data is presented for Lake Shore’s Fiscal Year Ended December 31 for each respective year. Peer group is detailed on page 31. * In the first quarter of 2016, Lake Shore sold $14.4 million of U.S. Treasury Bonds resulting in realized gains of $1.6 million. 0.74% 0.77% 0.65% 0.70% 0.74% 0.59% 0.47% 0.38% 0.42% 0.40%0.39% 0.49% 0.25% 0.50% 0.75% 1.00% 20122013201420152016*1Q2017LSBK ROAAMedian Peer ROAA
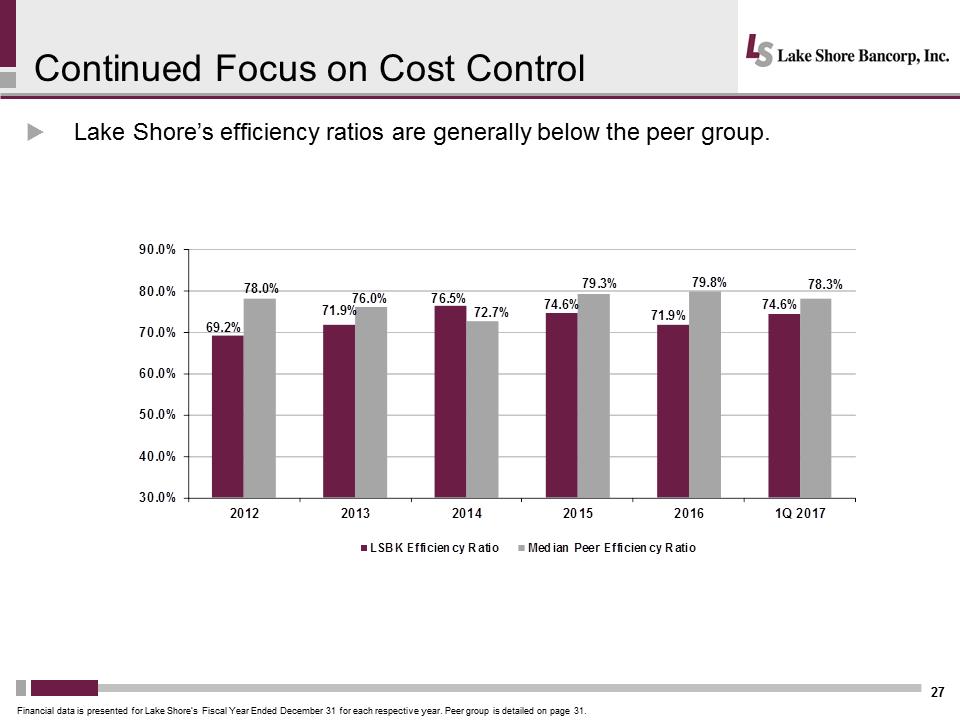 Continued Focus on Cost Control 27 .Lake Shore’s efficiency ratios are generally below the peer group. Financial data is presented for Lake Shore’s Fiscal Year Ended December 31 for each respective year. Peer group is detailed on page 31. 69.2% 71.9% 76.5%74.6% 71.9% 74.6% 78.0% 76.0% 72.7% 79.3%79.8%78.3% 30.0% 40.0% 50.0% 60.0% 70.0% 80.0% 90.0% 201220132014201520161Q 2017LSBK Efficiency RatioMedian Peer Efficiency Ratio
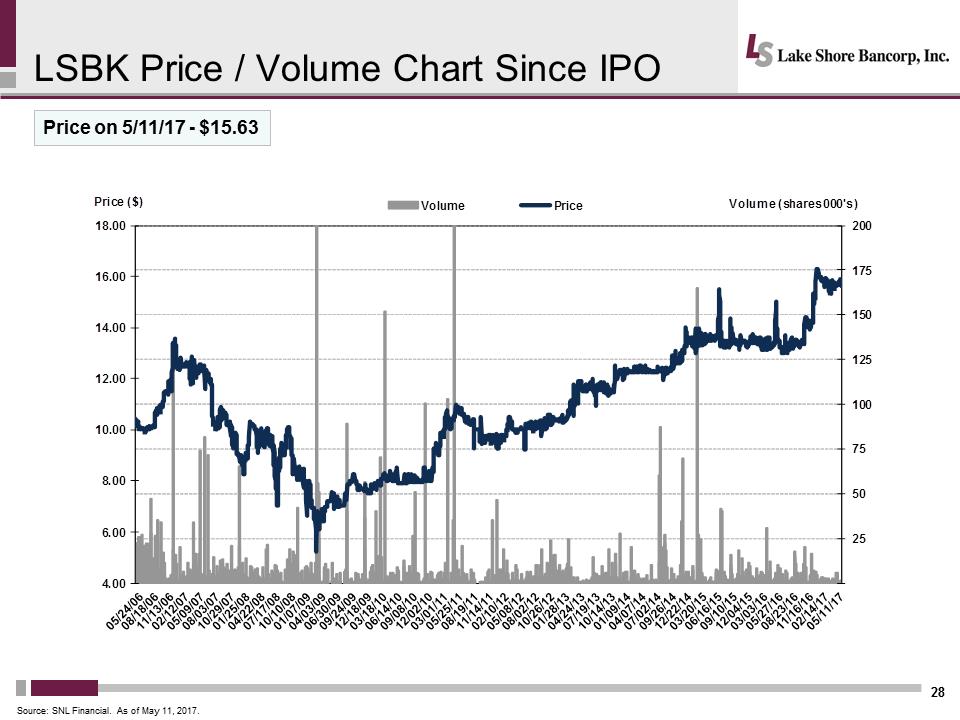 LSBK Price / Volume Chart Since IPO 28 Price on 5/11/17 - $15.63 Source: SNL Financial. As of May 11, 2017. 4.006.008.0010.0012.0014.0016.0018.00255075100125150175200Price ($)Volume (shares 000's)VolumePrice
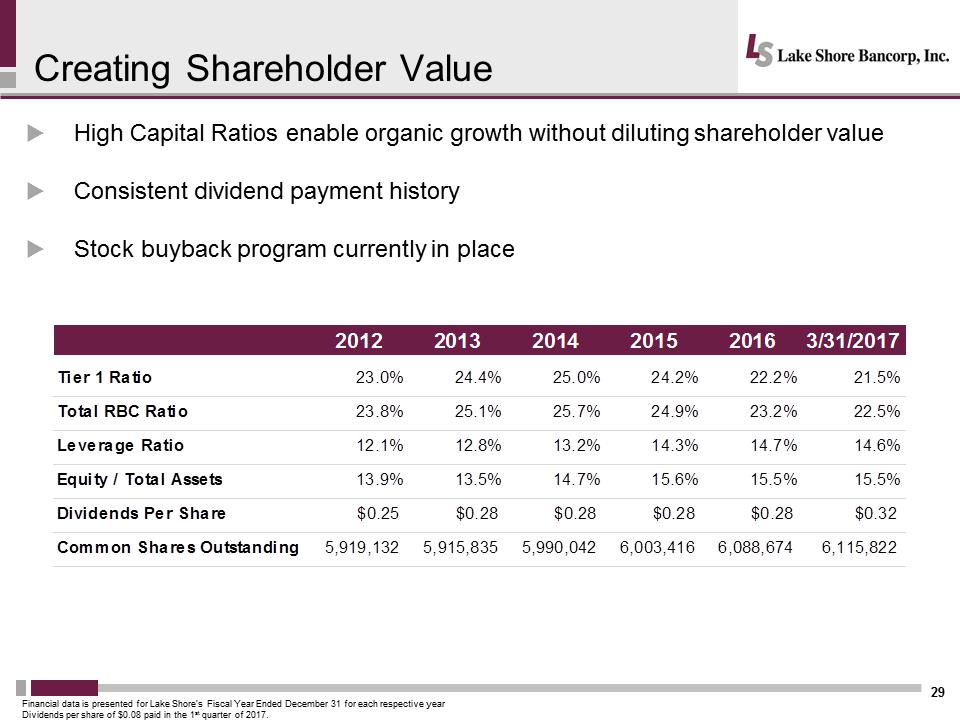 Creating Shareholder Value 29 .High Capital Ratios enable organic growth without diluting shareholder value .Consistent dividend payment history .Stock buyback program currently in place Financial data is presented for Lake Shore’s Fiscal Year Ended December 31 for each respective year Dividends per share of $0.08 paid in the 1st quarter of 2017. 201220132014201520163/31/2017Tier 1 Ratio23.0%24.4%25.0%24.2%22.2%21.5% Total RBC Ratio23.8%25.1%25.7%24.9%23.2%22.5% Leverage Ratio12.1%12.8%13.2%14.3%14.7%14.6% Equity / Total Assets13.9%13.5%14.7%15.6%15.5%15.5% Dividends Per Share$0.25$0.28$0.28$0.28$0.28$0.32Common Shares Outstanding5,919,1325,915,8355,990,0426,003,4166,088,6746,115,822
 QUESTIONS & ANSWERS
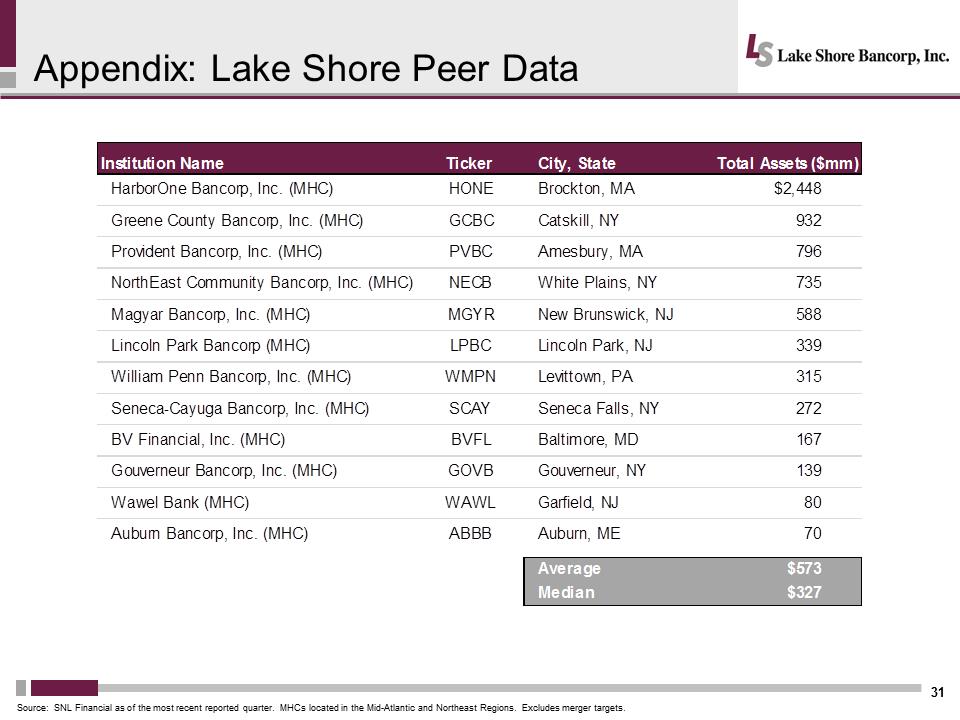 Appendix: Lake Shore Peer Data 31 Source: SNL Financial as of the most recent reported quarter. MHCs located in the Mid-Atlantic and Northeast Regions. Excludes merger targets. Institution Name Ticker City, State Total Assets ($mm) HarborOne Bancorp, Inc. (MHC)HONEBrockton, MA$2,448Greene County Bancorp, Inc. (MHC)GCBCCatskill, NY932Provident Bancorp, Inc. (MHC)PVBCAmesbury, MA796NorthEast Community Bancorp, Inc. (MHC)NECBWhite Plains, NY735Magyar Bancorp, Inc. (MHC)MGYRNew Brunswick, NJ588Lincoln Park Bancorp (MHC)LPBCLincoln Park, NJ339William Penn Bancorp, Inc. (MHC)WMPNLevittown, PA315Seneca-Cayuga Bancorp, Inc. (MHC)SCAYSeneca Falls, NY272BV Financial, Inc. (MHC)BVFLBaltimore, MD167Gouverneur Bancorp, Inc. (MHC)GOVBGouverneur, NY139Wawel Bank (MHC)WAWLGarfield, NJ80Auburn Bancorp, Inc. (MHC)ABBBAuburn, ME70Average$573Median$327
 .Call to Order .Introduction of Proposal to Elect Directors .Tabulation of Votes .Adjournment 32 Lake Shore, MHC Annual Meeting of Members