Attached files
| file | filename |
|---|---|
| EX-99.2 - EXHIBIT 99.2 - NEULION, INC. | ex99_2.htm |
| 8-K - NEULION, INC. | l5151708k.htm |
Exhibit 99.1

Investor Presentation | May 2017

Forward Looking Statements Certain statements herein are forward-looking statements and represent NeuLion’s current intentions in respect of future activities. Forward-looking statements can be identified by the use of the words “will,” “expect,” “seek,” “anticipate,” “believe,” “plan,” “estimate,” “expect,” and “intend,” statements that an event or result “may,” “will,” “can,” “should,” “could,” or “might” occur or be achieved, and other similar expressions. These statements, in addressing future events and conditions, involve inherent risks and uncertainties. Although the forward-looking statements contained in this release are based upon what management believes to be reasonable assumptions, NeuLion cannot assure readers that actual results will be consistent with these forward-looking statements. These forward-looking statements are made as of the date of this release and NeuLion assumes no obligation to update or revise them to reflect new events or circumstances, except as required by law. Many factors could cause NeuLion’s actual results, performance or achievements to be materially different from any future results, performance or achievements that may be expressed or implied by such forward-looking statements, including: our ability to derive anticipated benefits from the acquisitions of DivX Corporation and Saffron Digital Media; our ability to realize some or all of the anticipated benefits of our partnerships; general economic and market segment conditions; our customers’ subscriber levels and financial health; our ability to pursue and consummate acquisitions in a timely manner; our continued relationships with our customers; our ability to negotiate favorable terms for contract renewals; competitor activity; product capability and acceptance rates; technology changes; regulatory changes; foreign exchange risk; interest rate risk; and credit risk. These factors should be considered carefully and readers should not place undue reliance on the forward-looking statements. A more detailed assessment of the risks that could cause actual results to materially differ from current expectations is contained in the “Risk Factors” section of NeuLion’s Annual Report on Form 10-K for the fiscal year ended December 31, 2016, which is available on www.sec.gov and filed on www.sedar.com.
Deliver and enable the highest quality live and on-demand digital video content experiences anywhere and on any device NeuLion Mission

TSX, 550+ Employees, OTT & TVE Leader, Big Brand Customers High and expanding margins – Adj. EBITDA positive since 2013 Land and expand model – customers scale over time Company Highlights Recurring license revenue drives higher visibility Scalable business model with significant operating leverage

Market Trends Driving NeuLion’s Business 1/3 330 Million 20% 5.4 Billion of all TV watching now via on-demand services4 mobile handsets by 2020, an increase of over 800% global shipments of 4K enabled Televisions by 2019 of all U.S. households, were cable-free at the end of 2015 Expanding OTT Video Qualities Appointment TV is Dying Young Audiences Choose OTT TV is the Screen In Front of You

NeuLion By The Numbers

NeuLion Empowers the Entire Ecosystem NeuLion Digital Platform(~70% of 2016 revenue) Provides digital video broadcasting, distribution and monetization of live and on-demand sports and entertainment content to any connected device NeuLion MainConcept(~10% of 2016 revenue) NeuLion CE SDK (~20% of 2016 revenue) Licenses technology (SDKs, CTKs) to the biggest names in consumer electronics and when coupled with NeuLion Digital Platform empowers the entire video ecosystem, with up to 4k Ultra HD video Leading global provider of video and audio codec solutions to support for next generation standards including latest technologies such as HEVC MPEG DASH support

NeuLion owns and operates every piece of the end-to-end platform that seamlessly delivers high-quality, interactive content across multiple screens The Proprietary NeuLion Digital Platform 1 2 3 4 5 6 7 8

NeuLion Delivers on All ScreensAll Video Formats – HD & 4K

Content Owners Video Integrators CE Manufacturers Attractive Blue Chip Customer Base

Why We Win

Internal Deployments Proprietary, End-to-End, Fully Integrated, Configurable Solution Technology Licensee Technology Licensee High Perception of Value: Live and On-Demand Content Delivery Offered At Reasonable Price High-cost alternative Expensive; Potentially Ineffective Dedicated Account Management & Customer/Operational Support ? Investment in Internal Resources Deep Industry Expertise with a Global Sales Footprint Limited International Presence NA Ability to Utilize Large, Recognizable Customer Base to Attract New Ones NA Content Agnostic Disney Ownership + Discovery Partnership NA Marketplace Competition

Multi Vendor Expense and Risk

NeuLion’s Diversive & Growing Global Customer Base 66%North America (1) 10%EMEA (1) 22%Asia (1) Proven Land & Expand Sales ModelAttracting Entertainment and Sports Variable Pricing ModelFixed FeeRevenue ShareVariable Fee Flexible Customer Acquisition Strategy : As at December 31, 2016Top 60 NeuLion Digital Platform Customers, as at December 31, 2016

Fragmented Global Sports Content Market Significant NeuLion Growth Opportunities Remain >1300 >190 <1% Countries Content Rights Holders Market Penetration Source: Sportscal Survey of top global revenue sports rights deals in 2016 Top Global Sports Events

High and expanding margins – Adj. EBITDA positive since 2013 Land and expand model – customers scale over time Financial Highlights Recurring license revenue drives higher visibility Scalable business model with significant operating leverage Usage revenue provides upside potential

Adjusted EBITDA Key Financial Metrics (in millions) 4YR CAGR 26.5% (1) Adjusted EBITDA represents net income (loss) before interest, income taxes, depreciation and amortization, stock-based compensation, acquisition-related expenses, listing-related expenses, purchase price accounting adjustments, impairment of intangibles, discount on convertible note, loss on dissolution of majority-owned subsidiary, gain on revaluation of convertible note derivative, investment income/expense and foreign exchange gain/loss.(2) Includes $9.0M for the acquisition of Saffron Digital, $5.1M of stock repurchases and $7.3M to purchase new office building.(3) Includes $2.0M of stock repurchases and $1.9M in purchases of Property, Plant & Equipment for our U.K Headquarters. (2) (1) (3) Revenue Working Capital

NeuLion Company Revenue Model License fees create annuity revenue streamVariable revenue grows with increased usageLarger audienceMore content, features, devicesAdded events Revenue Mix (1) Note:Source: Management estimate, based on historical results. Actual customer case study Setup/Dev Annual Fixed Fees Variable Actual Cable Operator Customer Case Study: Land and Expand Revenue Model Note: Annotations above denote price configuration assumptions ContentDevice Categories: 5 Content +Device Categories: 7 Content +Device Categories: 15 Content +Device Categories: 20 Content +Device Categories: 25
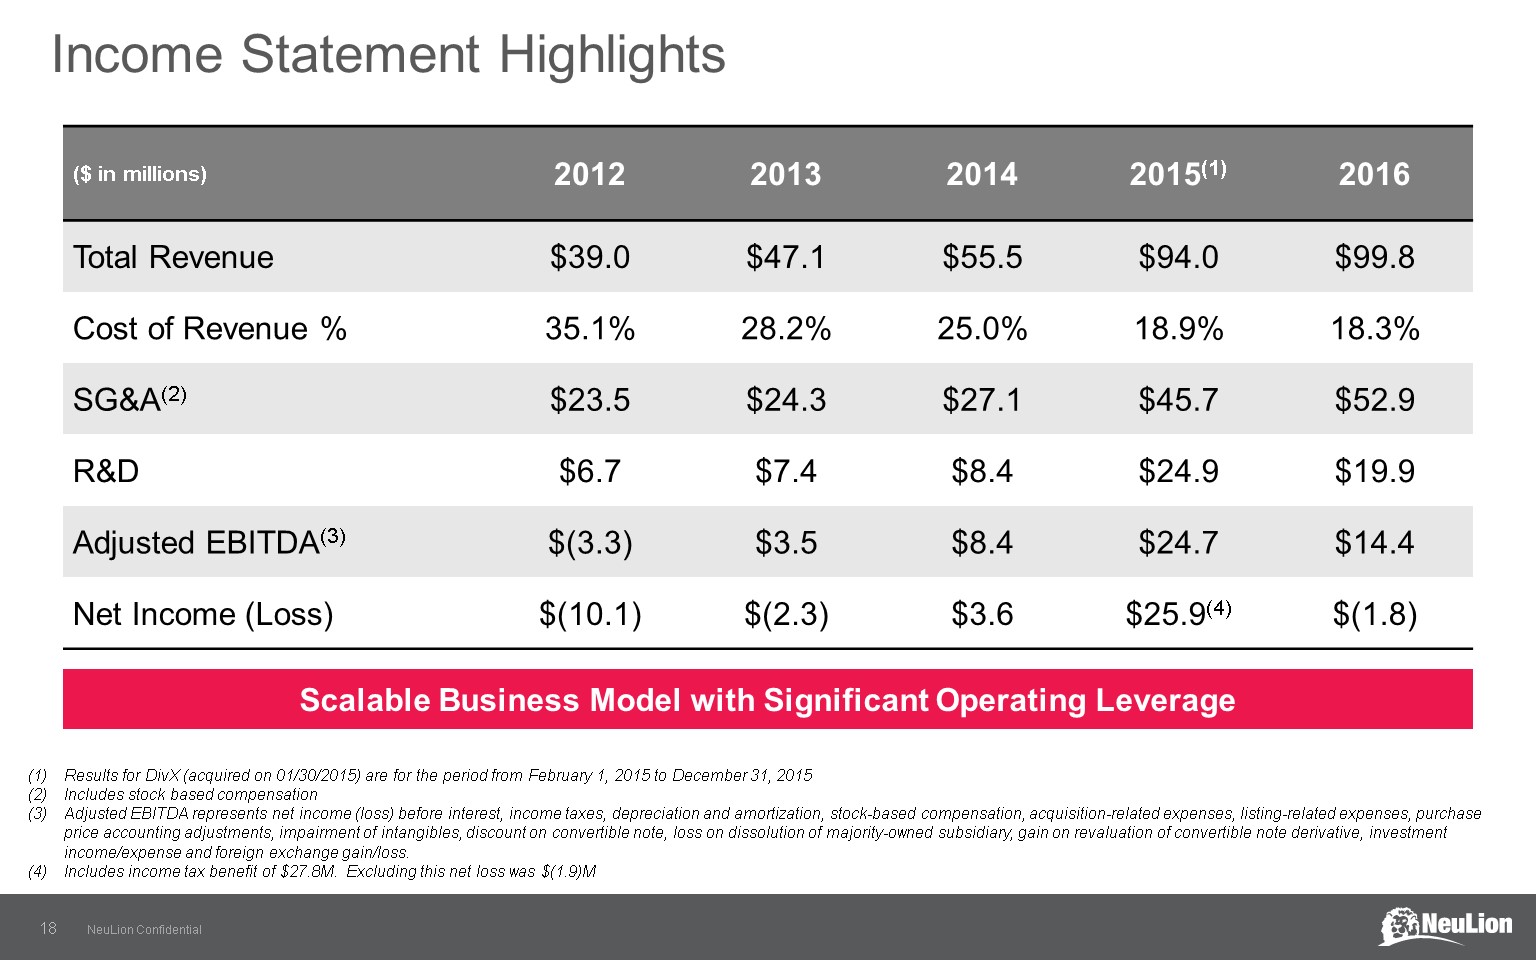
($ in millions) 2012 2013 2014 2015(1) 2016 Total Revenue $39.0 $47.1 $55.5 $94.0 $99.8 Cost of Revenue % 35.1% 28.2% 25.0% 18.9% 18.3% SG&A(2) $23.5 $24.3 $27.1 $45.7 $52.9 R&D $6.7 $7.4 $8.4 $24.9 $19.9 Adjusted EBITDA(3) $(3.3) $3.5 $8.4 $24.7 $14.4 Net Income (Loss) $(10.1) $(2.3) $3.6 $25.9(4) $(1.8) Results for DivX (acquired on 01/30/2015) are for the period from February 1, 2015 to December 31, 2015Includes stock based compensationAdjusted EBITDA represents net income (loss) before interest, income taxes, depreciation and amortization, stock-based compensation, acquisition-related expenses, listing-related expenses, purchase price accounting adjustments, impairment of intangibles, discount on convertible note, loss on dissolution of majority-owned subsidiary, gain on revaluation of convertible note derivative, investment income/expense and foreign exchange gain/loss.Includes income tax benefit of $27.8M. Excluding this net loss was $(1.9)M Scalable Business Model with Significant Operating Leverage Income Statement Highlights

Income Statement Highlights Q1 ’17 Q4 ’16 Q3 ’16 Q2 ’16 Q1’16 Q4’15 Q3’15 Q2’15 Total Revenue $23.9 $25.5 $23.9 $24.1 $26.3 $27.8 $21.9 $22.7 Cost of Revenue as a % of Revenue 21% 20% 18% 17% 18% 19% 18% 19% SG&A(1) $14.7 $14.7 $13.4 $12.9 $11.9 $13.2 $11.2 $11.4 R&D $4.2 $5.1 $5.2 $5.3 $4.4 $5.5 $6.6 $7.5 Non-GAAP Adjusted EBITDA $0.9 $1.7 $2.3 $3.3 $7.0 $8.8 $5.0 $4.2 GAAP Net Income (Loss) $(1.9) $(0.3) $(2.7) $(0.8) $2.1 $32.8 $(3.1) $(3.2) Diluted EPS $(0.01) $(0.01) $(0.01) $0.00 $0.01 $0.12 $(0.01) $(0.01) High margin business with increasing growth opportunitiesFirst and fourth quarters are seasonally strongestQ2 2015 includes first full quarter of DivXQ2 2016 includes one month of Saffron DigitalQ3 2016 includes first full quarter of Saffron Digital Scalable Business Model with High Operating Leverage Includes stock based compensation

Balance Sheet Highlights Decrease in Cash & Equivalents from 12/31/16 to 3/31/17 includes $2.3M in stock repurchases and $1.8M to build out our European headquarters in LondonDecrease in Cash & Equivalents from 9/30/16 to 12/31/16 includes $9.0M to acquire Saffron Digital, $5.1M in stock repurchases and $7.3M to purchase new office building (in USD $M) 03/31/2017 12/31/2016 09/30/2016 06/30/2016 Cash & Equivalents $32.7 (1) $41.9(1)(2) $69.6 (2) $46.1 Accounts Receivable $17.7 $14.1 $12.3 $9.6 Total Current Assets $54.7 $61.2 $86.8 $61.0 Accounts Payable $11.1 $11.8 $28.5 $7.7 Deferred Revenue - current $13.6 $14.0 $13.1 $10.0 Total Current Liabilities $36.3 $38.5 $54.5 $28.8 Working Capital $18.4 $22.7 $32.3 $32.2 Other Long-Term Liabilities $3.3 $4.5 $5.1 $4.0 Total Equity $102.2 $105.4 $107.1 $110.3 Total Liabilities and Equity $141.8 $148.4 $166.7 $143.1

Board of Directors Roy ReichbachPresident & CEO Chris WagnerEVP, Marketplace Strategy Tim AlavathilChief Financial Officer Michael HerChief Technology Officer Ronald NunnEVP, Business Operations Charles B. WangDirector Nancy LiExecutive Chair Roy ReichbachPresident & CEO Gabriel A. BattistaDirector Shirley Strum KennyDirector David KronfeldLead Director Robert E. BostromDirector John A. CoelhoDirector James HaleDirector Management Team Nancy LiExecutive Chair Alexander AratoGeneral Counsel

Capital Structure and Ownership Security Fully Diluted Shares Outstanding Common Stock 277,545,918 Options/Restricted Stock/Warrants (Treasury Method) 18,654,131 Total 296,200,049 Insider Ownership Shares/Millions % O/SCommon Stock Nancy Li, Executive Chair 40.8 15 Charles Wang, Director 37.7 13 PCF1, LLC (DivX) 63.6 23 JK&B Capital V LP (Board Member control) 20.6 7 JK&B Capital V Special Opp. LP (Board member control and Charles Wang 85% ownership) 15.5 6 Other Insider Ownership 17.6 6 Total 195.8 70 February 28, 2017