Attached files
| file | filename |
|---|---|
| 8-K - FORM 8-K - SIMMONS FIRST NATIONAL CORP | f8k_051517.htm |
Exhibit 99.1

NASDAQ - GS: SFNC Pine Bluff – Corporate Headquarters Little Rock Corporate Office

Forward - Looking Statements and Non - GAAP Financial Measures Page 2 Certain statements contained in this presentation may not be based on historical facts and are "forward - looking statements" within the meaning of Section 27 A of the Securities Act of 1933 , as amended, and Section 21 E of the Securities Exchange Act of 1934 , as amended . These forward - looking statements may be identified by reference to a future period(s) or by the use of forward - looking terminology, such as "anticipate," "estimate," "expect," "foresee," "may," "might," "will," "would," "could" or "intend," future or conditional verb tenses, and variations or negatives of such terms . These forward - looking statements include, without limitation, those relating to the Company's future growth, revenue, assets, asset quality, profitability and customer service, critical accounting policies, net interest margin, non - interest revenue, market conditions related to the Company's common stock repurchase program, allowance for loan losses, the effect of certain new accounting standards on the Company's financial statements, income tax deductions, credit quality, the level of credit losses from lending commitments, net interest revenue, interest rate sensitivity, loan loss experience, liquidity, capital resources, market risk, earnings, effect of pending litigation, acquisition strategy, legal and regulatory limitations and compliance and competition . Readers are cautioned not to place undue reliance on the forward - looking statements contained in this presentation in that actual results could differ materially from those indicated in such forward - looking statements, due to a variety of factors . These factors include, but are not limited to, changes in the Company's operating or expansion strategy, availability of and costs associated with obtaining adequate and timely sources of liquidity, the ability to maintain credit quality, possible adverse rulings, judgments, settlements and other outcomes of pending litigation, the ability of the Company to collect amounts due under loan agreements, changes in consumer preferences, effectiveness of the Company's interest rate risk management strategies, laws and regulations affecting financial institutions in general or relating to taxes, the effect of pending or future legislation, the ability of the Company to repurchase its common stock on favorable terms, the ability of the Company to successfully implement its acquisition strategy, changes in interest rates and capital markets, inflation, customer acceptance of the Company's products and services, and other risk factors . Other relevant risk factors may be detailed from time to time in the Company's press releases and filings with the Securities and Exchange Commission . Any forward - looking statement speaks only as of the date of this Report, and we undertake no obligation to update these forward - looking statements to reflect events or circumstances that occur after the date of this Report . Annualized, pro forma, projected and estimated numbers are used for illustrative purpose only, are not forecasts and may not reflect actual results . Non - GAAP Financial Measures This document contains financial information determined by methods other than in accordance with generally accepted accounting principles (GAAP) . The Company's management uses these non - GAAP financial measures in their analysis of the company's performance . These measures typically adjust GAAP performance measures to include the tax benefit associated with revenue items that are tax - exempt, as well as adjust income available to common shareholders for certain significant activities or nonrecurring transactions . Since the presentation of these GAAP performance measures and their impact differ between companies, management believes presentations of these non - GAAP financial measures provide useful supplemental information that is essential to a proper understanding of the operating results of the company's core businesses . These non - GAAP disclosures should not be viewed as a substitute for operating results determined in accordance with GAAP, nor are they necessarily comparable to non - GAAP performance measures that may be presented by other companies .

Important Additional Information and Where to Find It Page 3 Merger with First Texas BHC, Inc . In connection with the proposed merger with First Texas BHC, Inc . ("First Texas"), Simmons First National Corporation ("SFNC") will file with the SEC a Registration Statement on Form S - 4 that will include a joint proxy statement of First Texas and SFNC, and a prospectus of SFNC, as well as other relevant documents concerning the proposed transaction . This communication does not constitute an offer to sell or the solicitation of an offer to buy any securities or a solicitation of any vote or approval . SHAREHOLDERS OF SFNC AND FIRST TEXAS ARE URGED TO READ THE REGISTRATION STATEMENT AND THE JOINT PROXY STATEMENT/PROSPECTUS REGARDING THE MERGER WHEN IT BECOMES AVAILABLE AND ANY OTHER RELEVANT DOCUMENTS FILED WITH THE SEC BY SFNC, AS WELL AS ANY AMENDMENTS OR SUPPLEMENTS TO THOSE DOCUMENTS, BECAUSE THEY WILL CONTAIN IMPORTANT INFORMATION . A free copy of the joint proxy statement/prospectus, as well as other filings containing information about SFNC and First Texas, may be obtained at the SEC's Internet site (http : //www . sec . gov), when they are filed by SFNC . You will also be able to obtain these documents, when they are filed, free of charge, from SFNC at www . simmonsbank . com under the heading "Investor Relations" . Copies of the joint proxy statement/prospectus can also be obtained, when it becomes available, free of charge, by directing a request to Simmons First National Corporation, 501 Main Street, Pine Bluff, Arkansas 71601 , Attention : David Garner, Investor Relations Officer, Telephone : ( 870 ) 541 - 1000 or to First Texas BHC, Inc . , 2200 West 7 th Street, Suite 112 , Fort Worth, TX 76107 , Attention : Lisanne Davidson, Telephone : ( 817 ) 298 - 5610 . SFNC, First Texas, and certain of their respective directors, executive officers and other members of their management and employees may be deemed to be participants in the solicitation of proxies in connection with the proposed transaction . Information about the directors and executive officers of SFNC, and their respective ownership of SFNC common stock, is set forth in the proxy statement for SFNC's 2017 annual meeting of shareholders, as filed with the SEC on Schedule 14 A on March 14 , 2017 . Additional information regarding all of the participants in the solicitation may be obtained by reading the joint proxy statement/prospectus regarding the proposed merger when it becomes available . Free copies of this document may be obtained as described in the preceding paragraph . Merger with Southwest Bancorp, Inc . In connection with the proposed merger with Southwest Bancorp, Inc . ("Southwest"), SFNC will file with the SEC a Registration Statement on Form S - 4 that will include a joint proxy statement of Southwest and SFNC, and a prospectus of SFNC, as well as other relevant documents concerning the proposed transaction . This communication does not constitute an offer to sell or the solicitation of an offer to buy any securities or a solicitation of any vote or approval . SHAREHOLDERS OF SOUTHWEST AND SFNC ARE URGED TO READ THE REGISTRATION STATEMENT AND THE JOINT PROXY STATEMENT/PROSPECTUS REGARDING THE MERGER WHEN IT BECOMES AVAILABLE AND ANY OTHER RELEVANT DOCUMENTS FILED WITH THE SEC BY SFNC AND/OR SOUTHWEST, AS WELL AS ANY AMENDMENTS OR SUPPLEMENTS TO THOSE DOCUMENTS, BECAUSE THEY WILL CONTAIN IMPORTANT INFORMATION . A free copy of the joint proxy statement/prospectus, as well as other filings containing information about SFNC and Southwest, may be obtained at the SEC's Internet site (http : //www . sec . gov), when they are filed by SFNC or Southwest . You will also be able to obtain these documents, when they are filed, free of charge, from SFNC at www . simmonsbank . com under the heading "Investor Relations . " Copies of the joint proxy statement/prospectus can also be obtained, when it becomes available, free of charge, by directing a request to Simmons First National Corporation, 501 Main Street, Pine Bluff, Arkansas 71601 , Attention : David Garner, Investor Relations Officer, Telephone : ( 870 ) 541 - 1000 or to Southwest Bancorp, Inc . , 608 South Main Street, Stillwater, Oklahoma 74074 , Attention : Joe Shockley, CFO or Rusty LaForge, EVP, General Counsel & Investor Relations, Telephone : ( 405 ) 742 - 1800 . SFNC, Southwest, and certain of their respective directors and executive officers may be deemed to be participants in the solicitation of proxies from the shareholders of the SFNC and Southwest, respectively, in connection with the proposed merger . Information about the directors and executive officers of SFNC and Southwest, and their respective ownership of SFNC's common stock and Southwest's common stock is set forth in the proxy statement for SFNC's 2017 annual meeting of shareholders, as filed with the SEC on Schedule 14 A on March 14 , 2017 , and in the proxy statement for Southwest's 2017 annual meeting of shareholders, as filed with the SEC on Schedule 14 A on March 9 , 2017 . Additional information regarding the interests of those participants and other persons who may be deemed participants in the transaction may be obtained by reading the joint proxy statement/prospectus regarding the proposed merger when it becomes available . Free copies of this document may be obtained as described in the preceding paragraph .

(1) Source: American Bankers Association's list of the Top 100 Farm Lender Ranked by Dollar Volume (as of 12/31/16) (2) Source: U.S. Small Business Administration's list of the Top 100 SBA Lenders Ranked by Number of Loans (as of 12/31/16) Company Profile • Ticker: SFNC • $8.6 billion Total Assets • $1.7 billion Market Cap • 4 State Footprint • Since 1903 • History of strong asset quality • Excellent non - interest income (non - banking business units) • Converted from a National Charter to a State Charter (Fed Member Bank) (March 2016) • Ranked 42 nd in the U.S. on ABA's list of Top 100 Farm Lenders (1) • Ranked 41 st in the U.S. on SBA's list of Top 100 SBA Lenders (2) Page 4

Company Footprint and Regional Structure o Loans o Deposits $1 . 3 B $1 . 6 B o Loans o Deposits $1 . 4 B $1 . 1 B o Loans o Deposits $2 . 5 B $4 . 1 B 1 Arkansas Region 2 Missouri / Kansas Region 3 Tennessee Region 2 3 1 Page 5
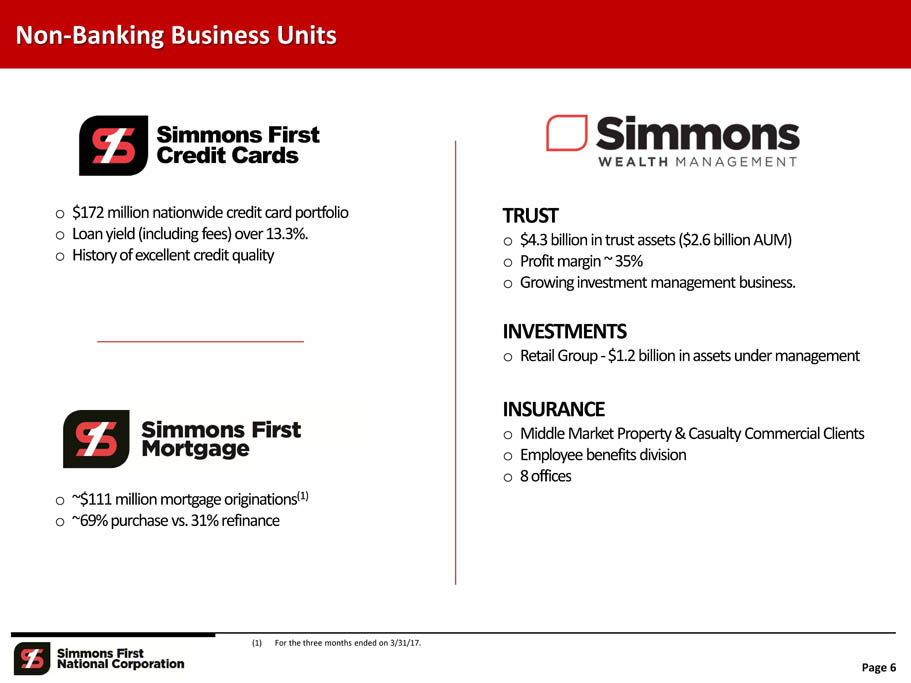
Non - Banking Business Units Simmons First Credit Cards o $172 million nationwide credit card portfolio o Loanyield (including fees) over 13.3%. o Historyof excellent credit quality o ~$111 million mortgage originations (1) o ~69% purchase vs. 31% refinance TRUST o $4.3 billion in trust assets ($2.6 billion AUM) o Profit margin ~ 35% o Growing investment management business. INVESTMENTS o Retail Group - $1.2 billion inassets under management INSURANCE o Middle Market Property & Casualty Commercial Clients o Employee benefits division o 8 offices (1) For the three months ended on 3/31/17. Page 6
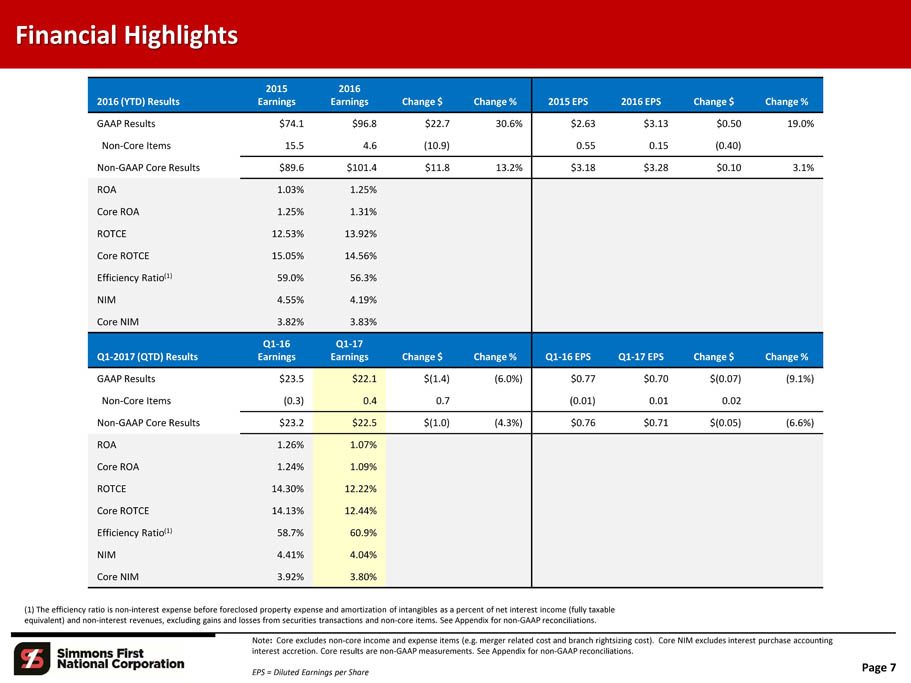
EPS = Diluted Earnings per Share Financial Highlights Page 7 (1) The efficiency ratio is non - interest expense before foreclosed property expense and amortization of intangibles as a percent of net interest income (fully taxable equivalent) and non - interest revenues, excluding gains and losses from securities transactions and non - core items. See Appendix for non - GAAP reconciliations. Note : Core excludes non - core income and expense items (e.g. merger related cost and branch rightsizing cost). Core NIM excludes interest purchase accounting interest accretion. Core results are non - GAAP measurements. See Appendix for non - GAAP reconciliations. 2016 (YTD) Results 2015 Earnings 2016 Earnings Change $ Change % 2015 EPS 2016 EPS Change $ Change % GAAP Results $74.1 $96.8 $22.7 30.6% $2.63 $3.13 $0.50 19.0% Non - Core Items 15.5 4.6 ( 10.9) 0.55 0.15 ( 0.40) Non - GAAP Core Results $89.6 $101.4 $11.8 13.2% $3.18 $3.28 $0.10 3.1% ROA 1.03% 1.25% Core ROA 1.25% 1.31% ROTCE 12.53% 13.92% Core ROTCE 15.05% 14.56% Efficiency Ratio (1) 59.0% 56.3% NIM 4.55% 4.19% Core NIM 3.82% 3.83% Q1 - 2017 (QTD) Results Q1 - 16 Earnings Q1 - 17 Earnings Change $ Change % Q1 - 16 EPS Q1 - 17 EPS Change $ Change % GAAP Results $23.5 $22.1 $ ( 1.4) ( 6.0%) $0.77 $0.70 $ ( 0.07) ( 9.1%) Non - Core Items ( 0.3) 0.4 0.7 ( 0.01) 0.01 0.02 Non - GAAP Core Results $23.2 $22.5 $ ( 1.0) ( 4.3%) $0.76 $0.71 $ ( 0.05) ( 6.6%) ROA 1.26% 1.07% Core ROA 1.24% 1.09% ROTCE 14.30% 12.22% Core ROTCE 14.13% 12.44% Efficiency Ratio (1) 58.7% 60.9% NIM 4.41% 4.04% Core NIM 3.92% 3.80%

SFNC: Performance Trends 0.83 0.64 0.80 1.03 1.25 1.07 0.81 0.77 0.86 1.25 1.31 1.09 0.40 0.60 0.80 1.00 1.20 1.40 2012 2013 2014 2015 2016 Q1 FY17 G A A P C o re ROA (%) Diluted EPS ($) Efficiency Ratio (%) (1) 8.05 6.36 10 . 99 12 . 53 13 . 92 12 . 22 7.81 7.54 11 . 89 15 . 05 14 . 56 12 . 44 4.00 6.00 8.00 10.00 12.00 14.00 16.00 2012 2013 2014 2015 2016 Q1 FY17 G A A P C o re ROTCE (%) 70.1 71.2 67.2 59.0 56.3 60.9 50 55 60 65 70 75 2012 2013 2014 2015 2016 Q1 FY17 1.64 1.42 2.11 2.63 3.13 3.06 1.59 1.69 2.29 3.18 3.28 3.23 $1.00 $1.50 $2.00 $2.50 $3.00 $3.50 2012 2013 2014 2015 2016 Q1 - 17 LTM G A A P C o re Page 8 (1) The efficiency ratio is non - interest expense before foreclosed property expense and amortization of intangibles as a percent of net interest income (fully taxable equivalent) and non - interest revenues, excluding gains and losses from securities transactions and non - core items. See Appendix for non - GAAP reconciliations. Note: Core excludes non - core income and expense items (e.g. merger related cost and branch rightsizing cost). Core NIM excludes interest purchase accounting interest accretion. Core results are non - GAAP measurements. See Appendix for non - GAAP reconciliations.
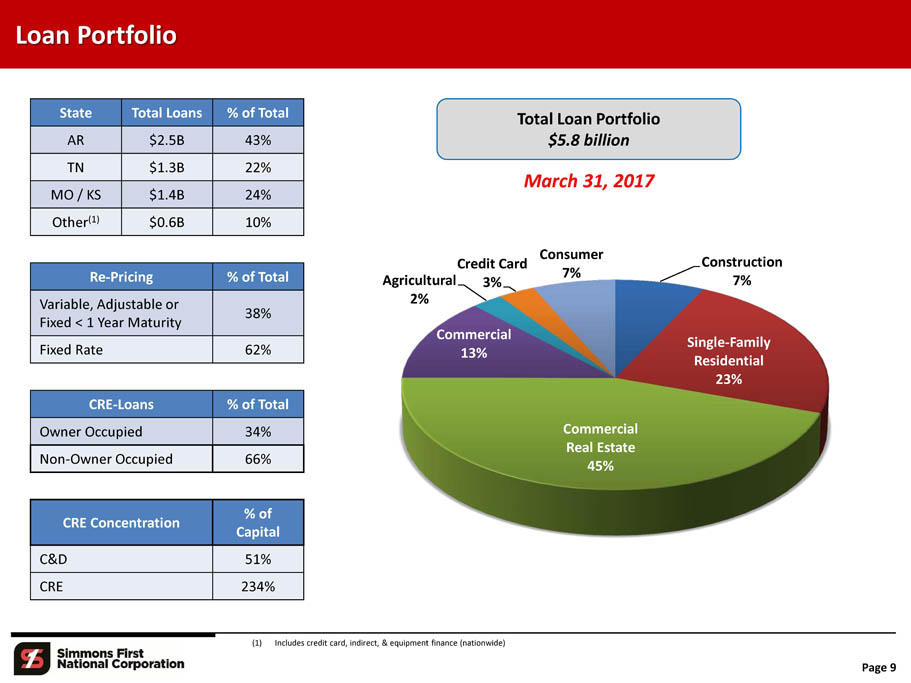
S i n g l e - F am il y Residential 23% Co mme r c i a l Real Estate 45% Co mme r c i a l 13% Agricultural 2% Credit Card 3% Consu mer 7% Construction 7% Loan Portfolio Total Loan Portfolio $5.8 billion March 31, 2017 Page 9 State Total Loans % of Total AR $2.5B 43% TN $1.3B 22% MO / KS $1.4B 24% Other (1) $0.6B 10% Re - Pricing % of Total Variable, Adjustable or Fixed < 1 Year Maturity 38% Fixed Rate 62% CRE - Loans % of Total Owner Occupied 34% Non - Owner Occupied 66% CRE Concentration % of C a p i t al C&D 51% CRE 234% (1) Includes credit card, indirect, & equipment finance (nationwide)

Loan Growth Quarter - over - Quarter Growth Linked Quarter Growth $ in millions Q1 2016 Q1 2017 $ C h a n ge % Change Q4 2016 Q1 2017 $ C h a n ge % Change Legacy Loans (includes acquired migrated) $3,473 $4,633 $1,160 33 . 4% $4,327 $4,633 $306 7 . 1% Acquired Loans, net of discounts 1,458 1,145 (313) (21 . 5%) 1,307 1,145 (162) (12 . 4%) Total Loans, net of discounts $4,931 $5,778 $847 17 . 2% $5,634 $5,778 $144 2 . 6% Note : Q4 linked quarter loan growth includes the normal seasonal impact of a net decrease in the agricultural ( - $10 million) and credit card (+$13 million) portfolios totaling $23 million. Seasonal balance fluctuations in row crop lending of approximately $85 million occur in the agricultural loan portfolio. The row crop balance peaks during the third quarter and reaches its low point in January of each year. Page 10

Data in % 2008 2009 2010 2011 2012 2013 2014 2015 2016 Q1 FY17 NPL – SFNC 0.81 1.35 1.98 1.74 1.42 1.07 0.74 0.68 1.16 1.38 NPL – All US Banks (1)(2) 2.19 4.41 4.15 4.11 3.36 2.67 2.07 1.71 1.64 NA NPA – SFNC 0.64 1.12 1.71 1.52 1.61 1.91 1.30 0.89 0.93 1.05 NPA – All US Banks (1) (2) 1.96 3.81 3.69 3.53 2.91 2.30 1.72 1.40 1.27 NA Net Charge - offs – SFNC 0.43 0.59 0.71 0.49 0.40 0.27 0.30 0.24 0.40 0.18 Net Charge - offs – SFNC (3) 0.30 0.38 0.52 0.30 0.26 0.15 0.20 0.16 0.35 0.11 Net Charge - offs – All US Banks (1) (2) 1.34 2.67 2.67 1.64 1.12 0.70 0.49 0.43 0.45 NA Credit Quality: Legacy Loan Portfolio (Excludes acquired loans) Page 11 "Great Recession" (1) Source: SNL Financial – all U.S. Banks as of 12/31/16 (2) Data as of 3/31/17 not yet published by the Federal Reserve Board (3) Excluding Credit Card net charge - offs

6.6% 1.3% 2.1% 2.6% 1.8% 3.1% 0 . 0 % 1 . 5 % 3 . 0 % 4 . 5 % 6 . 0 % 7 . 5 % 9 . 0 % 1 0 . 5% 1 2 . 0% N e t Cha r g e - Of f % SFN C Industry History of Strong Asset Quality (Net Charge - offs ) 1991 Recession 4.9% 2001 Recession 2008 "The Great Recession" 10.5% * Federal bankruptcy reform impacted charge - offs in 2005 Source: Federal Reserve Board Note: Industry data as of 3/31/17 not yet published by the Federal Reserve Board * * Credit Quality: Credit Card Portfolio Page 12

$ in millions Actual 3 / 31 / 17 Coverage Legacy Loan Portfolio 4,633 Allowance for Loan Loss (38 . 0) 0.82% Loans acquired 1,174 Loan discount / acquired ALLL (29 . 4) 2.50% Total Loans, before discounts 5,807 Total allowance for loan loss and loan discount (67 . 2) 1.16% Credit Quality: Loan and Credit Coverage Page 13 Acquired Loan Migration Note : Upon acquisition of a portfolio, all loans are considered acquired and have a credit mark (loan discount) in place to cover potential exposure . When an acquired, non - impaired loan is renewed or otherwise is re - underwritten for a formal modification or change in terms, the loan is then considered as a legacy credit (migrated loan) and is expected to conform to current policy guidelines . Acquired, impaired loans remain in the acquired pools for the life of the loan, regardless of renewal or modification status . Migrated loans that convert to the legacy portfolio are considered to be of acceptable risk to the bank and are then subject to ALLL methodology . As with newly originated loans, acceptable credit risk loans require a lower ALLL allocation than those with a higher level of risk . Therefore, our ALLL to total loans ratio has declined, as the quality of loans subject to our ALLL methodology has improved . When acquired loan credit mark is included, our total coverage ratio remains over 1 . 15 % .

Acquisitions since 2013 Page 14 Bank Announced Closed System C on v ers i o n Total Asse t s Trust Assets Under Mgm t . P ur c has e Price (1) Price / Earnings (1) Price / Book Value ( 1 ) Price / T an gi b le Book Value (1) E s t im a t e d Cost Savings Metropolitan National Bank Sep - 13 Nov - 13 Mar - 14 $920 $370 $54 (2) 86% 87% 40% Delta Trust & Bank Mar - 14 Aug - 14 Oct - 14 $420 $815 $66 15.6X 161% 165% 35% First State Bank May - 14 Feb - 15 Sep - 15 $1,915 ---- $243 11.9X 176% 180% 20% Liberty Bank May - 14 Feb - 15 Apr - 15 $1,065 ---- $207 13.2X 204% 212% 25% Trust Company of the Ozarks Apr - 15 Oct - 15 Jan - 16 $15 $1,000 $24 ---- 15% Citizens National Bank May - 16 Sep - 16 Oct - 16 $585 $200 $77 16.2X 127% 127% 25% Hardeman County Investments Nov - 16 Pending TBD $462 ---- $75 18.4X 140% 179% 30% Southwest Bancorp, Inc (OKSB) Dec - 16 Pending TBD $2,468 ---- $568 28.9X 200% 212% 35% First Texas BHC, Inc. Jan - 17 Pending TBD $2,019 $430 $462 26.1X 208% 250% 32% (1) Deal ratios as of announcement date (Source: SNL Financial) (2) Metropolitan was acquired from Section 363 Bankruptcy $ in millions
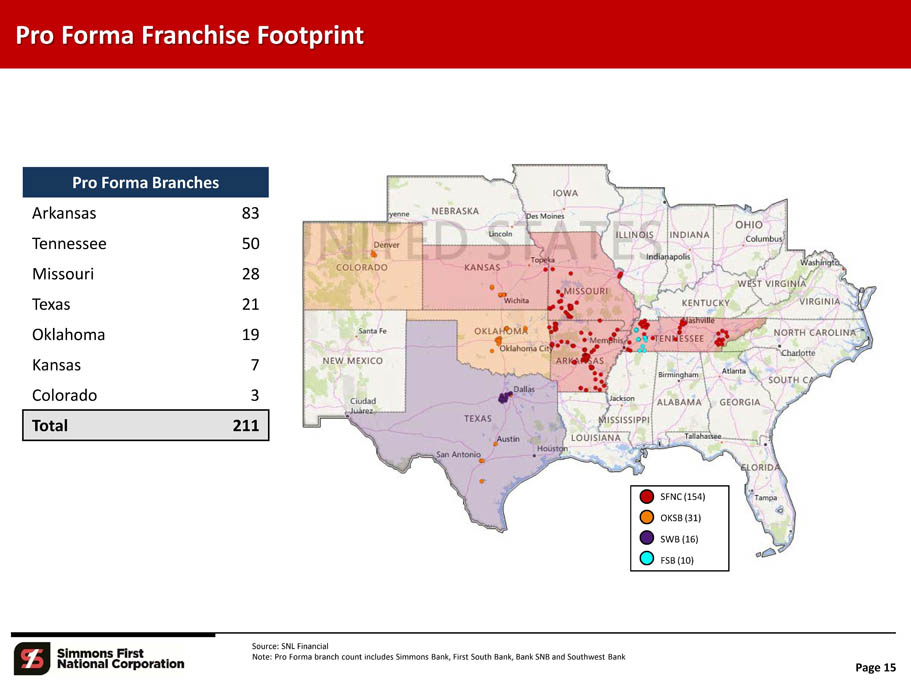
Pro Forma Franchise Footprint Source: SNL Financial Note: Pro Forma branch count includes Simmons Bank, First South Bank, Bank SNB and Southwest Bank Pro Forma Branches Arkansas 83 Tennessee 50 Missouri 28 Texas 21 Oklahoma 19 Kansas 7 Colorado 3 Total 211 SFNC (154) OKSB (31) SWB (16) FSB (10) Page 15
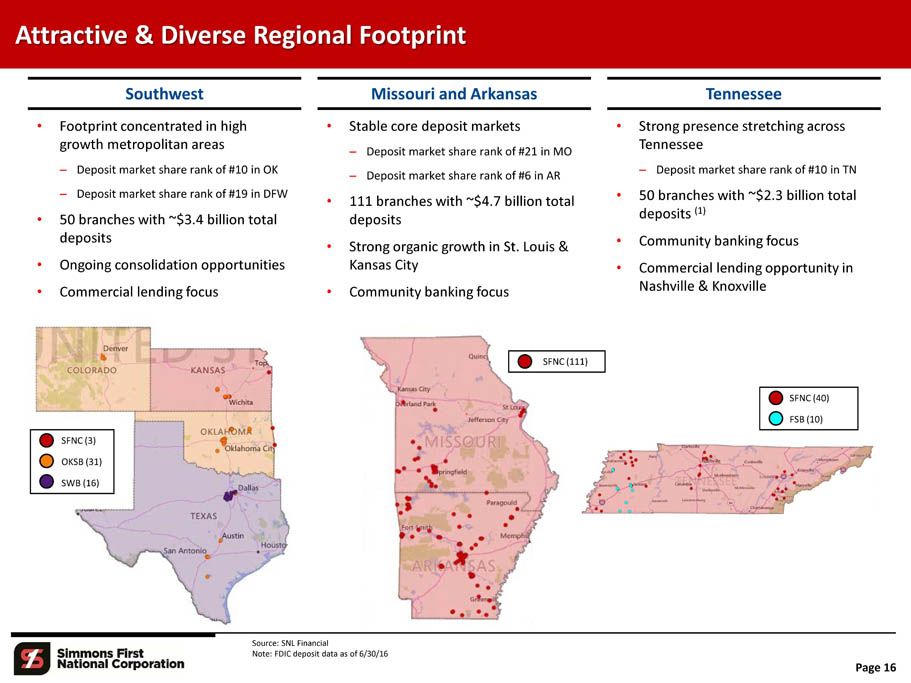
Attractive & Diverse Regional Footprint Source: SNL Financial Note: FDIC deposit data as of 6/30/16 T enness e e Southwest Missouri and Arkansas – Deposit market share rank of #10 in OK – Deposit market share rank of #19 in DFW • 50 branches with ~$3.4 billion total deposits • Ongoing consolidation opportunities • Commercial lending focus • Footprint concentrated in high • Stable core deposit markets growth metropolitan areas – Deposit market share rank of #21 in MO – Deposit market share rank of #6 in AR • 111 branches with ~$4.7 billion total deposits • Strong organic growth in St. Louis & Kansas City • Community banking focus • Strong presence stretching across Tennessee – Deposit market share rank of #10 in TN • 50 branches with ~$2.3 billion total deposits (1) • Community banking focus • Commercial lending opportunity in Nashville & Knoxville SFNC (3) OKSB (31) SWB (16) SFNC (111) SFNC (40) FSB (10) Page 16
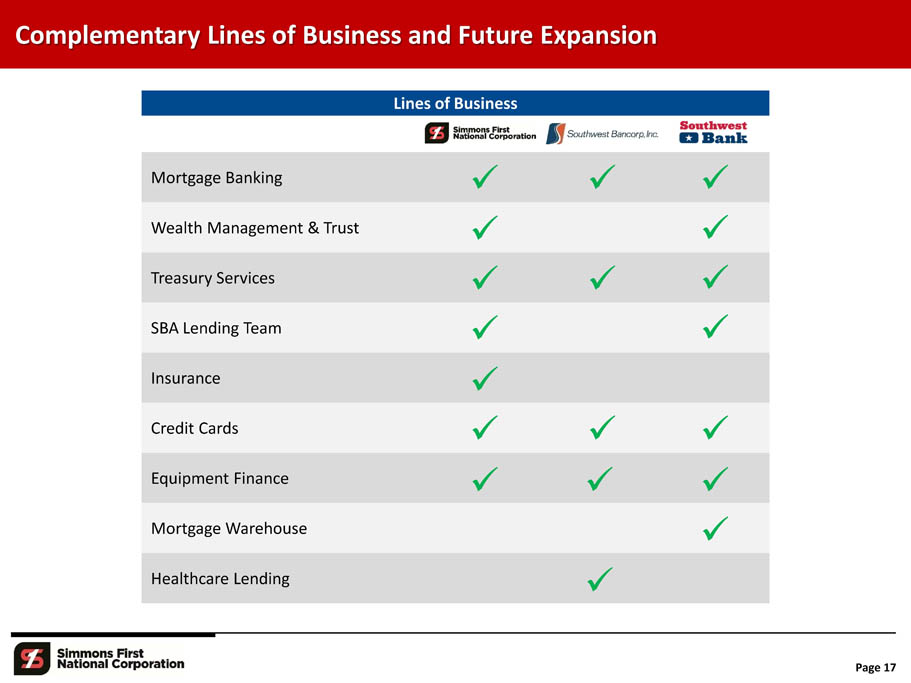
Complementary Lines of Business and Future Expansion Lines of Business Mortgage Banking x x x Wealth Management & Trust x x Treasury Services x x x SBA Lending Team x x Insurance x Credit Cards x x x Equipment Finance x x x Mortgage Warehouse x Healthcare Lending x Page 17

Proven Acquirer and Integrator Recent Acquisitions 2013 2014 2015 2016 2017 (1) $0.9B Metropolitan Central AR (363 Bankruptcy) $0.4B Delta Arkansas $1.1B Liberty Springfield, MO $0.6B Citizens National East Tennessee $0.5B First South West Tennessee $1.9B First State Tennessee $2.5B OKSB OK, TX, KS & CO $1.0B AUM Trust Co. of the Ozarks Missouri $2.0B SWB TX (DFW MSA) (1) Expect closing of Hardeman County Investment Company, OKSB and SWB in 2017. Acquisitions since 1990: Q 3 2017 Expected Page 18
Acquisition Summary Page 19 • Pro forma assets of $13.5 billion (1) • $4.6 billion asset franchise in high growth Southwest markets throughout Texas, Oklahoma and Colorado • Significantly enhances organic growth profile and expands future M&A opportunities • Expected to be accretive to earnings per share within the first full year, while retaining strong capital position • Integration experience and retention of local management helps achieve low execution risk • We remain well - positioned for future opportunities (1) Pro forma assets includes acquisition of Hardeman County Investment Company, OKSB and SWB.

DFAST (Dodd - Frank Stress Test Act) As part of the Dodd - Frank financial reform legislation in 2010 , financial institution's with total consolidated assets of more than $ 10 billion are required to conduct an annual stress test . SFNC is well underway in the preparation for the DFAST requirements . A GAP analysis has been prepared, the Audit and Compliance Groups have been strengthened, and the Company is preparing to invest in IT system requirements . SFNC's expected reporting timeline is : Audit & Compliance Regulatory Cost (1) To strengthen the Audit and Regulatory Compliance groups, as well as to prepare for the increased regulatory requirements associated with exceeding $10 billion in assets, the Company has incurred, and estimates it will incur, the following costs: Durbin Amendment The Durbin amendment, passed as part of the Dodd - Frank, required the Federal Reserve to limit fees charged to retailers for debit card processing . For financial institution's with total of $ 10 billion or more as of December 31 st , the debit card fees are reduced beginning on July 1 st of the following year . Due to the acquisition of OKSB, SFNC expects to exceed the $ 10 billion threshold on December 31 , 2017 . The effective date for the impact of the Durbin Amendment is expected to be July 1 , 2018 . SFNC's estimated reduction in debit card fees per year is : Page 20 $10 Billion Threshold (Dodd - Frank potential impact) (1) Does not include pending or future acquisitions. (2) Pro forma shares outstanding of approximately 46 million, which includes the acquisition of Hardeman County Investment Company, OKSB and First Texas BHC. • "As of" date for first stress test - December 31, 2019 • First stress test reporting date - July 31, 2020 • First public disclosure - October 15 - 31, 2020 • 2017 - $0 • 2018 - $3.8 million after - tax, or $0.08 per share (2) • 2019 - $7.5 million after - tax, or $0.16 per share (2) • 2015 - $4.1 million • 2016 - $7.0 million • 2017 - $9.3 million (projected)
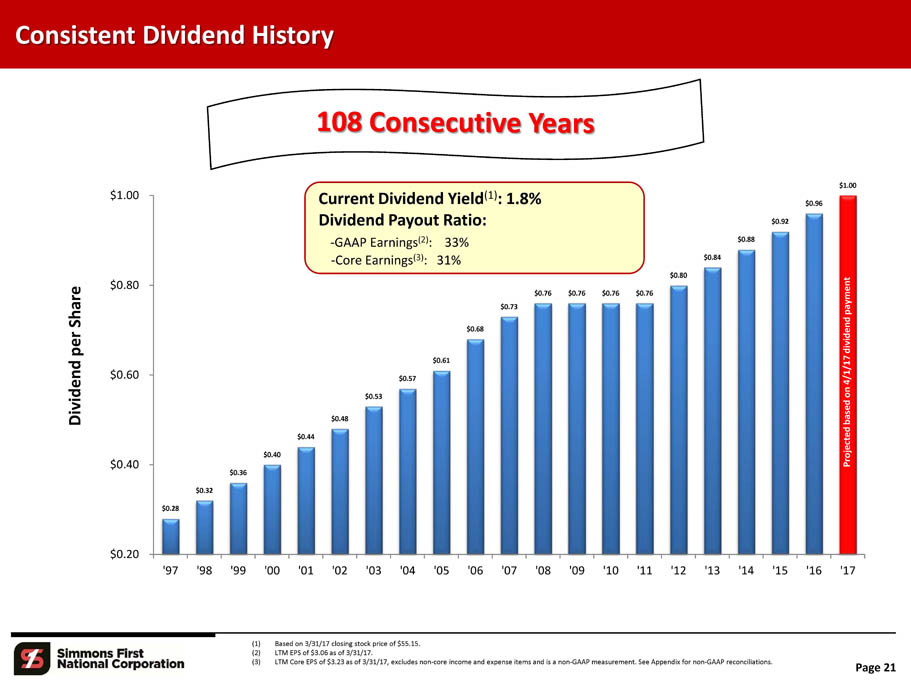
$0.32 $0.28 $0.36 $0.40 $0.53 $0.48 $0.44 $0.57 $0.73 $0.68 $0.61 $0.76 $0.76 $0.76 $0.76 $0.80 $0.84 $0.88 $0.92 $0.96 $1.00 $ 0 . 40 $ 0 . 60 $ 0 . 80 $ 1 . 00 $0.20 ' 9 7 ' 9 8 ' 9 9 ' 0 0 ' 0 1 ' 0 2 ' 0 3 ' 0 4 ' 0 5 ' 0 6 ' 0 7 ' 0 8 ' 0 9 ' 1 0 ' 1 1 ' 1 2 ' 1 3 ' 1 4 ' 1 5 ' 1 6 ' 1 7 Di v idend per S ha r e Pr oj e ct ed b a sed o n 4/1/17 d i v i dend p a y m ent Current Dividend Yield (1) : 1.8% Dividend Payout Ratio: - GAAP Earnings (2) : 33% - Core Earnings (3) : 31% Page 21 (1) (2) (3) Based on 3/31/17 closing stock price of $55.15. LTM EPS of $3.06 as of 3/31/17. LTM Core EPS of $3.23 as of 3/31/17, excludes non - core income and expense items and is a non - GAAP measurement. See Appendix for non - GAAP reconciliations. Consistent Dividend History

- 25 - 10 5 20 35 50 Mar - 2016 Jun - 2016 Sep - 2016 T o t al R e turn (% ) Dec - 2016 SFN C Mar - 2017 SNL Mid Cap Bank 1 Year Total Shareholder Return (Dividends + Stock Appreciation) S F N C Note: Stock Price $55.15 as of 3/31/17 Source: SNL Financial Page 22 25% SNL Mid Cap U.S. Bank Index 40% 3/31/16 – 3/31/17

60 40 20 0 - 20 80 100 M a r - 14 J u n - 14 Se p - 14 D e c - 14 M a r - 15 J u n - 15 Se p - 15 D e c - 15 M a r - 16 J u n - 1 6 Se p - 16 D e c - 16 M a r - 17 T o t al R e turn (% ) SFN C SNL Mid Cap Bank 3 Year Total Shareholder Return (Dividends + Stock Appreciation) S F N C Note: Stock Price $55.15 as of 3/31/17 Source: SNL Financial Page 23 57% SNL Mid Cap U.S. Bank Index 45% 3/31/14 – 3/31/17
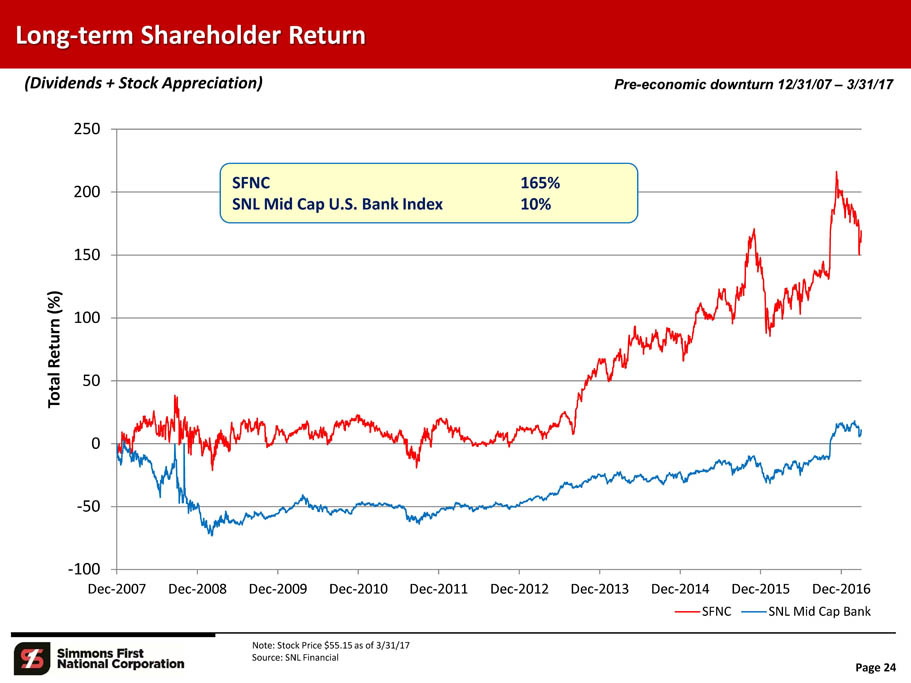
150 100 50 0 - 50 - 100 200 250 D e c - 20 0 7 D e c - 20 0 8 D e c - 20 0 9 D e c - 20 1 0 D e c - 20 1 1 D e c - 20 1 2 D e c - 20 1 3 T o t al R e turn (% ) Dec - 2014 SFN C Dec - 2015 Dec - 2016 SNL Mid Cap Bank Long - term Shareholder Return (Dividends + Stock Appreciation) S F N C Note: Stock Price $55.15 as of 3/31/17 Source: SNL Financial Page 24 165 % SNL Mid Cap U.S. Bank Index 10 % Pre - economic downturn 12/31/07 – 3/31/17

Market Data as of 3/31/17 SFNC Stock Price $55.15 52 week price range $42.20 - $66.40 Common Shares Outstanding 31.4 million Market Capitalization $1.7 billion % Institutional Ownership 51% Valuation & Per Share Data Price/LTM EPS (as of 3/31/17) 18.0x Price/LTM Core EPS (as of 3/31/17) (1) 17.1x Price/2017 Consensus EPS (2) 16.6x Price/2018 Consensus EPS (2) 13.3x Price/Book Value 1.5x Price/Tangible Book Value 2.3x Source: SNL Financial (1) LTM Core EPS excludes non - core income and expense items and is a non - GAAP measurement. See Appendix for non - GAAP reconciliations. (2) Based upon the Company's five analyst consensus EPS of $3.32 for 2017 and $4.16 for 2018, as of 4/26/17. Page 25 Investment Profile

▪ "Table Stakes" □ Asset Quality □ Regulatory Compliance ▪ Internal revenue opportunities ▪ Efficiency initiatives ▪ Branding in new markets and product enhancement ▪ $10 billion threshold ▪ Acquisitions ▪ Traditional banking – enhance current footprint and consider expanding into adjoining states (inside - out strategy) ▪ Non - banking – trust, investments, insurance and credit card Strategic Focus Page 26

▪ Multiple paths to potential above - average earnings growth □ M&A accretion, cost savings and revenue enhancements □ Continued efficiency initiatives □ Organic legacy loan growth ▪ Experienced and deep management ▪ Exceptional balance sheet ▪ Consistent historical earnings performance ▪ Attractive dividend yield and total shareholder return Committed to delivering a sophisticated and diverse range of products with the service level of a community bank Why Simmons First? Page 27

SUPP L E M E N T AL INFORMATION Page 28

Overview of SWB SWB Footprint Headquarters Year Established Branches CEO Overview ▪ Founded in 1963 ▪ Headquartered in Fort Worth, Texas ▪ Operates 16 branches in the Dallas/Fort Worth Metroplex ▪ Offers personal and business banking, wealth management and mortgage services Financial Highlights Fort Worth, TX 1963 16 Vernon Bryant Total Assets Total Loans & Leases (Incl. HFS) Total Deposits Loans / Deposits % Core Deposits $ 2,018,711 1,758,879 1,514,579 116.1% 94.7% ROAA ROAE R O A T C E Net Interest Margin Efficiency Ratio NPAs / Assets NPAs / Loans + REO C&D Concentration CRE Concentration 1.09% 9.60% 11.58% 3.86% 59. 8% 0.14% 0.16% 106. 1% 363. 6% First Texas (16) Dollars in thousands Source: SNL Financial Data as of or for the three months ended 9/30/16 Note: Core deposits defined as total deposits less jumbo time deposits greater than $250,000 Page 29

Overview of OKSB OKSB Footprint Financial Highlights Overview ▪ Founded in 1894 (Bank SNB) ▪ Headquartered in Stillwater, OK ▪ Operates 31 branches throughout Colorado, Kansas, Oklahoma and Texas ▪ Offers commercial and consumer lending, deposit services, specialized cash management and other financial services Southwest (31) $ Total Assets Total Gross Loans Total Deposits Loans / Deposits % Core Deposits 2,468,042 1,880,112 1,947,924 96.1% 93.4% ROAA ROAE R O A T CE Net Interest Margin Efficiency Ratio 0 . 71 % 6 . 00 % 6 . 38 % 3 . 43 % 64 . 8 % NPAs / Assets NPAs / Loans + REO 1 . 11 % 1 . 46 % C&D Concentration CRE Concentration 11 . 0 % 43 . 9 % Dollars in thousands Source: SNL Financial Data as of or for the three months ended 9/30/16 Note: Core deposits defined as total deposits less jumbo time deposits greater than $250,000 Page 39
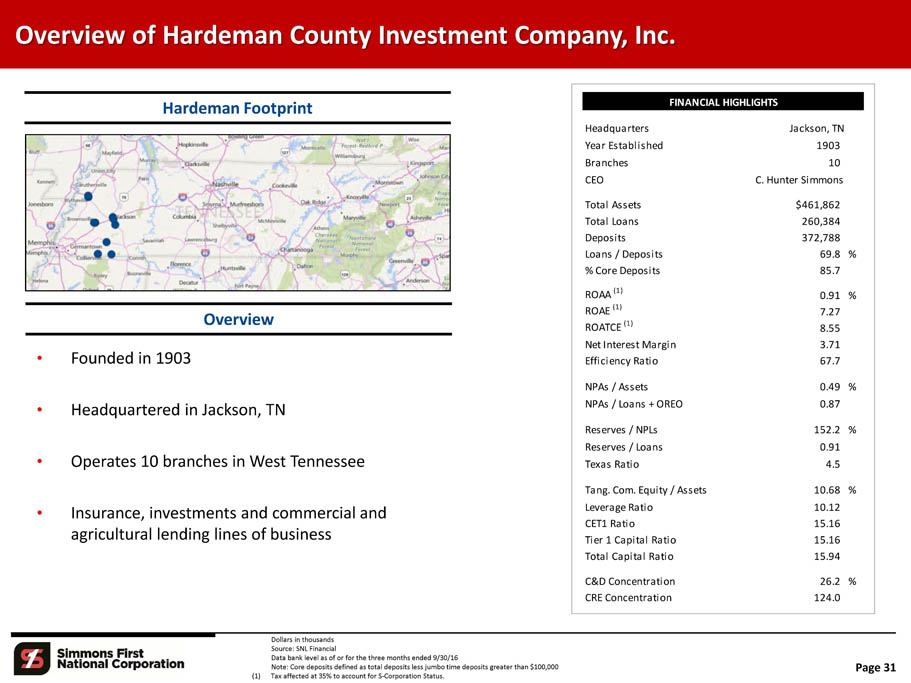
Page 31 Overview of Hardeman County Investment Company, Inc. Hardeman Footprint Overview • Founded in 1903 • Headquartered in Jackson, TN • Operates 10 branches in West Tennessee • Insurance, investments and commercial and agricultural lending lines of business Dollars in thousands Source: SNL Financial Data bank level as of or for the three months ended 9/30/16 Note: Core deposits defined as total deposits less jumbo time deposits greater than $100,000 (1) Tax affected at 35% to account for S - Corporation Status. FINANCIAL HIGHLIGHTS Headquarters Year Established Jackson, TN 190 3 Branches 1 0 CEO C. Hunter Simmons Total Assets $461 , 86 2 Total Loans 260 , 38 4 Deposits 372 , 78 8 Loans / Deposits 69 . 8 % % Core Deposits 85 . 7 ROAA (1) 0 . 9 1 % ROAE (1) 7 . 2 7 ROATCE (1) 8 . 5 5 Net Interest Margin 3 . 7 1 Efficiency Ratio 67 . 7 NPAs / Assets 0 . 4 9 % NPAs / Loans + OREO 0 . 8 7 Reserves / NPLs 152 . 2 % Reserves / Loans 0 . 9 1 Texas Ratio 4 . 5 Tang. Com. Equity / Assets 10 . 6 8 % Leverage Ratio 10 . 1 2 CET1 Ratio 15 . 1 6 Tier 1 Capital Ratio 15 . 1 6 Total Capital Ratio 15 . 9 4 C&D Concentration 26 . 2 % CRE Concentration 124 . 0

11.0% 9.6% 9.4% 7.8% 7.4% 6.1% 5.9% 7.3% 4.5% 5.8% Oklahoma Stillwater Denver City San A n t oni o D / F W Wichita Austin U S A S F N C SFNC Pro Forma Expansion into Attractive Markets Page 32 '17 – '22 Projected Population Growth (%) '17 – '22 Projected Median HHI Growth (%) Source: SNL Financial Deposit data as of 6/30/16 SFNC demographic data deposit weighted by county Projected 2022 Median Household Income ($) 10.0% 8.4% 8.1% 8.1% 6.3% 4.4% 2.3% 3.8% 1.1% 2.8% Austin San A n t oni o D / F W Denver Oklahoma Stillwater Wichita City U S A SFNC SFNC Pro Forma $76,838 $70,417 $68,553 $62,535 $60,767 $57,253 $44,508 $61,639 $45,615 $49,807 Denver Austin D/FW Oklahoma San City Antonio W i chit a S ti l l w a t e r U S A S F N C SFNC Pro Forma

Yield on Total Loans 4.77% 9 % 17 % 2 % 4% 15 % 19 % 19 % 3 % Pro Forma Loan Composition Pro Forma Yield on Total Loans: 4.86% 7 % 3 % 5% 15 % 5 % 14 % Yield on Total Loans: 4.48% 11 % 9 % 2% 4 % 17 % 29 % 0% 2% Loans ($000) Loans ($000) Loans ($000) Loans ($000) Construction & Land $383 , 874 7% Construction & Land $206 , 672 11% Construction & Land $245 , 238 14% Construction & Land $835 , 784 9% 1 - 4 Family 1 , 224 , 314 22% 1 - 4 Family 162 , 459 9% 1 - 4 Family 213 , 294 12% 1 - 4 Family 1 , 600 , 067 17% Home Equity Loans 174 , 636 3% Home Equity Loans 31 , 219 2% Home Equity Loans 21 , 767 1% Home Equity Loans 227 , 622 2% Multi - Family 287 , 070 5% Multi - Family 71 , 335 4% Multi - Family 34 , 087 2% Multi - Family 392 , 492 4% CRE - Owner - Occupied 857 , 724 15% CRE - Owner - Occupied 320 , 506 17% CRE - Owner - Occupied 174 , 485 10% CRE - Owner - Occupied 1 , 352 , 715 15% CRE - Income Producing 727 , 141 13% CRE - Income Producing 500 , 318 27% CRE - Income Producing 560 , 276 32% CRE - Income Producing 1 , 787 , 735 19% C&I 945 , 526 17% C&I 540 , 089 29% C&I 267 , 367 15% C&I 1 , 752 , 982 19% Agriculture 285 , 751 5% Agriculture 1 , 647 0% Agriculture 22 , 496 1% Agriculture 309 , 894 3% Consumer & Other 803,704 14% Consumer & Other 45,867 2% Consumer & Other 219,869 13% Consumer & Other 1,069,440 11% Total $5,689,740 100% Total $1,880,112 100% Total $1,758,879 100% Total $9,328,731 100% Yield on Total Loans: 4.78% 14 % 12 % 1 % 2 % 10 % 32 % 1 % 13 % S W B O K S B SFNC (1) Dollars in thousands Source: SNL Financial (1) SFNC pro forma for acquisition of Hardeman County Investment Company. Data bank level as of 9/30/16 Page 33 22% 13 % 27% 11% 17% 15%

Pro Forma Deposit Composition Pro Forma S W B O K S B SFNC (1) Cost of Total Deposits: 0.24% 7 % 3 % 11 % 10 % Cost of Total Deposits: 0.32% 5% 1% 62 % 18 % Cost of Total Deposits: 0.54% 1 % 59 % 1 % 10 % Deposits ($000) Deposits ($000) Deposits ($000) Deposits ($000) Demand Deposits $506 , 969 7% Demand Deposits $95 , 766 5% Demand Deposits $430 , 879 28% Demand Deposits $1 , 033 , 614 10% NOW & Other 218 , 458 3% NOW & Other 15 , 719 1% NOW & Other 16 , 113 1% NOW & Other 250 , 290 2% MMDA & Savings 4 , 833 , 972 69% MMDA & Savings 1 , 216 , 859 62% MMDA & Savings 889 , 642 59% MMDA & Savings 6 , 940 , 473 66% Retail CDs 736 , 391 11% Retail CDs 271 , 604 14% Retail CDs 20 , 919 1% Retail CDs 1 , 028 , 914 10% Jumbo CDs 694,379 10% Jumbo CDs 347,976 18% Jumbo CDs 157,026 10% Jumbo CDs 1,199,381 11% Total Deposits $6,990,169 100% Total Deposits $1,947,924 100% Total Deposits $1,514,579 100% Total Deposits $10,452,672 100% Cost of Total Deposits: 0.30% 10 % Dollars in thousands Source: SNL Financial (1) SFNC pro forma for acquisition of Hardeman County Investment Company. Data bank level as of 9/30/16 Page 34 2 % 69 % 66 % 10 % 11% 28% 14%

Pro Forma Deposit Composition by State Pro Forma S W B O K S B SFNC (1) 32 % 14 % 1 % 80 % 10 % 3 % 7 % Arkansas $3 , 697 , 83 7 53% Oklahoma $1 , 540 , 30 4 80% Texas $1,416,303 100% Arkansas $3,697,837 36% Tennessee 2 , 251 , 40 7 32% Texas 190 , 47 4 10% Texas $1,416,303 100% Tennessee 2,251,407 22% Missouri 975 , 12 9 14% Colorado 49 , 53 1 3% Missouri 975,129 9% Kansas 66 , 05 2 1% Kansas 133 , 78 6 7% Kansas 199,838 2% Total Deposits $6,990,425 100% Total Deposits $1,914,095 100% Oklahoma 1,540,304 15% Texas 1,606,777 16% Colorado 49,531 0% T o t a l $10,320,823 100% 36 % Dollars in thousands Source: SNL Financial (1) SFNC pro forma for acquisition of Hardeman County Investment Company. Note: FDIC deposit data as of 6/30/16 Page 35 100% 22% Deposits ($000) Deposits ($000) Deposits ($000) Deposits ($000) 9 % 2 % 15 % 16 % 0 % 53%

Stock Price Performance – 10/25/16 through 3/31/17 Source: SNL Financial U.S. Election 11/8/16 85 . 0 % 90 . 0 % 95 . 0 % 10 0 . 0 % 10 5 . 0 % 11 0 . 0 % 11 5 . 0 % 12 0 . 0 % 12 5 . 0 % 13 0 . 0 % 13 5 . 0 % 14 0 . 0 % 14 5 . 0 % 15 0 . 0 % 15 5 . 0 % 16 0 . 0 % 10 / 25 / 1 6 11 / 19 / 1 6 12 / 14 / 1 6 1/8/17 2/2/17 2 / 27/ 1 7 3 / 24/ 1 7 NASDAQ Bank 22.9% SFNC 11.8% OKSB 34.8% Page 36

APPENDIX Page 37
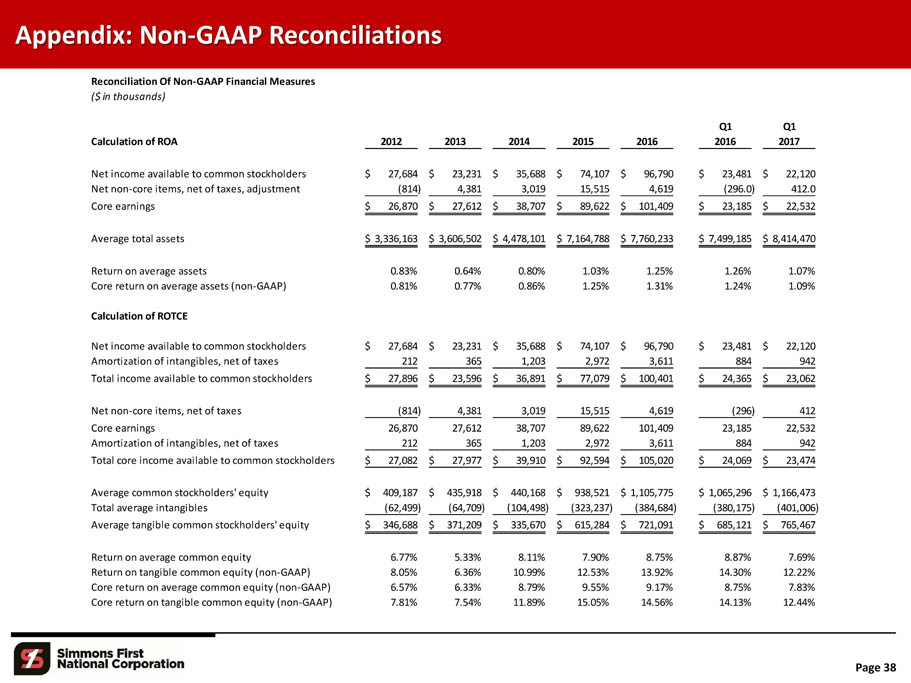
Appendix: Non - GAAP Reconciliations Page 38 Reconciliation Of Non - GAAP Financial Measures ($ in thousands) Calculation of ROA 2012 201 3 201 4 201 5 201 6 Q1 2016 Q1 2017 Net income available to common stockholders $ 27,684 $ 23 , 231 $ 35 , 688 $ 74 , 107 $ 96 , 790 $ 23,481 $ 22 , 120 Net non - core items, net of taxes, adjustment ( 814 ) 4 , 381 3 , 019 15 , 515 4 , 619 ( 296 . 0 ) 412 . 0 Core earnings $ 26,870 $ 27 , 612 $ 38 , 707 $ 89 , 622 $ 101,409 $ 23,185 $ 22 , 532 Average total assets $ 3,336,163 $ 3,606,502 $ 4,478,101 $ 7,164,788 $ 7,760,233 $ 7,499,185 $ 8,414,470 Return on average assets 0 . 83% 0 . 64% 0 . 80% 1 . 03% 1 . 25% 1 . 26% 1 . 07% Core return on average assets (non - GAAP) 0 . 81% 0 . 77% 0 . 86% 1 . 25% 1 . 31% 1 . 24% 1 . 09% Calculation of ROTCE Net income available to common stockholders $ 27,684 $ 23 , 231 $ 35 , 688 $ 74 , 107 $ 96 , 790 $ 23,481 $ 22 , 120 Amortization of intangibles, net of taxes 212 365 1 , 203 2 , 972 3 , 611 884 942 Total income available to common stockholders $ 27,896 $ 23 , 596 $ 36 , 891 $ 77 , 079 $ 100,401 $ 24,365 $ 23 , 062 Net non - core items, net of taxes ( 814 ) 4 , 381 3 , 019 15 , 515 4 , 619 ( 296 ) 412 Core earnings 26 , 870 27 , 612 38 , 707 89 , 622 101 , 409 23 , 185 22 , 532 Amortization of intangibles, net of taxes 212 365 1 , 203 2 , 972 3 , 611 884 942 Total core income available to common stockholders $ 27,082 $ 27 , 977 $ 39 , 910 $ 92 , 594 $ 105,020 $ 24,069 $ 23 , 474 Average common stockholders' equity $ 409,187 $ 435,918 $ 440,168 $ 938,521 $ 1,105,775 $ 1,065,296 $ 1,166,473 Total average intangibles ( 62 , 499 ) ( 64 , 709 ) ( 104 , 498 ) ( 323 , 237 ) ( 384 , 684 ) ( 380 , 175 ) ( 401 , 006 ) Average tangible common stockholders' equity $ 346,688 $ 371,209 $ 335,670 $ 615,284 $ 721,091 $ 685,121 $ 765,467 Return on average common equity 6 . 77% 5 . 33% 8 . 11% 7 . 90% 8 . 75% 8 . 87% 7 . 69% Return on tangible common equity (non - GAAP) 8 . 05% 6 . 36% 10 . 99% 12 . 53% 13 . 92% 14.30% 12 . 22% Core return on average common equity (non - GAAP) 6 . 57% 6 . 33% 8 . 79% 9 . 55% 9 . 17% 8 . 75% 7 . 83% Core return on tangible common equity (non - GAAP) 7 . 81% 7 . 54% 11 . 89% 15 . 05% 14 . 56% 14.13% 12 . 44%

Appendix: Non - GAAP Reconciliations Reconciliation Of Non - GAAP Financial Measures ($ in thousands) Q1 Q1 Calculation of Core Earnings 2012 201 3 2014 2015 2016 2016 2017 Net Income $ 27,684 $ 23 , 231 $ 35,688 $ 74,107 $ 96,790 $ 23,481 $ 22,120 Non - core items Accelerated vesting on retirement agreements - - - 2 , 209 - - - Gain on sale of merchant services - - ( 1 , 000) - - - - Gain on sale of banking operations - - - ( 2 , 110) - - - Gain from early retirement of trust preferred securities - - - - ( 594) ( 594) - Loss on FDIC loss - share termination/Gain on FDIC - assisted transactions (3,411) - - 7 , 476 - - - Merger - related costs 1,896 6,376 7,470 13 , 760 4 , 835 93 524 Change - in - control payments - - 885 - - - - Loss on sale of securities - 193 - - - - - FHLB prepayment penalties 175 - - - - - - Branch right - sizing - 64 1 ( 3 , 059) 3 , 144 3 , 359 14 154 Charter consolidation costs - - 652 - - - - Tax effect (1) 52 6 ( 2 , 829 ) ( 1 , 929 ) ( 8 , 964 ) ( 2 , 981 ) 191 ( 266 ) Net non - core items (814 ) 4,381 3,019 15 , 515 4 , 619 ( 296 ) 412 Diluted core earnings per share (non - GAAP) $ 26,870 $ 27,612 $ 38,707 $ 89 , 622 $ 101,409 $ 23 , 185 $ 22 , 532 (1) Effective tax rate of 39.225%, adjusted for non - deductible merger - related costs. Page 39
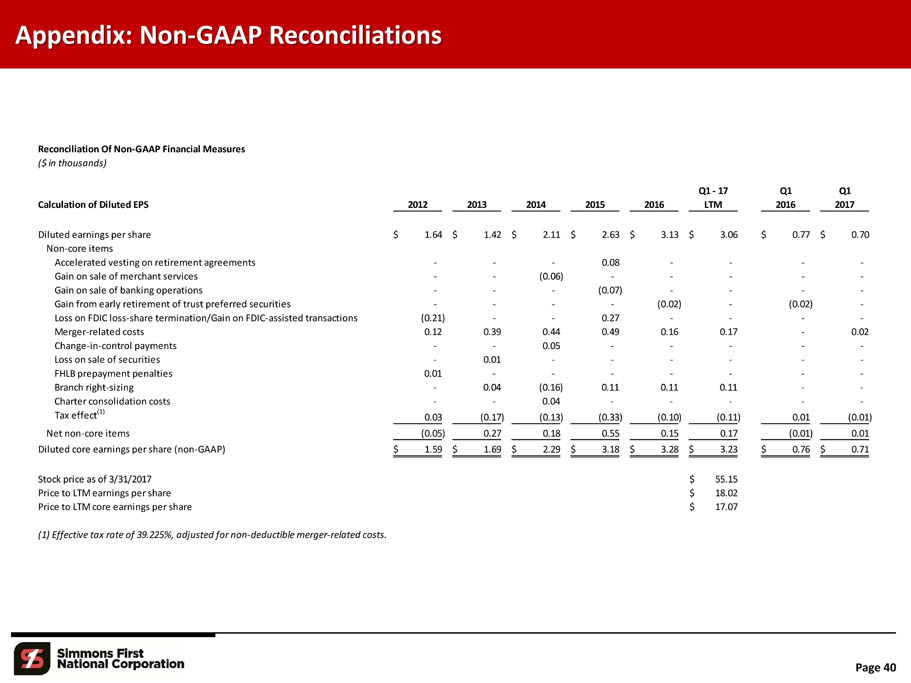
Appendix: Non - GAAP Reconciliations Page 40 Reconciliation Of Non - GAAP Financial Measures ($ in thousands) Q1 - 17 Q1 Q1 Calculation of Diluted EPS 201 2 2013 2014 2015 2016 LTM 2016 2017 Diluted earnings per share $ 1 . 64 $ 1.42 $ 2.11 $ 2.63 $ 3.13 $ 3.06 $ 0.77 $ 0.70 Non - core items Accelerated vesting on retirement agreements - - - 0 . 08 - - - - Gain on sale of merchant services - - ( 0 . 06) - - - - - Gain on sale of banking operations - - - ( 0 . 07) - - - - Gain from early retirement of trust preferred securities - - - - ( 0 . 02) - ( 0 . 02) - Loss on FDIC loss - share termination/Gain on FDIC - assisted transactions ( 0 . 21) - - 0 . 27 - - - - Merger - related costs 0 . 12 0 . 39 0 . 44 0 . 49 0 . 16 0 . 17 - 0 . 02 Change - in - control payments - - 0 . 05 - - - - - Loss on sale of securities - 0 . 01 - - - - - - FHLB prepayment penalties 0 . 01 - - - - - - - Branch right - sizing - 0 . 04 ( 0 . 16) 0 . 11 0 . 11 0 . 11 - - Charter consolidation costs - - 0 . 04 - - - - - Tax effect (1) 0 . 03 ( 0 . 17 ) ( 0 . 13 ) ( 0 . 33 ) ( 0 . 10 ) ( 0 . 11 ) 0 . 01 ( 0 . 01 ) Net non - core items ( 0 . 05 ) 0 . 27 0 . 18 0 . 55 0 . 15 0 . 17 ( 0 . 01 ) 0 . 01 Diluted core earnings per share (non - GAAP) $ 1 . 59 $ 1 . 69 $ 2 . 29 $ 3 . 18 $ 3 . 28 $ 3 . 23 $ 0 . 76 $ 0 . 71 Stock price as of 3/31/2017 $ 55 . 15 Price to LTM earnings per share $ 18 . 02 Price to LTM core earnings per share $ 17 . 07 (1) Effective tax rate of 39.225%, adjusted for non - deductible merger - related costs.

Appendix: Non - GAAP Reconciliations Page 41 Reconciliation Of Non - GAAP Financial Measures ($ in thousands) Calculation of Efficiency Ratio 201 2 201 3 2014 201 5 2016 Q1 2016 Q1 2017 Non - interest expense $ 117 , 733 $ 134 , 812 $ 175,721 $ 256 , 970 $ 255,085 $ 61 , 789 $ 66 , 322 Non - core non - interest expense adjustment ( 2 , 071) ( 7 , 017) ( 13 , 747) ( 18 , 747) ( 8 , 435) ( 107) ( 635) Other real estate and foreclosure expense adjustment ( 992) ( 1 , 337) ( 4 , 507) ( 4 , 861) ( 4 , 389) ( 966) ( 550) Amortization of intangibles adjustment ( 348 ) ( 601 ) (1,979 ) ( 4 , 889 ) (5,942 ) ( 1 , 455 ) ( 1 , 550 ) Efficiency ratio numerator $ 114 , 322 $ 125 , 857 $ 155,488 $ 228 , 473 $ 236,319 $ 59 , 261 $ 63 , 587 Net - interest income $ 113 , 517 $ 130 , 850 $ 171,064 $ 278 , 595 $ 279,206 $ 70 , 232 $ 72 , 380 Non - interest income 48 , 371 40 , 616 62 , 192 94 , 661 139,382 29 , 503 30 , 060 Non - core non - interest income adjustment ( 3 , 411) 193 ( 8 , 780) 5 , 731 ( 835) ( 594) 43 Fully tax - equivalent adjustment 4 , 705 4 , 951 6 , 840 8 , 517 7 , 722 2 , 084 1 , 965 (Gain) loss on sale of securities ( 2 ) 151 (8 ) ( 307 ) (5,848 ) ( 329 ) ( 63 ) Efficiency ratio denominator $ 163 , 180 $ 176 , 761 $ 231,308 $ 387 , 197 $ 419,627 $ 100 , 896 $ 104 , 385 Efficiency ratio 70 . 06% 71 . 20% 67.22% 59 . 01% 56.32% 58 . 73% 60 . 92%

Appendix: Non - GAAP Reconciliations Page 42 Reconciliation Of Non - GAAP Financial Measures ($ in thousands) Calculation of Core Net Interest Margin 2015 YTD 2016 YTD Q1 2016 Q1 2017 Net interest income $ 278,595 $ 279,206 $ 70 , 232 $ 72 , 380 FTE adjustment 8,517 7,722 2 , 084 1 , 965 Fully tax equivalent net interest income 287 , 112 286,928 72 , 316 74 , 345 Total accretable yield (46,131 ) (24,257 ) ( 8 , 077 ) ( 4 , 427 ) Core net interest income $ 240,981 $ 262,671 $ 64 , 239 $ 69 , 918 Average earning assets $ 6,305,966 $ 6,855,322 $ 6 , 597 , 389 $ 7 , 469 , 709 Net interest margin 4 . 55% 4.19% 4 . 41% 4 . 04% Core net interest margin (non - GAAP) 3 . 82% 3.83% 3 . 92% 3 . 80% Calculation of Tangible Book Value per Share March 2017 Total common stockholders' equity $ 1 , 170 , 889 Total intangibles ( 401 , 443 ) Tangible common stockholders' equity $ 769 , 446 Shares of common stock outstanding 31 , 388 , 357 Book value per common share $ 37 . 30 Tangible book value per common share (non - GAAP) $ 24 . 51 Stock price as of 12/31/2016 $ 55 . 15 Price to book value per share $ 1 . 48 Price to tangible book value per share $ 2 . 25

NASDAQ - GS: SFNC Pine Bluff – Corporate Headquarters Little Rock Corporate Office