Attached files
| file | filename |
|---|---|
| 8-K - 8-K - APARTMENT INVESTMENT & MANAGEMENT CO | a8-kmay2017investorpresent.htm |
1
INVESTOR PRESENTATION
MAY 2017
ON PROSPECT

2
AIMCO QUICK FACTS
$52 NAV
per share
$12 Billion
Gross Asset Value
10% Five-
Year AFFO
CAGR
141 Apartment
Communities
12%
Five-Year Economic
Income CAGR
12 Primary Markets $1,996
Avg Revenue per
Apartment Home
2003
Added to S&P
500
39K Apartment Homes
6.7x
Leverage-to-
EBITDA
SHAREHOLDER GOAL
Aimco seeks to earn long-term returns on equity that are superior to those of the equity REIT and S&P 500
indices, and also those of peer apartment REITs, by investing in a portfolio of high quality multifamily
communities, diversified by both geography and price point, whose cash flows are predictable and rising.
(1) Peer group consists of AvalonBay, Camden, Equity Residential, Essex, MAA and UDR. Source for peer simple average: KeyBanc Capital Markets in its Leaderboard.
(2) Represents price-to-projected 2017 AFFO.
(3) Price-to-Earnings to AFFO Growth Rate ratio.
AIV, 12.2%
MSCI US REIT Index, 10.6%
S&P 500, 9.5%
DJIA, 7.7%
Total Shareholder Return Since IPO
7/22/94 - 12/31/16
Valuation Metrics
As of May 5, 2017
Aimco
Peer
Average(1)
Price-to-Earnings(2) 20.74x 22.13x
2017 AFFO Growth Rate 7.6% 2.1%
Price-to-NAV 85% 100%
PEG Ratio(3) 2.72 10.37
3
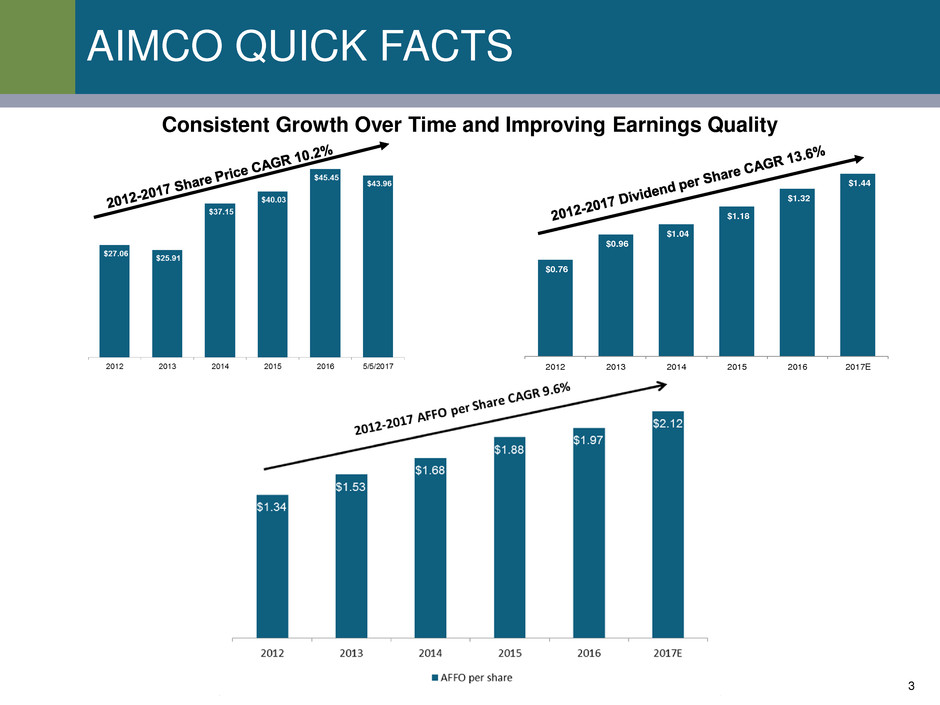
AIMCO QUICK FACTS
$0.76
$0.96
$1.04
$1.18
$1.32
$1.44
2012 2013 2014 2015 2016 2017E
Consistent Growth Over Time and Improving Earnings Quality

4
• Aimco’s projected 2017 AFFO growth of 7.6% is comprised of NOI increases of $0.12 in Same Store and $0.19 from other
communities, primarily contributions from those in lease-up or redevelopment, leading to core earnings growth.
• These increases more than offset the decline in NOI from 2016 property sales, the proceeds of which were used to fund
the acquisition of Indigo and to pre-fund redevelopment efforts, plus the decline in Other Earnings related to the runoff of
the Asset Management business and lower tax related benefits.
• The funding of redevelopment efforts paves the way for future earnings growth, while the decline in Other Earnings
contributes to higher quality AFFO.
AIMCO QUICK FACTS

5
LEADERSHIP TEAM
Terry Considine
Chairman & CEO
Paul Beldin
EVP &
Chief Financial
Officer
Keith Kimmel
EVP
Property
Operations
Lisa Cohn
EVP &
General Counsel
Miles Cortez
EVP &
Chief Administrative
Officer
Development
John Bezzant
EVP &
Chief Investment
Officer
Patti Fielding
EVP
Redevelopment
Legal
Human Resources
Risk
Asset Quality
Acquisitions
Dispositions
Administration
Government Relations
Communications
Special Projects
Finance
Accounting
Investor Relations
Information
Technology
Property
Operations
Redevelopment
Capital Investment
6
MULTIFAMILY LANDSCAPE
(1) U.S. Census Bureau, Current Population Survey/Housing Vacancy Survey
(2) Aimco estimate based on projections made by John Burns Real Estate Consulting and included in the book Big Shifts Ahead: Demographic Clarity for Businesses written by John Burns
and Chris Porter, published by Advantage Media Group (October 11, 2016).
(3) Bureau of Labor Statistics
(4) Moody’s Economy.com
(5) Green Street Advisors, 2017 U.S. Apartment Outlook, January 2017
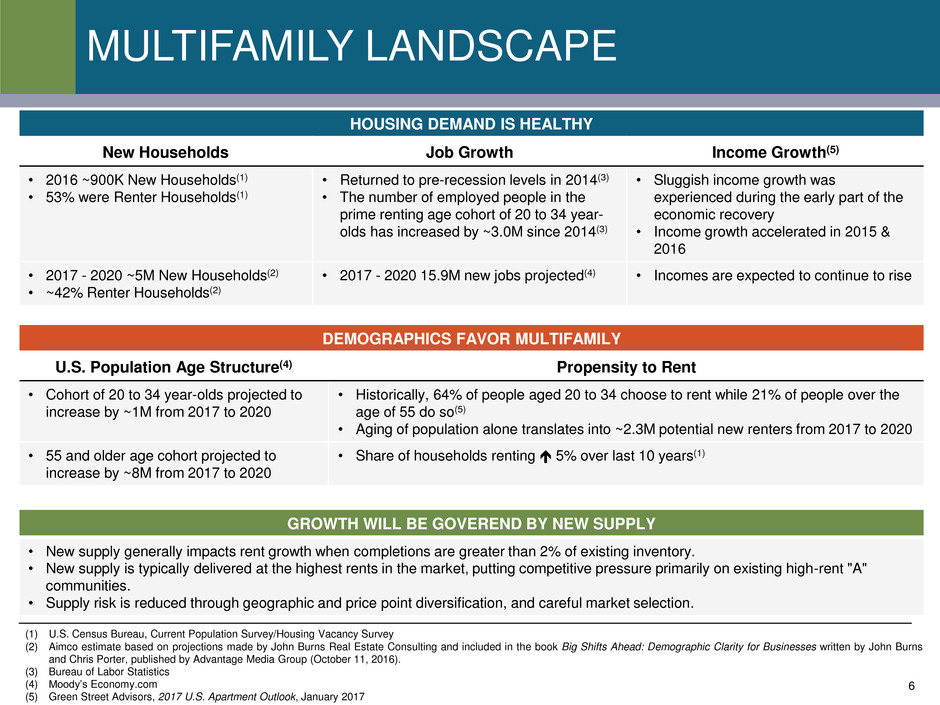
HOUSING DEMAND IS HEALTHY
New Households Job Growth Income Growth(5)
• 2016 ~900K New Households(1)
• 53% were Renter Households(1)
• Returned to pre-recession levels in 2014(3)
• The number of employed people in the
prime renting age cohort of 20 to 34 year-
olds has increased by ~3.0M since 2014(3)
• Sluggish income growth was
experienced during the early part of the
economic recovery
• Income growth accelerated in 2015 &
2016
• 2017 - 2020 ~5M New Households(2)
• ~42% Renter Households(2)
• 2017 - 2020 15.9M new jobs projected(4) • Incomes are expected to continue to rise
DEMOGRAPHICS FAVOR MULTIFAMILY
U.S. Population Age Structure(4) Propensity to Rent
• Cohort of 20 to 34 year-olds projected to
increase by ~1M from 2017 to 2020
• Historically, 64% of people aged 20 to 34 choose to rent while 21% of people over the
age of 55 do so(5)
• Aging of population alone translates into ~2.3M potential new renters from 2017 to 2020
• 55 and older age cohort projected to
increase by ~8M from 2017 to 2020
• Share of households renting 5% over last 10 years(1)
GROWTH WILL BE GOVEREND BY NEW SUPPLY
• New supply generally impacts rent growth when completions are greater than 2% of existing inventory.
• New supply is typically delivered at the highest rents in the market, putting competitive pressure primarily on existing high-rent "A"
communities.
• Supply risk is reduced through geographic and price point diversification, and careful market selection.

7
STRATEGIC OBJECTIVES
Operational Excellence Redevelopment
Focus on Total Contribution to
AFFO
• Lower resident turnover
through careful customer
selection and emphasis on
measured customer
satisfaction
• Control costs by focusing on
productivity while maintaining
asset quality and a high level of
customer service
• 2017 Guidance
o Revenue 3.25%-4.25%
o Expenses 2.50%-3.00%
o NOI 3.50%-5.00%
Add Value by Repositioning
Properties Within Existing
Portfolio
• Invest up to 3% of GAV
annually
• Current projects are
expected to create value
>35% of our investment
• 2017 Guidance
o Invest $100M - $200M
Portfolio Management
Reduce Revenue Volatility
Through Portfolio Design and
Customer Selection
• Diversify by geography
across 12 primary markets
• Diversify by price point with
~50% "A" communities and
~50% "B/C+" communities
• Select highly qualified
residents
o Higher earnings are
correlated with an older,
more stable customer
o Median income of new
residents in 1Q 2017
was $100,000, up 5%
year-over-year
o Average age of new
residents in 1Q 2017
was 36
• 2017 Guidance
o Year-end average
revenue per apartment
home ~$2,050
Balance Sheet
Limit Risk Through Balance
Sheet Structure
• Finance with long-term,
fixed-rate, amortizing, non-
recourse property debt and
preferred securities
• Maintain investment-grade
rating
• Weighted-average maturity
of 9 years is ~50% longer
than peer average
• Aimco has the lowest
refunding and repricing risk
among peer group
• 2017 Guidance
o Year-end Leverage:
EBITDA ~6.4x
Team and Culture
Intentional focus on talent development and succession planning results in a strong, stable team that
engenders a collaborative and productive culture which is the underpinning of Aimco's success.

8
PROPERTY OPERATIONS STRATEGY
STRATEGY PROVIDES FOR
• Greater NOI contribution: Renewal lease rate increases are generally
higher than new lease rate increases; renewals avoid costs associated
with turnover: higher vacancy, refurbishment, and marketing.
• More predictable operating results: Renewal lease rate increases are
less volatile; operating costs more predictable.
PRODUCE ABOVE-AVERAGE
OPERATING RESULTS
• Focus on customer selection, customer
satisfaction, resident retention, and
superior cost control.
• Focus on efficient operations by
centralizing activities, standardizing
purchasing, and investing in longer-lived
materials.
9
STRONG OPERATING PERFORMANCE
(1) Peer group consists of AvalonBay, Camden, Equity Residential, Essex and UDR. Source for peer information: Bank of America Merrill Lynch, which does not track MAA turnover. Retention is
calculated as the difference between 100% and turnover.
(2) Volatility as measured by the standard deviation of Same Store revenue growth for the five years from 2012 through 2016. Standard deviation computed by Aimco based on information reported
by SNL Financial. Peer group consists of AvalonBay, Camden, Equity Residential, Essex, MAA and UDR.
(3) Aimco measures changes in Same Store rental rates by comparing, on a lease-by-lease basis, the rate on a newly executed lease to the rate on the expiring lease for that same apartment.
Newly executed leases are classified either as a new lease, where a vacant apartment is leased to a new customer, or as a renewal. Results are for Aimco's 1Q 2017 Same Store portfolio.
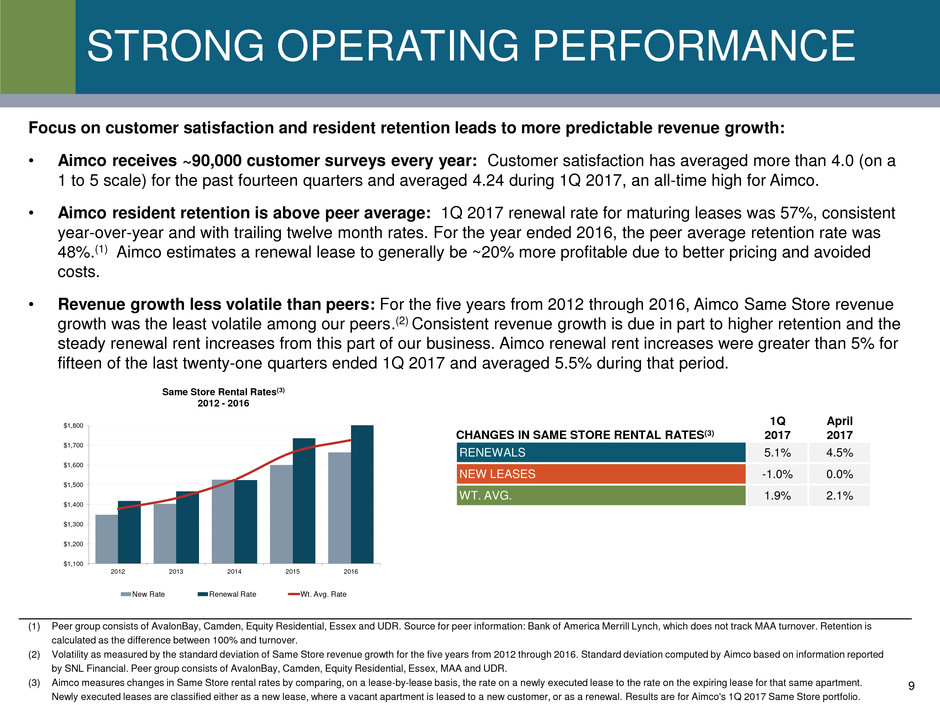
Focus on customer satisfaction and resident retention leads to more predictable revenue growth:
• Aimco receives ~90,000 customer surveys every year: Customer satisfaction has averaged more than 4.0 (on a
1 to 5 scale) for the past fourteen quarters and averaged 4.24 during 1Q 2017, an all-time high for Aimco.
• Aimco resident retention is above peer average: 1Q 2017 renewal rate for maturing leases was 57%, consistent
year-over-year and with trailing twelve month rates. For the year ended 2016, the peer average retention rate was
48%.(1) Aimco estimates a renewal lease to generally be ~20% more profitable due to better pricing and avoided
costs.
• Revenue growth less volatile than peers: For the five years from 2012 through 2016, Aimco Same Store revenue
growth was the least volatile among our peers.(2) Consistent revenue growth is due in part to higher retention and the
steady renewal rent increases from this part of our business. Aimco renewal rent increases were greater than 5% for
fifteen of the last twenty-one quarters ended 1Q 2017 and averaged 5.5% during that period.
CHANGES IN SAME STORE RENTAL RATES(3)
1Q
2017
April
2017
RENEWALS 5.1% 4.5%
NEW LEASES -1.0% 0.0%
WT. AVG. 1.9% 2.1%
2012 2013 2014 2015 2016
$1,100
$1,200
$1,300
$1,400
$1,500
$1,600
$1,700
$1,800
Same Store Rental Rates(3)
2012 - 2016
New Rate Renewal Rate Wt. Avg. Rate
10
PEER-LEADING EXPENSE CONTROL
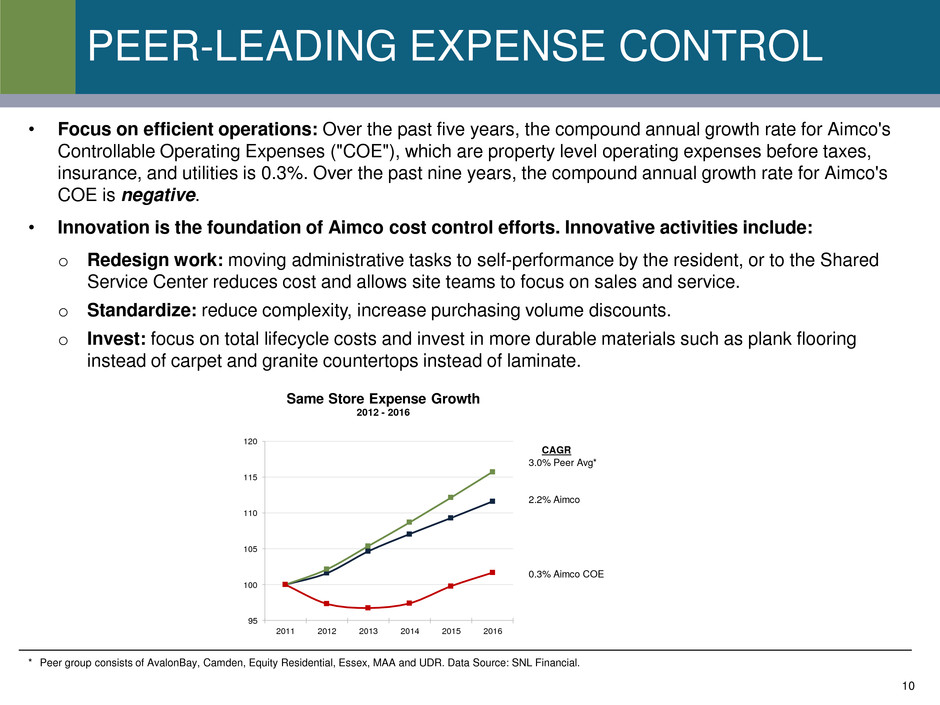
• Focus on efficient operations: Over the past five years, the compound annual growth rate for Aimco's
Controllable Operating Expenses ("COE"), which are property level operating expenses before taxes,
insurance, and utilities is 0.3%. Over the past nine years, the compound annual growth rate for Aimco's
COE is negative.
• Innovation is the foundation of Aimco cost control efforts. Innovative activities include:
o Redesign work: moving administrative tasks to self-performance by the resident, or to the Shared
Service Center reduces cost and allows site teams to focus on sales and service.
o Standardize: reduce complexity, increase purchasing volume discounts.
o Invest: focus on total lifecycle costs and invest in more durable materials such as plank flooring
instead of carpet and granite countertops instead of laminate.
* Peer group consists of AvalonBay, Camden, Equity Residential, Essex, MAA and UDR. Data Source: SNL Financial.
CAGR
3.0% Peer Avg*
2.2% Aimco
0.3% Aimco COE
95
100
105
110
115
120
2011 2012 2013 2014 2015 2016
Same Store Expense Growth
2012 - 2016

11
Aimco’s 2017 NOI guidance range is a 3.5%-5.0% increase over the prior year. Aimco’s 1Q 2017 NOI growth
was 3.7%, ahead of our beginning of year expectations for the quarter.
There are multiple factors that contribute to NOI. The three most impactful are considered below to illustrate
some ways to achieve 2017 NOI guidance. For example:
• The high end of SS NOI guidance is achievable assuming:
• Blended lease rates of 3.1%, reflecting 1Q actual results, the typical seasonal acceleration of lease rate in 2Q and 3Q,
followed by their seasonal deceleration in 4Q.
• ADO increase of 40bps.
• Increased Other Income contribution of 10bps reflecting additional ancillary fee opportunities.
• Full year expense growth of 1.5%, achievable assuming flat COE and insurance, 3.5% increase in real estate taxes, and
2% increase in utilities.
o COE growth was 1.9% in 2016, and the compounded annual growth rate for the past five years was 0.3%.
o Tax exposure is limited because ~40% of our GAV is invested in California where property tax increases are capped by
Proposition 13 at 2%.
o Utility expense exposure is limited because, on average, Aimco is reimbursed by customers for ~65% of utility costs.
o Aimco full year expense growth for 2016 was 1.4%... and the compounded annual growth rate for the past five years
was 2.2%.
• The midpoint of SS NOI guidance is achievable assuming:
• Blended lease rates of 3.1%, as described above, with an ADO increase of 20bps, and full year expense growth of 2.1%,
or…
• Blended lease rates of 3.6%, with an ADO increase of 10bps, and full year expense growth of 2.6%.
• The low end of SS NOI guidance is achievable assuming:
• Blended lease rates of 2.0%, consistent with YTD April blended lease rate growth.
• ADO increase of 30 bps.
• Full year expense growth of 2.5%.
2017 SAME STORE GUIDANCE

12
FFO is projected to accelerate in 2H 2017.
• Over one-half of the projected acceleration is from year-over-year increased contribution from lease-up and redevelopment
communities. The leasing at these communities is substantially complete.
• The remaining projected acceleration is from Same Store operations.
o Achieving the high end of Same Store NOI guidance increases FFO by $0.02 per share.
o Achieving the low end of Same Store NOI guidance reduces FFO by $0.02 per share.
2017 FFO & AFFO GUIDANCE
(per share) FFO AFFO
2017 Guidance Range $2.39-$2.49 $2.07-$2.17
1Q 2017 $0.58 $0.51
2Q 2017 Guidance Range $0.56-$0.60 $0.46-$0.50
2H 2017 Guidance Range $1.25-$1.31 $1.10-$1.16

13
REDEVELOPMENT STRATEGY
REDEVELOPMENT APPROACH
• Own communities where land value as a percentage of total value is
high. Lower price-point communities with high land values support
redevelopment and entitlement activities.
• Provide predictable cash flows through excellence in property
operations and incubate land value while it appreciates.
• Where appropriate, re-entitle land in anticipation of adding future
value. Entitlement requires little capital.
• Redevelop properties when market conditions support repositioning.
• Execute large scale projects in phases, to refine product offerings and
to reduce risk.
• Adjust pace and scope of redevelopment to match market acceptance
and to reduce lease-up inventory risk.
AIMCO RISK MANAGEMENT POLICIES
• Invest up to 3% of GAV in redevelopment and development annually.
• In all investment activities, require unlevered returns that reflect risk
acceptance.
• Arrange in advance required capital both from property debt financing
and equity raised in "paired trades."
• Aimco is not a developer. Aimco relies on third-party developers whose
expertise and balance sheet limit Aimco exposure to construction risks.
• Limit exposure to lease-up risk, including by taking on an equity
partner if indicated.

14
REDEVELOPMENT VALUE CREATION
• The portfolio of Aimco redevelopment and limited development activities predictably results in
value creation of 25% to 35%.
• During 2016, three Aimco redevelopment properties achieved NOI stabilization creating ~$170M of
value, equal to 30% of our investment.
• Multi-phase redevelopments under construction are projected to create value of > 35% of Aimco's
investment.
• Aimco plans 2018 starts to backfill our redevelopment pipeline, and has numerous opportunities in
its portfolio for continuing value creation through redevelopment.
Estimated Net
Investment ($M) Redevelopment Scope
Apartment Homes
to be Redeveloped
BAY PARC PLAZA
MIAMI, FL
$16.0 Amenities, common areas, creation of a new commercial space na
CALHOUN BEACH CLUB
MINNEAPOLIS, MN
$28.7 Unit interiors, common areas 275
THE PALAZZO AT PARK LA BREA
LOS ANGELES, CA
$24.5 Unit interiors, common areas 389
PARK TOWNE PLACE
PHILADELPHIA, PA
$136.3 Unit interiors, building exterior, amenities, common areas, commercial space 701
SAYBROOK POINT
SAN JOSE, CA
$18.3 Unit interiors, building exteriors, amenities, common areas 324
THE STERLING
PHILADELPHIA, PA
$73.0 Unit interiors, amenities, common areas, commercial space 534
YORKTOWN
LOMBARD, IL
$25.7 Unit interiors, amenities, common areas 292
MULTI-PHASE REDEVELOPMENTS UNDER CONSTRUCTION

15
BAY AREA
707 Leahy
Preserve At Marin
(Expansion)
CHICAGO
100 Forest Place
Evanston Place
Yorktown Apartments
(Expansion)
MIAMI
Bay Parc Plaza
(Expanded Scope)
Flamingo South Beach
Yacht Club at Brickell
PHILADELPHIA
Park Towne Place
(Expanded Scope)
Chestnut Hall
DENVER
21 Fitzsimons
Eastpointe
Township at Highlands
GREATER LA
3400 Avenue of the Arts
Palazzo East
Villas at Park La Brea
MINNEAPOLIS
Calhoun Beach Club
(Expanded Scope)
GREATER DC
Foxchase
Merrill House
Shenandoah Crossing
SAN DIEGO
Mariner's Cove
WHAT'S NEXT FOR REDEVELOPMENT?
POTENTIAL FUTURE REDEVELOPMENT AND LIMITED DEVELOPMENT STARTS
The menu shown above is representative of the communities whose redevelopment or development expansion is being considered. Actual projects and their scope may differ materially
from the above.
16
SELECT VALUE CREATION OPPORTUNITIES
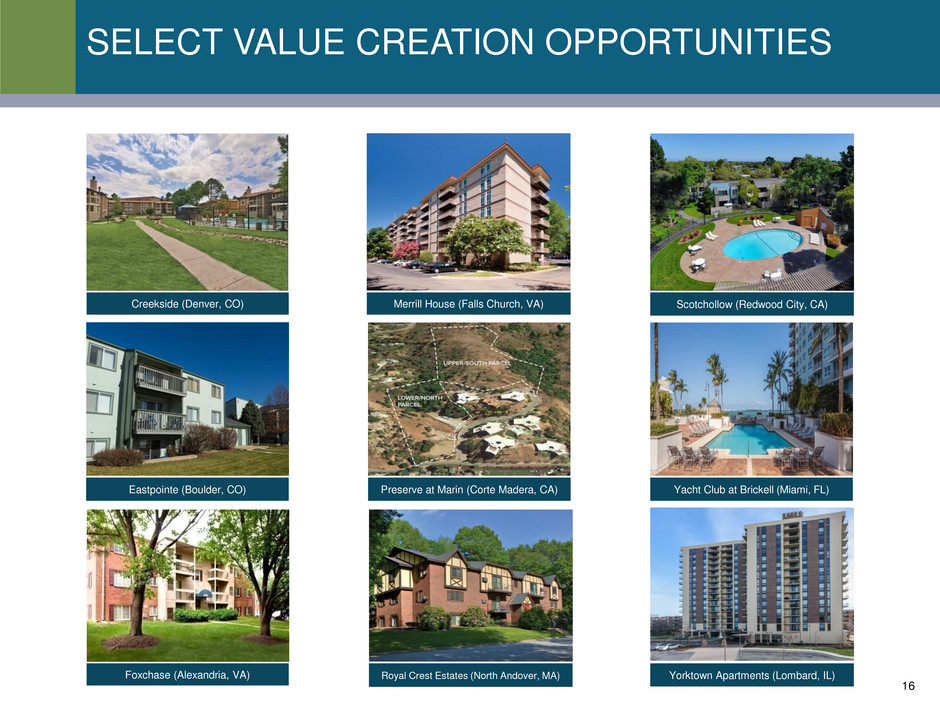
Eastpointe (Boulder, CO)
Creekside (Denver, CO)
Foxchase (Alexandria, VA)
Yacht Club at Brickell (Miami, FL)
Scotchollow (Redwood City, CA)
Yorktown Apartments (Lombard, IL)
Preserve at Marin (Corte Madera, CA)
Merrill House (Falls Church, VA)
Royal Crest Estates (North Andover, MA)
17
PORTFOLIO STRATEGY
To upgrade our portfolio through redevelopment, property upgrades,
acquisitions, and limited development activity.
We do this through a strict paired-trade discipline with:
• DISPOSITION of up to 10% of our portfolio annually, primarily from
submarkets with lower revenue growth prospects; and
• REINVESTMENT of these proceeds in communities with better
locations, higher expected rent growth, and higher projected free cash
flow internal rates of return.
• We maintain sufficient geographic and price point DIVERSIFICATION to
limit volatility and concentration risk, while focusing investment in higher
rent growth, higher-margin submarkets.
• We offer a product that ATTRACTS highly qualified residents with positive
prospects for income growth and the ability and willingness to pay for high
quality homes and service.

18
PORTFOLIO DIVERSIFICATION
Aimco defines apartment community quality as follows: "A" quality communities are those earning rents greater than 125% of local market average; "B" quality communities are those earning rents 90%
to 125% of local market average; "C+" quality communities are those earning rents less than 90% of local market average, and earning rents greater than $1,100 per month; and "C" quality communities
are those earning rents less than 90% of local market average and earning rents less than $1,100 per month. The charts above illustrate Aimco's 1Q 2017 portfolio.
• Aimco emphasizes diversification by both geography and price point.
• The nature of a diversified portfolio is that generally some markets accelerate
while other markets decelerate, and their combination mutes the volatility of local
building cycles.
Geographic Diversification
(% Real Estate GAV)
Coastal California 42%
Mid Atlantic 20%
Northeast 15%
Sunbelt 7%
Miami 9%
Chicago 6%
Other 1%

19
AIMCO EXPOSURE TO NEW SUPPLY
• New supply generally impacts rent growth when completions are greater than 2% of existing
inventory. Nationwide, 2017 completions as a percentage of existing inventory are projected to be
2.3%. This compares to 1.9% for 2016, and 1.6% for 2015*.
• However, building cycles vary by geography and not all markets are oversupplied.
• For Aimco’s submarkets, third-party data providers expect deliveries of apartment homes currently
under construction to peak in 2017, although one quarter later than was projected as of 4Q 2016.
* Source: MPF Research.
0
2,000
4,000
6,000
8,000
10,000
12,000
14,000
16,000
18,000
2Q 2016 3Q 2016 4Q 2016 1Q 2017 2Q 2017 3Q 2017 4Q 2017 1Q 2018 2Q 2018
Nu
mb
er
of
Ap
art
me
nt
Ho
me
s C
om
ple
ted
Expected Completions in Aimco Submarkets*
4Q 2016 Estimate 1Q 2017 Estimate
20
AIMCO EXPOSURE TO NEW SUPPLY
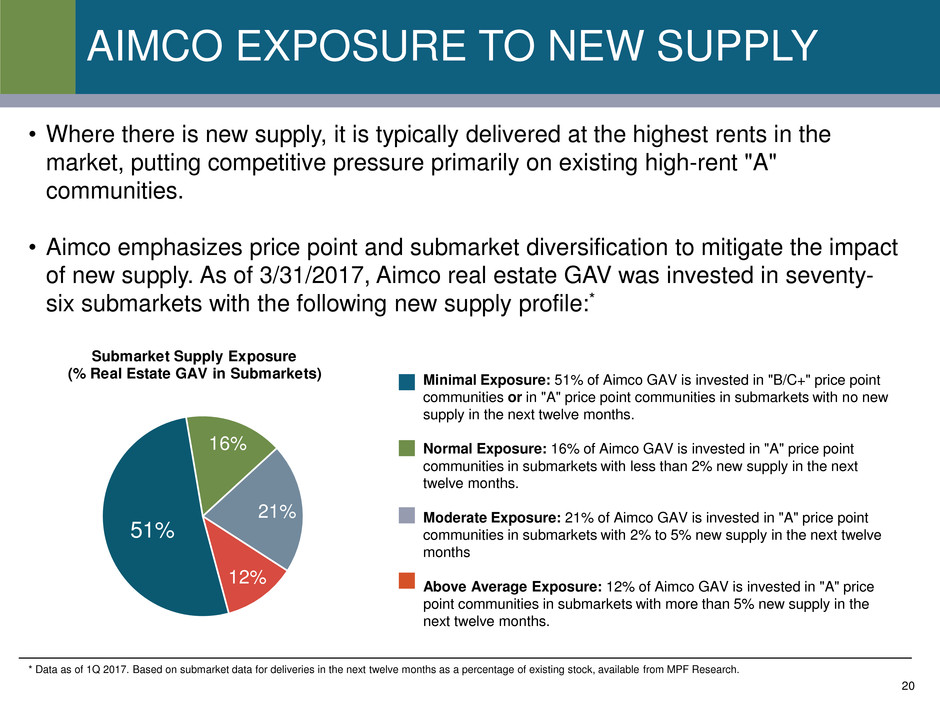
• Where there is new supply, it is typically delivered at the highest rents in the
market, putting competitive pressure primarily on existing high-rent "A"
communities.
• Aimco emphasizes price point and submarket diversification to mitigate the impact
of new supply. As of 3/31/2017, Aimco real estate GAV was invested in seventy-
six submarkets with the following new supply profile:*
Minimal Exposure: 51% of Aimco GAV is invested in "B/C+" price point
communities or in "A" price point communities in submarkets with no new
supply in the next twelve months.
Normal Exposure: 16% of Aimco GAV is invested in "A" price point
communities in submarkets with less than 2% new supply in the next
twelve months.
Moderate Exposure: 21% of Aimco GAV is invested in "A" price point
communities in submarkets with 2% to 5% new supply in the next twelve
months
Above Average Exposure: 12% of Aimco GAV is invested in "A" price
point communities in submarkets with more than 5% new supply in the
next twelve months.
* Data as of 1Q 2017. Based on submarket data for deliveries in the next twelve months as a percentage of existing stock, available from MPF Research.
51%
16%
21%
12%
Submarket Supply Exposure
(% Real Estate GAV in Submarkets)
21
AIMCO EXPOSURE TO NEW SUPPLY
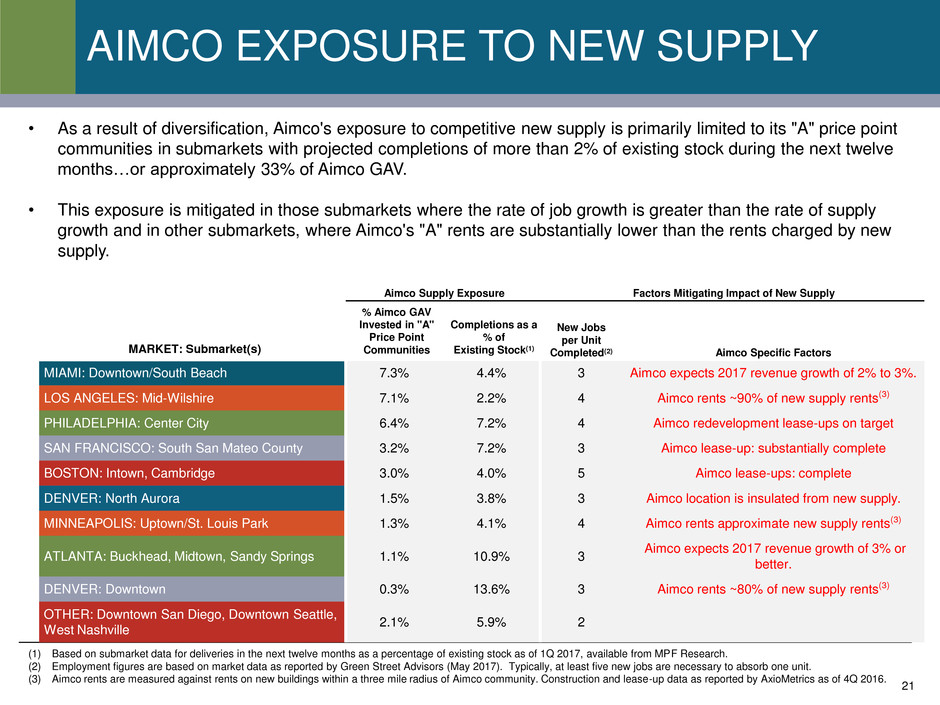
• As a result of diversification, Aimco's exposure to competitive new supply is primarily limited to its "A" price point
communities in submarkets with projected completions of more than 2% of existing stock during the next twelve
months…or approximately 33% of Aimco GAV.
• This exposure is mitigated in those submarkets where the rate of job growth is greater than the rate of supply
growth and in other submarkets, where Aimco's "A" rents are substantially lower than the rents charged by new
supply.
(1) Based on submarket data for deliveries in the next twelve months as a percentage of existing stock as of 1Q 2017, available from MPF Research.
(2) Employment figures are based on market data as reported by Green Street Advisors (May 2017). Typically, at least five new jobs are necessary to absorb one unit.
(3) Aimco rents are measured against rents on new buildings within a three mile radius of Aimco community. Construction and lease-up data as reported by AxioMetrics as of 4Q 2016.
Aimco's "A" Price Point Where Sub-Market Supply >2%
Aimco Supply Exposure Factors Mitigating Impact of New Supply
MARKET: Submarket(s)
% Aimco GAV
Invested in "A"
Price Point
Communities
Completions as a
% of
Existing Stock(1)
New Jobs
per Unit
Completed(2) Aimco Specific Factors
MIAMI: Downtown/South Beach 7.3% 4.4% 3 Aimco expects 2017 revenue growth of 2% to 3%.
LOS ANGELES: Mid-Wilshire 7.1% 2.2% 4 Aimco rents ~90% of new supply rents(3)
PHILADELPHIA: Center City 6.4% 7.2% 4 Aimco redevelopment lease-ups on target
SAN FRANCISCO: South San Mateo County 3.2% 7.2% 3 Aimco lease-up: substantially complete
BOSTON: Intown, Cambridge 3.0% 4.0% 5 Aimco lease-ups: complete
DENVER: North Aurora 1.5% 3.8% 3 Aimco location is insulated from new supply.
MINNEAPOLIS: Uptown/St. Louis Park 1.3% 4.1% 4 Aimco rents approximate new supply rents(3)
ATLANTA: Buckhead, Midtown, Sandy Springs 1.1% 10.9% 3
Aimco expects 2017 revenue growth of 3% or
better.
DENVER: Downtown 0.3% 13.6% 3 Aimco rents ~80% of new supply rents(3)
OTHER: Downtown San Diego, Downtown Seattle,
West Nashville
2.1% 5.9% 2

22
HIGH QUALITY BALANCE SHEET
• Aimco has a safe, flexible balance sheet with abundant liquidity.
• Aimco leverage consists primarily of non-recourse, amortizing, fixed-rate property debt and
perpetual preferred equity.
• Annualized 4Q 2017 debt and preferred equity to EBITDA ratio is expected to be ~6.2x.
• Both S&P and Fitch rate the Aimco balance sheet "investment grade," which would be
useful if Aimco chose to access capital through the sale of bonds in public or private
transactions.
o In first quarter 2017, Aimco closed $65M of ten-year property loans that have a weighted
average interest rate 134 basis points above the 10-year Treasury rate at the time of pricing.
o In first quarter 2017, REITs having an investment grade rating of BBB- issued ten-year bonds
in the range of 155 to 270 basis points above the then ten-year Treasury rate.
Quarter-End
1Q 2017
Forecast
Year-End 2017
DEBT TO EBITDA 6.3x ~6.0x
DEBT AND PREFERRED EQUITY TO EBITDA 6.7x ~6.4x
VALUE OF UNENCUMBERED PROPERTIES $1.6B ~$1.9B

23
• Aimco Debt and Preferred Equity to EBITDA of 6.7x reflects outstanding
balances at March 31, 2017, but overstates the refunding risk of our leverage.
• Our property debt balances at maturity are more than $700 million lower than 1Q
2017 balances due to principal amortization paid from retained earnings.
HIGH QUALITY BALANCE SHEET
(1) Peer group consists of AvalonBay, Camden, Equity Residential, Essex, MAA and UDR. Peer weighted average computed by Aimco based on 3/31/2017 debt and preferred equity
balances, less cash, cash equivalents and restricted cash, divided by last twelve months recurring EBITDA, all as reported by SNL Financial. Balances are adjusted by Aimco to reflect
company share of unconsolidated debt and NOI. For Aimco, leverage represents Aimco's share of property debt, preferred equity and any balance on the revolving credit facility,
reduced by Aimco's share of cash, cash equivalents, restricted cash and investments in a securitization trust that holds Aimco property loans. See further information in Aimco's 1Q
2017 Earnings Release.
(2) Refunding Risk is lower than Total Leverage because property debt balances are reduced by scheduled amortization funded from retained earnings and because perpetual preferred
equity is not subject to mandatory refunding.
Property debt
amortization,
Perpetual
Preferred Equity
Total Leverage / LTM EBITDA as of March 31, 2017
(1)
Aimco Refunding Risk
(2)

24
TEAM AND CULTURE
TEAM ENGAGEMENT
• Out of hundreds of companies participating in the competition,
Aimco is one of only a dozen in the entire state recognized as a
"Top Place to Work" in Colorado for the past five consecutive
years.
• For the past four years, Aimco team engagement scores
measured on a 1 to 5 scale have averaged better than 4.
TALENT AND SUCCESSION PLANNING
• Aimco maintains an executive talent pipeline for every executive
officer position, including the CEO position.
• The Company maintains a forward-looking approach to
succession. Positions are filled considering the business strategy
and needs at the time of a vacancy and the candidate's skills,
experience, expertise, leadership and fit.
• The Aimco Board of Directors is actively involved in succession
planning. The Compensation and Human Resources Committee
reviews in detail the executive talent pipeline at least once per
year and is provided with regular updates on succession
candidate development progress. The Board is provided exposure
to succession candidates for executive officer positions.
The underpinning of Aimco's success is a strong, stable team focused on a
collaborative and productive culture.
25
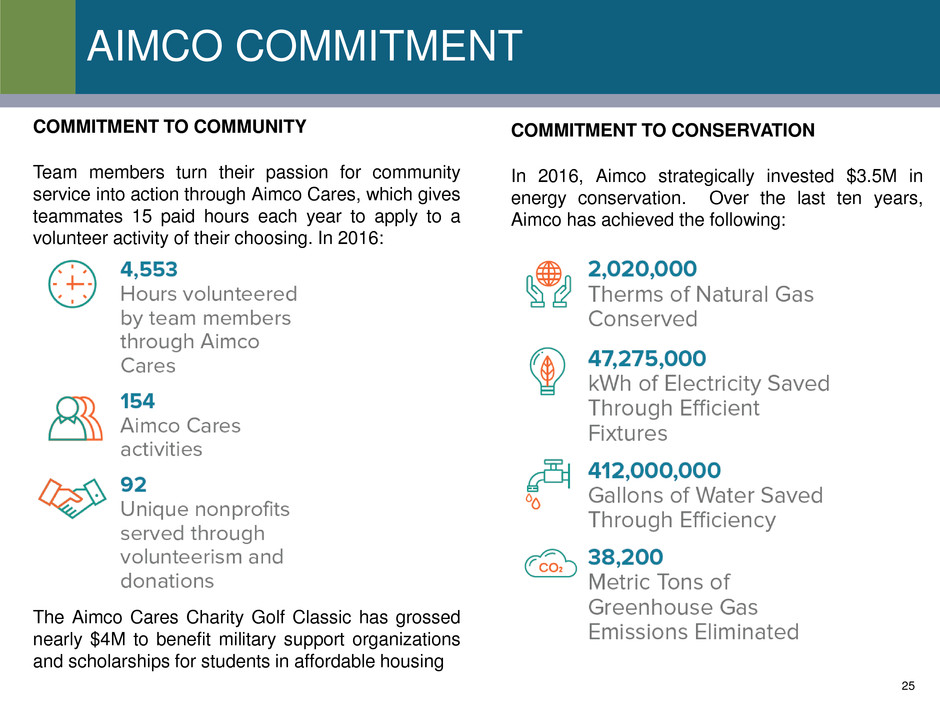
AIMCO COMMITMENT
COMMITMENT TO CONSERVATION
In 2016, Aimco strategically invested $3.5M in
energy conservation. Over the last ten years,
Aimco has achieved the following:
COMMITMENT TO COMMUNITY
Team members turn their passion for community
service into action through Aimco Cares, which gives
teammates 15 paid hours each year to apply to a
volunteer activity of their choosing. In 2016:
The Aimco Cares Charity Golf Classic has grossed
nearly $4M to benefit military support organizations
and scholarships for students in affordable housing

26
AIMCO SENIOR LEADERSHIP TEAM
Terry is a life-long entrepreneur focused on business, politics
and family. Terry has been an active real estate investor for
almost 50 years, serving four REITs as CEO. Through the
Considine Companies, Terry has invested in real estate,
television broadcasting, convenience stores, environmental
services, and venture capital. Terry contributed his apartment
business to the formation of Aimco, led the Aimco IPO in 1994,
and has served as Aimco Chairman/CEO since that time. Terry
has also been active in politics, elected twice to the Colorado
Senate and holding leadership roles in numerous campaigns and
political organizations. He is a director of the Lynde and Harry
Bradley Foundation in Milwaukee, Wisconsin and Intrepid
Potash (NYSE: IPI) in Denver, Colorado. Terry has been married
for 41 years to his wife Betsy. Together, they are actively
involved in education reform as well as ranching in western
Colorado. Most of all, they enjoy three adult children, their
spouses, and two remarkable grandchildren.
Terry Considine
Chairman of the Board &
Chief Executive Officer

27
AIMCO SENIOR LEADERSHIP TEAM
John was appointed Executive Vice President and Chief Investment Officer in August 2013.
Prior to that, he served as Executive Vice President, Transactions beginning in January 2011.
He joined Aimco as Senior Vice President-Development in June 2006. John serves as
chairman of Aimco's investment committee. He is also responsible for development activities
and portfolio management. Prior to joining Aimco, John spent over 20 years with Prologis, Inc.
and Catellus Development Corporation in a variety of executive positions, including those with
responsibility for transactions, fund management, asset management, leasing, and operations.
John and his wife Sheri have nine children, live in Littleton, Colorado, and are anxiously
engaged in all the excitement that comes with a big family.
John E. Bezzant
Executive Vice President, Chief Investment Officer and
Investment Committee Chairman
Paul joined Aimco in 2008 as Senior Vice President and Chief Accounting Officer. Prior to
joining Aimco, from October 2007 to March 2008, he served as Chief Financial Officer of
APRO Residential Fund. Prior to that, from May 2005 to September 2007, Paul served as
Chief Financial Officer of America First Apartment Investors, Inc., then a publicly traded
company. From 1996 to 2005, Paul was with the firm of Deloitte & Touche, LLP, serving in
numerous roles, including Audit Senior Manager and in the firm's national office as an Audit
Manager in SEC Services. Paul is a certified public accountant.
Paul Beldin
Executive Vice President & Chief Financial Officer

28
AIMCO SENIOR LEADERSHIP TEAM
Miles was promoted to Executive Vice President and Chief Administrative Officer in December 2007.
He is responsible for administration, government relations, communications, special projects, and
chairs the Senior Leadership Team. Miles joined Aimco in August 2001 as Executive Vice President,
General Counsel and Secretary. Prior to joining the Aimco, he practiced law in Denver, Colorado since
1970 and served as president of both the Colorado Bar Association and the Denver Bar Association.
For over ten years he was recognized in "Best Lawyers in America" and in 2001 was the Denver
Business Journal's "Law Executive of the Year." He served with the First Infantry Division in Vietnam in
1969, where he was awarded the Bronze Star, the Air Medal and the Army Commendation Medal.
Miles has been a trustee of his alma mater Trinity University since 2005 and serves on the board of
directors of the Tragedy Assistance Program for Survivors and the Colorado Open Golf Foundation. He
is married to Jan Cortez, and they have four children and five grandchildren. He is an avid tennis player
and golfer, and speaks Spanish.
Miles Cortez
Executive Vice President & Chief Administrative Officer
Lisa was appointed Executive Vice President, General Counsel and Secretary in December 2007. In
addition to serving as general counsel, Lisa has responsibility for insurance and risk management,
human resources, compliance and asset quality and service. She is also responsible for certain of
Aimco's acquisition and disposition activities. Lisa has previously served as chairman of Aimco's
investment committee. She joined Aimco in July 2002 as Vice President, Assistant General Counsel
and Assistant Secretary and was promoted to Senior Vice President in July 2004. Prior to joining
Aimco, Lisa was engaged in the private practice of law at Hogan & Hartson LLP (now Hogan Lovells),
with an emphasis on public and private mergers and acquisitions, venture capital financing, securities
and corporate governance. Prior to private practice, she spent two years as a Federal judicial law clerk.
Lisa earned her degree in Public Policy from Stanford University and earned her law degree from
Harvard Law School. She serves on the Board of Trustees of the Rose Community Foundation and is
actively involved in the Denver community. Lisa and her husband, Rich, have one son.
Lisa R. Cohn
Executive Vice President, General Counsel, Secretary

29
AIMCO SENIOR LEADERSHIP TEAM
Keith was born in Pittsburgh, Pennsylvania and is a diehard Steelers fan. In 1976, his family moved
to Southern California where he quickly acclimated to the beautiful beaches and took up his
passion for surfing. Keith is married to his wonderful wife Leyla, and they have two beautiful
children and now reside in Colorado. Keith began his career in the multifamily real estate business
in 1992 as a leasing consultant and onsite manager, where he learned the day-to-day operations
and cultivated a keen connection to onsite teams. He joined Aimco in March 2002 as a Regional
Manager and in March 2006 was promoted to Regional Vice President - Property Operations for
California. In September 2008, Keith was appointed Area Vice President - Property Operations for
the western United States. In January 2011, Keith was promoted to Executive Vice President -
Property Operations heading our national operations.
Keith M. Kimmel
Executive Vice President, Property Operations
Patti Fielding
Executive Vice President, Redevelopment and Treasurer
Patti was appointed Executive Vice President - Securities and Debt in February 2003, and
Treasurer in January 2005. In 2014, she assumed responsibility for redevelopment. In addition to
redevelopment, she remains responsible for debt financing and treasury. Patti has previously
served as chairman of Aimco's investment committee. From January 2000 to February 2003, she
served as Senior Vice President - Securities and Debt. Patti joined Aimco as a Vice President in
February 1997. Prior to joining Aimco, she was with Hanover Capital from 1996 to1997, and from
1993 to 1995 she was Vice Chairman, Senior Vice President and Co-Founder of CapSource
Funding Corp. Patti was also a Group Vice President with Duff & Phelps Rating Company from
1987 to 1993 and a commercial real estate appraiser with American Appraisal for three years.

30
FORWARD LOOKING STATEMENTS &
OTHER INFORMATION
This presentation contains forward-looking statements within the meaning of the federal securities laws, including, without limitation, statements regarding projected
results and specifically forecasts of 2017 results, including but not limited to: Pro forma FFO and selected components thereof; AFFO; Aimco redevelopment and
development investments and projected value creation from such investments; and Aimco liquidity and leverage metrics.
These forward-looking statements are based on management’s judgment as of this date, which is subject to risks and uncertainties. Risks and uncertainties include, but
are not limited to: Aimco’s ability to maintain current or meet projected occupancy, rental rate and property operating resul ts; the effect of acquisitions, dispositions,
redevelopments and developments; Aimco’s ability to meet budgeted costs and timelines, and achieve budgeted rental rates related to Aimco redevelopments and
developments; and Aimco’s ability to comply with debt covenants, including financial coverage ratios. Actual results may differ materially from those described in these
forward-looking statements and, in addition, will be affected by a variety of risks and factors, some of which are beyond Aimco’s control, including, without
limitation:
• Real estate and operating risks, including fluctuations in real estate values and the general economic climate in the markets in which Aimco operates and
competition for residents in such markets; national and local economic conditions, including the pace of job growth and the level of unemployment; the amount,
location and quality of competitive new housing supply; the timing of acquisitions, dispositions, redevelopments and developments; and changes in operating costs,
including energy costs;
• Financing risks, including the availability and cost of capital markets’ financing; the risk that cash flows from operations may be insufficient to meet required
payments of principal and interest; and the risk that earnings may not be sufficient to maintain compliance with debt covenants;
• Insurance risks, including the cost of insurance, and natural disasters and severe weather such as hurricanes; and
• Legal and regulatory risks, including costs associated with prosecuting or defending claims and any adverse outcomes; the terms of governmental regulations that
affect Aimco and interpretations of those regulations; and possible environmental liabilities, including costs, fines or penalties that may be incurred due to necessary
remediation of contamination of apartment communities presently or previously owned by Aimco.
In addition, Aimco’s current and continuing qualification as a real estate investment trust involves the application of highly technical and complex provisions of the
Internal Revenue Code and depends on Aimco’s ability to meet the various requirements imposed by the Internal Revenue Code, through actual operating results,
distribution levels and diversity of stock ownership.
Readers should carefully review Aimco’s financial statements and the notes thereto, as well as the section entitled “Risk Factors” in Item 1A of Aimco’s Annual Report
on Form 10-K for the year ended December 31, 2016, and the other documents Aimco files from time to time with the Securities and Exchange Commission.
These forward-looking statements reflect management’s judgment as of this date, and Aimco assumes no obligation to revise or update them to reflect future events or
circumstances. This presentation does not constitute an offer of securities for sale.
Glossary & Reconciliations of Non-GAAP Financial and Operating Measures
Financial and operating measures discussed in this document include certain financial measures used by Aimco management, some of which are measures not defined
under accounting principles generally accepted in the United States, or GAAP. These measures are defined in the Glossary and Reconciliations of Non-GAAP Financial
and Operating Measures included in Aimco's First Quarter 2017 Earnings Release dated April 27, 2017.
