Attached files
| file | filename |
|---|---|
| 8-K - FORM 8-K - CB Financial Services, Inc. | f8k_050817.htm |
Exhibit 99.1
0 Investor Presentation May 2017
1 Statements contained in this investor presentation that are not historical facts may constitute forward - looking statements as that term is defined in the Private Securities Litigation Reform Act of 1995 . Such forward - looking statements are subject to significant risks and uncertainties . The Company intends such forward - looking statements to be covered by the safe harbor provisions contained in the Act . The Company’s ability to predict results or the actual effect of future plans or strategies is inherently uncertain . Factors which could have a material adverse effect on the operations and future prospects of the Company and its subsidiaries include, but are not limited to, changes in market interest rates, general economic conditions, changes in federal and state regulation, actions by our competitors, loan delinquency rates, our ability to control costs and expenses, and other factors that may be described in the Company’s periodic reports as filed with the Securities and Exchange Commission . These risks and uncertainties should be considered in evaluating forward - looking statements and undue reliance should not be placed on such statements . The Company assumes no obligation to update any forward - looking statement except as may be required by applicable law or regulation . Forward - Looking Statements
2 CB Financial Services Overview
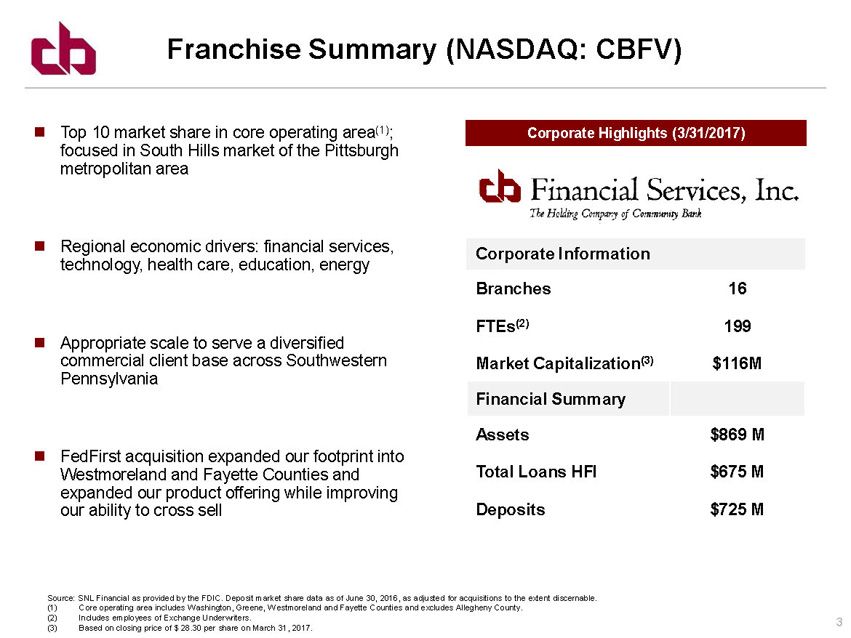
3 Corporate Highlights (3/31/2017) Corporate Information Branches 16 FTEs (2) 199 Market Capitalization (3) $116M Financial Summary Assets $869 M Total Loans HFI $675 M Deposits $725 M Top 10 market share in core operating area (1) ; focused in South Hills market of the Pittsburgh metropolitan area Regional economic drivers: financial services, technology, health care, education, energy Appropriate scale to serve a diversified commercial client base across Southwestern Pennsylvania FedFirst acquisition expanded our footprint into Westmoreland and Fayette Counties and expanded our product offering while improving our ability to cross sell Franchise Summary (NASDAQ: CBFV) Source: SNL Financial as provided by the FDIC. Deposit market share data as of June 30, 2016, as adjusted for acquisitions to the extent discernable. (1) Core operating area includes Washington, Greene, Westmoreland and Fayette Counties and excludes Allegheny County. (2) Includes employees of Exchange Underwriters. (3) Based on closing price of $ 28.30 per share on March 31, 2017.
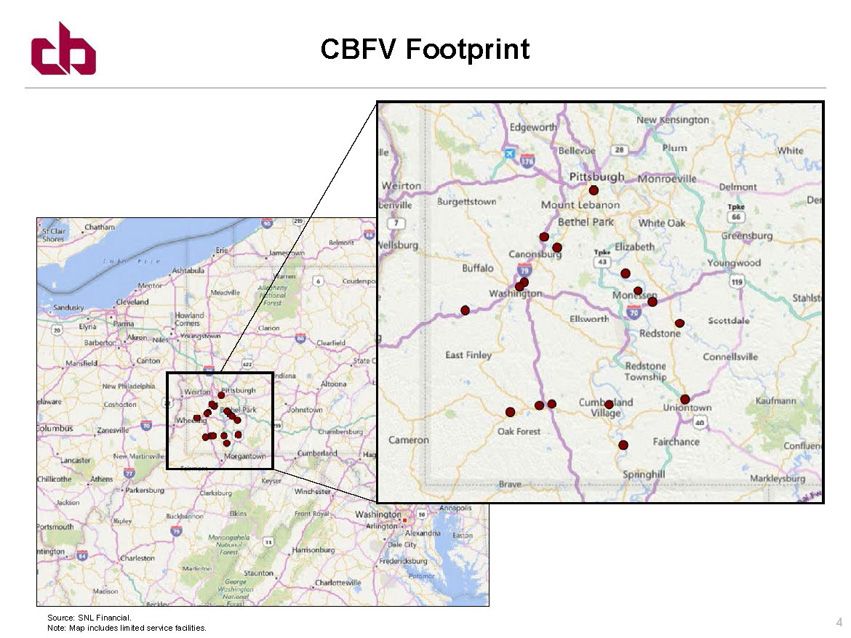
4 CBFV Footprint Source: SNL Financial. Note: Map includes limited service facilities.
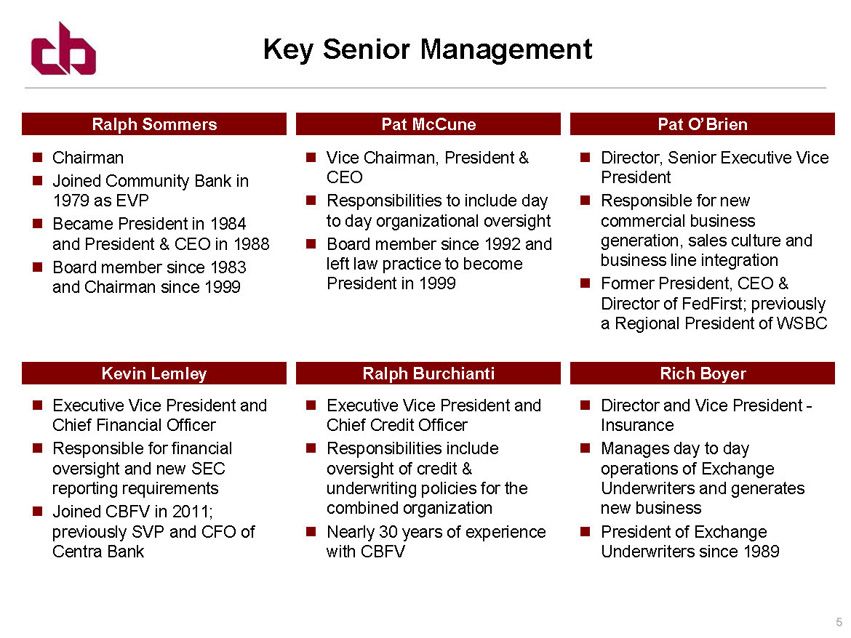
5 Key Senior Management Pat McCune Ralph Sommers Chairman Joined Community Bank in 1979 as EVP Became President in 1984 and President & CEO in 1988 Board member since 1983 and Chairman since 1999 Director, Senior Executive Vice President Responsible for new commercial business generation, sales culture and business line integration Former President, CEO & Director of FedFirst ; previously a Regional President of WSBC Vice Chairman, President & CEO Responsibilities to include day to day organizational oversight Board member since 1992 and left law practice to become President in 1999 Kevin Lemley Executive Vice President and Chief Financial Officer Responsible for financial oversight and new SEC reporting requirements Joined CBFV in 2011; previously SVP and CFO of Centra Bank Pat O’Brien Rich Boyer Ralph Burchianti Executive Vice President and Chief Credit Officer Responsibilities include oversight of credit & underwriting policies for the combined organization Nearly 30 years of experience with CBFV Director and Vice President - Insurance Manages day to day operations of Exchange Underwriters and generates new business President of Exchange Underwriters since 1989
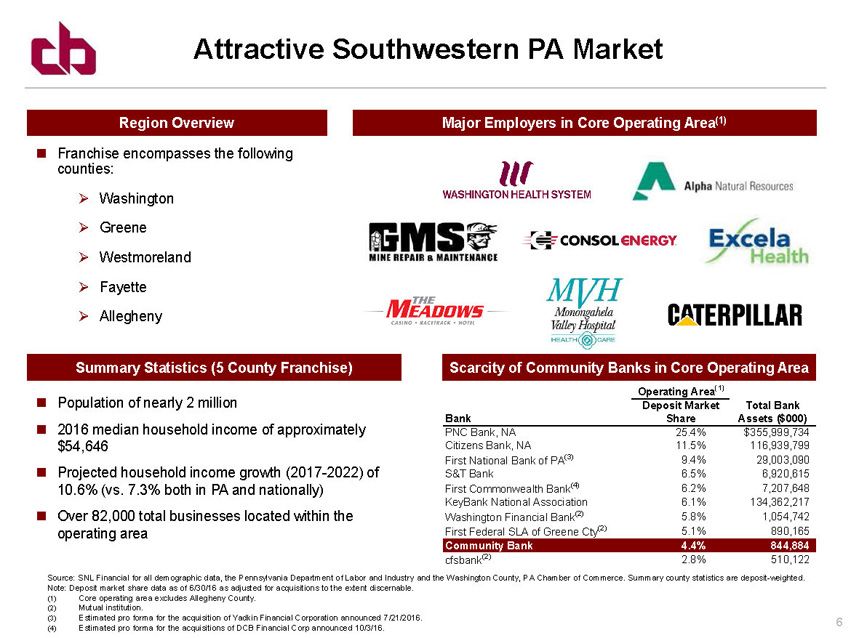
6 Attractive Southwestern PA Market Source: SNL Financial for all demographic data, the Pennsylvania Department of Labor and Industry and the Washington County, PA Chamber of Commerce. Summary county statistics are deposit - weighted. Note: Deposit market share data as of 6/30/16 as adjusted for acquisitions to the extent discernable. (1) Core operating area excludes Allegheny County . (2) Mutual institution. (3) Estimated pro forma for the acquisition of Yadkin Financial Corporation announced 7/21/2016. (4) Estimated pro forma for the acquisitions of DCB Financial Corp announced 10/3/16. Franchise encompasses the following counties: » Washington » Greene » Westmoreland » Fayette » Allegheny The Washington Hospital CONSOL Energy, Inc. Meadows Racetrack and Casino Monongahela Valley Hospital Caterpillar Alpha Natural Resources GMS Mine Repair and Maintenance Westmoreland Regional Hospital Summary Statistics (5 County Franchise) Population of nearly 2 million 2016 median household i ncome of approximately $54,646 Projected h ousehold income growth (2017 - 2022) of 10.6% (vs. 7.3% both in PA and nationally) Over 82,000 total businesses located within the operating area Major Employers in Core Operating Area (1) Region Overview Scarcity of Community Banks in Core Operating Area Operating Area (1) Deposit Market Total Bank Bank Share Assets ($000) PNC Bank, NA 25.4% $355,999,734 Citizens Bank, NA 11.5% 116,939,799 First National Bank of PA (3) 9.4% 29,003,090 S&T Bank 6.5% 6,920,615 First Commonwealth Bank (4) 6.2% 7,207,648 KeyBank National Association 6.1% 134,362,217 Washington Financial Bank (2) 5.8% 1,054,742 First Federal SLA of Greene Cty (2) 5.1% 890,165 Community Bank 4.4% 844,884 cfsbank (2) 2.8% 510,122
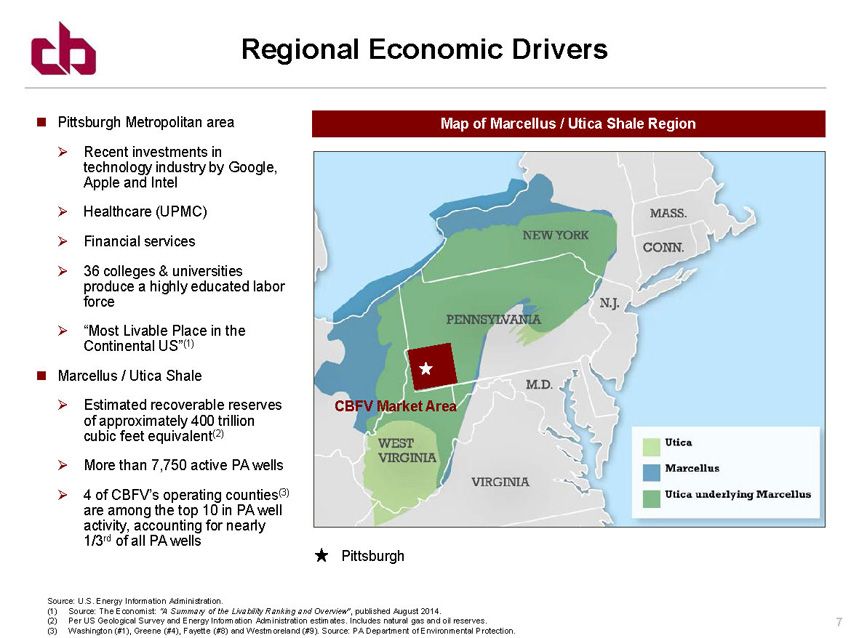
7 Regional Economic Drivers Source: U.S. Energy Information Administration. (1) Source: The Economist : “A Summary of the Livability Ranking and Overview” , published August 2014. (2) Per US Geological Survey and Energy Information Administration estimates. Includes natural gas and oil reserves. (3) Washington (#1), Greene (#4), Fayette (#8) and Westmoreland (#9). Source: PA Department of Environmental Protection. Map of Marcellus / Utica Shale Region CBFV Market Area Pittsburgh Pittsburgh Metropolitan area » Recent investments in technology industry by Google, Apple and Intel » Healthcare (UPMC) » Financial services » 36 colleges & universities produce a highly educated labor force » “Most Livable Place in the Continental US” (1) Marcellus / Utica Shale » Estimated recoverable reserves of approximately 400 trillion cubic feet equivalent (2) » More than 7,750 active PA wells » 4 of CBFV’s operating counties (3) are among the top 10 in PA well activity, accounting for nearly 1/3 rd of all PA wells
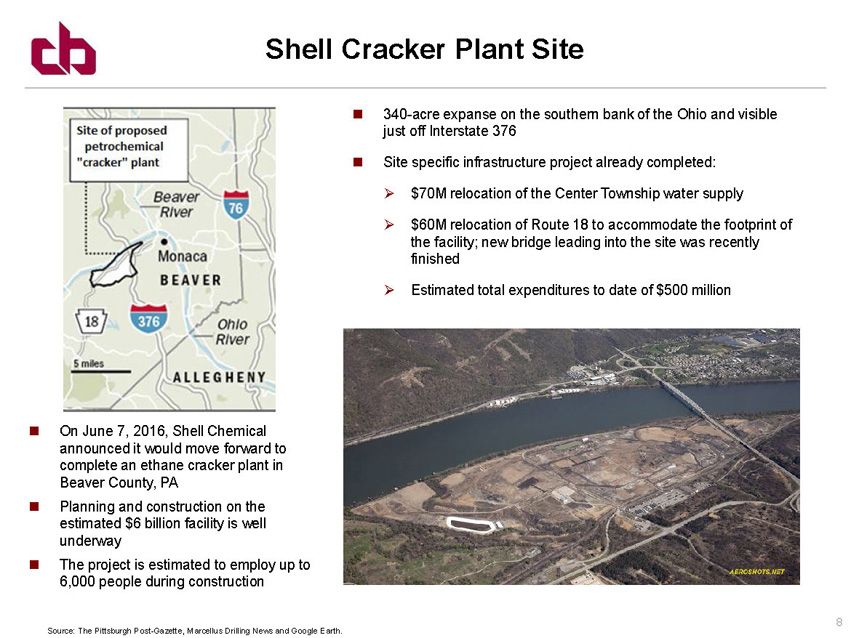
8 Shell Cracker Plant Site Source: The Pittsburgh Post - Gazette, Marcellus Drilling News and Google Earth. 340 - acre expanse on the southern bank of the Ohio and visible just off Interstate 376 Site specific infrastructure project already completed: » $70M relocation of the Center Township water supply » $60M relocation of Route 18 to accommodate the footprint of the facility; new bridge leading into the site was recently finished » Estimated total expenditures to date of $500 million On June 7, 2016, Shell Chemical announced it would move forward to complete an ethane cracker plant in Beaver County, PA Planning and construction on the estimated $6 billion facility is well underway The project is estimated to employ up to 6,000 people during construction
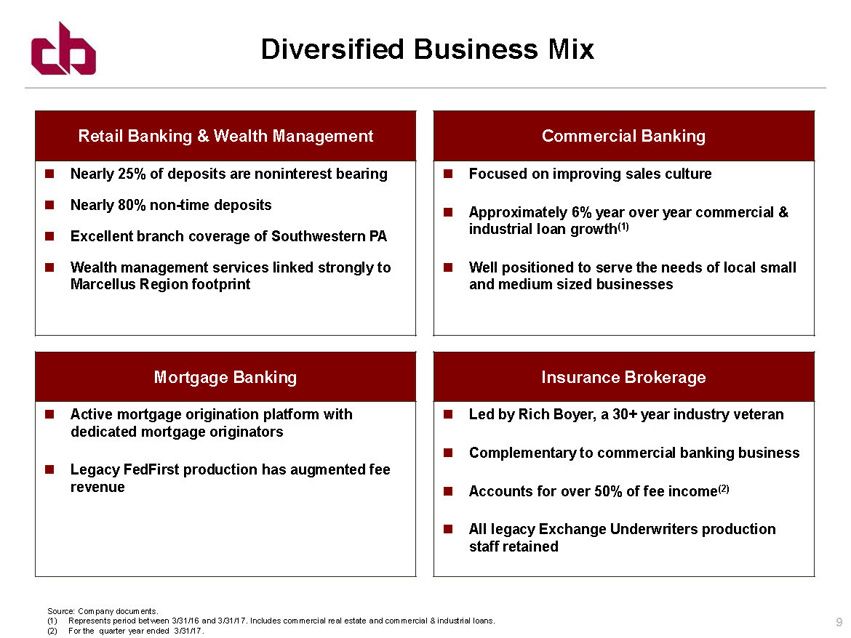
9 Retail Banking & Wealth Management Nearly 25% of deposits are noninterest bearing Nearly 80% non - time deposits Excellent branch coverage of Southwestern PA Wealth management services linked strongly to Marcellus Region footprint Diversified Business Mix Commercial Banking Focused on improving sales culture Approximately 6% year over year commercial & industrial loan growth (1) Well positioned to serve the needs of local small and medium sized businesses Mortgage Banking Active mortgage origination platform with dedicated mortgage originators Legacy FedFirst production has augmented fee revenue Insurance Brokerage Led by Rich Boyer, a 30+ year industry veteran Complementary to commercial banking business Accounts for over 50% of fee income (2) All legacy Exchange Underwriters production staff retained Source: Company documents. (1) Represents period between 3/31/16 and 3/31/17. Includes commercial real estate and commercial & industrial loans. (2) For the quarter year ended 3/31/17.
10 Financial Performance
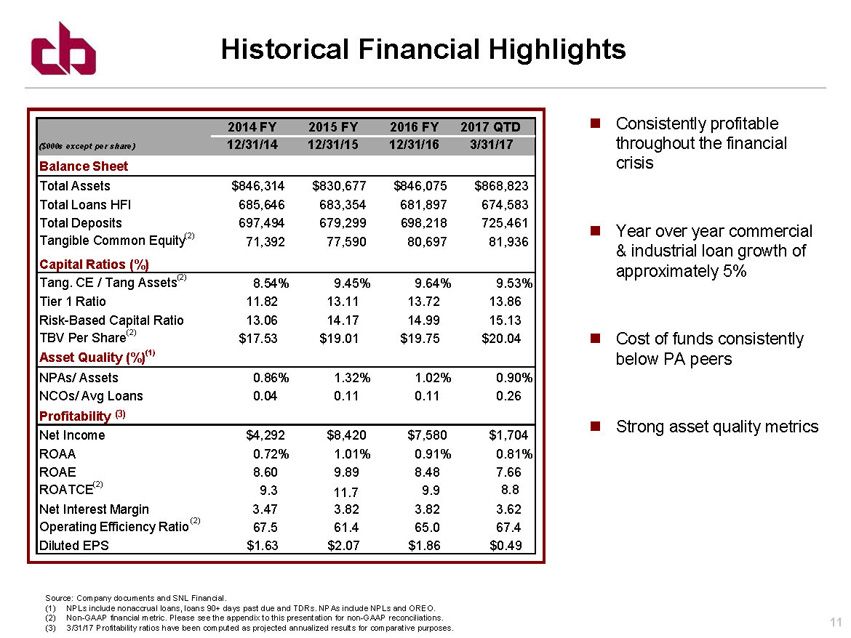
11 Source: Company documents and SNL Financial . (1) NPLs include nonaccrual loans, loans 90+ days past due and TDRs. NPAs include NPLs and OREO. (2) Non - GAAP financial metric. Please see the appendix to this presentation for non - GAAP reconciliations. (3) 3/31/17 Profitability ratios have been computed as projected annualized results for comparative purposes. Historical Financial Highlights Consistently profitable throughout the financial crisis Year over year commercial & industrial loan growth of approximately 5% Cost of funds consistently below PA peers Strong asset quality metrics 2014 FY 2015 FY 2016 FY 2017 QTD ($000s except per share) 12/31/14 12/31/15 12/31/16 3/31/17 Balance Sheet Total Assets $846,314 $830,677 $846,075 $868,823 Total Loans HFI 685,646 683,354 681,897 674,583 Total Deposits 697,494 679,299 698,218 725,461 Tangible Common Equity (2) 71,392 77,590 80,697 81,936 Capital Ratios (%) Tang. CE / Tang Assets (2) 8.54% 9.45% 9.64% 9.53% Tier 1 Ratio 11.82 13.11 13.72 13.86 Risk - Based Capital Ratio 13.06 14.17 14.99 15.13 TBV Per Share (2) $17.53 $19.01 $19.75 $20.04 Asset Quality (%) (1) NPAs/ Assets 0.86% 1.32% 1.02% 0.9 0% NCOs/ Avg Loans 0.04 0.11 0.11 0.26 Profitability Net Income $4,292 $8,420 $7,580 $1,704 ROAA 0.72% 1.01% 0.91% 0.81% ROAE 8.60 9.89 8.48 7.66 ROATCE (2) 9.3 11.7 9.9 8.8 Net Interest Margin 3.47 3.82 3.82 3.62 Operating Efficiency Ratio (2) 67.5 61.4 65.0 67.4 Diluted EPS $1.63 $ 2.07 $1.86 $0.49 (3)
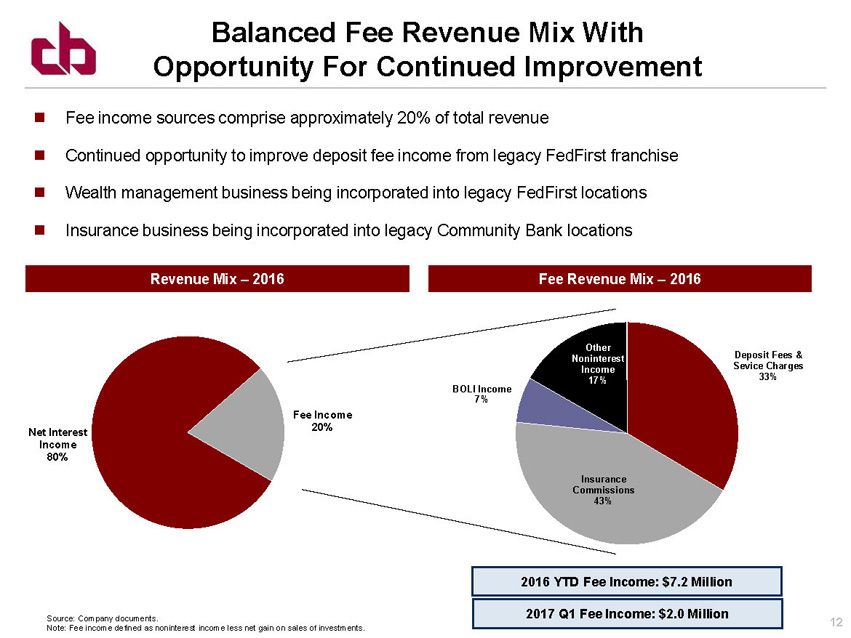
12 Net Interest Income 80% Fee Income 20% Balanced Fee Revenue Mix With Opportunity For Continued Improvement Source: Company documents. Note: Fee income defined as noninterest income less net gain on sales of investments. Fee Revenue Mix – 2016 Fee income sources comprise approximately 20% of total revenue Continued opportunity to improve deposit fee income from legacy FedFirst franchise Wealth management business being incorporated into legacy FedFirst locations Insurance business being incorporated into legacy Community Bank locations 2016 YTD Fee Income: $7.2 Million Revenue Mix – 2016 Deposit Fees & Sevice Charges 33% Insurance Commissions 43% BOLI Income 7% Other Noninterest Income 17% 2017 Q1 Fee Income: $2.0 Million
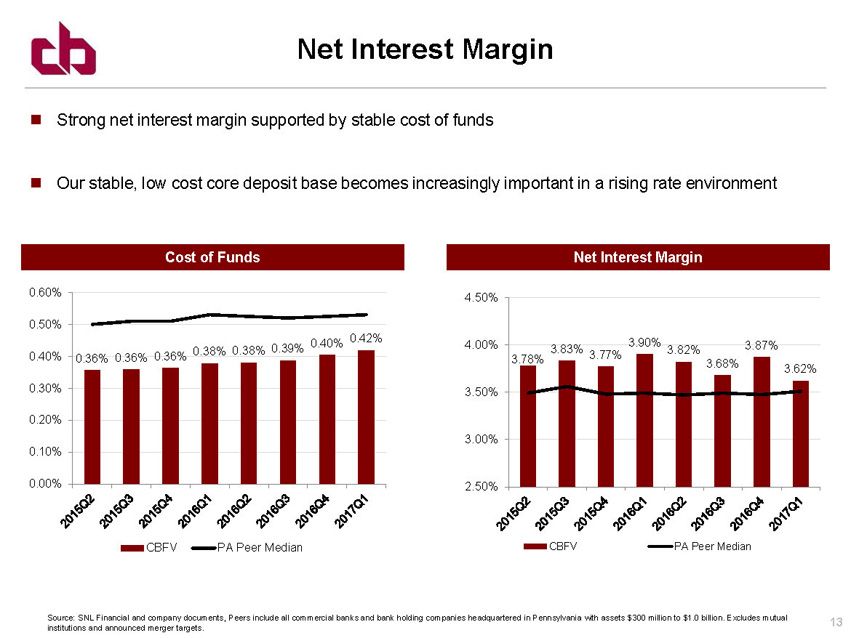
13 Cost of Funds Source: SNL Financial and company documents, Peers include all commercial banks and bank holding companies headquartered in Pennsylvania with assets $300 million to $1.0 bil lion. Excludes mutual institutions and announced merger targets. Net Interest Margin Strong net interest margin supported by stable cost of funds Our stable, low cost core deposit base becomes increasingly important in a rising rate environment Net Interest Margin 0.36% 0.36% 0.36% 0.38% 0.38% 0.39% 0.40% 0.42% 0.00% 0.10% 0.20% 0.30% 0.40% 0.50% 0.60% CBFV PA Peer Median 3.78% 3.83% 3.77% 3.90% 3.82% 3.68% 3.87% 3.62% 2.50% 3.00% 3.50% 4.00% 4.50% CBFV PA Peer Median
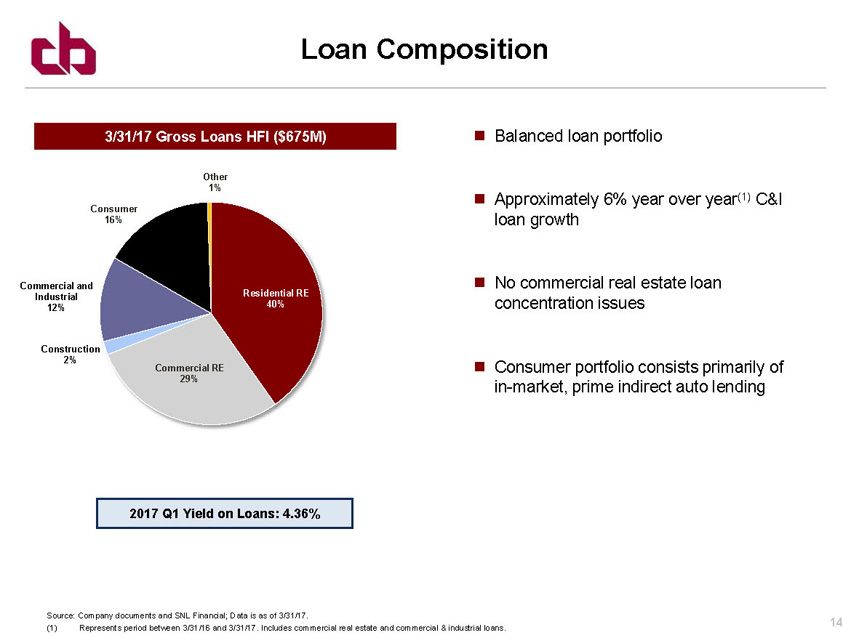
14 Loan Composition Source: Company documents and SNL Financial; Data is as of 3/31/17. (1) Represents period between 3/31/16 and 3/31/17. Includes commercial real estate and commercial & industrial loans . 2017 Q1 Yield on Loans: 4.36% Balanced loan portfolio Approximately 6% year over year (1) C&I loan growth No commercial real estate loan concentration issues Consumer portfolio consists primarily of in - market, prime indirect auto lending 12/31/16 Gross Loans HFI ($682M) 12/3333333331/16 Gross Loans HFI ($682M) 3/31/17 Gross Loans HFI ($675M) Residential RE 40% Commercial RE 29% Construction 2% Commercial and Industrial 12% Consumer 16% Other 1%
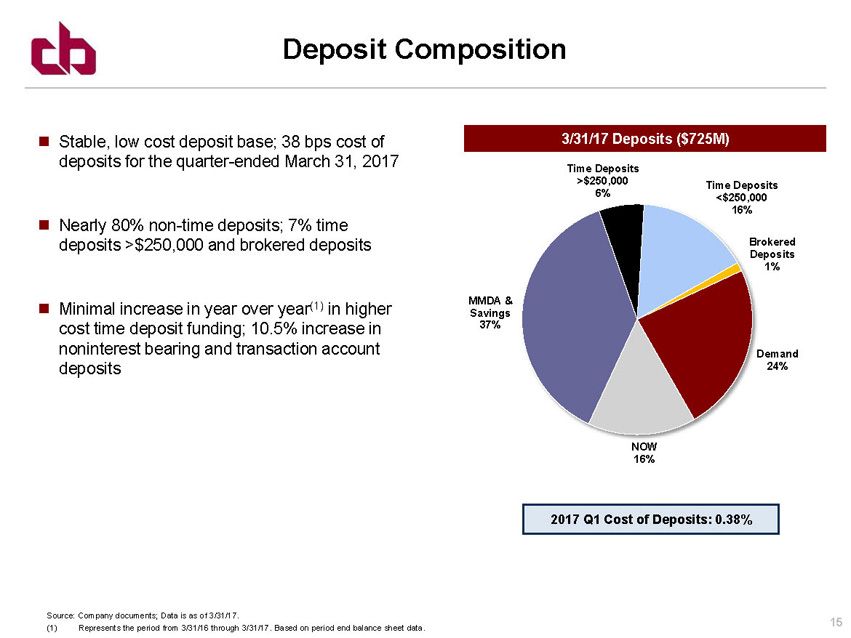
15 Source: Company documents; Data is as of 3/31/17. (1) Represents the period from 3/31/16 through 3/31/17. Based on period end balance sheet data. 2017 Q1 Cost of Deposits: 0.38% Stable, low cost deposit base; 38 bps cost of deposits for the quarter - ended March 31, 2017 Nearly 80% non - time deposits; 7% time deposits >$250,000 and brokered deposits Minimal increase in year over year (1) in higher cost time deposit funding; 10.5% increase in noninterest bearing and transaction account deposits Deposit Composition Demand 24% NOW 16% MMDA & Savings 37% Time Deposits >$250,000 6% Time Deposits <$250,000 16% Brokered Deposits 1% 3/31/17 Deposits ($725M)
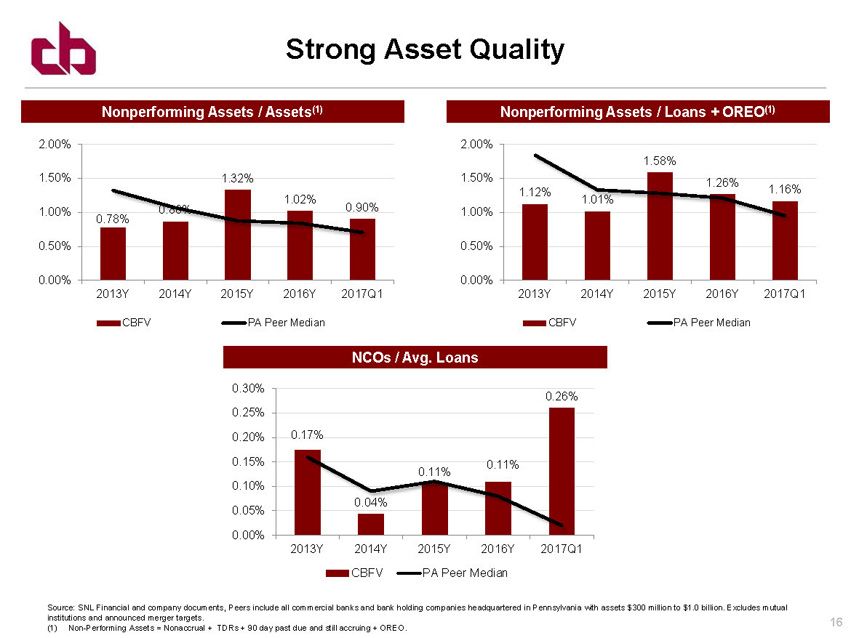
16 Nonperforming Assets / Assets (1) Nonperforming Assets / Loans + OREO (1) NCOs / Avg. Loans Source: SNL Financial and company documents, Peers include all commercial banks and bank holding companies headquartered in Pennsylvania with assets $300 million to $1.0 billio n. Excludes mutual institutions and announced merger targets. (1) Non - Performing Assets = Nonaccrual + TDRs + 90 day past due and still accruing + OREO . Strong Asset Quality 0.78% 0.86% 1.32% 1.02% 0.90% 0.00% 0.50% 1.00% 1.50% 2.00% 2013Y 2014Y 2015Y 2016Y 2017Q1 CBFV PA Peer Median 1.12% 1.01% 1.58% 1.26% 1.16% 0.00% 0.50% 1.00% 1.50% 2.00% 2013Y 2014Y 2015Y 2016Y 2017Q1 CBFV PA Peer Median 0.17% 0.04% 0.11% 0.11% 0.26% 0.00% 0.05% 0.10% 0.15% 0.20% 0.25% 0.30% 2013Y 2014Y 2015Y 2016Y 2017Q1 CBFV PA Peer Median
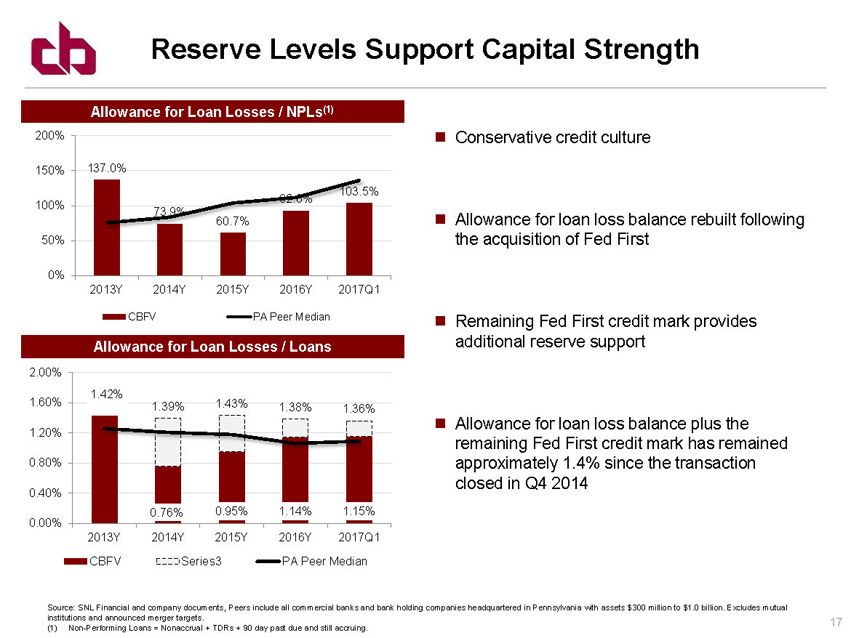
17 Allowance for Loan Losses / NPLs (1) Allowance for Loan Losses / Loans Source: SNL Financial and company documents, Peers include all commercial banks and bank holding companies headquartered in Pennsylvania with assets $300 million to $1.0 billio n. Excludes mutual institutions and announced merger targets. (1) Non - Performing Loans = Nonaccrual + TDRs + 90 day past due and still accruing . Reserve Levels Support Capital Strength Conservative credit culture Allowance for loan loss balance rebuilt following the acquisition of Fed First Remaining Fed First credit mark provides additional reserve support Allowance for loan loss balance plus the remaining Fed First credit mark has remained approximately 1.4% since the transaction closed in Q4 2014 137.0% 73.9% 60.7% 92.6% 103.5% 0% 50% 100% 150% 200% 2013Y 2014Y 2015Y 2016Y 2017Q1 CBFV PA Peer Median 1.42% 0.76% 0.95% 1.14% 1.15% 1.39% 1.43% 1.38% 1.36% 0.00% 0.40% 0.80% 1.20% 1.60% 2.00% 2013Y 2014Y 2015Y 2016Y 2017Q1 CBFV Series3 PA Peer Median
18 Investment Returns and Potential
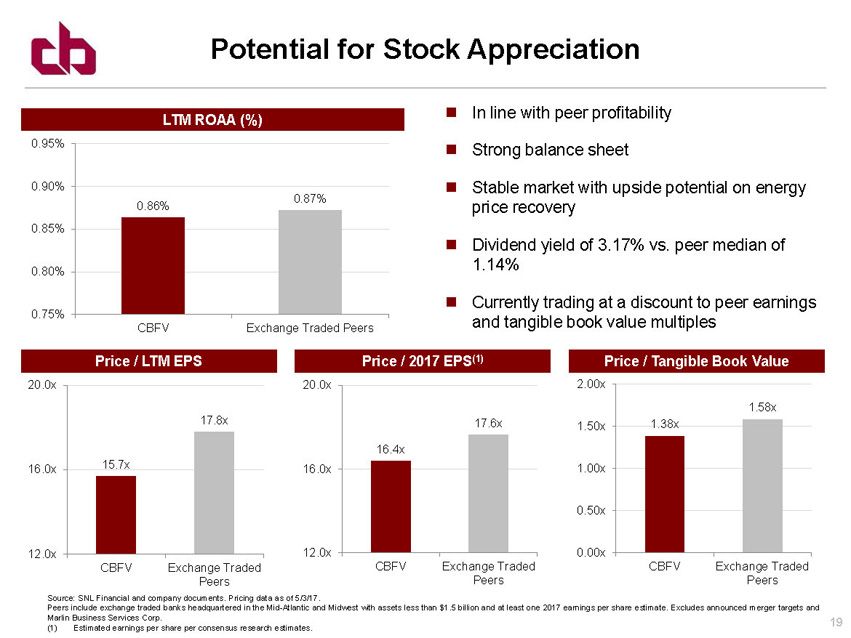
19 LTM ROAA (%) Price / LTM EPS Source: SNL Financial and company documents. Pricing data as of 5/3/17. Peers include exchange traded banks headquartered in the Mid - Atlantic and Midwest with assets less than $1.5 billion and at leas t one 2017 earnings per share estimate. Excludes announced merger targets and Marlin Business Services Corp. (1) Estimated earnings per share per consensus research estimates. Potential for Stock Appreciation In line with peer profitability Strong balance sheet Stable market with upside potential on energy price recovery Dividend yield of 3.17% vs. peer median of 1.14% Currently trading at a discount to peer earnings and tangible book value multiples Price / Tangible Book Value Price / 2017 EPS (1) 0.86% 0.87% 0.75% 0.80% 0.85% 0.90% 0.95% CBFV Exchange Traded Peers 15.7x 17.8x 12.0x 16.0x 20.0x CBFV Exchange Traded Peers 1.38x 1.58x 0.00x 0.50x 1.00x 1.50x 2.00x CBFV Exchange Traded Peers 16.4x 17.6x 12.0x 16.0x 20.0x CBFV Exchange Traded Peers
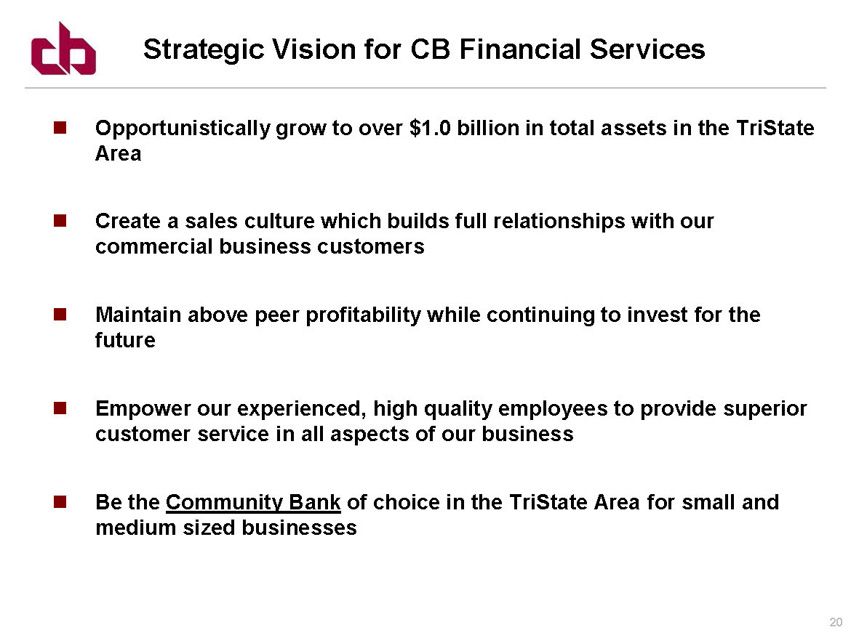
20 Opportunistically grow to over $1.0 billion in total assets in the TriState Area Create a sales culture which builds full relationships with our commercial business customers Maintain above peer profitability while continuing to invest for the future Empower our experienced, high quality employees to provide superior customer service in all aspects of our business Be the Community Bank of choice in the TriState Area for small and medium sized businesses Strategic Vision for CB Financial Services
21 Appendix
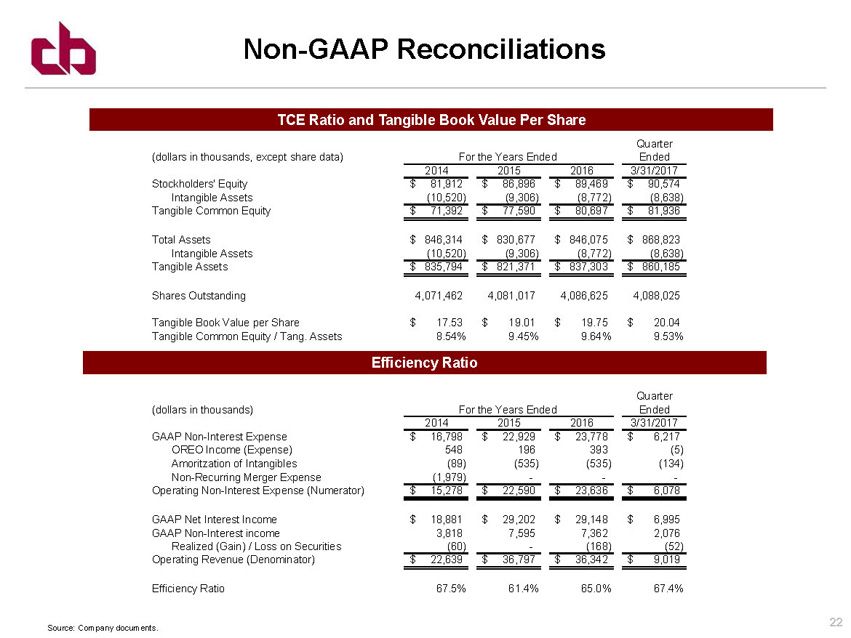
22 Non - GAAP Reconciliations TCE Ratio and Tangible Book Value Per Share Source: Company documents. Efficiency Ratio Quarter (dollars in thousands, except share data) For the Years Ended Ended 2014 2015 2016 3/31/2017 Stockholders' Equity 81,912$ 86,896$ 89,469$ 90,574$ Intangible Assets (10,520) (9,306) (8,772) (8,638) Tangible Common Equity 71,392$ 77,590$ 80,697$ 81,936$ Total Assets 846,314$ 830,677$ 846,075$ 868,823$ Intangible Assets (10,520) (9,306) (8,772) (8,638) Tangible Assets 835,794$ 821,371$ 837,303$ 860,185$ Shares Outstanding 4,071,462 4,081,017 4,086,625 4,088,025 Tangible Book Value per Share 17.53$ 19.01$ 19.75$ 20.04$ Tangible Common Equity / Tang. Assets 8.54% 9.45% 9.64% 9.53% Quarter (dollars in thousands) For the Years Ended Ended 2014 2015 2016 3/31/2017 GAAP Non-Interest Expense 16,798$ 22,929$ 23,778$ 6,217$ OREO Income (Expense) 548 196 393 (5) Amoritzation of Intangibles (89) (535) (535) (134) Non-Recurring Merger Expense (1,979) - - - Operating Non-Interest Expense (Numerator) 15,278$ 22,590$ 23,636$ 6,078$ GAAP Net Interest Income 18,881$ 29,202$ 29,148$ 6,995$ GAAP Non-Interest income 3,818 7,595 7,362 2,076 Realized (Gain) / Loss on Securities (60) - (168) (52) Operating Revenue (Denominator) 22,639$ 36,797$ 36,342$ 9,019$ Efficiency Ratio 67.5% 61.4% 65.0% 67.4%
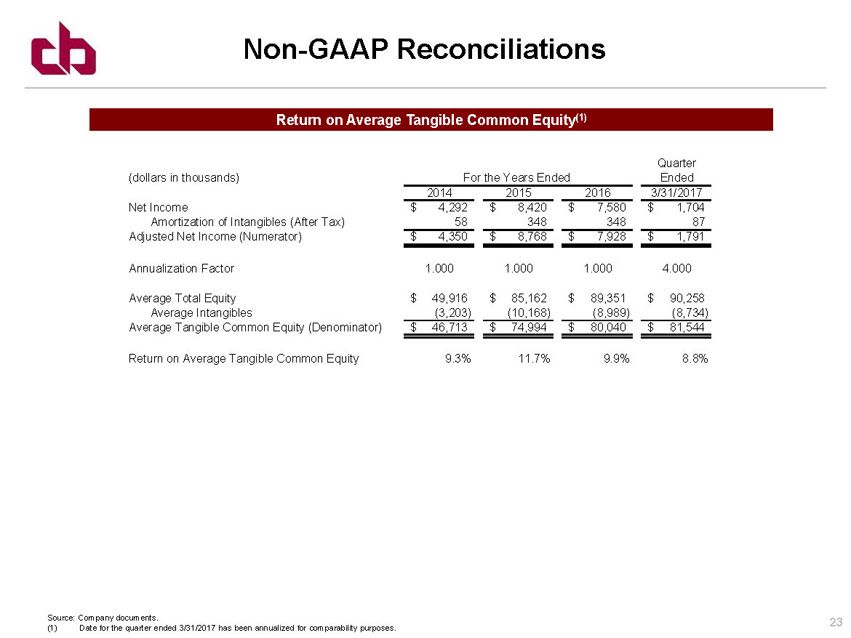
23 Non - GAAP Reconciliations Return on Average Tangible Common Equity (1) Source: Company documents. (1) Date for the quarter ended 3/31/2017 has been annualized for comparability purposes. Quarter (dollars in thousands) For the Years Ended Ended 2014 2015 2016 3/31/2017 Net Income 4,292$ 8,420$ 7,580$ 1,704$ Amortization of Intangibles (After Tax) 58 348 348 87 Adjusted Net Income (Numerator) 4,350$ 8,768$ 7,928$ 1,791$ Annualization Factor 1.000 1.000 1.000 4.000 Average Total Equity 49,916$ 85,162$ 89,351$ 90,258$ Average Intangibles (3,203) (10,168) (8,989) (8,734) Average Tangible Common Equity (Denominator) 46,713$ 74,994$ 80,040$ 81,544$ Return on Average Tangible Common Equity 9.3% 11.7% 9.9% 8.8%