Attached files
| file | filename |
|---|---|
| 8-K - 8-K - GETTY REALTY CORP /MD/ | d374948d8k.htm |
 Investor Presentation
Exhibit 99.1 |
 Safe Harbor Statement
1 Certain statements in this Presentation constitute “forward-looking statements” within the meaning of the federal securities laws. Forward-looking statements are statements that relate to management’s expectations or beliefs, future plans and strategies, future financial performance and similar expressions concerning matters that are not historical facts. In some cases, forward-looking statements can be identified by the use of forward-looking terminology such as “may,” “will,” “should,” “expects,” “intends,” “plans,” “anticipates,” “believes,” “estimates,” “predicts,” or “potential.” Such forward-looking statements reflect current views with respect to the matters referred to and are based on certain assumptions and involve known and unknown risks, uncertainties and other important factors, many of which are beyond the Company’s control, that could cause the actual results, performance, or achievements of the Company to differ materially from any future results, performance, or achievement implied by such forward- looking statements. While forward-looking statements reflect the Company’s good faith beliefs, assumptions and expectations, they are not guarantees of future performance. The Company does not undertake any obligation to publicly update or revise any forward-looking statements to reflect changes in underlying assumptions or factors, new information, data or methods, future events or other changes. Examples of forward-looking statements in this Presentation include, but are not limited to, statement(s): (a) relating to the Company’s Portfolio, Net Lease Portfolio, Long-Term Leases and Rent Escalators, Tenant Base, Growth Platform, Market Opportunity, and Redevelopment Projects, (b) relating to Industry Fundamentals and (c) relating to the Company’s Balance Sheet, Dividend Growth and Investment Highlights. Other unknown or unpredictable factors could also have material adverse effects on our business, financial condition, liquidity, results of operations and prospects. For a further discussion of these and other factors that could cause the Company’s future results to differ materially from any forward-looking statements, see the Company’s Annual Report on Form 10-K for the year ended December 31, 2016 and the Company’s other filings with the SEC, including, in particular, the section entitled “Risk Factors” contained therein. In light of these risks, uncertainties, assumptions and factors, there can be no assurance that the results and events contemplated by the forward-looking statements contained in this Presentation will, in fact, transpire. Moreover, because the Company operates in a very competitive and rapidly changing environment, new risks are likely to emerge from time to time. Given these risks and uncertainties, potential investors are cautioned not to place undue reliance on these forward-looking statements as a prediction of future results. Unless otherwise noted in this Presentation, all reported financial data is presented as of the period ended March 31, 2017, and all portfolio data is as of March 31, 2017. Except as required under the federal securities laws and the rules and regulations of the SEC, the Company does not undertake any obligation to release publicly any revisions to the forward-looking statements to reflect events or circumstances after the date of this Presentation or to reflect the occurrence of unanticipated events. The information contained herein has been prepared from public and non-public sources believed to be reliable. However, the Company has not independently verified certain of the information contained herein, and does not make any representation or warranty as to the accuracy or completeness of the information contained in this Presentation. |
 Investment Highlights
2 1 National Retail Net Lease Portfolio Located in Mature and High Growth Markets
2 Stable Cash Flows Supported by Increasingly Institutional Quality Credit Tenants
with Long-Term Triple-Net Leases
5 Industry Leading Expertise as Underwriter and Owner of Convenience Stores and
Gasoline Stations
3 4 Selectively Repurposing, Repositioning and Redeveloping Locations to Maximize
Value 6 Strong Balance Sheet Positioned for Future Growth Leadership Position with Proven Platform to Successfully Pursue Growth in a
Consolidating Sector |
 Company Overview |
 Corporate History
4 1955: Leo Liebowitz
and Milton Safenowitz purchase a gas station in New York City 1985: Acquires the northeastern retail petroleum
distribution and marketing assets, and Getty®
trademark for retail petroleum, from Texaco
1971: Getty grows its portfolio to
roughly 75 service stations and holds its initial
public offering under the name Power Test Corp.
1990
1980 1955 1970 January 2016: Completes successful
senior leadership transition and key
employee recruitment
2015 2010 2000 2001: Elects to be taxed as a
REIT with the year beginning
January 1, 2001
June 2015: Acquires 77 properties for
$215 million from Pacific Convenience and Fuels
and leases them to United Oil
2009: Completes sale-leaseback of 36 Exxon branded properties from White Oak Petroleum for $49 million 2011: Acquires 59 Mobil branded properties in a
sale-leaseback and loan transaction with CPD for $111 million; also completes 66 Shell branded
properties in sale-leaseback transaction with Nouria
Energy for $87 million
1997: Completes the spin-off of its petroleum marketing business and forms Getty Realty Corp. 2013: Completes sale-leaseback of 36
properties from Capitol Petroleum Group for $72.5
million June 2016:
Launches $125 million at-the-market equity
offering program
2012 –
2016: Re-leases 374 properties and sells 366 properties as part of portfolio repositioning Feb. 2017:Completes $50 million debt private placement |
 National Net Lease Portfolio
5 823 properties (736 fee, 87 leased) located in 24 states plus Washington, D.C.
(1) — 806 net lease properties — 7 redevelopment properties — 10 vacant properties — 98.8% occupied (2) $32.5 million mortgage portfolio (9-9.5% yield) 1) As of March 31, 2017 2) Occupancy calculation excludes seven properties classified as redevelopment |
 Investment Overview |
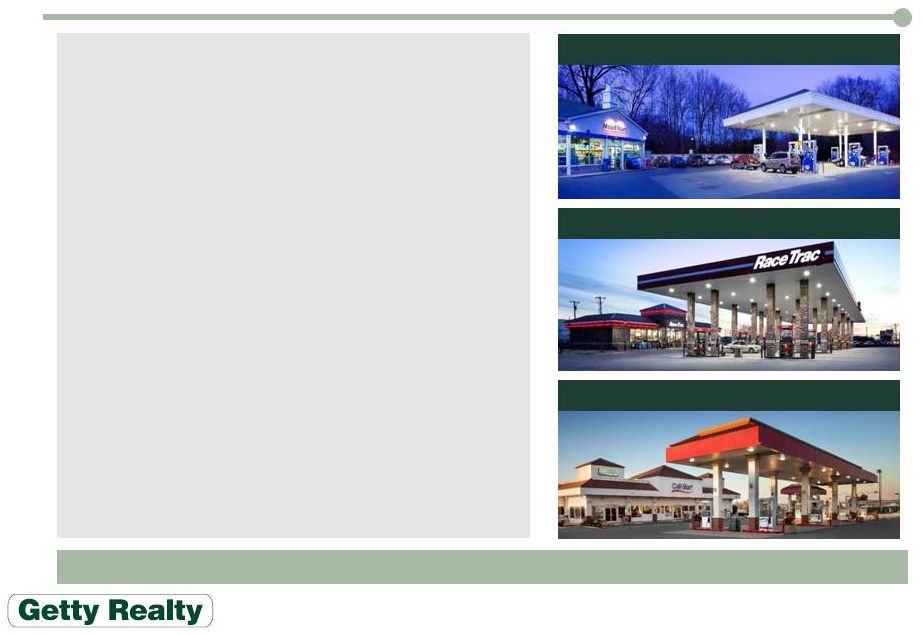 7 Convenience Store and Gasoline Station Properties — Stable, yet growing sector — Increasingly institutional tenant base Mature, Infill Markets — Densely populated areas — High barriers to entry — Limited new development — Prime locations and corners — Mature transportation grid — Convenient ingress and egress High Growth Markets — Favorable population demographics — 2015 United Oil acquisition accelerated entry into several new markets — High daily traffic counts Alternative Use Opportunities — Retail, banking, service, restaurant — Assemblage, redevelopment, repositioning Garland, TX Chula Vista, CA New Paltz, NY Attractive Net Lease Portfolio Well Positioned Portfolio that is Difficult to Replicate |
 59% of contractual annual rent attributable to leases with initial terms expiring in 2027 or beyond
Sustainable cash flows supported by long-term triple-net
leases —
Contractual rent increases of 1.0% –
2.0% with unitary lease portfolio weighted average of 1.6%
—
Rental coverage of 1.5x –
2.0x — Unitary tenant credit visibility via station and tenant financial statements
Majority of triple-net leases have 15-year initial terms
—
Leases are typically 15 to 20 years with extension options
—
Weighted average lease term, excluding renewal options, of approximately 11
years Stable Long-Term Lease Structure
Stable Long-Term Leases with Rent Escalators
8 1.9% 2.8% 6.6% 5.3% 2.4% 2.4% 1.6% 1.2% 2.9% 13.8% 59.1% 2017 2018 2019 2020 2021 2022 2023 2024 2025 2026 2027 |
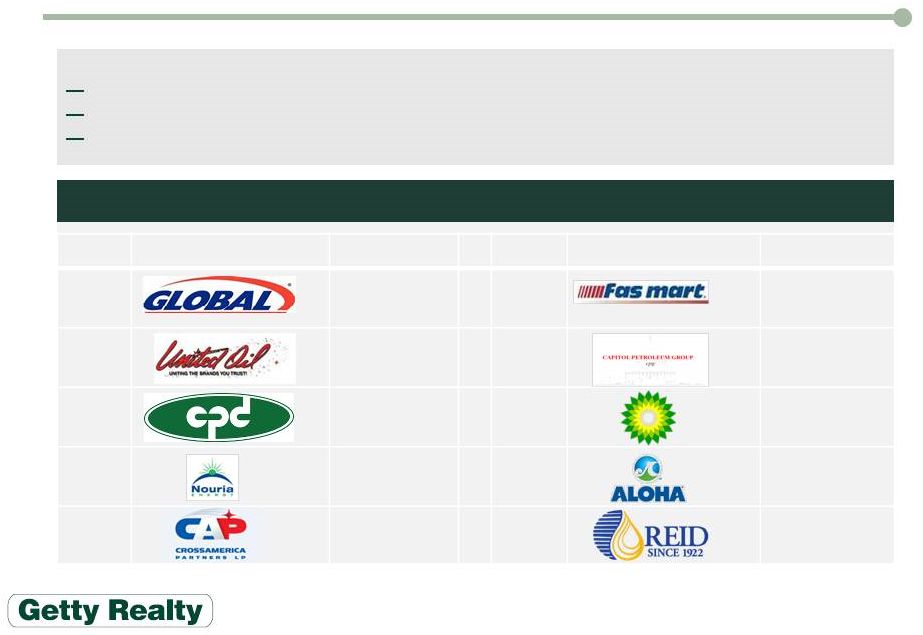 Top 10 Tenants
(2) High-Quality, Diversified Tenant Base 9 Total annualized base rent (ABR): Credit rated tenants (35%) Unitary / master lease tenants (1) (56%) Individual / single asset tenants (9%) Rank Tenant % of ABR Rank Tenant % of ABR 1 * 20% 6 + 7% 2 + 18% 7 + 6% 3 + 12% 8 * 3% 4 + 9% 9 * 2% 5 * 8% 10 + 2% 1) Excludes credit rated unitary / master lease tenants 2) Based on GAAP annualized base rent * Credit rated tenants, including subsidiaries of credit rated companies
+ Regional unitary tenants |
 10 Getty Growth Platform Embedded growth derived from long-term triple-net leases — 1% to 2% contractual annual rent increases Leasing activity — Leased nine properties and five properties in 2016 and 2017 YTD, respectively Asset recycling — Sold 14 properties ($5 million) and six properties ($1 million) in 2016 and 2017 YTD, respectively Opportunity to consolidate a fragmented market — Convenience store sector is recession and e-commerce resistant — Significant pipeline of actionable opportunities — Focused on both single asset and portfolio acquisitions 2017 YTD — Acquired five properties for $6 million — Weighted average cash return of 7.7% Over past five years completed $329 million of portfolio and single asset acquisitions Unlocking embedded value in existing portfolio — Five-year plan to redevelop 5% to 10% of properties — Targeting 10%+ unlevered yields — Improves tenant credit quality and coverage ratios — Diversifies retail tenant base Program results — Rent commenced on one redevelopment project — Executed leases and LOIs on 15 redevelopment projects — Building significant pipeline of high quality projects Organic Redevelopment Acquisitions |
 Number of convenience stores in service has
remained steady over last 10 years
(1) — More than 154,000 properties (81% selling fuel) represents 34% of all retail outlets — Single-store operators account for 63% of all convenience stores Stable Operator Performance (1) — Sales and pre-tax profits have grown at 4.5% and 8.5% CAGR since 2003, respectively
— In 2015, motor fuel sales accounted for 61% of total industry revenue — Operator profit margins exhibit less volatility than broader commodity market Consumers embracing convenience stores (1) — Average store with fuel has around 1,100
customer visits per day — Stores expanding offerings to become part grocery, restaurant, bank and drug store — Record overall industry profits in 2015, due to growth of in-store sales, led by strong demand for foodservice products Convenience Stores Dominate Retail Landscape 11 1) Sources: National Association of Convenience Stores 2) Average in-store margin of Couche-Tard, Casey's General Store & CST Brands used as an example of the broader market
trends 3)
Sunoco LP margins from its investor presentation used as an example of
the broader market trends for retail and wholesale margins
Convenience Store Margins ($bn)
(2) (3) Convenience Store Sales ($bn) (1) |
 Large Market Opportunity
12 Expertise in underwriting unit level and tenant credit Appraising underlying real estate to support replacement value Established record of diligencing environmental site conditions Strict adherence to proprietary underwriting standards The Getty Competitive Advantage Estimated Addressable Market Size (1) — Total market size estimated at $175 billion to $250 billion — Getty estimates up to 40% ($70 billion) of the market is addressable for potential acquisition Aggregation Opportunity — Highly fragmented with current REIT ownership of less than 2% of total stores — Sale/leaseback structure attractive for smaller, capital constrained sellers Industry Consolidation — Traditional owner/operators — Public and non-traded REITs — Public MLPs — Private equity 1) Source: Company estimate based on National Association of Convenience Stores data |
 Financial Overview |
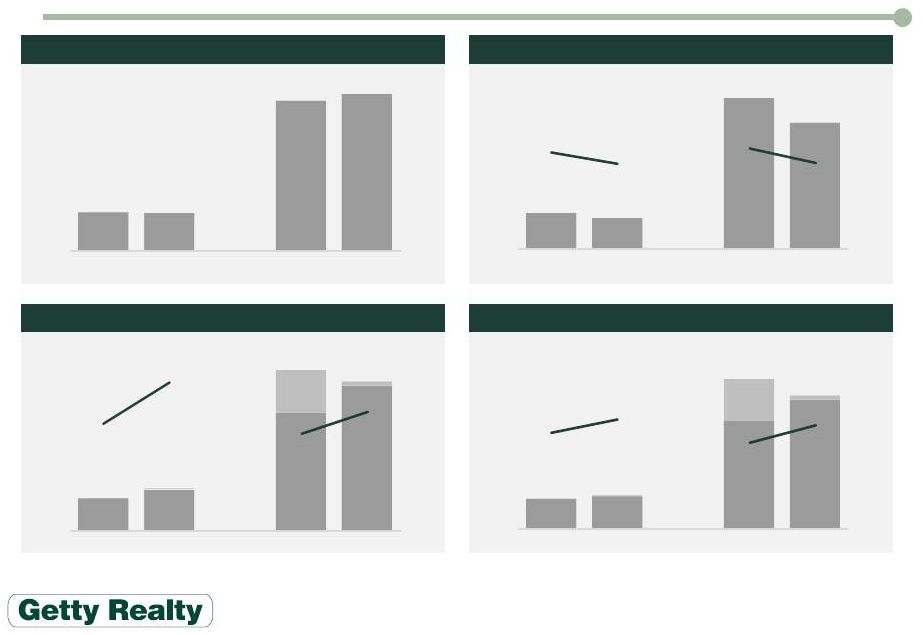 Income Growth, Scalable G&A
14 AFFO ($ thousands) (1) FFO ($ thousands) (1) 14,147 17,857 50,957 62,462 307 (3) 18,177 (2) 1,720 (3) 49.8% 64.6% 46.0% 54.2% 10.0% 20.0% 30.0% 40.0% 50.0% 60.0% 70.0% - 10,000 20,000 30,000 40,000 50,000 60,000 70,000 1Q16 1Q17 2015 2016 Margin 13,161 14,154 47,028 56,231 307 (3) 18,177 (2) 1,720 (3) 46.3% 51.2% 42.5% 48.8% 10.0% 20.0% 30.0% 40.0% 50.0% 60.0% 70.0% - 10,000 20,000 30,000 40,000 50,000 60,000 70,000 1Q16 1Q17 2015 2016 Margin 28,427 27,648 110,733 115,266 - 20,000 40,000 60,000 80,000 100,000 120,000 1Q16 1Q17 2015 2016 4,044 3,493 16,930 14,154 1.8% 1.6% 1.9% 1.6% 0.0% 0.5% 1.0% 1.5% 2.0% 2.5% 3.0% - 2,000 4,000 6,000 8,000 10,000 12,000 14,000 16,000 18,000 1Q16 1Q17 2015 2016 % of Assets G&A ($ thousands) Revenue ($ thousands) 1) AFFO and FFO are non-GAAP measures. For a description of how Getty calculates AFFO and FFO
and for a reconciliation to Net Earnings, see Item 2 of
our Quarterly Report on Form 10-Q for the period ended March 31, 2017. Margins exclude items detailed in footnotes 2 and 3 below
2) Includes $18.2 million of income
received from the Getty Petroleum Marketing Inc. bankruptcy estate for the 12 months ended December 31, 2015
3) Includes a net $0.3 million and
$1.7 million of environmental insurance reimbursements, recoveries of uncollectible accounts and other income for the three months ended March
31, 2017 and the 12 months ended December 31, 2016, respectively |
 Strong Balance Sheet
15 Credit Agreement — Revolving Credit Facility — $175 million — Matures 2018 with 1-year option — LIBOR +195 to 325 bps based on leverage — Bank Term Loan — $50 million — Matures 2020 — LIBOR +190 to 320 bps based on leverage Senior Unsecured Notes — Series A: 6.0% $100 million matures 2021 — Series B: 5.35% $75 million matures 2023 — Series C: 4.75% $50 million matures 2025 $125 million ATM Equity Issuance Program — $20 million of issuance Credit Statistics Maturity Schedule ($ millions) Debt to Total Capitalization 25% Net Debt to EBITDA (1) 3.4x Fixed Charge Coverage (1) 3.2x Weighted Average Interest Rate 5.0% Weighted Average Maturity 4.8 yrs Variable Rate vs. Fixed Rate 25% / 75% 1) As defined in the Company’s loan agreements |
 Market Asset Type Anticipated Total Investment (1) Investment As Of 3/31/17 Estimated Completion (2) Active Projects White Plains, NY Retail $368 $147 2017 Howell, NJ Retail 549 8 2018 Millerton, NY Retail & QSR 943 36 2018 Phoenixville, PA Financial Services 366 15 2018 Falmouth, MA Urgent Care 1,687 36 2018 Worcester, MA Convenience Store 1,800 10 2018 Freehold, NJ Fast Casual Restaurant 756 151 2019 Active Projects Total 6,469 403 Pipeline Eight sites Various 4,746 204 2017-2018 Total $11,215 $607 Redevelopment Activity ($ thousands) 16 Redevelopment Projects 1) Anticipated total investment includes development costs, termination/recapture fees and leasing commissions
2) No assurance can be given that any of these redevelopment projects will be completed. At completion redevelopment projects are
reclassified as operating real estate on the balance
sheet |
 17 Consistent Dividend Growth 1) Excludes special dividends of $0.05, $0.14 and $0.22 per share in 4Q13, 4Q14 and 4Q15, respectively
$0.00 $0.05 $0.10 $0.15 $0.20 $0.25 $0.30 2Q13 3Q13 4Q13 1Q14 2Q14 3Q14 4Q14 1Q15 2Q15 3Q15 4Q15 1Q16 2Q16 3Q16 4Q16 1Q17 2Q17 Quarterly Dividends Declared per Share (1) |
 Investment Highlights
1 National Retail Net Lease Portfolio Located in Mature and High Growth Markets
2 Stable Cash Flows Supported by Increasingly Institutional Quality Credit Tenants
with Long-Term Triple-Net Leases
5 Industry Leading Expertise as Underwriter and Owner of Convenience Stores and
Gasoline Stations
3 4 Selectively Repurposing, Repositioning and Redeveloping Locations to Maximize
Value 6 Strong Balance Sheet Positioned for Future Growth Leadership Position with Proven Platform to Successfully Pursue Growth in a
Consolidating Sector
18 |
 Appendix |
 Reconciliation of Net Income to FFO and AFFO
20 3 months ended March 31, 12 months ended December 31, $ in thousands, except per share amounts (1) 2016 2017 (3) 2015 (2) 2016 (3) Net earnings $7,703 $9,704 $37,410 $38,411 Depreciation and amortization of real estate assets
4,622 4,392 16,974 19,170 Loss (gains) on dispositions of real estate
(487) 331 (2,611)
(6,213)
Impairments
2,309 3,737 17,361 12,814 FFO 14,147 18,164 69,134 64,182 Revenue recognition adjustments
(952) (419) (4,471) (3,417) Allowance for deferred rental revenue
- -
(93) -
Changes in environmental estimates (987) (4,317) (4,639) (7,007) Accretion expense
953 1,033
4,829
4,107
Acquisition costs
- -
445 86
AFFO $13,161 $14,461 $65,205 $57,951 Basic and diluted weighted average shares outstanding
33,659 34,555 33,420 33,806 Earnings per share
$0.23 $0.28 $1.11 $1.12 FFO per share 0.42 0.52 2.04 1.87 AFFO per share $0.39 $0.41 $1.93 $1.69 1) AFFO and FFO are non-GAAP measures. For a description of how Getty calculates AFFO and FFO
see Item 2 in the Quarterly Report on our Form 10-Q
for the period ended March 31, 2017 2) Includes $18.2 million of income received from the Getty Petroleum Marketing Inc. bankruptcy
estate for the twelve months ended December 31, 2015 3) Includes a net $0.3 million and $1.7 million of environmental insurance reimbursements, recoveries of uncollectible accounts and other income for
the three months ended March 31, 2017 and the 12 months ended December 31, 2016, respectively |