Attached files
| file | filename |
|---|---|
| EX-32.2 - EX-32.2 - GETTY REALTY CORP /MD/ | d62672dex322.htm |
| EX-23 - EX-23 - GETTY REALTY CORP /MD/ | d62672dex23.htm |
| EX-21 - EX-21 - GETTY REALTY CORP /MD/ | d62672dex21.htm |
| EX-32.1 - EX-32.1 - GETTY REALTY CORP /MD/ | d62672dex321.htm |
| EX-31.(I).2 - EX-31(I).2 - GETTY REALTY CORP /MD/ | d62672dex31i2.htm |
| EX-31.(I).1 - EX-31(I).1 - GETTY REALTY CORP /MD/ | d62672dex31i1.htm |
Table of Contents
UNITED STATES
SECURITIES AND EXCHANGE COMMISSION
WASHINGTON, D.C. 20549
FORM 10-K
| x | ANNUAL REPORT PURSUANT TO SECTION 13 OR 15(d) OF THE SECURITIES EXCHANGE ACT OF 1934 |
FOR THE FISCAL YEAR ENDED DECEMBER 31, 2015
OR
| ¨ | TRANSITION REPORT PURSUANT TO SECTION 13 OR 15(d) OF THE SECURITIES EXCHANGE ACT OF 1934 |
COMMISSION FILE NUMBER 001-13777
GETTY REALTY CORP.
(Exact name of registrant as specified in its charter)
| Maryland | 11-3412575 | |
| (State or other jurisdiction of incorporation or organization) |
(I.R.S. employer identification no.) | |
| Two Jericho Plaza, Suite 110, Jericho, New York | 11753-1681 | |
| (Address of principal executive offices) | (Zip Code) | |
Registrant’s telephone number, including area code: (516) 478-5400
Securities registered pursuant to Section 12(b) of the Act:
| TITLE OF EACH CLASS |
NAME OF EACH EXCHANGE ON WHICH REGISTERED | |
| Common Stock, $0.01 par value | New York Stock Exchange |
Securities registered pursuant to Section 12(g) of the Act:
None
(Title of Class)
Indicate by check mark whether the registrant has submitted electronically and posted on its corporate Web site, if any, every Interactive Data File required to be submitted and posted pursuant to Rule 405 of Regulation S-T during the preceding 12 months (or for such shorter period that the registrant was required to submit and post such files). Yes x No ¨
Indicate by check mark if the registrant is a well-known seasoned issuer, as defined in Rule 405 of the Securities Act. Yes ¨ No x
Indicate by check mark if the registrant is not required to file reports pursuant to Section 13 or Section 15(d) of the Exchange Act. Yes ¨ No x
Indicate by check mark whether the registrant (1) has filed all reports required to be filed by Section 13 or 15(d) of the Securities Exchange Act of 1934 during the preceding 12 months (or for such shorter period that the registrant was required to file such reports), and (2) has been subject to such filing requirements for the past 90 days. Yes x No ¨
Indicate by check mark if disclosure of delinquent filers pursuant to Item 405 of Regulation S-K is not contained herein, and will not be contained, to the best of registrant’s knowledge, in definitive proxy or information statements incorporated by reference in Part III of this Form 10-K or any amendment to this Form 10-K. ¨
Indicate by check mark whether the registrant is a large accelerated filer, an accelerated filer, a non-accelerated filer or a smaller reporting company. See the definitions of “large accelerated filer,” “accelerated filer” and “smaller reporting company” in Rule 12b-2 of the Exchange Act. (Check one):
| Large accelerated filer | ¨ | Accelerated filer | x | |||
| Non-accelerated filer | ¨ (Do not check if a smaller reporting company) | Smaller reporting company | ¨ | |||
Indicate by check mark whether the registrant is a shell company (as defined in Rule 12b-2 of the Exchange Act). Yes ¨ No x
The aggregate market value of common stock held by non-affiliates (25,560,734 shares of common stock) of the Company was $418,174,000 as of June 30, 2015.
The registrant had outstanding 33,683,867 shares of common stock as of March 10, 2016.
DOCUMENTS INCORPORATED BY REFERENCE
| DOCUMENT |
PART OF | |
| Selected Portions of Definitive Proxy Statement for the 2016 Annual Meeting of Stockholders (the “Proxy Statement”), which will be filed by the registrant on or prior to 120 days following the end of the registrant’s year ended December 31, 2015 pursuant to Regulation 14A. |
III |
Table of Contents
| Item |
Description |
Page |
||||
| 3 | ||||||
| PART I | ||||||
| 1 | 5 | |||||
| 1A | 9 | |||||
| 1B | 19 | |||||
| 2 | 19 | |||||
| 3 | 21 | |||||
| 4 | 24 | |||||
| PART II | ||||||
| 5 | 25 | |||||
| 6 | 27 | |||||
| 7 | Management’s Discussion and Analysis of Financial Condition and Results of Operations |
28 | ||||
| 7A | 42 | |||||
| 8 | 43 | |||||
| 9 | Changes in and Disagreements with Accountants on Accounting and Financial Disclosure |
70 | ||||
| 9A | 70 | |||||
| 9B | 70 | |||||
| PART III | ||||||
| 10 | 72 | |||||
| 11 | 72 | |||||
| 12 | Security Ownership of Certain Beneficial Owners and Management and Related Stockholder Matters |
73 | ||||
| 13 | Certain Relationships and Related Transactions, and Director Independence |
73 | ||||
| 14 | 73 | |||||
| PART IV | ||||||
| 15 | 73 | |||||
| 93 | ||||||
| 94 | ||||||
Table of Contents
Cautionary Note Regarding Forward-Looking Statements
Certain statements in this Annual Report on Form 10-K may constitute “forward-looking statements” within the meaning of the Private Securities Litigation Reform Act of 1995. When we use the words “believes,” “expects,” “plans,” “projects,” “estimates,” “anticipates,” “predicts” and similar expressions, we intend to identify forward-looking statements. (All capitalized and undefined terms used in this section shall have the same meanings hereafter defined in this Annual Report on Form 10-K.)
Examples of forward-looking statements included in this Annual Report on Form 10-K include, but are not limited to, statements regarding: our network of convenience store and gasoline station properties; substantial compliance of our properties with federal, state and local provisions enacted or adopted pertaining to environmental matters; the impact of existing legislation and regulations on our competitive position; our prospective future environmental liabilities, including those resulting from preexisting unknown environmental contamination; quantifiable trends, which we believe allow us to make reasonable estimates of fair value for the future costs of environmental remediation resulting from the removal and replacement of USTs; our efforts, expectations and ability to re-lease or sell our transitional properties; incurring costs associated with repositioning our transitional properties including, but not limited to, operating expenses, environmental compliance costs, environmental remediation costs and potential capital expenditures; the impact of our redevelopment efforts related to certain of our properties; the amount of revenue we expect to realize from our properties; our belief that our owned and leased properties are adequately covered by casualty and liability insurance; AFFO and its utility in comparing the sustainability of our operating performance with the sustainability of the operating performance of other REITs; our expectations regarding the NECG Lease; corporate-level federal income taxes; our ability to pay dividends; our stock price; the reasonableness of our estimates, judgments, beliefs, projections and assumptions used regarding our accounting estimates, allowances, accruals, judgments and assumptions; our critical accounting policies; our exposure and liability due to and our accruals, estimates and assumptions regarding our environmental liabilities and remediation costs; loan loss reserves or allowances; our belief that our accruals for environmental and litigation matters including matters related to our former Newark, New Jersey Terminal and the Lower Passaic River and MTBE multi-district litigation cases in the states of New Jersey and Pennsylvania, were appropriate based on the information then available; compliance with federal, state and local provisions enacted or adopted pertaining to environmental matters; our beliefs about the settlement proposals we receive and the probable outcome of litigation or regulatory actions and their impact on us; our expected recoveries from UST funds; our indemnification obligations and the indemnification obligations of others; our investment strategy and its impact on our financial performance; the adequacy of our current and anticipated cash flows from operations, borrowings under our Credit Agreement and available cash and cash equivalents; our continued compliance with the covenants in our Credit Agreement and Restated Prudential Note Purchase Agreement; our belief that certain environmental liabilities can be allocated to others under various agreements; our belief that our real estate assets are not carried at amounts in excess of their estimated net realizable fair value amounts; and our ability to maintain our federal tax status as a REIT.
These forward-looking statements are based on our current beliefs and assumptions and information currently available to us, and involve known and unknown risks (including the risks described below in “Item 1A. Risk Factors” and in “Item 7. Management’s Discussion and Analysis of Financial Condition and Results of Operations” herein, and other risks that we describe from time to time in this and our other filings with the SEC), uncertainties and other factors which may cause our actual results, performance and achievements to be materially different from any future results, performance or achievements expressed or implied by these forward-looking statements.
These risks include, but are not limited to risks associated with: complying with environmental laws and regulations and the costs associated with complying with such laws and regulations; counterparty risks; the creditworthiness of our tenants; our tenants’ compliance with their lease obligations; renewal of existing leases and our ability to either re-lease or sell transitional properties; our dependence on external sources of capital; repositioning our transitional properties; the uncertainty of our estimates, judgments, projections and assumptions associated with our accounting policies and methods; our business operations generating sufficient cash for distributions or debt service; potential future acquisitions and our ability to successfully manage our investment strategy; adverse developments in general business, economic or political conditions; substantially all of our tenants depending on the same industry for their revenues; property taxes; potential exposure related to pending lawsuits and claims; owning real estate primarily concentrated in the Northeast and Mid-Atlantic regions of the United States; the adequacy of our insurance coverage; owning and leasing real estate generally; the impact of our electing to be treated as a REIT under the federal income tax laws, including failure to qualify as a REIT and paying taxes, penalties, interest or a deficiency dividend; changes in interest rates and our ability to manage or mitigate this risk effectively; dilution as a result of future issuances of equity securities; our dividend policy, ability to pay dividends and changes to our dividend policy; changes in market conditions; provisions in our corporate charter and by-laws; Maryland law discouraging a third-party takeover; adverse effect of inflation; the loss of a member or members of our management team; changes in accounting standards that may adversely affect our financial position; future impairment charges and our investors’ ability to determine the creditworthiness of our tenants; terrorist attacks and other acts of violence and war; and our information systems.
As a result of these and other factors, we may experience material fluctuations in future operating results on a quarterly or annual basis, which could materially and adversely affect our business, financial condition, operating results, ability to pay dividends or stock price. An investment in our stock involves various risks, including those mentioned above and elsewhere in this Annual Report on Form 10-K and those that are described from time to time in our other filings with the SEC.
3
Table of Contents
You should not place undue reliance on forward-looking statements, which reflect our view only as of the date hereof. We undertake no obligation to publicly release revisions to these forward-looking statements that reflect future events or circumstances or reflect the occurrence of unanticipated events.
4
Table of Contents
Company Profile
Getty Realty Corp., a Maryland corporation, is the leading publicly-traded real estate investment trust (“REIT”) in the United States specializing in the ownership, leasing and financing of convenience store and gasoline station properties. Our 851 properties are located in 23 states across the United States and Washington, D.C. Our properties are operated under a variety of brands including 76, Aloha, BP, Citgo, Conoco, Exxon, Getty, Mobil, Shell and Valero. We own the Getty® trademark and trade name in connection with our real estate and the petroleum marketing business in the United States.
We are self-administered and self-managed by our management team, which has extensive experience in owning, leasing and managing convenience store and gasoline station properties. We have invested, and will continue to invest, in real estate and real estate related investments when appropriate opportunities arise. As of March 10, 2016, we had 32 employees.
Company Operations
As of December 31, 2015, we owned 753 properties and leased 98 properties from third-party landlords. Our typical property is used as a convenience store and gasoline station, and is located on between one-half and three quarters of an acre of land in a metropolitan area. The properties that we have acquired since 2007 are generally located on larger parcels of land. In addition, many of our properties are located at highly trafficked urban intersections or conveniently close to highway entrances or exit ramps. Our properties are concentrated in the Northeast and Mid-Atlantic regions. We believe our network of convenience store and gasoline station properties across the Northeast and the Mid-Atlantic regions of the United States is unique and that comparable networks of properties are not readily available for purchase or lease from other owners or landlords.
Substantially all of our properties are leased on a triple-net basis primarily to petroleum distributors and, to a lesser extent, to individual operators. Generally our tenants supply fuel and either operate our properties directly or sublet our properties to operators who operate their convenience stores, gasoline stations, automotive repair service facilities or other businesses at our properties. Convenience store and gasoline station properties are an integral component of the transportation infrastructure supported by highly inelastic demand for petroleum products, day-to-day consumer goods and convenience foods. Substantially all of our tenants’ financial results depend on the sale of refined petroleum products, convenience store sales or rental income from their subtenants. As a result, our tenants’ financial results are highly dependent on the performance of the petroleum marketing industry, which is highly competitive and subject to volatility. During the terms of our leases, we monitor the credit quality of our triple-net tenants by reviewing their published credit rating, if available, reviewing publicly available financial statements, or financial or other operating statements which are delivered to us pursuant to applicable lease agreements, monitoring news reports regarding our tenants and their respective businesses, and monitoring the timeliness of lease payments and the performance of other financial covenants under their leases. As of December 31, 2015 we consider 805 of our properties to be part of our net lease portfolio (see below) and 46 of our properties to be transitional (see below).
| • | Net Lease Portfolio. As of December 31, 2015, we leased 805 properties to tenants under long-term triple-net leases; an increase of 109 properties, or 16%, over the year ended December 31, 2014. This increase in our net lease portfolio for the year ended December 31, 2015 resulted from our acquisition and leasing activities, offset by the impact of our disposition activities and certain previously net leased properties which we reclassified as transitional (as described below). Our net lease portfolio consists of 724 properties leased to 25 regional and national fuel distributors under unitary or master triple-net leases and 81 properties leased under single unit triple-net leases. |
Our triple-net leases generally provide for initial terms of 15 years with options for successive renewal terms of up to 20 years and include provisions for rental increases during the initial and renewal terms of the lease. As of December 31, 2015, our average lease term, excluding renewal options, weighted by the number of underlying properties, was approximately 12 years. Our triple-net tenants are responsible for the payment of all taxes, maintenance, repairs, insurance and other operating expenses relating to our properties, and are also responsible for environmental contamination occurring during the terms of their leases and in certain cases also for environmental contamination that existed before their leases commenced.
Several of our leases provide for additional rent based on the aggregate volume of fuel sold. For the year ended December 31, 2015, additional rent based on the aggregate volume of fuel sold was not material to our financial results. In addition, certain of our leases require the tenants to make capital expenditures at our properties, substantially all of which are related to the replacement of underground storage tanks (“UST” or “USTs”) that are owned by our tenants during the terms of their leases. As of December 31, 2015, we have a remaining commitment to fund as much as $11.9 million in the aggregate with our tenants for a portion of such capital expenditures within the next approximately five years. See “Leasing Activities” in Note 2 in “Item 8. Financial Statements and Supplementary Data — Notes to Consolidated Financial Statements” in this Annual Report on Form 10-K.
5
Table of Contents
| • | Transitional Properties. We regularly evaluate our portfolio of properties and, as of December 31, 2015, we had 46 properties which we consider to be transitional properties, defined as properties which we are actively repositioning for sale, redevelopment or re-leasing. As of December 31, 2014, we had 167 transitional properties, of which we either leased or disposed of 129 properties during 2015, representing a 77% year-over-year decline. The reduction in the number of our transitional properties can be attributed to: |
| • | Dispositions. During the year ended December 31, 2015, we sold 84 properties (70 properties were classified as transitional) for $25.1 million in the aggregate. Our 2015 disposition activities included the Company-financed sale of 48 properties to affiliates of Hanuman Business, Inc. (d/b/a “Ramoco”). These properties had been leased to Ramoco under a unitary lease (the “Ramoco Lease”) and had previously been designated as transitional properties as a consequence of our agreement with Ramoco to restructure such lease. In addition, one third-party leased property expired during the year ended December 31, 2015. |
| • | Leasing Activities. During the year ended December 31, 2015, we leased 58 transitional properties to tenants under long-term triple-net leases. As a result, these properties are now included in our net lease portfolio. Our 2015 leasing activities also included three new unitary leases covering an aggregate of 42 properties, which had previously been leased to NECG Holdings Corp., (“NECG”) under our unitary lease with NECG (the “NECG Lease”). As a result of the restructuring of the NECG Lease, as of December 31, 2015, the remaining properties in the NECG Lease continue to be transitional. See “NECG Lease Restructuring” in Note 2 in “Item 8. Financial Statements and Supplementary Data — Notes to Consolidated Financial Statements” in this Annual Report on Form 10-K. |
As of December 31, 2015, our 46 transitional properties were comprised of (i) eight properties subject to the NECG Lease, (ii) 15 properties occupied under month-to-month license agreements and (iii) 23 properties that are vacant. See “Month-to-Month License Agreements” in Note 2 in “Item 8. Financial Statements and Supplementary Data — Notes to Consolidated Financial Statements” in this Annual Report on Form 10-K.
We expect that we will either sell or enter into new leases on all of our transitional properties over time. In addition, we also expect to invest in redeveloping certain of our transitional properties for alternative single tenant net lease uses. See “Investment/Redevelopment Strategy and Activity” below. Although we are currently working on repositioning our transitional properties, the timing of pending or anticipated transactions may be affected by factors beyond our control and we cannot predict when or on what terms sales or leases will ultimately be consummated.
Investment / Redevelopment Strategy and Activity
As part of our overall growth strategy, we regularly review acquisition and financing opportunities to invest in additional convenience store and gasoline station properties, and we expect to continue to pursue investments that we believe will benefit our financial performance. In addition to sale/leaseback and other real estate acquisitions, our investment activities include purchase money financing with respect to properties we sell, and real property loans relating to our leasehold portfolios. Our investment strategy seeks to generate current income and benefit from long-term appreciation in the underlying value of our real estate. To achieve that goal we seek to invest in high quality individual properties and real estate portfolios that will promote our geographic diversity. A key element of our investment strategy is to invest in properties in strong primary markets that serve high density population centers. We cannot provide any assurance that we will be successful making additional investments, that investments will be available which meet our investment criteria or that our current sources of liquidity will be sufficient to fund such investments.
We believe that a portion of our properties are located in geographic areas, which together with other factors, may make them well-suited for alternative uses, such as, quick service restaurants, automotive parts and service stores, specialty retail stores and bank branch locations. We believe that such alternative types of properties can be leased or sold at higher values than their current use. We are in the process of pursuing redevelopment opportunities on certain of our transitional properties. In addition, we are also seeking to recapture select properties from our net lease portfolio to redevelop such properties for alternative uses.
During the year ended December 31, 2015, we acquired fee simple interests in 80 convenience store and gasoline station properties for an aggregate purchase price of $219.2 million. Included in these acquisitions was our June 3, 2015 acquisition of fee simple interests in 77 convenience store and gasoline station properties from affiliates of Pacific Convenience and Fuels LLC which we simultaneously leased to Apro, LLC (d/b/a “United Oil”), a leading regional convenience store and gasoline station operator, under three separate cross-defaulted long-term triple-net unitary leases (the “United Oil Transaction”). The United Oil properties are located across California, Colorado, Nevada, Oregon and Washington State and operate under several well recognized brands including 7-Eleven,
6
Table of Contents
76, Circle K, Conoco and My Goods Market. The total purchase price for the United Oil Transaction was $214.5 million, which was funded with proceeds from our Credit Agreement and Restated Prudential Note Purchase Agreement. For information regarding the United Oil Transaction see Note 10 in “Item 8. Financial Statements and Supplementary Data — Notes to Consolidated Financial Statement” in this Annual Report on Form 10-K. See Item 9B in this Annual Report on Form 10-K for selected combined audited financial data of United Oil.
Over the last five years, we have acquired more than 250 properties, located in various states, at an aggregate purchase price of approximately $514 million. These acquisitions include single property transactions and portfolio transactions ranging in size, the largest of which is the United Oil Transaction.
The History of Our Company
Our founders started the business in 1955 with the ownership of one gasoline service station in New York City and combined real estate ownership, leasing and management with service station operation and petroleum distribution. We held our initial public offering in 1971 under the name Power Test Corp. In 1985, we acquired from Texaco the petroleum distribution and marketing assets of Getty Oil Company in the Northeast United States along with the Getty® name and trademark in connection with our real estate and the petroleum marketing business in the United States.
Getty Petroleum Marketing, Inc. (“Marketing”) was formed to facilitate the spin-off of our petroleum marketing business to our shareholders, which was completed in 1997. Marketing was acquired by a U.S. subsidiary of OAO Lukoil (“Lukoil”) in December 2000. In connection with Lukoil’s acquisition of Marketing, we renegotiated our long-term unitary triple-net lease (the “Master Lease”) with Marketing. In December 2011, Marketing filed for Chapter 11 bankruptcy protection in the U.S. Bankruptcy Court (the “Bankruptcy Court”). The Master Lease was terminated effective April 30, 2012, and in July 2012, the Bankruptcy Court approved Marketing’s Plan of Liquidation and appointed a trustee (the “Liquidating Trustee”) to oversee liquidation of the Marketing estate (the “Marketing Estate”). During the year ended December 31, 2015, we received distributions from the Marketing Estate of approximately $18.2 million. Pursuant to a Final Decree issued by the Bankruptcy Court in October 2015, the Chapter 11 cases pertaining to the Marketing Estate were closed, subject to final distributions to creditors which were made by the Liquidating Trustee in November 2015. We do not expect to receive any further distributions from the Marketing Estate. Approximately 400 of the properties we own or lease as of December 31, 2015 were previously leased to Marketing pursuant to the Master Lease.
We elected to be treated as a REIT under the federal income tax laws beginning January 1, 2001. A REIT is a corporation, or a business trust that would otherwise be taxed as a corporation, which meets certain requirements of the Internal Revenue Code. The Internal Revenue Code permits a qualifying REIT to deduct dividends paid, thereby effectively eliminating corporate level federal income tax and making the REIT a pass-through vehicle for federal income tax purposes. To meet the applicable requirements of the Internal Revenue Code, a REIT must, among other things, invest substantially all of its assets in interests in real estate (including mortgages and other REITs) or cash and government securities, derive most of its income from rents from real property or interest on loans secured by mortgages on real property, and distribute to shareholders annually a substantial portion of its otherwise taxable income. As a REIT, we are required to distribute at least 90% of our taxable income to our shareholders each year and would be subject to corporate level federal income taxes on any taxable income that is not distributed.
Major Tenants
As of December 31, 2015, we had three major tenants. For information regarding factors that could adversely affect us relating to our lessees with these tenants, see “Part I, Item 1A. Risk Factors”.
As of December 31, 2015, we leased 169 convenience store and gasoline station properties pursuant to three separate unitary leases to subsidiaries of Global Partners, LP (NYSE: GLP) (“Global Partners”). Two of these leases were assigned to subsidiaries of Global Partners in June 2015 by our former tenants, White Oak Petroleum, LLC and Big Apple Petroleum Realty, LLC (both affiliates of Capitol Petroleum Group, LLC). In the aggregate, our leases with subsidiaries of Global Partners represented 21% and 13% of our rental revenues for the years ended December 31, 2015 and 2014, respectively. All three of our leases with subsidiaries of Global Partners are guaranteed by the parent company.
As of December 31, 2015, we leased 84 convenience store and gasoline station properties pursuant to three separate unitary leases to subsidiaries of Chestnut Petroleum Dist. Inc. (“Chestnut Petroleum”). In the aggregate, our leases with subsidiaries of Chestnut Petroleum represented 16% and 19% of our rental revenues for the years ended December 31, 2015 and 2014, respectively. The largest of these unitary leases, accounting for 57 of our properties, is guaranteed by the parent company, its principals and numerous Chestnut Petroleum affiliates.
As of December 31, 2015, we leased 77 convenience store and gasoline station properties pursuant to three separate unitary leases to Apro, LLC (d/b/a “United Oil”). In the aggregate, our leases with United Oil represented 9% of our rental revenues for the year ended December 31, 2015. For information regarding the United Oil Transaction see Note 10 in “Item 8. Financial Statements and Supplementary Data — Notes to Consolidated Financial Statement” in this Annual Report on Form 10-K. See Item 9B in this Annual Report on Form 10-K for selected combined audited financial data of United Oil.
7
Table of Contents
Our major tenants are part of larger corporate organizations and the financial distress of one subsidiary or other affiliated companies or businesses in those organizations may negatively impact the ability or willingness of our tenant to perform its obligations under its lease with us.
Competition
The net-lease retail sector of the real estate industry in which we operate is highly competitive. In addition, we expect major real estate investors with significant capital will continue to compete with us for attractive acquisition opportunities. These competitors include petroleum manufacturing, distributing and marketing companies, other REITs, public and private investment funds, and other individual and institutional investors.
Trademarks
We own the Getty® name and trademark in connection with our real estate and the petroleum marketing business in the United States and we permit certain of our tenants and licensees to use the Getty® trademarks at properties that they lease from us.
Regulation
Our properties are subject to numerous federal, state and local laws and regulations including matters related to the protection of the environment such as the remediation of known contamination and the retirement and decommissioning or removal of long-lived assets including buildings containing hazardous materials, USTs and other equipment. These laws include: (i) requirements to report to governmental authorities discharges of petroleum products into the environment and, under certain circumstances, to remediate the soil and groundwater contamination, including pursuant to governmental order and directive, (ii) requirements to remove and replace USTs that have exceeded governmental-mandated age limitations and (iii) the requirement to provide a certificate of financial responsibility with respect to potential claims relating to UST failures. Our triple-net lease tenants are directly responsible for compliance with various environmental laws and regulations as the operators of our properties.
We believe that our properties are in substantial compliance with federal, state and local provisions enacted or adopted pertaining to environmental matters. Although we are unable to predict what legislation or regulations may be adopted in the future with respect to environmental protection and waste disposal, we do not believe that existing legislation and regulations will have a material adverse effect on our competitive position. For additional information with respect to pending environmental lawsuits and claims see “Item 3. Legal Proceedings”.
Environmental expenses are principally attributable to remediation costs which include removing USTs, excavation of contaminated soil and water, installing, operating, maintaining and decommissioning remediation systems, monitoring contamination and governmental agency compliance reporting incurred in connection with contaminated properties. We seek reimbursement from state UST remediation funds related to these environmental expenses where available. We enter into leases and various other agreements which allocate between the parties responsibility for known and unknown environmental liabilities at or relating to the subject premises. We are contingently liable for these environmental obligations in the event that our counterparty to the agreement does not satisfy them.
For all of our triple-net leases, our tenants are contractually responsible for compliance with environmental laws and regulations, removal of USTs at the end of their lease term and remediation of any environmental contamination that arises during the term of their tenancy. Under the terms of our leases covering properties previously leased to Marketing (substantially all of which commenced in 2012), we have agreed to be responsible for environmental contamination at the premises that was known at the time the lease commenced, and which existed prior to commencement of the lease and is discovered (other than as a result of a voluntary site investigation) during the first ten years of the lease term (or a shorter period for a minority of such leases). After expiration of such ten year (or, in certain cases, shorter) period, responsibility for all newly discovered contamination, even if it relates to periods prior to commencement of the lease, is contractually allocated to our tenant. Our tenants at properties previously leased to Marketing are in all cases responsible for the cost of any remediation of contamination that results from their use and occupancy of our properties. Under substantially all of our other triple-net leases, responsibility for remediation of all environmental contamination discovered during the term of the lease (including known and unknown contamination that existed prior to commencement of the lease) is the responsibility of our tenant.
For additional information please refer to “Item 1A. Risk Factors” and to “Liquidity and Capital Resources,” “Environmental Matters” and “Contractual Obligations” in “Item 7. Management’s Discussion and Analysis of Financial Condition and Results of Operations” and to Note 5 in “Item 8. Financial Statements and Supplementary Data — Notes to Consolidated Financial Statements” in this Annual Report on Form 10-K.
8
Table of Contents
Additional Information
Our website address is www.gettyrealty.com. Information available on our website shall not be deemed to be a part of this Annual Report on Form 10-K. Our Annual Reports on Form 10-K, Quarterly Reports on Form 10-Q, Current Reports on Form 8-K and any amendments to those reports filed or furnished pursuant to Section 13(a) or 15(d) of the Securities Exchange Act of 1934 (the “Exchange Act”) are available on our website, free of charge, as soon as reasonably practicable after we electronically file such materials with, or furnish them to, the U.S. Securities and Exchange Commission (“SEC”). The public may read and copy any materials that we file with the SEC at the SEC’s Public Reference Room at 100 F Street, NE, Washington, DC 20549. The public may obtain information on the operation of the Public Reference Room by calling the SEC at 1-800-SEC-0330.
Our website also contains our business conduct guidelines (“Code of Ethics”), corporate governance guidelines and the charters of the Compensation, Nominating/Corporate Governance and Audit Committees of our Board of Directors. We intend to make available on our website any future amendments or waivers to our Code of Ethics within four business days after any such amendments or waivers become effective.
We are subject to various risks, many of which are beyond our control. As a result of these and other factors, we may experience material fluctuations in our future operating results on a quarterly or annual basis, which could materially and adversely affect our business, financial condition, results of operations, liquidity, ability to pay dividends or stock price. An investment in our stock involves various risks, including those mentioned below and elsewhere in this Annual Report on Form 10-K and those that are described from time to time in our other filings with the SEC.
We incur significant operating costs as a result of environmental laws and regulations which costs could significantly rise and reduce our profitability.
We are subject to numerous federal, state and local laws and regulations, including matters relating to the protection of the environment. Under certain environmental laws, a current or previous owner or operator of real estate may be liable for contamination resulting from the presence or discharge of hazardous or toxic substances or petroleum products at, on, or under, such property, and may be required to investigate and clean-up such contamination. Such laws typically impose liability and clean-up responsibility without regard to whether the owner or operator knew of or caused the presence of the contaminants, or the timing or cause of the contamination, and the liability under such laws has been interpreted to be joint and several unless the harm is divisible and there is a reasonable basis for allocation of responsibility. For example, liability may arise as a result of the historical use of a property or from the migration of contamination from adjacent or nearby properties. Any such contamination or liability may also reduce the value of the property. In addition, the owner or operator of a property may be subject to claims by third-parties based on injury, damage and/or costs, including investigation and clean-up costs, resulting from environmental contamination present at or emanating from a property. The properties owned or controlled by us are leased primarily as convenience store and gasoline station properties, and therefore may contain, or may have contained, USTs for the storage of petroleum products and other hazardous or toxic substances, which creates a potential for the release of such products or substances. Some of our properties may be subject to regulations regarding the retirement and decommissioning or removal of long-lived assets including buildings containing hazardous materials, USTs and other equipment. Some of the properties may be adjacent to or near properties that have contained or currently contain USTs used to store petroleum products or other hazardous or toxic substances. In addition, certain of the properties are on, adjacent to, or near properties upon which others have engaged or may in the future engage in activities that may release petroleum products or other hazardous or toxic substances. There may be other environmental problems associated with our properties of which we are unaware. These problems may make it more difficult for us to re-let or sell our properties on favorable terms, or at all.
For additional information with respect to pending environmental lawsuits and claims, and environmental remediation obligations and estimates see “Item 3. Legal Proceedings”, “Environmental Matters” in “Item 7. Management’s Discussion and Analysis of Financial Condition and Results of Operations” and Notes 3 and 5 in “Item 8. Financial Statements and Supplementary Data — Notes to Consolidated Financial Statements” in this Annual Report on Form 10-K.
We enter into leases and various other agreements which contractually allocate responsibility between the parties for known and unknown environmental liabilities at or relating to the subject properties. We are contingently liable for these environmental obligations in the event that our counterparty to the lease or other agreement does not satisfy them. It is possible that our assumptions regarding the ultimate allocation method and share of responsibility that we used to allocate environmental liabilities may change, which may result in material adjustments to the amounts recorded for environmental litigation accruals and environmental remediation liabilities. We are required to accrue for environmental liabilities that we believe are allocable to others under our leases and other agreements if we determine that it is probable that our counterparty will not meet its environmental obligations. We may ultimately be responsible to pay for environmental liabilities as the property owner if the counterparty fails to pay them. We assess whether to accrue for environmental liabilities based upon relevant factors including our tenants’ histories of paying for such obligations, our assessment of their financial ability, and their intent to pay for such obligations. However, there can be no assurance that our
9
Table of Contents
assessments or estimates are correct or that our tenants who have paid their obligations in the past will continue to do so. The ultimate resolution of these matters could cause a material adverse effect on our business, financial condition, results of operations, liquidity, ability to pay dividends or stock price.
For all of our triple-net leases, our tenants are contractually responsible for compliance with environmental laws and regulations, removal of USTs at the end of their lease term and remediation of any environmental contamination that arises during the term of their tenancy. Under the terms of our leases covering properties previously leased to Marketing (substantially all of which commenced in 2012), we have agreed to be responsible for environmental contamination at the premises that was known at the time the lease commenced, and which existed prior to commencement of the lease and is discovered (other than as a result of a voluntary site investigation) during the first ten years of the lease term (or a shorter period for a minority of such leases). After expiration of such ten year (or, in certain cases, shorter) period, responsibility for all newly discovered contamination, even if it relates to periods prior to commencement of the lease, is contractually allocated to our tenant. Our tenants at properties previously leased to Marketing are in all cases responsible for the cost of any remediation of contamination that results from their use and occupancy of our properties. Under substantially all of our other triple-net leases, responsibility for remediation of all environmental contamination discovered during the term of the lease (including known and unknown contamination that existed prior to commencement of the lease) is the responsibility of our tenant.
We anticipate that a majority of the USTs at properties previously leased to Marketing will be replaced over the next decade because these USTs are either at or near the end of their useful lives. For long-term, triple-net leases covering sites previously leased to Marketing, our tenants are responsible for the cost of removal and replacement of USTs and for remediation of contamination found during such UST removal and replacement, unless such contamination was found during the first ten years of the lease term and also existed prior to commencement of the lease. In those cases, we are responsible for costs associated with the remediation of such contamination. For our transitional properties occupied under month-to-month license agreements, or which are vacant, we are responsible for costs associated with UST removals and for the cost of remediation of contamination found during the removal of USTs. We have also agreed to be responsible for environmental contamination that existed prior to the sale of certain properties assuming the contamination is discovered (other than as a result of a voluntary site investigation) during the first five years after the sale of the properties. For additional information regarding our transitional properties, see “Item 1. Business — Company Operations” and “Transitional Properties” in “Item 7. Management’s Discussion and Analysis of Financial Condition and Results of Operations” which appear in this Annual Report on Form 10-K.
After the termination of the Master Lease, we commenced a process to take control of our properties and to reposition them. A substantial portion of these properties had USTs which were either at or near the end of their useful lives. For properties that we sold, we elected to remove certain of these USTs and in the course of re-leasing properties, we made lease concessions to reimburse our tenants at operating gasoline stations for certain capital expenditures including UST replacements. In the course of these UST removals and replacements, previously unknown environmental contamination has been and continues to be discovered. As a result of these developments, we began to assess our prospective future environmental liability resulting from preexisting unknown environmental contamination which we believe might be discovered during removal and replacement of USTs at properties previously leased to Marketing in the future.
We have developed a reasonable estimate of fair value for the prospective future environmental liability resulting from preexisting unknown environmental contamination and accrued for these estimated costs. These estimates are based primarily upon quantifiable trends, which we believe allow us to make reasonable estimates of fair value for the future costs of environmental remediation resulting from the removal and replacement of USTs. Our accrual of the additional liability represents the best estimate of the fair value of cost for each component of the liability, net of estimated recoveries from state UST remediation funds, considering estimated recovery rates developed from prior experience with the funds. In arriving at our accrual, we analyzed the ages of USTs at properties where we would be responsible for preexisting contamination found within ten years after commencement of a lease (for properties subject to long-term triple-net leases) or five years from a sale (for divested properties), and projected a cost to closure for new environmental contamination. Based on these estimates, along with relevant economic and risk factors, at December 31, 2015 and 2014, we accrued $45.4 million and $49.7 million, respectively, for these future environmental liabilities related to preexisting unknown contamination. Our estimates are based upon facts that are known to us at this time and an assessment of the possible ultimate remedial action outcomes. It is possible that our assumptions, which form the basis of our estimates, regarding our ultimate environmental liabilities may change, which may result in our providing an accrual, or adjustments to the amounts recorded, for environmental remediation liabilities. Among the many uncertainties that impact the estimates are our assumptions, the necessary regulatory approvals for, and potential modifications of remediation plans, the amount of data available upon initial assessment of contamination, changes in costs associated with environmental remediation services and equipment, the availability of state UST remediation funds and the possibility of existing legal claims giving rise to additional claims. Additional environmental liabilities could cause a material adverse effect on our business, financial condition, results of operations, liquidity, ability to pay dividends or stock price.
Environmental exposures are difficult to assess and estimate for numerous reasons, including the extent of contamination, alternative treatment methods that may be applied, location of the property which subjects it to differing local laws and regulations and their interpretations, as well as the time it takes to remediate contamination and receive regulatory approval. In developing our
10
Table of Contents
liability for estimated environmental remediation obligations on a property by property basis, we consider among other things, enacted laws and regulations, assessments of contamination and surrounding geology, quality of information available, currently available technologies for treatment, alternative methods of remediation and prior experience. Environmental accruals are based on estimates which are subject to significant change, and are adjusted as the remediation treatment progresses, as circumstances change and as environmental contingencies become more clearly defined and reasonably estimable. We expect to adjust the accrued liabilities for environmental remediation obligations reflected in our consolidated financial statements as they become probable and a reasonable estimate of fair value can be made.
We measure our environmental remediation liability at fair value based on expected future net cash flows, adjusted for inflation, and then discount them to present value. We adjust our environmental remediation liability quarterly to reflect changes in projected expenditures, changes in present value due to the passage of time and reductions in estimated liabilities as a result of actual expenditures incurred during each quarter. As of December 31, 2015, we had accrued a total of $84.3 million for our prospective environmental remediation liability. This accrual includes (a) $38.9 million, which was our best estimate of reasonably estimable environmental remediation obligations and obligations to remove USTs for which we are the title owner, net of estimated recoveries and (b) $45.4 million for future environmental liabilities related to preexisting unknown contamination.
We cannot predict what environmental legislation or regulations may be enacted in the future, or how existing laws or regulations will be administered or interpreted with respect to products or activities to which they have not previously been applied. We cannot predict if state UST fund programs will be administered and funded in the future in a manner that is consistent with past practices and if future environmental spending will continue to be eligible for reimbursement at historical recovery rates under these programs. Compliance with more stringent laws or regulations, as well as more vigorous enforcement policies of the regulatory agencies or stricter interpretation of existing laws, which may develop in the future, could have an adverse effect on our financial position, or that of our tenants, and could require substantial additional expenditures for future remediation.
As a result of the factors discussed above, or others, compliance with environmental laws and regulations could have a material adverse effect on our business, financial condition, results of operations, liquidity, ability to pay dividends or stock price.
We are exposed to counterparty risk and there can be no assurances that we will effectively manage or mitigate this risk.
We regularly interact with counterparties in various industries. The types of counterparties most common to our transactions and agreements include, but are not limited to, landlords, tenants, vendors and lenders. We also enter into agreements to acquire and sell properties which allocate responsibility for certain costs to the counterparty. Our most significant counterparties include, but are not limited to, the members of the Bank Syndicate related to our Credit Agreement, the lender that is the counterparty to the Restated Prudential Note Purchase Agreement and our major tenants from whom we derive a significant amount of rental revenue. The default, insolvency or other inability or unwillingness of a significant counterparty to perform its obligations under an agreement or transaction, including, without limitation, as a result of the rejection of an agreement or transaction in bankruptcy proceedings, is likely to have a material adverse effect on us. As of December 31, 2015, we leased 169 convenience store and gasoline station properties pursuant to three separate unitary leases to subsidiaries of Global Partners, LP (NYSE: GLP) (“Global Partners”). Two of these leases were assigned to subsidiaries of Global Partners in June 2015 by our former tenants, White Oak Petroleum, LLC and Big Apple Petroleum Realty, LLC (both affiliates of Capitol Petroleum Group, LLC). In the aggregate, our leases with subsidiaries of Global Partners represented 21% and 13% of our rental revenues for the years ended December 31, 2015 and 2014, respectively. All three of our leases with subsidiaries of Global Partners are guaranteed by the parent company. As of December 31, 2015, we leased 84 convenience store and gasoline station properties pursuant to three separate unitary leases to subsidiaries of Chestnut Petroleum Dist. Inc. (“Chestnut Petroleum”). In the aggregate, our leases with subsidiaries of Chestnut Petroleum represented 16% and 19% of our rental revenues for the years ended December 31, 2015 and 2014, respectively. The largest of these unitary leases, accounting for 57 of our properties, is guaranteed by the parent company, its principals and numerous Chestnut Petroleum affiliates. As of December 31, 2015, we leased 77 convenience store and gasoline station properties pursuant to three separate unitary leases to Apro, LLC (d/b/a “United Oil”). In the aggregate, our leases with United Oil represented 9% of our rental revenues for the year ended December 31, 2015. See Item 9B in this Annual Report on Form 10-K for selected combined audited financial data of United Oil. We may also undertake additional transactions with these or other existing tenants which would further concentrate our sources of rental revenues. Many of our tenants, including those noted above, are part of larger corporate organizations and the financial distress of one subsidiary or other affiliated companies or businesses in those organizations may negatively impact the ability or willingness of our tenant to perform its obligations under its lease with us. The failure of a major tenant or their default in their rental and other obligations to us is likely to have a material adverse effect on our business, financial condition, results of operations, liquidity, ability to pay dividends or stock price.
Because certain of our tenants are not rated and their financial information is not available to you, it may be difficult for our investors to determine their creditworthiness.
The majority of our properties are leased to tenants who are not rated by any nationally recognized statistical rating organizations. In addition, our tenant’s financial information is not generally available to our investors. Additionally, many of our tenants are part of larger corporate organizations and we do not receive financial information for the other entities in those
11
Table of Contents
organizations. The financial distress of other affiliated companies or businesses in those organizations may negatively impact the ability or willingness of our tenant to perform its obligations under its lease with us. Because of the lack of financial information or credit ratings it is, therefore, difficult for our investors to assess the creditworthiness of our tenants and to determine the ability of a tenant to meet its obligations to us. It is possible that the assumptions and estimates we make after reviewing publicly and privately obtained information about our tenants are not accurate and that we may be required to increase reserves for bad debts, record allowances for deferred rent receivable or record additional expenses if our tenants are unable or unwilling to meet their obligations to us.
Our future cash flow is dependent on the performance of our tenants of their lease obligations, renewal of existing leases and either re-leasing or selling our transitional properties.
We are subject to risks that financial distress, default or bankruptcy of our tenants may lead to vacancy at our properties or disruption in rent receipts as a result of partial payment or nonpayment of rent or that expiring leases may not be renewed. Under unfavorable general economic conditions, there can be no assurance that our tenants’ level of sales and financial performance generally will not be adversely affected, which in turn, could negatively impact our rental revenues. We are subject to risks that the terms governing renewal or re-leasing of our properties (including, compliance with numerous federal, state and local laws and regulations related to the protection of the environment, such as the remediation of contamination and the retirement and decommissioning or removal of long-lived assets, the cost of required renovations, or replacement of USTs and related equipment) may be less favorable than current lease terms (or prior lease terms in the case of vacant properties).
We are also subject to the risk that we may receive less net proceeds from the properties we sell as compared to their current carrying value or that the value of our properties may be adversely affected by unfavorable general economic conditions. Unfavorable general economic conditions may also negatively impact our ability to re-lease or sell our transitional properties. Numerous properties compete with our properties in attracting tenants to lease space. The number of available or competitive properties in a particular area could have a material adverse effect on our ability to lease or sell our properties and on the rents we are able to charge. In addition to the risk of disruption in rent receipts, we are subject to the risk of incurring real estate taxes, maintenance, environmental and other expenses at vacant properties. The financial distress, default or bankruptcy of our tenants may also lead to protracted and expensive processes for retaking control of our properties than would otherwise be the case, including, eviction or other legal proceedings related to or resulting from the tenant’s default. These risks are greater with respect to certain of our tenants who lease multiple properties from us. If a tenant files for bankruptcy protection it is possible that we would recover substantially less than the full value of our claims against the tenant. If our tenants do not perform their lease obligations; or we are unable to renew existing leases and promptly recapture and re-lease or sell our transitional properties; or if lease terms upon renewal or re-leasing are less favorable than current or historical lease terms; or if the values of properties that we sell are adversely affected by market conditions; or if we incur significant costs or disruption related to or resulting from tenant financial distress, default or bankruptcy; then our cash flow could be significantly adversely affected.
As of December 31, 2015, our 46 transitional properties were comprised of (i) eight properties subject to the NECG Lease, (ii) 15 properties occupied under month-to-month license agreements and (iii) 23 properties that are vacant. See “Business – Company Operations – Transitional Properties”, “NECG Lease Restructuring” and “Month-to-Month License Agreements” in Note 2 in “Item 8. Financial Statements and Supplementary Data — Notes to Consolidated Financial Statements” in this Annual Report on Form 10-K.
We are dependent on external sources of capital which may not be available on favorable terms, or at all.
We are dependent on external sources of capital to maintain our status as a REIT and must distribute to our shareholders each year at least 90% of our net taxable income, excluding any net capital gain. Because of these distribution requirements, it is not likely that we will be able to fund all future capital needs, including acquisitions, from income from operations. Therefore, we will have to continue to rely on third-party sources of capital, which may or may not be available on favorable terms, or at all. We may need to access the capital markets in order to execute future significant acquisitions. There can be no assurance that sources of capital will be available to us on favorable terms, or at all.
Our principal sources of liquidity are our cash flows from operations, funds available under our $225.0 million Credit Agreement with a group of banks led by Bank of America, N.A. The Credit Agreement consists of a $175.0 million Revolving Facility, which is scheduled to mature in June 2018 and a $50.0 million Term Loan, which is scheduled to mature in June 2020. Subject to the terms of the Credit Agreement and our continued compliance with its provisions, we have the option to (a) extend the term of the Revolving Facility for one additional year to June 2019 and (b) increase by $75.0 million the amount of the Revolving Facility to $250.0 million. On June 2, 2015, we entered into the Restated Prudential Note Purchase Agreement, amending and restating our existing senior secured note purchase agreement with Prudential and an affiliate of Prudential. Pursuant to the Restated Prudential Note Purchase Agreement, among other matters, Prudential and its affiliate, redenominated the existing notes in the aggregate amount of $100.0 million issued under the existing note purchase agreement as senior unsecured Series A Notes, and issued $75.0 million of senior unsecured Series B Notes bearing interest at 5.35% and maturing in June 2023 to Prudential and certain affiliates of Prudential. The Series A Notes continue to bear interest at 6.0% and mature in February 2021. For additional information, please refer to “Credit Agreement” and “Senior Unsecured Notes” in Note 4 in “Item 8. Financial Statements and Supplementary Data – Notes to Consolidated Financial Statements,” which appears in this Annual Report on Form 10-K.
12
Table of Contents
Each of the Credit Agreement and the Restated Prudential Note Purchase Agreement contains customary financial and other covenants such as leverage and coverage ratios and minimum tangible net worth, as well as limitations on restricted payments, which may limit our ability to incur additional debt or pay dividends. The Credit Agreement contains customary events of default, including default under the Restated Prudential Note Purchase Agreement, change of control and failure to maintain REIT status. The Restated Prudential Note Purchase Agreement contains customary events of default, including default under the Credit Agreement and failure to maintain REIT status. Our ability to meet the terms of the agreements is dependent on our continued ability to meet certain criteria as further described in Note 4 in “Item 8. Financial Statements and Supplementary Data – Notes to Consolidated Financial Statements,” the performance of our tenants and the other risks described in this section. If we are not in compliance with one or more of our covenants, which could result in an event of default under our Credit Agreement or our Restated Prudential Note Purchase Agreement, there can be no assurance that our lenders would waive such non-compliance. This could have a material adverse effect on our business, financial condition, results of operation, liquidity, ability to pay dividends or stock price.
Our access to third-party sources of capital depends upon a number of factors including general market conditions, the market’s perception of our growth potential, financial stability, our current and potential future earnings and cash distributions, covenants and limitations imposed under our Credit Agreement and Restated Prudential Note Purchase Agreement and the market price of our common stock.
We are repositioning our transitional properties and may incur additional costs associated with repositioning these properties which may materially negatively impact our cash flow and ability to pay dividends.
We are repositioning our transitional properties and expect that we will sell, enter into new leases or modify existing leases on these properties over time. The timing of pending or anticipated transactions may be affected by factors beyond our control and we cannot predict when or on what terms sales or leases will ultimately be consummated.
It is possible that when we complete the repositioning of individual transitional properties, we will generate less net revenue from these properties than we are currently generating or we may be responsible for the payment of certain operating expenses, environmental compliance costs and costs associated with any environmental remediation. The incurrence of these expenses may materially negatively impact our cash flow and ability to pay dividends.
We are continuing our efforts to sell certain properties. We cannot predict the terms or timing of any such property dispositions. If we do not obtain favorable terms on such dispositions, our operations and financial performance may be negatively impacted.
We are continuing our efforts to sell properties, including those properties which are accounted for as held for sale. While we have dedicated considerable effort designed to increase sales activity, we cannot predict if or when property dispositions will close and whether the terms of any such disposition will be favorable to us. It is likely that we will retain environmental liabilities that exist with respect to that property or group of properties prior to the date of sale. If we do not obtain favorable terms on such dispositions, our operations and financial performance will be negatively impacted.
Our accounting policies and methods are fundamental to how we record and report our financial position and results of operations, and they require management to make estimates, judgments and assumptions about matters that are inherently uncertain.
Our accounting policies and methods are fundamental to how we record and report our financial position and results of operations. We have identified several accounting policies as being critical to the presentation of our financial position and results of operations because they require management to make particularly subjective or complex judgments about matters that are inherently uncertain and because of the likelihood that materially different amounts would be recorded under different conditions or using different assumptions. We cannot provide any assurance that we will not make subsequent significant adjustments to our consolidated financial statements. Estimates, judgments and assumptions underlying our consolidated financial statements include, but are not limited to, receivables and related reserves, deferred rent receivable, income under direct financing leases, asset retirement obligations including environmental remediation obligations and future environmental liabilities for pre-existing unknown environmental contamination, real estate, depreciation and amortization, carrying value of our properties, impairment of long-lived assets, litigation, accrued liabilities, income taxes and allocation of the purchase price of properties acquired to the assets acquired and liabilities assumed.
If our accounting policies, methods, judgments, assumptions, estimates and allocations prove to be incorrect, or if circumstances change, our business, financial condition, revenues, operating expense, results of operations, liquidity, ability to pay dividends or stock price may be materially adversely affected.
13
Table of Contents
Our business operations may not generate sufficient cash for distributions or debt service.
There is no assurance that our business will generate sufficient cash flow from operations or that future borrowings will be available to us in an amount sufficient to enable us to pay dividends on our common stock, to pay our indebtedness or to fund our other liquidity needs. We may not be able to repay or refinance existing indebtedness on favorable terms, which could force us to dispose of properties on disadvantageous terms (which may also result in losses) or accept financing on unfavorable terms.
We may acquire new properties and this may create risks.
We may acquire or develop properties when we believe that an acquisition or development matches our business and investment strategies. These properties may have characteristics or deficiencies currently unknown to us that affect their value or revenue potential. It is possible that the operating performance of these properties may decline after we acquire them, they may not perform as expected and, if financed by the Company using debt or new equity issuances, may result in shareholder dilution. Our acquisition of properties will expose us to the liabilities of those properties, some of which we may not be aware of at the time of acquisition. We face competition in pursuing these acquisitions and we may not succeed in leasing acquired properties at rents sufficient to cover their costs of acquisition and operations.
Newly acquired properties may require significant management attention that would otherwise be devoted to our ongoing business. We may not succeed in consummating desired acquisitions. Consequences arising from or in connection with any of the foregoing could have a material adverse effect on our business, financial condition, results of operations, liquidity, ability to pay dividends or stock price.
We are pursuing redevelopment opportunities and this creates risks to our Company.
We have commenced a program to redevelop certain of our transitional properties and to recapture select properties from our net lease portfolio in order to redevelop such properties for alternative uses. The success at each stage of our redevelopment program is dependent on numerous factors and risks including our ability to identify and extract preferred sites from our portfolio and successfully prepare and market them for alternative uses, and project development issues, including those relating to planning, zoning, licensing, permitting, third party and governmental authorizations, changes in local market conditions, increases in construction costs, the availability and cost of financing, and issues arising from possible discovery of new environmental contamination and the need to conduct environmental remediation. Occupancy rates and rents at any particular redeveloped property may fail to meet our original expectations for a number of reasons beyond our control, including changes in market and economic conditions and the development by competitors of competing properties. We could experience increased and unexpected costs or significant delays or abandonment of some or all of these redevelopment opportunities. For any of the above-described reasons, and others, we may determine to abandon opportunities that we have already begun to explore or with respect to which we have commenced redevelopment efforts and, as a result, we may fail to recover expenses already incurred. We cannot assure you that we will be able to successfully redevelop and lease any of our identified opportunities or that our overall redevelopment program will be successful. Consequences arising from or in connection with any of the foregoing could have a material adverse effect on our business, financial condition, results of operations, liquidity, ability to pay dividends or stock price.
We may not be able to successfully implement our investment strategy.
We may not be able to successfully implement our investment strategy. We cannot assure you that our portfolio of properties will expand at all, or if it will expand at any specified rate or to any specified size. As part of our overall growth strategy, we regularly review acquisition, financing and development opportunities, and we expect to continue to pursue investments that we believe will benefit our financial performance. We cannot assure you that investment opportunities will be available which meet our investment criteria. Pursuing our investment opportunities may result in the issuance of new equity securities of the Company that may initially be dilutive to our net income, and such investments may not perform as we expect or produce the returns that we anticipate (including, without limitation, as a result of tenant bankruptcies, tenant concessions, our inability to collect rents and higher than anticipated operating expenses). Further, we may not successfully integrate investments into our existing portfolio without operating disruptions or unanticipated costs. To the extent that our current sources of liquidity are not sufficient to fund such investments, we will require other sources of capital, which may or may not be available on favorable terms or at all. Additionally, to the extent we increase the size of our portfolio, we may not be able to adapt our management, administrative, accounting and operational systems, or hire and retain sufficient operational staff to integrate investments into our portfolio or manage any future investments without operating disruptions or unanticipated costs. Moreover, our continued growth will require increased investment in management personnel, professional fees, other personnel, financial and management systems and controls and facilities, which will result in additional operating expenses. Under the circumstances described above, our results of operations, financial condition and growth prospects may be materially adversely affected.
We are subject to risks inherent in owning and leasing real estate.
We are subject to varying degrees of risk generally related to leasing and owning real estate many of which are beyond our control. In addition to general risks applicable to us, our risks include, among others: our liability as a lessee for long-term lease obligations regardless of our revenues; deterioration in national, regional and local economic and real estate market conditions; potential changes in supply of, or demand for, rental properties similar to ours; competition for tenants and declining rental rates; difficulty in selling or re-leasing properties on favorable terms or at all; impairments in our ability to collect rent or other payments due to us when they are due; increases in interest rates and adverse changes in the availability, cost and terms of financing; uninsured property liability; the impact of present or future environmental legislation and compliance with environmental laws; adverse changes in zoning laws and other regulations; acts of terrorism and war; acts of God; the potential risk of functional obsolescence of properties over time the need to periodically renovate and repair our properties; and physical or weather-related damage to our properties.
Certain significant expenditures generally do not change in response to economic or other conditions, including: (i) debt service, (ii) real estate taxes, (iii) environmental remediation costs and (iv) operating and maintenance costs. The combination of variable revenue and relatively fixed expenditures may result, under certain market conditions, in reduced earnings and could have an adverse effect on our financial condition.
Each of the factors listed above could cause a material adverse effect on our business, financial condition, results of operations, liquidity, ability to pay dividends or stock price. In addition, real estate investments are relatively illiquid, which means that our ability to vary our portfolio of properties in response to changes in economic and other conditions may be limited.
14
Table of Contents
Adverse developments in general business, economic or political conditions could have a material adverse effect on us.
Adverse developments in general business and economic conditions, including through recession, downturn or otherwise, either in the economy generally or in those regions in which a large portion of our business is conducted, could have a material adverse effect on us and significantly increase certain of the risks we are subject to. Among other effects, adverse economic conditions could depress real estate values, impact our ability to re-let or sell our properties and have an adverse effect on our tenants’ level of sales and financial performance generally. Our revenues are dependent on the economic success of our tenants and any factors that adversely impact our tenants could also have a material adverse effect on our business, financial condition and results of operations, liquidity, ability to pay dividends or stock price.
Substantially all of our tenants depend on the same industry for their revenues.
We derive substantially all of our revenues from leasing, primarily on a triple-net basis, and financing convenience store and gasoline station properties to tenants in the petroleum marketing industry. Accordingly, our revenues are substantially dependent on the economic success of the petroleum marketing industry, and any factors that adversely affect that industry, such as disruption in the supply of petroleum or a decrease in the demand for conventional motor fuels due to conservation, technological advancements in petroleum-fueled motor vehicles or an increase in the use of alternative fuel vehicles, or “green technology” could have a material adverse effect on our business, financial condition and results of operations, liquidity, ability to pay dividends or stock price. The success of participants in the petroleum marketing industry depends upon the sale of refined petroleum products at margins in excess of fixed and variable expenses. The petroleum marketing industry is highly competitive and volatile. Petroleum products are commodities, the prices of which depend on numerous factors that affect supply and demand. The prices paid by our tenants and other petroleum marketers for products are affected by global, national and regional factors. A large, rapid increase in wholesale petroleum prices would adversely affect the profitability and cash flows of our tenants if the increased cost of petroleum products could not be passed on to their customers or if automobile consumption of gasoline was to decline significantly. We cannot be certain how these factors will affect petroleum product prices or supply in the future, or how in particular they will affect our tenants.
Property taxes on our properties may increase without notice.
Each of the properties we own or lease is subject to real property taxes. The leases for certain of the properties that we lease from third-parties obligate us to pay real property taxes with regard to those properties. The real property taxes on our properties and any other properties that we acquire or lease in the future may increase as property tax rates change and as those properties are assessed or reassessed by tax authorities. To the extent that our tenants are not responsible for property taxes pursuant to their contractual arrangements with us or are unable or unwilling to pay such increase in accordance with their leases, our net operating expenses may increase.
We are defending pending lawsuits and claims and are subject to material losses.
We are subject to various lawsuits and claims, including litigation related to environmental matters, such as those arising from leaking USTs, contamination of groundwater with methyl tertiary butyl ether (a fuel derived from methanol, commonly referred to as “MTBE”) and releases of motor fuel into the environment, and toxic tort claims. For example, we are currently involved in several proceedings described in “Item 3. Legal Proceedings” in this Annual Report on Form 10-K. The ultimate resolution of certain matters cannot be predicted because considerable uncertainty exists both in terms of the probability of loss and the estimate of such loss. Our ultimate liabilities resulting from the lawsuits and claims we face could cause a material adverse effect on our business, financial condition, results of operations, liquidity, ability to pay dividends or stock price. For additional information with respect to pending environmental lawsuits and claims and environmental remediation obligations and estimates see “Item 3. Legal Proceedings”, “Environmental Matters” in “Item 7. Management’s Discussion and Analysis of Financial Condition and Results of Operations” and Notes 3 and 5 in “Item 8. Financial Statements and Supplementary Data — Notes to Consolidated Financial Statements” in this Annual Report on Form 10-K.
A significant portion of our properties are concentrated in the Northeast and Mid-Atlantic regions of the United States, and adverse conditions in those regions, in particular, could negatively impact our operations.
A significant portion of the properties we own and lease are located in the Northeast and Mid-Atlantic regions of the United States and approximately 57% of our properties are concentrated in three states (New York, Massachusetts and Connecticut). Because of the concentration of our properties in those regions, in the event of adverse economic conditions in those regions, we would likely experience higher risk of default on payment of rent to us than if our properties were more geographically diversified. Additionally, the rents on our properties may be subject to a greater risk of default than other properties in the event of adverse economic, political or business developments or natural hazards that may affect the Northeast or Mid-Atlantic regions of the United States and the ability of our lessees to make rent payments. This lack of geographical diversification could have a material adverse effect on our business, financial condition, results of operations, liquidity, ability to pay dividends or stock price.
15
Table of Contents
We are in a competitive business.
The real estate industry is highly competitive. Where we own properties, we compete for tenants with a large number of real estate property owners and other companies that sublet properties. Our principal means of competition are rents we are able to charge in relation to the income producing potential of the location. In addition, we expect other major real estate investors, some with much greater financial resources or more experienced personnel than we have, will compete with us for attractive acquisition opportunities. These competitors include petroleum manufacturing, distributing and marketing companies, other REITs, public and private investment funds, and other individual and institutional investors. This competition has increased prices for properties we seek to acquire and may impair our ability to make suitable property acquisitions on favorable terms in the future.
We are subject to losses that may not be covered by insurance.
We, and certain of our tenants, carry insurance against certain risks and in such amounts as we believe are customary for businesses of our kind. However, as the costs and availability of insurance change, we may decide not to be covered against certain losses (such as certain environmental liabilities, earthquakes, hurricanes, floods and civil disorder) where, in the judgment of management, the insurance is not warranted due to cost or availability of coverage or the remoteness of perceived risk. Furthermore, there are certain types of losses, such as losses resulting from wars, terrorism or certain acts of God, that generally are not insured because they are either uninsurable or not economically insurable. There is no assurance that the existing insurance coverages are or will be sufficient to cover actual losses incurred. The destruction of, or significant damage to, or significant liabilities arising out of conditions at, our properties due to an uninsured loss would result in an economic loss and could result in us losing both our investment in, and anticipated profits from, such properties. When a loss is insured, the coverage may be insufficient in amount or duration, or a lessee’s customers may be lost, such that the lessee cannot resume its business after the loss at prior levels or at all, resulting in reduced rent or a default under its lease. Any such loss relating to a large number of properties could have a material adverse effect on our business, financial condition, results of operations, liquidity, ability to pay dividends or stock price.
Failure to qualify as a REIT under the federal income tax laws would have adverse consequences to our shareholders. Uncertain tax matters may have a significant impact on the results of operations for any single fiscal year or interim period or may cause us to fail to qualify as a REIT.
We elected to be treated as a REIT under the federal income tax laws beginning January 1, 2001. To qualify for taxation as a REIT, we must, among other requirements such as those related to the composition of our assets and gross income, distribute annually to our stockholders at least 90% of our taxable income, including taxable income that is accrued by us without a corresponding receipt of cash. Accordingly, we generally will not be subject to federal income tax on qualifying REIT income, provided that distributions to our shareholders equal at least the amount of our taxable income as defined under the Internal Revenue Code.
Many of the REIT requirements are highly technical and complex. If we were to fail to meet the requirements, or if the Internal Revenue Service were to successfully assert that our earnings and profits were greater than the amount distributed, we may be subject to federal income tax, excise taxes, penalties and interest or we may have to pay a deficiency dividend to eliminate any earnings and profits that were not distributed. We may have to borrow money or sell assets to pay such a deficiency dividend.
We cannot guarantee that we will continue to qualify in the future as a REIT. We cannot give any assurance that new legislation, regulations, administrative interpretations or court decisions will not significantly change the requirements relating to our qualification. If we fail to qualify as a REIT, we would not be allowed a deduction for distributions to shareholders in computing our taxable income and will again be subject to federal income tax at regular corporate rates, we could be subject to the federal alternative minimum tax, we could be required to pay significant income taxes and we would have less money available for our operations and distributions to shareholders. This would likely have a significant adverse effect on the value of our securities. We could also be precluded from treatment as a REIT for four taxable years following the year in which we lost the qualification, and all distributions to shareholders would be taxable as regular corporate dividends to the extent of our current and accumulated earnings and profits. Loss of our REIT status could have a material adverse effect on our business, financial condition, results of operations, liquidity, ability to pay dividends or stock price.
We are exposed to interest rate risk and there can be no assurances that we will manage or mitigate this risk effectively.
We are exposed to interest rate risk, primarily as a result of our Credit Agreement. Borrowings under our Credit Agreement bear interest at a floating rate. Accordingly, an increase in interest rates will increase the amount of interest we must pay under our Credit Agreement. Our interest rate risk may materially change in the future if we increase our borrowings under the Credit Agreement, or amend our Credit Agreement or Restated Prudential Note Purchase Agreement, seek other sources of debt or equity capital or refinance our outstanding debt. A significant increase in interest rates could also make it more difficult to find alternative financing on desirable terms. For additional information with respect to interest rate risk, see “Item 7A. Quantitative and Qualitative Disclosures About Market Risk” as filed with this Annual Report on Form 10-K.
16
Table of Contents
Future issuances of equity securities could dilute the interest of holders of our equity securities.
Our future growth will depend upon our ability to raise additional capital. If we were to raise additional capital through the issuance of equity securities, we could dilute the interest of holders of our common stock. The interest of our common stockholders could also be diluted by the issuance of shares of common stock pursuant to stock incentive plans. Accordingly, the Board of Directors may authorize the issuance of equity securities that could dilute, or otherwise adversely affect, the interest of holders of our common stock.
We may change our dividend policy and the dividends we pay may be subject to significant volatility.
The decision to declare and pay dividends on our common stock in the future, as well as the timing, amount and composition of any such future dividends, will be at the sole discretion of our Board of Directors and will depend on such factors as the Board of Directors deems relevant. In addition, our Credit Agreement and our Restated Prudential Note Purchase Agreement prohibit the payments of dividends during certain events of default. No assurance can be given that our financial performance in the future will permit our payment of any dividends or that the amount of dividends we pay, if any, will not fluctuate significantly.
Under the Maryland General Corporation Law, our ability to pay dividends would be restricted if, after payment of the dividend, (1) we would not be able to pay indebtedness as it becomes due in the usual course of business or (2) our total assets would be less than the sum of our liabilities plus the amount that would be needed, if we were to be dissolved, to satisfy the rights of any shareholders with liquidation preferences. There currently are no shareholders with liquidation preferences.
To qualify for taxation as a REIT, we must, among other requirements such as those related to the composition of our assets and gross income, distribute annually to our stockholders at least 90% of our taxable income, including taxable income that is accrued by us without a corresponding receipt of cash. We cannot provide any assurance that our cash flows will permit us to continue paying cash dividends.
The Internal Revenue Service (“IRS”) has allowed the use of a procedure, as a result of which we could satisfy the REIT income distribution requirement by making a distribution on our common stock comprised of (i) shares of our common stock having a value of up to 80% of the total distribution and (ii) cash in the remaining amount of the total distribution, in lieu of paying the distribution entirely in cash. In January 2015, we received a private letter ruling from the IRS that allows us to use such a procedure.
It is also possible that instead of distributing 100% of our taxable income on an annual basis, we may decide to retain a portion of our taxable income and to pay taxes on such amounts as permitted by the IRS. In the event that we pay a portion of a dividend in shares of our common stock, taxable U.S. shareholders would be required to pay tax on the entire amount of the dividend, including the portion paid in shares of common stock, in which case such shareholders might have to pay the tax using cash from other sources. If a U.S. shareholder sells the stock he, she or it receives as a dividend in order to pay this tax, the sales proceeds may be less than the amount included in income with respect to the dividend, depending on the market price of our common stock at the time of the sale. Furthermore, with respect to non-U.S. shareholders, we may be required to withhold U.S. tax with respect to such dividend, including in respect of all or a portion of such dividend that is payable in stock. In addition, if a significant number of our shareholders sell shares of our common stock in order to pay taxes owed on dividends, such sales would put downward pressure on the market price of our common stock.
As a result of the factors described herein and elsewhere in this Annual Report on Form 10-K and those that are described from time to time in our other filings with the SEC, we may experience material fluctuations in future operating results on a quarterly or annual basis, which could materially and adversely affect our business, financial condition, revenues, operating expenses, results of operations, liquidity, ability to pay dividends or our stock price.
Changes in market conditions could adversely affect the market price of our publicly traded common stock.
As with other publicly traded securities, the market price of our publicly traded common stock depends on various market conditions, which may change from time-to-time. Among the market conditions that may affect the market price of our publicly traded common stock are the following: our financial condition and performance and that of our significant tenants; the market’s perception of our growth potential and potential future earnings; the reputation of REITs generally and the reputation of REITs with portfolios similar to us; the attractiveness of the securities of REITs in comparison to securities issued by other entities (including securities issued by other real estate companies); an increase in market interest rates, which may lead prospective investors to demand a higher distribution rate in relation to the price paid for publicly traded securities; the extent of institutional investor interest in us; and general economic and financial market conditions.
17
Table of Contents
In order to preserve our REIT status, our charter limits the number of shares a person may own, which may discourage a takeover that could result in a premium price for our common stock or otherwise benefit our stockholders.
Our charter, with certain exceptions, authorizes our Board of Directors to take such actions as are necessary and desirable to preserve our qualification as a REIT for federal income tax purposes. Unless exempted by our Board of Directors, no person may actually or constructively own more than 5% (by value or number of shares, whichever is more restrictive) of the outstanding shares of our common stock or the outstanding shares of any class or series of our preferred stock, which may inhibit large investors from desiring to purchase our stock. This restriction may have the effect of delaying, deferring or preventing a change in control, including an extraordinary transaction (such as a merger, tender offer or sale of all or substantially all of our assets) that might provide a premium price for our common stock or otherwise be in the best interest of our stockholders.
Maryland law may discourage a third-party from acquiring us.
We are subject to the provisions of the Maryland Business Combination Act (the “Business Combination Act”) which prohibits transactions between a Maryland corporation and an interested stockholder or an affiliate of an interested stockholder for five years after the most recent date on which the interested stockholder becomes an interested stockholder. Generally, pursuant to the Business Combination Act, an “interested stockholder” is a person who, together with affiliates and associates, beneficially owns, directly or indirectly, 10% or more of a Maryland corporation’s voting stock. These provisions could have the effect of delaying, preventing or deterring a change in control of our Company or reducing the price that certain investors might be willing to pay in the future for shares of our capital stock. Additionally, the Maryland Control Share Acquisition Act may deny voting rights to shares involved in an acquisition of one-tenth or more of the voting stock of a Maryland corporation. In our charter and bylaws, we have elected not to have the Maryland Control Share Acquisition Act apply to any acquisition by any person of shares of stock of our Company. However, in the case of the control share acquisition statute, our Board of Directors may opt to make this statute applicable to us at any time by amending our bylaws, and may do so on a retroactive basis. Finally, the “unsolicited takeovers” provisions of the Maryland General Corporation Law permit our Board of Directors, without stockholder approval and regardless of what is currently provided in our charter or bylaws, to implement certain provisions that may have the effect of inhibiting a third-party from making an acquisition proposal for our Company or of delaying, deferring or preventing a change in control of our Company under circumstances that otherwise could provide the holders of our common stock with the opportunity to realize a premium over the then current market price or that stockholders may otherwise believe is in their best interests.
Inflation may adversely affect our financial condition and results of operations.
Although inflation has not materially impacted our results of operations in the recent past, increased inflation could have a more pronounced negative impact on any variable rate debt we incur in the future and on our results of operations. During times when inflation is greater than increases in rent, as provided for in our leases, rent increases may not keep up with the rate of inflation. Likewise, even though our triple-net leases reduce our exposure to rising property expenses due to inflation, substantial inflationary pressures and increased costs may have an adverse impact on our tenants if increases in their operating expenses exceed increases in revenue, which may adversely affect our tenants’ ability to pay rent.
The loss of certain members of our management team could adversely affect our business.
Our future success and ability to implement our business and investment strategy depends, in part, on our ability to attract and retain key management personnel and on the continued contributions of members of our senior management team, each of whom would be difficult to replace. As a REIT, we employ only 32 employees and have a cost-effective management structure. We do not have any employment agreements with any of our executives. In the event of the loss of key management personnel, or upon unexpected death, disability or retirement, we may not be able to find replacements with comparable skill, ability and industry expertise which could have a material adverse effect on our business, financial condition, results of operations, liquidity, ability to pay dividends or stock price.
Amendments to the Accounting Standards Codification made by the Financial Accounting Standards Board (the “FASB”) or changes in accounting standards issued by other standard-setting bodies may adversely affect our reported revenues, profitability or financial position.
Our consolidated financial statements are subject to the application of Generally Accepted Accounting Principles (“GAAP”) in accordance with the Accounting Standards Codification, which is periodically amended by the FASB. The application of GAAP is also subject to varying interpretations over time. Accordingly, we are required to adopt amendments to the Accounting Standards Codification or comply with revised interpretations that are issued from time-to-time by recognized authoritative bodies, including the FASB and the SEC. Those changes could adversely affect our reported revenues, profitability or financial position.
18
Table of Contents
Our assets may be subject to impairment charges.
We periodically evaluate our real estate investments and other assets for impairment indicators. The judgment regarding the existence of impairment indicators is based on GAAP, and includes a variety of factors such as market conditions, the accumulation of asset retirement costs due to changes in estimates associated with our estimated environmental liabilities, the status of significant leases, the financial condition of major tenants and other assumptions and factors that could affect the cash flow from or fair value of our properties. During the years ended December 31, 2015 and 2014, we incurred $17.4 million and $21.5 million, respectively, of non-cash impairment charges. We may be required to take similar non-cash impairment charges, which could affect the implementation of our current business strategy and have a material adverse effect on our financial condition and results of operations.
Terrorist attacks and other acts of violence or war may affect the market on which our common stock trades, the markets in which we operate, our operations and our results of operations.
Terrorist attacks or other acts of violence or war could affect our business or the businesses of our tenants. The consequences of armed conflicts are unpredictable, and we may not be able to foresee events that could have a material adverse effect on us. More generally, any of these events could cause consumer confidence and spending to decrease or result in increased volatility in the United States and worldwide financial markets and economy. Terrorist attacks also could be a factor resulting in, or a continuation of, an economic recession in the United States or abroad. Any of these occurrences could have a material adverse effect on our business, financial condition, results of operations, liquidity, ability to pay dividends or stock price.
We rely on information technology in our operations, and any material failure, inadequacy, interruption or security failure of that technology could harm our business.
We rely on information technology networks and systems, including the Internet, to process, transmit and store electronic information and to manage or support a variety of our business processes, including financial transactions and maintenance of records, which may include personal identifying information of tenants and lease data. We rely on commercially available systems, software, tools and monitoring to provide security for processing, transmitting and storing confidential tenant information, such as individually identifiable information relating to financial accounts. Although we have taken steps to protect the security of the data maintained in our information systems, it is possible that our security measures will not be able to prevent the systems’ improper functioning, or the improper disclosure of personally identifiable information such as in the event of cyberattacks. Security breaches, including physical or electronic break-ins, computer viruses, attacks by hackers and similar breaches, can create system disruptions, shutdowns or unauthorized disclosure of confidential information. Any failure to maintain proper function, security and availability of our information systems could interrupt our operations, damage our reputation, subject us to liability claims or regulatory penalties and could materially and adversely affect us.
Item 1B. Unresolved Staff Comments
None.
Substantially all our properties are leased or sublet to petroleum distributors and retailers engaged in the sale of refined petroleum products, convenience store products and automotive repair services who are responsible for the operations conducted at these properties and for the payment of taxes, maintenance, repair, insurance and other operating expenses relating to our properties. In those instances where we determine that the best use for a property is no longer its existing use, we will seek an alternative tenant or buyer for the property.
We believe that most of our owned and leased properties are adequately covered by casualty and liability insurance. In addition, we generally require our tenants, which exclude our month-to-month licensees, to provide insurance for all properties they lease from us, including casualty, liability, pollution legal liability, fire and extended coverage in amounts and on other terms satisfactory to us.
The following table summarizes the geographic distribution of our properties at December 31, 2015. The table also identifies the number and location of properties we lease from third-parties. In addition, we lease approximately 8,900 square feet of office space at Two Jericho Plaza, Jericho, New York, which is used for our corporate headquarters, which we believe will remain suitable and adequate for such purposes for the immediate future.
19
Table of Contents
| OWNED BY GETTY REALTY |
LEASED BY GETTY REALTY |
TOTAL PROPERTIES BY STATE |
PERCENT OF TOTAL PROPERTIES |
|||||||||||||
| New York |
229 | 50 | 279 | 32.8 | % | |||||||||||
| Massachusetts |
103 | 15 | 118 | 13.9 | ||||||||||||
| Connecticut |
75 | 13 | 88 | 10.3 | ||||||||||||
| New Jersey |
46 | 11 | 57 | 6.7 | ||||||||||||
| New Hampshire |
45 | 2 | 47 | 5.5 | ||||||||||||
| Virginia |
45 | 2 | 47 | 5.5 | ||||||||||||
| Maryland |
41 | 2 | 43 | 5.1 | ||||||||||||
| Washington State |
31 | — | 31 | 3.6 | ||||||||||||
| California |
29 | — | 29 | 3.4 | ||||||||||||
| Pennsylvania |
24 | 2 | 26 | 3.1 | ||||||||||||
| Texas |
19 | — | 19 | 2.2 | ||||||||||||
| Colorado |
15 | — | 15 | 1.8 | ||||||||||||
| Oregon |
10 | — | 10 | 1.2 | ||||||||||||
| Hawaii |
10 | — | 10 | 1.2 | ||||||||||||
| Maine |
7 | — | 7 | 0.7 | ||||||||||||
| Rhode Island |
5 | — | 5 | 0.6 | ||||||||||||
| Ohio |
4 | — | 4 | 0.5 | ||||||||||||
| Florida |
3 | — | 3 | 0.4 | ||||||||||||
| North Carolina |
3 | — | 3 | 0.4 | ||||||||||||
| Arkansas |
3 | — | 3 | 0.4 | ||||||||||||
| Delaware |
1 | 1 | 2 | 0.2 | ||||||||||||
| Nevada |
2 | — | 2 | 0.2 | ||||||||||||
| Washington, D.C. |
2 | — | 2 | 0.2 | ||||||||||||
| North Dakota |
1 | — | 1 | 0.1 | ||||||||||||
|
|
|
|
|
|
|
|
|
|||||||||
| Total |
753 | 98 | 851 | 100.0 | % | |||||||||||
|
|
|
|
|
|
|
|
|
|||||||||
The properties that we lease from third-parties have a remaining lease term, including renewal and extension option terms, averaging approximately 11 years. The following table sets forth information regarding lease expirations, including renewal and extension option terms, for properties that we lease from third-parties:
| CALENDAR YEAR |
NUMBER OF LEASES EXPIRING |
PERCENT OF TOTAL LEASED PROPERTIES |
PERCENT OF TOTAL PROPERTIES |
|||||||||
| 2016 |
10 | 10.2 | % | 1.2 | % | |||||||
| 2017 |
6 | 6.1 | 0.7 | |||||||||
| 2018 |
3 | 3.1 | 0.3 | |||||||||
| 2019 |
6 | 6.1 | 0.7 | |||||||||
| 2020 |
7 | 7.1 | 0.8 | |||||||||
|
|
|
|
|
|
|
|||||||
| Subtotal |
32 | 32.6 | 3.7 | |||||||||
| Thereafter |
66 | 67.4 | 7.8 | |||||||||
|
|
|
|
|
|
|
|||||||
| Total |
98 | 100.0 | % | 11.5 | % | |||||||
|
|
|
|
|
|
|
|||||||
Revenues from rental properties included in continuing and discontinued operations for the year ended December 31, 2015 were $107.2 million with respect to 875 average rental properties held during the year for an average revenue per rental property of approximately $122,500. Revenues from rental properties included in continuing and discontinued operations for the year ended December 31, 2014 were $99.1 million with respect to 905 average rental properties held during the year for an average revenue per rental property of approximately $110,000.
20
Table of Contents
Rental property lease expirations and annualized contractual rent as of December 31, 2015 are as follows (in thousands, except for the number of rental units data):
| CALENDAR YEAR |
NUMBER OF RENTAL PROPERTIES(a) |
ANNUALIZED CONTRACTUAL RENT(b) |
PERCENTAGE OF TOTAL ANNUALIZED RENT |
|||||||||
| Vacant |
23 | $ | — | 0.0 | % | |||||||
| Month-to-month |
15 | 770 | 0.9 | |||||||||
| 2016 |
14 | 711 | 0.8 | |||||||||
| 2017 |
36 | 1,902 | 2.1 | |||||||||
| 2018 |
18 | 1,400 | 1.6 | |||||||||
| 2019 |
47 | 2,914 | 3.3 | |||||||||
| 2020 |
23 | 2,626 | 3.0 | |||||||||
| 2021 |
32 | 3,317 | 3.7 | |||||||||
| 2022 |
11 | 634 | 0.7 | |||||||||
| 2023 |
4 | 276 | 0.3 | |||||||||
| 2024 |
8 | 796 | 0.9 | |||||||||
| 2025 |
— | — | — | |||||||||
| Thereafter |
620 | 73,178 | 82.7 | |||||||||
|
|
|
|
|
|
|
|||||||
| Total |
851 | $ | 88,524 | 100.0 | % | |||||||
|
|
|
|
|
|
|
|||||||
| (a) | With respect to a unitary master lease that includes properties that we lease from third-parties, the expiration dates refer to the dates that the leases with the third-parties expire and upon which date our tenant must vacate those properties, not the expiration date of the unitary master lease itself. |
| (b) | Represents the monthly contractual rent due from tenants under existing leases as of December 31, 2015 multiplied by 12. |
We are engaged in a number of legal proceedings, many of which we consider to be routine and incidental to our business. Many of these legal proceedings involve claims relating to alleged discharges of petroleum into the environment at current and former gasoline stations. We routinely assess our liabilities and contingencies in connection with these matters based upon the latest available information. The following is a description of material legal proceedings, including those involving private parties and governmental authorities under federal, state and local laws regulating the discharge of materials into the environment. We are vigorously defending all of the legal proceedings against us, including each of the legal proceedings listed below. As of December 31, 2015 and 2014, we had accrued $11.3 million and $11.0 million, respectively, for certain of these matters which accruals we believe were appropriate based on information then currently available. It is possible that losses related to these legal proceedings could exceed the amounts accrued as of December 31, 2015 and that such additional losses could cause a material adverse effect on our business, financial condition, results of operations, liquidity, ability to pay dividends or stock price.
In 1991, the State of New York commenced an action in the Supreme Court, Albany County, against Kingston Oil Supply Corp. (our former heating oil subsidiary), Charles Baccaro and Amos Post, Inc. The action seeks recovery for reimbursement of investigation and remediating costs incurred by the New York Environmental Protection and Spill Compensation Fund, together with interest and statutory penalties under the New York Navigation Law. We answered the complaint on behalf of Kingston Oil Supply Corp. and Amos Post Inc. Thereafter, from approximately 1993 to November 2011, the case remained dormant except for a brief period in 2002 when the State of New York indicated an intention to prosecute the lawsuit. In November 2011, the State of New York recommenced efforts to pursue its claims for reimbursement of costs, interest and statutory penalties under the Navigation Law. In 2013, we reevaluated this case and determined that Kingston Oil Supply Corp. (ownership of which was transferred in 2009 by Marketing to Lukoil North America LLC), should be defending the action on behalf of itself and its Amos Post division, and we therefore made a demand to Kingston Oil Supply Corp. that it be responsible for the action. Although Kingston Oil Supply Corp.’s law firm was substituted in place of our law firm as the attorneys of record for Kingston Oil Supply Corp. and Amos Post Inc., Kingston Oil Supply Corp. nevertheless continued to dispute our position as to its defense responsibilities. In November 2015, we settled our dispute with Kingston Oil Supply Corp. regarding who, as between the two of us, was responsible for defense and liability (if any) for the underlying action, by agreeing that we would each pay one-half of the costs of defense incurred going forward, and one-half of any award upon settlement or final judgment. Discussions with the State of New York regarding this case are ongoing.
In September 2004, the State of New York commenced an action against us, United Gas Corp., Costa Gas Station, Inc., The Ingraham Bedell Corporation, Exxon Mobil Corporation, Shell Oil Company, Shell Oil Products Company, Motiva Enterprises, LLC, and related parties, in New York Supreme Court in Albany County seeking recovery for reimbursement of investigation and remediation costs claimed to have been incurred by the New York Environmental Protection and Spill Compensation Fund relating to
21
Table of Contents
contamination it alleges emanated from various gasoline station properties located in the same vicinity in Uniondale, N.Y., including a site formerly owned by us and at which a petroleum release and cleanup occurred. The complaint also seeks future costs for remediation, as well as interest and penalties. We have served an answer to the complaint denying responsibility. We have also filed a third party complaint against Hess Corporation and certain individual defendants based on alleged contribution to the contamination that is the subject of the State’s claims arising from a petroleum discharge at a gasoline station up-gradient from the site formerly owned by us. Discovery in this case is ongoing.
In September 2008, we received a directive and notice of violation from the New Jersey Department of Environmental Protection (“NJDEP”) calling for a remedial investigation and cleanup, to be conducted by us and Gary and Barbara Galliker (the “Gallikers”), individually and trading as Millstone Auto Service (“Millstone”), Auto Tech and other named parties, of petroleum-related contamination found at a gasoline station property located in Millstone Township, New Jersey. We did not own or lease this property, but in 1985 we did acquire ownership of certain USTs located at the property. In 1986 we tried to remove these USTs and were refused access by the Gallikers to do so. We believe the USTs were transferred to the Gallikers by operation of law not later than 1987 and responded to the NJDEP’s directive and notice by denying liability. In November 2009, the NJDEP issued an Administrative Order and Notice of Civil Administrative Penalty Assessment (the “Order and Assessment”) to us, Marketing and the Gallikers, individually and trading as Millstone. We filed for, and were granted, a hearing to contest the allegations of the Order and Assessment. A case management conference was held by the Administrative Law Judge assigned to hear the case, which is still in early stages of discovery and without a scheduled hearing date. In 2014, the NJDEP issued a notice of violation directed to the Gallikers and Millstone to register and remove the contents of the USTs at the property. Thereafter, the Gallikers made written demand of us to investigate and remediate all contamination at the property. We have rejected the Gallikers’ demand on the basis that we are not responsible for the alleged contamination.
MTBE Litigation – State of New Jersey
We are a party to a case involving a large number of gasoline station sites throughout the State of New Jersey brought by various governmental agencies of the State of New Jersey, including the NJDEP. This New Jersey case (the “New Jersey MDL Proceedings”) is among the more than one hundred cases that were transferred from various state and federal courts throughout the country and consolidated in the United States District Court for the Southern District of New York for coordinated Multi-District Litigation (“MDL”) proceedings. The New Jersey MDL Proceedings allege various theories of liability due to contamination of groundwater with methyl tertiary butyl ether (a fuel derived from methanol, commonly referred to as “MTBE”) as the basis for claims seeking compensatory and punitive damages. New Jersey is seeking reimbursement of significant clean-up and remediation costs arising out of the alleged release of MTBE containing gasoline in the State of New Jersey and is asserting various natural resource damage claims as well as liability against the owners and operators of gasoline station properties from which the releases occurred. The New Jersey MDL Proceedings name us as a defendant along with approximately 50 petroleum refiners, manufacturers, distributors and retailers of MTBE, or gasoline containing MTBE, including Atlantic Richfield Company, BP America, Inc., BP Amoco Chemical Company, BP Products North America, Inc., Chevron Corporation, Chevron U.S.A., Inc., Citgo Petroleum Corporation, ConocoPhillips Company, Cumberland Farms, Inc., Duke Energy Merchants, LLC, ExxonMobil Corporation, ExxonMobil Oil Corporation, Getty Petroleum Marketing, Inc., Gulf Oil Limited Partnership, Hess Corporation, Lyondell Chemical Company, Lyondell-Citgo Refining, LP, Lukoil Americas Corporation, Marathon Oil Corporation, Mobil Corporation, Motiva Enterprises, LLC, Shell Oil Company, Shell Oil Products Company LLC, Sunoco, Inc., Unocal Corporation, Valero Energy Corporation, and Valero Refining & Marketing Company. Several of the named defendants have already settled the case against them. These cases have been transferred to the United States District Court for the District of New Jersey for pre-trial proceedings and trial, although a trial date has not yet been set. We continue to engage in settlement negotiations and a dialogue with the plaintiff’s counsel to educate them on the unique role of the Company and our business as compared to other defendants in the litigation, and with respect to certain facts applicable to our activities and gasoline stations, and affirmative defenses available to us, which we believe have not been sufficiently developed in the proceedings. In addition, we are pursuing claims for reimbursement of monies expended in the defense and settlement of certain MTBE cases under pollution insurance policies previously obtained by us and Marketing and under which we believe we are entitled to coverage, however, we have not yet confirmed whether and to what extent such coverage may actually be available. Although the ultimate outcome of the New Jersey MDL Proceedings cannot be ascertained at this time, we believe it is probable that this litigation will be resolved in a manner that is unfavorable to us. We are unable to estimate the range of loss in excess of the amount accrued with certainty for the New Jersey MDL Proceedings as we do not believe that plaintiffs’ settlement proposal is realistic and there remains uncertainty as to the allegations in this case as they relate to us, our defenses to the claims, our rights to indemnification or contribution from other parties and the aggregate possible amount of damages for which we may be held liable. It is possible that losses related to the New Jersey MDL Proceedings in excess of the amounts accrued as of December 31, 2015 could cause a material adverse effect on our business, financial condition, results of operations, liquidity, ability to pay dividends or stock price.
MTBE Litigation – State of Pennsylvania
On July 7, 2014, our subsidiary, Getty Properties Corp., was served with a complaint filed by the Commonwealth of Pennsylvania (the “State”) in the Court of Common Pleas, Philadelphia County relating to alleged statewide MTBE contamination in Pennsylvania (the
22
Table of Contents
“Complaint”). The named plaintiffs are the State, by and through Pennsylvania Attorney General Kathleen G. Kane (as Trustee of the waters of the State), the Pennsylvania Insurance Department (which governs and administers the Underground Storage Tank Indemnification Fund), the Pennsylvania Department of Environmental Protection (vested with the authority to protect the environment) and the Pennsylvania Underground Storage Tank Indemnification Fund.
The Complaint names us and more than 50 other defendants, including Exxon Mobil, various BP entities, Chevron, Citgo, Gulf, Lukoil Americas, Getty Petroleum Marketing Inc., Marathon, Hess, Shell Oil, Texaco, Valero, as well as other smaller petroleum refiners, manufacturers, distributors and retailers of MTBE or gasoline containing MTBE who are alleged to have distributed, stored and sold MTBE gasoline in Pennsylvania.
The Complaint seeks compensation for natural resource damages and for injuries sustained as a result of “defendants’ unfair and deceptive trade practices and act in the marketing of MTBE and gasoline containing MTBE.” The plaintiffs also seek to recover costs paid or incurred by the State to detect, treat and remediate MTBE from public and private water wells and groundwater. The plaintiffs assert causes of action against all defendants based on multiple theories, including strict liability – defective design; strict liability – failure to warn; public nuisance; negligence; trespass; and violation of consumer protection law.
The case was filed in the Court of Common Pleas, Philadelphia County, but was removed by defendants to the United States District Court for the Eastern District of Pennsylvania and then transferred to the United States District Court for the Southern District of New York so that it may be managed as part of the ongoing MTBE MDL. Plaintiffs have recently filed a Second Amended Complaint naming additional defendants and adding factual allegations intended to bolster their claims against the defendants. We have joined with other defendants in the filing of a motion to dismiss the claims against us. This motion is pending with the Court.
We intend to defend vigorously the claims made against us. Our ultimate liability, if any, in this proceeding is uncertain and subject to numerous contingencies which cannot be predicted and the outcome of which are not yet known.
Matters related to our former Newark, New Jersey Terminal and the Lower Passaic River
In September 2003, we received a directive (the “Directive”) issued by the NJDEP under the New Jersey Spill Compensation and Control Act. The Directive indicated that we are one of approximately 66 potentially responsible parties for alleged natural resource damages resulting from the discharges of hazardous substances along the lower Passaic River (the “Lower Passaic River”). Other named recipients of the Directive are 360 North Pastoria Environmental Corporation, Amerada Hess Corporation, American Modern Metals Corporation, Apollo Development and Land Corporation, Ashland Inc., AT&T Corporation, Atlantic Richfield Assessment Company, Bayer Corporation, Benjamin Moore & Company, Bristol Myers-Squibb, Chemical Land Holdings, Inc., Chevron Texaco Corporation, Diamond Alkali Company, Diamond Shamrock Chemicals Company, Diamond Shamrock Corporation, Dilorenzo Properties Company, Dilorenzo Properties, L.P., Drum Service of Newark, Inc., E.I. Dupont De Nemours and Company, Eastman Kodak Company, Elf Sanofi, S.A., Fine Organics Corporation, Franklin-Burlington Plastics, Inc., Franklin Plastics Corporation, Freedom Chemical Company, H.D. Acquisition Corporation, Hexcel Corporation, Hilton Davis Chemical Company, Kearny Industrial Associates, L.P., Lucent Technologies, Inc., Marshall Clark Manufacturing Corporation, Maxus Energy Corporation, Monsanto Company, Motor Carrier Services Corporation, Nappwood Land Corporation, Noveon Hilton Davis Inc., Occidental Chemical Corporation, Occidental Electro-Chemicals Corporation, Occidental Petroleum Corporation, Oxy-Diamond Alkali Corporation, Pitt-Consol Chemical Company, Plastics Manufacturing Corporation, PMC Global Inc., Propane Power Corporation, Public Service Electric & Gas Company, Public Service Enterprise Group, Inc., Purdue Pharma Technologies, Inc., RTC Properties, Inc., S&A Realty Corporation, Safety-Kleen Envirosystems Company, Sanofi S.A., SDI Divestiture Corporation, Sherwin Williams Company, SmithKline Beecham Corporation, Spartech Corporation, Stanley Works Corporation, Sterling Winthrop, Inc., STWB Inc., Texaco Inc., Texaco Refining and Marketing Inc., Thomasset Colors, Inc., Tierra Solution, Incorporated, Tierra Solutions, Inc., and Wilson Five Corporation.
The Directive provides, among other things, that the named recipients must conduct an assessment of the natural resources that have been injured by discharges into the Lower Passaic River and must implement interim compensatory restoration for the injured natural resources. The NJDEP alleges that our liability arises from alleged discharges originating from our former Newark, New Jersey Terminal site (which was sold in October 2013). We responded to the Directive by asserting that we are not liable. There has been no material activity and/or communications by the NJDEP with respect to the Directive since early after its issuance.
In May 2007, the United States Environmental Protection Agency (“EPA”) entered into an Administrative Settlement Agreement and Order on Consent (“AOC”) with over 70 parties to perform a Remedial Investigation and Feasibility Study (“RI/FS”) for a 17 mile stretch of the Lower Passaic River in New Jersey. The RI/FS is intended to address the investigation and evaluation of alternative remedial actions with respect to alleged damages to the Lower Passaic River. Most of the parties to the AOC, including us, are also members of a Cooperating Parties Group (“CPG”). The CPG agreed to an interim allocation formula for purposes of allocating the costs to complete the RI/FS among its members, with the understanding that this agreed-upon allocation formula is not binding on the parties in terms of any potential liability for the costs to remediate the Lower Passaic River. The CPG submitted to the EPA its draft RI/FS in 2015. The draft RI/FS set forth various alternatives for remediating the entire 17 mile stretch of the Lower Passaic River, and provides that cost estimate for the preferred remedial action presented therein is in the range of approximately $483 million to $725 million. The EPA is still evaluating the draft RI/FS report submitted by the CPG.
23
Table of Contents
In addition to the RI/FS activities, other actions relating to the investigation and/or remediation of the Lower Passaic River have proceeded as follows. First, in June 2012, certain members of the CPG entered into an Administrative Settlement Agreement and Order on Consent (“10.9 AOC”) effective June 18, 2012 to perform certain remediation activities, including removal and capping of sediments at the river mile 10.9 area and certain testing. The EPA also issued a Unilateral Order to Occidental Chemical Corporation (“Occidental”) directing Occidental to participate and contribute to the cost of the river mile 10.9 work. Concurrent with the CPG’s work on the RI/FS, on April 11, 2014, the EPA issued a draft Focused Feasibility Study (“FFS”) with proposed remedial alternatives to remediate the lower 8-miles of the 17 mile stretch of the Lower Passaic River. The FFS was subject to public comments and objections and, on March 4, 2016, the EPA issued its Record of Decision (“ROD”) for the lower 8-miles selecting a remedy that involves bank-to-bank dredging and installing an engineered cap with an estimated cost of $1.38 billion. The Company does not know how the EPA intends to implement the ROD, but anticipates that performance of the EPA’s selected remedy will be subject to future negotiation, potential enforcement proceedings and/or litigation, thus many uncertainties remain. The RI/FS, AOC and 10.9 AOC do not obligate us to fund or perform remedial action contemplated by either the ROD or RI/FS and do not resolve liability issues for remedial work or the restoration of or compensation for alleged natural resource damages to the Lower Passaic River, which are not known at this time. Our ultimate liability, if any, in the pending and possible future proceedings pertaining to the Lower Passaic River is uncertain and subject to numerous contingencies which cannot be predicted and the outcome of which are not yet known.
We have made a demand upon Chevron/Texaco for indemnity under certain agreements between us and Chevron/Texaco that allocate environmental liabilities for the Newark Terminal site between the parties. In response, Chevron/Texaco has asserted that the proceedings and claims are still not yet developed enough to determine the extent to which indemnities apply. We have engaged in discussions with Chevron/Texaco regarding our demands for indemnification. To facilitate these discussions, in October 2009, the parties entered into a Tolling/Standstill Agreement which tolls all claims by and among Chevron/Texaco and us that relate to the various Lower Passaic River matters, until either party terminates such Tolling/Standstill Agreement.
Lukoil Americas Case
In March 2016, we filed a civil lawsuit in the New York State Supreme Court, New York County, against Lukoil Americas Corporation and certain of its current or former executives, seeking recovery of environmental remediation costs that we have either incurred, or expect to incur, at properties previously leased to Marketing pursuant to the Master Lease. The lawsuit alleges various theories of liability, including claims based on environmental liability statutes in effect in the states in which the properties are located, claims seeking to pierce Marketing’s corporate veil, negligence claims and tortious interference claims. This case is at the earliest stage of its proceedings. It is not possible to predict or estimate the potential outcome of this case.
Item 4. Mine Safety Disclosures
None.
24
Table of Contents
Item 5. Market for Registrant’s Common Equity, Related Stockholder Matters and Issuer Purchases of Equity Securities Capital Stock
Our common stock is traded on the New York Stock Exchange (symbol: “GTY”). There were approximately 10,161 beneficial holders of our common stock as of March 10, 2016, of which approximately 1,014 were holders of record. The price range of our common stock and cash dividends declared with respect to each share of common stock during the years ended December 31, 2015 and 2014 was as follows:
| PRICE RANGE | CASH DIVIDENDS |
|||||||||||
| QUARTER ENDED |
HIGH | LOW | PER SHARE | |||||||||
| March 31, 2014 |
20.00 | 18.00 | .2000 | |||||||||
| June 30, 2014 |
20.39 | 18.44 | .2000 | |||||||||
| September 30, 2014 |
19.43 | 17.00 | .2000 | |||||||||
| December 31, 2014 |
18.99 | 17.00 | .3600 | (a) | ||||||||
| March 31, 2015 |
19.30 | 17.03 | .2200 | |||||||||
| June 30, 2015 |
18.59 | 16.29 | .2200 | |||||||||
| September 30, 2015 |
17.10 | 15.16 | .2400 | |||||||||
| December 31, 2015 |
17.87 | 15.67 | .4700 | (b) | ||||||||
| (a) | Includes a $0.14 per share special dividend declared in the quarter ended December 31, 2014. |
| (b) | Includes a $0.22 per share special dividend declared in the quarter ended December 31, 2015. |
For a discussion of potential limitations on our ability to pay future dividends see “Item 1A. Risk Factors – We may change our dividend policy and the dividends we pay may be subject to significant volatility” and “Item 7. Management’s Discussion and Analysis of Financial Condition and Results of Operations — Liquidity and Capital Resources”.
Issuer Purchases of Equity Securities
None.
Sales of Unregistered Securities
None.
25
Table of Contents
Stock Performance Graph
Comparison of Five-Year Cumulative Total Return*
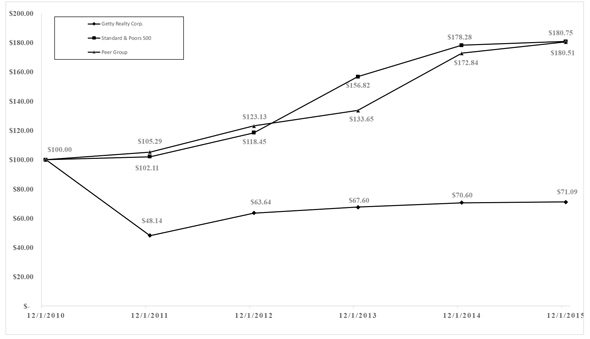
Source: SNL Financial
| 12/31/2010 | 12/31/2011 | 12/31/2012 | 12/31/2013 | 12/31/2014 | 12/31/2015 | |||||||||||||||||||
| Getty Realty Corp. |
100.00 | 48.14 | 63.64 | 67.60 | 70.60 | 71.09 | ||||||||||||||||||
| Standard & Poors 500 |
100.00 | 102.11 | 118.45 | 156.82 | 178.28 | 180.75 | ||||||||||||||||||
| Peer Group |
100.00 | 105.29 | 123.13 | 133.65 | 172.84 | 180.51 | ||||||||||||||||||
Assumes $100 invested at the close of the last day of trading on the New York Stock Exchange on December 31, 2010 in Getty Realty Corp. common stock, Standard & Poors 500 and Peer Group.
| * | Cumulative total return assumes reinvestment of dividends. |
We have chosen as our Peer Group the following companies: National Retail Properties, Entertainment Properties Trust, Realty Income Corp. and Hospitality Properties Trust. We have chosen these companies as our Peer Group because a substantial segment of each of their businesses is owning and leasing commercial properties. We cannot assure you that our stock performance will continue in the future with the same or similar trends depicted in the graph above. We do not make or endorse any predictions as to future stock performance.
This performance graph and related information shall not be deemed filed for the purposes of Section 18 of the Exchange Act or otherwise subject to the liability of that Section and shall not be deemed to be incorporated by reference into any filing that we make under the Securities Act or the Exchange Act.
26
Table of Contents
Item 6. Selected Financial Data
GETTY REALTY CORP. AND SUBSIDIARIES
SELECTED FINANCIAL DATA
(in thousands, except per share amounts and number of properties)
| FOR THE YEARS ENDED DECEMBER 31, | ||||||||||||||||||||
| 2015(a) | 2014(b) | 2013(c) | 2012 | 2011(d) | ||||||||||||||||
| OPERATING DATA: |
||||||||||||||||||||
| Total revenues |
$ | 110,733 | $ | 99,893 | $ | 102,818 | (e) | $ | 96,122 | $ | 94,291 | |||||||||
| Earnings from continuing operations |
40,370 | (f) | 20,405 | 27,376 | (g) | 13,728 | (h) | 9,301 | (i) | |||||||||||
| (Loss) earnings from discontinued operations |
(2,960 | ) | 3,013 | 42,635 | (1,281 | ) | 3,155 | |||||||||||||
|
|
|
|
|
|
|
|
|
|
|
|||||||||||
| Net earnings |
37,410 | 23,418 | 70,011 | 12,447 | 12,456 | |||||||||||||||
| Basic and diluted earnings per common share: |
||||||||||||||||||||
| Earnings from continuing operations |
1.20 | 0.60 | 0.81 | 0.41 | 0.27 | |||||||||||||||
| Net earnings |
1.11 | 0.69 | 2.08 | 0.37 | 0.37 | |||||||||||||||
| Basic and diluted weighted average common shares outstanding |
33,420 | 33,409 | 33,397 | 33,395 | 33,172 | |||||||||||||||
| Cash dividends declared per share (j) |
1.15 | 0.96 | 0.85 | 0.375 | 1.46 | |||||||||||||||
| FUNDS FROM OPERATIONS AND ADJUSTED FUNDS FROM OPERATIONS (k): |
||||||||||||||||||||
| Net earnings |
37,410 | 23,418 | 70,011 | 12,447 | 12,456 | |||||||||||||||
| Depreciation and amortization |
16,974 | 10,549 | 9,927 | 13,700 | 10,336 | |||||||||||||||
| Gains on dispositions of real estate |
(2,611 | ) | (10,218 | ) | (45,505 | ) | (6,866 | ) | (968 | ) | ||||||||||
| Impairments |
17,361 | 21,534 | 13,425 | 13,942 | 20,226 | |||||||||||||||
|
|
|
|
|
|
|
|
|
|
|
|||||||||||
| Funds from operations |
69,134 | 45,283 | 47,858 | 33,223 | 42,050 | |||||||||||||||
| Revenue recognition adjustments |
(4,471 | ) | (5,372 | ) | (8,379 | ) | (4,433 | ) | (1,163 | ) | ||||||||||
| Allowance for deferred rental revenue/mortgage receivable |
(93 | ) | 2,331 | 4,775 | — | 19,758 | ||||||||||||||
| Acquisition costs |
445 | 104 | 480 | — | 2,034 | |||||||||||||||
| Non-cash changes in environmental estimates |
(4,639 | ) | (2,756 | ) | (2,956 | ) | (4,215 | ) | — | |||||||||||
| Accretion expense |
4,829 | 3,046 | 3,214 | 3,174 | 775 | |||||||||||||||
|
|
|
|
|
|
|
|
|
|
|
|||||||||||
| Adjusted funds from operations |
65,205 | 42,636 | 44,992 | 27,749 | 63,454 | |||||||||||||||
| BALANCE SHEET DATA (AT END OF YEAR): |
||||||||||||||||||||
| Real estate before accumulated depreciation and amortization |
$ | 783,233 | $ | 595,959 | $ | 570,275 | $ | 562,316 | $ | 615,854 | ||||||||||
| Total assets |
899,129 | 687,501 | 682,402 | 640,581 | 635,089 | |||||||||||||||
| Total debt |
319,303 | 125,344 | 158,000 | 172,320 | 170,510 | |||||||||||||||
| Shareholders’ equity |
406,561 | 407,024 | 415,091 | 372,749 | 372,169 | |||||||||||||||
| NUMBER OF PROPERTIES: |
||||||||||||||||||||
| Owned |
753 | 757 | 840 | 946 | 996 | |||||||||||||||
| Leased |
98 | 106 | 125 | 135 | 153 | |||||||||||||||
|
|
|
|
|
|
|
|
|
|
|
|||||||||||
| Total properties |
851 | 863 | 965 | 1,081 | 1,149 | |||||||||||||||
|
|
|
|
|
|
|
|
|
|
|
|||||||||||
| (a) | Includes (from the date of the acquisition) the effect of the $214.5 million acquisition of 77 convenience store and gasoline station properties from affiliates of Pacific Convenience and Fuels LLC which we simultaneously leased to United Oil which we acquired on June 3, 2015 and the effect of a $17.4 million impairment charge. |
| (b) | Includes the effect of a $2.2 million non-cash allowance for deferred rent receivable and the effect of a $21.5 million impairment charge. |
| (c) | Includes (from the date of the acquisition) the effect of the $72.5 million acquisition of 16 Mobil-branded convenience store and gasoline station properties and 20 Exxon- and Shell-branded convenience store and gasoline station properties in two sale/leaseback transactions with subsidiaries of Capitol Petroleum Group, LLC which were acquired on May 9, 2013. |
| (d) | Includes (from the respective dates of the acquisition) the effect of the $111.6 million acquisition of 59 Mobil-branded convenience store and gasoline station properties in a sale/leaseback and loan transaction with CPD NY Energy Corp. which were acquired on January 13, 2011 and the effect of the $87.0 million acquisition of 66 Shell-branded convenience store and gasoline station properties in a sale/leaseback transaction with Nouria Energy Ventures I, LLC which were acquired on March 31, 2011. |
| (e) | Includes $3.1 million of other revenue recorded in 2013 for the partial recovery of damages stemming from Marketing’s default of its obligations under the Master Lease, which was received as a result of the Lukoil Settlement. |
| (f) | Includes the effect of $18.2 million of other income recorded in 2015 received from the Marketing Estate. |
| (g) | Includes the effect of a $15.2 million net credit for bad debt expense primarily related to receiving funds from the Marketing Estate and the Litigation Funding Agreement (both defined below), the effect of a $9.6 million increase in provisions for environmental litigation losses, the effect of a $4.3 million non-cash allowance for deferred rent receivable and the effect of a $3.6 million impairment charge. |
| (h) | Includes the effect of a $12.0 million accounts receivable reserve and the effect of a $5.1 million impairment charge. |
| (i) | Includes the effect of a $16.7 million non-cash allowance for deferred rent receivable, the effect of a $6.6 million accounts receivable reserve and the effect of a $12.7 million impairment charge. |
| (j) | Includes special dividends of $0.22 per share, $0.14 per share and $0.05 per share for the years ended December 31, 2015, 2014 and 2013, respectively. |
| (k) | See “Item 7. Management’s Discussion and Analysis of Financial Condition and Results of Operations – General – Supplemental Non-GAAP Measures”. |
27
Table of Contents
Item 7. Management’s Discussion and Analysis of Financial Condition and Results of Operations
The following discussion and analysis should be read in conjunction with the “Cautionary Note Regarding Forward-Looking Statements”; the sections in Part I entitled “Item 1A. Risk Factors”; the selected financial data in in Part II entitled “Item 6. Selected Financial Data”; and the consolidated financial statements and related notes in “Item 8. Financial Statements and Supplementary Data”.
GENERAL
Real Estate Investment Trust
We are a real estate investment trust (“REIT”) specializing in the ownership, leasing and financing of convenience store and gasoline station properties. As of December 31, 2015, we owned 753 properties and leased 98 properties from third-party landlords. As a REIT, we are not subject to federal corporate income tax on the taxable income we distribute to our shareholders. In order to continue to qualify for taxation as a REIT, we are required, among other things, to distribute at least 90% of our ordinary taxable income to our shareholders each year.
Our Convenience Store and Gasoline Stations Assets
Substantially all of our properties are leased on a triple-net basis primarily to petroleum distributors and, to a lesser extent, to individual operators. Generally our tenants supply fuel and either operate our properties directly or sublet our properties to operators who operate their convenience stores, gasoline stations, automotive repair service facilities or other businesses at our properties. Our triple-net tenants are contractually responsible for the payment of all taxes, maintenance, repairs, insurance and other operating expenses relating to our properties, and are also responsible for environmental contamination occurring during the terms of their leases and in certain cases also for environmental contamination that existed before their leases commenced. Substantially all of our tenants’ financial results depend on the sale of refined petroleum products, convenience store sales or rental income from their subtenants. As a result, our tenants’ financial results are highly dependent on the performance of the petroleum marketing industry, which is highly competitive and subject to volatility. During the terms of our leases, we monitor the credit quality of our triple-net tenants by reviewing their published credit rating, if available, reviewing publicly available financial statements, or reviewing financial or other operating statements which are delivered to us pursuant to applicable lease agreements, monitoring news reports regarding our tenants and their respective businesses, and monitoring the timeliness of lease payments and the performance of other financial covenants under their leases. For additional information regarding our real estate business, our properties and environmental matters, see “Item 1. Business — Company Operations”, “Item 2. Properties” and “Environmental Matters” below.
Investment/Redevelopment Strategy
As part of our overall growth strategy, we regularly review acquisition and financing opportunities to invest in additional convenience store and gasoline station properties, and we expect to continue to pursue investments that we believe will benefit our financial performance. In addition to sale/leaseback and other real estate acquisitions, our investment activities include purchase money financing with respect to properties we sell, and real property loans relating to our leasehold portfolios. Our investment strategy seeks to generate current income and benefit from long-term appreciation in the underlying value of our real estate. To achieve that goal we seek to invest in high quality individual properties and real estate portfolios that will promote geographic diversity. A key element of our investment strategy is to invest in properties in strong primary markets that serve high density population centers. We cannot provide any assurance that we will be successful making additional investments, that investments will be available which meet our investment criteria or that our current sources of liquidity will be sufficient to fund such investments.
We believe that a portion of our properties are located in geographic areas, which together with other factors, may make them well-suited for alternative uses such as quick service restaurants, automotive parts and service stores, specialty retail stores and bank branch locations. We believe that such alternative types of properties can be leased or sold at higher prices than their current use. We are in the process of pursuing redevelopment opportunities on certain of our transitional properties. In addition, we are also seeking to recapture select properties from our net lease portfolio to redevelop such properties for alternative uses.
Net Lease Portfolio
As of December 31, 2015, we leased 805 properties to tenants under long-term triple-net leases; an increase of 109 properties, or 16%, over the year ended December 31, 2014. Our net lease portfolio consists of 724 properties leased to 25 regional and national fuel distributors under unitary or master triple-net leases and 81 properties leased as single unit triple-net leases. These leases generally provide for initial terms of 15 years with options for successive renewal terms of up to 20 years and periodic rent escalations. Several of our leases provide for additional rent based on the aggregate volume of fuel sold. Certain leases require our tenants to invest capital in our properties.
28
Table of Contents
Transitional Properties
We regularly evaluate our portfolio of properties and, as of December 31, 2015, we had 46 properties which we consider to be transitional properties, defined as properties which we are actively repositioning for sale, redevelopment or re-leasing. As of December 31, 2015, our transitional properties were comprised of (i) eight properties subject to the NECG Lease, (ii) 15 properties occupied under month-to-month license agreements and (iii) 23 properties that are vacant.
Our month-to-month license agreements allow the licensees to occupy and use these properties as convenience stores, gasoline stations, automotive repair service facilities or other businesses. These month-to-month license agreements are intended as interim occupancy arrangements until these properties are sold or leased on a triple-net basis. Under our month-to-month license agreements we are responsible for the payment of operating expenses (such as maintenance, repairs and real estate taxes), certain environmental compliance costs and costs associated with any environmental remediation. We will continue to be responsible for such operating expenses and environmental costs until these properties are sold or leased on a triple-net basis, and under certain leases and agreements thereafter. For vacant transitional properties, we are responsible for the payment of all operating expenses, environmental compliance costs and costs associated with environmental remediation until these properties are sold, or leased on a triple-net basis. The incurrence of these various expenses may materially negatively impact our cash flow and ability to pay dividends.
We expect that we will either sell or enter into new leases on all transitional properties over time. In addition, we also expect to invest in redeveloping certain of our transitional properties for alternative single tenant net lease uses. Although we are currently working on repositioning transitional properties, the timing of pending or anticipated transactions may be affected by factors beyond our control and we cannot predict when or on what terms sales or leases will ultimately be consummated.
Our estimates, judgments, assumptions and beliefs regarding our properties affect the amounts reported in our consolidated financial statements and are subject to change. Actual results could differ from these estimates, judgments and assumptions and such differences could be material. If we are unable to re-let or sell our properties upon terms that are favorable to us, if the amounts realized from the disposition of assets held for sale vary significantly from our estimates of fair value, or if we change our estimates, judgments, assumptions and beliefs, our business, financial condition, revenues, operating expenses, results of operations, liquidity, ability to pay dividends and stock price may be materially adversely affected or adversely affected to a greater extent than we have experienced.
Marketing and the Master Lease
Approximately 400 of the properties we own or lease as of December 31, 2015 were previously leased to Marketing pursuant to the Master Lease. In December 2011, Marketing filed for Chapter 11 bankruptcy protection in the Bankruptcy Court. The Master Lease was terminated effective April 30, 2012, and in July 2012, the Bankruptcy Court approved Marketing’s Plan of Liquidation and appointed the Liquidating Trustee to oversee liquidation of the Marketing Estate.
As part of Marketing’s bankruptcy proceeding, we maintained significant pre-petition and post-petition unsecured claims against Marketing. On March 3, 2015, we entered into the Settlement Agreement with the Liquidating Trustee of the Marketing Estate to resolve claims asserted by us in Marketing’s bankruptcy case. The Settlement Agreement was approved by an order of the U.S. Bankruptcy Court, and, on April 22, 2015, we received a distribution from the Marketing Estate of $6.8 million on account of our unsecured claims.
The Settlement Agreement also resolved a dispute relating to the balance of payment due to us pursuant to our agreement to fund the lawsuit that was brought by the Liquidating Trustee against Lukoil Americas Corporation and related entities and individuals for the benefit of Marketing’s creditors. As a result, on April 22, 2015, we also received an additional distribution of approximately $0.6 million from the Marketing Estate in full resolution of the funding agreement dispute.
On October 19, 2015, the U.S. Bankruptcy Court entered a final decree closing the bankruptcy case of the Marketing Estate. As a result, on November 3, 2015, we received a final distribution from the Marketing Estate of approximately $10.8 million on account of our general unsecured claims. We do not expect to receive any further distributions from the Marketing Estate.
The $18.2 million received from the Marketing Estate for the year ended December 31, 2015 is included in other income on our consolidated statements of operations.
Asset Impairment
We perform an impairment analysis for the carrying amount of our properties in accordance with GAAP when indicators of impairment exist. We reduced the carrying amount to fair value, and recorded in continuing and discontinued operations, non-cash impairment charges aggregating $17.4 million and $21.5 million for the years ended December 31, 2015 and 2014, respectively, where the carrying amount of the property exceeds the estimated undiscounted cash flows expected to be received during the assumed holding period which includes the estimated sales value expected to be received at disposition. The non-cash impairment charges were
29
Table of Contents
attributable to reductions in estimated undiscounted cash flows expected to be received during the assumed holding period, reductions in our estimates of value for properties held for sale and the accumulation of asset retirement costs due to changes in estimates associated with our environmental liabilities which increased the carrying value of certain properties in excess of their fair value. The evaluation of and estimates of anticipated cash flows used to conduct our impairment analysis are highly subjective and actual results could vary significantly from our estimates.
Supplemental Non-GAAP Measures
We manage our business to enhance the value of our real estate portfolio and, as a REIT, place particular emphasis on minimizing risk, to the extent feasible, and generating cash sufficient to make required distributions to shareholders of at least 90% of our ordinary taxable income each year. In addition to measurements defined by GAAP, we also focus on funds from operations available to common shareholders (“FFO”) and adjusted funds from operations available to common shareholders (“AFFO”) to measure our performance. FFO is generally considered to be an appropriate supplemental non-GAAP measure of the performance of REITs. FFO is defined by the National Association of Real Estate Investment Trusts as net earnings before depreciation and amortization of real estate assets, gains or losses on dispositions of real estate, non-cash impairment charges and cumulative effect of accounting change. Other REITs may use definitions of FFO and/or AFFO that are different from ours and, accordingly, may not be comparable.
FFO and AFFO are not in accordance with, or a substitute for, measures prepared in accordance with GAAP. In addition, FFO and AFFO are not based on any comprehensive set of accounting rules or principles. Neither FFO nor AFFO represent cash generated from operating activities calculated in accordance with GAAP and therefore these measures should not be considered an alternative for GAAP net earnings or as a measure of liquidity. These measures should only be used to evaluate our performance in conjunction with corresponding GAAP measures.
We believe that FFO and AFFO are helpful to investors in measuring our performance because both FFO and AFFO exclude various items included in GAAP net earnings that do not relate to, or are not indicative of, our fundamental operating performance. Our assessment of our operations is focused on long-term sustainability and not on non-cash items, which may cause short-term fluctuations in net income but have no impact on cash flows. FFO excludes various items such as gains or losses on property dispositions, depreciation and amortization of real estate assets and non-cash impairment charges. In our case, however, GAAP net earnings and FFO typically include the impact of Revenue Recognition Adjustments comprised of deferred rental revenue (straight-line rental revenue), the net amortization of above-market and below-market leases, adjustments recorded for recognition of rental of income recognized from direct financing leases on revenues from rental properties and the amortization of deferred lease incentives, as offset by the impact of related collection reserves. Deferred rental revenue results primarily from fixed rental increases scheduled under certain leases with our tenants. In accordance with GAAP, the aggregate minimum rent due over the current term of these leases are recognized on a straight-line (or average) basis rather than when payment is contractually due. The present value of the difference between the fair market rent and the contractual rent for in-place leases at the time properties are acquired is amortized into revenue from rental properties over the remaining lives of the in-place leases. Income from direct financing leases is recognized over the lease terms using the effective interest method which produces a constant periodic rate of return on the net investments in the leased properties. The amortization of deferred lease incentives represents our funding commitment in certain leases, which deferred expense is recognized on a straight-line basis as a reduction of rental revenue. GAAP net earnings and FFO also include non-cash environmental accretion expense and non-cash changes in environmental estimates, which do not impact our recurring cash flow. GAAP net earnings and FFO from time to time may also include property acquisition costs or other unusual items. Property acquisition costs are expensed, generally in the period when properties are acquired, and are not reflective of recurring operations. Other unusual items are not reflective of recurring operations.
We pay particular attention to AFFO, a supplemental non-GAAP performance measure that we believe best represents our recurring financial performance. Beginning in the fourth quarter of 2014, we revised our definition of AFFO to exclude non-cash environmental accretion expense and non-cash changes in environmental estimates. AFFO for all periods presented has been restated to conform to our revised definition.
Our revised definition of AFFO is defined as FFO less Revenue Recognition Adjustments (net of allowances), acquisition costs, non-cash environmental accretion expense and non-cash changes in environmental estimates and other unusual items. In our view, AFFO provides a more accurate depiction than FFO of our fundamental operating performance as AFFO removes non-cash Revenue Recognition Adjustments related to: (i) scheduled rent increases from operating leases, net of related collection reserves; (ii) the rental revenue earned from acquired in-place leases; (iii) rent due from direct financing leases; and (iv) the amortization of deferred lease incentives. Our definition of AFFO also excludes non-cash, or non-recurring items such as: (i) non-cash environmental accretion expense and non-cash changes in environmental estimates, (ii) costs expensed related to property acquisitions; and (iii) other unusual items. By providing AFFO, we believe we are presenting useful information that assists investors and analysts to better assess the sustainability of our operating performance. Further, we believe AFFO is useful in comparing the sustainability of our operating performance with the sustainability of the operating performance of other real estate companies.
30
Table of Contents
2015 and 2014 Acquisitions
In 2015, we acquired fee simple interests in 80 convenience store and gasoline station properties for an aggregate purchase price of $219.2 million.
On June 3, 2015, we acquired fee simple interests in 77 convenience store and gasoline station properties from affiliates of Pacific Convenience and Fuels LLC and simultaneously leased the properties to Apro, LLC (d/b/a “United Oil”), a leading regional convenience store and gasoline station operator, under three separate cross-defaulted long-term triple-net unitary leases (the “United Oil Transaction”). The United Oil properties are located across California, Colorado, Nevada, Oregon and Washington State and operate under several well recognized brands including 7-Eleven, 76, Circle K, Conoco and My Goods Market. The total purchase price for the acquisition was approximately $214.5 million, which was funded with proceeds from the Credit Agreement and Restated Prudential Note Purchase Agreement.
In addition, in 2015, we acquired fee simple interests in three convenience store and gasoline station properties in separate transactions for an aggregate purchase price of $4.7 million.
In 2014, we acquired fee simple interests in ten convenience store and gasoline station properties in separate transactions for an aggregate purchase price of $17.6 million.
RESULTS OF OPERATIONS
Year ended December 31, 2015 compared to year ended December 31, 2014
Total revenues included in continuing operations increased by $10.8 million to $110.7 million for the year ended December 31, 2015, as compared to $99.9 million for the year ended December 31, 2014. The increase in total revenues for the year ended December 31, 2015 was primarily due to approximately $10.2 million of revenues from the properties acquired in the United Oil Transaction which closed in June 2015. Revenues from rental properties included in continuing operations were $107.0 million and $96.7 million for the years ended December 31, 2015 and 2014, respectively. Rental income contractually due or received from our tenants included in revenues from rental properties in continuing operations was $88.4 million for the year ended December 31, 2015, as compared to $77.7 million for the year ended December 31, 2014. Revenues from rental properties and property costs included $14.1 million and $13.8 million for the years ended December 31, 2015 and 2014, respectively, of “pass-through” real estate taxes and other municipal charges paid by us and reimbursable by our tenants pursuant to their triple-net lease agreements. Interest income on notes and mortgages receivable was $3.7 million for the year ended December 31, 2015, as compared to $3.1 million for the year ended December 31, 2014.
In accordance with GAAP, we recognize revenues from rental properties in amounts which vary from the amount of rent contractually due or received during the periods presented. As a result, revenues from rental properties include Revenue Recognition Adjustments comprised of non-cash adjustments recorded for deferred rental revenue due to the recognition of rental income on a straight-line basis over the current lease term, the net amortization of above-market and below-market leases, recognition of rental income under direct financing leases using the effective interest rate method which produces a constant periodic rate of return on the net investments in the leased properties and the amortization of deferred lease incentives. Revenues from rental properties included in continuing operations includes Revenue Recognition Adjustments which increased rental revenue by $4.5 million for the year ended December 31, 2015 and $5.3 million for the year ended December 31, 2014.
Property costs included in continuing operations, which are primarily comprised of rent expense, real estate and other state and local taxes and maintenance expense, were $23.6 million for the year ended December 31, 2015, as compared to $23.8 million for the year ended December 31, 2014. The decrease in property costs is principally due to declines in rent expense and maintenance expenses, offset by an increase in “pass-through” real estate taxes paid by us. We continue to reduce our property costs due to our efforts to dispose of or re-lease certain of our transitional properties.
Non-cash impairment charges included in continuing operations were $11.6 million for the year ended December 31, 2015, as compared to $12.9 million for the year ended December 31, 2014. Impairment charges are recorded when the carrying value of a property is reduced to fair value. The non-cash impairment charges in continuing operations for the years ended December 31, 2015 and 2014 were primarily attributable to the effect of adding asset retirement costs due to changes in estimates associated with our environmental liabilities, which increased the carrying value of certain properties in excess of their fair value, and reductions in estimated undiscounted cash flows expected to be received during the assumed holding period for certain of our properties.
Environmental expenses included in continuing operations for the year ended December 31, 2015 increased by $1.6 million to $6.2 million, as compared to $4.6 million for the year ended December 31, 2014. The increase in environmental expenses for the year ended December 31, 2015 was principally due to a $0.5 million increase in litigation losses and legal fees and a $1.1 million increase in environmental remediation costs. Environmental expenses vary from period to period and, accordingly, undue reliance should not be placed on the magnitude or the direction of change in reported environmental expenses for one period, as compared to prior periods.
31
Table of Contents
General and administrative expenses included in continuing operations increased by $1.1 million to $16.9 million for the year ended December 31, 2015, as compared to $15.8 million for the year ended December 31, 2014. The increase in general and administrative expenses for the year ended December 31, 2015 was principally due to $1.1 million of non-recurring employee related expenses attributable to severance and retirement costs.
Allowance for uncollectible accounts included in continuing operations was $1.1 million for the year ended December 31, 2015, as compared to a $3.4 million for the year ended December 31, 2014. The decrease in allowance for uncollectible accounts was principally due to $2.1 million in allowances for deferred rent receivable related to the NECG Lease and Ramoco Lease recorded for the year ended December 31, 2014.
Depreciation and amortization expense included in continuing operations was $17.0 million for the year ended December 31, 2015, as compared to $10.5 million for the year ended December 31, 2014. The increase was primarily due to depreciation charges related to asset retirement costs and properties acquired offset by the effect of certain assets becoming fully depreciated, lease terminations and dispositions of real estate.
Gains on dispositions of real estate included in continuing operations were $2.3 million for the year ended December 31, 2015, as compared to $1.2 million for the year ended December 31, 2014. The gains were the result of the sale of 70 properties during the year ended December 31, 2015 and four properties during the year ended December 31, 2014, which did not previously meet the criteria to be held for sale. In addition, we recorded deferred gains of approximately $3.9 million related to the Ramoco sale at December 31, 2015. The deferred gain is recorded in accounts payable and accrued liabilities on our balance sheet at December 31, 2015.
Other income included in earnings from continuing operations was, $18.3 million for the year ended December 31, 2015, as compared to $0.1 million for the year ended December 31, 2014. During the year ended December 31, 2015, we received distributions from the Marketing Estate of approximately $18.2 million.
Interest expense was $14.5 million for the year ended December 31, 2015, as compared to $9.8 million for the year ended December 31, 2014. The increase was due to higher average borrowings outstanding and the incurrence of new indebtedness required to fund the United Oil Transaction.
We reported as discontinued operations the results of five properties accounted for as held for sale in accordance with GAAP as of December 31, 2015 and certain properties disposed of during the periods presented that were previously classified as held for sale. The operating results of such properties for the years ended December 31, 2014 and 2013 have also been reclassified to discontinued operations to conform to the 2015 presentation. Earnings from discontinued operations decreased by $6.0 million to a loss of $3.0 million for the year ended December 31, 2015, as compared to earnings of $3.0 million for the year ended December 31, 2014. The decrease in earnings was primarily due to lower gains on dispositions of real estate offset by a decrease in loss from operating activities in discontinued operations. Gains on dispositions of real estate included in discontinued operations were $0.3 million for the year ended December 31, 2015 and $9.0 million for the year ended December 31, 2014. For the year ended December 31, 2015, there were 14 property dispositions recorded in discontinued operations. For the year ended December 31, 2014, there were 89 property dispositions recorded in discontinued operations. The non-cash impairment charges recorded in discontinued operations during the years ended December 31, 2015 and 2014 of $5.8 million and $8.6 million, respectively, were attributable to reductions in our estimates of value for properties held for sale and the accumulation of asset retirement costs due to changes in estimates associated with our estimated environmental liabilities which increased the carrying value of certain properties above their fair value. Gains on disposition of real estate and impairment charges vary from period to period and, accordingly, undue reliance should not be placed on the magnitude or the directions of change in reported gains and impairment charges for one period, as compared to prior periods.
For the year ended December 31, 2015, FFO increased by $23.8 million to $69.1 million, as compared to $45.3 million for the year ended December 31, 2014, and AFFO increased by $22.6 million to $65.2 million, as compared to $42.6 million for the prior year. The increase in FFO for the year ended December 31, 2015 was primarily due to the changes in net earnings but excludes a $4.1 million decrease in impairment charges, a $6.5 million increase in depreciation and amortization expense and a $7.6 million decrease in gains on dispositions of real estate. The increase in AFFO for the year ended December 31, 2015 also excludes a $2.4 million decrease in the allowance for deferred rental revenue and mortgage receivable, a $0.1 million decrease in non-cash environmental expenses and credits, a $0.3 million increase in acquisition costs and a $0.9 million decrease in Rental Revenue Adjustments which cause our reported revenues from rental properties to vary from the amount of rent payments contractually due or received by us during the periods presented (which are included in net earnings and FFO but are excluded from AFFO). In addition, FFO and AFFO includes the effect of $18.2 million of other income recorded in 2015 received form the Marketing Estate.
Basic and diluted earnings per share were $1.11 per share for the year ended December 31, 2015, as compared to $0.69 per share for the year ended December 31, 2014. Basic and diluted FFO per share for the year ended December 31, 2015 was $2.04 per share, as compared to $1.34 per share for the year ended December 31, 2014. Basic and diluted AFFO per share for the year ended December 31, 2015 was $1.93 per share, as compared to $1.26 per share for the year ended December 31, 2014.
32
Table of Contents
Year ended December 31, 2014 compared to year ended December 31, 2013
Total revenues included in continuing operations decreased by $2.9 million to $99.9 million for the year ended December 31, 2014, as compared to $102.8 million for the year ended December 31, 2013. The decrease in total revenues for the year ended December 31, 2014 was primarily due to the impact of $3.1 million of other revenue received during the year ended 2013 and a decrease in Revenue Recognition Adjustments. The decline was partially offset by increases in rental revenues from our existing portfolio of rental properties, including our 2014 acquisitions and leasing activities and the full year impact of rental revenues from our acquisition of 36 properties from Capitol Petroleum Group, LLC in May 2013. Revenues from rental properties included in continuing operations were $96.8 million and $96.3 million for the years ended December 31, 2014 and 2013, respectively. Rental income contractually due or received from our tenants included in revenues from rental properties in continuing operations was $77.7 million for the year ended December 31, 2014, as compared to $73.0 million for the year ended December 31, 2013. Revenues from rental properties and property costs included $13.8 million and $15.4 million for the years ended December 31, 2014 and 2013, respectively, of “pass-through” real estate taxes and other municipal charges paid by us and reimbursable by our tenants pursuant to their triple-net lease agreements. Interest income on notes and mortgages receivable was $3.1 million for the year ended December 31, 2014, as compared to $3.4 million for the year ended December 31, 2013. Total revenue from continuing operations for the year ended December 31, 2013 also includes $3.1 million of other revenue from Marketing Estate, which was received as a result of the Lukoil Settlement.
In accordance with GAAP, we recognize revenues from rental properties in amounts which vary from the amount of rent contractually due or received during the periods presented. As a result, revenues from rental properties include Revenue Recognition Adjustments comprised of non-cash adjustments recorded for deferred rental revenue due to the recognition of rental income on a straight-line basis over the current lease term, the net amortization of above-market and below-market leases, recognition of rental income under direct financing leases using the effective interest rate method which produces a constant periodic rate of return on the net investments in the leased properties and the amortization of deferred lease incentives. Revenues from rental properties included in continuing operations includes Revenue Recognition Adjustments which increased rental revenue by $5.3 million for the year ended December 31, 2014 and $7.9 million for the year ended December 31, 2013.
Property costs included in continuing operations, which are primarily comprised of rent expense, real estate and other state and local taxes and maintenance expense, were $23.8 million for the year ended December 31, 2014, as compared to $29.4 million for the year ended December 31, 2013. The decrease in property costs is principally due to declines in rent expense, real estate taxes and maintenance expenses paid by us resulting from the cumulative effect of leasing an increasing number of properties on a triple-net basis and our disposition efforts.
Non-cash impairment charges included in continuing operations were $12.9 million for the year ended December 31, 2014, as compared to $3.7 million for the year ended December 31, 2013. Impairment charges are recorded when the carrying value of a property is reduced to fair value. The non-cash impairment charges in continuing operations for the years ended December 31, 2014 and 2013 were primarily attributable to the effect of adding asset retirement costs due to changes in estimates associated with our environmental liabilities, which increased the carrying value of certain properties in excess of their fair value, and reductions in estimated undiscounted cash flows expected to be received during the assumed holding period for certain of our properties.
Environmental expenses included in continuing operations for the year ended December 31, 2014 decreased by $7.5 million to $4.6 million, as compared to $12.1 million for the year ended December 31, 2013. The decrease in environmental expenses for the year ended December 31, 2014 was principally due to an $8.5 million reduction in litigation losses and legal fees partially offset by $1.0 million of increases in environmental remediation costs. Environmental expenses vary from period to period and, accordingly, undue reliance should not be placed on the magnitude or the direction of change in reported environmental expenses for one period, as compared to prior periods.
General and administrative expenses included in continuing operations decreased by $4.6 million to $15.8 million for the year ended December 31, 2014, as compared to $20.4 million for the year ended December 31, 2013. The decrease in general and administrative expenses for the year ended December 31, 2014 was principally due to a $4.3 million decline in legal and professional fees. The decrease in legal and professional fees was primarily due to reductions in costs incurred in connection with Marketing’s bankruptcy and the Lukoil Settlement.
Allowance (recoveries) for uncollectible accounts included in continuing operations increased by $14.4 million to $3.4 million for the year ended December 31, 2014, as compared to a recovery of $11.0 million for the year ended December 31, 2013. The allowances for the year ended December 31, 2014 consisted of $2.1 million in allowances for deferred rent receivable related to the NECG Lease and Ramoco Lease, $1.2 million in reserves for bad debts and $0.1 million in allowances for mortgage receivables. The recoveries to allowances for the year ended December 31, 2013 were primarily related to reversals of previously provided bad debt reserves associated with receiving funds from the Marketing Estate and the Lukoil Settlement.
33
Table of Contents
Depreciation and amortization expense included in continuing operations was $10.5 million for the year ended December 31, 2014, as compared to $9.3 million for the year ended December 31, 2013. The increase was primarily due to depreciation charges related to asset retirement costs and properties acquired offset by the effect of certain assets becoming fully depreciated, lease terminations and dispositions of real estate.
Gains on dispositions of real estate included in continuing operations were $1.2 million for the year ended December 31, 2014. The gains were the result of the sale of four properties during the year ended December 31, 2014.
Interest expense was $9.8 million for the year ended December 31, 2014, as compared to $11.7 million for the year ended December 31, 2013. The decrease was due to a decrease in the weighted-average interest rate on borrowings outstanding and lower average borrowings outstanding for the year ended December 31, 2014, as compared to the year ended December 31, 2013.
We reported as discontinued operations the results of 20 properties accounted for as held for sale in accordance with GAAP as of December 31, 2014 and certain properties disposed of during the periods presented that were previously classified as held for sale. The operating results and gains on dispositions of real estate sold during the first six months of 2014 have been classified as discontinued operations. The operating results of such properties for the years ended December 31, 2014 and 2013 have also been reclassified to discontinued operations to conform to the 2015 presentation. Earnings from discontinued operations decreased by $39.6 million to $3.0 million for the year ended December 31, 2014, as compared to $42.6 million for the year ended December 31, 2013. The decrease was primarily due to lower gains on dispositions of real estate and an increase in loss from operating activities in discontinued operations. Gains on dispositions of real estate included in discontinued operations were $9.0 million for the year ended December 31, 2014 and $45.5 million for the year ended December 31, 2013. For the year ended December 31, 2014, there were 89 property dispositions recorded in discontinued operations. For the year ended December 31, 2013, there were 145 property dispositions recorded in discontinued operations. The non-cash impairment charges recorded in discontinued operations during the years ended December 31, 2014 and 2013 of $8.6 million and $9.7 million, respectively, were attributable to reductions in our estimates of value for properties held for sale and the accumulation of asset retirement costs due to changes in estimates associated with our environmental liabilities which increased the carrying value of certain properties above their fair value. Gains on disposition of real estate and impairment charges vary from period to period and, accordingly, undue reliance should not be placed on the magnitude or the directions of change in reported gains and impairment charges for one period, as compared to prior periods.
For the year ended December 31, 2014, FFO decreased by $2.6 million to $45.3 million, as compared to $47.9 million for the year ended December 31, 2013, and AFFO decreased by $2.4 million to $42.6 million, as compared to $45.0 million for the prior year. The decrease in FFO for the year ended December 31, 2014 was primarily due to the changes in net earnings but excludes an $8.1 million increase in impairment charges, a $0.6 million increase in depreciation and amortization expense and a $35.3 million decrease in gains on dispositions of real estate. The decrease in AFFO for the year ended December 31, 2014 also excludes a $2.6 million decrease in the allowance for deferred rental revenue, a $32 thousand increase in non-cash environmental expenses and credits, a $0.4 million decrease in acquisition costs and a $3.0 million decrease in Rental Revenue Adjustments which cause our reported revenues from rental properties to vary from the amount of rent payments contractually due or received by us during the periods presented (which are included in net earnings and FFO but are excluded from AFFO).
Basic and diluted earnings per share were $0.69 per share for the year ended December 31, 2014, as compared to $2.08 per share for the year ended December 31, 2013. Basic and diluted FFO per share for the year ended December 31, 2014 was $1.34 per share, as compared to $1.43 per share for the year ended December 31, 2013. Basic and diluted AFFO per share for the year ended December 31, 2014 was $1.26 per share, as compared to $1.34 per share for the year ended December 31, 2013.
LIQUIDITY AND CAPITAL RESOURCES
Our principal sources of liquidity are the cash flows from our operations, funds available under our Credit Agreement that matures in June 2018 (described below) and available cash and cash equivalents. Our business operations and liquidity are dependent on our ability to generate cash flow from our properties. We believe that our operating cash needs for the next twelve months can be met by cash flows from operations, borrowings under our Credit Agreement and available cash and cash equivalents.
Our cash flow activities for the years ended December 31, 2015, 2014 and 2013 are summarized as follows (in thousands):
| YEAR ENDED DECEMBER 31, | ||||||||||||
| 2015 | 2014 | 2013 | ||||||||||
| Net cash flow provided by operating activities |
$ | 49,688 | $ | 29,237 | $ | 43,678 | ||||||
| Net cash flow (used in)/provided by investing activities |
$ | (204,724 | ) | $ | 23,505 | $ | (6,847 | ) | ||||
| Net cash flow provided by/(used in) financing activities |
$ | 155,867 | $ | (61,666 | ) | $ | (41,672 | ) | ||||
34
Table of Contents
Operating Activities
Net cash flow from operating activities increased by $20.5 million for the year ended December 31, 2015 to $49.7 million, as compared to $29.2 million for the year ended December 31, 2014. The increase in net cash flow from operating activities for the year ended December 31, 2015 is primarily the result of the United Oil Transaction and the receipt of approximately $18.2 million from the Marketing Estate. Net cash provided by operating activities represents cash received primarily from rental income and interest income less cash used for property costs, environmental expenses and general and administrative expenses. The change in net cash flow provided by operating activities for the years ended December 31, 2015, 2014 and 2013, is primarily the result of changes in revenues and expenses as discussed in “Results of Operations.” The net cash flow provided by operating activities is expected to fluctuate in the future.
Investing Activities
Our investing activities are primarily real estate-related transactions. Since we generally lease our properties on a triple-net basis, we have not historically incurred significant capital expenditures other than those related to investments in real estate. Net cash flow used in our investing activities increased by $228.2 million for the year ended December 31, 2015 to a use of $204.7 million, as compared to net cash flow provided by our investing activities of $23.5 million for the year ended December 31, 2014. The decrease in net cash flow available to us for the year ended December 31, 2015 was primarily due to the property acquisitions we made during the year of $202.3 million, a decrease in cash held for property acquisitions of $13.4 million and a decrease in proceeds from the sale of rental properties of $13.1 million.
Financing Activities
Net cash flow from financing activities increased by $217.6 million for the year ended December 31, 2015 to $155.9 million, as compared to a use of $61.7 million for the year ended December 31, 2014. The increase in net cash flow from financing activities was primarily due to net borrowings under the Credit Agreement, the Restated Prudential Note Purchase Agreement and the prior credit agreement of $194.0 million for the year ended December 31, 2015, as compared to net repayments of the prior credit agreement of $33.0 million for the year ended December 31, 2014 offset by an increase in dividends paid on common stock of $6.5 million and an increase in loan origination costs of $2.4 million.
Debt Refinancing
As of December 31, 2014, we were a party to a $175.0 million senior secured revolving credit agreement with a group of commercial banks led by JPMorgan Chase Bank, N.A. which was scheduled to mature in August 2015. As of December 31, 2014, borrowings under the credit agreement were $25.0 million bearing interest at a rate of approximately 2.7%. On June 2, 2015, the borrowings then outstanding under such credit agreement were repaid with proceeds of the Credit Agreement (as defined below) and the prior credit agreement was terminated. In addition, as a result of entering into the Credit Agreement, mortgage liens and other security interests on certain of our properties and assets held by the prior bank group under our prior credit agreement were released.
Credit Agreement
On June 2, 2015, we entered into a $225.0 million senior unsecured credit agreement (the “Credit Agreement”) with a group of banks led by Bank of America, N.A. (the “Bank Syndicate”). The Credit Agreement consists of a $175.0 million revolving facility (the “Revolving Facility”), which is scheduled to mature in June 2018 and a $50.0 million term loan (the “Term Loan”), which is scheduled to mature in June 2020. Subject to the terms of the Credit Agreement and our continued compliance with its provisions, we have the option to (a) extend the term of the Revolving Facility for one additional year to June 2019 and (b) increase by $75.0 million the amount of the Revolving Facility to $250.0 million.
The Credit Agreement incurs interest and fees at various rates based on our net debt to EBITDA ratio (as defined in the Credit Agreement) at the end of each quarterly reporting period. The Revolving Facility permits borrowings at an interest rate equal to the sum of a base rate plus a margin of 0.95% to 2.25% or a LIBOR rate plus a margin of 1.95% to 3.25%. The annual commitment fee on the undrawn funds under the Revolving Facility is 0.25% to 0.30%. The Term Loan bears interest at a rate equal to the sum of a base rate plus a margin of 0.90% to 2.20% or a LIBOR rate plus a margin of 1.90% to 3.20%. The Credit Agreement does not provide for scheduled reductions in the principal balance prior to its maturity. As of December 31, 2015, borrowings under the Revolving Facility were $94.0 million and borrowings under the Term Loan were $50.0 million and, as of December 31, 2014, borrowings under our prior credit agreement were $25.0 million, respectively.
The Credit Agreement contains customary financial covenants such as availability, leverage and coverage ratios and minimum tangible net worth, as well as limitations on restricted payments, which may limit our ability to incur additional debt or pay dividends. The Credit Agreement contains customary events of default, including cross default provisions under the Restated Prudential Note Purchase Agreement (as defined below), change of control and failure to maintain REIT status. Any event of default, if not cured or waived in a timely manner, would increase by 200 basis points (2.00%) the interest rate we pay under the Credit Agreement and prohibit us from drawing funds against the Credit Agreement and could result in the acceleration of our indebtedness under the Credit Agreement and could also give rise to an event of default and could result in the acceleration of our indebtedness under the Restated Prudential Note Purchase Agreement. We may be prohibited from drawing funds against the Revolving Facility if there is a material adverse effect on our business, assets, prospects or condition.
35
Table of Contents
Senior Unsecured Notes
On June 2, 2015, we entered into an amended and restated note purchase agreement (the “Restated Prudential Note Purchase Agreement”) amending and restating our existing senior secured note purchase agreement with The Prudential Insurance Company of America (“Prudential”) and an affiliate of Prudential. Pursuant to the Restated Prudential Note Purchase Agreement, Prudential and its affiliate released the mortgage liens and other security interests held by Prudential and its affiliate on certain of our properties and assets, redenominated the existing notes in the aggregate amount of $100.0 million issued under the existing note purchase agreement as senior unsecured Series A Notes, and issued $75.0 million of senior unsecured Series B Notes bearing interest at 5.35% and maturing in June 2023 to Prudential and certain affiliates of Prudential. The Series A Notes continue to bear interest at 6.0% and mature in February 2021. The Restated Prudential Note Purchase Agreement does not provide for scheduled reductions in the principal balance of either the Series A Notes or the Series B Notes prior to their respective maturities. As of December 31, 2015, borrowings under the Restated Prudential Note Purchase Agreement were $175.0 million and, as of December 31, 2014, borrowings under the prior senior secured note purchase agreement were $100.0 million.
The Restated Prudential Note Purchase Agreement contains customary financial covenants such as leverage and coverage ratios and minimum tangible net worth, as well as limitations on restricted payments, which may limit our ability to incur additional debt or pay dividends. The Restated Prudential Note Purchase Agreement contains customary events of default, including default under the Credit Agreement and failure to maintain REIT status. Any event of default, if not cured or waived, would increase by 200 basis points (2.00%) the interest rate we pay under the Restated Prudential Note Purchase Agreement and could result in the acceleration of our indebtedness under the Restated Prudential Note Purchase Agreement and could also give rise to an event of default and could result in the acceleration of our indebtedness under our Credit Agreement.
As of December 31, 2015, we are in compliance with all of the material terms of the Credit Agreement and Restated Prudential Note Purchase Agreement, including the various financial covenants described above.
As of December 31, 2015, the maturity date and amounts outstanding under the Credit Agreement and the Restated Prudential Note Purchase Agreement are as follows:
| Maturity Date | Amount | |||||||
| Credit Agreement - Revolving Facility |
June 2018 | $ | 94.0 million | |||||
| Credit Agreement - Term Loan |
June 2020 | $ | 50.0 million | |||||
| Restated Prudential Note Purchase Agreement - Series A Note |
February 2021 | $ | 100.0 million | |||||
| Restated Prudential Note Purchase Agreement - Series B Note |
June 2023 | $ | 75.0 million | |||||
Property Acquisitions and Capital Expenditures
Since we generally lease our properties on a triple-net basis, we have not historically incurred significant capital expenditures other than those related to acquisitions. We are reviewing select opportunities for capital expenditures, redevelopment and alternative uses for properties that were previously subject to the Master Lease with Marketing and which are not currently subject to long-term triple-net leases. We are also seeking to recapture select properties from our net lease portfolio to redevelop such properties for alternative uses. In addition, our tenants frequently make improvements to the properties leased from us at their expense. As of December 31, 2015, we have a remaining commitment to fund as much as $11.9 million in the aggregate in capital improvements in certain properties previously subject to the Master Lease with Marketing.
As part of our overall business strategy, we regularly review opportunities to acquire additional properties and we expect to continue to pursue acquisitions that we believe will benefit our financial performance. Our property acquisitions and capital expenditures for the year ended December 31, 2015 were $219.5 million, substantially all of which was for the United Oil Transaction. In addition, for the year ended December 31, 2015, we incurred $1.0 million of construction-in-progress cost related to our redevelopment activities. Our property acquisitions and capital expenditures for the year ended December 31, 2014 were $17.7 million, substantially all of which was for the acquisition of ten properties. To the extent that our sources of liquidity are not sufficient to fund acquisitions and capital expenditures, we will require other sources of capital, which may or may not be available on favorable terms or at all.
36
Table of Contents
Dividends
We elected to be treated as a REIT under the federal income tax laws with the year beginning January 1, 2001. To qualify for taxation as a REIT, we must, among other requirements such as those related to the composition of our assets and gross income, distribute annually to our stockholders at least 90% of our taxable income, including taxable income that is accrued by us without a corresponding receipt of cash. We cannot provide any assurance that our cash flows will permit us to continue paying cash dividends.
The Internal Revenue Service (“IRS”) has allowed the use of a procedure, as a result of which we could satisfy the REIT income distribution requirement by making a distribution on our common stock comprised of (i) shares of our common stock having a value of up to 80% of the total distribution and (ii) cash in the remaining amount of the total distribution, in lieu of paying the distribution entirely in cash. In January 2015, we received a private letter ruling from the IRS that allows us to use such a procedure.
It is also possible that instead of distributing 100% of our taxable income on an annual basis, we may decide to retain a portion of our taxable income and to pay taxes on such amounts as permitted by the IRS. Payment of dividends is subject to market conditions, our financial condition, including but not limited to, our continued compliance with the provisions of the Credit Agreement and the Restated Prudential Note Purchase Agreement and other factors, and therefore is not assured. In particular, our Credit Agreement and Restated Prudential Note Purchase Agreement prohibit the payment of dividends during certain events of default. Cash dividends paid to our shareholders aggregated $35.2 million, $28.7 million and $24.4 million, for the years ended December 31, 2015, 2014 and 2013, respectively. There can be no assurance that we will continue to pay cash dividends at historical rates.
CONTRACTUAL OBLIGATIONS
Our significant contractual obligations and commitments as of December 31, 2015 were comprised of borrowings under the Credit Agreement and the Restated Prudential Note Purchase Agreement, operating lease payments due to landlords, estimated environmental remediation expenditures and our funding commitments for capital improvements at certain properties which were previously leased to Marketing. The aggregate maturity of the Credit Agreement and the Restated Prudential Note Purchase Agreement is as follows: 2018 — $94.0 million, 2020 — $50.0 million, 2021 — $100.0 million and 2023 — $75.0 million.
In addition, as a REIT, we are required to pay dividends equal to at least 90% of our taxable income in order to continue to qualify as a REIT. Our contractual obligations and commitments as of December 31, 2015 are summarized below (in thousands):
| TOTAL | LESS THAN- ONE YEAR |
ONE-TO THREE YEARS |
THREE TO FIVE YEARS |
MORE THAN FIVE YEARS |
||||||||||||||||
| Operating leases |
$ | 26,469 | $ | 6,219 | $ | 9,103 | $ | 4,899 | $ | 6,248 | ||||||||||
| Credit Agreement (a) |
144,000 | — | 94,000 | 50,000 | — | |||||||||||||||
| Restated Prudential Note Purchase Agreement (a) |
175,000 | — | — | — | 175,000 | |||||||||||||||
| Estimated environmental remediation expenditures (b) |
84,345 | 16,840 | 28,962 | 14,365 | 24,178 | |||||||||||||||
| Capital improvements (c) |
11,916 | — | 11,916 | — | — | |||||||||||||||
|
|
|
|
|
|
|
|
|
|
|
|||||||||||
| Total |
$ | 441,730 | $ | 23,059 | $ | 143,981 | $ | 69,264 | $ | 205,426 | ||||||||||
|
|
|
|
|
|
|
|
|
|
|
|||||||||||
| (a) | Excludes related interest payments. See “Liquidity and Capital Resources” above and “Item 7A. Quantitative and Qualitative Disclosures About Market Risk” for additional information. |
| (b) | Estimated environmental remediation expenditures have been adjusted for inflation and discounted to present value. |
| (c) | The actual timing of funding of capital improvements is dependent on the timing of such capital improvement projects and the terms of our leases. We expect that substantially all of such expenditures will be incurred within five years. Our commitment provides us with the option to either reimburse our tenants, or to offset rent when these capital expenditures are made. |
Generally, leases with our tenants are “triple-net” leases, with the tenant responsible for the operations conducted at these properties and for the payment of taxes, maintenance, repair, insurance, environmental remediation and other operating expenses.
We have no significant contractual obligations not fully recorded on our consolidated balance sheets or fully disclosed in the notes to our consolidated financial statements. We have no off-balance sheet arrangements as defined in Item 303(a)(4)(ii) of Regulation S-K promulgated by the Exchange Act.
37
Table of Contents
CRITICAL ACCOUNTING POLICIES AND ESTIMATES
The consolidated financial statements included in this Annual Report on Form 10-K have been prepared in conformity with accounting principles generally accepted in the United States of America. The preparation of consolidated financial statements in accordance with GAAP requires us to make estimates, judgments and assumptions that affect the amounts reported in our consolidated financial statements. Although we have made estimates, judgments and assumptions regarding future uncertainties relating to the information included in our consolidated financial statements, giving due consideration to the accounting policies selected and materiality, actual results could differ from these estimates, judgments and assumptions and such differences could be material.
Estimates, judgments and assumptions underlying the accompanying consolidated financial statements include, but are not limited to, receivables, deferred rent receivable, income under direct financing leases, environmental remediation obligations, real estate, depreciation and amortization, impairment of long-lived assets, litigation, accrued liabilities, income taxes and allocation of the purchase price of properties acquired to the assets acquired and liabilities assumed. The information included in our consolidated financial statements that is based on estimates, judgments and assumptions is subject to significant change and is adjusted as circumstances change and as the uncertainties become more clearly defined.
Our accounting policies are described in Note 1 in “Item 8. Financial Statements and Supplementary Data — Notes to Consolidated Financial Statements”. We believe that the more critical of our accounting policies relate to revenue recognition and deferred rent receivable and related reserves, direct financing leases, impairment of long-lived assets, income taxes, environmental remediation obligations, allocation of the purchase price of properties acquired to the assets acquired and liabilities assumed and litigation as described below:
Revenue recognition — We earn revenue primarily from operating leases with our tenants. We recognize income under leases with our tenants, on the straight-line method, which effectively recognizes contractual lease payments evenly over the current term of the leases. The present value of the difference between the fair market rent and the contractual rent for in-place leases at the time properties are acquired is amortized into revenue from rental properties over the remaining lives of the in-place leases. A critical assumption in applying the straight-line accounting method is that the tenant will make all contractual lease payments during the current lease term and that the net deferred rent receivable balance of $25.5 million recorded as of December 31, 2015 will be collected when the payment is due, in accordance with the annual rent escalations provided for in the leases. We may be required to reverse, or provide reserves for a portion of the recorded deferred rent receivable if it becomes apparent that the tenant may not make all of its contractual lease payments when due during the current term of the lease.
Direct financing leases — Income under direct financing leases is included in revenues from rental properties and is recognized over the lease terms using the effective interest rate method which produces a constant periodic rate of return on the net investments in the leased properties. Net investment in direct financing leases represents the investments in leased assets accounted for as direct financing leases. The investments are reduced by the receipt of lease payments, net of interest income earned and amortized over the life of the leases.
Impairment of long-lived assets — Real estate assets represent “long-lived” assets for accounting purposes. We review the recorded value of long-lived assets for impairment in value whenever any events or changes in circumstances indicate that the carrying amount of the assets may not be recoverable. We may become aware of indicators of potentially impaired assets upon tenant or landlord lease renewals, upon receipt of notices of potential governmental takings and zoning issues, or upon other events that occur in the normal course of business that would cause us to review the operating results of the property. We believe our real estate assets are not carried at amounts in excess of their estimated net realizable fair value amounts.
Income taxes — Our financial results generally do not reflect provisions for current or deferred federal income taxes since we elected to be treated as a REIT under the federal income tax laws effective January 1, 2001. Our intention is to operate in a manner that will allow us to continue to be treated as a REIT and, as a result, we do not expect to pay substantial corporate-level federal income taxes. Many of the REIT requirements; however, are highly technical and complex. If we were to fail to meet the requirements, we may be subject to federal income tax, excise taxes, penalties and interest or we may have to pay a deficiency dividend to eliminate any earnings and profits that were not distributed. Certain states do not follow the federal REIT rules and we have included provisions for these taxes in property costs.
Environmental remediation obligations — We provide for the estimated fair value of future environmental remediation obligations when it is probable that a liability has been incurred and a reasonable estimate of fair value can be made. See “Environmental Matters” below for additional information. Environmental liabilities net of related recoveries are measured based on their expected future cash flows which have been adjusted for inflation and discounted to present value. Since environmental exposures are difficult to assess and estimate and knowledge about these liabilities is not known upon the occurrence of a single event, but rather is gained over a continuum of events, we believe that it is appropriate that our accrual estimates are adjusted as the remediation treatment progresses, as circumstances change and as environmental contingencies become more clearly defined and reasonably estimable. A critical assumption in accruing for these liabilities is that the state environmental laws and regulations will be administered and enforced in the future in a manner that is consistent with past practices. Environmental liabilities are estimated net of recoveries of environmental costs from state UST remediation funds, with respect to past and future spending based on estimated
38
Table of Contents
recovery rates developed from our experience with the funds when such recoveries are considered probable. A critical assumption in accruing for these recoveries is that the state UST fund programs will be administered and funded in the future in a manner that is consistent with past practices and that future environmental spending will be eligible for reimbursement at historical rates under these programs. We accrue environmental liabilities based on our share of responsibility as defined in our lease contracts with our tenants and under various other agreements with others or if circumstances indicate that our counterparty may not have the financial resources to pay its share of the costs. It is possible that our assumptions regarding the ultimate allocation method and share of responsibility that we used to allocate environmental liabilities may change, which may result in material adjustments to the amounts recorded for environmental litigation accruals and environmental remediation liabilities. We may ultimately be responsible to pay for environmental liabilities as the property owner if our tenants or other counterparties fail to pay them. In certain environmental matters the effect on future financial results is not subject to reasonable estimation because considerable uncertainty exists both in terms of the probability of loss and the estimate of such loss. The ultimate liabilities resulting from such lawsuits and claims, if any, may be material to our results of operations in the period in which they are recognized.
Allocation of the purchase price of properties acquired — Upon acquisition of real estate and leasehold interests, we estimate the fair value of acquired tangible assets (consisting of land, buildings and improvements) “as if vacant” and identified intangible assets and liabilities (consisting of leasehold interests, above-market and below-market leases, in-place leases and tenant relationships) and assumed debt. Based on these estimates, we allocate the purchase price to the applicable assets and liabilities.
Litigation — Legal fees related to litigation are expensed as legal services are performed. We provide for litigation reserves, including certain environmental litigation (see “Environmental Matters” below for additional information), when it is probable that a liability has been incurred and a reasonable estimate of the liability can be made. If the estimate of the liability can only be identified as a range, and no amount within the range is a better estimate than any other amount, the minimum of the range is accrued for the liability.
ENVIRONMENTAL MATTERS
General
We are subject to numerous federal, state and local laws and regulations, including matters relating to the protection of the environment such as the remediation of known contamination and the retirement and decommissioning or removal of long-lived assets including buildings containing hazardous materials, USTs and other equipment. Environmental costs are principally attributable to remediation costs which include removing USTs, excavation of contaminated soil and water, installing, operating, maintaining and decommissioning remediation systems, monitoring contamination and governmental agency compliance reporting incurred in connection with contaminated properties. We seek reimbursement from state UST remediation funds related to these environmental costs where available. In July 2012, we purchased a ten-year pollution legal liability insurance policy covering all of our properties for preexisting unknown environmental liabilities and new environmental events. The policy has a $50.0 million aggregate limit and is subject to various self-insured retentions and other conditions and limitations. Our intention in purchasing this policy is to obtain protection predominantly for significant events. No assurances can be given that we will obtain a net financial benefit from this investment.
The estimated future costs for known environmental remediation requirements are accrued when it is probable that a liability has been incurred and a reasonable estimate of fair value can be made. The accrued liability is the aggregate of the best estimate of the fair value of cost for each component of the liability net of estimated recoveries from state UST remediation funds considering estimated recovery rates developed from prior experience with the funds.
We enter into leases and various other agreements which contractually allocate responsibility between the parties for known and unknown environmental liabilities at or relating to the subject properties. We are contingently liable for these environmental obligations in the event that our counterparty to the lease or other agreement does not satisfy them. It is possible that our assumptions regarding the ultimate allocation method and share of responsibility that we used to allocate environmental liabilities may change, which may result in material adjustments to the amounts recorded for environmental litigation accruals and environmental remediation liabilities. We are required to accrue for environmental liabilities that we believe are allocable to others under leases and other agreements if we determine that it is probable that our counterparty will not meet its environmental obligations. We may ultimately be responsible to pay for environmental liabilities as the property owner if our counterparty fails to pay them. We assess whether to accrue for environmental liabilities based upon relevant factors including our tenants’ histories of paying for such obligations, our assessment of their financial ability, and their intent to pay for such obligations. However, there can be no assurance that our assessments are correct or that our tenants who have paid their obligations in the past will continue to do so. The ultimate resolution of these matters could cause a material adverse effect on our business, financial condition, results of operations, liquidity, ability to pay dividends or stock price.
39
Table of Contents
For all of our triple-net leases, our tenants are contractually responsible for compliance with environmental laws and regulations, removal of USTs at the end of their lease term and remediation of any environmental contamination that arises during the term of their tenancy. Under the terms of our leases covering properties previously leased to Marketing (substantially all of which commenced in 2012), we have agreed to be responsible for environmental contamination at the premises that was known at the time the lease commenced, and which existed prior to commencement of the lease and is discovered (other than as a result of a voluntary site investigation) during the first ten years of the lease term (or a shorter period for a minority of such leases). After expiration of such ten year (or, in certain cases, shorter) period, responsibility for all newly discovered contamination, even if it relates to periods prior to commencement of the lease, is contractually allocated to our tenant. Our tenants at properties previously leased to Marketing are in all cases responsible for the cost of any remediation of contamination that results from their use and occupancy of our properties. Under substantially all of our other triple-net leases, responsibility for remediation of all environmental contamination discovered during the term of the lease (including known and unknown contamination that existed prior to commencement of the lease) is the responsibility of our tenant.
We anticipate that a majority of the USTs at properties previously leased to Marketing will be replaced over the next decade because these USTs are either at or near the end of their useful lives. For long-term, triple-net leases covering sites previously leased to Marketing, our tenants are responsible for the cost of removal and replacement of USTs and for remediation of contamination found during such UST removal and replacement, unless such contamination was found during the first ten years of the lease term and also existed prior to commencement of the lease. In those cases, we are responsible for costs associated with the remediation of such contamination. For our transitional properties occupied under month-to-month license agreements, or which are vacant, we are responsible for costs associated with UST removals and for the cost of remediation of contamination found during the removal of USTs. We have also agreed to be responsible for environmental contamination that existed prior to the sale of certain properties assuming the contamination is discovered (other than as a result of a voluntary site investigation) during the first five years after the sale of the properties. For additional information regarding our transitional properties, see “Item 1. Business — Company Operations” and “Transitional Properties” in “Item 7. Management’s Discussion and Analysis of Financial Condition and Results of Operations” which appear in this Annual Report on Form 10-K.
After the termination of the Master Lease, we commenced a process to take control of our properties and to reposition them. A substantial portion of these properties had USTs which were either at or near the end of their useful lives. For properties that we sold, we elected to remove certain of these USTs and in the course of re-leasing properties, we made lease concessions to reimburse our tenants at operating gasoline stations for certain capital expenditures including UST replacements. In the course of these UST removals and replacements, previously unknown environmental contamination has been and continues to be discovered. As a result of these developments, we began to assess our prospective future environmental liability resulting from preexisting unknown environmental contamination which we believe may be discovered during removal and replacement of USTs at properties previously leased to Marketing in the future.
We have developed a reasonable estimate of fair value for the prospective future environmental liability resulting from preexisting unknown environmental contamination and accrued for these estimated costs. These estimates are based primarily upon quantifiable trends, which we believe allow us to make reasonable estimates of fair value for the future costs of environmental remediation resulting from the removal and replacement of USTs. Our accrual of the additional liability represents the best estimate of the fair value of cost for each component of the liability net of estimated recoveries from state UST remediation funds considering estimated recovery rates developed from prior experience with the funds. In arriving at our accrual, we analyzed the ages of USTs at properties where we would be responsible for preexisting contamination found within ten years after commencement of a lease (for properties subject to long-term triple-net leases) or five years from a sale (for divested properties), and projected a cost to closure for new environmental contamination. Based on these estimates, along with relevant economic and risk factors, at December 31, 2015 and 2014, we have accrued $45.4 million and $49.7 million, respectively, for these future environmental liabilities related to preexisting unknown contamination. Our estimates are based upon facts that are known to us at this time and an assessment of the possible ultimate remedial action outcomes. It is possible that our assumptions, which form the basis of our estimates, regarding our ultimate environmental liabilities may change, which may result in our providing an accrual, or adjustments to the amounts recorded, for environmental remediation liabilities. Among the many uncertainties that impact the estimates are our assumptions, the necessary regulatory approvals for, and potential modifications of remediation plans, the amount of data available upon initial assessment of contamination, changes in costs associated with environmental remediation services and equipment, the availability of state UST remediation funds and the possibility of existing legal claims giving rise to additional claims. Additional environmental liabilities could cause a material adverse effect on our business, financial condition, results of operations, liquidity, ability to pay dividends or stock price.
Environmental exposures are difficult to assess and estimate for numerous reasons, including the extent of contamination, alternative treatment methods that may be applied, location of the property which subjects it to differing local laws and regulations and their interpretations, as well as the time it takes to remediate contamination and receive regulatory approval. In developing our liability for estimated environmental remediation obligations on a property by property basis, we consider among other things, enacted laws and regulations, assessments of contamination and surrounding geology, quality of information available, currently available technologies for treatment, alternative methods of remediation and prior experience. Environmental accruals are based on estimates
40
Table of Contents
which are subject to significant change, and are adjusted as the remediation treatment progresses, as circumstances change and as environmental contingencies become more clearly defined and reasonably estimable. We expect to adjust the accrued liabilities for environmental remediation obligations reflected in our consolidated financial statements as they become probable and a reasonable estimate of fair value can be made.
We measure our environmental remediation liability at fair value based on expected future net cash flows, adjusted for inflation (using a range of 2.0% to 2.75%), and then discount them to present value (using a range of 4.0% to 7.0%). We adjust our environmental remediation liability quarterly to reflect changes in projected expenditures, changes in present value due to the passage of time and reductions in estimated liabilities as a result of actual expenditures incurred during each quarter. As of December 31, 2015, we had accrued a total of $84.3 million for our prospective environmental remediation liability. This accrual includes (a) $38.9 million, which was our best estimate of reasonably estimable environmental remediation obligations and obligations to remove USTs for which we are the title owner, net of estimated recoveries and (b) $45.4 million for future environmental liabilities related to preexisting unknown contamination. As of December 31, 2014, we had accrued a total of $91.6 million for our prospective environmental remediation liability. This accrual includes (a) $41.9 million, which was our best estimate of reasonably estimable environmental remediation obligations and obligations to remove USTs for which we are the title owner, net of estimated recoveries and (b) $49.7 million for future environmental liabilities related to preexisting unknown contamination.
Environmental liabilities are accreted for the change in present value due to the passage of time and, accordingly, $4.8 million, $3.0 million and $3.2 million of net accretion expense was recorded for the years ended December 31, 2015, 2014 and 2013, respectively, which is included in environmental expenses. In addition, during the years ended December 31, 2015, 2014 and 2013, we recorded credits to environmental expenses included in continuing operations and to earnings from operating activities in discontinued operations in our consolidated statements of operations aggregating $4.6 million, $2.8 million and $3.0 million, respectively, where decreases in estimated remediation costs exceeded the depreciated carrying value of previously capitalized asset retirement costs. Environmental expenses also include project management fees, legal fees and provisions for environmental litigation losses.
During the years ended December 31, 2015 and 2014, we increased the carrying value of certain of our properties by $12.3 million and $62.5 million (consisting of $12.8 million of known environmental liabilities and $49.7 million of reserves for future environmental liabilities), respectively, due to increases in estimated environmental remediation costs. The recognition and subsequent changes in estimates in environmental liabilities and the increase or decrease in carrying value of the properties are non-cash transactions which do not appear on the face of the consolidated statements of cash flows. We recorded non-cash impairment charges aggregating $12.5 million (consisting of $10.3 million for known environmental liabilities and $2.2 million for future environmental liabilities) and $16.9 million (consisting of $8.6 million for known environmental liabilities and $8.3 million for future environmental liabilities) for the years ended December 31, 2015 and 2014, respectively, in continuing operations and in discontinued operations for capitalized asset retirement costs. Capitalized asset retirement costs are being depreciated over the estimated remaining life of the UST, a ten year period if the increase in carrying value is related to environmental remediation obligations or such shorter period if circumstances warrant, such as the remaining lease term for properties we lease from others. Depreciation and amortization expense included in continuing operations and earnings from discontinued operations in our consolidated statements of operations for the years ended December 31, 2015, 2014 and 2013 included $6.0 million, $1.6 million and $2.0 million, respectively, of depreciation related to capitalized asset retirement costs. Capitalized asset retirement costs were $51.4 million (consisting of $20.9 million of known environmental liabilities and $30.5 million of reserves for future environmental liabilities) and $59.8 million (consisting of $18.4 million of known environmental liabilities and $41.4 million of reserves for future environmental liabilities) as of December 31, 2015 and 2014, respectively.
As part of the triple-net leases for properties previously leased to Marketing, we transferred title of the USTs to our tenants, and the obligation to pay for the retirement and decommissioning or removal of USTs at the end of their useful life or earlier if circumstances warranted was fully or partially transferred to our new tenants. We remain contingently liable for this obligation in the event that our tenants do not satisfy their responsibilities. Accordingly, through December 31, 2015, we removed $13.4 million of asset retirement obligations and $10.7 million of net asset retirement costs related to USTs from our balance sheet. The cumulative net amount of $2.7 million is recorded as deferred rental revenue and will be recognized on a straight-line basis as additional revenues from rental properties over the terms of the various leases. See Note 2 in “Item 8. Financial Statements and Supplementary Data — Notes to Consolidated Financial Statements” in this Annual Report on Form 10-K.
We cannot predict what environmental legislation or regulations may be enacted in the future or how existing laws or regulations will be administered or interpreted with respect to products or activities to which they have not previously been applied. We cannot predict if state UST fund programs will be administered and funded in the future in a manner that is consistent with past practices and if future environmental spending will continue to be eligible for reimbursement at historical recovery rates under these programs. Compliance with more stringent laws or regulations, as well as more vigorous enforcement policies of the regulatory agencies or stricter interpretation of existing laws, which may develop in the future, could have an adverse effect on our financial position, or that of our tenants, and could require substantial additional expenditures for future remediation.
In light of the uncertainties associated with environmental expenditure contingencies, we are unable to estimate ranges in excess of the amount accrued with any certainty; however, we believe it is possible that the fair value of future actual net expenditures could be substantially higher than amounts currently recorded by us. Adjustments to accrued liabilities for environmental remediation
41
Table of Contents
obligations will be reflected in our consolidated financial statements as they become probable and a reasonable estimate of fair value can be made. Future environmental expenses could cause a material adverse effect on our business, financial condition, results of operations, liquidity, ability to pay dividends or stock price.
Environmental Litigation
We are subject to various legal proceedings and claims which arise in the ordinary course of our business. As of December 31, 2015 and 2014, we had accrued an aggregate $11.3 million and $11.0 million, respectively, for certain of these matters which we believe were appropriate based on information then currently available. It is possible that our assumptions regarding the ultimate allocation method and share of responsibility that we used to allocate environmental liabilities may change, which may result in our providing an accrual, or adjustments to the amounts recorded, for environmental litigation accruals. Matters related to our former Newark, New Jersey Terminal and Lower Passaic River and MTBE litigations in the states of New Jersey and Pennsylvania, in particular, could cause a material adverse effect on our business, financial condition, results of operations, liquidity, ability to pay dividends or stock price. See “Item 3. Legal Proceedings” and Note 3 to our consolidated financial statements for additional information with respect to these and other pending environmental lawsuits and claims.
Item 7A. Quantitative and Qualitative Disclosures about Market Risk
We are exposed to interest rate risk, primarily as a result of our $225.0 million senior unsecured credit agreement (the “Credit Agreement”) entered into on June 2, 2015 with a group of commercial banks led by Bank of America, N.A. (the “Bank Syndicate”). The Credit Agreement consists of a $175.0 million revolving facility (the “Revolving Facility”), which is scheduled to mature in June 2018 and a $50.0 million term loan (the “Term Loan”), which is scheduled to mature in June 2020. Subject to the terms of the Credit Agreement and our continued compliance with its provisions, we have the option to (a) extend the term of the Revolving Facility for one additional year to June 2019 and (b) increase by $75.0 million the amount of the Revolving Facility to $250.0 million. The Credit Agreement incurs interest and fees at various rates based on our net debt to EBITDA ratio (as defined in the Credit Agreement) at the end of each quarterly reporting period. The Revolving Facility permits borrowings at an interest rate equal to the sum of a base rate plus a margin of 0.95% to 2.25% or a LIBOR rate plus a margin of 1.95% to 3.25%. The Term Loan bears interest at a rate equal to the sum of a base rate plus a margin of 0.90% to 2.20% or a LIBOR rate plus a margin of 1.90% to 3.20%. The Credit Agreement does not provide for scheduled reductions in the principal balance prior to its maturity. We use borrowings under the Credit Agreement to finance acquisitions and for general corporate purposes. Borrowings outstanding at floating interest rates under the Credit Agreement as of December 31, 2015 were $144.0 million.
We manage our exposure to interest rate risk by minimizing, to the extent feasible, our overall borrowings and monitoring available financing alternatives. We reduced our interest rate risk on June 2, 2015 when we entered into an amended and restated note purchase agreement (the “Restated Prudential Note Purchase Agreement”) with The Prudential Insurance Company of America (“Prudential”) and an affiliate of Prudential. Pursuant to the Restated Prudential Note Purchase Agreement, Prudential and its affiliate redenominated the existing notes in the aggregate amount of $100.0 million issued under the existing note purchase agreement as senior unsecured Series A Notes, and issued $75.0 million of senior unsecured Series B Notes bearing interest at 5.35% and maturing in June 2023 to Prudential and certain affiliates of Prudential. The Series A Notes continue to bear interest at 6.0% and mature in February 2021. The Restated Prudential Note Purchase Agreement does not provide for scheduled reductions in the principal balance of either the Series A Notes or the Series B Notes prior to their respective maturities. Our interest rate risk may materially change in the future if we seek other sources of debt or equity capital or refinance our outstanding debt.
Based on our average outstanding borrowings under the Credit Agreement of $144.0 million for the year ended December 31, 2015, an increase in market interest rates of 0.50% for 2016 would decrease our 2016 net income and cash flows by approximately $0.7 million. This amount was determined by calculating the effect of a hypothetical interest rate change on our borrowings floating at market rates, and assumes that the $144.0 million outstanding borrowings under the Credit Agreement is indicative of our future average floating interest rate borrowings for 2016 before considering additional borrowings required for future acquisitions or repayment of outstanding borrowings from proceeds of future equity offerings. The calculation also assumes that there are no other changes in our financial structure or the terms of our borrowings. Our exposure to fluctuations in interest rates will increase or decrease in the future with increases or decreases in the outstanding amount under our Credit Agreement and with increases or decreases in amounts outstanding under borrowing agreements entered into with interest rates floating at market rates.
In order to minimize our exposure to credit risk associated with financial instruments, we place our temporary cash investments with high-credit-quality institutions. Temporary cash investments, if any, are currently held in an overnight bank time deposit with JPMorgan Chase Bank, N.A.
42
Table of Contents
Item 8. Financial Statements and Supplementary Data
GETTY REALTY CORP. INDEX TO CONSOLIDATED FINANCIAL STATEMENTS AND
SUPPLEMENTARY DATA
43
Table of Contents
GETTY REALTY CORP. AND SUBSIDIARIES
CONSOLIDATED BALANCE SHEETS
(in thousands, except share data)
| DECEMBER 31, | ||||||||
| 2015 | 2014 | |||||||
| ASSETS: |
||||||||
| Real Estate: |
||||||||
| Land |
$ | 475,784 | $ | 344,324 | ||||
| Buildings and improvements |
304,894 | 246,112 | ||||||
| Construction in progress |
955 | — | ||||||
|
|
|
|
|
|||||
| 781,633 | 590,436 | |||||||
| Less accumulated depreciation and amortization |
(107,109 | ) | (99,510 | ) | ||||
|
|
|
|
|
|||||
| Real estate held for use, net |
674,524 | 490,926 | ||||||
| Real estate held for sale, net |
1,339 | 4,343 | ||||||
|
|
|
|
|
|||||
| Real estate, net |
675,863 | 495,269 | ||||||
| Net investment in direct financing leases |
94,098 | 95,764 | ||||||
| Deferred rent receivable, net of allowance of $0 and $7,009, respectively |
25,450 | 21,049 | ||||||
| Cash and cash equivalents |
3,942 | 3,111 | ||||||
| Restricted cash |
409 | 713 | ||||||
| Notes and mortgages receivable |
48,455 | 34,226 | ||||||
| Accounts receivable, net of allowance of $2,634 and $4,160, respectively |
2,975 | 4,395 | ||||||
| Prepaid expenses and other assets |
47,937 | 32,974 | ||||||
|
|
|
|
|
|||||
| Total assets |
$ | 899,129 | $ | 687,501 | ||||
|
|
|
|
|
|||||
| LIABILITIES AND SHAREHOLDERS’ EQUITY: |
||||||||
| Borrowings under credit agreement |
$ | 144,000 | $ | 25,000 | ||||
| Senior unsecured notes |
175,000 | 100,000 | ||||||
| Mortgage payable, net |
303 | 344 | ||||||
| Environmental remediation obligations |
84,345 | 91,566 | ||||||
| Dividends payable |
15,897 | 12,150 | ||||||
| Accounts payable and accrued liabilities |
73,023 | 51,417 | ||||||
|
|
|
|
|
|||||
| Total liabilities |
492,568 | 280,477 | ||||||
|
|
|
|
|
|||||
| Commitments and contingencies (notes 2, 3, 4 and 5) |
— | — | ||||||
| Shareholders’ equity: |
||||||||
| Preferred stock, $0.01 par value; 20,000,000 shares authorized; unissued |
— | — | ||||||
| Common stock, $0.01 par value; 50,000,000 shares authorized; 33,422,170 and 33,417,203 shares issued and outstanding, respectively |
334 | 334 | ||||||
| Paid-in capital |
464,338 | 463,314 | ||||||
| Dividends paid in excess of earnings |
(58,111 | ) | (56,624 | ) | ||||
|
|
|
|
|
|||||
| Total shareholders’ equity |
406,561 | 407,024 | ||||||
|
|
|
|
|
|||||
| Total liabilities and shareholders’ equity |
$ | 899,129 | $ | 687,501 | ||||
|
|
|
|
|
|||||
The accompanying notes are an integral part of these consolidated financial statements.
44
Table of Contents
GETTY REALTY CORP. AND SUBSIDIARIES
CONSOLIDATED STATEMENTS OF OPERATIONS
(in thousands, except per share amounts)
| YEAR ENDED DECEMBER 31, | ||||||||||||
| 2015 | 2014 | 2013 | ||||||||||
| Revenues: |
||||||||||||
| Revenues from rental properties |
$ | 107,035 | $ | 96,748 | $ | 96,295 | ||||||
| Interest on notes and mortgages receivable |
3,698 | 3,145 | 3,397 | |||||||||
| Other revenue |
— | — | 3,126 | |||||||||
|
|
|
|
|
|
|
|||||||
| Total revenues |
110,733 | 99,893 | 102,818 | |||||||||
|
|
|
|
|
|
|
|||||||
| Operating expenses: |
||||||||||||
| Property costs |
23,649 | 23,768 | 29,382 | |||||||||
| Impairments |
11,615 | 12,938 | 3,677 | |||||||||
| Environmental |
6,222 | 4,612 | 12,056 | |||||||||
| General and administrative |
16,930 | 15,777 | 20,369 | |||||||||
| Allowance (recoveries) for uncollectible accounts |
1,053 | 3,408 | (10,952 | ) | ||||||||
| Depreciation and amortization |
16,974 | 10,549 | 9,346 | |||||||||
|
|
|
|
|
|
|
|||||||
| Total operating expenses |
76,443 | 71,052 | 63,878 | |||||||||
|
|
|
|
|
|
|
|||||||
| Operating income |
34,290 | 28,841 | 38,940 | |||||||||
| Gains on dispositions of real estate |
2,272 | 1,223 | — | |||||||||
| Other income, net |
18,301 | 147 | 103 | |||||||||
| Interest expense |
(14,493 | ) | (9,806 | ) | (11,667 | ) | ||||||
|
|
|
|
|
|
|
|||||||
| Earnings from continuing operations |
40,370 | 20,405 | 27,376 | |||||||||
| Discontinued operations: |
||||||||||||
| Loss from operating activities |
(3,299 | ) | (5,982 | ) | (2,870 | ) | ||||||
| Gains on dispositions of real estate |
339 | 8,995 | 45,505 | |||||||||
|
|
|
|
|
|
|
|||||||
| (Loss) earnings from discontinued operations |
(2,960 | ) | 3,013 | 42,635 | ||||||||
|
|
|
|
|
|
|
|||||||
| Net earnings |
$ | 37,410 | $ | 23,418 | $ | 70,011 | ||||||
|
|
|
|
|
|
|
|||||||
| Basic and diluted earnings per common share: |
||||||||||||
| Earnings from continuing operations |
$ | 1.20 | $ | 0.60 | $ | 0.81 | ||||||
| (Loss) earnings from discontinued operations |
(0.09 | ) | 0.09 | 1.27 | ||||||||
| Net earnings |
$ | 1.11 | $ | 0.69 | $ | 2.08 | ||||||
| Weighted average common shares outstanding: |
||||||||||||
| Basic and diluted |
33,420 | 33,409 | 33,397 | |||||||||
|
|
|
|
|
|
|
|||||||
The accompanying notes are an integral part of these consolidated financial statements.
45
Table of Contents
GETTY REALTY CORP. AND SUBSIDIARIES
CONSOLIDATED STATEMENTS OF CASH FLOWS
(in thousands)
| YEAR ENDED DECEMBER 31, | ||||||||||||
| 2015 | 2014 | 2013 | ||||||||||
| CASH FLOWS FROM OPERATING ACTIVITIES: |
||||||||||||
| Net earnings |
$ | 37,410 | $ | 23,418 | $ | 70,011 | ||||||
| Adjustments to reconcile net earnings to net cash flow provided by operating activities: |
||||||||||||
| Depreciation and amortization expense |
||||||||||||
| Continuing operations |
16,974 | 10,549 | 9,346 | |||||||||
| Discontinued operations |
— | — | 581 | |||||||||
| Impairments |
17,361 | 21,534 | 13,425 | |||||||||
| Gains on dispositions of real estate |
||||||||||||
| Continuing operations |
(2,272 | ) | (1,223 | ) | — | |||||||
| Discontinued operations |
(339 | ) | (8,995 | ) | (45,505 | ) | ||||||
| Deferred rent receivable, net of allowance |
(4,401 | ) | (4,156 | ) | (4,445 | ) | ||||||
| Bad debt expense (recoveries) |
1,089 | 1,278 | (20,854 | ) | ||||||||
| Amortization of above-market and below-market leases |
(1,496 | ) | (28 | ) | 160 | |||||||
| Amortization of credit agreement and senior unsecured notes origination costs |
1,150 | 1,068 | 1,650 | |||||||||
| Accretion expense |
4,829 | 3,046 | 3,214 | |||||||||
| Stock-based employee compensation expense |
1,090 | 917 | 971 | |||||||||
| Changes in assets and liabilities: |
||||||||||||
| Accounts receivable |
(1,546 | ) | (730 | ) | 20,847 | |||||||
| Prepaid expenses and other assets |
(189 | ) | 3,934 | (201 | ) | |||||||
| Environmental remediation obligations |
(23,485 | ) | (16,368 | ) | (15,611 | ) | ||||||
| Accounts payable and accrued liabilities |
3,513 | (5,007 | ) | 10,089 | ||||||||
|
|
|
|
|
|
|
|||||||
| Net cash flow provided by operating activities |
49,688 | 29,237 | 43,678 | |||||||||
|
|
|
|
|
|
|
|||||||
| CASH FLOWS FROM INVESTING ACTIVITIES: |
||||||||||||
| Property acquisitions and capital expenditures |
(219,526 | ) | (17,238 | ) | (67,174 | ) | ||||||
| Investment in direct financing leases |
— | — | (6,267 | ) | ||||||||
| Proceeds from dispositions of real estate |
||||||||||||
| Continuing operations |
5,604 | 4,776 | — | |||||||||
| Discontinued operations |
1,424 | 15,289 | 66,349 | |||||||||
| Change in cash held for property acquisitions |
2,844 | 16,226 | (16,467 | ) | ||||||||
| Change in restricted cash |
304 | 287 | (1,000 | ) | ||||||||
| Addition to construction in progress |
(687 | ) | — | — | ||||||||
| Amortization of investment in direct financing leases |
1,666 | 1,382 | 1,025 | |||||||||
| Issuance of notes, mortgages and other receivables |
— | — | (4,138 | ) | ||||||||
| Collection of notes and mortgages receivable |
3,647 | 2,783 | 20,825 | |||||||||
|
|
|
|
|
|
|
|||||||
| Net cash flow (used in) / provided by investing activities |
(204,724 | ) | 23,505 | (6,847 | ) | |||||||
|
|
|
|
|
|
|
|||||||
| CASH FLOWS FROM FINANCING ACTIVITIES: |
||||||||||||
| Borrowings under prior credit agreement |
14,000 | 3,000 | 130,400 | |||||||||
| Repayments under prior credit agreement |
(39,000 | ) | (36,000 | ) | (222,690 | ) | ||||||
| Borrowings under new credit agreement |
172,000 | — | — | |||||||||
| Repayments under new credit agreement |
(28,000 | ) | — | — | ||||||||
| Borrowings under senior unsecured notes |
75,000 | — | 100,000 | |||||||||
| Repayments under term loan |
— | — | (22,030 | ) | ||||||||
| Payments of capital lease obligations |
(249 | ) | (255 | ) | (220 | ) | ||||||
| Principal payments of mortgage notes |
(50 | ) | (50 | ) | — | |||||||
| Payments of cash dividends |
(35,150 | ) | (28,675 | ) | (24,419 | ) | ||||||
| Payments of loan origination costs |
(2,432 | ) | — | (2,842 | ) | |||||||
| Cash paid in settlement of restricted stock units |
(65 | ) | — | — | ||||||||
| Security deposits (refunded) received |
(187 | ) | 314 | 129 | ||||||||
|
|
|
|
|
|
|
|||||||
| Net cash flow provided by / (used in) financing activities |
155,867 | (61,666 | ) | (41,672 | ) | |||||||
|
|
|
|
|
|
|
|||||||
| Change in cash and cash equivalents |
831 | (8,924 | ) | (4,841 | ) | |||||||
| Cash and cash equivalents at beginning of year |
3,111 | 12,035 | 16,876 | |||||||||
|
|
|
|
|
|
|
|||||||
| Cash and cash equivalents at end of year |
$ | 3,942 | $ | 3,111 | $ | 12,035 | ||||||
|
|
|
|
|
|
|
|||||||
| Supplemental disclosures of cash flow information |
||||||||||||
| Cash paid during the period for: |
||||||||||||
| Interest paid |
$ | 12,643 | $ | 8,735 | $ | 9,563 | ||||||
| Income taxes |
341 | 316 | 173 | |||||||||
| Environmental remediation obligations |
19,123 | 13,448 | 12,396 | |||||||||
| Non-cash transactions |
||||||||||||
| Issuance of notes and mortgages receivable related to property dispositions |
17,876 | 8,278 | 8,714 | |||||||||
| Mortgage payable, net related to property acquisition |
— | 390 | — | |||||||||
| Accrued construction in progress |
268 | — | — | |||||||||
The accompanying notes are an integral part of these consolidated financial statements.
46
Table of Contents
GETTY REALTY CORP. AND SUBSIDIARIES
NOTES TO CONSOLIDATED FINANCIAL STATEMENTS
1. SUMMARY OF SIGNIFICANT ACCOUNTING POLICIES
Basis of Presentation: The consolidated financial statements include the accounts of Getty Realty Corp. and its wholly-owned subsidiaries. We are a real estate investment trust (“REIT”) specializing in the ownership, leasing and financing of convenience store and gasoline station properties. The accompanying consolidated financial statements have been prepared in conformity with accounting principles generally accepted in the United States of America (“GAAP”). We do not distinguish our principal business or our operations on a geographical basis for purposes of measuring performance. We manage and evaluate our operations as a single segment. All significant intercompany accounts and transactions have been eliminated.
Use of Estimates, Judgments and Assumptions: The consolidated financial statements have been prepared in conformity with GAAP, which requires management to make estimates, judgments and assumptions that affect the reported amounts of assets and liabilities and disclosure of contingent assets and liabilities at the date of the consolidated financial statements and revenues and expenses during the period reported. Estimates, judgments and assumptions underlying the accompanying consolidated financial statements include, but are not limited to, receivables, deferred rent receivable, net investment in direct financing leases, environmental remediation costs, real estate, depreciation and amortization, impairment of long-lived assets, litigation, environmental remediation obligations, accrued liabilities, income taxes and the allocation of the purchase price of properties acquired to the assets acquired and liabilities assumed. Application of these estimates and assumptions requires exercise of judgment as to future uncertainties and, as a result, actual results could differ materially from these estimates.
Subsequent Events: We evaluated subsequent events and transactions for potential recognition or disclosure in our consolidated financial statements.
New Accounting Pronouncements: In May 2014, the FASB issued ASU 2014-09 Revenue from Contracts with Customers (Topic 606) (“ASU 2014-09”). ASU 2014-09 is a comprehensive new revenue recognition model requiring a company to recognize revenue to depict the transfer of goods or services to a customer at an amount reflecting the consideration it expects to receive in exchange for those goods or services. In adopting ASU 2014-09, companies may use either a full retrospective or a modified retrospective approach. ASU 2014-09 was effective for the first interim period within annual reporting periods beginning after December 15, 2016, and early adoption was not permitted. On July 9, 2015, the FASB decided to delay the effective date of ASU 2014-09 by one year making it effective for the first interim period within annual reporting periods beginning after December 15, 2017. Early adoption is permitted as of the original effective date. We are currently in the process of evaluating the impact the adoption of ASU 2014-09 will have on our financial position or results of operations.
In August 2014, the FASB issued guidance ASU 2014-15, Presentation of Financial Statements – Going Concern: Disclosure of Uncertainties about an Entity’s Ability to Continue as a Going Concern. This guidance requires management to evaluate whether there is substantial doubt about the entity’s ability to continue as a going concern and, if so, disclose that fact. This guidance is effective for annual periods ending after December 15, 2016, including interim reporting periods thereafter. The new guidance affects disclosures only and is not expected to have a material impact on our consolidated financial position, results of operations or cash flows.
In April 2015, the FASB issued guidance ASU 2015-03, which amends Topic 835, Other Presentation Matters. The amendments in ASU 2015-03 require that debt issuance costs be reported on the balance sheet as a direct reduction of the face amount of the debt instrument they relate to, and should not be classified as a deferred charge, as was previously required under the Accounting Standards Codification. ASU 2015-03 is effective, on a retrospective basis, for interim and annual periods beginning after December 15, 2015, and early adoption is permitted. We do not expect the adoption of ASU 2015-03 to have a material impact on our consolidated financial statements.
In August 2015, the FASB issued guidance ASU 2015-15: Presentation and Subsequent Measurement of Debt Issuance Costs Associated with Line of Credit Arrangements (“ASU 2015-15”) providing guidance regarding the presentation and subsequent measurement of debt issuance costs related to line-of-credit arrangements. Given the absence of authoritative guidance on this matter, the SEC staff has indicated that it would not object to an entity deferring and presenting debt issuance costs as an asset and subsequently amortizing the deferred debt issuance costs ratably over the term of the line-of-credit arrangement, regardless of whether there are any outstanding borrowings on that line-of-credit arrangement. We do not expect the adoption of ASU 2015-15 to have a material impact on our consolidated financial statements.
In September 2015, the FASB issued guidance ASU 2015-16, Simplifying the Accounting for Measurement-Period Adjustments (“ASU 2015-16”) to simplify the accounting for business combinations, specifically as it relates to measurement-period adjustments. ASU 2015-16 requires acquiring entities in a business combination to recognize measurement-period adjustments in the reporting period in which the adjustment amounts are determined. Also, ASU 2015-16 requires entities to present separately on the face of the income statement (or disclose in the notes to the financial statements) the portion of the amount recorded in the current period earnings, by line item, that would have been recorded in previous reporting periods if the adjustment to the provisional amounts had been recognized as of the acquisition date. ASU 2015-16 is effective for interim and annual periods beginning after December 15, 2015. Early adoption is permitted. We elected to early adopt ASU 2015-16 beginning in the fourth quarter ended December 31, 2015. The adoption of ASU 2015-16 did not have a material impact on our financial position or results of operations.
47
Table of Contents
In February 2016, the FASB issued ASU 2016-02, ‘‘Leases’’ (“ASU 2016-02”). ASU 2016-02 amends the existing accounting standards for lease accounting, including requiring lessees to recognize most leases on their balance sheets. Lessor accounting will remain similar to lessor accounting under previous GAAP, while aligning with the FASB’s new revenue recognition guidance. ASU 2016-02 is effective for the Company beginning January 1, 2019. Early adoption of ASU 2016-02 is permitted. The standard requires a modified retrospective transition approach for all leases existing at, or entered into after, the date of initial application, with an option to use certain transition relief. We are evaluating the impact ASU 2016-02 will have on our financial position and results of operations.
Fair Value Hierarchy: The preparation of consolidated financial statements in accordance with GAAP requires management to make estimates of fair value that affect the reported amounts of assets and liabilities and disclosure of assets and liabilities at the date of the consolidated financial statements and revenues and expenses during the period reported using a hierarchy (the “Fair Value Hierarchy”) that prioritizes the inputs to valuation techniques used to measure the fair value. The Fair Value Hierarchy gives the highest priority to unadjusted quoted prices in active markets for identical assets or liabilities (Level 1 measurements) and the lowest priority to unobservable inputs (Level 3 measurements). The levels of the Fair Value Hierarchy are as follows: “Level 1”-inputs that reflect unadjusted quoted prices in active markets for identical assets or liabilities that we have the ability to access at the measurement date; “Level 2”-inputs other than quoted prices that are observable for the asset or liability either directly or indirectly, including inputs in markets that are not considered to be active; and “Level 3”-inputs that are unobservable. Certain types of assets and liabilities are recorded at fair value either on a recurring or non-recurring basis. Assets required or elected to be marked-to-market and reported at fair value every reporting period are valued on a recurring basis. Other assets not required to be recorded at fair value every period may be recorded at fair value if a specific provision or other impairment is recorded within the period to mark the carrying value of the asset to market as of the reporting date. Such assets are valued on a non-recurring basis.
We have mutual fund assets that are measured at fair value on a recurring basis using Level 1 inputs. We have a Supplemental Retirement Plan for executives and other senior management employees. The amounts held in trust under the Supplemental Retirement Plan using Level 2 inputs may be used to satisfy claims of general creditors in the event of our or any of our subsidiaries’ bankruptcy. We have liability to the employees participating in the Supplemental Retirement Plan for the participant account balances equal to the aggregate of the amount invested at the employees’ direction and the income earned in such mutual funds.
We have certain real estate assets that are measured at fair value on a non-recurring basis using Level 3 inputs as of December 31, 2015 and December 31, 2014 of $1,264,000 and $9,266,000, respectively, where impairment charges have been recorded. Due to the subjectivity inherent in the internal valuation techniques used in estimating fair value, the amounts realized from the sale of such assets may vary significantly from these estimates.
The following summarizes as of December 31, 2015 our assets and liabilities measured at fair value on a recurring basis by level within the Fair Value Hierarchy:
| (in thousands) |
Level 1 | Level 2 | Level 3 | Total | ||||||||||||
| Assets: |
||||||||||||||||
| Mutual funds |
$ | 888 | $ | — | $ | — | $ | 888 | ||||||||
| Liabilities: |
||||||||||||||||
| Deferred compensation |
$ | — | $ | 888 | $ | — | $ | 888 | ||||||||
The following summarizes as of December 31, 2014 our assets and liabilities measured at fair value on a recurring basis by level within the Fair Value Hierarchy:
| (in thousands) |
Level 1 | Level 2 | Level 3 | Total | ||||||||||||
| Assets: |
||||||||||||||||
| Mutual funds |
$ | 785 | $ | — | $ | — | $ | 785 | ||||||||
| Liabilities: |
||||||||||||||||
| Deferred compensation |
$ | — | $ | 785 | $ | — | $ | 785 | ||||||||
Fair Value Disclosure of Financial Instruments: All of our financial instruments are reflected in the accompanying consolidated balance sheets at amounts which, in our estimation based upon an interpretation of available market information and valuation methodologies, reasonably approximate their fair values, except those separately disclosed in the notes to our consolidated financial statements.
48
Table of Contents
Discontinued Operations and Assets Held-for-Sale: We report as discontinued operations five properties which met the criteria to be accounted for as held for sale in accordance with GAAP as of June 30, 2014 and certain properties disposed of during the periods presented that were previously classified as held for sale as of June 30, 2014. All results of these discontinued operations are included in a separate component of income on the consolidated statements of operations under the caption discontinued operations. This has resulted in certain amounts related to discontinued operations in 2014 being reclassified to conform to the 2015 presentation. We elected to early adopt ASU 2014-08 effective July 1, 2014 and, as a result, the results of operations for all qualifying disposals and properties classified as held for sale that were not previously reported in discontinued operations as of June 30, 2014 are presented within income from continuing operations in our consolidated statements of income.
During the year ended December 31, 2015, we sold 14 properties resulting in a gain of $339,000 that were previously classified as held for sale as of June 30, 2014. In addition, during the year ended December 31, 2015, we sold 70 properties resulting in a recognized gain of $1,333,000 that previously did not meet the criteria to be classified as held for sale. We also sold a leasehold interest and recognized a gain of $998,000, received funds from three partial property condemnations resulting in a loss of $51,000 and recognized a loss on capital lease terminations of $8,000. We determined that the 70 properties sold did not represent a strategic shift in our operations as defined in ASU 2014-08 and, as a result, the gains on dispositions of real estate for the 70 properties were reflected in our earnings from continuing operations.
As a result of a change in circumstances that was previously considered unlikely, we reclassified one property from held for sale to held and used as the property no longer met the criteria to be held for sale during the year ended December 31, 2015. A property that is reclassified to held and used is measured and recorded at the lower of (i) its carrying amount before the property was classified as held for sale, adjusted for any depreciation expense that would have been recognized had the property been continuously classified as held and used, or (ii) the fair value at the date of the subsequent decision not to sell.
Real estate held for sale consisted of the following at December 31, 2015 and 2014:
| (in thousands) |
December | |||||||
| 2015 | 2014 | |||||||
| Land |
$ | 603 | $ | 2,383 | ||||
| Buildings and improvements |
997 | 3,140 | ||||||
|
|
|
|
|
|||||
| 1,600 | 5,523 | |||||||
| Accumulated depreciation and amortization |
(261 | ) | (1,180 | ) | ||||
|
|
|
|
|
|||||
| Real estate held for sale, net |
$ | 1,339 | $ | 4,343 | ||||
|
|
|
|
|
|||||
The revenue from rental properties, impairment charges, other operating expenses and gains from dispositions of real estate related to these properties are as follows:
| Year ended December 31, | ||||||||||||
| (in thousands) |
2015 | 2014 | 2013 | |||||||||
| Revenues from rental properties |
$ | 164 | $ | 2,372 | $ | 4,583 | ||||||
| Impairments |
(5,746 | ) | (8,596 | ) | (9,748 | ) | ||||||
| Other operating income |
2,283 | 242 | 2,295 | |||||||||
|
|
|
|
|
|
|
|||||||
| Loss from operating activities |
(3,299 | ) | (5,982 | ) | (2,870 | ) | ||||||
| Gains from dispositions of real estate |
339 | 8,995 | 45,505 | |||||||||
|
|
|
|
|
|
|
|||||||
| (Loss) earnings from discontinued operations |
$ | (2,960 | ) | $ | 3,013 | $ | 42,635 | |||||
|
|
|
|
|
|
|
|||||||
Real Estate: Real estate assets are stated at cost less accumulated depreciation and amortization. Upon acquisition of real estate and leasehold interests, we estimate the fair value of acquired tangible assets (consisting of land, buildings and improvements) “as if vacant” and identified intangible assets and liabilities (consisting of leasehold interests, above-market and below-market leases, in-place leases and tenant relationships) and assumed debt. Based on these estimates, we allocate the estimated fair value to the applicable assets and liabilities. Fair value is determined based on an exit price approach, which contemplates the price that would be received from the sale of an asset or paid to transfer a liability in an orderly transaction between market participants at the measurement date. We expense transaction costs associated with business combinations in the period incurred. We capitalize direct costs, including costs such as construction costs and professional services, and indirect costs associated with the development and construction of real estate assets while substantive activities are ongoing to prepare the assets for their intended use. The capitalization period begins when development activities are underway and ends when it is determined that the asset is substantially complete and ready for its intended use.
49
Table of Contents
When real estate assets are sold or retired, the cost and related accumulated depreciation and amortization is eliminated from the respective accounts and any gain or loss is credited or charged to income. We evaluate real estate sale transactions where we provide seller financing to determine sale and gain recognition in accordance with GAAP. Expenditures for maintenance and repairs are charged to income when incurred. See Note 10 for additional information regarding property acquisitions.
Depreciation and Amortization: Depreciation of real estate is computed on the straight-line method based upon the estimated useful lives of the assets, which generally range from 16 to 25 years for buildings and improvements, or the term of the lease if shorter. Asset retirement costs are depreciated over the shorter of the remaining useful lives of USTs or ten years for asset retirement costs related to environmental remediation obligations, which costs are attributable to the group of assets identified at a property. Leasehold interests and in-place leases are amortized over the remaining term of the underlying lease.
Impairment of Long-Lived Assets and Long-Lived Assets to Be Disposed Of: Assets are written down to fair value when events and circumstances indicate that the assets might be impaired and the projected undiscounted cash flows estimated to be generated by those assets are less than the carrying amount of those assets. Assets held for disposal are written down to fair value less estimated disposition costs.
We recorded non-cash impairment charges aggregating $17,361,000, $21,534,000 and $13,425,000 for the years ended December 31, 2015, 2014 and 2013, respectively, in continuing operations and in discontinued operations. Our estimated fair values, as it relates to property carrying values were primarily based upon (i) estimated sales prices from third-party offers based on signed contracts, letters of intent or indicative bid and/or consideration of the amount that currently would be required to replace the asset, as adjusted for obsolescence (this method was used to determine $8,776,000 of the $17,361,000 in impairments recognized during the year ended December 31, 2015), for which we do not have access to the unobservable inputs used to determine these estimated fair values and (ii) discounted cash flow models (this method was used to determine $842,000 of the $17,361,000 in impairments recognized during the year ended December 31, 2015). During the year ended December 31, 2015, we recorded $7,743,000 of the $17,361,000 in impairments recognized due to the accumulation of asset retirement costs as a result of changes in estimates associated with our estimated environmental liabilities which increased the carrying value of certain properties in excess of their fair value. The non-cash impairment charges recorded during the years ended December 31, 2015 and 2014 were attributable to reductions in estimated undiscounted cash flows expected to be received during the assumed holding period, reductions in our estimates of value for properties held for sale and the accumulation of asset retirement costs due to changes in estimates associated with our environmental liabilities which increased the carrying value of certain properties in excess of their fair value. The estimated fair value of real estate is based on the price that would be received from the sale of the property in an orderly transaction between market participants at the measurement date. In general, we consider multiple internal valuation techniques when measuring the fair value of a property, all of which are based on unobservable inputs and assumptions that are classified within Level 3 of the Fair Value Hierarchy. These unobservable inputs include assumed holding periods ranging up to 15 years, assumed average rent increases of 2.0% annually, income capitalized at a rate of 8.0% and cash flows discounted at a rate of 7.0%. These assessments have a direct impact on our net income because recording an impairment loss results in an immediate negative adjustment to net income. The evaluation of anticipated cash flows is highly subjective and is based in part on assumptions regarding future rental rates and operating expenses that could differ materially from actual results in future periods. Where properties held for use have been identified as having a potential for sale, additional judgments are required related to the determination as to the appropriate period over which the projected undiscounted cash flows should include the operating cash flows and the amount included as the estimated residual value. This requires significant judgment. In some cases, the results of whether impairment is indicated are sensitive to changes in assumptions input into the estimates, including the holding period until expected sale.
Deferred Gain: On August 3, 2015, we terminated our unitary triple-net lease (the “Ramoco Lease”) with Hanuman Business, Inc. (d/b/a “Ramoco”), and sold to Ramoco affiliates 48 of the properties that had been subject to the Ramoco Lease. The total consideration for the 48 properties we sold to Ramoco affiliates, including seller financing, was $15,000,000. In accordance with ASC 360-20, Property, Plant and Equipment, Real Estate Sales, we evaluated the accounting for the gain on sales of these assets, noting that the buyer’s initial investment did not represent the amount required for recognition of gain by the full accrual method. Accordingly, we recorded deferred gains of approximately $3,900,000 related to the Ramoco sale at December 31, 2015. The deferred gain is recorded in accounts payable and accrued liabilities on our balance sheet at December 31, 2015.
Deferred Rent Receivable and Revenue Recognition: We earn rental income under operating and direct financing leases with tenants. Minimum lease payments from operating leases are recognized on a straight-line basis over the term of the leases. The cumulative difference between lease revenue recognized under this method and the contractual lease payment terms is recorded as deferred rent receivable on our consolidated balance sheets. We provide reserves for a portion of the recorded deferred rent receivable if circumstances indicate that it is not reasonable to assume that the tenant will make all of its contractual lease payments when due during the current term of the lease. We make estimates of the collectability of our accounts receivable related to revenue from rental properties. We analyze accounts receivable and historical bad debt levels, customer creditworthiness and current economic trends when evaluating the adequacy of the allowance for doubtful accounts. Additionally, with respect to tenants in bankruptcy, we estimate the expected recovery through bankruptcy claims and increase the allowance for amounts deemed uncollectible. If our assumptions regarding the collectability of accounts receivable prove incorrect, we could experience write-offs of the accounts receivable or deferred rent receivable in excess of our allowance for doubtful accounts. Lease termination fees are recognized as rental income
50
Table of Contents
when earned upon the termination of a tenant’s lease and relinquishment of space in which we have no further obligation to the tenant. The present value of the difference between the fair market rent and the contractual rent for above-market and below-market leases at the time properties are acquired is amortized into revenue from rental properties over the remaining terms of the in-place leases.
Direct Financing Leases: Income under direct financing leases is included in revenues from rental properties and is recognized over the lease terms using the effective interest rate method which produces a constant periodic rate of return on the net investments in the leased properties. The investments in direct financing leases are increased for interest income earned and amortized over the life of the leases and reduced by the receipt of lease payments. We consider direct financing leases to be past-due or delinquent when a contractually required payment is not remitted in accordance with the provisions of the underlying agreement. We evaluate each account individually and set up an allowance when, based upon current information and events, it is probable that we will be unable to collect all amounts due according to the existing contractual terms, and the amount can be reasonably estimated.
We review our direct financing leases at least annually to determine whether there has been an-other-than-temporary decline in the current estimate of residual value of the property. The residual value is our estimate of what we could realize upon the sale of the property at the end of the lease term, based on market information and third-party estimates where available. If this review indicates that a decline in residual value has occurred that is other-than-temporary, we recognize an impairment charge. There were no impairments of any of our direct financing leases during the years ended December 31, 2015, 2014 and 2013.
When we enter into a contract to sell properties that are recorded as direct financing leases, we evaluate whether we believe it is probable that the disposition will occur. If we determine that the disposition is probable and therefore the property’s holding period is reduced, we record an allowance for credit losses to reflect the change in the estimate of the undiscounted future rents. Accordingly, the net investment balance is written down to fair value.
Cash and Cash Equivalents: We consider highly liquid investments purchased with an original maturity of three months or less to be cash equivalents. Our cash and cash equivalents are held in the custody of several financial institutions, and these balances, at times, exceed federally insurable limits.
Restricted Cash: Restricted cash consists of cash that is contractually restricted or held in escrow pursuant to various agreements with counterparties. At December 31, 2015, restricted cash of $409,000 consisted of an escrow account established to guarantee our environmental remediation obligations at several of our properties. At December 31, 2014, restricted cash of $713,000 consisted of $463,000 for an escrow account established to guarantee our environmental remediation obligations at several of our properties and $250,000 for tax withholdings related to a property acquisition.
Notes and Mortgages Receivable: Notes and mortgages receivable consists of loans originated by us in conjunction with property dispositions and funding provided to tenants in conjunction with property acquisitions. Notes and mortgages receivable are recorded at stated principal amounts. We evaluate the collectability of both interest and principal on each loan to determine whether it is impaired. A loan is considered to be impaired when, based upon current information and events, it is probable that we will be unable to collect all amounts due under the existing contractual terms. When a loan is considered to be impaired, the amount of loss is calculated by comparing the recorded investment to the fair value determined by discounting the expected future cash flows at the loan’s effective interest rate or to the fair value of the underlying collateral, if the loan is collateralized. Interest income on performing loans is accrued as earned. Interest income on impaired loans is recognized on a cash basis. We do not provide for an additional allowance for loan losses based on the grouping of loans as we believe the characteristics of the loans are not sufficiently similar to allow an evaluation of these loans as a group for a possible loan loss allowance. As such, all of our loans are evaluated individually for impairment purposes.
Environmental Remediation Obligations: We record the fair value of a liability for an environmental remediation obligation as an asset and liability when there is a legal obligation associated with the retirement of a tangible long-lived asset and the liability can be reasonably estimated. Environmental remediation obligations are estimated based on the level and impact of contamination at each property. The accrued liability is the aggregate of the best estimate of the fair value of cost for each component of the liability. The accrued liability is net of recoveries of environmental costs from state UST remediation funds with respect to both past and future environmental spending based on estimated recovery rates developed from prior experience with the funds. Net environmental liabilities are currently measured based on their expected future cash flows which have been adjusted for inflation and discounted to present value. We accrue for environmental liabilities that we believe are allocable to other potentially responsible parties if it becomes probable that the other parties will not pay their environmental remediation obligations.
Litigation: Legal fees related to litigation are expensed as legal services are performed. We provide for litigation accruals, including certain litigation related to environmental matters, when it is probable that a liability has been incurred and a reasonable estimate of the liability can be made. If the estimate of the liability can only be identified as a range, and no amount within the range is a better estimate than any other amount, the minimum of the range is accrued for the liability. We accrue our share of environmental litigation liabilities based on our assumptions of the ultimate allocation method and share that will be used when determining our share of responsibility.
Income Taxes: We and our subsidiaries file a consolidated federal income tax return. Effective January 1, 2001, we elected to qualify, and believe we are operating so as to qualify, as a REIT for federal income tax purposes. Accordingly, we generally will not
51
Table of Contents
be subject to federal income tax on qualifying REIT income, provided that distributions to our shareholders equal at least the amount of our taxable income as defined under the Internal Revenue Code. We accrue for uncertain tax matters when appropriate. The accrual for uncertain tax positions is adjusted as circumstances change and as the uncertainties become more clearly defined, such as when audits are settled or exposures expire. Tax returns for the years 2012, 2013 and 2014, and tax returns which will be filed for the year ended 2015, remain open to examination by federal and state tax jurisdictions under the respective statute of limitations.
Earnings per Common Share: Basic earnings per common share gives effect, utilizing the two-class method, to the potential dilution from the issuance of common shares in settlement of restricted stock units (“RSU” or “RSUs”) which provide for non-forfeitable dividend equivalents equal to the dividends declared per common share. Basic earnings per common share is computed by dividing net earnings less dividend equivalents attributable to RSUs by the weighted-average number of common shares outstanding during the year. Diluted earnings per common share, also gives effect to the potential dilution from the exercise of stock options utilizing the treasury stock method. There were 5,000 stock options excluded from the earnings per share calculations below as they were anti-dilutive as of December 31, 2015, 2014 and 2013, respectively.
| Year ended December 31, | ||||||||||||
| (in thousands): | 2015 | 2014 | 2013 | |||||||||
| Earnings from continuing operations |
$ | 40,370 | $ | 20,405 | $ | 27,376 | ||||||
| Less dividend equivalents attributable to RSUs outstanding |
(460 | ) | (341 | ) | (252 | ) | ||||||
|
|
|
|
|
|
|
|||||||
| Earnings from continuing operations attributable to common shareholders |
39,910 | 20,064 | 27,124 | |||||||||
|
|
|
|
|
|
|
|||||||
| (Loss) earnings from discontinued operations |
(2,960 | ) | 3,013 | 42,635 | ||||||||
| Less dividend equivalents attributable to RSUs outstanding |
— | (50 | ) | (392 | ) | |||||||
|
|
|
|
|
|
|
|||||||
| (Loss) earnings from discontinued operations attributable to common shareholders |
(2,960 | ) | 2,963 | 42,243 | ||||||||
|
|
|
|
|
|
|
|||||||
| Net earnings attributable to common shareholders used for basic and diluted earnings per share calculation |
$ | 36,950 | $ | 23,027 | $ | 69,367 | ||||||
|
|
|
|
|
|
|
|||||||
| Weighted average common shares outstanding: |
||||||||||||
| Basic and diluted |
33,420 | 33,409 | 33,397 | |||||||||
|
|
|
|
|
|
|
|||||||
| RSUs outstanding at the end of the period |
400 | 333 | 296 | |||||||||
|
|
|
|
|
|
|
|||||||
Stock-Based Compensation: Compensation cost for our stock-based compensation plans using the fair value method was $1,090,000, $917,000 and $971,000 for the years ended December 31, 2015, 2014 and 2013, respectively, and is included in general and administrative expenses in the accompanying consolidated statements of operations.
Reclassifications: Certain amounts related to discontinued operations for 2014 and 2013 have been reclassified to continuing operations to account for the reclassification of one property from held for sale to held for use.
Dividends: For the year ended December 31, 2015, we paid cash dividends of $35,150,000 or $1.04 per share (which consisted of $30,425,000 or $0.90 per share of regular quarterly cash dividends and a $4,725,000 or $0.14 per share special cash dividend). For the year ended December 31, 2014, we paid cash dividends of $28,675,000 or $0.85 per share (which consisted of $26,990,000 or $0.80 per share of regular quarterly cash dividends and a $1,685,000 or $0.05 per share special cash dividend).
Out-of-Period Adjustments: We corrected a misstatement in our recording of prepaid real estate taxes and real estate tax expense for the year ended 2013, which decreased our net earnings by $420,000 during the quarter ended March 31, 2014. We concluded that this adjustment was not material to our results for this or any of the prior periods.
During the fourth quarter of 2015, we identified an error in the September 30, 2015 interim consolidated financial statements related to the calculation of Impairment of Long-Lived Assets, whereby we overstated non-cash impairment charges from continuing operations and from discontinued operations by $613,000 and $401,000, respectively. This resulted in an understatement of net earnings by $1,014,000. The error reduced third quarter earnings per share by $0.03. We evaluated the impact on the previously issued consolidated financial statements and current consolidated financial statements
52
Table of Contents
and concluded that the error was not material. We recorded an out-of-period adjustment to correct the error which resulted in an increase our net earnings by $1,014,000 for non-cash impairment adjustment and an increase to earnings per share of $0.03 for the quarter ended December 31, 2015. The interim consolidated financial statements as of and for the three months ended March 31, 2015 and June 30, 2015, were not impacted by these adjustments.
2. LEASES
As of December 31, 2015, we owned 753 properties and leased 98 properties from third-party landlords. Our 851 properties are located in 23 states across the United States and Washington, D.C. Substantially all of our properties are leased on a triple-net basis primarily to petroleum distributors and, to a lesser extent, to individual operators. Generally our tenants supply fuel and either operate our properties directly or sublet our properties to operators who operate their convenience stores, gasoline stations, automotive repair service facilities or other businesses at our properties. Our triple-net tenants are responsible for the payment of all taxes, maintenance, repairs, insurance and other operating expenses relating to our properties, and are also responsible for environmental contamination occurring during the terms of their leases and in certain cases also for environmental contamination that existed before their leases commenced. See Note 5 for additional information regarding environmental obligations. Substantially all of our tenants’ financial results depend on the sale of refined petroleum products and, to a lesser extent, convenience store sales or rental income from their subtenants. As a result, our tenants’ financial results are highly dependent on the performance of the petroleum marketing industry, which is highly competitive and subject to volatility. During the terms of our leases, we monitor the credit quality of our triple-net tenants by reviewing their published credit rating, if available, reviewing publicly available financial statements, or reviewing financial or other operating statements which are delivered to us pursuant to applicable lease agreements, monitoring news reports regarding our tenants and their respective businesses, and monitoring the timeliness of lease payments and the performance of other financial covenants under their leases.
Revenues from rental properties included in continuing operations for the years ended December 31, 2015, 2014 and 2013 were $107,035,000, $96,748,000 and $96,295,000, respectively. Rental income contractually due or received from our tenants included in revenues from rental properties in continuing operations was $88,358,000, $77,720,000 and $72,990,000 for the years ended December 31, 2015, 2014 and 2013, respectively. “Pass-through” real estate taxes and other municipal charges paid by us which were reimbursable by our tenants pursuant to the terms of triple-net lease agreements included in revenues from rental properties and property costs in continuing operations totaled $14,146,000, $13,777,000 and $15,405,000 for the years ended December 31, 2015, 2014 and 2013, respectively. Total revenues for the year ended December 31, 2013 included $3,126,000 of other revenue recorded for the partial recovery of damages stemming from Marketing’s default of its obligations under the Master Lease (as described in more detail below).
In accordance with GAAP, we recognize rental revenue in amounts which vary from the amount of rent contractually due or received during the periods presented. As a result, revenues from rental properties include non-cash adjustments recorded for deferred rental revenue due to the recognition of rental income on a straight-line (or average) basis over the current lease term, the net amortization of above-market and below-market leases, rental income recorded under direct financing leases using the effective interest method which produces a constant periodic rate of return on the net investments in the leased properties and the amortization of deferred lease incentives (the “Revenue Recognition Adjustments”). Revenue Recognition Adjustments included in revenues from rental properties in continuing operations were $4,531,000, $5,251,000 and $7,900,000 for the years ended December 2015, 2014 and 2013, respectively. We provide reserves for a portion of the recorded deferred rent receivable if circumstances indicate that a tenant will not make all of its contractual lease payments during the current lease term. Our assessments and assumptions regarding the recoverability of the deferred rent receivable are reviewed on an ongoing basis and such assessments and assumptions are subject to change.
The components of the $94,098,000 net investment in direct financing leases as of December 31, 2015 are minimum lease payments receivable of $179,372,000 plus unguaranteed estimated residual value of $13,979,000 less unearned income of $99,253,000. The components of the $95,764,000 net investment in direct financing leases as of December 31, 2014 are minimum lease payments receivable of $191,491,000 plus unguaranteed estimated residual value of $13,979,000 less unearned income of $109,706,000.
Future contractual minimum annual rentals receivable from our tenants, which have terms in excess of one year as of December 31, 2015, are as follows (in thousands):
| YEAR ENDING DECEMBER 31, |
OPERATING LEASES | DIRECT FINANCING LEASES |
TOTAL | |||||||||
| 2016 |
$ | 79,520 | $ | 12,308 | $ | 91,828 | ||||||
| 2017 |
79,582 | 12,623 | 92,205 | |||||||||
| 2018 |
78,965 | 12,871 | 91,836 | |||||||||
| 2019 |
78,620 | 13,079 | 91,699 | |||||||||
| 2020 |
74,070 | 13,375 | 87,445 | |||||||||
| Thereafter |
628,673 | 115,116 | 743,789 | |||||||||
53
Table of Contents
We have obligations to lessors under non-cancelable operating leases which have terms in excess of one year, principally for convenience stores and gasoline stations. The leased properties have a remaining lease term averaging approximately 11 years, including renewal options. Future minimum annual rentals payable under such leases, excluding renewal options, are as follows: 2016 — $6,219,000, 2017 — $5,064,000, 2018 — $4,038,000, 2019 — $3,026,000, 2020 — $1,873,000 and $6,248,000 thereafter.
Rent expense, substantially all of which consists of minimum rentals on non-cancelable operating leases, amounted to $5,918,000, $6,088,000 and $7,092,000 for the years ended December 31, 2015, 2014 and 2013, respectively, and is included in property costs using the straight-line method. Rent received under subleases for the years ended December 31, 2015, 2014 and 2013 was $9,653,000, $10,358,000 and $10,715,000, respectively.
Marketing and the Master Lease
Approximately 400 of the properties we own or lease as of December 31, 2015 were previously leased to Getty Petroleum Marketing Inc. (“Marketing”) pursuant to a master lease (the “Master Lease”). In December 2011, Marketing filed for Chapter 11 bankruptcy protection in the U.S. Bankruptcy Court. The Master Lease was terminated effective April 30, 2012, and in July 2012, the Bankruptcy Court approved Marketing’s Plan of Liquidation and appointed a trustee (the “Liquidating Trustee”) to oversee liquidation of the Marketing estate (the “Marketing Estate”).
In December 2011, the Marketing Estate filed a lawsuit (the “Lukoil Complaint”) against Marketing’s former parent, Lukoil Americas Corporation, and certain of its affiliates (collectively, “Lukoil”). In October 2012, we entered into an agreement with the Marketing Estate to make loans and otherwise fund up to an aggregate amount of $6,725,000 to prosecute the Lukoil Complaint and for certain other expenses incurred in connection with the wind-down of the Marketing Estate (the “Litigation Funding Agreement”). We ultimately advanced $6,526,000 in the aggregate to the Marketing Estate pursuant to the Litigation Funding Agreement. The Litigation Funding Agreement also provided that we were entitled to be reimbursed for up to $1,300,000 of our legal fees incurred in connection with the Litigation Funding Agreement.
On July 29, 2013, the Bankruptcy Court approved a settlement of the claims made in the Lukoil Complaint (the “Lukoil Settlement”). The terms of the Lukoil Settlement included a collective payment to the Marketing Estate of $93,000,000. In August 2013, the settlement payment was received by the Marketing Estate of which $25,096,000 was distributed to us pursuant to the Litigation Funding Agreement and $6,585,000 was distributed to us in full satisfaction of our post-petition priority claims related to the Master Lease.
Of the $25,096,000 received by us in the third quarter of 2013 pursuant to the Litigation Funding Agreement, $7,976,000 was applied to the advances made to the Marketing Estate plus accrued interest; $13,994,000 was applied to unpaid rent and real estate taxes due from Marketing and the related bad debt reserve was reversed in full; and the remainder of $3,126,000 attributed to the partial recovery of damages resulting from Marketing’s default of its obligations under the Master Lease and is reflected in continuing operations in our consolidated statements of operations as other revenue.
In accordance with GAAP, we recognized in revenue from rental properties in our consolidated statements of operations the full contractual rent and real estate obligations due to us by Marketing during the term of the Master Lease and provided bad debt reserves included in allowance for uncollectible accounts and in earnings (loss) from discontinued operations in our consolidated statements of operations for our estimate of uncollectible amounts due from Marketing. During the year ended December 31, 2013, we received $34,251,000 of funds from the Marketing Estate from our post-petition priority claims and the Lukoil Settlement thereby eliminating the previously provided reserves. The reduction in our bad debt reserve for uncollectible amounts due from Marketing for the year ended December 31, 2013 of $22,782,000 is reflected in our consolidated statements of operations by reducing allowance for uncollectible accounts in continuing operations by $16,963,000 and increasing earnings from operating activities included in discontinued operations by $5,819,000.
As part of Marketing’s bankruptcy proceeding, we maintained significant pre-petition and post-petition unsecured claims against Marketing. On March 3, 2015, we entered into a settlement agreement with the Liquidating Trustee of the Marketing Estate to resolve claims asserted by us in Marketing’s bankruptcy case (the “Settlement Agreement”). The Settlement Agreement was approved by an order of the U.S. Bankruptcy Court, and, on April 22, 2015, we received a distribution from the Marketing Estate of $6,800,000 on account of our general unsecured claims. The Settlement Agreement also resolved a dispute relating to the balance of payment due to us pursuant to the Litigation Funding Agreement. As a result, on April 22, 2015, we also received an additional distribution of $550,000 from the Marketing Estate in full resolution of the Litigation Funding Agreement dispute.
On October 19, 2015, the U.S. Bankruptcy Court entered a final decree closing the bankruptcy case of the Marketing Estate. As a result, on November 3, 2015, we received a final distribution from the Marketing Estate of approximately $10,800,000 on account of our general unsecured claims. We do not expect to receive any further distributions from the Marketing Estate.
54
Table of Contents
The $18,177,000 received from the Marketing Estate for the year ended December 31, 2015 is included in other income on our consolidated statements of operations.
Leasing Activities
As of December 31, 2015, we have entered into long-term triple-net leases with petroleum distributors for 15 separate property portfolios comprising approximately 360 properties in the aggregate that were previously leased to Marketing. The long-term triple-net leases with petroleum distributors are unitary triple-net lease agreements generally with an initial term of 15 to 20 years, and options for successive renewal terms of up to 20 years. Rent is scheduled to increase at varying intervals during both the initial and renewal terms of our leases. Several of the leases provide for additional rent based on the aggregate volume of fuel sold. In addition, the majority of the leases require the tenants to make capital expenditures at our properties substantially all of which are related to the replacement of USTs that are owned by our tenants. As of December 31, 2015, we have a remaining commitment to fund as much as $11,917,000 in the aggregate with our tenants for a portion of such capital expenditures within the next approximately five years. Our commitment provides us with the option to either reimburse our tenants, or to offset rent when these capital expenditures are made. This deferred expense is recognized on a straight-line basis as a reduction of rental revenue in our consolidated statements of operations over the terms of the various leases.
As part of the triple-net leases for properties previously leased to Marketing, we transferred title of the USTs to our tenants, and the obligation to pay for the retirement and decommissioning or removal of USTs at the end of their useful life or earlier if circumstances warranted was fully or partially transferred to our new tenants. We remain contingently liable for this obligation in the event that our tenants do not satisfy their responsibilities. Accordingly, through December 31, 2015, we removed $13,403,000 of asset retirement obligations and $10,672,000 of net asset retirement costs related to USTs from our balance sheet. The cumulative net amount of $2,731,000 is recorded as deferred rental revenue and will be recognized on a straight-line basis as additional revenues from rental properties over the terms of the various leases. We incurred $120,000, $60,000 and $365,000 of lease origination costs for the years ended December 31, 2015, 2014 and 2013, respectively, which deferred expense is recognized on a straight-line basis as amortization expense in our consolidated statements of operations over the terms of the various leases.
Month-to-Month License Agreements
As of December 31, 2015, 15 properties are subject to month-to-month license agreements, which allow the licensees (substantially all of whom were former tenants of Marketing) to occupy and use these properties as convenience stores, gasoline stations, automotive repair service facilities or other businesses. Our month-to-month license agreements differ from our triple-net lease arrangements in that, among other things, we receive monthly occupancy payments directly from the licensees while we remain responsible for certain costs associated with the properties. These month-to-month license agreements are intended as interim occupancy arrangements until these properties are sold or leased on a triple-net basis. Under our month-to-month license agreements we are responsible for the payment of certain operating expenses (such as maintenance, repairs and real estate taxes), certain environmental compliance costs and costs associated with any environmental remediation. We will continue to be responsible for such operating expenses and environmental costs until these properties are sold or leased on a triple-net basis, and under certain leases and agreements thereafter.
Major Tenants
As of December 31, 2015, we had three significant tenants by revenue:
| • | We leased 169 convenience store and gasoline station properties in three separate unitary leases to subsidiaries of Global Partners, LP (NYSE: GLP) (“Global Partners”). Two of these leases were assigned to subsidiaries of Global Partners in June 2015 by our former tenants, White Oak Petroleum, LLC and Big Apple Petroleum Realty, LLC (both affiliates of Capitol Petroleum Group, LLC). In the aggregate, our leases with subsidiaries of Global Partners represented 21% and 13% of our rental revenues for the years ended December 31, 2015 and 2014, respectively. All three of our leases with subsidiaries of Global Partners are guaranteed by the parent company. |
| • | We leased 84 convenience store and gasoline station properties pursuant to three separate unitary leases to subsidiaries of Chestnut Petroleum Dist. Inc (“Chestnut Petroleum”). In the aggregate, our leases with subsidiaries of Chestnut Petroleum represented 16% and 19% of our rental revenues for the years ended December 31, 2015 and 2014, respectively. The largest of these unitary leases, accounting for 57 of our properties, is guaranteed by the parent company, its principals and numerous Chestnut Petroleum affiliates. |
| • | We leased 77 convenience store and gasoline station properties pursuant to three separate unitary leases to Apro, LLC (d/b/a “United Oil”). In the aggregate, our leases with United Oil represented 9% of our rental revenues for the year ended December 31, 2015. See Note 10 for additional information regarding the United Oil Transaction. See Item 9B in this Annual Report on Form 10-K for selected combined audited financial data of United Oil. |
55
Table of Contents
NECG Lease Restructuring
On May 1, 2012, we entered into a lease with NECG Holdings Corp (“NECG”) covering 84 properties in Connecticut, Massachusetts and Rhode Island (the “NECG Lease”). Eviction proceedings against a holdover group of former subtenants who continued to occupy properties subject to the NECG Lease had a material adverse impact on NECG’s operations and profitability. On January 27, 2015, the Connecticut Supreme Court, in a written opinion, affirmed the Superior Court rulings in favor of NECG and us. As a result, we or NECG have regained possession of all of the locations that were still subject to appeal.
We had previously entered into a lease modification agreement with NECG which deferred a portion of NECG’s rent due to us and allowed us to remove properties from the NECG Lease. As a result, as of September 30, 2015, there were 53 properties remaining in the NECG Lease.
During the fourth quarter of 2015, we severed 42 properties from the NECG Lease and re-leased these properties in three new or existing unitary leases. In addition, we severed and then sold three properties from the NECG Lease. The remaining eight properties continue to be leased to NECG with the understanding that the properties will be removed from the NECG Lease when we complete their repositioning.
As a result of the developments with NECG described above, the existing leases were either cancelled or modified such that the existing deferred rent receivable, which had been fully reserved, is no longer contractually due to us. Accordingly, as of December 31, 2015, we have completely written off the outstanding deferred rent receivable balance of $6,043,000. Allowances for deferred rent receivable reduce our net earnings, but do not impact our cash flow from operating activities. In addition, as of December 31, 2015, we have completely written off the entire accounts receivable balance related to the NECG Lease of $9,076,000.
3. COMMITMENTS AND CONTINGENCIES
Credit Risk
In order to minimize our exposure to credit risk associated with financial instruments, we place our temporary cash investments, if any, with high credit quality institutions. Temporary cash investments, if any, are currently held in an overnight bank time deposit with JPMorgan Chase Bank, N.A. and these balances, at times, exceed federally insurable limits.
Legal Proceedings
We are subject to various legal proceedings and claims which arise in the ordinary course of our business. As of December 31, 2015 and 2014, we had accrued $11,265,000 and $11,040,000, respectively, for certain of these matters which we believe were appropriate based on information then currently available. We have recorded provisions for litigation losses aggregating $374,000 and $130,000 for certain of these matters during the years ended December 31, 2015 and 2014, respectively. We are unable to estimate ranges in excess of the amount accrued with any certainty for these matters. It is possible that our assumptions regarding the ultimate allocation method and share of responsibility that we used to allocate environmental liabilities may change, which may result in our providing an accrual, or adjustments to the amounts recorded, for environmental litigation accruals. Matters related to our former Newark, New Jersey Terminal and the Lower Passaic River and MTBE litigations in the states of New Jersey and Pennsylvania, in particular, could cause a material adverse effect on our business, financial condition, results of operations, liquidity, ability to pay dividends or stock price.
Matters related to our former Newark, New Jersey Terminal and the Lower Passaic River
In September 2003, we received a directive (the “Directive”) issued by the New Jersey Department of Environmental Protection (“NJDEP”) under the New Jersey Spill Compensation and Control Act. The Directive indicated that we are one of approximately 66 potentially responsible parties for alleged natural resource damages resulting from the discharges of hazardous substances along the lower Passaic River (the “Lower Passaic River”). The Directive provides, among other things, that the named recipients must conduct an assessment of the natural resources that have been injured by discharges into the Lower Passaic River and must implement interim
56
Table of Contents
compensatory restoration for the injured natural resources. The NJDEP alleges that our liability arises from alleged discharges originating from our former Newark, New Jersey Terminal site (which was sold in October 2013). We responded to the Directive by asserting that we are not liable. There has been no material activity and/or communications by the NJDEP with respect to the Directive since early after its issuance.
In May 2007, the United States Environmental Protection Agency (“EPA”) entered into an Administrative Settlement Agreement and Order on Consent (“AOC”) with over 70 parties to perform a Remedial Investigation and Feasibility Study (“RI/FS”) for a 17 mile stretch of the Lower Passaic River in New Jersey. The RI/FS is intended to address the investigation and evaluation of alternative remedial actions with respect to alleged damages to the Lower Passaic River. Most of the parties to the AOC, including us, are also members of a Cooperating Parties Group (“CPG”). The CPG agreed to an interim allocation formula for purposes of allocating the costs to complete the RI/FS among its members, with the understanding that this agreed-upon allocation formula is not binding on the parties in terms of any potential liability for the costs to remediate the Lower Passaic River. The CPG submitted to the EPA its draft RI/FS in 2015. The draft RI/FS set forth various alternatives for remediating the entire 17 mile stretch of the Lower Passaic River, and provides that cost estimate for the preferred remedial action presented therein is in the range of approximately $483,000,000 to $725,000,000. The EPA is still evaluating the draft RI/FS report submitted by the CPG.
In addition to the RI/FS activities, other actions relating to the investigation and/or remediation of the Lower Passaic River have proceeded as follows. First, in June 2012, certain members of the CPG entered into an Administrative Settlement Agreement and Order on Consent (“10.9 AOC”) effective June 18, 2012 to perform certain remediation activities, including removal and capping of sediments at the river mile 10.9 area and certain testing. The EPA also issued a Unilateral Order to Occidental Chemical Corporation (“Occidental”) directing Occidental to participate and contribute to the cost of the river mile 10.9 work. Concurrent with the CPG’s work on the RI/FS, on April 11, 2014, the EPA issued a draft Focused Feasibility Study (“FFS”) with proposed remedial alternatives to remediate the lower 8-miles of the 17 mile stretch of the Lower Passaic River. The FFS was subject to public comments and objections, and on March 4, 2016, the EPA issued its Record of Decision (“ROD”) for the lower 8-miles selecting a remedy that would involve bank-to-bank dredging and installing an engineered cap with an estimated cost of $1,380,000,000. The company does not know how the EPA intends to implement the ROD, but anticipates that performance of the EPA’s selected remedy will be subject to future negotiations, potential enforcement proceedings and/or litigation, thus many uncertainties remain. The RI/FS, AOC and 10.9 AOC do not obligate us to fund or perform remedial action contemplated by either the ROD or RI/FS and do not resolve liability issues for remedial work or the restoration of or compensation for alleged natural resource damages to the Lower Passaic River, which are not known at this time. Our ultimate liability, if any, in the pending and possible future proceedings pertaining to the Lower Passaic River is uncertain and subject to numerous contingencies which cannot be predicted and the outcome of which are not yet known.
MTBE Litigation – State of New Jersey
We are defending against a lawsuit brought by various governmental agencies of the State of New Jersey, including the NJDEP alleging various theories of liability due to contamination of groundwater with methyl tertiary butyl ether (a fuel derived from methanol, commonly referred to as “MTBE”) involving multiple locations throughout the State of New Jersey (the “New Jersey MDL Proceedings”). The complaint names as defendants approximately 50 petroleum refiners, manufacturers, distributors and retailers of MTBE or gasoline containing MTBE. The State of New Jersey is seeking reimbursement of significant clean-up and remediation costs arising out of the alleged release of MTBE containing gasoline in the State of New Jersey and is asserting various natural resource damage claims as well as liability against the owners and operators of gasoline station properties from which the releases occurred. Several of the named defendants have already settled the case against them. These cases have been transferred to the United States District Court for the District of New Jersey for pre-trial proceedings and trial, although a trial date has not yet been set. We continue to engage in settlement negotiations and a dialogue with the plaintiff’s counsel to educate them on the unique role of the Company and our business as compared to other defendants in the litigation, and with respect to certain facts applicable to our activities and gasoline stations, and affirmative defenses available to us, which we believe have not been sufficiently developed in the proceedings. In addition, we are pursuing claims for reimbursement of monies expended in the defense and settlement of certain MTBE cases under pollution insurance policies previously obtained by us and Marketing and under which we believe we are entitled to coverage, however, we have not yet confirmed whether and to what extent such coverage may actually be available. Although the ultimate outcome of the New Jersey MDL Proceedings cannot be ascertained at this time, we believe it is probable that this litigation will be resolved in a manner that is unfavorable to us. We are unable to estimate the range of loss in excess of the amount accrued with certainty for the New Jersey MDL Proceedings as we do not believe that plaintiffs’ settlement proposal is realistic and there remains uncertainty as to the allegations in this case as they relate to us, our defenses to the claims, our rights to indemnification or contribution from other parties and the aggregate possible amount of damages for which we may be held liable. It is possible that losses related to the New Jersey MDL Proceedings in excess of the amounts accrued as of December 31, 2015 could cause a material adverse effect on our business, financial condition, results of operations, liquidity, ability to pay dividends or stock price.
57
Table of Contents
MTBE Litigation – State of Pennsylvania
On July 7, 2014, our subsidiary, Getty Properties Corp., was served with a complaint filed by the Commonwealth of Pennsylvania (the “State”) in the Court of Common Pleas, Philadelphia County relating to alleged statewide MTBE contamination in Pennsylvania (the “Complaint”).
The Complaint names us and more than 50 other defendants, including Exxon Mobil, various BP entities, Chevron, Citgo, Gulf, Lukoil Americas, Getty Petroleum Marketing Inc., Marathon, Hess, Shell Oil, Texaco, Valero, as well as other smaller petroleum refiners, manufacturers, distributors and retailers of MTBE or gasoline containing MTBE. The Complaint seeks compensation for natural resource damages and for injuries sustained as a result of “defendants’ unfair and deceptive trade practices and acts in the marketing of MTBE and gasoline containing MTBE.” The plaintiffs also seek to recover costs paid or incurred by the State to detect, treat and remediate MTBE from public and private water wells and groundwater. The plaintiffs assert causes of action against all defendants based on multiple theories, including strict liability – defective design; strict liability – failure to warn; public nuisance; negligence; trespass; and violation of consumer protection law.
The case was filed in the Court of Common Pleas, Philadelphia County, but was removed by defendants to the United States District Court for the Eastern District of Pennsylvania and then transferred to the United States District Court for the Southern District of New York so that it may be managed as part of the ongoing MTBE MDL. Plaintiffs have recently filed a Second Amended Complaint naming additional defendants and adding factual allegations intended to bolster their claims against the defendants. We have joined with other defendants in the filing of a motion to dismiss the claims against us. This motion is pending with the Court. We intend to defend vigorously the claims made against us. Our ultimate liability, if any, in this proceeding is uncertain and subject to numerous contingencies which cannot be predicted and the outcome of which are not yet known.
4. CREDIT AGREEMENT AND SENIOR UNSECURED NOTES
Debt Refinancing
As of December 31, 2014, we were a party to a $175,000,000 senior secured revolving credit agreement with a group of commercial banks led by JPMorgan Chase Bank, N.A. which was scheduled to mature in August 2015. As of December 31, 2014, borrowings under the credit agreement were $25,000,000 bearing interest at a rate of approximately 2.7%. On June 2, 2015, the borrowings then outstanding under such credit agreement were repaid with proceeds of the Credit Agreement (as defined below) and the prior credit agreement was terminated. In addition, as a result of entering into the Credit Agreement, mortgage liens and other security interests on certain of our properties and assets held by the prior bank group under our prior credit agreement were released.
Credit Agreement
On June 2, 2015, we entered into a $225,000,000 senior unsecured credit agreement (the “Credit Agreement”) with a group of banks led by Bank of America, N.A. (the “Bank Syndicate”). The Credit Agreement consists of a $175,000,000 revolving facility (the “Revolving Facility”), which is scheduled to mature in June 2018 and a $50,000,000 term loan (the “Term Loan”), which is scheduled to mature in June 2020. Subject to the terms of the Credit Agreement and our continued compliance with its provisions, we have the option to (a) extend the term of the Revolving Facility for one additional year to June 2019 and (b) increase by $75,000,000 the amount of the Revolving Facility to $250,000,000.
The Credit Agreement incurs interest and fees at various rates based on our net debt to EBITDA ratio (as defined in the Credit Agreement) at the end of each quarterly reporting period. The Revolving Facility permits borrowings at an interest rate equal to the sum of a base rate plus a margin of 0.95% to 2.25% or a LIBOR rate plus a margin of 1.95% to 3.25%. The annual commitment fee on the undrawn funds under the Revolving Facility is 0.25% to 0.30%. The Term Loan bears interest at a rate equal to the sum of a base rate plus a margin of 0.90% to 2.20% or a LIBOR rate plus a margin of 1.90% to 3.20%. The Credit Agreement does not provide for scheduled reductions in the principal balance prior to its maturity. As of December 31, 2015, borrowings under the Revolving Facility were $94,000,000 and borrowings under the Term Loan were $50,000,000 and, as of December 31, 2014, borrowings under our prior credit agreement were $25,000,000. The interest rate on Credit Agreement borrowings at December 31, 2015 was approximately 3.0% per annum.
The Credit Agreement contains customary financial covenants such as availability, leverage and coverage ratios and minimum tangible net worth, as well as limitations on restricted payments, which may limit our ability to incur additional debt or pay dividends. The Credit Agreement contains customary events of default, including cross default provisions under the Restated Prudential Note Purchase Agreement (as defined below), change of control and failure to maintain REIT status. Any event of default, if not cured or waived in a timely manner, would increase by 200 basis points (2.00%) the interest rate we pay under the Credit Agreement and prohibit us from drawing funds against the Credit Agreement and could result in the acceleration of our indebtedness under the Credit Agreement and could also give rise to an event of default and could result in the acceleration of our indebtedness under the Restated Prudential Note Purchase Agreement. We may be prohibited from drawing funds against the Revolving Facility if there is a material adverse effect on our business, assets, prospects or condition.
58
Table of Contents
Senior Unsecured Notes
On June 2, 2015, we entered into an amended and restated note purchase agreement (the “Restated Prudential Note Purchase Agreement”) amending and restating our existing senior secured note purchase agreement with The Prudential Insurance Company of America (“Prudential”) and an affiliate of Prudential. Pursuant to the Restated Prudential Note Purchase Agreement, Prudential and its affiliate released the mortgage liens and other security interests held by Prudential and its affiliate on certain of our properties and assets, redenominated the existing notes in the aggregate amount of $100,000,000 issued under the existing note purchase agreement as senior unsecured Series A Notes, and issued $75,000,000 of senior unsecured Series B Notes bearing interest at 5.35% and maturing in June 2023 to Prudential and certain affiliates of Prudential. The Series A Notes continue to bear interest at 6.0% and mature in February 2021. The Restated Prudential Note Purchase Agreement does not provide for scheduled reductions in the principal balance of either the Series A Notes or the Series B Notes prior to their respective maturities. As of December 31, 2015, borrowings under the Restated Prudential Note Purchase Agreement were $175,000,000 and, as of December 31, 2014, borrowings under the prior senior secured note purchase agreement were $100,000,000.
The Restated Prudential Note Purchase Agreement contains customary financial covenants such as leverage and coverage ratios and minimum tangible net worth, as well as limitations on restricted payments, which may limit our ability to incur additional debt or pay dividends. The Restated Prudential Note Purchase Agreement contains customary events of default, including default under the Credit Agreement and failure to maintain REIT status. Any event of default, if not cured or waived, would increase by 200 basis points (2.00%) the interest rate we pay under the Restated Prudential Note Purchase Agreement and could result in the acceleration of our indebtedness under the Restated Prudential Note Purchase Agreement and could also give rise to an event of default and could result in the acceleration of our indebtedness under our Credit Agreement.
As of December 31, 2015, we are in compliance with all of the material terms of the Credit Agreement and Restated Prudential Note Purchase Agreement, including the various financial covenants described above.
The maturity date and amounts outstanding under the Credit Agreement and the Restated Prudential Note Purchase Agreement are as follows:
| Maturity Date | Amount | |||||
| Credit Agreement - Revolving Facility |
June 2018 | $ | 94,000,000 | |||
| Credit Agreement - Term Loan |
June 2020 | $ | 50,000,000 | |||
| Restated Prudential Note Purchase Agreement - Series A Note |
February 2021 | $ | 100,000,000 | |||
| Restated Prudential Note Purchase Agreement - Series B Note |
June 2023 | $ | 75,000,000 | |||
As of December 31, 2015, the carrying value of the borrowings outstanding under the Credit Agreement approximated fair value, and the fair value of the borrowings under the Prudential Series A Notes and Series B Notes were $105,800,000 and $76,400,000, respectively. As of December 31, 2014, the carrying value of our prior credit agreement approximated fair value, and the fair value of borrowings outstanding under the Prudential Series A Notes was $106,527,000. The fair value of the borrowings outstanding as of December 31, 2015 and 2014 was determined using a discounted cash flow technique that incorporates a market interest yield curve with adjustments for duration, optionality, risk profile and projected average borrowings outstanding or borrowings outstanding, which are based on unobservable inputs within Level 3 of the Fair Value Hierarchy.
5. ENVIRONMENTAL OBLIGATIONS
We are subject to numerous federal, state and local laws and regulations, including matters relating to the protection of the environment such as the remediation of known contamination and the retirement and decommissioning or removal of long-lived assets including buildings containing hazardous materials, USTs and other equipment. Environmental costs are principally attributable to remediation costs which include removing USTs, excavation of contaminated soil and water, installing, operating, maintaining and decommissioning remediation systems, monitoring contamination and governmental agency compliance reporting incurred in connection with contaminated properties. We seek reimbursement from state UST remediation funds related to these environmental costs where available. In July 2012, we purchased a ten-year pollution legal liability insurance policy covering all of our properties for preexisting unknown environmental liabilities and new environmental events. The policy has a $50,000,000 aggregate limit and is subject to various self-insured retentions and other conditions and limitations. Our intention in purchasing this policy is to obtain protection predominantly for significant events. No assurances can be given that we will obtain a net financial benefit from this investment.
59
Table of Contents
The estimated future costs for known environmental remediation requirements are accrued when it is probable that a liability has been incurred and a reasonable estimate of fair value can be made. The accrued liability is the aggregate of the best estimate of the fair value of cost for each component of the liability net of estimated recoveries from state UST remediation funds considering estimated recovery rates developed from prior experience with the funds.
We enter into leases and various other agreements which contractually allocate responsibility between the parties for known and unknown environmental liabilities at or relating to the subject properties. We are contingently liable for these environmental obligations in the event that our counterparty to the lease or other agreement does not satisfy them. It is possible that our assumptions regarding the ultimate allocation method and share of responsibility that we used to allocate environmental liabilities may change, which may result in material adjustments to the amounts recorded for environmental litigation accruals and environmental remediation liabilities. We are required to accrue for environmental liabilities that we believe are allocable to others under leases and other agreements if we determine that it is probable that our counterparty will not meet its environmental obligations. We may ultimately be responsible to pay for environmental liabilities as the property owner if our counterparty fails to pay them. We assess whether to accrue for environmental liabilities based upon relevant factors including our tenants’ histories of paying for such obligations, our assessment of their financial ability, and their intent to pay for such obligations. However, there can be no assurance that our assessments are correct or that our tenants who have paid their obligations in the past will continue to do so. The ultimate resolution of these matters could cause a material adverse effect on our business, financial condition, results of operations, liquidity, ability to pay dividends or stock price.
For all of our triple-net leases, our tenants are contractually responsible for compliance with environmental laws and regulations, removal of USTs at the end of their lease term and remediation of any environmental contamination that arises during the term of their tenancy. Under the terms of our leases covering properties previously leased to Marketing (substantially all of which commenced in 2012), we have agreed to be responsible for environmental contamination at the premises that was known at the time the lease commenced, and which existed prior to commencement of the lease and is discovered (other than as a result of a voluntary site investigation) during the first ten years of the lease term (or a shorter period for a minority of such leases). After expiration of such ten year (or, in certain cases, shorter) period, responsibility for all newly discovered contamination, even if it relates to periods prior to commencement of the lease, is contractually allocated to our tenant. Our tenants at properties previously leased to Marketing are in all cases responsible for the cost of any remediation of contamination that results from their use and occupancy of our properties. Under substantially all of our other triple-net leases, responsibility for remediation of all environmental contamination discovered during the term of the lease (including known and unknown contamination that existed prior to commencement of the lease) is the responsibility of our tenant.
We anticipate that a majority of the USTs at properties previously leased to Marketing will be replaced over the next decade because these USTs are either at or near the end of their useful lives. For long-term, triple-net leases covering sites previously leased to Marketing, our tenants are responsible for the cost of removal and replacement of USTs and for remediation of contamination found during such UST removal and replacement, unless such contamination was found during the first ten years of the lease term and also existed prior to commencement of the lease. In those cases, we are responsible for costs associated with the remediation of such contamination. For our transitional properties occupied under month-to-month license agreements, or which are vacant, we are responsible for costs associated with UST removals and for the cost of remediation of contamination found during the removal of USTs. We have also agreed to be responsible for environmental contamination that existed prior to the sale of certain properties assuming the contamination is discovered (other than as a result of a voluntary site investigation) during the first five years after the sale of the properties.
After the termination of the Master Lease, we commenced a process to take control of our properties and to reposition them. A substantial portion of these properties had USTs which were either at or near the end of their useful lives. For properties that we sold, we elected to remove certain of these USTs and in the course of re-leasing properties, we made lease concessions to reimburse our tenants at operating gasoline stations for certain capital expenditures including UST replacements. In the course of these UST removals and replacements, previously unknown environmental contamination has been and continues to be discovered. As a result of these developments, we began to assess our prospective future environmental liability resulting from preexisting unknown environmental contamination which we believe may be discovered during removal and replacement of USTs at properties previously leased to Marketing in the future.
We have developed a reasonable estimate of fair value for the prospective future environmental liability resulting from preexisting unknown environmental contamination and accrued for these estimated costs. These estimates are based primarily upon quantifiable trends, which we believe allow us to make reasonable estimates of fair value for the future costs of environmental remediation resulting from the removal and replacement of USTs. Our accrual of the additional liability represents the best estimate of the fair value of cost for each component of the liability, net of estimated recoveries from state UST remediation funds, considering estimated recovery rates developed from prior experience with the funds. In arriving at our accrual, we analyzed the ages of USTs at properties where we would be responsible for preexisting contamination found within ten years after commencement of a lease (for properties subject to long-term triple-net leases) or five years from a sale (for divested properties), and projected a cost to closure for new environmental contamination. Based on these estimates, along with relevant economic and risk factors, at December 31, 2015 and 2014, we have accrued $45,443,000 and $49,700,000, respectively, for these future environmental liabilities related to preexisting unknown contamination. Our estimates
60
Table of Contents
are based upon facts that are known to us at this time and an assessment of the possible ultimate remedial action outcomes. It is possible that our assumptions, which form the basis of our estimates, regarding our ultimate environmental liabilities may change, which may result in our providing an accrual, or adjustments to the amounts recorded, for environmental remediation liabilities. Among the many uncertainties that impact the estimates are our assumptions, the necessary regulatory approvals for, and potential modifications of remediation plans, the amount of data available upon initial assessment of contamination, changes in costs associated with environmental remediation services and equipment, the availability of state UST remediation funds and the possibility of existing legal claims giving rise to additional claims. Additional environmental liabilities could cause a material adverse effect on our business, financial condition, results of operations, liquidity, ability to pay dividends or stock price.
Environmental exposures are difficult to assess and estimate for numerous reasons, including the extent of contamination, alternative treatment methods that may be applied, location of the property which subjects it to differing local laws and regulations and their interpretations, as well as the time it takes to remediate contamination and receive regulatory approval. In developing our liability for estimated environmental remediation obligations on a property by property basis, we consider among other things, enacted laws and regulations, assessments of contamination and surrounding geology, quality of information available, currently available technologies for treatment, alternative methods of remediation and prior experience. Environmental accruals are based on estimates which are subject to significant change, and are adjusted as the remediation treatment progresses, as circumstances change and as environmental contingencies become more clearly defined and reasonably estimable. We expect to adjust the accrued liabilities for environmental remediation obligations reflected in our consolidated financial statements as they become probable and a reasonable estimate of fair value can be made.
We measure our environmental remediation liability at fair value based on expected future net cash flows, adjusted for inflation (using a range of 2.0% to 2.75%), and then discount them to present value (using a range of 4.0% to 7.0%). We adjust our environmental remediation liability quarterly to reflect changes in projected expenditures, changes in present value due to the passage of time and reductions in estimated liabilities as a result of actual expenditures incurred during each quarter. As of December 31, 2015, we had accrued a total of $84,345,000 for our prospective environmental remediation liability. This accrual includes (a) $38,902,000, which was our best estimate of reasonably estimable environmental remediation obligations and obligations to remove USTs for which we are the title owner, net of estimated recoveries and (b) $45,443,000 for future environmental liabilities related to preexisting unknown contamination. As of December 31, 2014, we had accrued a total of $91,566,000 for our prospective environmental remediation liability. This accrual includes (a) $41,866,000, which was our best estimate of reasonably estimable environmental remediation obligations and obligations to remove USTs for which we are the title owner, net of estimated recoveries and (b) $49,700,000 for future environmental liabilities related to preexisting unknown contamination.
Environmental liabilities are accreted for the change in present value due to the passage of time and, accordingly, $4,829,000, $3,046,000 and $3,214,000 of net accretion expense was recorded for the years ended December 31, 2015, 2014 and 2013, respectively, which is included in environmental expenses. In addition, during the years ended December 31, 2015, 2014 and 2013, we recorded credits to environmental expenses included in continuing operations and to earnings from operating activities in discontinued operations aggregating $4,639,000, $2,756,000 and $2,956,000, respectively, where decreases in estimated remediation costs exceeded the depreciated carrying value of previously capitalized asset retirement costs. Environmental expenses also include project management fees, legal fees and provisions for environmental litigation losses.
During the years ended December 31, 2015 and 2014, we increased the carrying value of certain of our properties by $12,285,000 and $62,543,000 (consisting of $12,843,000 of known environmental liabilities and $49,700,000 for future environmental liabilities), respectively, due to increases in estimated environmental remediation costs. The recognition and subsequent changes in estimates in environmental liabilities and the increase or decrease in carrying value of the properties are non-cash transactions which do not appear on the face of the consolidated statements of cash flows. We recorded non-cash impairment charges aggregating $12,548,000 (consisting of $10,398,000 for known environmental liabilities and $2,150,000 for reserves for future environmental liabilities) and $16,894,000 (consisting of $8,575,000 for known environmental liabilities and $8,319,000 for reserves for future environmental liabilities) for the years ended December 31, 2015 and 2014, respectively, in continuing operations and in discontinued operations for capitalized asset retirement costs. Capitalized asset retirement costs are being depreciated over the estimated remaining life of the UST, a ten year period if the increase in carrying value is related to environmental remediation obligations or such shorter period if circumstances warrant, such as the remaining lease term for properties we lease from others. Depreciation and amortization expense included in continuing operations and earnings from discontinued operations in our consolidated statements of operations for the years ended December 31, 2015, 2014 and 2013 included $5,997,000, $1,560,000 and $2,009,000, respectively, of depreciation related to capitalized asset retirement costs. Capitalized asset retirement costs were $51,393,000 (consisting of $20,939,000 of known environmental liabilities and $30,454,000 of reserves for future environmental liabilities) and $59,809,000 (consisting of $18,428,000 of known environmental liabilities and $41,381,000 of reserves for future environmental liabilities) as of December 31, 2015 and 2014, respectively.
As part of the triple-net leases for properties previously leased to Marketing, we transferred title of the USTs to our tenants, and the obligation to pay for the retirement and decommissioning or removal of USTs at the end of their useful life or earlier if circumstances warranted was fully or partially transferred to our new tenants. We remain contingently liable for this obligation in the event that our tenants do not satisfy their responsibilities. Accordingly, through December 31, 2015, we removed $13,403,000 of asset
61
Table of Contents
retirement obligations and $10,672,000 of net asset retirement costs related to USTs from our balance sheet. The cumulative net amount of $2,731,000 is recorded as deferred rental revenue and will be recognized on a straight-line basis as additional revenues from rental properties over the terms of the various leases. See Note 2 for additional information.
We cannot predict what environmental legislation or regulations may be enacted in the future or how existing laws or regulations will be administered or interpreted with respect to products or activities to which they have not previously been applied. We cannot predict if state UST fund programs will be administered and funded in the future in a manner that is consistent with past practices and if future environmental spending will continue to be eligible for reimbursement at historical recovery rates under these programs. Compliance with more stringent laws or regulations, as well as more vigorous enforcement policies of the regulatory agencies or stricter interpretation of existing laws, which may develop in the future, could have an adverse effect on our financial position, or that of our tenants, and could require substantial additional expenditures for future remediation.
In light of the uncertainties associated with environmental expenditure contingencies, we are unable to estimate ranges in excess of the amount accrued with any certainty; however, we believe it is possible that the fair value of future actual net expenditures could be substantially higher than amounts currently recorded by us. Adjustments to accrued liabilities for environmental remediation obligations will be reflected in our consolidated financial statements as they become probable and a reasonable estimate of fair value can be made. Future environmental expenses could cause a material adverse effect on our business, financial condition, results of operations, liquidity, ability to pay dividends or stock price.
6. INCOME TAXES
Net cash paid for income taxes for the years ended December 31, 2015, 2014 and 2013 of $341,000, $316,000 and $173,000, respectively, includes amounts related to state and local income taxes for jurisdictions that do not follow the federal tax rules, which are provided for in property costs in our consolidated statements of operations.
Earnings and profits (as defined in the Internal Revenue Code) are used to determine the tax attributes of dividends paid to stockholders and will differ from income reported for consolidated financial statements purposes due to the effect of items which are reported for income tax purposes in years different from that in which they are recorded for consolidated financial statements purposes. The federal tax attributes of the common dividends for the years ended December 31, 2015, 2014 and 2013 were: ordinary income of 83.8%, 43.9% and 94.4%, capital gain distributions of 16.2%, 56.1% and 5.6% and non-taxable distributions of 0.0%, 0.0% and 0.0%, respectively.
To qualify for taxation as a REIT, we, among other requirements such as those related to the composition of our assets and gross income, must distribute annually to our stockholders at least 90% of our taxable income, including taxable income that is accrued by us without a corresponding receipt of cash. We cannot provide any assurance that our cash flows will permit us to continue paying cash dividends. Should the Internal Revenue Service (“IRS”) successfully assert that our earnings and profits were greater than the amount distributed, we may fail to qualify as a REIT; however, we may avoid losing our REIT status by paying a deficiency dividend to eliminate any remaining earnings and profits. We may have to borrow money or sell assets to pay such a deficiency dividend. Although tax returns for the years 2012, 2013 and 2014, and tax returns which will be filed for the year ended 2015, remain open to examination by federal and state tax jurisdictions under the respective statute of limitations, we have not currently identified any uncertain tax positions related to those years and, accordingly, have not accrued for uncertain tax positions as of December 31, 2015 or 2014. However, uncertain tax matters may have a significant impact on the results of operations for any single fiscal year or interim period.
The IRS has allowed the use of a procedure, as a result of which we could satisfy the REIT income distribution requirement by making a distribution on our common stock comprised of (i) shares of our common stock having a value of up to 80% of the total distribution and (ii) cash in the remaining amount of the total distribution, in lieu of paying the distribution entirely in cash. In January 2015, we received a private letter ruling from the IRS that allows us to use such a procedure.
On November 25, 2015, our Board of Directors declared a special dividend of $0.22 per share (the “Special Dividend”). The Special Dividend was payable in either common stock or cash. The aggregate amount of cash to be distributed by the Company was a minimum of 20% of the total distribution and a maximum of 40% of the total distribution, with the remainder to be paid in shares of common stock. As result, we issued 255,340 shares of common stock and made cash payments aggregating $2,941,000 to our shareholders.
In the third quarter of 2013, we submitted to the IRS a request seeking a ruling that a portion of the payments we received from the Marketing Estate, including amounts related to the Litigation Funding Agreement (see Note 2 for additional information regarding the Lukoil Settlement and the Litigation Funding Agreement), be treated either as qualifying income or excluded from gross income for the purposes of the REIT qualification gross income tests either as a matter of law or pursuant to the discretionary authority granted by Congress to the IRS to determine whether certain types of income are an outgrowth of a REIT’s business of owning and operating real estate. In January 2014, we received a favorable ruling from the IRS indicating that a portion of the payments received
62
Table of Contents
from the Marketing Estate will be treated as qualifying income and the remainder will be excluded from gross income for the purposes of the REIT qualification gross income tests. Therefore, none of the cash flow received from the Marketing Estate, including amounts related to the Litigation Funding Agreement, will be treated as non-qualifying income for purposes of the REIT qualification gross income tests. During 2015, we received distributions from Marketing Estate in the amount of $18,177,000, which will be treated as non-qualifying income for REIT qualification gross income tests.
7. SHAREHOLDERS’ EQUITY
A summary of the changes in shareholders’ equity for the years ended December 31, 2015, 2014 and 2013 is as follows (in thousands, except per share amounts):
| COMMON STOCK | PAID-IN | DIVIDENDS PAID IN EXCESS |
||||||||||||||||||
| SHARES | AMOUNT | CAPITAL | OF EARNINGS | TOTAL | ||||||||||||||||
| BALANCE, DECEMBER 31, 2012 |
33,397 | $ | 334 | $ | 461,426 | $ | (89,011 | ) | $ | 372,749 | ||||||||||
|
|
|
|
|
|
|
|
|
|
|
|||||||||||
| Net earnings |
70,011 | 70,011 | ||||||||||||||||||
| Dividends declared — $0.850 per share |
(28,640 | ) | (28,640 | ) | ||||||||||||||||
| Stock-based compensation |
— | — | 971 | — | 971 | |||||||||||||||
|
|
|
|
|
|
|
|
|
|
|
|||||||||||
| BALANCE, DECEMBER 31, 2013 |
33,397 | $ | 334 | $ | 462,397 | $ | (47,640 | ) | $ | 415,091 | ||||||||||
| Net earnings |
23,418 | 23,418 | ||||||||||||||||||
| Dividends declared — $0.960 per share |
(32,402 | ) | (32,402 | ) | ||||||||||||||||
| Stock-based compensation |
20 | — | 917 | — | 917 | |||||||||||||||
|
|
|
|
|
|
|
|
|
|
|
|||||||||||
| BALANCE, DECEMBER 31, 2014 |
33,417 | $ | 334 | $ | 463,314 | $ | (56,624 | ) | $ | 407,024 | ||||||||||
|
|
|
|
|
|
|
|
|
|
|
|||||||||||
| Net earnings |
37,410 | 37,410 | ||||||||||||||||||
| Dividends declared — $1.15 per share |
(38,897 | ) | (38,897 | ) | ||||||||||||||||
| Stock-based compensation |
5 | — | 1,024 | — | 1,024 | |||||||||||||||
|
|
|
|
|
|
|
|
|
|
|
|||||||||||
| BALANCE, DECEMBER 31, 2015 |
33,422 | $ | 334 | $ | 464,338 | $ | (58,111 | ) | $ | 406,561 | ||||||||||
|
|
|
|
|
|
|
|
|
|
|
|||||||||||
On March 1, 2015 our Board of Directors granted 79,250 restricted stock units to our employees under our 2004 Omnibus Incentive Compensation Plan.
We are authorized to issue 20,000,000 shares of preferred stock, par value $.01 per share, of which none were issued as of December 31, 2015, 2014 and 2013.
8. EMPLOYEE BENEFIT PLANS
The Getty Realty Corp. 2004 Omnibus Incentive Compensation Plan (the “2004 Plan”) provided for the grant of restricted stock, restricted stock units, performance awards, dividend equivalents, stock payments and stock awards to all employees and members of the Board of Directors. In May 2014, an Amended and Restated 2004 Omnibus Incentive Compensation Plan (the “Restated Plan”) was approved at our annual meeting of shareholders. The Restated Plan maintained the 2004 Plan’s authorization to grant awards with respect to an aggregate of 1,000,000 shares of common stock, and extended the term of 2004 Plan to May 2019. The Restated Plan increased the aggregate maximum number of shares of common stock that may be subject to awards granted during any calendar year to 100,000. The Restated Plan also included several updates to the 2004 Plan in order to comply with the current Internal Revenue Code.
In addition, in April 2012, the Compensation Committee of the Board of Directors adopted, for 2012 only, a performance-based incentive compensation feature to our compensation program for named executive officers (“NEOs”) and other executives. By adding this performance-based incentive compensation feature, the Compensation Committee intended to incentivize management’s efforts associated with achieving our business objectives and financial performance in 2012. To do so, the Compensation Committee approved a program under which certain NEOs and other executives would be eligible to receive restricted stock units (“RSUs”) (including dividend equivalents paid with respect to such RSUs) in 2013 contingent on the level of achievement of several financial performance goals in 2012 and on a subjective qualitative evaluation of the performance of the executive in 2012. Under the 2012 performance-based incentive compensation program, the RSUs that were granted, were granted on terms substantially consistent with the 2004 Plan, except for the relative vesting schedules: RSUs granted under the 2012 performance-based incentive compensation program vest on a cumulative basis, with the first 20% vesting occurring on May 1, 2013, and an additional 20% vesting on each May 1 thereafter, through May 1, 2017; while the traditional discretionary RSU awards vest on a cumulative basis ratably over a five-year
63
Table of Contents
period with the first 20% vesting occurring on the first anniversary of the date of the grant. In February 2013, the Compensation Committee granted a total of 35,000 RSUs to NEOs and other executives under the 2012 performance-based incentive compensation program. All such RSU grants include related dividend equivalents.
We awarded to employees and directors 79,250, 72,125 and 79,500 (including 35,000 RSUs issued under the 2012 performance-based incentive compensation program) RSUs and dividend equivalents in 2015, 2014 and 2013, respectively. RSUs granted before 2009 provide for settlement upon termination of employment with the Company or termination of service from the Board of Directors and RSUs granted in 2009 and thereafter upon the earlier of ten years after grant or termination. On the settlement date each vested RSU will have a value equal to one share of common stock and may be settled, at the sole discretion of the Compensation Committee, in cash or by the issuance of one share of common stock. The RSUs do not provide voting or other shareholder rights unless and until the RSU is settled for a share of common stock. The RSUs vest starting one year from the date of grant, on a cumulative basis at the annual rate of 20% of the total number of RSUs covered by the award. The dividend equivalents represent the value of the dividends paid per common share multiplied by the number of RSUs covered by the award. For the years ended December 31, 2015, 2014 and 2013, dividend equivalents aggregating approximately $464,000, $333,000 and $251,000, respectively, were charged against retained earnings when common stock dividends were declared.
The following is a schedule of the activity relating to RSUs outstanding:
| NUMBER OF RSUs OUTSTANDING |
FAIR VALUE | |||||||||||
| AMOUNT | AVERAGE PER RSU |
|||||||||||
| RSUs OUTSTANDING AT DECEMBER 31, 2012 |
216,350 | |||||||||||
| Granted |
79,500 | $ | 1,439,110 | $ | 18.10 | |||||||
|
|
|
|||||||||||
| RSUs OUTSTANDING AT DECEMBER 31, 2013 |
295,850 | |||||||||||
| Granted |
72,125 | $ | 1,386,000 | $ | 19.21 | |||||||
| Settled |
(19,550 | ) | $ | 360,000 | $ | 18.43 | ||||||
| Cancelled |
(15,900 | ) | $ | 293,000 | $ | 18.44 | ||||||
|
|
|
|||||||||||
| RSUs OUTSTANDING AT DECEMBER 31, 2014 |
332,525 | |||||||||||
| Granted |
79,250 | $ | 1,429,700 | $ | 18.04 | |||||||
| Settled |
(8,160 | ) | $ | 144,300 | $ | 17.68 | ||||||
| Cancelled |
(3,240 | ) | $ | 55,600 | $ | 17.16 | ||||||
|
|
|
|||||||||||
| RSUs OUTSTANDING AT DECEMBER 31, 2015 |
400,375 | |||||||||||
|
|
|
|||||||||||
The fair values of the RSUs were determined based on the closing market price of our stock on the date of grant. The fair value of the grants is recognized as compensation expense ratably over the five-year vesting period of the RSUs. Compensation expense related to RSUs for the years ended December 31, 2015, 2014 and 2013 was $1,083,000, $910,000 and $962,000, respectively, and is included in general and administrative expenses in our consolidated statements of operations. As of December 31, 2015, there was $2,172,000 of unrecognized compensation cost related to RSUs granted under the 2004 Plan and the 2012 performance-based incentive compensation program, which cost is expected to be recognized over a weighted average period of approximately three years. The aggregate intrinsic value of the 400,375 outstanding RSUs and the 202,344 vested RSUs as of December 31, 2015 was $6,866,000 and $3,470,000, respectively.
64
Table of Contents
The following is a schedule of the vesting activity relating to RSUs outstanding:
| NUMBER OF RSUs VESTED |
FAIR VALUE |
|||||||
| RSUs VESTED AT DECEMBER 31, 2012 |
93,225 | |||||||
| Vested |
42,910 | $ | 844,00 | |||||
|
|
|
|||||||
| RSUs VESTED AT DECEMBER 31, 2013 |
136,135 | |||||||
| Vested |
38,270 | $ | 697,000 | |||||
| Settled |
(19,550 | ) | $ | 360,000 | ||||
|
|
|
|||||||
| RSUs VESTED AT DECEMBER 31, 2014 |
154,855 | |||||||
| Vested |
55,649 | $ | 954,400 | |||||
| Settled |
(8,160 | ) | $ | 144,300 | ||||
|
|
|
|||||||
| RSUs VESTED AT DECEMBER 31, 2015 |
202,344 | |||||||
|
|
|
|||||||
We have a retirement and profit sharing plan with deferred 401(k) savings plan provisions (the “Retirement Plan”) for employees meeting certain service requirements and a supplemental plan for executives (the “Supplemental Plan”). Under the terms of these plans, the annual discretionary contributions to the plans are determined by the Compensation Committee of the Board of Directors.
Also, under the Retirement Plan, employees may make voluntary contributions and we have elected to match an amount equal to fifty percent of such contributions but in no event more than three percent of the employee’s eligible compensation. Under the Supplemental Plan, a participating executive may receive an amount equal to ten percent of eligible compensation, reduced by the amount of any contributions allocated to such executive under the Retirement Plan. Contributions, net of forfeitures, under the retirement plans approximated $284,000, $261,000 and $238,000 for the years ended December 31, 2015, 2014 and 2013, respectively. These amounts are included in general and administrative expenses in our consolidated statements of operations. During the year ended December 31, 2014, we distributed $2,690,000 from the Supplemental Plan to two former officers of the Company. There were no distributions from the Supplemental Plan for the years ended December 31, 2015 and 2013.
We have a stock option plan (the “Stock Option Plan”). Our authorization to grant options to purchase shares of our common stock under the Stock Option Plan has expired. As of December 31, 2015 and 2014, there were 5,000 options outstanding which were exercisable at $27.68 with an expiration date of May 15, 2017. As of December 31, 2015 and 2014, the 5,000 options outstanding had no intrinsic value.
9. QUARTERLY FINANCIAL DATA
The following is a summary of the quarterly results of operations for the years ended December 31, 2015 and 2014 (unaudited as to quarterly information) (in thousands, except per share amounts):
| THREE MONTHS ENDED | ||||||||||||||||
| YEAR ENDED DECEMBER 31, 2015 |
MARCH 31, | JUNE 30, | SEPTEMBER 30, | DECEMBER 31, | ||||||||||||
| Revenues from rental properties |
$ | 23,927 | $ | 25,467 | $ | 29,077 | $ | 28,564 | ||||||||
| (Loss) earnings from continuing operations |
(81 | ) | 11,503 | 8,564 | 20,384 | |||||||||||
| Net (loss) earnings |
(1,137 | ) | 11,619 | 7,035 | 19,893 | |||||||||||
| Diluted earnings per common share: |
||||||||||||||||
| (Loss) earnings from continuing operations |
(.01 | ) | .34 | .25 | .60 | |||||||||||
| Net (loss) earnings |
(.04 | ) | .34 | .21 | .59 | |||||||||||
|
YEAR ENDED DECEMBER 31, 2014 |
MARCH 31, | JUNE 30, | SEPTEMBER 30, | DECEMBER 31, | ||||||||||||
| Revenues from rental properties |
$ | 23,764 | $ | 24,356 | $ | 24,078 | $ | 24,550 | ||||||||
| Earnings (loss) from continuing operations |
7,696 | 6,823 | 9,006 | (3,120 | ) | |||||||||||
| Net earnings (loss) |
9,638 | 6,637 | 10,235 | (3,092 | ) | |||||||||||
| Diluted earnings per common share: |
||||||||||||||||
| Earnings (loss) from continuing operations |
.23 | .20 | .27 | (.10 | ) | |||||||||||
| Net earnings (loss) |
.29 | .20 | .30 | (.10 | ) | |||||||||||
65
Table of Contents
10. PROPERTY ACQUISITIONS
2015 Activity
During the year ended December 31, 2015, we acquired fee simple interests in 80 convenience store and gasoline station properties for an aggregate purchase price of $219,200,000.
On June 3, 2015, we acquired fee simple interests in 77 convenience store and gasoline station properties from affiliates of Pacific Convenience and Fuels LLC which we simultaneously leased to Apro, LLC (d/b/a “United Oil”), a leading regional convenience store and gasoline station operator, under three separate cross-defaulted long-term triple-net unitary leases (the “United Oil Transaction”). The United Oil properties are located across California, Colorado, Nevada, Oregon and Washington State and operate under several well recognized brands including 7-Eleven, 76, Circle K, Conoco and My Goods Market. The total purchase price for the United Oil Transaction was $214,500,000, which was funded with proceeds from our Credit Agreement and Restated Prudential Note Purchase Agreement.
The leases governing the properties are unitary triple-net lease agreements with initial terms of 20 years and options for up to three successive five year renewal options. The unitary leases require United Oil to pay a fixed annual rent plus all amounts pertaining to the properties including environmental expenses, real estate taxes, assessments, license and permit fees, charges for public utilities and all other governmental charges. Rent is contractually scheduled to increase at various intervals over the course of the initial and renewal terms of the leases.
We accounted for the United Oil Transaction as a business combination. We estimated the fair value of acquired tangible assets (consisting of land, buildings and equipment) “as if vacant.” Based on these estimates, we allocated $140,966,000 ($1,391,000 decrease from preliminary allocation) of the purchase price to land, $75,119,000 ($544,000 decrease from preliminary allocation) to buildings and equipment, $216,000 ($104,000 increase from preliminary allocation) to above market leases, $19,210,000 (decrease of $565,000 from preliminary allocation) to below market leases, which is accounted for as a deferred liability and $17,402,000 (increase of $1,266,000 from preliminary allocation) to in-place leases and other intangible assets. We incurred transaction costs of $413,000 directly related to the acquisition which are included in general and administrative expenses in our consolidated statements of operations.
In accordance with our adoption of ASU 2015-16, which eliminates the requirement to restate prior period consolidated financial statements for measurement period adjustments relating to purchase price allocations, we, during the fourth quarter of 2015, adjusted the preliminary allocation amounts recorded for properties acquired during the six months ended June 30, 2015. The impact of these allocation adjustments on our tangible and intangible assets and liabilities are reflected above. In addition, these allocation adjustments resulted in an increase to depreciation and amortization expense of $244,000 and a reduction to revenues from rental properties of $20,000 for the year ended December 31, 2015.
In addition, in 2015, we acquired fee simple interests in three convenience store and gasoline station properties in separate transactions for an aggregate purchase price of $4,700,000.
2014 Activity
During the year ended December 31, 2014, we acquired fee simple interests in ten convenience store and gasoline station properties in separate transactions for an aggregate purchase price of $17,598,000.
We accounted for these acquisitions as business combinations. We estimated the fair value of acquired tangible assets (consisting of land, buildings and equipment) “as if vacant.” Based on these estimates, we allocated $5,478,000 of the purchase price to land, $11,097,000 to buildings and equipment, $10,000 to above market leases, $243,000 to below market leases, which is accounted for as a deferred liability, $1,146,000 to in-place leases, and $110,000 to favorable financing. We incurred transaction costs of $104,000 directly related to the acquisitions which are included in general and administrative expenses in our consolidated statements of operations.
Acquired Intangible Assets
Acquired above-market (when we are a lessor) and below-market leases (when we are a lessee) are included in prepaid expenses and other assets and had a balance of $3,021,000 and $3,300,000 (net of accumulated amortization of $3,715,000 and $3,220,000, respectively) at December 31, 2015 and 2014, respectively. Acquired above-market (when we are lessee) and below-market (when we are lessor) leases are included in accounts payable and accrued liabilities and had a balance of $24,534,000 and $7,531,000 (net of accumulated amortization of $11,624,000 and $10,036,000, respectively) at December 31, 2015 and 2014, respectively. When we are a lessor, above-market and below-market leases are amortized and recorded as either an increase (in the case of below-market leases) or a decrease (in the case of above-market leases) to rental revenue over the remaining term of the associated lease in place at the time of purchase. In-place leases are included in prepaid expenses and other assets and had a balance of $22,004,000 and $5,328,000 (net of accumulated amortization of $3,793,000 and $2,773,000, respectively) at December 31, 2015 and 2014, respectively. When we are a lessee, above-market and below-market leases are amortized and recorded as either an increase (in the case of below-market leases) or a decrease (in the case of above-market leases) to rental expense over the remaining term of the associated lease in place at the time of
66
Table of Contents
purchase. Rental income included amortization from acquired leases of $1,426,000, $1,239,000 and $986,000 for the years ended December 31, 2015, 2014 and 2013, respectively. Rent expense included amortization from acquired leases of $333,000, $333,000 and $353,000 for the years ended December 31, 2015, 2014 and 2013, respectively. The value associated with in-place leases and lease origination costs are amortized into depreciation and amortization expense over the remaining life of the lease. Depreciation and amortization expense included amortization from in-place leases of $1,019,000, $518,000 and $408,000 for the years ended December 31, 2015, 2014 and 2013, respectively.
The amortization for acquired intangible assets during the next five years and thereafter, assuming no early lease terminations, is as follows:
| Above-Market Leases |
Below-Market Leases |
In-Place Leases |
||||||||||
| As Lessor: |
||||||||||||
| Year ending December 31, |
||||||||||||
| 2016 |
$ | 166,000 | $ | 1,935,000 | $ | 1,381,000 | ||||||
| 2017 |
153,000 | 1,871,000 | 1,366,000 | |||||||||
| 2018 |
52,000 | 1,816,000 | 1,339,000 | |||||||||
| 2019 |
35,000 | 1,706,000 | 1,319,000 | |||||||||
| 2020 |
29,000 | 1,468,000 | 1,290,000 | |||||||||
| Thereafter |
170,000 | 15,738,000 | 15,309,000 | |||||||||
|
|
|
|
|
|
|
|||||||
| $ | 605,000 | $ | 24,534,000 | $ | 22,004,000 | |||||||
|
|
|
|
|
|
|
|||||||
| Below-Market Leases |
||||||
| As Lessee: |
||||||
| Year ending December 31, |
||||||
| 2016 |
$ | 333,000 | ||||
| 2017 |
320,000 | |||||
| 2018 |
317,000 | |||||
| 2019 |
312,000 | |||||
| 2020 |
222,000 | |||||
| Thereafter |
912,000 | |||||
|
|
|
|||||
| $ | 2,416,000 | |||||
|
|
|
|||||
Unaudited Pro Forma Condensed Consolidated Financial Information
The following unaudited pro forma condensed consolidated financial information has been prepared utilizing our historical financial statements and the combined effect of additional revenue and expenses from the properties acquired assuming that the acquisitions had occurred on January 1, 2014, after giving effect to certain adjustments resulting from the straight-lining of scheduled rent increases. The following information also gives effect to the additional interest expense resulting from the assumed increase in borrowings outstanding under the Credit Agreement and the Restated Prudential Note Purchase Agreement to fund the acquisition. The unaudited pro forma condensed financial information is not indicative of the results of operations that would have been achieved had the acquisition reflected herein been consummated on the dates indicated or that will be achieved in the future.
67
Table of Contents
| (in thousands, except per share data) |
Year ended December 31, |
|||||||
| 2015 | 2014 | |||||||
| Revenues from continuing operations |
$ | 118,003 | $ | 117,340 | ||||
|
|
|
|
|
|||||
| Earnings from continuing operations |
$ | 41,763 | $ | 22,399 | ||||
|
|
|
|
|
|||||
| Basic and diluted earnings from continuing operations per common share |
$ | 1.24 | $ | 0.66 | ||||
|
|
|
|
|
|||||
68
Table of Contents
Report of Independent Registered Public Accounting Firm
To the Board of Directors and Shareholders of Getty Realty Corp.
In our opinion, the accompanying consolidated balance sheets and the related consolidated statements of operations and of cash flows present fairly, in all material respects, the financial position of Getty Realty Corp. and its subsidiaries at December 31, 2015 and 2014, and the results of their operations and their cash flows for each of the three years in the period ended December 31, 2015 in conformity with accounting principles generally accepted in the United States of America. Also in our opinion, the Company maintained, in all material respects, effective internal control over financial reporting as of December 31, 2015, based on criteria established in Internal Control - Integrated Framework 2013 issued by the Committee of Sponsoring Organizations of the Treadway Commission (COSO). The Company’s management is responsible for these financial statements, for maintaining effective internal control over financial reporting and for its assessment of the effectiveness of internal control over financial reporting, included in Management’s Report on Internal Control over Financial Reporting appearing under Item 9A of this Form 10-K. Our responsibility is to express opinions on these financial statements and on the Company’s internal control over financial reporting based on our integrated audits. We conducted our audits in accordance with the standards of the Public Company Accounting Oversight Board (United States). Those standards require that we plan and perform the audits to obtain reasonable assurance about whether the financial statements are free of material misstatement and whether effective internal control over financial reporting was maintained in all material respects. Our audits of the financial statements included examining, on a test basis, evidence supporting the amounts and disclosures in the financial statements, assessing the accounting principles used and significant estimates made by management, and evaluating the overall financial statement presentation. Our audit of internal control over financial reporting included obtaining an understanding of internal control over financial reporting, assessing the risk that a material weakness exists, and testing and evaluating the design and operating effectiveness of internal control based on the assessed risk. Our audits also included performing such other procedures as we considered necessary in the circumstances. We believe that our audits provide a reasonable basis for our opinions.
As discussed in Note 1 to the consolidated financial statements, the Company adopted accounting standards update No. 2014-08, “Reporting Discontinued Operations and Disclosures of Disposals of Components of an Entity” as of July 1, 2014, which changed the manner in which it accounts for discontinued operations.
A company’s internal control over financial reporting is a process designed to provide reasonable assurance regarding the reliability of financial reporting and the preparation of financial statements for external purposes in accordance with generally accepted accounting principles. A company’s internal control over financial reporting includes those policies and procedures that (i) pertain to the maintenance of records that, in reasonable detail, accurately and fairly reflect the transactions and dispositions of the assets of the company; (ii) provide reasonable assurance that transactions are recorded as necessary to permit preparation of financial statements in accordance with generally accepted accounting principles, and that receipts and expenditures of the company are being made only in accordance with authorizations of management and directors of the company; and (iii) provide reasonable assurance regarding prevention or timely detection of unauthorized acquisition, use, or disposition of the company’s assets that could have a material effect on the financial statements.
Because of its inherent limitations, internal control over financial reporting may not prevent or detect misstatements. Also, projections of any evaluation of effectiveness to future periods are subject to the risk that controls may become inadequate because of changes in conditions, or that the degree of compliance with the policies or procedures may deteriorate.
/s/ PricewaterhouseCoopers LLP
New York, New York
March 10, 2016
69
Table of Contents
Item 9. Changes in and Disagreements with Accountants on Accounting and Financial Disclosure
None.
Item 9A. Controls and Procedures
Disclosure Controls and Procedures
We maintain disclosure controls and procedures that are designed to ensure that information required to be disclosed in our reports filed or furnished pursuant to the Exchange Act of 1934, as amended, is recorded, processed, summarized and reported within the time periods specified in the Commission’s rules and forms, and that such information is accumulated and communicated to our management, including our Chief Executive Officer and Chief Financial Officer, as appropriate, to allow timely decisions regarding required disclosure. In designing and evaluating the disclosure controls and procedures, management recognized that any controls and procedures, no matter how well designed and operated, can provide only reasonable assurance of achieving the desired control objectives, and management necessarily was required to apply its judgment in evaluating the cost-benefit relationship of possible controls and procedures.
As required by the Exchange Act Rule 13a-15(b), we have carried out an evaluation, under the supervision and with the participation of our management, including our Chief Executive Officer and our Chief Financial Officer, of the effectiveness of the design and operation of our disclosure controls and procedures as of the end of the period covered by this Annual Report on Form 10-K. Based on the foregoing, our Chief Executive Officer and Chief Financial Officer concluded that our disclosure controls and procedures were effective as of December 31, 2015.
Management’s Report on Internal Control Over Financial Reporting
Our management is responsible for establishing and maintaining adequate internal control over financial reporting, as such term is defined in Exchange Act Rule 13a-15(f). Under the supervision and with the participation of our management, including our Chief Executive Officer and Chief Financial Officer, we have conducted an evaluation of the effectiveness of our internal control over financial reporting based on the framework in Internal Control — Integrated Framework (2013) issued by the Committee of Sponsoring Organizations of the Treadway Commission. Based on our assessment under the framework in Internal Control — Integrated Framework, our management concluded that our internal control over financial reporting was effective as of December 31, 2015.
The effectiveness of our internal control over financial reporting as of December 31, 2015, has been audited by PricewaterhouseCoopers LLP, an independent registered public accounting firm, as stated in their report which appears in “Item 8. Financial Statements and Supplementary Data”.
As of December 31, 2015, we leased 77 convenience store and gasoline station properties pursuant to three separate, cross-defaulted, unitary leases to Apro, LLC (d/b/a “United Oil”). In the aggregate, these leases with United Oil accounted for 9% of our rental revenues for the year ended December 31, 2015. United Oil is wholly owned subsidiary of CF United LLC.
70
Table of Contents
The selected combined audited financial data of CF United LLC, which has been prepared by CF United LLC’s management and audited by a third-party accounting firm, is provided below:
(in thousands)
Operating Data:
| Year ended December 31, |
||||||||
| 2015 | 2014 | |||||||
| Total income |
$ | 1,160,652 | $ | 628,882 | ||||
| Total costs of operations and operating expenses |
1,133,510 | 616,684 | ||||||
| Net income |
23,545 | 11,190 | ||||||
Balance Sheet Data:
| December 31, 2015 |
December 31, 2014 |
|||||||
| Current assets |
$ | 87,195 | $ | 35,961 | ||||
| Noncurrent assets |
265,315 | 121,049 | ||||||
| Current liabilities |
63,892 | 33,629 | ||||||
| Noncurrent liabilities |
151,088 | 76,851 | ||||||
71
Table of Contents
Item 10. Directors, Executive Officers and Corporate Governance
Information with respect to compliance with Section 16(a) of the Exchange Act is incorporated herein by reference to information under the heading “Section 16(a) Beneficial Ownership Reporting Compliance” in the Proxy Statement. Information with respect to directors, the audit committee and the audit committee financial expert, and procedures by which shareholders may recommend nominees to the board of directors in response to this item is incorporated herein by reference to information under the headings “Election of Directors” and “Directors’ Meetings, Committees and Executive Officers” in the Proxy Statement. The following table lists our executive officers, their respective ages and the offices and positions held.
| NAME |
AGE | POSITION |
OFFICER SINCE | |||
| Christopher J. Constant |
37 | President, Chief Executive Officer and Director | 2012 | |||
| Mark J. Olear |
51 | Executive Vice President and Chief Operating Officer | 2014 | |||
| Joshua Dicker |
55 | Senior Vice President, General Counsel and Secretary | 2008 | |||
| Danion Fielding |
44 | Vice President, Chief Financial Officer and Treasurer | 2016 |
Mr. Constant has served as President, Chief Executive Officer and Director since January 2016. Mr. Constant joined the Company in November 2010 as Director of Planning and Corporate Development and was later promoted to Treasurer in May 2012, Vice President in May 2013 and Chief Financial Officer in December 2013. Prior to joining the Company, Mr. Constant was a Vice President in the corporate finance department at Morgan Joseph & Co. Inc. and began his career in the corporate finance department at ING Barings.
Mr. Olear has served as Executive Vice President since May 2014 and Chief Operating Officer since May 2015 (Chief Investment Officer since May 2014). Prior to joining the Company, Mr. Olear held various positions in real estate with TD Bank, Home Depot, Toys “R” Us and A&P.
Mr. Dicker has served as Senior Vice President, General Counsel and Secretary since 2012. He was Vice President, General Counsel and Secretary since February 2009. Prior to joining the Company in 2008, he was a partner at the law firm Arent Fox, LLP, resident in its New York City office, specializing in corporate and transactional matters.
Mr. Fielding joined the Company in February 2016 as Vice President, Chief Financial Officer and Treasurer. Prior to joining the Company, Mr. Fielding held various positions in real estate and investment banking with Wilbraham Capital, Moinian Group, Nationwide Health Properties, J.P. Morgan, PricewaterhouseCoopers and Daiwa Securities.
There are no family relationships between any of the Company’s directors or executive officers.
The Getty Realty Corp. Business Conduct Guidelines (“Code of Ethics”), which applies to all employees, including our Chief Executive Officer and Chief Financial Officer, is available on our website at www.gettyrealty.com.
Item 11. Executive Compensation
Information in response to this item is incorporated herein by reference to information under the heading “Executive Compensation” in the Proxy Statement.
72
Table of Contents
Item 12. Security Ownership of Certain Beneficial Owners and Management and Related Stockholder Matters
Information in response to this item is incorporated herein by reference to information under the heading “Beneficial Ownership of Capital Stock” and “Executive Compensation — Compensation Discussion and Analysis — Equity Compensation — Equity Compensation Plan Information” in the Proxy Statement.
Item 13. Certain Relationships and Related Transactions, and Director Independence
There were no such relationships or transactions to report for the year ended December 31, 2015.
Information with respect to director independence is incorporated herein by reference to information under the heading “Directors’ Meetings, Committees and Executive Officers — Independence of Directors” in the Proxy Statement.
Item 14. Principal Accountant Fees and Services
Information in response to this item is incorporated herein by reference to information under the heading “Ratification of Appointment of Independent Registered Public Accounting Firm” in the Proxy Statement.
Item 15. Exhibits and Financial Statement Schedules
(a) (1) Financial Statements
Information in response to this Item is included in “Item 8. Financial Statements and Supplementary Data”.
(a) (2) Financial Statement Schedules
73
Table of Contents
INDEX TO FINANCIAL STATEMENT SCHEDULES
Item 15(a)(2)
(a) (3) Exhibits
Information in response to this Item is incorporated herein by reference to the Exhibit Index on page 94 of this Annual Report on Form 10-K.
74
Table of Contents
REPORT OF INDEPENDENT REGISTERED PUBLIC ACCOUNTING FIRM
ON FINANCIAL STATEMENT SCHEDULES
To the Board of Directors of Getty Realty Corp.:
Our audits of the consolidated financial statements and of the effectiveness of internal control over financial reporting referred to in our report dated March 10, 2016 appearing in Item 8 of the 2015 Annual Report to Shareholders of Getty Realty Corp. (which report and consolidated financial statements are incorporated by reference in this Annual Report on Form 10-K) also included an audit of the financial statement schedules listed in Item 15(a)(2) of this Form 10-K. In our opinion, these financial statement schedules present fairly, in all material respects, the information set forth therein when read in conjunction with the related consolidated financial statements.
/s/ PricewaterhouseCoopers LLP
New York, New York
March 10, 2016
GETTY REALTY CORP. and SUBSIDIARIES
SCHEDULE II — VALUATION and QUALIFYING ACCOUNTS and RESERVES
for the years ended December 31, 2015, 2014 and 2013
(in thousands)
| BALANCE AT BEGINNING OF YEAR |
ADDITIONS | DEDUCTIONS | BALANCE AT END OF YEAR |
|||||||||||||
| December 31, 2015: |
||||||||||||||||
| Allowance for deferred rent receivable |
$ | 7,009 | $ | — | $ | 7,009 | $ | — | ||||||||
| Allowance for accounts receivable |
$ | 4,160 | $ | 1,778 | $ | 3,304 | $ | 2,634 | ||||||||
| December 31, 2014: |
||||||||||||||||
| Allowance for deferred rent receivable |
$ | 4,775 | $ | 2,234 | $ | — | $ | 7,009 | ||||||||
| Allowance for accounts receivable |
$ | 3,248 | $ | 1,182 | $ | 270 | $ | 4,160 | ||||||||
| December 31, 2013: |
||||||||||||||||
| Allowance for deferred rent receivable |
$ | — | $ | 4,775 | $ | — | $ | 4,775 | ||||||||
| Allowance for accounts receivable |
$ | 25,371 | $ | 4,027 | $ | 26,150 | $ | 3,248 | ||||||||
75
Table of Contents
GETTY REALTY CORP. and SUBSIDIARIES
SCHEDULE III — REAL ESTATE AND ACCUMULATED DEPRECIATION AND AMORTIZATION
As of December 31, 2015
(in thousands)
The summarized changes in real estate assets and accumulated depreciation are as follows:
| 2015 | 2014 | 2013 | ||||||||||
| Investment in real estate: |
||||||||||||
| Balance at beginning of year |
$ | 595,959 | $ | 570,275 | $ | 562,316 | ||||||
| Acquisitions and capital expenditures |
233,785 | 79,259 | 76,016 | |||||||||
| Impairments |
(20,606 | ) | (24,620 | ) | (23,238 | ) | ||||||
| Sales and condemnations |
(25,019 | ) | (25,786 | ) | (42,884 | ) | ||||||
| Lease expirations/settlements |
(886 | ) | (3,169 | ) | (1,935 | ) | ||||||
|
|
|
|
|
|
|
|||||||
| Balance at end of year |
$ | 783,233 | $ | 595,959 | $ | 570,275 | ||||||
|
|
|
|
|
|
|
|||||||
| Accumulated depreciation and amortization: |
||||||||||||
| Balance at beginning of year |
$ | 100,690 | $ | 103,452 | $ | 116,768 | ||||||
| Depreciation and amortization |
15,663 | 9,777 | 9,231 | |||||||||
| Impairments |
(3,246 | ) | (3,086 | ) | (9,813 | ) | ||||||
| Sales and condemnations |
(5,313 | ) | (6,544 | ) | (11,474 | ) | ||||||
| Lease expirations/settlements |
(424 | ) | (2,909 | ) | (1,260 | ) | ||||||
|
|
|
|
|
|
|
|||||||
| Balance at end of year |
$ | 107,370 | $ | 100,690 | $ | 103,452 | ||||||
|
|
|
|
|
|
|
|||||||
76
Table of Contents
| Initial Cost of Leasehold or Acquisition Investment to Company (1) |
Cost Capitalized Subsequent to Initial Investment |
Gross Amount at Which Carried at Close of Period |
Total Cost |
Accumulated Depreciation |
Date of Initial Leasehold or Acquisition Investment (1) |
|||||||||||||||||||||||
| Land |
Building and |
|||||||||||||||||||||||||||
| Brookland, AR |
$ | 1,468 | $ | 0 | $ | 149 | $ | 1,319 | $ | 1,468 | $ | 452 | 2007 | |||||||||||||||
| Jonesboro, AR |
868 | 0 | 173 | 695 | 868 | 250 | 2007 | |||||||||||||||||||||
| Jonesboro, AR |
2,985 | 0 | 330 | 2,655 | 2,985 | 965 | 2007 | |||||||||||||||||||||
| Bellflower, CA |
1,369 | 0 | 910 | 459 | 1,369 | 216 | 2007 | |||||||||||||||||||||
| Benicia, CA |
2,224 | 0 | 1,058 | 1,166 | 2,224 | 573 | 2007 | |||||||||||||||||||||
| Chula Vista, CA |
2,385 | 0 | 889 | 1,496 | 2,385 | 79 | 2014 | |||||||||||||||||||||
| Coachella, CA |
2,235 | 0 | 1,217 | 1,018 | 2,235 | 466 | 2007 | |||||||||||||||||||||
| Cotati, CA |
6,072 | 0 | 4,008 | 2,064 | 6,072 | 66 | 2015 | |||||||||||||||||||||
| Fillmore, CA |
1,354 | 0 | 950 | 404 | 1,354 | 189 | 2007 | |||||||||||||||||||||
| Grass Valley, CA |
1,485 | 0 | 853 | 632 | 1,485 | 21 | 2015 | |||||||||||||||||||||
| Hesperia, CA |
1,643 | 0 | 849 | 794 | 1,643 | 344 | 2007 | |||||||||||||||||||||
| Hesperia, CA |
2,055 | 0 | 492 | 1,563 | 2,055 | 61 | 2015 | |||||||||||||||||||||
| Indio, CA |
1,250 | 0 | 302 | 948 | 1,250 | 33 | 2015 | |||||||||||||||||||||
| Indio, CA |
2,727 | 0 | 1,486 | 1,241 | 2,727 | 45 | 2015 | |||||||||||||||||||||
| LaPalma, CA |
1,971 | 0 | 1,389 | 582 | 1,971 | 269 | 2007 | |||||||||||||||||||||
| LaPuente, CA |
7,615 | 0 | 6,405 | 1,210 | 7,615 | 46 | 2015 | |||||||||||||||||||||
| Lakeside, CA |
3,715 | 0 | 2,695 | 1,020 | 3,715 | 37 | 2015 | |||||||||||||||||||||
| Los Angeles, CA |
6,612 | 0 | 5,006 | 1,606 | 6,612 | 60 | 2015 | |||||||||||||||||||||
| Oakland, CA |
5,434 | 0 | 4,123 | 1,311 | 5,434 | 49 | 2015 | |||||||||||||||||||||
| Ontario, CA |
6,613 | 0 | 4,523 | 2,090 | 6,613 | 79 | 2015 | |||||||||||||||||||||
| Phelan, CA |
4,611 | 0 | 3,276 | 1,335 | 4,611 | 51 | 2015 | |||||||||||||||||||||
| Riverside, CA |
2,130 | 0 | 1,619 | 511 | 2,130 | 29 | 2015 | |||||||||||||||||||||
| Riverside, CA |
2,737 | 0 | 1,216 | 1,521 | 2,737 | 102 | 2014 | |||||||||||||||||||||
| Sacramento, CA |
3,193 | 0 | 2,207 | 986 | 3,193 | 38 | 2015 | |||||||||||||||||||||
| Sacramento, CA |
4,247 | 0 | 2,604 | 1,643 | 4,247 | 56 | 2015 | |||||||||||||||||||||
| Sacramento, CA |
5,942 | 0 | 4,233 | 1,709 | 5,942 | 62 | 2015 | |||||||||||||||||||||
| SanDimas, CA |
1,941 | 0 | 749 | 1,192 | 1,941 | 473 | 2007 | |||||||||||||||||||||
| San Jose, CA |
5,412 | 0 | 4,219 | 1,193 | 5,412 | 48 | 2015 | |||||||||||||||||||||
| San Leandro, CA |
5,978 | 0 | 5,078 | 900 | 5,978 | 36 | 2015 | |||||||||||||||||||||
| Shingle Springs, CA |
4,751 | 0 | 3,489 | 1,262 | 4,751 | 47 | 2015 | |||||||||||||||||||||
| Stockton, CA |
1,187 | 0 | 627 | 560 | 1,187 | 21 | 2015 | |||||||||||||||||||||
| Stockton, CA |
3,001 | 0 | 1,460 | 1,541 | 3,001 | 53 | 2015 | |||||||||||||||||||||
| Boulder, CO |
3,900 | 0 | 2,875 | 1,025 | 3,900 | 35 | 2015 | |||||||||||||||||||||
| Castle Rock, CO |
5,269 | 0 | 3,269 | 2,000 | 5,269 | 73 | 2015 | |||||||||||||||||||||
| Golden, CO |
4,641 | 0 | 3,247 | 1,394 | 4,641 | 49 | 2015 | |||||||||||||||||||||
| Greenwood Village, CO |
4,077 | 0 | 2,889 | 1,188 | 4,077 | 40 | 2015 | |||||||||||||||||||||
| Highlands Ranch, CO |
4,356 | 0 | 2,921 | 1,435 | 4,356 | 52 | 2015 | |||||||||||||||||||||
| Lakewood, CO |
2,349 | 0 | 1,541 | 808 | 2,349 | 28 | 2015 | |||||||||||||||||||||
77
Table of Contents
| Initial Cost of Leasehold or Acquisition Investment to Company (1) |
Cost Capitalized Subsequent to Initial Investment |
Gross Amount at Which Carried at Close of Period |
Total Cost |
Accumulated Depreciation |
Date of Initial Leasehold or Acquisition Investment (1) |
|||||||||||||||||||||||
| Land |
Building and |
|||||||||||||||||||||||||||
| Littleton, CO |
4,233 | 0 | 2,366 | 1,867 | 4,233 | 67 | 2015 | |||||||||||||||||||||
| LoneTree, CO |
6,612 | 0 | 5,125 | 1,487 | 6,612 | 56 | 2015 | |||||||||||||||||||||
| Longmont, CO |
3,619 | 0 | 2,315 | 1,304 | 3,619 | 49 | 2015 | |||||||||||||||||||||
| Louisville, CO |
6,605 | 0 | 5,228 | 1,377 | 6,605 | 51 | 2015 | |||||||||||||||||||||
| Morrison, CO |
5,081 | 0 | 3,018 | 2,063 | 5,081 | 77 | 2015 | |||||||||||||||||||||
| Superior, CO |
3,748 | 0 | 2,477 | 1,271 | 3,748 | 46 | 2015 | |||||||||||||||||||||
| Thornton, CO |
5,003 | 0 | 2,722 | 2,281 | 5,003 | 82 | 2015 | |||||||||||||||||||||
| Westminster, CO |
1,457 | 0 | 752 | 705 | 1,457 | 25 | 2015 | |||||||||||||||||||||
| WheatRidge, CO |
6,151 | 0 | 4,201 | 1,950 | 6,151 | 72 | 2015 | |||||||||||||||||||||
| Avon, CT |
731 | 347 | 403 | 675 | 1,078 | 262 | 2002 | |||||||||||||||||||||
| Bridgeport, CT |
346 | 12 | 230 | 128 | 358 | 128 | 1985 | |||||||||||||||||||||
| Bridgeport, CT |
339 | 22 | 220 | 141 | 361 | 108 | 1985 | |||||||||||||||||||||
| Bridgeport, CT |
59 | 380 | 24 | 415 | 439 | 169 | 1982 | |||||||||||||||||||||
| Bridgeport, CT |
313 | 298 | 204 | 407 | 611 | 130 | 1985 | |||||||||||||||||||||
| Bridgeport, CT |
350 | 330 | 228 | 452 | 680 | 171 | 1985 | |||||||||||||||||||||
| Bridgeport, CT |
377 | 394 | 246 | 525 | 771 | 218 | 1985 | |||||||||||||||||||||
| Bristol, CT |
360 | 0 | 0 | 360 | 360 | 360 | 2004 | |||||||||||||||||||||
| Bristol, CT |
365 | 0 | 237 | 128 | 365 | 57 | 2004 | |||||||||||||||||||||
| Bristol, CT |
1,594 | 0 | 1,036 | 558 | 1,594 | 249 | 2004 | |||||||||||||||||||||
| Brookfield, CT |
57 | 645 | 20 | 682 | 702 | 224 | 1985 | |||||||||||||||||||||
| Cheshire, CT |
491 | (91 | ) | 267 | 133 | 400 | 33 | 1985 | ||||||||||||||||||||
| Cobalt, CT |
396 | 0 | 0 | 396 | 396 | 396 | 2004 | |||||||||||||||||||||
| Darien, CT |
667 | 332 | 434 | 565 | 999 | 312 | 1985 | |||||||||||||||||||||
| Durham, CT |
994 | 0 | 0 | 994 | 994 | 994 | 2004 | |||||||||||||||||||||
| East Hartford, CT |
208 | 224 | 54 | 378 | 432 | 204 | 1982 | |||||||||||||||||||||
| Ellington, CT |
1,295 | 0 | 842 | 453 | 1,295 | 202 | 2004 | |||||||||||||||||||||
| Fairfield, CT |
430 | 10 | 280 | 160 | 440 | 118 | 1985 | |||||||||||||||||||||
| Farmington, CT |
466 | 0 | 303 | 163 | 466 | 73 | 2004 | |||||||||||||||||||||
| Franklin, CT |
51 | 447 | 20 | 478 | 498 | 229 | 1982 | |||||||||||||||||||||
| Hartford, CT |
571 | 0 | 371 | 200 | 571 | 89 | 2004 | |||||||||||||||||||||
| Hartford, CT |
665 | 0 | 432 | 233 | 665 | 104 | 2004 | |||||||||||||||||||||
| Manchester, CT |
110 | 323 | 50 | 383 | 433 | 117 | 1987 | |||||||||||||||||||||
| Meriden, CT |
208 | 340 | 84 | 464 | 548 | 199 | 1982 | |||||||||||||||||||||
| Meriden, CT |
1,532 | 0 | 989 | 543 | 1,532 | 248 | 2004 | |||||||||||||||||||||
| Middletown, CT |
132 | 579 | 131 | 580 | 711 | 193 | 1987 | |||||||||||||||||||||
| Middletown, CT |
1,039 | 0 | 675 | 364 | 1,039 | 162 | 2004 | |||||||||||||||||||||
| Milford, CT |
293 | 45 | 191 | 147 | 338 | 116 | 1985 | |||||||||||||||||||||
| Milford, CT |
57 | 295 | 30 | 322 | 352 | 76 | 1985 | |||||||||||||||||||||
| Montville, CT |
57 | 332 | 24 | 365 | 389 | 119 | 1982 | |||||||||||||||||||||
| New Britain, CT |
391 | 0 | 254 | 137 | 391 | 61 | 2004 | |||||||||||||||||||||
| New Haven, CT |
217 | 297 | 141 | 373 | 514 | 105 | 1985 | |||||||||||||||||||||
| New Haven, CT |
1,414 | (539 | ) | 569 | 306 | 875 | 39 | 1985 | ||||||||||||||||||||
| New Haven, CT |
539 | 454 | 351 | 642 | 993 | 337 | 1985 | |||||||||||||||||||||
| Newington, CT |
954 | 0 | 620 | 334 | 954 | 149 | 2004 | |||||||||||||||||||||
| North Haven, CT |
405 | 0 | 252 | 153 | 405 | 78 | 2004 | |||||||||||||||||||||
| Norwalk, CT |
511 | 57 | 332 | 236 | 568 | 174 | 1985 | |||||||||||||||||||||
| Norwalk, CT |
0 | 943 | 402 | 541 | 943 | 145 | 1988 | |||||||||||||||||||||
78
Table of Contents
| Initial Cost of Leasehold or Acquisition Investment to Company (1) |
Cost Capitalized Subsequent to Initial Investment |
Gross Amount at Which Carried at Close of Period |
Total Cost |
Accumulated Depreciation |
Date of Initial Leasehold or Acquisition Investment (1) |
|||||||||||||||||||||||
| Land |
Building and |
|||||||||||||||||||||||||||
| Norwich, CT |
107 | 323 | 44 | 386 | 430 | 145 | 1982 | |||||||||||||||||||||
| Old Greenwich, CT |
0 | 1,223 | 620 | 603 | 1,223 | 152 | 1969 | |||||||||||||||||||||
| Plainville, CT |
545 | 0 | 354 | 191 | 545 | 85 | 2004 | |||||||||||||||||||||
| Plymouth, CT |
931 | 0 | 605 | 326 | 931 | 146 | 2004 | |||||||||||||||||||||
| Ridgefield, CT |
402 | 304 | 167 | 539 | 706 | 298 | 1985 | |||||||||||||||||||||
| Ridgefield, CT |
536 | 466 | 348 | 654 | 1,002 | 251 | 1985 | |||||||||||||||||||||
| South Windham, CT |
644 | 1,398 | 598 | 1,444 | 2,042 | 491 | 2004 | |||||||||||||||||||||
| South Windsor, CT |
545 | 0 | 337 | 208 | 545 | 108 | 2004 | |||||||||||||||||||||
| Stamford, CT |
507 | 16 | 330 | 193 | 523 | 143 | 1985 | |||||||||||||||||||||
| Stamford, CT |
507 | 377 | 330 | 554 | 884 | 216 | 1985 | |||||||||||||||||||||
| Stamford, CT |
604 | 342 | 393 | 553 | 946 | 227 | 1985 | |||||||||||||||||||||
| Suffield, CT |
237 | 603 | 201 | 639 | 840 | 469 | 2004 | |||||||||||||||||||||
| Tolland, CT |
108 | 379 | 44 | 443 | 487 | 192 | 1982 | |||||||||||||||||||||
| Vernon, CT |
1,434 | 0 | 0 | 1,434 | 1,434 | 1,434 | 2004 | |||||||||||||||||||||
| Wallingford, CT |
551 | 0 | 335 | 216 | 551 | 116 | 2004 | |||||||||||||||||||||
| Waterbury, CT |
469 | 0 | 305 | 164 | 469 | 73 | 2004 | |||||||||||||||||||||
| Waterbury, CT |
515 | 0 | 335 | 180 | 515 | 81 | 2004 | |||||||||||||||||||||
| Waterbury, CT |
804 | 0 | 516 | 288 | 804 | 134 | 2004 | |||||||||||||||||||||
| Watertown, CT |
352 | 343 | 204 | 491 | 695 | 182 | 1992 | |||||||||||||||||||||
| Watertown, CT |
925 | 0 | 567 | 358 | 925 | 189 | 2004 | |||||||||||||||||||||
| West Haven, CT |
185 | 322 | 74 | 433 | 507 | 187 | 1982 | |||||||||||||||||||||
| West Haven, CT |
1,215 | 0 | 790 | 425 | 1,215 | 190 | 2004 | |||||||||||||||||||||
| Westbrook, CT |
345 | 0 | 0 | 345 | 345 | 345 | 2004 | |||||||||||||||||||||
| Westport, CT |
604 | 12 | 393 | 223 | 616 | 164 | 1985 | |||||||||||||||||||||
| Wethersfield, CT |
447 | 0 | 0 | 447 | 447 | 447 | 2004 | |||||||||||||||||||||
| Willimantic, CT |
717 | 0 | 466 | 251 | 717 | 112 | 2004 | |||||||||||||||||||||
| Wilton, CT |
519 | 385 | 338 | 566 | 904 | 203 | 1985 | |||||||||||||||||||||
| Windsor Locks, CT |
1,031 | 0 | 670 | 361 | 1,031 | 161 | 2004 | |||||||||||||||||||||
| Windsor Locks, CT |
1,434 | 1,400 | 1,055 | 1,779 | 2,834 | 1,438 | 2004 | |||||||||||||||||||||
| Washington, DC |
848 | 0 | 418 | 430 | 848 | 57 | 2013 | |||||||||||||||||||||
| Washington, DC |
941 | 0 | 664 | 277 | 941 | 43 | 2013 | |||||||||||||||||||||
| Wilmington, DE |
382 | 187 | 249 | 320 | 569 | 166 | 1985 | |||||||||||||||||||||
| Jacksonville, FL |
545 | 0 | 256 | 289 | 545 | 190 | 2000 | |||||||||||||||||||||
| Orlando, FL |
867 | 34 | 401 | 500 | 901 | 311 | 2000 | |||||||||||||||||||||
| Haleiwa, HI |
1,522 | 0 | 1,058 | 464 | 1,522 | 269 | 2007 | |||||||||||||||||||||
| Honolulu, HI |
1,071 | 15 | 981 | 105 | 1,086 | 66 | 2007 | |||||||||||||||||||||
| Honolulu, HI |
1,539 | 0 | 1,219 | 320 | 1,539 | 145 | 2007 | |||||||||||||||||||||
| Honolulu, HI |
1,769 | 0 | 1,192 | 577 | 1,769 | 241 | 2007 | |||||||||||||||||||||
| Honolulu, HI |
9,211 | 0 | 8,194 | 1,017 | 9,211 | 439 | 2007 | |||||||||||||||||||||
| Kaneohe, HI |
1,364 | 0 | 822 | 542 | 1,364 | 264 | 2007 | |||||||||||||||||||||
| Kaneohe, HI |
1,978 | 128 | 1,473 | 633 | 2,106 | 255 | 2007 | |||||||||||||||||||||
| Waianae, HI |
1,520 | 0 | 648 | 872 | 1,520 | 364 | 2007 | |||||||||||||||||||||
| Waianae, HI |
1,997 | 0 | 871 | 1,126 | 1,997 | 473 | 2007 | |||||||||||||||||||||
| Waipahu, HI |
2,458 | 0 | 945 | 1,513 | 2,458 | 606 | 2007 | |||||||||||||||||||||
| Andover, MA |
390 | 0 | 240 | 150 | 390 | 25 | 2014 | |||||||||||||||||||||
| Arlington, MA |
519 | 27 | 338 | 208 | 546 | 157 | 1985 | |||||||||||||||||||||
| Auburn, MA |
175 | 195 | 125 | 245 | 370 | 105 | 1986 | |||||||||||||||||||||
79
Table of Contents
| Initial Cost of Leasehold or Acquisition Investment to Company (1) |
Cost Capitalized Subsequent to Initial Investment |
Gross Amount at Which Carried at Close of Period |
Total Cost |
Accumulated Depreciation |
Date of Initial Leasehold or Acquisition Investment (1) |
|||||||||||||||||||||||
| Land |
Building and |
|||||||||||||||||||||||||||
| Auburn, MA |
0 | 535 | 388 | 147 | 535 | 18 | 1996 | |||||||||||||||||||||
| Auburn, MA |
600 | 0 | 600 | 0 | 600 | 0 | 2011 | |||||||||||||||||||||
| Auburn, MA |
625 | 0 | 625 | 0 | 625 | 0 | 2011 | |||||||||||||||||||||
| Auburn, MA |
369 | 262 | 240 | 391 | 631 | 154 | 1991 | |||||||||||||||||||||
| Auburn, MA |
725 | 0 | 725 | 0 | 725 | 0 | 2011 | |||||||||||||||||||||
| Auburn, MA |
800 | 0 | 0 | 800 | 800 | 360 | 2011 | |||||||||||||||||||||
| Barre, MA |
536 | 12 | 348 | 200 | 548 | 103 | 1991 | |||||||||||||||||||||
| Bedford, MA |
1,350 | 0 | 1,350 | 0 | 1,350 | 0 | 2011 | |||||||||||||||||||||
| Bellingham, MA |
734 | 73 | 476 | 331 | 807 | 258 | 1985 | |||||||||||||||||||||
| Belmont, MA |
390 | 29 | 254 | 165 | 419 | 126 | 1985 | |||||||||||||||||||||
| Billerica, MA |
399 | 115 | 180 | 334 | 514 | 261 | 1986 | |||||||||||||||||||||
| Bradford, MA |
650 | 0 | 650 | 0 | 650 | 0 | 2011 | |||||||||||||||||||||
| Burlington, MA |
600 | 0 | 600 | 0 | 600 | 0 | 2011 | |||||||||||||||||||||
| Burlington, MA |
1,250 | 0 | 1,250 | 0 | 1,250 | 0 | 2011 | |||||||||||||||||||||
| Chelmsford, MA |
715 | 0 | 0 | 715 | 715 | 184 | 2012 | |||||||||||||||||||||
| Danvers, MA |
400 | 0 | 400 | 0 | 400 | 0 | 2011 | |||||||||||||||||||||
| Dracut, MA |
450 | 0 | 450 | 0 | 450 | 0 | 2011 | |||||||||||||||||||||
| Falmouth, MA |
519 | 127 | 458 | 188 | 646 | 113 | 1988 | |||||||||||||||||||||
| Fitchburg, MA |
390 | 33 | 254 | 169 | 423 | 102 | 1992 | |||||||||||||||||||||
| Foxborough, MA |
427 | 98 | 325 | 200 | 525 | 127 | 1990 | |||||||||||||||||||||
| Framingham, MA |
400 | 23 | 260 | 163 | 423 | 94 | 1991 | |||||||||||||||||||||
| Gardner, MA |
550 | 0 | 550 | 0 | 550 | 0 | 2011 | |||||||||||||||||||||
| Gardner, MA |
1,009 | 297 | 657 | 649 | 1,306 | 381 | 1985 | |||||||||||||||||||||
| Gardners, MA |
787 | 0 | 638 | 149 | 787 | 14 | 2014 | |||||||||||||||||||||
| Hingham, MA |
353 | 111 | 243 | 221 | 464 | 143 | 1989 | |||||||||||||||||||||
| HydePark, MA |
499 | 158 | 322 | 335 | 657 | 174 | 1985 | |||||||||||||||||||||
| Leominster, MA |
571 | 0 | 199 | 372 | 571 | 68 | 2012 | |||||||||||||||||||||
| Lowell, MA |
375 | 9 | 250 | 134 | 384 | 134 | 1986 | |||||||||||||||||||||
| Lowell, MA |
361 | 90 | 201 | 250 | 451 | 245 | 1985 | |||||||||||||||||||||
| Lowell, MA |
1 | 699 | 429 | 271 | 700 | 31 | 1996 | |||||||||||||||||||||
| Lynn, MA |
400 | 0 | 400 | 0 | 400 | 0 | 2011 | |||||||||||||||||||||
| Lynn, MA |
850 | 0 | 850 | 0 | 850 | 0 | 2011 | |||||||||||||||||||||
| Marlborough, MA |
550 | 0 | 550 | 0 | 550 | 0 | 2011 | |||||||||||||||||||||
| Maynard, MA |
736 | 98 | 479 | 355 | 834 | 200 | 1985 | |||||||||||||||||||||
| Melrose, MA |
600 | 0 | 600 | 0 | 600 | 0 | 2011 | |||||||||||||||||||||
| Methuen, MA |
300 | 134 | 150 | 284 | 434 | 209 | 1986 | |||||||||||||||||||||
| Methuen, MA |
380 | 64 | 246 | 198 | 444 | 161 | 1985 | |||||||||||||||||||||
| Methuen, MA |
490 | 98 | 319 | 269 | 588 | 147 | 1985 | |||||||||||||||||||||
| Methuen, MA |
650 | 0 | 650 | 0 | 650 | 0 | 2011 | |||||||||||||||||||||
| Newton, MA |
691 | 366 | 450 | 607 | 1,057 | 254 | 1985 | |||||||||||||||||||||
| North Andover, MA |
393 | 33 | 256 | 170 | 426 | 131 | 1985 | |||||||||||||||||||||
| Oxford, MA |
293 | 78 | 178 | 193 | 371 | 0 | 1993 | |||||||||||||||||||||
| Peabody, MA |
400 | 18 | 252 | 166 | 418 | 166 | 1986 | |||||||||||||||||||||
| Peabody, MA |
550 | 0 | 550 | 0 | 550 | 0 | 2011 | |||||||||||||||||||||
| Peabody, MA |
650 | 0 | 650 | 0 | 650 | 0 | 2011 | |||||||||||||||||||||
| Pittsfield, MA |
123 | 206 | 50 | 279 | 329 | 200 | 1982 | |||||||||||||||||||||
| Randolph, MA |
573 | 195 | 430 | 338 | 768 | 207 | 1985 | |||||||||||||||||||||
80
Table of Contents
| Initial Cost of Leasehold or Acquisition Investment to Company (1) |
Cost Capitalized Subsequent to Initial Investment |
Gross Amount at Which Carried at Close of Period |
Total Cost |
Accumulated Depreciation |
Date of Initial Leasehold or Acquisition Investment (1) |
|||||||||||||||||||||||
| Land |
Building and |
|||||||||||||||||||||||||||
| Revere, MA |
1,300 | 0 | 1,300 | 0 | 1,300 | 0 | 2011 | |||||||||||||||||||||
| Rockland, MA |
579 | 45 | 377 | 247 | 624 | 190 | 1985 | |||||||||||||||||||||
| Salem, MA |
600 | 0 | 600 | 0 | 600 | 0 | 2011 | |||||||||||||||||||||
| Seekonk, MA |
1,073 | (301 | ) | 576 | 196 | 772 | 26 | 1985 | ||||||||||||||||||||
| Shrewsbury, MA |
400 | 0 | 400 | 0 | 400 | 0 | 2011 | |||||||||||||||||||||
| Shrewsbury, MA |
450 | 0 | 450 | 0 | 450 | 0 | 2011 | |||||||||||||||||||||
| Sterling, MA |
476 | 2 | 309 | 169 | 478 | 87 | 1991 | |||||||||||||||||||||
| Sutton, MA |
714 | 127 | 464 | 377 | 841 | 187 | 1993 | |||||||||||||||||||||
| Tewksbury, MA |
125 | 521 | 75 | 571 | 646 | 121 | 1986 | |||||||||||||||||||||
| Tewksbury, MA |
1,200 | 0 | 1,200 | 0 | 1,200 | 0 | 2011 | |||||||||||||||||||||
| Upton, MA |
429 | 114 | 279 | 264 | 543 | 110 | 1991 | |||||||||||||||||||||
| Wakefield, MA |
900 | 0 | 900 | 0 | 900 | 0 | 2011 | |||||||||||||||||||||
| Walpole, MA |
450 | 92 | 293 | 249 | 542 | 131 | 1985 | |||||||||||||||||||||
| Watertown, MA |
358 | 212 | 321 | 249 | 570 | 128 | 1985 | |||||||||||||||||||||
| Webster, MA |
1,012 | 842 | 659 | 1,195 | 1,854 | 405 | 1985 | |||||||||||||||||||||
| West Boylston, MA |
312 | 29 | 203 | 138 | 341 | 84 | 1991 | |||||||||||||||||||||
| West Roxbury, MA |
490 | 87 | 319 | 258 | 577 | 166 | 1985 | |||||||||||||||||||||
| Westborough, MA |
312 | 21 | 203 | 130 | 333 | 76 | 1991 | |||||||||||||||||||||
| Westborough, MA |
450 | 0 | 450 | 0 | 450 | 0 | 2011 | |||||||||||||||||||||
| Westford, MA |
275 | 65 | 175 | 165 | 340 | 136 | 1986 | |||||||||||||||||||||
| Wilmington, MA |
600 | 0 | 600 | 0 | 600 | 0 | 2011 | |||||||||||||||||||||
| Wilmington, MA |
1,300 | 0 | 1,300 | 0 | 1,300 | 0 | 2011 | |||||||||||||||||||||
| Woburn, MA |
350 | 140 | 200 | 290 | 490 | 207 | 1986 | |||||||||||||||||||||
| Woburn, MA |
508 | 394 | 508 | 394 | 902 | 229 | 1985 | |||||||||||||||||||||
| Worcester, MA |
285 | 44 | 185 | 144 | 329 | 95 | 1991 | |||||||||||||||||||||
| Worcester, MA |
400 | 0 | 400 | 0 | 400 | 0 | 2011 | |||||||||||||||||||||
| Worcester, MA |
500 | 0 | 500 | 0 | 500 | 0 | 2011 | |||||||||||||||||||||
| Worcester, MA |
550 | 0 | 550 | 0 | 550 | 0 | 2011 | |||||||||||||||||||||
| Worcester, MA |
548 | 10 | 356 | 202 | 558 | 107 | 1991 | |||||||||||||||||||||
| Worcester, MA |
498 | 291 | 322 | 467 | 789 | 227 | 1985 | |||||||||||||||||||||
| Worcester, MA |
978 | 8 | 636 | 350 | 986 | 181 | 1991 | |||||||||||||||||||||
| Accokeek, MD |
692 | 0 | 692 | 0 | 692 | 0 | 2010 | |||||||||||||||||||||
| Baltimore, MD |
802 | 0 | 0 | 802 | 802 | 351 | 2007 | |||||||||||||||||||||
| Baltimore, MD |
2,259 | 0 | 722 | 1,537 | 2,259 | 629 | 2007 | |||||||||||||||||||||
| Beltsville, MD |
525 | 0 | 525 | 0 | 525 | 0 | 2009 | |||||||||||||||||||||
| Beltsville, MD |
731 | 0 | 731 | 0 | 731 | 0 | 2009 | |||||||||||||||||||||
| Beltsville, MD |
1,050 | 0 | 1,050 | 0 | 1,050 | 0 | 2009 | |||||||||||||||||||||
| Beltsville, MD |
1,130 | 0 | 1,130 | 0 | 1,130 | 0 | 2009 | |||||||||||||||||||||
| Bladensburg, MD |
571 | 0 | 571 | 0 | 571 | 0 | 2009 | |||||||||||||||||||||
| Bowie, MD |
1,084 | 0 | 1,084 | 0 | 1,084 | 0 | 2009 | |||||||||||||||||||||
| Capitol Heights, MD |
628 | 0 | 628 | 0 | 628 | 0 | 2009 | |||||||||||||||||||||
| Clinton, MD |
651 | 0 | 651 | 0 | 651 | 0 | 2009 | |||||||||||||||||||||
| College Park, MD |
445 | 0 | 445 | 0 | 445 | 0 | 2009 | |||||||||||||||||||||
| College Park, MD |
536 | 0 | 536 | 0 | 536 | 0 | 2009 | |||||||||||||||||||||
| District Heights, MD |
388 | 0 | 388 | 0 | 388 | 0 | 2009 | |||||||||||||||||||||
| District Heights, MD |
479 | 0 | 479 | 0 | 479 | 0 | 2009 | |||||||||||||||||||||
| Ellicott City, MD |
895 | 0 | 0 | 895 | 895 | 413 | 2007 | |||||||||||||||||||||
81
Table of Contents
| Initial Cost of Leasehold or Acquisition Investment to Company (1) |
Cost Capitalized Subsequent to Initial Investment |
Gross Amount at Which Carried at Close of Period |
Total Cost |
Accumulated Depreciation |
Date of Initial Leasehold or Acquisition Investment (1) |
|||||||||||||||||||||||
| Land |
Building and |
|||||||||||||||||||||||||||
| Emmitsburg, MD |
147 | 191 | 102 | 236 | 338 | 143 | 1986 | |||||||||||||||||||||
| Forestville, MD |
1,039 | 0 | 1,039 | 0 | 1,039 | 0 | 2009 | |||||||||||||||||||||
| Fort Washington, MD |
422 | 0 | 422 | 0 | 422 | 0 | 2009 | |||||||||||||||||||||
| Greenbelt, MD |
1,153 | 0 | 1,153 | 0 | 1,153 | 0 | 2009 | |||||||||||||||||||||
| Hyattsville, MD |
491 | 0 | 491 | 0 | 491 | 0 | 2009 | |||||||||||||||||||||
| Hyattsville, MD |
594 | 0 | 594 | 0 | 594 | 0 | 2009 | |||||||||||||||||||||
| Landover Hills, MD |
457 | 0 | 457 | 0 | 457 | 0 | 2009 | |||||||||||||||||||||
| Landover Hills, MD |
1,358 | 0 | 1,358 | 0 | 1,358 | 0 | 2009 | |||||||||||||||||||||
| Landover, MD |
662 | 0 | 662 | 0 | 662 | 0 | 2009 | |||||||||||||||||||||
| Landover, MD |
753 | 0 | 753 | 0 | 753 | 0 | 2009 | |||||||||||||||||||||
| Lanham, MD |
822 | 0 | 822 | 0 | 822 | 0 | 2009 | |||||||||||||||||||||
| Laurel, MD |
696 | 0 | 696 | 0 | 696 | 0 | 2009 | |||||||||||||||||||||
| Laurel, MD |
1,210 | 0 | 1,210 | 0 | 1,210 | 0 | 2009 | |||||||||||||||||||||
| Laurel, MD |
1,267 | 0 | 1,267 | 0 | 1,267 | 0 | 2009 | |||||||||||||||||||||
| Laurel, MD |
1,415 | 0 | 1,415 | 0 | 1,415 | 0 | 2009 | |||||||||||||||||||||
| Laurel, MD |
1,530 | 0 | 1,530 | 0 | 1,530 | 0 | 2009 | |||||||||||||||||||||
| Laurel, MD |
2,523 | 0 | 2,523 | 0 | 2,523 | 0 | 2009 | |||||||||||||||||||||
| Oxon Hill, MD |
1,256 | 0 | 1,256 | 0 | 1,256 | 0 | 2009 | |||||||||||||||||||||
| Riverdale, MD |
582 | 0 | 582 | 0 | 582 | 0 | 2009 | |||||||||||||||||||||
| Riverdale, MD |
788 | 0 | 788 | 0 | 788 | 0 | 2009 | |||||||||||||||||||||
| Seat Pleasant, MD |
468 | 0 | 468 | 0 | 468 | 0 | 2009 | |||||||||||||||||||||
| Suitland, MD |
377 | 0 | 377 | 0 | 377 | 0 | 2009 | |||||||||||||||||||||
| Suitland, MD |
673 | 0 | 673 | 0 | 673 | 0 | 2009 | |||||||||||||||||||||
| Temple Hills, MD |
331 | 0 | 331 | 0 | 331 | 0 | 2009 | |||||||||||||||||||||
| Upper Marlboro, MD |
845 | 0 | 845 | 0 | 845 | 0 | 2009 | |||||||||||||||||||||
| Biddeford, ME |
618 | 8 | 235 | 391 | 626 | 391 | 1985 | |||||||||||||||||||||
| Lewiston,ME |
342 | 188 | 222 | 308 | 530 | 185 | 1985 | |||||||||||||||||||||
| Kernersville, NC |
449 | 0 | 338 | 111 | 449 | 91 | 2007 | |||||||||||||||||||||
| Madison, NC |
396 | 0 | 46 | 350 | 396 | 166 | 2007 | |||||||||||||||||||||
| New Bern, NC |
350 | 83 | 190 | 243 | 433 | 123 | 2007 | |||||||||||||||||||||
| Belfield, ND |
1,232 | 0 | 382 | 850 | 1,232 | 650 | 2007 | |||||||||||||||||||||
| Allenstown, NH |
1,787 | 0 | 467 | 1,320 | 1,787 | 600 | 2007 | |||||||||||||||||||||
| Concord, NH |
675 | 0 | 675 | 0 | 675 | 0 | 2011 | |||||||||||||||||||||
| Concord, NH |
900 | 0 | 900 | 0 | 900 | 0 | 2011 | |||||||||||||||||||||
| Derry, NH |
418 | 17 | 158 | 277 | 435 | 275 | 1987 | |||||||||||||||||||||
| Derry, NH |
950 | 0 | 950 | 0 | 950 | 0 | 2011 | |||||||||||||||||||||
| Dover, NH |
650 | 0 | 650 | 0 | 650 | 0 | 2011 | |||||||||||||||||||||
| Dover, NH |
1,200 | 0 | 1,200 | 0 | 1,200 | 0 | 2011 | |||||||||||||||||||||
| Goffstown, NH |
1,737 | 0 | 697 | 1,040 | 1,737 | 261 | 2012 | |||||||||||||||||||||
| Hooksett, NH |
1,562 | 0 | 824 | 738 | 1,562 | 582 | 2007 | |||||||||||||||||||||
| Kingston, NH |
1,500 | 0 | 1,500 | 0 | 1,500 | 0 | 2011 | |||||||||||||||||||||
| Londonderry, NH |
703 | 30 | 458 | 275 | 733 | 206 | 1985 | |||||||||||||||||||||
| Londonderry, NH |
1,100 | 0 | 1,100 | 0 | 1,100 | 0 | 2011 | |||||||||||||||||||||
| Manchester, NH |
550 | 0 | 550 | 0 | 550 | 0 | 2011 | |||||||||||||||||||||
| Milford, NH |
190 | 147 | 115 | 222 | 337 | 127 | 1986 | |||||||||||||||||||||
| Nashua, NH |
500 | 0 | 500 | 0 | 500 | 0 | 2011 | |||||||||||||||||||||
| Nashua, NH |
550 | 0 | 550 | 0 | 550 | 0 | 2011 | |||||||||||||||||||||
82
Table of Contents
| Initial Cost of Leasehold or Acquisition Investment to Company (1) |
Cost Capitalized Subsequent to Initial Investment |
Gross Amount at Which Carried at Close of Period |
Total Cost |
Accumulated Depreciation |
Date of Initial Leasehold or Acquisition Investment (1) |
|||||||||||||||||||||||
| Land |
Building and |
|||||||||||||||||||||||||||
| Nashua, NH |
750 | 0 | 750 | 0 | 750 | 0 | 2011 | |||||||||||||||||||||
| Nashua, NH |
825 | 0 | 825 | 0 | 825 | 0 | 2011 | |||||||||||||||||||||
| Nashua, NH |
1,750 | 0 | 1,750 | 0 | 1,750 | 0 | 2011 | |||||||||||||||||||||
| Northwood, NH |
500 | 0 | 500 | 0 | 500 | 0 | 2011 | |||||||||||||||||||||
| Pelham, NH |
(1 | ) | 731 | 317 | 413 | 730 | 43 | 1996 | ||||||||||||||||||||
| Plaistow, NH |
301 | 100 | 245 | 156 | 401 | 155 | 1987 | |||||||||||||||||||||
| Portsmouth, NH |
525 | 0 | 525 | 0 | 525 | 0 | 2011 | |||||||||||||||||||||
| Raymond, NH |
550 | 0 | 550 | 0 | 550 | 0 | 2011 | |||||||||||||||||||||
| Rochester, NH |
700 | 0 | 700 | 0 | 700 | 0 | 2011 | |||||||||||||||||||||
| Rochester, NH |
939 | 12 | 600 | 351 | 951 | 255 | 1985 | |||||||||||||||||||||
| Rochester, NH |
1,400 | 0 | 1,400 | 0 | 1,400 | 0 | 2011 | |||||||||||||||||||||
| Rochester, NH |
1,600 | 0 | 1,600 | 0 | 1,600 | 0 | 2011 | |||||||||||||||||||||
| Salem, NH |
450 | 97 | 350 | 197 | 547 | 150 | 1986 | |||||||||||||||||||||
| Salem, NH |
743 | 19 | 484 | 278 | 762 | 205 | 1985 | |||||||||||||||||||||
| Basking Ridge, NJ |
362 | 287 | 200 | 449 | 649 | 190 | 1986 | |||||||||||||||||||||
| Bergenfield, NJ |
382 | 304 | 300 | 386 | 686 | 138 | 1990 | |||||||||||||||||||||
| Brick, NJ |
1,508 | 310 | 1,000 | 818 | 1,818 | 401 | 2000 | |||||||||||||||||||||
| Colonia, NJ |
719 | (295 | ) | 72 | 352 | 424 | 254 | 1985 | ||||||||||||||||||||
| Deptford, NJ |
282 | 358 | 183 | 457 | 640 | 156 | 1985 | |||||||||||||||||||||
| Elizabeth, NJ |
406 | 367 | 227 | 546 | 773 | 146 | 1985 | |||||||||||||||||||||
| Flemington, NJ |
709 | (252 | ) | 168 | 289 | 457 | 32 | 1985 | ||||||||||||||||||||
| Flemington, NJ |
547 | 17 | 346 | 218 | 564 | 161 | 1985 | |||||||||||||||||||||
| FortLee, NJ |
1,245 | 354 | 811 | 788 | 1,599 | 390 | 1985 | |||||||||||||||||||||
| Franklin Twp., NJ |
683 | 455 | 445 | 693 | 1,138 | 303 | 1985 | |||||||||||||||||||||
| Freehold, NJ |
495 | 128 | 183 | 440 | 623 | 55 | 1978 | |||||||||||||||||||||
| Hasbrouck Heights, NJ |
639 | 357 | 416 | 580 | 996 | 306 | 1985 | |||||||||||||||||||||
| Hillsborough, NJ |
238 | 470 | 100 | 608 | 708 | 199 | 1985 | |||||||||||||||||||||
| Howell, NJ |
10 | 437 | 0 | 447 | 447 | 211 | 1978 | |||||||||||||||||||||
| Lake Hopatcong, NJ |
1,305 | 0 | 800 | 505 | 1,305 | 400 | 2000 | |||||||||||||||||||||
| Livingston, NJ |
872 | 293 | 568 | 597 | 1,165 | 276 | 1985 | |||||||||||||||||||||
| Long Branch, NJ |
514 | 355 | 335 | 534 | 869 | 201 | 1985 | |||||||||||||||||||||
| Mcafee, NJ |
671 | 269 | 437 | 503 | 940 | 205 | 1985 | |||||||||||||||||||||
| Midland Park, NJ |
201 | 443 | 150 | 494 | 644 | 155 | 1989 | |||||||||||||||||||||
| Mountainside, NJ |
664 | (185 | ) | 134 | 345 | 479 | 49 | 1985 | ||||||||||||||||||||
| North Bergen, NJ |
630 | 413 | 410 | 633 | 1,043 | 274 | 1985 | |||||||||||||||||||||
| North Plainfield, NJ |
227 | 776 | 175 | 828 | 1,003 | 379 | 1978 | |||||||||||||||||||||
| Nutley, NJ |
434 | 167 | 283 | 318 | 601 | 174 | 1985 | |||||||||||||||||||||
| Paramus, NJ |
382 | 52 | 249 | 185 | 434 | 122 | 1985 | |||||||||||||||||||||
| Parlin, NJ |
418 | 138 | 203 | 353 | 556 | 48 | 1985 | |||||||||||||||||||||
| Paterson, NJ |
619 | 17 | 403 | 233 | 636 | 172 | 1985 | |||||||||||||||||||||
| Ridgefield, NJ |
55 | 280 | 33 | 302 | 335 | 88 | 1980 | |||||||||||||||||||||
| Ridgewood, NJ |
703 | 375 | 458 | 620 | 1,078 | 261 | 1985 | |||||||||||||||||||||
| Trenton, NJ |
1,303 | 0 | 1,146 | 157 | 1,303 | 29 | 2012 | |||||||||||||||||||||
| Union, NJ |
437 | 187 | 239 | 385 | 624 | 55 | 1985 | |||||||||||||||||||||
| Washington Township, NJ |
912 | 238 | 594 | 556 | 1,150 | 278 | 1985 | |||||||||||||||||||||
| Watchung, NJ |
449 | 90 | 226 | 313 | 539 | 36 | 1985 | |||||||||||||||||||||
| West Orange, NJ |
800 | 628 | 521 | 907 | 1,428 | 358 | 1985 | |||||||||||||||||||||
83
Table of Contents
| Initial Cost of Leasehold or Acquisition Investment to Company (1) |
Cost Capitalized Subsequent to Initial Investment |
Gross Amount at Which Carried at Close of Period |
Total Cost |
Accumulated Depreciation |
Date of Initial Leasehold or Acquisition Investment (1) |
|||||||||||||||||||||||
| Land |
Building and |
|||||||||||||||||||||||||||
| Fernley, NV |
1,665 | 0 | 221 | 1,444 | 1,665 | 60 | 2015 | |||||||||||||||||||||
| Naples, NY |
1,257 | 0 | 827 | 430 | 1,257 | 169 | 2006 | |||||||||||||||||||||
| Perry, NY |
1,444 | 0 | 1,044 | 400 | 1,444 | 157 | 2006 | |||||||||||||||||||||
| Prattsburg, NY |
553 | 0 | 303 | 250 | 553 | 98 | 2006 | |||||||||||||||||||||
| Rochester, NY |
853 | 0 | 303 | 550 | 853 | 216 | 2006 | |||||||||||||||||||||
| Albany, NY |
405 | 295 | 262 | 438 | 700 | 224 | 1985 | |||||||||||||||||||||
| Alfred Station, NY |
714 | 0 | 414 | 300 | 714 | 118 | 2006 | |||||||||||||||||||||
| Amherst, NY |
223 | 246 | 173 | 296 | 469 | 64 | 2000 | |||||||||||||||||||||
| Astoria, NY |
1,684 | 0 | 1,105 | 579 | 1,684 | 89 | 2013 | |||||||||||||||||||||
| Avoca, NY |
936 | (1 | ) | 635 | 300 | 935 | 118 | 2006 | ||||||||||||||||||||
| Batavia, NY |
684 | 0 | 364 | 320 | 684 | 126 | 2006 | |||||||||||||||||||||
| Bay Shore, NY |
157 | 355 | 86 | 426 | 512 | 217 | 1981 | |||||||||||||||||||||
| Bayside, NY |
470 | 298 | 306 | 462 | 768 | 184 | 1985 | |||||||||||||||||||||
| Bellaire, NY |
329 | 38 | 215 | 152 | 367 | 120 | 1985 | |||||||||||||||||||||
| Bethpage, NY |
211 | 294 | 126 | 379 | 505 | 149 | 1978 | |||||||||||||||||||||
| Brewster, NY |
789 | 0 | 789 | 0 | 789 | 0 | 2011 | |||||||||||||||||||||
| Briarcliff Manor, NY |
653 | 636 | 502 | 787 | 1,289 | 390 | 1976 | |||||||||||||||||||||
| Bronx, NY |
104 | 226 | 90 | 240 | 330 | 232 | 1985 | |||||||||||||||||||||
| Bronx, NY |
129 | 217 | 101 | 245 | 346 | 92 | 1972 | |||||||||||||||||||||
| Bronx, NY |
423 | 0 | 423 | 0 | 423 | 0 | 2013 | |||||||||||||||||||||
| Bronx, NY |
390 | 54 | 251 | 193 | 444 | 154 | 1985 | |||||||||||||||||||||
| Bronx, NY |
877 | 0 | 877 | 0 | 877 | 0 | 2013 | |||||||||||||||||||||
| Bronx, NY |
884 | 0 | 884 | 0 | 884 | 0 | 2013 | |||||||||||||||||||||
| Bronx, NY |
953 | 0 | 953 | 0 | 953 | 0 | 2013 | |||||||||||||||||||||
| Bronx, NY |
1,049 | 0 | 485 | 564 | 1,049 | 87 | 2013 | |||||||||||||||||||||
| Bronx, NY |
1,910 | 0 | 1,349 | 561 | 1,910 | 90 | 2013 | |||||||||||||||||||||
| Bronx, NY |
2,408 | 0 | 1,712 | 696 | 2,408 | 101 | 2013 | |||||||||||||||||||||
| Bronxville, NY |
1,232 | 0 | 1,232 | 0 | 1,232 | 0 | 2011 | |||||||||||||||||||||
| Brooklyn, NY |
75 | 272 | 45 | 302 | 347 | 285 | 1978 | |||||||||||||||||||||
| Brooklyn, NY |
0 | 396 | 0 | 396 | 396 | 170 | 1970 | |||||||||||||||||||||
| Brooklyn, NY |
75 | 365 | 31 | 409 | 440 | 184 | 1967 | |||||||||||||||||||||
| Brooklyn, NY |
100 | 345 | 67 | 378 | 445 | 152 | 1972 | |||||||||||||||||||||
| Brooklyn, NY |
237 | 341 | 154 | 424 | 578 | 120 | 1985 | |||||||||||||||||||||
| Brooklyn, NY |
148 | 461 | 104 | 505 | 609 | 213 | 1972 | |||||||||||||||||||||
| Brooklyn, NY |
282 | 457 | 176 | 563 | 739 | 336 | 1967 | |||||||||||||||||||||
| Brooklyn, NY |
422 | 334 | 275 | 481 | 756 | 217 | 1985 | |||||||||||||||||||||
| Brooklyn, NY |
476 | 320 | 306 | 490 | 796 | 222 | 1985 | |||||||||||||||||||||
| Brooklyn, NY |
627 | 313 | 408 | 532 | 940 | 238 | 1985 | |||||||||||||||||||||
| Buffalo, NY |
313 | 241 | 151 | 403 | 554 | 138 | 2000 | |||||||||||||||||||||
| Byron, NY |
969 | 0 | 669 | 300 | 969 | 118 | 2006 | |||||||||||||||||||||
| Central Islip, NY |
573 | 17 | 358 | 232 | 590 | 153 | 1998 | |||||||||||||||||||||
| Chester, NY |
1,158 | 0 | 1,158 | 0 | 1,158 | 0 | 2011 | |||||||||||||||||||||
| Churchville, NY |
1,011 | 0 | 601 | 410 | 1,011 | 161 | 2006 | |||||||||||||||||||||
| Commack, NY |
321 | 26 | 209 | 138 | 347 | 106 | 1985 | |||||||||||||||||||||
| Corona, NY |
114 | 322 | 113 | 323 | 436 | 306 | 1965 | |||||||||||||||||||||
| Corona, NY |
2,543 | 0 | 1,903 | 640 | 2,543 | 94 | 2013 | |||||||||||||||||||||
| Cortland Manor, NY |
1,872 | 0 | 1,872 | 0 | 1,872 | 0 | 2011 | |||||||||||||||||||||
84
Table of Contents
| Initial Cost of Leasehold or Acquisition Investment to Company (1) |
Cost Capitalized Subsequent to Initial Investment |
Gross Amount at Which Carried at Close of Period |
Total Cost |
Accumulated Depreciation |
Date of Initial Leasehold or Acquisition Investment (1) |
|||||||||||||||||||||||
| Land |
Building and |
|||||||||||||||||||||||||||
| Dobbs Ferry, NY |
671 | 73 | 434 | 310 | 744 | 243 | 1985 | |||||||||||||||||||||
| Dobbs Ferry, NY |
1,345 | 0 | 1,345 | 0 | 1,345 | 0 | 2011 | |||||||||||||||||||||
| East Hampton, NY |
660 | 39 | 428 | 271 | 699 | 205 | 1985 | |||||||||||||||||||||
| East Islip, NY |
89 | 558 | 87 | 560 | 647 | 209 | 1972 | |||||||||||||||||||||
| East Pembroke, NY |
787 | 0 | 537 | 250 | 787 | 98 | 2006 | |||||||||||||||||||||
| Eastchester, NY |
1,724 | 0 | 1,724 | 0 | 1,724 | 0 | 2011 | |||||||||||||||||||||
| Elmont, NY |
389 | 319 | 231 | 477 | 708 | 262 | 1978 | |||||||||||||||||||||
| Elmsford, NY |
(1 | ) | 1,156 | 581 | 574 | 1,155 | 193 | 1971 | ||||||||||||||||||||
| Elmsford, NY |
1,453 | 0 | 1,453 | 0 | 1,453 | 0 | 2011 | |||||||||||||||||||||
| Fishkill, NY |
1,793 | 0 | 1,793 | 0 | 1,793 | 0 | 2011 | |||||||||||||||||||||
| Floral Park, NY |
616 | 287 | 356 | 547 | 903 | 227 | 1998 | |||||||||||||||||||||
| Flushing, NY |
516 | 241 | 320 | 437 | 757 | 161 | 1998 | |||||||||||||||||||||
| Flushing, NY |
1,936 | 0 | 1,413 | 523 | 1,936 | 80 | 2013 | |||||||||||||||||||||
| Flushing, NY |
1,947 | 0 | 1,405 | 542 | 1,947 | 76 | 2013 | |||||||||||||||||||||
| Flushing, NY |
2,478 | 0 | 1,801 | 677 | 2,478 | 95 | 2013 | |||||||||||||||||||||
| Forrest Hill, NY |
1,273 | 0 | 1,273 | 0 | 1,273 | 0 | 2013 | |||||||||||||||||||||
| Franklin Square, NY |
153 | 331 | 137 | 347 | 484 | 121 | 1978 | |||||||||||||||||||||
| Friendship, NY |
393 | 0 | 43 | 350 | 393 | 138 | 2006 | |||||||||||||||||||||
| GardenCity, NY |
362 | 242 | 236 | 368 | 604 | 127 | 1985 | |||||||||||||||||||||
| Garnerville, NY |
1,508 | 0 | 1,508 | 0 | 1,508 | 0 | 2011 | |||||||||||||||||||||
| Glen Head, NY |
235 | 469 | 103 | 601 | 704 | 369 | 1982 | |||||||||||||||||||||
| Glen Head, NY |
463 | 282 | 301 | 444 | 745 | 185 | 1985 | |||||||||||||||||||||
| Glendale, NY |
124 | 205 | 86 | 243 | 329 | 133 | 1976 | |||||||||||||||||||||
| Glendale, NY |
369 | 280 | 236 | 413 | 649 | 156 | 1985 | |||||||||||||||||||||
| Great Neck, NY |
500 | 252 | 450 | 302 | 752 | 97 | 1985 | |||||||||||||||||||||
| Greigsville, NY |
1,018 | 0 | 203 | 815 | 1,018 | 397 | 2008 | |||||||||||||||||||||
| Hartsdale, NY |
1,626 | 0 | 1,626 | 0 | 1,626 | 0 | 2011 | |||||||||||||||||||||
| Hawthorne, NY |
2,084 | 0 | 2,084 | 0 | 2,084 | 0 | 2011 | |||||||||||||||||||||
| Hopewell Junction, NY |
1,163 | 0 | 1,163 | 0 | 1,163 | 0 | 2011 | |||||||||||||||||||||
| Huntington Station, NY |
141 | 284 | 84 | 341 | 425 | 132 | 1978 | |||||||||||||||||||||
| Hyde Park, NY |
990 | 0 | 990 | 0 | 990 | 0 | 2011 | |||||||||||||||||||||
| Katonah, NY |
1,084 | 0 | 1,084 | 0 | 1,084 | 0 | 2011 | |||||||||||||||||||||
| Lagrangeville, NY |
129 | 1,123 | 64 | 1,188 | 1,252 | 280 | 1972 | |||||||||||||||||||||
| Lakeville, NY |
1,028 | 0 | 203 | 825 | 1,028 | 405 | 2008 | |||||||||||||||||||||
| Levittown, NY |
503 | 42 | 327 | 218 | 545 | 168 | 1985 | |||||||||||||||||||||
| Levittown, NY |
547 | 86 | 356 | 277 | 633 | 198 | 1985 | |||||||||||||||||||||
| Long Island City, NY |
106 | 265 | 73 | 298 | 371 | 111 | 1976 | |||||||||||||||||||||
| Long Island City, NY |
2,717 | 0 | 1,183 | 1,534 | 2,717 | 196 | 2013 | |||||||||||||||||||||
| Mamaroneck, NY |
1,429 | 0 | 1,429 | 0 | 1,429 | 0 | 2011 | |||||||||||||||||||||
| Massapequa, NY |
333 | 285 | 217 | 401 | 618 | 138 | 1985 | |||||||||||||||||||||
| Mastic, NY |
313 | 110 | 204 | 219 | 423 | 189 | 1985 | |||||||||||||||||||||
| Middletown, NY |
719 | 0 | 719 | 0 | 719 | 0 | 2011 | |||||||||||||||||||||
| Middletown, NY |
751 | 274 | 489 | 536 | 1,025 | 245 | 1985 | |||||||||||||||||||||
| Middletown, NY |
1,281 | 0 | 1,281 | 0 | 1,281 | 0 | 2011 | |||||||||||||||||||||
| Millwood, NY |
1,448 | 0 | 1,448 | 0 | 1,448 | 0 | 2011 | |||||||||||||||||||||
| Mount Kisco, NY |
1,907 | 0 | 1,907 | 0 | 1,907 | 0 | 2011 | |||||||||||||||||||||
| Mount Vernon, NY |
985 | 0 | 985 | 0 | 985 | 0 | 2011 | |||||||||||||||||||||
85
Table of Contents
| Initial Cost of Leasehold or Acquisition Investment to Company (1) |
Cost Capitalized Subsequent to Initial Investment |
Gross Amount at Which Carried at Close of Period |
Total Cost |
Accumulated Depreciation |
Date of Initial Leasehold or Acquisition Investment (1) |
|||||||||||||||||||||||
| Land |
Building and |
|||||||||||||||||||||||||||
| Nanuet, NY |
2,316 | 0 | 2,316 | 0 | 2,316 | 0 | 2011 | |||||||||||||||||||||
| New Paltz, NY |
971 | 0 | 971 | 0 | 971 | 0 | 2011 | |||||||||||||||||||||
| New Rochelle, NY |
189 | 301 | 104 | 386 | 490 | 148 | 1982 | |||||||||||||||||||||
| New Rochelle, NY |
1,887 | 0 | 1,887 | 0 | 1,887 | 0 | 2011 | |||||||||||||||||||||
| New Windsor, NY |
1,084 | 0 | 1,084 | 0 | 1,084 | 0 | 2011 | |||||||||||||||||||||
| New York, NY |
126 | 399 | 78 | 447 | 525 | 239 | 1972 | |||||||||||||||||||||
| Newburgh, NY |
527 | 0 | 527 | 0 | 527 | 0 | 2011 | |||||||||||||||||||||
| Newburgh, NY |
1,192 | 0 | 1,192 | 0 | 1,192 | 0 | 2011 | |||||||||||||||||||||
| Niskayuna, NY |
425 | 35 | 275 | 185 | 460 | 185 | 1986 | |||||||||||||||||||||
| North Lindenhurst, NY |
294 | 244 | 192 | 346 | 538 | 119 | 1998 | |||||||||||||||||||||
| Ossining, NY |
70 | 305 | 43 | 332 | 375 | 114 | 1977 | |||||||||||||||||||||
| Ossining, NY |
231 | 166 | 117 | 280 | 397 | 77 | 1985 | |||||||||||||||||||||
| Ozone Park, NY |
57 | 367 | 45 | 379 | 424 | 153 | 1976 | |||||||||||||||||||||
| Peekskill, NY |
2,207 | 0 | 2,207 | 0 | 2,207 | 0 | 2011 | |||||||||||||||||||||
| Pelham Manor, NY |
137 | 307 | 75 | 369 | 444 | 160 | 1985 | |||||||||||||||||||||
| Pelham, NY |
1,035 | 0 | 1,035 | 0 | 1,035 | 0 | 2011 | |||||||||||||||||||||
| Pleasant Valley, NY |
398 | 155 | 240 | 313 | 553 | 294 | 1986 | |||||||||||||||||||||
| Port Chester, NY |
941 | 0 | 0 | 941 | 941 | 277 | 2011 | |||||||||||||||||||||
| Port Chester, NY |
1,015 | 0 | 1,015 | 0 | 1,015 | 0 | 2011 | |||||||||||||||||||||
| Port Jefferson, NY |
388 | 293 | 246 | 435 | 681 | 187 | 1985 | |||||||||||||||||||||
| Poughkeepsie, NY |
33 | 409 | 36 | 406 | 442 | 186 | 1971 | |||||||||||||||||||||
| Poughkeepsie, NY |
591 | 0 | 591 | 0 | 591 | 0 | 2011 | |||||||||||||||||||||
| Poughkeepsie, NY |
1,020 | 0 | 1,020 | 0 | 1,020 | 0 | 2011 | |||||||||||||||||||||
| Poughkeepsie, NY |
1,232 | (32 | ) | 1,200 | 0 | 1,200 | 0 | 2011 | ||||||||||||||||||||
| Poughkeepsie, NY |
1,306 | 0 | 1,306 | 0 | 1,306 | 0 | 2011 | |||||||||||||||||||||
| Poughkeepsie, NY |
1,340 | 0 | 1,340 | 0 | 1,340 | 0 | 2011 | |||||||||||||||||||||
| Poughkeepsie, NY |
1,355 | 0 | 1,355 | 0 | 1,355 | 0 | 2011 | |||||||||||||||||||||
| Rego Park, NY |
2,783 | 0 | 2,104 | 679 | 2,783 | 100 | 2013 | |||||||||||||||||||||
| Riverhead, NY |
724 | 0 | 432 | 292 | 724 | 204 | 1998 | |||||||||||||||||||||
| Rochester, NY |
559 | 0 | 159 | 400 | 559 | 157 | 2006 | |||||||||||||||||||||
| Rochester, NY |
595 | 0 | 305 | 290 | 595 | 105 | 2008 | |||||||||||||||||||||
| Rockaway Beach, NY |
110 | 285 | 79 | 316 | 395 | 102 | 1972 | |||||||||||||||||||||
| Rockville Centre, NY |
350 | 66 | 201 | 215 | 416 | 185 | 1985 | |||||||||||||||||||||
| Rokaway Park, NY |
1,605 | 0 | 1,605 | 0 | 1,605 | 0 | 2013 | |||||||||||||||||||||
| Rye, NY |
872 | 0 | 872 | 0 | 872 | 0 | 2011 | |||||||||||||||||||||
| Sag Harbor, NY |
704 | 35 | 458 | 281 | 739 | 211 | 1985 | |||||||||||||||||||||
| Savona, NY |
1,314 | 0 | 964 | 350 | 1,314 | 138 | 2006 | |||||||||||||||||||||
| Sayville, NY |
344 | 246 | 300 | 290 | 590 | 56 | 1998 | |||||||||||||||||||||
| Scarsdale, NY |
1,301 | 0 | 1,301 | 0 | 1,301 | 0 | 2011 | |||||||||||||||||||||
| ShrubOak, NY |
1,061 | 518 | 691 | 888 | 1,579 | 432 | 1985 | |||||||||||||||||||||
| Sleepy Hollow, NY |
281 | 368 | 130 | 519 | 649 | 320 | 1969 | |||||||||||||||||||||
| Smithtown, NY |
88 | 287 | 51 | 324 | 375 | 111 | 1977 | |||||||||||||||||||||
| Spring Valley, NY |
749 | 0 | 749 | 0 | 749 | 0 | 2011 | |||||||||||||||||||||
| St. Albans, NY |
330 | 220 | 215 | 335 | 550 | 157 | 1985 | |||||||||||||||||||||
| Staten Island, NY |
358 | 35 | 230 | 163 | 393 | 128 | 1985 | |||||||||||||||||||||
| Staten Island, NY |
390 | 89 | 254 | 225 | 479 | 186 | 1985 | |||||||||||||||||||||
| Staten Island, NY |
301 | 324 | 196 | 429 | 625 | 178 | 1985 | |||||||||||||||||||||
86
Table of Contents
| Initial Cost of Leasehold or Acquisition Investment to Company (1) |
Cost Capitalized Subsequent to Initial Investment |
Gross Amount at Which Carried at Close of Period |
Total Cost |
Accumulated Depreciation |
Date of Initial Leasehold or Acquisition Investment (1) |
|||||||||||||||||||||||
| Land |
Building and |
|||||||||||||||||||||||||||
| Staten Island, NY |
350 | 290 | 228 | 412 | 640 | 156 | 1985 | |||||||||||||||||||||
| Stony Brook, NY |
176 | 281 | 105 | 352 | 457 | 139 | 1978 | |||||||||||||||||||||
| Tarrytown, NY |
956 | 0 | 956 | 0 | 956 | 0 | 2011 | |||||||||||||||||||||
| Tuchahoe, NY |
1,650 | 0 | 1,650 | 0 | 1,650 | 0 | 2011 | |||||||||||||||||||||
| Wantagh, NY |
640 | 0 | 370 | 270 | 640 | 188 | 1998 | |||||||||||||||||||||
| Wappingers Falls, NY |
452 | 0 | 0 | 452 | 452 | 202 | 2011 | |||||||||||||||||||||
| Wappingers Falls, NY |
1,488 | 0 | 1,488 | 0 | 1,488 | 0 | 2011 | |||||||||||||||||||||
| Warsaw, NY |
990 | 0 | 690 | 300 | 990 | 118 | 2006 | |||||||||||||||||||||
| Warwick, NY |
1,049 | 0 | 1,049 | 0 | 1,049 | 0 | 2011 | |||||||||||||||||||||
| WestNyack, NY |
936 | 0 | 936 | 0 | 936 | 0 | 2011 | |||||||||||||||||||||
| West Taghkanic, NY |
203 | 469 | 122 | 550 | 672 | 267 | 1986 | |||||||||||||||||||||
| Westbury, NY |
64 | 300 | 37 | 327 | 364 | 109 | 1972 | |||||||||||||||||||||
| White Plains, NY |
121 | 352 | 0 | 473 | 473 | 187 | 1979 | |||||||||||||||||||||
| White Plains, NY |
1 | 746 | 303 | 444 | 747 | 165 | 1972 | |||||||||||||||||||||
| White Plains, NY |
1,458 | 0 | 1,458 | 0 | 1,458 | 0 | 2011 | |||||||||||||||||||||
| Wyandanch, NY |
416 | (84 | ) | 262 | 70 | 332 | 11 | 1998 | ||||||||||||||||||||
| Yaphank, NY |
0 | 798 | 375 | 423 | 798 | 64 | 1993 | |||||||||||||||||||||
| Yonkers, NY |
154 | 288 | 77 | 365 | 442 | 138 | 1987 | |||||||||||||||||||||
| Yonkers, NY |
0 | 644 | 0 | 644 | 644 | 199 | 1970 | |||||||||||||||||||||
| Yonkers, NY |
0 | 1,040 | 780 | 260 | 1,040 | 65 | 1990 | |||||||||||||||||||||
| Yonkers, NY |
1,021 | 63 | 665 | 419 | 1,084 | 318 | 1985 | |||||||||||||||||||||
| Yonkers, NY |
291 | 1,015 | 216 | 1,090 | 1,306 | 276 | 1972 | |||||||||||||||||||||
| Yonkers, NY |
1,907 | 0 | 1,907 | 0 | 1,907 | 0 | 2011 | |||||||||||||||||||||
| Yorktown Heights, NY |
2,365 | 0 | 2,365 | 0 | 2,365 | 0 | 2011 | |||||||||||||||||||||
| Crestline, OH |
1,202 | 0 | 285 | 917 | 1,202 | 330 | 2008 | |||||||||||||||||||||
| Mansfield, OH |
922 | 0 | 332 | 590 | 922 | 199 | 2008 | |||||||||||||||||||||
| Mansfield, OH |
1,950 | 0 | 700 | 1,250 | 1,950 | 409 | 2009 | |||||||||||||||||||||
| Monroeville, OH |
2,580 | 0 | 485 | 2,095 | 2,580 | 660 | 2009 | |||||||||||||||||||||
| Banks, OR |
498 | 0 | 498 | 0 | 498 | 0 | 2015 | |||||||||||||||||||||
| Estacada, OR |
646 | 0 | 84 | 562 | 646 | 18 | 2015 | |||||||||||||||||||||
| Pendleton, OR |
766 | 0 | 122 | 644 | 766 | 23 | 2015 | |||||||||||||||||||||
| Portland, OR |
4,416 | 0 | 3,368 | 1,048 | 4,416 | 35 | 2015 | |||||||||||||||||||||
| Salem, OR |
1,071 | 0 | 399 | 672 | 1,071 | 28 | 2015 | |||||||||||||||||||||
| Salem, OR |
1,350 | 0 | 521 | 829 | 1,350 | 28 | 2015 | |||||||||||||||||||||
| Salem, OR |
1,408 | 0 | 524 | 884 | 1,408 | 31 | 2015 | |||||||||||||||||||||
| Salem, OR |
4,215 | 0 | 3,182 | 1,033 | 4,215 | 37 | 2015 | |||||||||||||||||||||
| Salem, OR |
5,130 | 0 | 4,033 | 1,097 | 5,130 | 37 | 2015 | |||||||||||||||||||||
| Springfield, OR |
1,398 | 0 | 796 | 602 | 1,398 | 25 | 2015 | |||||||||||||||||||||
| Allentown, PA |
358 | 31 | 233 | 156 | 389 | 120 | 1985 | |||||||||||||||||||||
| Allison Park, PA |
1,500 | 0 | 850 | 650 | 1,500 | 292 | 2010 | |||||||||||||||||||||
| Harrisburg, PA |
399 | 213 | 199 | 413 | 612 | 305 | 1989 | |||||||||||||||||||||
| Havertown, PA |
402 | 63 | 254 | 211 | 465 | 135 | 1985 | |||||||||||||||||||||
| Lancaster, PA |
642 | 18 | 300 | 360 | 660 | 360 | 1989 | |||||||||||||||||||||
| Mohnton, PA |
317 | 12 | 66 | 263 | 329 | 262 | 1989 | |||||||||||||||||||||
| New Holland, PA |
312 | 20 | 143 | 189 | 332 | 184 | 1989 | |||||||||||||||||||||
| New Kensington, PA |
1,375 | 0 | 675 | 700 | 1,375 | 176 | 2010 | |||||||||||||||||||||
| New Oxford, PA |
1,045 | (237 | ) | 19 | 789 | 808 | 775 | 1996 | ||||||||||||||||||||
87
Table of Contents
| Initial Cost of Leasehold or Acquisition Investment to Company (1) |
Cost Capitalized Subsequent to Initial Investment |
Gross Amount at Which Carried at Close of Period |
Total Cost |
Accumulated Depreciation |
Date of Initial Leasehold or Acquisition Investment (1) |
|||||||||||||||||||||||
| Land |
Building and |
|||||||||||||||||||||||||||
| Philadelphia, PA |
405 | 175 | 264 | 316 | 580 | 250 | 1985 | |||||||||||||||||||||
| Philadelphia, PA |
1,252 | 0 | 814 | 438 | 1,252 | 119 | 2009 | |||||||||||||||||||||
| Pottsville, PA |
452 | 1 | 148 | 305 | 453 | 304 | 1990 | |||||||||||||||||||||
| Reading, PA |
750 | 49 | 0 | 799 | 799 | 799 | 1989 | |||||||||||||||||||||
| Ashaway, RI |
619 | 0 | 402 | 217 | 619 | 97 | 2004 | |||||||||||||||||||||
| Barrington, RI |
490 | 180 | 319 | 351 | 670 | 217 | 1985 | |||||||||||||||||||||
| East Providence, RI |
2,298 | (1,556 | ) | 372 | 370 | 742 | 0 | 1985 | ||||||||||||||||||||
| N. Providence, RI |
543 | 158 | 353 | 348 | 701 | 200 | 1985 | |||||||||||||||||||||
| Austin, TX |
462 | 0 | 274 | 188 | 462 | 107 | 2007 | |||||||||||||||||||||
| Austin, TX |
2,368 | 0 | 738 | 1,630 | 2,368 | 655 | 2007 | |||||||||||||||||||||
| Austin, TX |
3,511 | 0 | 1,595 | 1,916 | 3,511 | 778 | 2007 | |||||||||||||||||||||
| Bedford, TX |
353 | 0 | 113 | 240 | 353 | 146 | 2007 | |||||||||||||||||||||
| Ft. Worth, TX |
2,115 | 0 | 866 | 1,249 | 2,115 | 567 | 2007 | |||||||||||||||||||||
| Garland, TX |
3,296 | 0 | 245 | 3,051 | 3,296 | 154 | 2014 | |||||||||||||||||||||
| Garland, TX |
4,439 | 0 | 439 | 4,000 | 4,439 | 211 | 2014 | |||||||||||||||||||||
| Harker Heights, TX |
2,051 | 0 | 588 | 1,463 | 2,051 | 968 | 2007 | |||||||||||||||||||||
| Houston, TX |
1,689 | 0 | 224 | 1,465 | 1,689 | 558 | 2007 | |||||||||||||||||||||
| Keller, TX |
2,507 | 0 | 996 | 1,511 | 2,507 | 645 | 2007 | |||||||||||||||||||||
| Lewisville, TX |
494 | 0 | 110 | 384 | 494 | 180 | 2008 | |||||||||||||||||||||
| Midlothian, TX |
429 | 0 | 72 | 357 | 429 | 186 | 2007 | |||||||||||||||||||||
| San Marcos, TX |
1,954 | 0 | 251 | 1,703 | 1,954 | 668 | 2007 | |||||||||||||||||||||
| Temple, TX |
2,405 | (10 | ) | 1,205 | 1,190 | 2,395 | 520 | 2007 | ||||||||||||||||||||
| The Colony, TX |
4,396 | 0 | 337 | 4,059 | 4,396 | 1,502 | 2007 | |||||||||||||||||||||
| Waco, TX |
3,884 | 0 | 894 | 2,990 | 3,884 | 1,313 | 2007 | |||||||||||||||||||||
| Alexandria, VA |
649 | 0 | 649 | 0 | 649 | 0 | 2013 | |||||||||||||||||||||
| Alexandria, VA |
656 | 0 | 409 | 247 | 656 | 41 | 2013 | |||||||||||||||||||||
| Alexandria, VA |
712 | 0 | 712 | 0 | 712 | 0 | 2013 | |||||||||||||||||||||
| Alexandria, VA |
735 | 0 | 735 | 0 | 735 | 0 | 2013 | |||||||||||||||||||||
| Alexandria, VA |
1,327 | 0 | 1,327 | 0 | 1,327 | 0 | 2013 | |||||||||||||||||||||
| Alexandria, VA |
1,388 | 0 | 1,020 | 368 | 1,388 | 62 | 2013 | |||||||||||||||||||||
| Alexandria, VA |
1,582 | 0 | 1,150 | 432 | 1,582 | 66 | 2013 | |||||||||||||||||||||
| Alexandria, VA |
1,757 | 0 | 1,313 | 444 | 1,757 | 72 | 2013 | |||||||||||||||||||||
| Annandale, VA |
1,718 | 0 | 1,718 | 0 | 1,718 | 0 | 2013 | |||||||||||||||||||||
| Arlington, VA |
1,083 | 0 | 1,083 | 0 | 1,083 | 0 | 2013 | |||||||||||||||||||||
| Arlington, VA |
1,464 | 0 | 1,085 | 379 | 1,464 | 59 | 2013 | |||||||||||||||||||||
| Arlington, VA |
2,014 | 0 | 1,516 | 498 | 2,014 | 75 | 2013 | |||||||||||||||||||||
| Arlington, VA |
2,062 | 0 | 1,603 | 459 | 2,062 | 69 | 2013 | |||||||||||||||||||||
| Ashland, VA |
840 | 0 | 840 | 0 | 840 | 0 | 2005 | |||||||||||||||||||||
| Chesapeake, VA |
780 | (77 | ) | 398 | 305 | 703 | 46 | 1990 | ||||||||||||||||||||
| Chesapeake, VA |
1,004 | 110 | 385 | 729 | 1,114 | 636 | 1990 | |||||||||||||||||||||
| Fairfax, VA |
1,825 | 0 | 1,190 | 635 | 1,825 | 96 | 2013 | |||||||||||||||||||||
| Fairfax, VA |
2,078 | 0 | 1,365 | 713 | 2,078 | 93 | 2013 | |||||||||||||||||||||
| Fairfax, VA |
3,348 | 0 | 2,351 | 997 | 3,348 | 142 | 2013 | |||||||||||||||||||||
| Fairfax, VA |
4,454 | 0 | 3,370 | 1,084 | 4,454 | 155 | 2013 | |||||||||||||||||||||
| Farmville, VA |
1,227 | 0 | 622 | 605 | 1,227 | 260 | 2005 | |||||||||||||||||||||
| Fredericksburg, VA |
1,279 | 0 | 469 | 810 | 1,279 | 348 | 2005 | |||||||||||||||||||||
| Fredericksburg, VA |
1,289 | 19 | 798 | 510 | 1,308 | 227 | 2005 | |||||||||||||||||||||
88
Table of Contents
| Initial Cost of Leasehold or Acquisition Investment to Company (1) |
Cost Capitalized Subsequent to Initial Investment |
Gross Amount at Which Carried at Close of Period |
Total Cost |
Accumulated Depreciation |
Date of Initial Leasehold or Acquisition Investment (1) |
|||||||||||||||||||||||
| Land |
Building and |
|||||||||||||||||||||||||||
| Fredericksburg, VA |
1,716 | 0 | 996 | 720 | 1,716 | 310 | 2005 | |||||||||||||||||||||
| Fredericksburg, VA |
3,623 | 0 | 2,828 | 795 | 3,623 | 342 | 2005 | |||||||||||||||||||||
| Glen Allen, VA |
1,037 | 0 | 412 | 625 | 1,037 | 269 | 2005 | |||||||||||||||||||||
| Glen Allen, VA |
1,077 | 0 | 322 | 755 | 1,077 | 325 | 2005 | |||||||||||||||||||||
| King William, VA |
1,688 | 0 | 1,068 | 620 | 1,688 | 267 | 2005 | |||||||||||||||||||||
| Mechanicsville, VA |
903 | 0 | 273 | 630 | 903 | 271 | 2005 | |||||||||||||||||||||
| Mechanicsville, VA |
957 | 0 | 324 | 633 | 957 | 300 | 2005 | |||||||||||||||||||||
| Mechanicsville, VA |
1,043 | 0 | 223 | 820 | 1,043 | 353 | 2005 | |||||||||||||||||||||
| Mechanicsville, VA |
1,125 | 0 | 505 | 620 | 1,125 | 267 | 2005 | |||||||||||||||||||||
| Mechanicsville, VA |
1,476 | 0 | 876 | 600 | 1,476 | 258 | 2005 | |||||||||||||||||||||
| Mechanicsville, VA |
1,677 | 0 | 1,157 | 520 | 1,677 | 224 | 2005 | |||||||||||||||||||||
| Montpelier, VA |
2,481 | (114 | ) | 1,612 | 755 | 2,367 | 325 | 2005 | ||||||||||||||||||||
| Norfolk, VA |
535 | 6 | 311 | 230 | 541 | 230 | 1990 | |||||||||||||||||||||
| Petersburg, VA |
1,441 | 0 | 816 | 625 | 1,441 | 269 | 2005 | |||||||||||||||||||||
| Portsmouth, VA |
563 | 33 | 222 | 374 | 596 | 362 | 1990 | |||||||||||||||||||||
| Richmond, VA |
1,132 | (41 | ) | 506 | 585 | 1,091 | 252 | 2005 | ||||||||||||||||||||
| RutherGlen, VA |
466 | 0 | 31 | 435 | 466 | 187 | 2005 | |||||||||||||||||||||
| Sandston, VA |
722 | 0 | 102 | 620 | 722 | 267 | 2005 | |||||||||||||||||||||
| Spotsylvania, VA |
1,290 | 0 | 490 | 800 | 1,290 | 344 | 2005 | |||||||||||||||||||||
| Springfield, VA |
4,257 | 0 | 2,969 | 1,288 | 4,257 | 182 | 2013 | |||||||||||||||||||||
| Auburn, WA |
3,022 | 0 | 1,965 | 1,057 | 3,022 | 36 | 2015 | |||||||||||||||||||||
| Bellevue, WA |
1,725 | 0 | 886 | 839 | 1,725 | 29 | 2015 | |||||||||||||||||||||
| Chehalis, WA |
1,176 | 0 | 313 | 863 | 1,176 | 33 | 2015 | |||||||||||||||||||||
| Colfax, WA |
4,800 | 0 | 3,611 | 1,189 | 4,800 | 41 | 2015 | |||||||||||||||||||||
| Federal Way, WA |
4,218 | 0 | 2,973 | 1,245 | 4,218 | 46 | 2015 | |||||||||||||||||||||
| Fife, WA |
1,211 | 0 | 444 | 767 | 1,211 | 29 | 2015 | |||||||||||||||||||||
| Kent, WA |
2,900 | 0 | 2,066 | 834 | 2,900 | 31 | 2015 | |||||||||||||||||||||
| Monroe, WA |
2,792 | 0 | 1,556 | 1,236 | 2,792 | 44 | 2015 | |||||||||||||||||||||
| Port Orchard, WA |
2,019 | 0 | 161 | 1,858 | 2,019 | 55 | 2015 | |||||||||||||||||||||
| Puyallup, WA |
831 | 0 | 172 | 659 | 831 | 26 | 2015 | |||||||||||||||||||||
| Puyallup, WA |
2,035 | 0 | 465 | 1,570 | 2,035 | 53 | 2015 | |||||||||||||||||||||
| Puyallup, WA |
4,050 | 0 | 2,394 | 1,656 | 4,050 | 70 | 2015 | |||||||||||||||||||||
| Renton, WA |
1,485 | 0 | 952 | 533 | 1,485 | 25 | 2015 | |||||||||||||||||||||
| Seattle, WA |
346 | 0 | 346 | 0 | 346 | 0 | 2015 | |||||||||||||||||||||
| Seattle, WA |
717 | 0 | 193 | 524 | 717 | 17 | 2015 | |||||||||||||||||||||
| Seattle, WA |
1,884 | 0 | 1,223 | 661 | 1,884 | 22 | 2015 | |||||||||||||||||||||
| Silverdale, WA |
2,178 | 0 | 1,217 | 961 | 2,178 | 36 | 2015 | |||||||||||||||||||||
| Snohomish, WA |
955 | 0 | 955 | 0 | 955 | 0 | 2015 | |||||||||||||||||||||
| South Bend, WA |
760 | 0 | 121 | 639 | 760 | 21 | 2015 | |||||||||||||||||||||
| Spokane, WA |
346 | 0 | 346 | 0 | 346 | 0 | 2015 | |||||||||||||||||||||
| Tacoma, WA |
518 | 0 | 518 | 0 | 518 | 0 | 2015 | |||||||||||||||||||||
| Tacoma, WA |
671 | 0 | 671 | 0 | 671 | 0 | 2015 | |||||||||||||||||||||
| Tenino, WA |
937 | 0 | 219 | 718 | 937 | 23 | 2015 | |||||||||||||||||||||
| Vancouver, WA |
1,214 | 0 | 163 | 1,051 | 1,214 | 31 | 2015 | |||||||||||||||||||||
| Wilbur, WA |
629 | 0 | 153 | 476 | 629 | 17 | 2015 | |||||||||||||||||||||
| Miscellaneous |
30,725 | 11,587 | 14,557 | 27,755 | 42,312 | 17,426 | various | |||||||||||||||||||||
|
|
|
|
|
|
|
|
|
|
|
|
|
|||||||||||||||||
| $ | 715,783 | $ | 67,450 | $ | 476,387 | $ | 306,846 | $ | 783,233 | $ | 107,370 | |||||||||||||||||
|
|
|
|
|
|
|
|
|
|
|
|
|
|||||||||||||||||
| 1) | Initial cost of leasehold or acquisition investment to company represents the aggregate of the cost incurred during the year in which we purchased the property for owned properties or purchased a leasehold interest in leased properties. Cost capitalized subsequent to initial investment includes investments made in previously leased properties prior to their acquisition. |
| 2) | Depreciation of real estate is computed on the straight-line method based upon the estimated useful lives of the assets, which generally range from 16 to 25 years for buildings and improvements, or the term of the lease if shorter. Leasehold interests are amortized over the remaining term of the underlying lease. |
| 3) | The aggregate cost for federal income tax purposes was approximately $775,000,000 at December 31, 2015. |
89
Table of Contents
GETTY REALTY CORP. and SUBSIDIARIES
SCHEDULE IV—MORTGAGE LOANS ON REAL ESTATE
As of December 31, 2015
(in thousands)
| Type of Loan/Borrower |
Description |
Location(s) |
Interest Rate |
Final Maturity Date |
Periodic Payment Terms (a) |
Prior Liens |
Face Value at Inception |
Amount of Principal Unpaid at Close of Period |
||||||||||||||||||
| Mortgage Loans: |
||||||||||||||||||||||||||
| Borrower A | Seller financing | Horsham, PA | 10.0 | % | 7/2024 | P & I | — | $ | 237 | $ | 158 | |||||||||||||||
| Borrower B | Seller financing | Green Island, NY | 11.0 | % | 8/2018 | P & I | — | 298 | 113 | |||||||||||||||||
| Borrower C | Seller financing | Concord, NH | 9.5 | % | 8/2028 | P & I | — | 210 | 173 | |||||||||||||||||
| Borrower D | Seller financing | Irvington, NJ | 10.0 | % | 12/2019 | P & I | — | 300 | 206 | |||||||||||||||||
| Borrower E | Seller financing | Kernersville/Lexington, NC | 8.0 | % | 7/2026 | P & I | — | 568 | 374 | |||||||||||||||||
| Borrower F | Seller financing | Wantagh, NY | 9.0 | % | 5/2032 | P & I | — | 455 | 421 | |||||||||||||||||
| Borrower G | Seller financing | Fullerton Hts, MD | 9.0 | % | 5/2019 | P & I | — | 225 | 94 | |||||||||||||||||
| Borrower H | Seller financing | Springfield, MA | 9.0 | % | 7/2019 | P & I | — | 131 | 112 | |||||||||||||||||
| Borrower I | Seller financing | E. Patchogue, NY | 9.0 | % | 8/2019 | P & I | — | 200 | 186 | |||||||||||||||||
| Borrower J | Seller financing | Manchester, NH | 9.5 | % | 9/2019 | P & I | — | 225 | 211 | |||||||||||||||||
| Borrower K | Seller financing | Union City, NJ | 9.0 | % | 9/2019 | P & I | — | 800 | 768 | |||||||||||||||||
| Borrower L | Seller financing | Bronx, NY | 9.0 | % | 12/2019 | P & I | — | 240 | 155 | |||||||||||||||||
| Borrower M | Seller financing | Seaford, NY | 9.0 | % | 1/2020 | P & I | — | 488 | 458 | |||||||||||||||||
| Borrower N | Seller financing | Spotswood, NJ | 9.0 | % | 1/2020 | P & I | — | 306 | 287 | |||||||||||||||||
| Borrower O | Seller financing | Clifton, NJ | 9.0 | % | 1/2020 | P & I | — | 284 | 267 | |||||||||||||||||
| Borrower P | Seller financing | Freeport, NY | 9.0 | % | 5/2020 | P & I | — | 206 | 195 | |||||||||||||||||
| Borrower Q | Seller financing | Pleasant Valley, NY | 9.0 | % | 10/2020 | P & I | — | 230 | 220 | |||||||||||||||||
| Borrower R | Seller financing | Fairhaven, MA | 9.0 | % | 10/2020 | P & I | — | 458 | 437 | |||||||||||||||||
| Borrower S | Seller financing | Baldwin, NY | 9.0 | % | 10/2020 | P & I | — | 300 | 288 | |||||||||||||||||
| Borrower T | Seller financing | Leicester, MA | 9.0 | % | 11/2020 | P & I | — | 268 | 257 | |||||||||||||||||
| Borrower U | Seller financing | Worcester, MA | 9.0 | % | 11/2020 | P & I | — | 280 | 266 | |||||||||||||||||
| Borrower V | Seller financing | Valley Cottage, NY | 9.0 | % | 11/2020 | P & I | — | 431 | 413 | |||||||||||||||||
| Borrower W | Seller financing | Ephrata, PA | 9.0 | % | 11/2020 | P & I | — | 265 | 253 | |||||||||||||||||
| Borrower X | Seller financing | Piscataway, NJ | 9.0 | % | 12/2020 | P & I | — | 121 | 106 | |||||||||||||||||
| Borrower Y | Seller financing | Westfield, MA | 9.0 | % | 12/2020 | P & I | — | 165 | 158 | |||||||||||||||||
90
Table of Contents
| Type of Loan/Borrower |
Description |
Location(s) |
Interest Rate |
Final Maturity Date |
Periodic Payment Terms (a) |
Prior Liens |
Face Value at Inception |
Amount of Principal Unpaid at Close of Period |
||||||||||||||||||
| Borrower Z | Seller financing | Wilmington, DE | 9.0 | % | 12/2020 | P & I | — | 84 | 81 | |||||||||||||||||
| Borrower AA | Seller financing | Gettysburg, PA | 9.0 | % | 12/2020 | P & I | — | 69 | 66 | |||||||||||||||||
| Borrower AB | Seller financing | Kenmore, NY | 9.0 | % | 1/2021 | P & I | — | 74 | 72 | |||||||||||||||||
| Borrower AC | Seller financing | Weymouth, MA | 9.0 | % | 1/2021 | P & I | — | 390 | 375 | |||||||||||||||||
| Borrower AD | Seller financing | Stafford Springs, CT | 9.0 | % | 2/2021 | P & I | — | 232 | 223 | |||||||||||||||||
| Borrower AE | Seller financing | Latham, NY | 9.0 | % | 2/2021 | P & I | — | 169 | 163 | |||||||||||||||||
| Borrower AF | Seller financing | Magnolia, NJ | 9.0 | % | 5/2020 | P & I | — | 53 | 50 | |||||||||||||||||
| Borrower AG | Seller financing | Colonia, NJ | 9.0 | % | 6/2020 | P & I | — | 320 | 305 | |||||||||||||||||
| Borrower AH | Seller financing | Jersey City, NJ | 9.0 | % | 7/2018 | P & I | — | 500 | 476 | |||||||||||||||||
| Borrower AI | Seller financing | Elmont, NY | 9.0 | % | 2/2020 | P & I | — | 450 | 392 | |||||||||||||||||
| Borrower AJ | Seller financing | Leola, PA | 9.0 | % | 3/2020 | P & I | — | 220 | 208 | |||||||||||||||||
| Borrower AK | Seller financing | Lititz/Rothsville, PA | 9.0 | % | 3/2020 | P & I | — | 180 | 170 | |||||||||||||||||
| Borrower AL | Seller financing | Bayonne, NJ | 9.0 | % | 3/2020 | P & I | — | 308 | 290 | |||||||||||||||||
| Borrower AM | Seller financing | Ballston, NY | 9.0 | % | 5/2020 | P & I | — | 225 | 213 | |||||||||||||||||
| Borrower AN | Seller financing | Reading, PA | 9.0 | % | 3/2021 | P & I | — | 176 | 170 | |||||||||||||||||
| Borrower AO | Seller financing | Waterbury, CT | 9.0 | % | 3/2021 | P & I | — | 171 | 165 | |||||||||||||||||
| Borrower AP | Seller financing | White Plains, NY | 9.0 | % | 3/2021 | P & I | — | 444 | 428 | |||||||||||||||||
| Borrower AQ | Seller financing | Scarsdale, NY | 9.0 | % | 3/2021 | P & I | — | 337 | 325 | |||||||||||||||||
| Borrower AR | Seller financing | York, PA | 9.0 | % | 3/2021 | P & I | — | 102 | 98 | |||||||||||||||||
| Borrower AS | Seller financing | Bristol, CT | 9.0 | % | 4/2021 | P & I | — | 230 | 222 | |||||||||||||||||
| Borrower AT | Seller financing | Belleville, NJ | 9.0 | % | 4/2021 | P & I | — | 315 | 304 | |||||||||||||||||
| Borrower AU | Seller financing | Southbridge, MA | 9.0 | % | 4/2021 | P & I | — | 300 | 290 | |||||||||||||||||
| Borrower AV | Seller financing | Ridgefield, NJ | 9.0 | % | 5/2021 | P & I | — | 172 | 167 | |||||||||||||||||
| Borrower AW | Seller financing | Glenville, NY | 9.0 | % | 5/2021 | P & I | — | 325 | 315 | |||||||||||||||||
| Borrower AX | Seller financing | Great Barrington, MA | 9.0 | % | 5/2021 | P & I | — | 58 | 56 | |||||||||||||||||
| Borrower AY | Seller financing | Rockland, MA | 9.0 | % | 5/2021 | P & I | — | 134 | 130 | |||||||||||||||||
| Borrower AZ | Seller financing | Williamstown, NJ | 9.0 | % | 5/2021 | P & I | — | 42 | 41 | |||||||||||||||||
| Borrower BA | Seller financing | Pine Hill, NJ | 9.0 | % | 5/2021 | P & I | — | 115 | 111 | |||||||||||||||||
| Borrower BB | Seller financing | Belford, NJ | 9.0 | % | 5/2021 | P & I | — | 134 | 130 | |||||||||||||||||
| Borrower BC | Seller financing | Swedesboro, NJ | 9.0 | % | 5/2021 | P & I | — | 77 | 74 | |||||||||||||||||
| Borrower BD | Seller financing | Hatboro, PA | 9.0 | % | 5/2021 | P & I | — | 84 | 81 | |||||||||||||||||
| Borrower BE | Seller financing | Middlesex, NJ | 9.0 | % | 6/2021 | P & I | — | 255 | 247 | |||||||||||||||||
| Borrower BF | Seller financing | Valley Cottage, NY | 9.0 | % | 6/2021 | P & I | — | 92 | 89 | |||||||||||||||||
| Borrower BG | Seller financing | Coxsackie, NY | 9.0 | % | 8/2021 | P & I | — | 153 | 149 | |||||||||||||||||
| Borrower BH | Seller financing | Newburgh, NY | 9.0 | % | 10/2021 | P & I | — | 394 | 384 | |||||||||||||||||
| Borrower BI | Seller financing | Providence, RI | 9.0 | % | 10/2021 | P & I | — | 184 | 179 | |||||||||||||||||
| Borrower BJ | Seller financing | Chatham, NY | 9.0 | % | 10/2021 | P & I | — | 360 | 351 | |||||||||||||||||
| Borrower BK | Seller financing | Warwick, RI | 9.0 | % | 11/2021 | P & I | — | 357 | 349 | |||||||||||||||||
| Borrower BL | Seller financing | New Bedford, MA | 9.0 | % | 11/2021 | P & I | — | 363 | 355 | |||||||||||||||||
| Borrower BM | Seller financing | Fitchburg, MA | 9.0 | % | 12/2021 | P & I | — | 187 | 183 | |||||||||||||||||
| Borrower BN | Seller financing | Queensbury, NY | 9.0 | % | 12/2021 | P & I | — | 176 | 172 | |||||||||||||||||
| Borrower BO | Seller financing | Worcester, MA | 9.0 | % | 12/2021 | P & I | — | 237 | 232 | |||||||||||||||||
| Borrower BP | Seller financing | Westfield, MA | 9.0 | % | 12/2021 | P & I | — | 303 | 297 | |||||||||||||||||
| Borrower BQ | Seller financing | Hyannis, MA | 9.0 | % | 2/2022 | P & I | — | 179 | 175 | |||||||||||||||||
| Borrower BR | Seller financing | S. Yarmouth, MA | 9.0 | % | 2/2022 | P & I | — | 275 | 270 | |||||||||||||||||
| Borrower BS | Seller financing | Harwich Port, MA | 9.0 | % | 2/2022 | P & I | — | 293 | 288 | |||||||||||||||||
| Borrower BT | Seller financing | S. Portland, ME | 9.0 | % | 10/2017 | P & I | — | 229 | 228 | |||||||||||||||||
| Borrower BU | Seller financing | Nyack, NY | 9.0 | % | 9/2022 | P & I | — | 253 | 252 | |||||||||||||||||
| Borrower BV | Seller financing | Norwalk, CT | 9.0 | % | 4/2022 | P & I | — | 319 | 315 | |||||||||||||||||
| Borrower BW | Seller financing | Hadley, MA | 9.0 | % | 7/2022 | P & I | — | 78 | 77 | |||||||||||||||||
91
Table of Contents
| Type of Loan/Borrower |
Description |
Location(s) |
Interest Rate |
Final Maturity Date |
Periodic Payment Terms (a) |
Prior Liens |
Face Value at Inception |
Amount of Principal Unpaid at Close of Period |
||||||||||||||||||
| Borrower BX | Seller financing | Clinton, MA | 9.0 | % | 4/2022 | P & I | — | 158 | 156 | |||||||||||||||||
| Borrower BY | Seller financing | Worcester, MA | 9.0 | % | 2/2022 | P & I | — | 210 | 207 | |||||||||||||||||
| Borrower BZ | Seller financing | Pelham, NH | 9.0 | % | 12/2022 | P & I | — | 73 | 73 | |||||||||||||||||
| Borrower CA | Seller financing | Jersey City, NJ | 9.0 | % | 12/2022 | P & I | — | 673 | 671 | |||||||||||||||||
| Borrower CB | Seller financing | Brewster, NY | 9.0 | % | 10/2022 | P & I | — | 554 | 552 | |||||||||||||||||
| Borrower CC | Seller financing | Brewster, NY | 9.0 | % | 10/2022 | P & I | — | 333 | 330 | |||||||||||||||||
| Borrower CD | Seller financing | Cranston, RI | 9.0 | % | 9/2022 | P & I | — | 153 | 152 | |||||||||||||||||
| Borrower CE | Seller financing | Pawtucket, RI | 9.0 | % | 12/2022 | P & I | — | 31 | 31 | |||||||||||||||||
| Borrower CF | Seller financing | E. Providence, RI | 9.0 | % | 2/2022 | P & I | — | 186 | 183 | |||||||||||||||||
| Borrower CG | Seller financing | McConnellsburg, PA | 9.0 | % | 12/2022 | P & I | — | 38 | 38 | |||||||||||||||||
| Borrower CH | Seller financing | Various-Ramoco | 9.0 | % | 8/2025 | P & I | — | 5,790 | 5,769 | |||||||||||||||||
| Borrower CI | Seller financing | Various-Ramoco | 9.0 | % | 8/2025 | P & I | — | 6,610 | 6,586 | |||||||||||||||||
| Borrower CJ | Seller financing | Various-Ramoco | 9.0 | % | 8/2025 | P & I | — | 1,500 | 1,495 | |||||||||||||||||
|
|
|
|
|
|||||||||||||||||||||||
| 35,177 | 33,602 | |||||||||||||||||||||||||
| Note receivable |
||||||||||||||||||||||||||
| Property sales | Various-Ramoco | — | 5/2016 | I | (b) | 239 | 133 | |||||||||||||||||||
| Purchase/leaseback | Various-NY | 9.5 | % | 1/2021 | I | (c) | 18,400 | 14,720 | ||||||||||||||||||
|
|
|
|
|
|||||||||||||||||||||||
| Total (d) |
$ | 53,816 | $ | 48,455 | ||||||||||||||||||||||
|
|
|
|
|
|||||||||||||||||||||||
| (a) | P & I = Principal and interest paid monthly. |
| (b) | P = Principal only paid monthly. |
| (c) | I = Interest only paid monthly with principal deferred. |
| (d) | The aggregate cost for federal income tax purposes approximates the amount of principal unpaid. |
We review payment status to identify performing versus non-performing loans. Interest income on performing loans is accrued as earned. A non-performing loan is placed on non-accrual status when it is probable that the borrower may be unable to meet interest payments as they become due. Generally, loans 90 days or more past due are placed on non-accrual status unless there is sufficient collateral to assure collectability of principal and interest. Upon the designation of non-accrual status, all unpaid accrued interest is reserved against through current income. Interest income on non-performing loans is generally recognized on a cash basis. The summarized changes in the carrying amount of mortgage loans are as follows:
| 2015 | 2014 | 2013 | ||||||||||
| Balance at January 1, |
$ | 34,226 | $ | 28,793 | $ | 22,333 | ||||||
| Additions: |
||||||||||||
| New mortgage loans |
17,876 | 8,278 | 8,714 | |||||||||
| Deductions: |
||||||||||||
| Loan repayments |
(2,883 | ) | (2,294 | ) | (480 | ) | ||||||
| Collection of principal |
(764 | ) | (489 | ) | (1,774 | ) | ||||||
| Write-off of loan balance |
— | (62 | ) | — | ||||||||
|
|
|
|
|
|
|
|||||||
| Balance at December 31, |
$ | 48,455 | $ | 34,226 | $ | 28,793 | ||||||
|
|
|
|
|
|
|
|||||||
92
Table of Contents
Pursuant to the requirements of Section 13 or 15(d) of the Securities Exchange Act of 1934, as amended, the Registrant has duly caused this Annual Report on Form 10-K to be signed on its behalf by the undersigned, thereunto duly authorized.
| Getty Realty Corp. (Registrant) | ||
| By: | /S/ DANION FIELDING | |
| Danion Fielding | ||
| Vice President, Chief Financial Officer and Treasurer (Principal Financial Officer) | ||
| March 10, 2016 | ||
| By: | /S/ EUGENE SHNAYDERMAN | |
| Eugene Shnayderman | ||
| Chief Accounting Officer and Controller (Principal Accounting Officer) | ||
| March 10, 2016 | ||
Pursuant to the requirements of the Securities Exchange Act of 1934, as amended, this Annual Report on Form 10-K has been signed below by the following persons on behalf of the Registrant and in the capacities and on the dates indicated.
| By: | /S/ CHRISTOPHER J. CONSTANT |
By: | /S/ HOWARD SAFENOWITZ | |||||
| Christopher J. Constant President, Chief Executive Officer and Director (Principal Executive Officer) March 10, 2016 |
Howard Safenowitz Director March 10, 2016 | |||||||
| By: | /S/ LEO LIEBOWITZ |
By: | /S/ PHILIP E. COVIELLO | |||||
| Leo Liebowitz Director and Chairman of the Board March 10, 2016 |
Philip E. Coviello Director March 10, 2016 | |||||||
| By: | /S/ MILTON COOPER |
By: | /S/ RICHARD E. MONTAG | |||||
| Milton Cooper Director March 10, 2016 |
Richard E. Montag Director March 10, 2016 | |||||||
93
Table of Contents
GETTY REALTY CORP.
Annual Report on Form 10-K
for the year ended December 31, 2015
| EXHIBIT |
DESCRIPTION |
|||
| 3.1 | Articles of Incorporation of Getty Realty Holding Corp. (“Holdings”), now known as Getty Realty Corp., filed December 23, 1997. | Filed as Exhibit 3.1 to Company’s Registration Statement on Form S-4, filed on January 12, 1998 (File No. 333- 44065), included as Appendix D. to the Joint Proxy/Prospectus that is a part thereof, and incorporated herein by reference. | ||
| 3.2 | Articles Supplementary to Articles of Incorporation of Holdings, filed January 21, 1998. | Filed as Exhibit 3.2 to Company’s Annual Report on Form 10-K for the year ended December 31, 2008 (File No. 001-13777) and incorporated herein by reference. | ||
| 3.3 | By-Laws of Getty Realty Corp. | Filed as Exhibit 3.2 to Company’s Current Report on Form 8-K filed November 14, 2011 (File No. 001-13777) and incorporated herein by reference. | ||
| 3.4 | Articles of Amendment of Holdings, changing its name to Getty Realty Corp., filed January 30, 1998. | Filed as Exhibit 3.4 to Company’s Annual Report on Form 10-K for the year ended December 31, 2008 (File No. 001-13777) and incorporated herein by reference. | ||
| 3.5 | Amendment to Articles of Incorporation of Holdings, filed August 1, 2001. | Filed as Exhibit 3.5 to Company’s Annual Report on Form 10-K for the year ended December 31, 2008 (File No. 001-13777) and incorporated herein by reference. | ||
| 4.1 | Dividend Reinvestment/Stock Purchase Plan. | Filed under the heading “Description of Plan” on pages 4 through 17 to Company’s Registration Statement on Form S-3D, filed on April 22, 2004 (File No. 333-114730) and incorporated herein by reference. | ||
| 10.1* | Retirement and Profit Sharing Plan (restated as of December 1, 2012). | Filed as Exhibit 10.1 to Company’s Annual Report on Form 10-K for the year ended December 31, 2012 (File No. 001-13777) and incorporated herein by reference. | ||
| 10.2* | 1998 Stock Option Plan, effective as of January 30,1998. | Filed as Exhibit 10.1 to Company’s Registration Statement on Form S-4, filed on January 12, 1998 (File No. 333-44065), included as Appendix H to the Joint Proxy Statement/Prospectus that is a part thereof, and incorporated herein by reference. | ||
| 10.3* | Form of Indemnification Agreement between the Company and its directors. | Filed as Exhibit 10.5 to Company’s Annual Report on Form 10-K for the year ended December 31, 2008 (File No. 001-13777) and incorporated herein by reference. | ||
| 10.4* | Amended and Restated Supplemental Retirement Plan for Executives of the Getty Realty Corp. and Participating Subsidiaries (adopted by the Company on December 16, 1997 and amended and restated effective January 1, 2009). | Filed as Exhibit 10.6 to Company’s Annual Report on Form 10-K for the year ended December 31, 2008 (File No. 001-13777) and incorporated herein by reference. | ||
| 10.6* | 2004 Getty Realty Corp. Omnibus Incentive Compensation Plan. | Filed as Appendix B to the Definitive Proxy Statement of the Company filed April 9, 2004 (File No. 001-13777) and incorporated herein by reference. | ||
| 10.7* | Form of restricted stock unit grant award under the 2004 Getty Realty Corp. Omnibus Incentive Compensation Plan, as amended. | Filed as Exhibit 10.15 to Company’s Annual Report on Form 10-K for the year ended December 31, 2008 (File No. 001-13777) and incorporated herein by reference. | ||
| 10.8* | Amendment to the 2004 Getty Realty Corp. Omnibus Incentive Compensation Plan dated December 31, 2008. | Filed as Exhibit 10.19 to Company’s Annual Report on Form 10-K for the year ended December 31, 2008 (File No. 001-13777) and incorporated herein by reference. | ||
94
Table of Contents
| EXHIBIT |
DESCRIPTION |
|||
| 10.10** | Unitary Net Lease Agreement between GTY NY Leasing, Inc. and CPD NY Energy Corp., dated as of January 13, 2011. | Filed as Exhibit 10.1 to Company’s Quarterly Report on Form 10-Q filed May, 12, 2011 (File No. 001-13777) and incorporated herein by reference. | ||
| 10.11 | Stipulation and order Deferring Rents Owing to Getty Properties, Establishing Procedures for the Administration of the Chapter 11 Cases, Extending the Time for the Debtors to Assume or Reject the Master Lease and Other Matters. | Filed as Exhibit 99.2 to Company’s Current Report on Form 8-K filed March 9, 2012 (File No. 001-13777) and incorporated herein by reference. | ||
| 10.15* | Form of incentive restricted stock unit grant award under the 2004 Getty Realty Corp. Omnibus Incentive Compensation Plan, as amended. | Filed as Exhibit 10.3 to Company’s Quarterly Report on Form 10-Q filed May 10, 2013 (File No. 001-13777) and incorporated herein by reference. | ||
| 10.18* | Getty Realty Corp. Amended and Restated 2004 Omnibus Incentive Compensation Plan. | Filed as Exhibit 10.18 to the Company’s Annual Report on Form 10-K filed on March 16, 2015 (File No. 001-13777) and incorporated herein by reference. | ||
| 10.19 | Settlement Agreement regarding claims of Getty Properties Corp., GettyMart Inc., and Leemilt’s Petroleum, Inc. dated March 3, 2015. | Filed as Exhibit 99.1 to the Company’s Current Report on Form 8-K filed on March 10, 2015 (File No. 001-13777) and incorporated herein by reference. | ||
| 10.20** | Credit Agreement, dated as of June 2, 2015, among Getty Realty Corp., certain of its subsidiaries party thereto, Bank of America, N.A. as Administrative Agent, Swing Line Lender, an L/C Issuer and as a Lender, and the other leaders party thereto. | Filed as Exhibit 10.1 to the Company’s Form 10-Q filed on August 10, 2015 (File No. 001-13777) and incorporated herein by reference. | ||
| 10.21** | Amended and Restated Note Purchase and Guarantee Agreement, dated as of June 2, 2015, among Getty Realty Corp., certain of its subsidiaries party thereto, the Prudential Insurance Company of America, and the Prudential Retirement Insurance and Annuity Company. | Filed as Exhibit 10.2 to the Company’s Form 10-Q filed on August 10, 2015 (File No. 001-13777) and incorporated herein by reference. | ||
| 10.22** | Master Land and Building Lease (Pool 1) between GTY-Pacific Leasing, LLC and Apro, LLC, dated as of June 3, 2015. | Filed as Exhibit 10.3 to the Company’s Form 10-Q filed on August 10, 2015 (File No. 001-13777) and incorporated herein by reference. | ||
| 10.23** | Master Land and Building Lease (Pool 2) between GTY-Pacific Leasing, LLC and Apro, LLC, dated as of June 3, 2015. | Filed as Exhibit 10.4 to the Company’s Form 10-Q filed on August 10, 2015 (File No. 001-13777) and incorporated herein by reference. | ||
| 10.24** | Master Land and Building Lease (Pool 3) between GTY-Pacific Leasing, LLC and Apro, LLC, dated as of June 3, 2015. | Filed as Exhibit 10.5 to the Company’s Form 10-Q filed on August 10, 2015 (File No. 001-13777) and incorporated herein by reference. | ||
| 10.25* | Severance Agreement and General Release between Getty Realty Corp. and Kevin C. Shea, dated September 17, 2015. | Filed as Exhibit 10.1 to the Company’s Current Report on Form 8-K filed on September 22, 2015 (File No. 001-13777) and incorporated herein by reference. | ||
| 10.26* | Retirement Agreement and Release between Getty Realty Corp. and David B. Driscoll, dated November 5, 2015. | Filed as Exhibit 10.1 to the Company’s Current Report on Form 8-K filed November 6, 2015 (File No. 001-13777) and incorporated herein by reference. | ||
| 21 | Subsidiaries of the Company. | (a) | ||
| 23 | Consent of Independent Registered Public Accounting Firm. | (a) | ||
| 31(i).1 | Rule 13a-14(a) Certification of Chief Executive Officer. | (b) | ||
| 31(i).2 | Rule 13a-14(a) Certification of Chief Financial Officer. | (b) | ||
95
Table of Contents
| 32.1 | Section 1350 Certification of Chief Executive Officer. | (b) | ||
| 32.2 | Section 1350 Certification of Chief Financial Officer. | (b) | ||
| 101.INS | XBRL Instance Document | (a) | ||
| 101.SCH | XBRL Taxonomy Extension Schema | (a) | ||
96
Table of Contents
| 101.CAL | XBRL Taxonomy Extension Calculation Linkbase | (a) | ||
| 101.DEF | XBRL Taxonomy Extension Definition Linkbase | (a) | ||
| 101.LAB | XBRL Taxonomy Extension Label Linkbase | (a) | ||
| 101.PRE | XBRL Taxonomy Extension Presentation Linkbase | (a) | ||
| (a) | Filed herewith. |
| (b) | Furnished herewith. These certifications are being furnished solely to accompany the Report pursuant to 18 U.S.C. Section. 1350, and are not being filed for purposes of Section 18 of the Exchange Act, and are not to be incorporated by reference into any filing of the Company, whether made before or after the date hereof, regardless of any general incorporation language in such filing. |
| * | Management contract or compensatory plan or arrangement. |
| ** | Confidential treatment has been granted for certain portions of this Exhibit pursuant to Rule 24b-2 under the Exchange Act, which portions are omitted and filed separately with the SEC. |
The exhibits listed in this Exhibit Index which were filed or furnished with our 2015 Annual Report on Form 10-K filed with the Securities and Exchange Commission are available upon payment of a $25 fee per exhibit, upon request from us, by writing to Investor Relations addressed to Getty Realty Corp., Two Jericho Plaza, Suite 110, Jericho, NY 11753-1681. Our website address is www.gettyrealty.com. Our website contains a hyperlink to the EDGAR database of the Securities and Exchange Commission at www.sec.gov where you can access, free-of-charge, each exhibit that was filed or furnished with our 2015 Annual Report on Form 10-K.
97