Attached files
| file | filename |
|---|---|
| EX-99.2 - EXHIBIT 99.2 - ISTAR INC. | q117istarsupplementalex9.htm |
| 8-K - 8-K - ISTAR INC. | star-03312017xpr8xk.htm |
Exhibit 99.1

Press Release
iStar Announces First Quarter 2017 Results and Recent Developments
NEW YORK, May 4, 2017
iStar (NYSE: STAR) today reported results for the quarter ended March 31, 2017.
Highlights
◦ | Net income (loss) and adjusted income (loss) for the first quarter was $(0.38) and $(0.16), respectively, per diluted common share. |
◦ | Transactions consummated subsequent to the end of the first quarter are expected to generate an estimated $240 million of income in the second quarter. |
◦ | 2017 full year guidance increased substantially: |
▪ | Target net income per diluted common share raised to a range of $2.15 - $2.65 from prior target of $0.65. |
▪ | Target adjusted income per diluted common share raised to a range of $3.00 - $3.50 from prior target of $1.50. |
◦ | New supplemental earnings report created to accompany release. The supplemental report is available at www.istar.com in the "Investors" section. |
1
First Quarter 2017 Results
iStar reported net income (loss) allocable to common shareholders for the first quarter of $(27.1) million, or $(0.38) per diluted common share, versus $(21.2) million, or $(0.27) per diluted common share for the first quarter 2016.
Adjusted income (loss) allocable to common shareholders for the first quarter was $(11.8) million, or $(0.16) per diluted common share, versus $(0.3) million, or $(0.00) per diluted common share for the first quarter 2016.
Adjusted income represents net income (loss) computed in accordance with GAAP, prior to the effects of certain non-cash items. The calculation of adjusted income and reconciliation to GAAP net income is presented in the financial tables that follow the text of this press release.
Recent Developments
The Company formed a new vehicle, Safety, Income and Growth, Inc. (Safety), to pursue the separate capitalization of iStar's ground net lease (GNL) business. iStar contributed a portfolio of 12 GNL properties to the vehicle, most of which the Company has owned for over 10 years, with a gross book value of $218 million and a net book value of $156 million at March 31, 2017.
On March 30, Safety entered into a $227 million loan agreement providing for 10-year, non-recourse financing secured by the initial portfolio of assets. iStar retained the $220 million of proceeds which was net of $7.4 million of associated costs, while Safety assumed the debt.
Subsequent to the end of the quarter, third party investors acquired, through a merger and related transactions, a 51% equity interest in Safety for $57.5 million in cash, which was paid to iStar. iStar retains a 49% interest in Safety.
As a result of these transactions, iStar received $277 million of net cash proceeds and expects to recognize a gain, net of realized and anticipated costs, of approximately $150 million in the second quarter of 2017.
On April 10, Safety filed an S-11 registration statement with the Securities and Exchange Commission.
Subsequent to the end of the quarter, the Company also received a favorable judgment from the U.S. Court of Appeals for the Fourth Circuit, affirming a prior district court judgment relating to a dispute with Lennar over the purchase and sale of Bevard, a master planned community located in Maryland.
On April 21, iStar conveyed the property to Lennar and received $231 million of proceeds comprised of the remaining purchase price of $114 million and $117 million of interest and real estate taxes, net of costs. Lennar simultaneously filed a petition with the Court of Appeals with respect to approximately $30 million of post-judgment interest awarded to the Company. The amount of attorneys' fees and costs to be recovered by the Company
2
are still to be determined. A third party holds a 4.3% participation interest in all proceeds from the judgment. The Company expects to record approximately $90 million of income in the second quarter, which excludes the portion of interest Lennar has contested and any recovery of attorneys' fees and costs awarded.
"We've reached a critical turning point for the Company," explained Jay Sugarman, iStar's chairman and chief executive officer. "We've spent significant time and effort working to unlock value in our portfolio and explore new areas of investment. Recent favorable developments have left us with over $1 billion of available liquidity on hand which gives us the ability to pursue large white space opportunities and deliver attractive risk-adjusted returns to shareholders."
Portfolio Overview and Investment Activity
At March 31, 2017, the Company’s portfolio totaled $4.5 billion, which is gross of $426 million of accumulated depreciation and $18 million of general loan loss reserves.
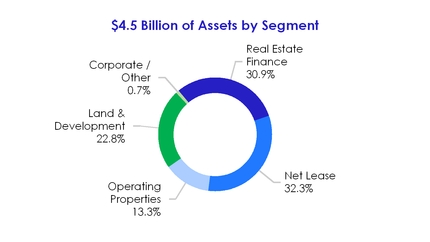
During the first quarter of 2017, the Company invested a total of $111 million associated with new investments, prior financing commitments and ongoing development across its four segments, and generated $246 million of proceeds from repayments and sales.
Real Estate Finance
iStar's real estate finance business targets sophisticated and innovative investors by providing one-stop capabilities that encompass financial alternatives ranging from full envelope senior loans to custom-tailored mezzanine and preferred equity capital positions.
At March 31, 2017, the Company’s real estate finance portfolio totaled $1.4 billion. The portfolio is categorized into iStar 3.0 loans, made post January 1, 2008, and legacy loans, which were all made prior to December 31, 2007.
3
Real Estate Finance Statistics | |||||||
iStar 3.0 | Legacy Loans | ||||||
Gross book value | $ | 1,176 | $ | 223 | |||
% of total loan portfolio | 84 | % | 16 | % | |||
Performing loans | $ | 1,176 | $ | 34 | |||
Non-performing loans | $ | — | $ | 190 | |||
% Performing / Non-performing | 100% / 0% | 15% / 85% | |||||
First mortgages / senior loans | 71 | % | 30 | % | |||
Mezzanine / subordinated debt | 29 | % | 70 | % | |||
Total | 100 | % | 100 | % | |||
Wtd. avg. LTV (1) | 62.6 | % | 44.7 | % | |||
Unlevered yield (1) | 9.2 | % | 8.6 | % | |||
Wtd. avg. maturity (years) (1) | 1.9 | 2.7 | |||||
Note: Gross book value represents the carrying value of iStar's loans, gross of general reserves. | |||||||
(1) Includes performing loans only. | |||||||
Net Lease
iStar's net lease business seeks to create stable cash flows through long-term leases to single tenants on its properties. The Company targets mission-critical facilities leased on a long-term basis to tenants, offering structured solutions that combine iStar's capabilities in underwriting, lease structuring, asset management and build-to-suit construction.
At the end of the quarter, iStar’s net lease portfolio totaled $1.5 billion, gross of $370 million of accumulated depreciation. The portfolio was comprised of $1.4 billion of wholly-owned assets and a $92 million equity investment in its net lease joint venture.
Since 2014, the Company has invested in new net lease investments primarily through its net lease joint venture with a sovereign wealth fund, in which it holds a 52% interest. At the end of the quarter, the venture's balance sheet, gross of $21 million of accumulated depreciation, included $537 million of assets, $316 million of liabilities and $198 million of equity (net of a $23 million non-controlling interest).
The overall net lease portfolio totaled 17 million square feet across 33 states. Occupancy for the portfolio was 99% at the end of the quarter, with a weighted average remaining lease term of 14.8 years. The net lease portfolio generated an unleveraged yield of 8.4% for the quarter.
Operating Properties
At the end of the quarter, iStar's operating property portfolio totaled $603 million, gross of $50 million of accumulated depreciation, and was comprised of $531 million of commercial and $72 million of residential real estate properties. During the quarter, the Company
4
invested $7.3 million within its operating properties portfolio and received $11.7 million of proceeds from sales. These sales generated $1.9 million of gains.
Commercial Operating Properties
The Company’s commercial operating properties represent a diverse pool of assets across a broad range of geographies and collateral types including office, retail and hotel properties. These properties generated $26.7 million of revenue offset by $19.8 million of operating expenses during the quarter. At the end of the first quarter, the Company had $339 million of stabilized assets and $192 million of transitional assets. iStar generally seeks to reposition transitional assets with the objective of maximizing their values through the infusion of capital and intensive asset management efforts.
Residential Operating Properties
At the end of the quarter, the $72 million residential operating portfolio was comprised of 41 units generally located within luxury projects in major U.S. cities. The Company sold 7 units during the quarter, generating $10.2 million of proceeds and a $1.9 million gain.
Land & Development
At the end of the quarter, the Company’s land & development portfolio totaled $1.0 billion, including 9 master planned communities, 6 waterfront projects and 15 urban/infill developments. These projects are collectively entitled for approximately 15,000 lots and units.
For the quarter, the Company's land and development portfolio generated $20.0 million of revenues, offset by $15.9 million of cost of sales. In addition, the Company earned $3.8 million of earnings from land development equity method investments. During the quarter, the Company invested $29.4 million in its land portfolio.
5
Capital Markets and Balance Sheet
The Company is capitalized with unsecured and secured debt, preferred equity and common equity. The chart below shows the capital structure of the Company at quarter end, as well as pro forma for several transactions that occurred subsequent to the end of the quarter, including repayment of $275 million of 9.0% unsecured notes, the third party acquisition of a 51% interest in Safety, Income and Growth, Inc. and the resolution of the Bevard litigation.
Capital Structure | |||
$ in millions | |||
At March 31, 2017 | Pro Forma (1) | ||
Secured debt | $959 | $739 | |
Unsecured debt | $2,923 | $2,649 | |
Total debt | $3,882 | $3,388 | |
Preferred equity (A) (2) | $745 | $745 | |
Common equity (B) | $246 | $494 | |
Total equity | $991 | $1,239 | |
Accumulated depreciation and amortization and general loan loss reserves (3) (C) | $496 | $434 | |
Adjusted common equity (B) + (C) | $742 | $928 | |
Adjusted total equity (A) + (B) + (C) | $1,487 | $1,673 | |
(1) Pro forma for the repayment of $275 million of 9.0% unsecured notes as well as the transactions described above under the heading "Recent Developments," including the third party acquisition of a 51% interest in Safety, Income and Growth, Inc. and the resolution of the Bevard litigation. (2) Represents liquidation preference value. (3) Accumulated depreciation and amortization includes iStar's proportionate share of accumulated depreciation and amortization relating to equity method investments. | |||
As previously announced, during the first quarter the Company repriced its $500 million senior secured credit facility. The credit facility was repriced at par and bears interest at an annual rate of LIBOR + 3.75% with a 1.00% LIBOR floor, a 75 basis point reduction from the prior rate of LIBOR + 4.50% with a 1.00% LIBOR floor. Call protection was extended for six months. All other terms of the facility, including its July 2020 maturity and 1.25x required collateral coverage, remained the same.
In addition, during the quarter the Company issued $375 million of 6.0% Senior Unsecured Notes due April 2022. The Company used proceeds from the offering to repay its $100 million 5.85% Senior Unsecured notes at maturity, and in April the Company repaid its $275 million 9.0% Senior Unsecured Notes due June 2017.
The Company allowed its $170 million delayed draw secured term loan, which it arranged during the fourth quarter, to expire. The facility was collateralized by the 12 GNLs that serve as Safety's initial portfolio. As previously mentioned, the Company replaced the facility with $227 million of secured debt raised during the first quarter collateralized by the same pool of assets. Both the debt and assets were assumed by the Safety venture.
6
The Company’s weighted average cost of debt for the first quarter was 5.9%. The Company’s leverage was 2.0x at the end of the quarter, below the Company’s targeted range of 2.0x - 2.5x. The chart below shows the calculation of the Company's leverage, as well as pro forma for several transactions that occurred subsequent to the end of the quarter, including repayment of $275 million of 9.0% unsecured notes, the third party acquisition of a 51% interest in Safety, Income and Growth, Inc. and the resolution of the Bevard litigation.
Leverage | ||||||
$ in millions | ||||||
At March 31, 2017 | Pro Forma (1) | |||||
Book debt | $ | 3,882 | $ | 3,388 | ||
Less: Cash and cash equivalents | (897 | ) | (932 | ) | ||
Net book debt (A) | $ | 2,985 | $ | 2,456 | ||
Book equity (2) | $ | 991 | $ | 1,239 | ||
Add: Accumulated depreciation and amortization (3) | 478 | 416 | ||||
Add: General loan loss reserves | 18 | 18 | ||||
Sum of book equity, accumulated D&A and general loan loss reserves (B) | $ | 1,487 | $ | 1,673 | ||
Leverage (A) / (B) | 2.0x | 1.5x | ||||
(1) Pro forma for the repayment of $275 million of 9.0% unsecured notes as well as the transactions described above under the heading "Recent Developments," including the third party acquisition of a 51% interest in Safety, Income and Growth, Inc. and the resolution of the Bevard litigation. Pro forma cash represents actual cash as of May 3, 2017. (2) Includes preferred equity. (3) Accumulated depreciation and amortization includes iStar's proportionate share of accumulated depreciation and amortization relating to equity method investments. | ||||||
Liquidity
At the end of the quarter, iStar had unrestricted cash and capacity on its revolving credit facility of $1.1 billion.
Liquidity | ||
$ in millions | ||
At March 31, 2017 | At May 3, 2017 | |
Unrestricted cash | $897 | $932 |
Revolving credit facility capacity | $236 | $236 |
Total liquidity | $1,133 | $1,168 |
7
Earnings Guidance
In light of the transactions described above under "Recent Developments," iStar is increasing its target net income and adjusted income guidance for the fiscal year 2017. iStar expects:
◦ | Target net income per diluted common share range increased to $2.15 - $2.65 as compared to prior target guidance of $0.65. |
◦ | Target adjusted income per diluted common share range increased to $3.00 - $3.50 as compared to prior target guidance of $1.50. |
This guidance assumes, among other things, that general macro economic conditions continue to remain favorable. Please see the financial tables that follow the text of this press release for a reconciliation from GAAP net income guidance to adjusted income guidance.
Annual Meeting
The Company will host its Annual Meeting of Shareholders at the Harvard Club of New York City, located at 35 West 44th Street, New York, New York 10036 on Tuesday, May 16, 2017 at 9:00 a.m. ET. All shareholders are cordially invited to attend.
Ÿ Ÿ Ÿ
iStar (NYSE: STAR) finances, invests in and develops real estate and real estate related projects as part of its fully-integrated investment platform. Building on over two decades of experience and more than $35 billion of transactions, iStar brings uncommon capabilities and new ways of thinking to commercial real estate and adapts its investment strategy to changing market conditions. The Company is structured as a real estate investment trust (“REIT”), with a diversified portfolio focused on larger assets located in major metropolitan markets.
iStar will hold a quarterly earnings conference call at 10:00 a.m. ET today, May 4, 2017. This conference call will be broadcast live over the internet and can be accessed by all interested parties through iStar’s website, www.istar.com. To listen to the live call, please go to the website’s “Investors” section at least 15 minutes prior to the start of the call to register, download and install any necessary audio software. For those who are not available to listen to the live broadcast, a replay will be available shortly after the call on iStar's website.
Note: Statements in this press release which are not historical fact may be deemed forward-looking statements within the meaning of Section 27A of the Securities Act of 1933 and Section 21E of the Securities Exchange Act of 1934. Although iStar believes the expectations reflected in any forward-looking statements are based on reasonable assumptions, the Company can give no assurance that its expectations will be attained. Factors that could cause actual results to differ materially from iStar’s expectations include general economic
8
conditions and conditions in the commercial real estate and credit markets, the Company’s ability to generate liquidity and to repay indebtedness as it comes due, additional loan loss provisions, the amount and timing of asset sales, changes in NPLs, repayment levels, the Company's ability to make new investments, the Company’s ability to maintain compliance with its debt covenants, the Company’s ability to generate income and gains from operating properties and land and other risks detailed from time to time in iStar SEC reports.
Company Contact:
Jason Fooks, Vice President of Investor Relations & Marketing
1114 Avenue of the Americas
New York, NY 10036
(212) 930-9400
investors@istar.com
9
iStar
Consolidated Statements of Operations
(In thousands)
(unaudited)
Three Months Ended March 31, | ||||||||
2017 | 2016 | |||||||
REVENUES | ||||||||
Operating lease income | $ | 52,591 | $ | 54,937 | ||||
Interest income | 29,058 | 33,219 | ||||||
Other income | 11,864 | 11,541 | ||||||
Land development revenue | 20,050 | 14,947 | ||||||
Total revenues | $ | 113,563 | $ | 114,644 | ||||
COST AND EXPENSES | ||||||||
Interest expense | $ | 51,193 | $ | 57,021 | ||||
Real estate expense | 35,741 | 34,305 | ||||||
Land development cost of sales | 15,910 | 11,575 | ||||||
Depreciation and amortization | 13,067 | 14,708 | ||||||
General and administrative(1) | 25,173 | 23,102 | ||||||
(Recovery of) provision for loan losses | (4,928 | ) | 1,506 | |||||
Impairment of assets | 4,413 | — | ||||||
Other expense | 1,869 | 740 | ||||||
Total costs and expenses | $ | 142,438 | $ | 142,957 | ||||
Income (loss) before other items | $ | (28,875 | ) | $ | (28,313 | ) | ||
Income from sales of real estate | 8,618 | 10,458 | ||||||
Earnings from equity method investments | 5,702 | 8,267 | ||||||
Income tax benefit (expense) | (607 | ) | 414 | |||||
Loss on early extinguishment of debt | (210 | ) | (125 | ) | ||||
Net income (loss) | $ | (15,372 | ) | $ | (9,299 | ) | ||
Net (income) loss attributable to noncontrolling interests | 1,100 | 942 | ||||||
Net income (loss) attributable to iStar | $ | (14,272 | ) | $ | (8,357 | ) | ||
Preferred dividends | (12,830 | ) | (12,830 | ) | ||||
Net income (loss) allocable to common shareholders | $ | (27,102 | ) | $ | (21,187 | ) | ||
_______________________________________________________________________________
(1) For the three months ended March 31, 2017 and 2016, includes $5,881 and $4,577 of stock-based compensation expense, respectively.
10
iStar
Supplemental Information
(In thousands, except per share data)
(unaudited)
Three Months Ended March 31, | ||||||||
2017 | 2016 | |||||||
ADJUSTED INCOME (1) | ||||||||
Reconciliation of Net Income to Adjusted Income | ||||||||
Net income (loss) allocable to common shareholders | $ | (27,102 | ) | $ | (21,187 | ) | ||
Add: Depreciation and amortization | 15,052 | 17,172 | ||||||
Add: (Recovery of) provision for loan losses | (4,928 | ) | 1,506 | |||||
Add: Impairment of assets | 4,413 | 915 | ||||||
Add: Stock-based compensation expense | 5,881 | 4,577 | ||||||
Add: Loss on early extinguishment of debt | 210 | 125 | ||||||
Less: Losses on charge-offs and dispositions | (5,316 | ) | (3,416 | ) | ||||
Adjusted income allocable to common shareholders | $ | (11,790 | ) | $ | (308 | ) | ||
_______________________________________________________________________________
(1) Adjusted Income allocable to common shareholders should be examined in conjunction with net income (loss) as shown in the Consolidated Statements of Operations. This non-GAAP financial measure should not be considered as an alternative to net income (determined in accordance with GAAP) or to cash flows from operating activities (determined in accordance with GAAP) as a measure of the Company’s liquidity, nor is it indicative of funds available to fund the Company’s cash needs or available for distribution to shareholders. It should be noted that the Company’s manner of calculating this non-GAAP financial measure may differ from the calculations of similarly-titled measures by other companies. Management considers this non-GAAP financial measure as supplemental information to net income in analyzing the performance of our underlying business. Depreciation and amortization includes our proportionate share of depreciation and amortization expense relating to equity method investments and excludes the portion of depreciation and amortization expense allocable to non-controlling interests. Impairment of assets includes impairments on cost and equity method investments recorded in other income and earnings from equity method investments, respectively. Effective in the second quarter 2016, the Company modified its presentation of Adjusted Income to include losses on charge-offs and dispositions of previously impaired or reserved assets to provide a more informative metric for investors to help evaluate our operating performance. Losses on charge-offs and dispositions represents the impact of charge-offs and dispositions realized during the period. These charge-offs and dispositions were taken on assets that were previously impaired for GAAP and reflected in net income but not in Adjusted Income.
Reconciliation of Adjusted Income per Share Guidance
to Net Income per Share Guidance
For the Year Ending | |
December 31, 2017 | |
Targeted Net Income per Diluted Common Share Range | $2.15 - $2.65 |
Add: Depreciation and amortization | $0.67 - $0.71 |
Add: Other non-cash adjustments | $0.54 - $0.58 |
Less: Losses on charge-offs and dispositions | ($0.36) - ($0.44) |
Targeted Adjusted Income per Diluted Common Share Range | $3.00 - $3.50 |
11
iStar
Earnings Per Share Information
(In thousands, except per share data)
(unaudited)
Three Months Ended March 31, | ||||||||
2017 | 2016 | |||||||
EPS INFORMATION FOR COMMON SHARES | ||||||||
Income (loss) from continuing operations attributable to iStar(1) | ||||||||
Basic | $ | (0.38 | ) | $ | (0.27 | ) | ||
Diluted | $ | (0.38 | ) | $ | (0.27 | ) | ||
Net income (loss) | ||||||||
Basic | $ | (0.38 | ) | $ | (0.27 | ) | ||
Diluted | $ | (0.38 | ) | $ | (0.27 | ) | ||
Adjusted income | ||||||||
Basic | $ | (0.16 | ) | $ | — | |||
Diluted | $ | (0.16 | ) | $ | — | |||
Weighted average shares outstanding | ||||||||
Basic | 72,065 | 77,060 | ||||||
Diluted (for net income per share) | 72,065 | 77,060 | ||||||
Diluted (for adjusted income per share) | 72,065 | 77,060 | ||||||
Common shares outstanding at end of period | 72,105 | 75,441 | ||||||
_______________________________________________________________________________
(1) Including preferred dividends, net (income) loss attributable to noncontrolling interests and income from sales of real estate.
12
iStar
Consolidated Balance Sheets
(In thousands)
(unaudited)
As of | As of | ||||||
March 31, 2017 | December 31, 2016 | ||||||
ASSETS | |||||||
Real estate | |||||||
Real estate, at cost | $ | 1,896,262 | $ | 1,906,592 | |||
Less: accumulated depreciation | (419,671 | ) | (414,840 | ) | |||
Real estate, net | $ | 1,476,591 | $ | 1,491,752 | |||
Real estate available and held for sale | 71,934 | 83,764 | |||||
$ | 1,548,525 | $ | 1,575,516 | ||||
Land and development, net | 955,150 | 945,565 | |||||
Loans receivable and other lending investments, net | 1,381,227 | 1,450,439 | |||||
Other investments | 197,559 | 214,406 | |||||
Cash and cash equivalents | 897,487 | 328,744 | |||||
Accrued interest and operating lease income receivable, net | 12,561 | 14,775 | |||||
Deferred operating lease income receivable | 97,859 | 96,420 | |||||
Deferred expenses and other assets, net | 204,148 | 199,649 | |||||
Total assets | $ | 5,294,516 | $ | 4,825,514 | |||
LIABILITIES AND EQUITY | |||||||
Accounts payable, accrued expenses and other liabilities | $ | 192,040 | $ | 211,570 | |||
Loan participations payable, net | 182,087 | 159,321 | |||||
Debt obligations, net | 3,882,395 | 3,389,908 | |||||
Total liabilities | $ | 4,256,522 | $ | 3,760,799 | |||
Redeemable noncontrolling interests | $ | 3,513 | $ | 5,031 | |||
Total iStar shareholders' equity | $ | 991,120 | $ | 1,016,564 | |||
Noncontrolling interests | 43,361 | 43,120 | |||||
Total equity | $ | 1,034,481 | $ | 1,059,684 | |||
Total liabilities and equity | $ | 5,294,516 | $ | 4,825,514 | |||
13
iStar
Segment Analysis
(In thousands)
(unaudited)
FOR THE THREE MONTHS ENDED MARCH 31, 2017 | |||||||||||||||||||||||
Real Estate Finance | Net Lease | Operating Properties | Land & Dev | Corporate / Other | Total | ||||||||||||||||||
Operating lease income | $ | — | $ | 36,496 | $ | 15,989 | $ | 106 | $ | — | $ | 52,591 | |||||||||||
Interest income | 29,058 | — | — | — | — | 29,058 | |||||||||||||||||
Other income | 76 | 506 | 10,355 | 386 | 541 | 11,864 | |||||||||||||||||
Land development revenue | — | — | — | 20,050 | — | 20,050 | |||||||||||||||||
Earnings from equity method investments | — | 981 | 632 | 3,842 | 247 | 5,702 | |||||||||||||||||
Income from sales of real estate | — | 6,720 | 1,898 | — | — | 8,618 | |||||||||||||||||
Total revenue and other earnings | $ | 29,134 | $ | 44,703 | $ | 28,874 | $ | 24,384 | $ | 788 | $ | 127,883 | |||||||||||
Real estate expense | — | (4,726 | ) | (21,518 | ) | (9,497 | ) | — | (35,741 | ) | |||||||||||||
Land development cost of sales | — | — | — | (15,910 | ) | — | (15,910 | ) | |||||||||||||||
Other expense | (605 | ) | — | — | — | (1,264 | ) | (1,869 | ) | ||||||||||||||
Allocated interest expense | (11,888 | ) | (15,783 | ) | (5,606 | ) | (8,118 | ) | (9,798 | ) | (51,193 | ) | |||||||||||
Allocated general and administrative(1) | (3,596 | ) | (4,642 | ) | (1,755 | ) | (3,926 | ) | (5,373 | ) | (19,292 | ) | |||||||||||
Segment profit (loss) | $ | 13,045 | $ | 19,552 | $ | (5 | ) | $ | (13,067 | ) | $ | (15,647 | ) | $ | 3,878 | ||||||||
_______________________________________________________________________________
(1) Excludes $5,881 of stock-based compensation expense.
AS OF MARCH 31, 2017 | |||||||||||||||||||||||
Real Estate Finance | Net Lease | Operating Properties | Land & Dev | Corporate / Other | Total | ||||||||||||||||||
Real estate | |||||||||||||||||||||||
Real estate, at cost | $ | — | $ | 1,368,482 | $ | 527,780 | $ | — | $ | — | $ | 1,896,262 | |||||||||||
Less: accumulated depreciation | — | (370,168 | ) | (49,503 | ) | — | — | (419,671 | ) | ||||||||||||||
Real estate, net | $ | — | $ | 998,314 | $ | 478,277 | $ | — | $ | — | $ | 1,476,591 | |||||||||||
Real estate available and held for sale | — | — | 71,934 | — | — | 71,934 | |||||||||||||||||
Total real estate | $ | — | $ | 998,314 | $ | 550,211 | $ | — | $ | — | $ | 1,548,525 | |||||||||||
Land and development, net | — | — | — | 955,150 | — | 955,150 | |||||||||||||||||
Loans receivable and other lending investments, net | 1,381,227 | — | — | — | — | 1,381,227 | |||||||||||||||||
Other investments | — | 92,024 | 3,215 | 69,454 | 32,866 | 197,559 | |||||||||||||||||
Total portfolio assets | $ | 1,381,227 | $ | 1,090,338 | $ | 553,426 | $ | 1,024,604 | $ | 32,866 | $ | 4,082,461 | |||||||||||
Cash and other assets | 1,212,055 | ||||||||||||||||||||||
Total assets | $ | 5,294,516 | |||||||||||||||||||||
14
iStar
Supplemental Information
(In thousands)
(unaudited)
Twelve Months Ended March 31, 2017 | |||||||||||
OPERATING STATISTICS | |||||||||||
Expense Ratio | |||||||||||
General and administrative expenses - trailing twelve months (A) | $ | 86,098 | |||||||||
Average total assets (B) | $ | 5,211,924 | |||||||||
Expense Ratio (A) / (B) | 1.7 | % | |||||||||
As of | |||||||||||
March 31, 2017 | |||||||||||
UNENCUMBERED ASSETS / UNSECURED DEBT | |||||||||||
Unencumbered assets (C)(1) | $ | 4,025,124 | |||||||||
Unsecured debt (D) | $ | 2,945,000 | |||||||||
Unencumbered Assets / Unsecured Debt (C) / (D) | 1.4x | ||||||||||
UNFUNDED COMMITMENTS | |||||||||||
Performance-based commitments(2) | $ | 339,735 | |||||||||
Strategic investments | 45,564 | ||||||||||
Total Unfunded Commitments | $ | 385,299 | |||||||||
LOAN RECEIVABLE CREDIT STATISTICS | As of | ||||||||||
March 31, 2017 | December 31, 2016 | ||||||||||
Carrying value of NPLs / | |||||||||||
As a percentage of total carrying value of loans | $ | 189,812 | 14.6 | % | $ | 191,696 | 14.0 | % | |||
Total reserve for loan losses / | |||||||||||
As a percentage of total gross carrying value of loans(3) | $ | 79,389 | 5.8 | % | $ | 85,545 | 5.9 | % | |||
_______________________________________________________________________________
(1) Unencumbered assets are calculated in accordance with the indentures governing the Company's unsecured debt securities.
(2) Excludes $155.3 million of commitments on loan participations sold that are not the obligation of the Company but are consolidated on the Company's balance sheet.
(3) Gross carrying value represents iStar's carrying value of loans, gross of loan loss reserves.
15
iStar
Supplemental Information
(In millions)
(unaudited)
PORTFOLIO STATISTICS AS OF MARCH 31, 2017(1) | |||||||||||||||||||||||
Property Type | Real Estate Finance | Net Lease | Operating Properties | Land & Dev | Total | % of Total | |||||||||||||||||
Office / Industrial | $ | 207 | $ | 748 | $ | 123 | $ | — | $ | 1,078 | 24 | % | |||||||||||
Land & Development | — | — | — | 1,031 | 1,031 | 23 | % | ||||||||||||||||
Hotel | 336 | 136 | 103 | — | 575 | 13 | % | ||||||||||||||||
Entertainment / Leisure | — | 490 | — | — | 490 | 11 | % | ||||||||||||||||
Mixed Use / Collateral | 298 | — | 174 | — | 472 | 10 | % | ||||||||||||||||
Condominium | 315 | — | 71 | — | 386 | 8 | % | ||||||||||||||||
Retail | 38 | 57 | 132 | — | 227 | 5 | % | ||||||||||||||||
Other Property Types | 206 | 30 | — | — | 236 | 5 | % | ||||||||||||||||
Strategic Investments | — | — | — | — | 33 | 1 | % | ||||||||||||||||
Total | $ | 1,400 | $ | 1,461 | $ | 603 | $ | 1,031 | $ | 4,528 | 100 | % | |||||||||||
Geography | Real Estate Finance | Net Lease | Operating Properties | Land & Dev | Total | % of Total | |||||||||||||||||
Northeast | $ | 663 | $ | 399 | $ | 47 | $ | 246 | $ | 1,355 | 30 | % | |||||||||||
West | 90 | 358 | 38 | 367 | 853 | 19 | % | ||||||||||||||||
Southeast | 168 | 251 | 149 | 138 | 706 | 16 | % | ||||||||||||||||
Mid-Atlantic | 174 | 154 | 50 | 222 | 600 | 13 | % | ||||||||||||||||
Southwest | 51 | 182 | 242 | 26 | 501 | 11 | % | ||||||||||||||||
Central | 164 | 68 | 67 | 32 | 331 | 7 | % | ||||||||||||||||
Various | 90 | 49 | 10 | — | 149 | 3 | % | ||||||||||||||||
Strategic Investments | — | — | — | — | 33 | 1 | % | ||||||||||||||||
Total | $ | 1,400 | $ | 1,461 | $ | 603 | $ | 1,031 | $ | 4,528 | 100 | % | |||||||||||
_______________________________________________________________________________
(1) Based on carrying value of the Company's total investment portfolio, gross of accumulated depreciation and general loan loss reserves.
16