Attached files
| file | filename |
|---|---|
| 8-K - HORIZON BANCORP INC /IN/ | hb_8k0504.htm |
Exhibit 99.1
A NASDAQ Traded Company - Symbol HBNC
This presentation may contain forward-looking statements regarding the financial performance, business prospects, growth and operating strategies of Horizon Bancorp and its affiliates (collectively, “Horizon”). For these statements, Horizon claims the protection of the safe harbor for forward-looking statements contained in the Private Securities Litigation Reform Act of 1995. Statements in the presentation materials should be considered in conjunction with the other information available about Horizon, including the information in the filings we make with the Securities and Exchange Commission. Forward-looking statements provide current expectations or forecasts of future events and are not guarantees of future performance. The forward-looking statements are based on management’s expectations and are subject to a number of risks and uncertainties. We have tried, wherever possible, to identify such statements by using words such as “anticipate,” “estimate,” “project,” “intend,” “plan,” “believe,” “will” and similar expressions in connection with any discussion of future operating or financial performance.Although management believes that the expectations reflected in such forward-looking statements are reasonable, actual results may differ materially from those expressed or implied in such statements. Risks and uncertainties that could cause actual results to differ materially include risk factors relating to the banking industry and the other factors detailed from time to time in Horizon’s reports filed with the Securities and Exchange Commission, including those described in Horizon’s Annual Report on Form 10-K. Undue reliance should not be placed on the forward-looking statements, which speak only as of the date hereof. Horizon does not undertake, and specifically disclaims any obligation, to publicly release the result of any revisions that may be made to update any forward-looking statement to reflect the events or circumstances after the date on which the forward-looking statement is made, or reflect the occurrence of unanticipated events, except to the extent required by law. Forward-Looking Statements

Mark E. SecorEVP & Chief Financial Officer *

Horizon’s Growth Story *

* Growth Transformation Based on the daily trading volume during the fourth quarter of 2006 and first quarter of 2017, respectively.Financial data in millions, except for stock price, as of December 31, 2006 and March 31, 2017. Source: SNL Financial (1) (2) (1)
* Growth Transformation Financial data in millions, except for stock price, as of December 31, 2006 and March 31, 2017. Based on the daily trading volume during the fourth quarter of 2006 and first quarter of 2017, respectively. Source: SNL Financial (1) (2) (2)

* Branch Footprint Then (1) December 2006 Locations – 15Counties – 6 Branches
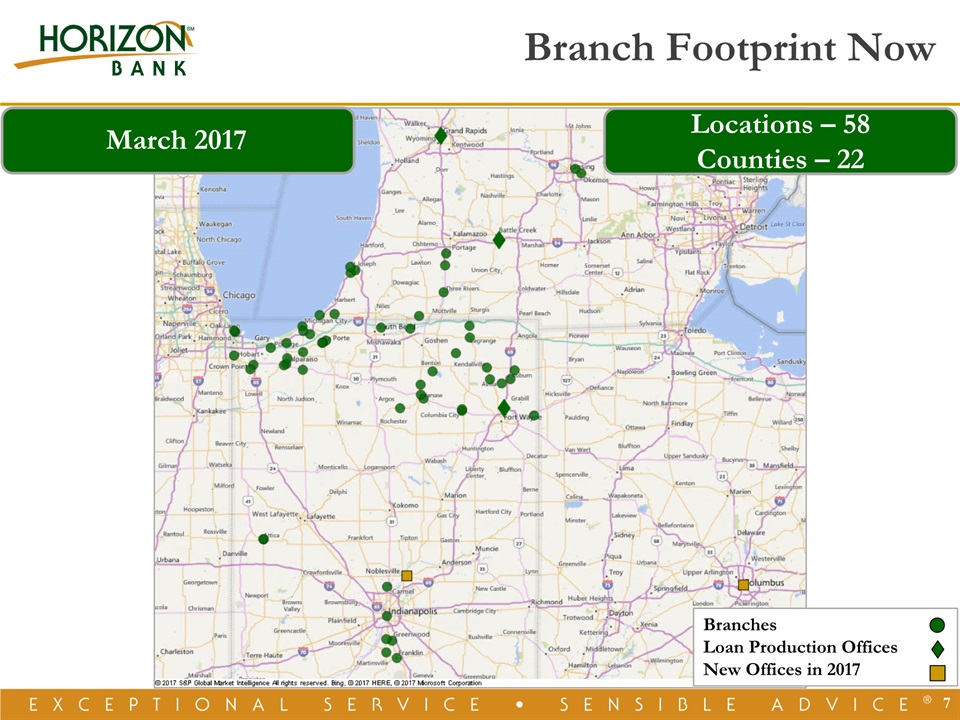
7 Branch Footprint Now (1) BranchesLoan Production OfficesNew Offices in 2017 March 2017 Locations – 58Counties – 22
* Branch Footprint Now (1) BranchesLoan Production OfficesNew Offices in 2017 March 2017 Locations – 58Counties – 22

March 31, 2017 December 31, 2011 ($ in Millions) 2011 1Q17 CAGR Commercial $352 $1,106 24% Real Estate 365 623 11% Consumer 265 417 9% Total $983 $2,147 16% * Shift to Commercial Lending

March 31, 2017 December 31, 2011 ($ in Millions) 2011 1Q17 CAGR Non-interest $131 $502 29% Interest 538 1,432 20% CDs 341 509 8% Total $1,101 $2,444 18% * Strong Low Cost Deposit Growth

* Wealth Management Growth Drives Fee Income

* Core net income and diluted EPS excludes one-time merger expenses and acquisition purchase accounting adjustments, gain on sale of securities and death benefit on bank owned life insurance. (See the Appendix for a reconciliation of these non-GAAP amounts to their GAAP counterparts.)2012’s results benefited from a record level of mortgage loan production volume and mortgage warehouse loan balances.Compound annual growth rate. EPS Annual Growth Rate: 11% Robust Earnings (2) (3)

* Excellent First Quarter 2017 % Δ 2-Yr. 1-Yr. Core Net Income 65% 39% Core Diluted EPS 7% 13% Core net income and diluted EPS excludes one-time merger expenses and acquisition purchase accounting adjustments, gain on sale of securities and death benefit on bank owned life insurance. (See the Appendix for a reconciliation of these non-GAAP amounts to their GAAP counterparts.)

Craig M. DwightChairman & CEO *

A Growth Company *

A Company on the Move * Assets ($ Mil.) $721 $3,169(1) Loans($ Mil.) $548 $2,134(1) Deposits($ Mil.) $489 $2,444(1) OrganicExpans.(11) St. JosephS. BendElkhart Lake County Kalamazoo Indianapolis Carmel Ft. WayneGrand Rapids Noblesville, IN(2)Columbus, OH(2) M&A(11) Anchor Mortgage Alliance American Trust Heartland 1st MortgageSummitPeoples FarmersLaPorteCNB Bargersville 11% CAGR 10% CAGR 12% CAGR Financials as of 3/31/2017. Planned new offices for 2017 – Noblesville branch application approved by OCC; Columbus Loan Production Office.
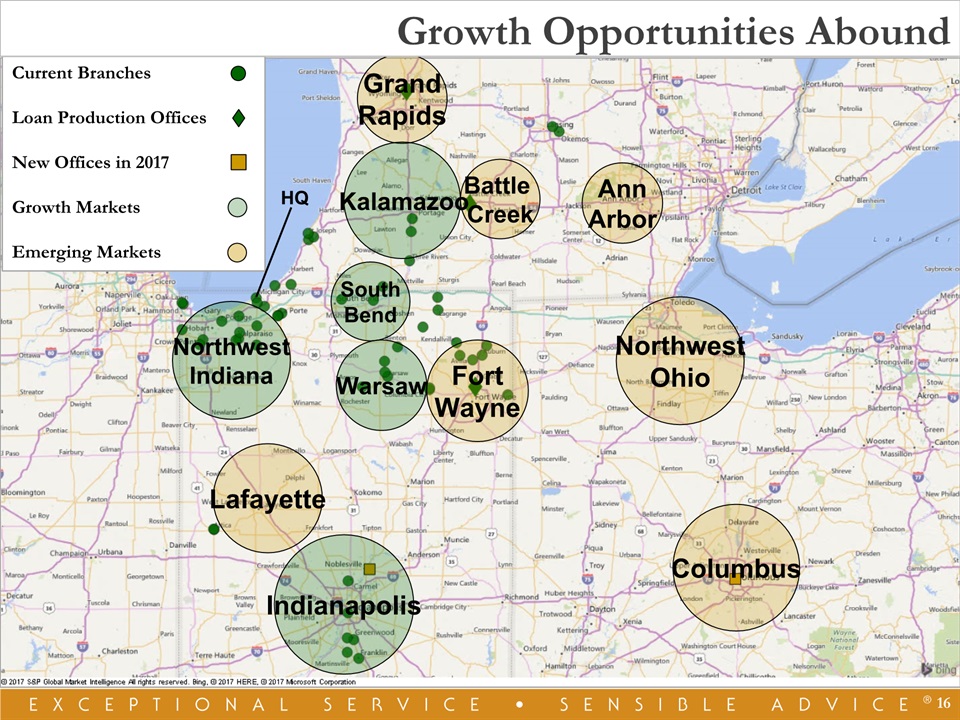
Current BranchesLoan Production OfficesNew Offices in 2017Growth MarketsEmerging Markets 16 GrandRapids AnnArbor Columbus NorthwestOhio FortWayne Battle Creek Lafayette Kalamazoo SouthBend Warsaw Indianapolis NorthwestIndiana HQ Growth Opportunities Abound
Current BranchesLoan Production OfficesNew Offices in 2017Growth MarketsEmerging Markets * GrandRapids AnnArbor Columbus NorthwestOhio FortWayne Battle Creek Lafayette Kalamazoo SouthBend Warsaw Indianapolis NorthwestIndiana HQ Growth Opportunities Abound
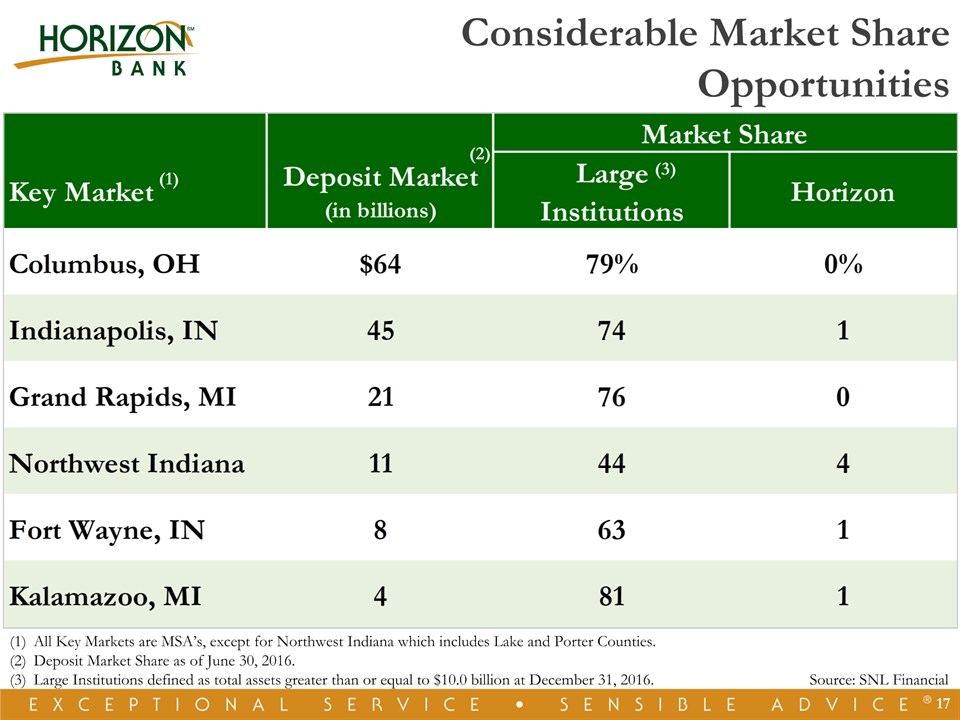
Considerable Market Share Opportunities * All Key Markets are MSA’s, except for Northwest Indiana which includes Lake and Porter Counties. Deposit Market Share as of June 30, 2016. Large Institutions defined as total assets greater than or equal to $10.0 billion at December 31, 2016. Source: SNL Financial (1) (2) (3)

* Scale Drives Shareholder Value Financial data as of December 31, 2016; market data as of April 25, 2017. Nationwide publicly traded banks, excluding merger targets. Source: SNL Financial

* Number of Banks Headquartered in Indiana and Michigan (1) M&A Opportunities Continue On average, 5% decline per year194 Banks Headquartered in Ohio IN and MI commercial banks, savings banks and savings & loan institutions with assets greater than $0 as of December 31st of each respective year.As of December 31, 2016. Source: SNL Financial. (2)

Historical Financial Performance Illustrates Ability to ExecuteConsistent, Well Executed and Disciplined Business StrategyA Growth Story10-year asset and net income CAGR of 10% and 12%, respectivelyEleven acquisitions and eleven market expansions since 2002Capacity to take additional market shareEntering the “Sweet-Spot” for Performance and MultiplesAptitude and Skill to Continue Mergers and Acquisitions * Proven Track Record

Horizon Outperforms the MarketFor Total Shareholder Return As of April 28, 2017SNL U.S. Bank: Includes all Major Exchange Banks in SNL's coverage universe. * Horizon Bancorp: 5-Year Total Return Comparison
Thank Youfor Your Investment inHorizon Bancorp

A NASDAQ Traded Company - Symbol HBNC

Appendix *

* Non-GAAP Reconciliations