Attached files
| file | filename |
|---|---|
| EX-99.1 - EXHIBIT 99.1 - GAIN Capital Holdings, Inc. | ex9913-31x17earningsrelease.htm |
| 8-K - 8-K - GAIN Capital Holdings, Inc. | form8-kq12017earnings.htm |
Q1 2017 Results
1
May 2017

SAFE HARBOR STATEMENT
2
Forward Looking Statements
In addition to historical information, this earnings presentation contains "forward-looking" statements that reflect management's expectations for the future. A variety of
important factors could cause results to differ materially from such statements.. These factors are noted throughout GAIN Capital's annual report on Form 10-K for the
year ended December 31, 2016, as filed with the Securities and Exchange Commission on March 15, 2017, and include, but are not limited to, the actions of both current
and potential new competitors, fluctuations in market trading volumes, financial market volatility, evolving industry regulations, errors or malfunctions in GAIN Capital’s
systems or technology, rapid changes in technology, effects of inflation, customer trading patterns, the success of our products and service offerings, our ability to
continue to innovate and meet the demands of our customers for new or enhanced products, our ability to successfully integrate assets and companies we have acquired,
our ability to effectively compete, changes in tax policy or accounting rules, fluctuations in foreign exchange rates and commodity prices, adverse changes or volatility in
interest rates, as well as general economic, business, credit and financial market conditions, internationally or nationally, and our ability to continue paying a quarterly
dividend in light of future financial performance and financing needs. The forward-looking statements included herein represent GAIN Capital’s views as of the date of this
release. GAIN Capital undertakes no obligation to revise or update publicly any forward-looking statement for any reason unless required by law.
Non-GAAP Financial Measures
This presentation contains various non-GAAP financial measures, including adjusted EBITDA, adjusted net income, adjusted EPS and various “pro forma” non-GAAP
measures. These non-GAAP financial measures have certain limitations, including that they do not have a standardized meaning and, therefore, our definitions may be
different from similar non-GAAP financial measures used by other companies and/or analysts. Thus, it may be more difficult to compare our financial performance to that
of other companies. We believe our reporting of these non-GAAP financial measures assists investors in evaluating our historical and expected operating performance.
However, because these are not measures of financial performance calculated in accordance with GAAP, such measures should be considered in addition to, but not as a
substitute for, other measures of our financial performance reported in accordance with GAAP, such as net income.

FIRST QUARTER REVIEW
3
• Lower market volatility and narrowing of average trading
ranges weighed on revenue capture
• March trading fundamentals improved compared to January and
February
• On track to return to historic average revenue capture levels in
April
• Identified $15 million in fixed cost savings for 2017
• Translating into $20 million run rate reduction for 2018
• FXCM acquisition strengthened our market position, making FOREX.com the #1 provider of Retail FX in
the U.S.
• Maintained strong balance sheet, which positions us well for future strategic opportunities
• Repurchased 612,423 shares during the quarter for a gross value of $4.7 million
Historic Retail Revenue Per Million
$79
$110
$62
$94
$105
$93
$107
$0
$20
$40
$60
$80
$100
$120
$140
$160
Q1 15 Q2 15 Q3 15 Q4 15 Q1 16 Q2 16 Q3 16 Q4 16 Q1 17
Quarterly Trailing 12 Months Trailing 12 Months - Pro Forma
FXCM U.S. ACQUISITION UPDATE
4
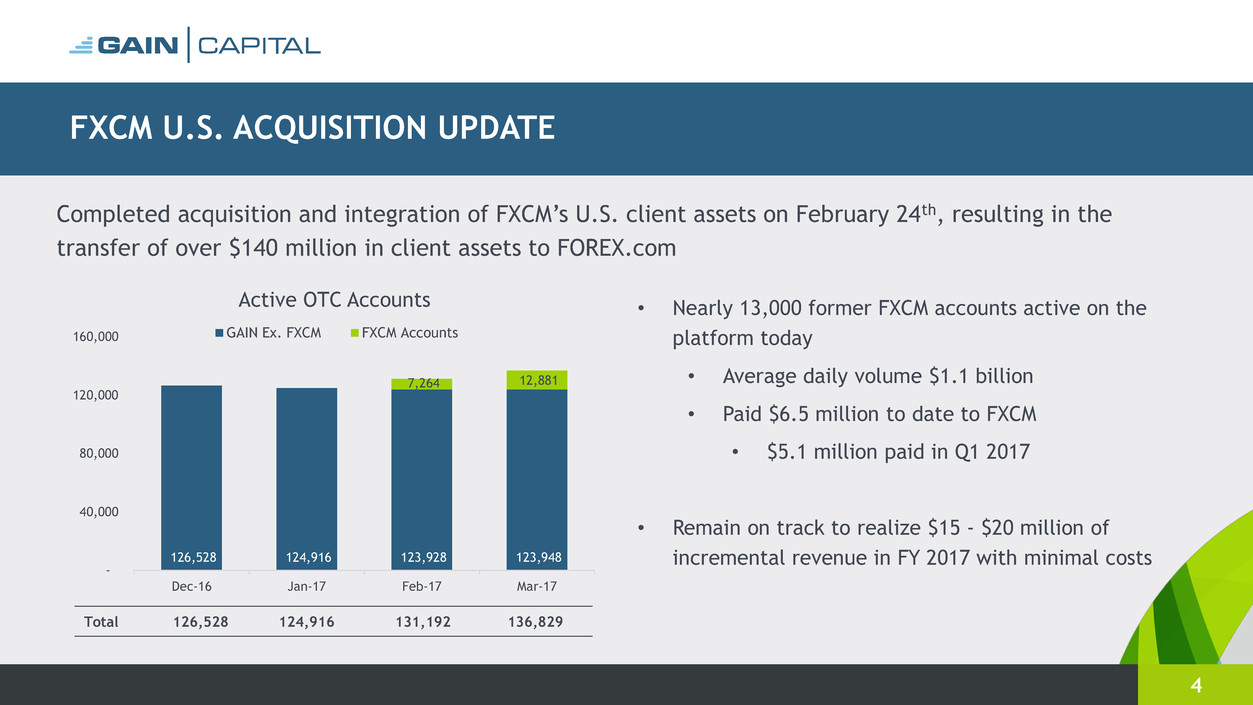
Completed acquisition and integration of FXCM’s U.S. client assets on February 24th, resulting in the
transfer of over $140 million in client assets to FOREX.com
• Nearly 13,000 former FXCM accounts active on the
platform today
• Average daily volume $1.1 billion
• Paid $6.5 million to date to FXCM
• $5.1 million paid in Q1 2017
• Remain on track to realize $15 - $20 million of
incremental revenue in FY 2017 with minimal costs
126,528 124,916 123,928 123,948
7,264 12,881
-
40,000
80,000
120,000
160,000
Dec-16 Jan-17 Feb-17 Mar-17
Active OTC Accounts
GAIN Ex. FXCM FXCM Accounts
Total 126,528 124,916 131,192 136,829
BALANCED GROWTH STRATEGY:
ORGANIC INITIATIVES, COMPLEMENTED BY STRATEGIC M&A
5
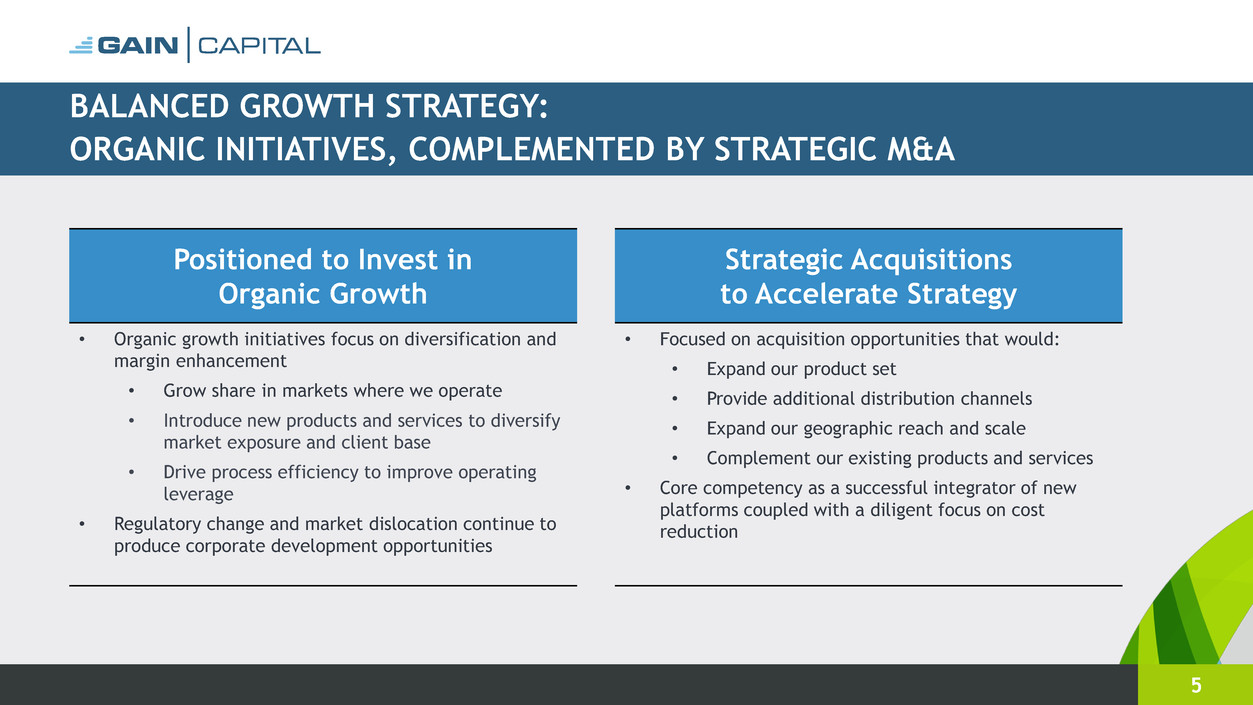
Strategic Acquisitions
to Accelerate Strategy
• Focused on acquisition opportunities that would:
• Expand our product set
• Provide additional distribution channels
• Expand our geographic reach and scale
• Complement our existing products and services
• Core competency as a successful integrator of new
platforms coupled with a diligent focus on cost
reduction
Positioned to Invest in
Organic Growth
• Organic growth initiatives focus on diversification and
margin enhancement
• Grow share in markets where we operate
• Introduce new products and services to diversify
market exposure and client base
• Drive process efficiency to improve operating
leverage
• Regulatory change and market dislocation continue to
produce corporate development opportunities

Expansion into Digital
Advisory
• Developing new products
for clients seeking
personalized trading
advice
ORGANIC GROWTH INITIATIVES PROGRESS UNDERWAY
6
Investing in product enhancements and marketing to drive long-term growth within our existing platforms
Redesigned Trading
Experience
• New web-based trading
platform launched in US
in April
• Upgrade of mobile trading
apps in early June
• Active trader program
launched in US; further
market roll-out Q2
Automated and
Streamlined Account
Opening
• Optimized end-to-end
mobile account opening
and funding process
• New funding options for
APAC customers, including
eWallets in late Q2
Global, Cross Brand
Affiliate Marketing
Program
• Introduction of the pilot
program in UK market
• Rolling out across other
regions in Q3

Financial Review
7

KEY FINANCIAL RESULTS & OPERATING METRICS
8
Note: Dollars in millions, except per share data. Columns may not add due to rounding.
(1) Adjusted EBITDA is a non-GAAP financial measure that represents our earnings before interest, taxes, depreciation, amortization and other one-time items. A reconciliation of net income/(loss) to adjusted EBITDA is available in the appendix to this presentation.
(2) Adjusted net income/(loss) is a non-GAAP financial measure that represents net income/(loss) excluding the impact of one-time items. A reconciliation of GAAP net income/(loss) to adjusted net income/(loss) is available in the appendix to this presentation.
(3) Adjusted EPS is a non-GAAP financial measure that represents net income/(loss) per share excluding the impact of one-time items. A reconciliation of GAAP EPS to adjusted EPS is available in the appendix to this presentation.
(4) Definitions for operating metrics are available in the appendix to this presentation.
3 Months Ended March 31, % Change
2017 2016 Q1
As Reported
Net Revenue $59.6 $115.6 (48%)
Operating Expenses (73.0) (83.9) (13%)
Adjusted EBITDA(1) ($13.4) $31.7 (142%)
Net (Loss)/Income ($18.9) $8.4 (325%)
Adjusted Net (Loss)/Income(2) (18.6) 16.9 (210%)
GAAP Diluted EPS ($0.39) $0.17 (331%)
Adjusted Diluted EPS (3) ($0.39) $0.35 (212%)
Operating Metrics( 4 )
Retail OTC ADV (bns) $9.5 $13.5 (29%)
Institutional ADV (bns) $15.2 $11.2
ECN 11.7 8.3 41%
Swap Dealer 3.5 2.9 19%
Avg. Daily Futures Contracts 33,236 38,267 (13%)

OPERATING SEGMENT RESULTS: RETAIL
9 Note: Dollars in millions, except where noted otherwise. Columns may not add due to rounding.
3 Months Ended March 31,
2017 2016 TTM 3/31/17
Trading Revenue $38.9 $94.7 $274.9
Other Retail Revenue 1.2 2.0 4.8
Total Revenue $40.1 $96.7 $279.7
Employee Comp & Ben 15.3 16.7 61.0
Marketing 8.9 6.2 30.4
Referral Fees 12.3 16.6 50.8
Other Operating Exp. 14.5 20.9 69.1
Segment (Loss)/Profit ($11.0) $36.3 $68.3
% Margin -27% 38% 24%
Operating Metrics
ADV (bns) $9.5 $13.5 $9.9
Active Accounts 136,829 132,452 136,829
Client Assets $754.6 $639.4 $754.6
PnL/mm $62 $110 $107
Retail Financial & Operating Results
Segment Highlights:
• FY 2017 segment loss of $11.0 million with margin of
-27%
• Client assets increased 18% year-over-year, helped in
part by the integration of FXCM accounts
• New accounts in Q1 2017 were 20 - 25% above the
historical average, excluding the newly acquired
FXCM accounts

OPERATING SEGMENT RESULTS: INSTITUTIONAL
10 Note: Dollars in millions, except where noted otherwise. Columns may not add due to rounding.
Segment Highlights:
• FY 2017 segment profit of $1.3 million with margin of
15%
• Average daily volume increased across both ECN and
Swap Dealer platforms
• Q117 saw ECN record volumes, 25% above the previous
high in Q416
• Further growth anticipated, with Tokyo data center now
live following the addition of London in Q416
3 Months Ended March 31,
2017 2016 TTM 3/31/17
ECN $6.1 $4.8 $21.9
Swap Dealer 2.5 2.3 9.8
Total Revenue $8.6 $7.1 $31.7
Employee Comp & Ben 4.0 3.2 15.2
Other Operating Exp. 3.2 2.4 11.2
Segment Profit $1.3 $1.5 $5.2
% Margin 15% 21% 16%
Operating Metrics
ECN ADV (bns) $11.7 $8.3 $9.2
Swap Dealer ADV (bns) 3.5 $2.9 3.1
Insitutional Financial & Operating Results

OPERATING SEGMENT RESULTS: FUTURES
11 Note: Dollars in millions, except where noted otherwise. Columns may not add due to rounding.
Segment Highlights:
• FY 2017 segment profit of $0.3 million with margin of 3%
• Client assets up 22% year-over-year to $288 million
• Contract volumes held up well, despite a 43% drop in
volatility compared to Q116
3 Months Ended March 31,
2017 2016 TTM 3/31/17
Revenue $11.0 $12.2 $46.9
Employee Comp & Ben 2.6 3.0 11.6
Marketing 0.3 0.2 1.1
Referral Fees 4.1 4.1 15.7
Other Operating Exp. 3.7 4.0 14.5
Segment Profit $0.3 $1.0 $4.0
% Margin 3% 8% 9%
Operating Metrics
Avg. Daily Contract 33,236 38,267 31,742
Active Accounts 8,201 8,890 8,201
Client Assets $287.5 $236.6 $287.5
Revenue/Contract $5.32 $5.23 $5.84
Futures Financial & Operating Results
STRATEGIC FIXED EXPENSE MANAGEMENT
12
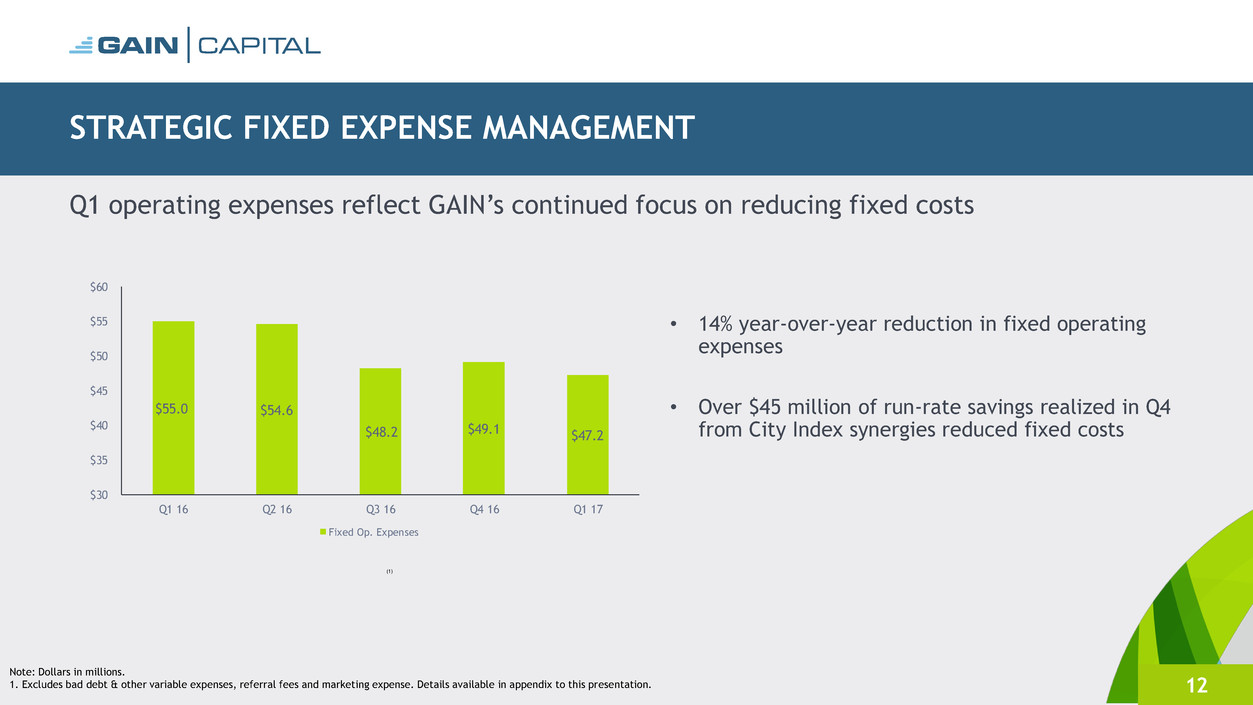
• 14% year-over-year reduction in fixed operating
expenses
• Over $45 million of run-rate savings realized in Q4
from City Index synergies reduced fixed costs
Note: Dollars in millions.
1. Excludes bad debt & other variable expenses, referral fees and marketing expense. Details available in appendix to this presentation.
(1)
Q1 operating expenses reflect GAIN’s continued focus on reducing fixed costs
$55.0 $54.6
$48.2 $49.1 $47.2
$30
$35
$40
$45
$50
$55
$60
Q1 16 Q2 16 Q3 16 Q4 16 Q1 17
Fixed Op. Expenses

FOCUS ON COST EFFICIENCY TO DRIVE MARGIN IMPROVEMENT
13
• Identified $15 million in fixed cost reductions for 2017 across G&A, communications & technology
and trading expenses
• Implies a $20 million run rate cost savings for 2018
• Will continue to identify areas for cost reductions over the next two years as we optimize our capital
spend
• Margin improvements will lower breakeven revenues

ACTIVELY RETURNING CAPITAL TO SHAREHOLDERS
14
Required Liquidity
Reserves
Strategic
Acquisitions
Quarterly Dividends
Buyback Program
Returned over $20 million to investors via buybacks and dividends in 2016
Conservatively retain excess capital over regulatory requirements
As of March 31, 2017, maintained $152.5 million in excess of
regulatory requirements
Successfully integrated 10 acquisitions over the last 5 years
Well positioned for future opportunities like the FXCM transaction
$10.2 million in 2016
Quarterly dividend of $0.06 per share approved
Record date: June 13, 2017
Payment date: June 20, 2017
$9.8 million in 2016
Equity: $8.1 million
Convertible: $1.7 million
Repurchased 612,423 shares at an average price of $7.59 in Q1 2017
~$17 million remains authorized for future opportunistic share repurchases
1. Liquidity table available in appendix to this presentation.
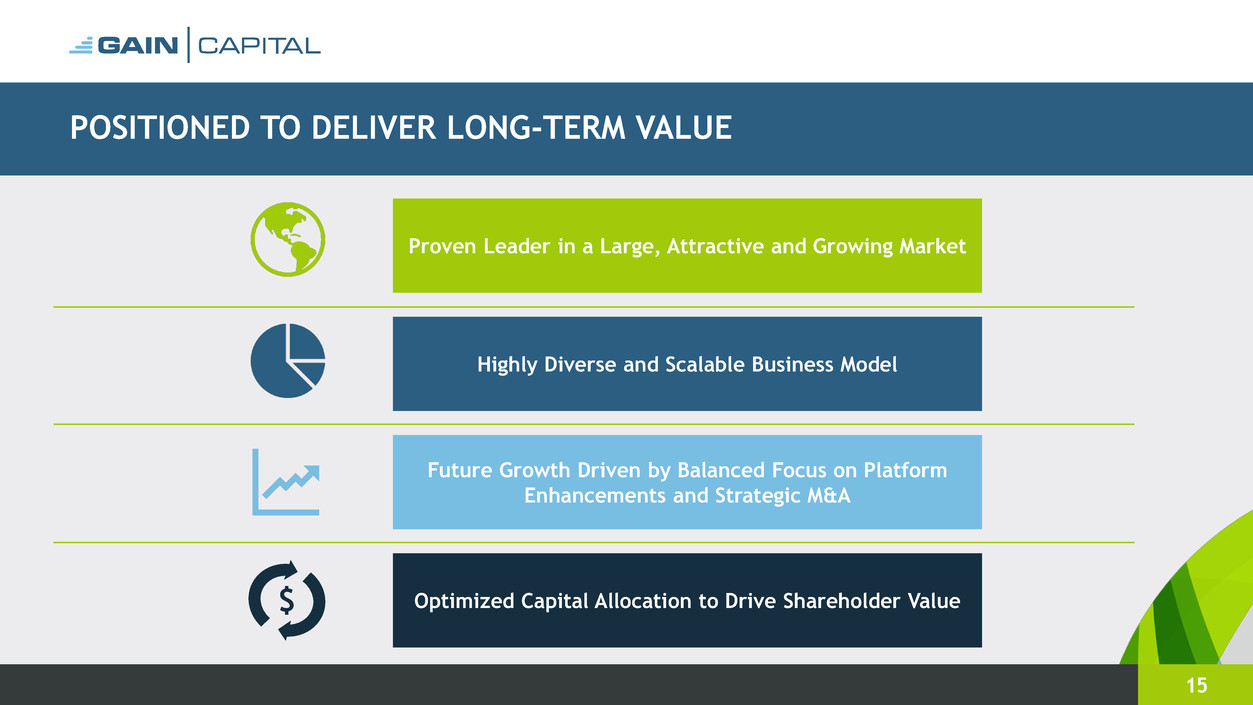
POSITIONED TO DELIVER LONG-TERM VALUE
15
Proven Leader in a Large, Attractive and Growing Market
Optimized Capital Allocation to Drive Shareholder Value
Future Growth Driven by Balanced Focus on Platform
Enhancements and Strategic M&A
Highly Diverse and Scalable Business Model
$

Appendix
16
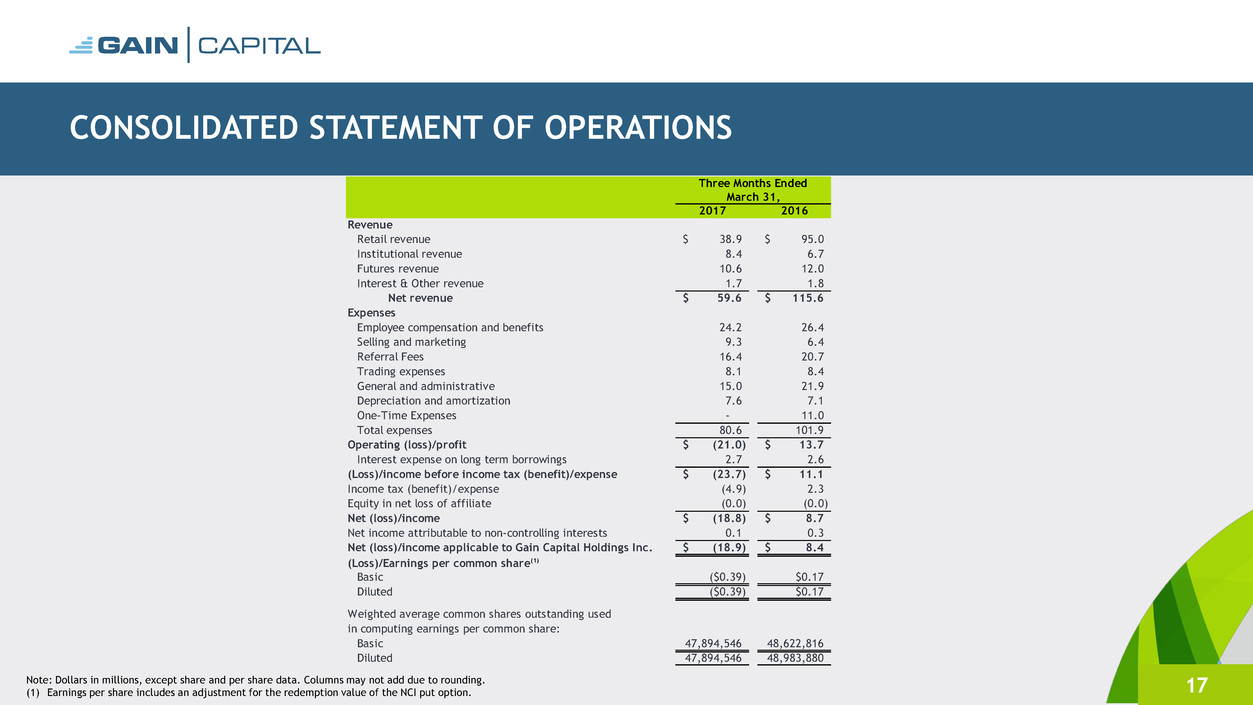
CONSOLIDATED STATEMENT OF OPERATIONS
17 Note: Dollars in millions, except share and per share data. Columns may not add due to rounding. (1) Earnings per share includes an adjustment for the redemption value of the NCI put option.
Three Months Ended
March 31,
2017 2016
Revenue
Retail revenue 38.9$ 95.0$
Institutional revenue 8.4 6.7
Futures revenue 10.6 12.0
Interest & Other revenue 1.7 1.8
Net revenue 59.6$ 115.6$
Expenses
Employee compensation and benefits 24.2 26.4
Selling and marketing 9.3 6.4
Referral Fees 16.4 20.7
Trading expenses 8.1 8.4
General and administrative 15.0 21.9
Depreciation and amortization 7.6 7.1
One-Time Expenses - 11.0
Total expenses 80.6 101.9
Operating (loss)/profit (21.0)$ 13.7$
Interest expense on long term borrowings 2.7 2.6
(Loss)/income before income tax (benefit)/expense (23.7)$ 11.1$
Income tax (benefit)/expense (4.9) 2.3
Equity in net loss of affiliate (0.0) (0.0)
Net (loss)/income (18.8)$ 8.7$
Net income attributable to non-controlling interests 0.1 0.3
Net (loss)/income applicable to Gain Capital Holdings Inc. (18.9)$ 8.4$
(Loss)/Earnings per common share(1)
Basic ($0.39) $0.17
Diluted ($0.39) $0.17
Weighted average common shares outstanding used
in computing earnings per common share:
Basic 47,894,546 48,622,816
Diluted 47,894,546 48,983,880
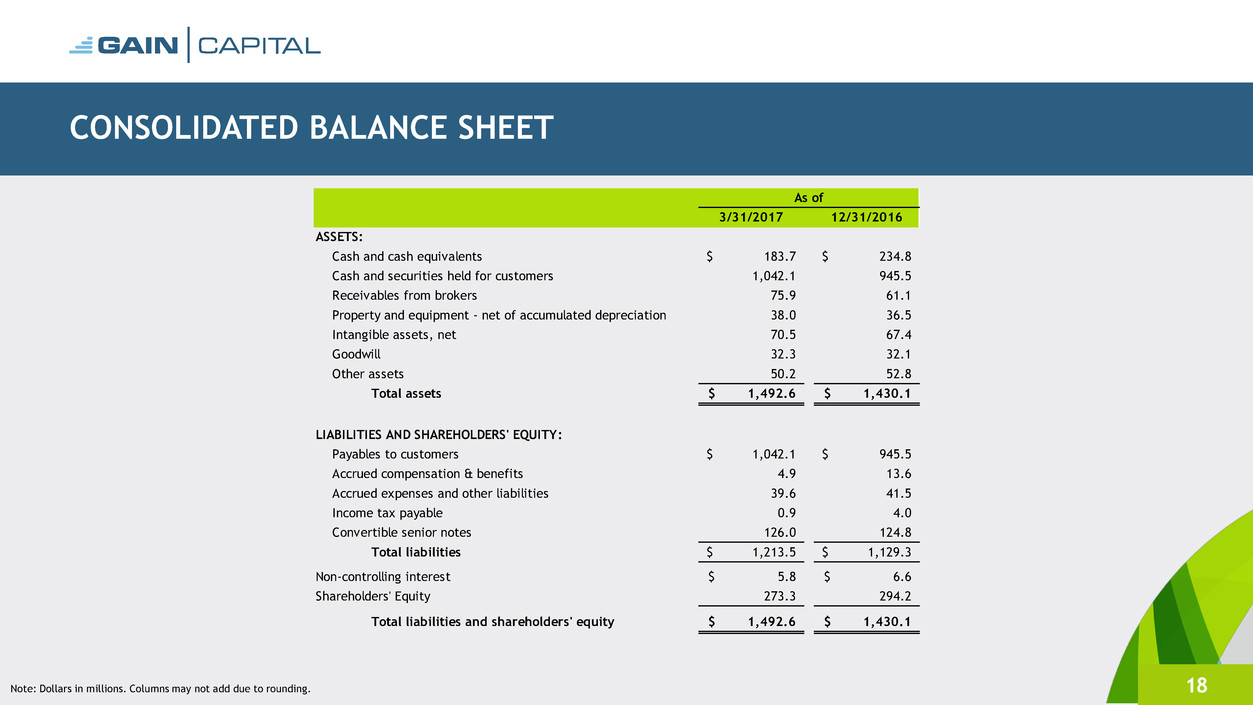
CONSOLIDATED BALANCE SHEET
18 Note: Dollars in millions. Columns may not add due to rounding.
As of
3/31/2017 12/31/2016
ASSETS:
Cash and cash equivalents 183.7$ 234.8$
Cash and securities held for customers 1,042.1 945.5
Receivables from brokers 75.9 61.1
Property and equipment - net of accumulated depreciation 38.0 36.5
Intangible assets, net 70.5 67.4
Goodwill 32.3 32.1
Other assets 50.2 52.8
Total assets 1,492.6$ 1,430.1$
LIABILITIES AND SHAREHOLDERS' EQUITY:
Payables to customers 1,042.1$ 945.5$
Accrued compensation & benefits 4.9 13.6
Accrued expenses and other liabilities 39.6 41.5
Income tax payable 0.9 4.0
Convertible senior notes 126.0 124.8
Total liabilities 1,213.5$ 1,129.3$
Non-controlling interest 5.8$ 6.6$
Shareholders' Equity 273.3 294.2
Total liabilities and shareholders' equity 1,492.6$ 1,430.1$
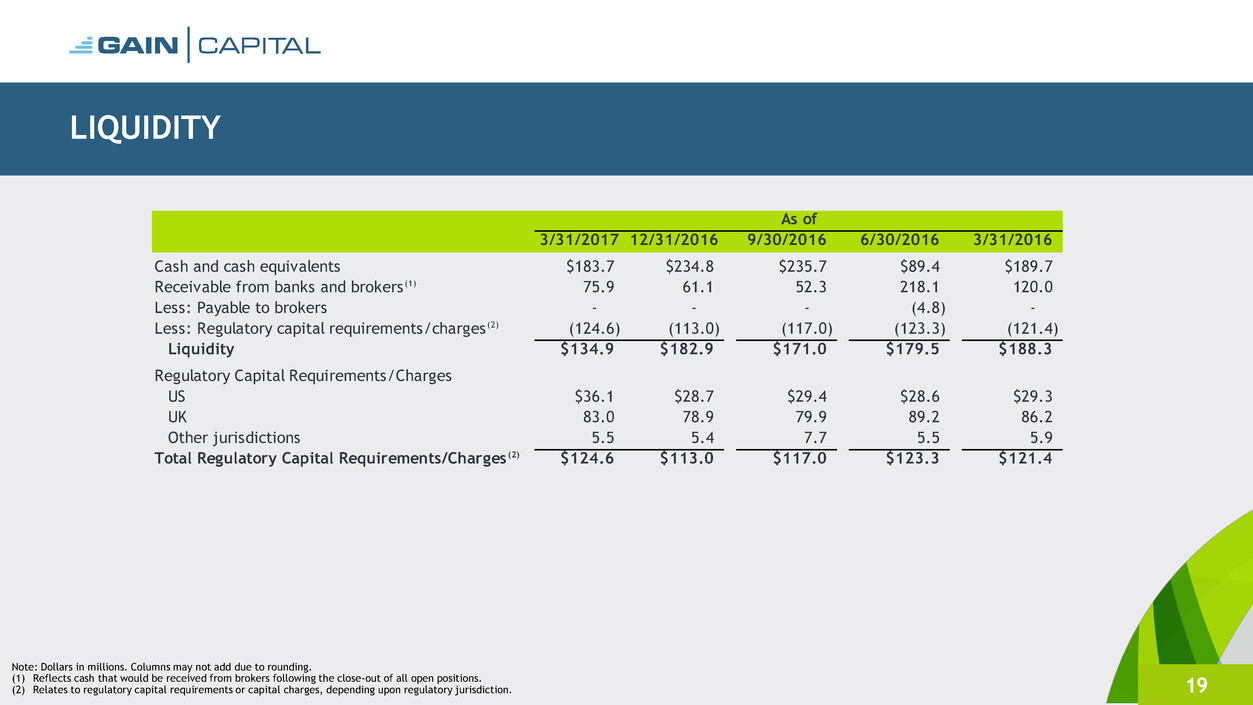
LIQUIDITY
19
Note: Dollars in millions. Columns may not add due to rounding.
(1) Reflects cash that would be received from brokers following the close-out of all open positions.
(2) Relates to regulatory capital requirements or capital charges, depending upon regulatory jurisdiction.
3/31/2017 12/31/2016 9/30/2016 6/30/2016 3/31/2016
Cash and cash equivalents $183.7 $234.8 $235.7 $89.4 $189.7
Receivable from banks and brokers (1) 75.9 61.1 52.3 218.1 120.0
Less: Payable to brokers - - - (4.8) -
Less: Regulatory capital requirements/charges (2) (124.6) (113.0) (117.0) (123.3) (121.4)
Liquidity $134.9 $182.9 $171.0 $179.5 $188.3
Regulatory Capital Requirements/Charges
US $36.1 $28.7 $29.4 $28.6 $29.3
UK 83.0 78.9 79.9 89.2 86.2
Other jurisdictions 5.5 5.4 7.7 5.5 5.9
Total Regulatory Capital Requirements/Charges (2) $124.6 $113.0 $117.0 $123.3 $121.4
As of

ADJUSTED EBITDA & MARGIN RECONCILIATION
20
Note: Dollars in millions. Columns may not add due to rounding.
(1) Adjusted EBITDA margin is calculated as adjusted EBITDA divided by net revenue.
3 Months Ended March 31,
2017 2016
Net Revenue 59.6$ 115.6$
Net (Loss)/Income (18.9) 8.4
Net (Loss)/Income Margin % (32%) 7%
Net (Loss)/Income (18.9)$ 8.4$
Depreciation & amortization 4.0 3.2
Purchase intangible amortization 3.6 3.9
Interest expense on long term borrowings 2.7 2.6
Income tax (benefit)/expense (4.9) 2.3
Restructuring - 0.8
Integration costs - 0.8
Legal settlement - 9.4
Net income attributable to non-controlling interest 0.1 0.3
Adjusted EBITDA (13.4)$ 31.7$
Adjusted EBITDA Margin % (1) (22%) 27%
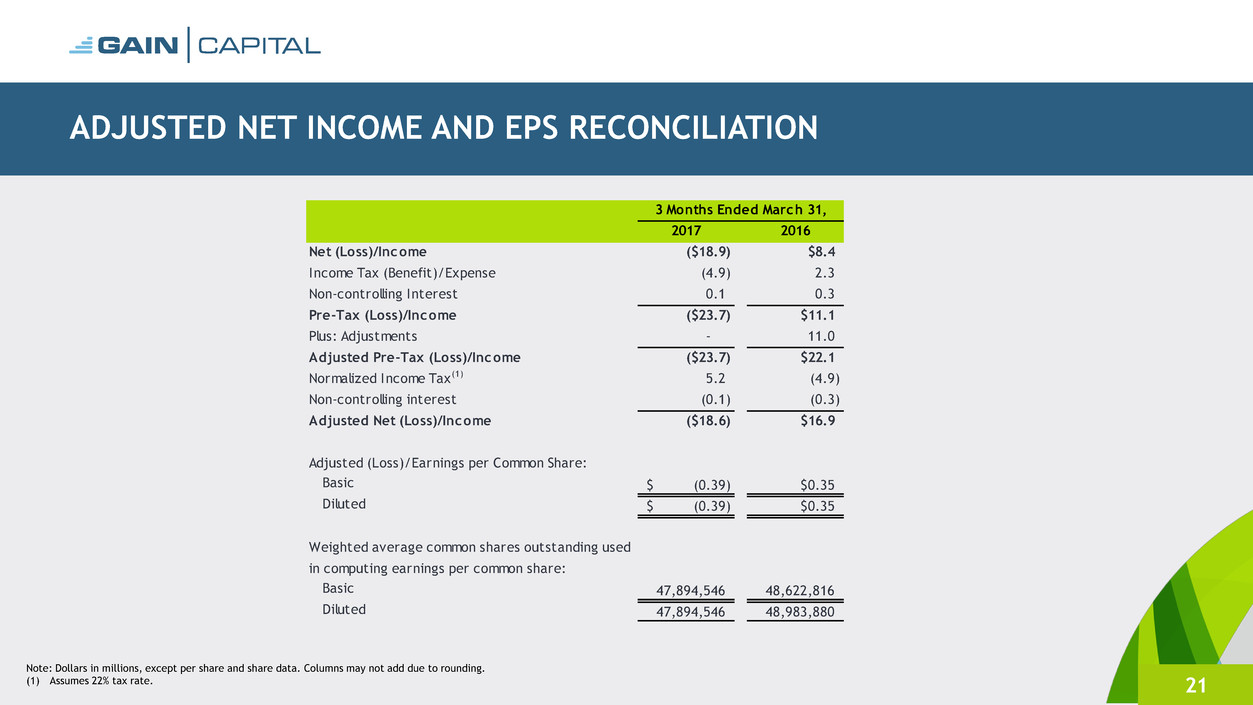
ADJUSTED NET INCOME AND EPS RECONCILIATION
21
Note: Dollars in millions, except per share and share data. Columns may not add due to rounding.
(1) Assumes 22% tax rate.
3 Months Ended March 31,
2017 2016
Net (Loss)/Income ($18.9) $8.4
Income Tax (Benefit)/Expense (4.9) 2.3
Non-controlling Interest 0.1 0.3
Pre-Tax (Loss)/Income ($23.7) $11.1
Plus: Adjustments - 11.0
Adjusted Pre-Tax (Loss)/Income ($23.7) $22.1
Normalized Income Tax(1) 5.2 (4.9)
Non-controlling interest (0.1) (0.3)
Adjusted Net (Loss)/Income ($18.6) $16.9
Adjusted (Loss)/Earnings per Common Share:
Basic (0.39)$ $0.35
Diluted (0.39)$ $0.35
Weighted average common shares outstanding used
in computing earnings per common share:
Basic 47,894,546 48,622,816
Diluted 47,894,546 48,983,880

EPS COMPUTATION
22
Note: Dollars in millions, except per share and share data. Columns may not add due to rounding.
(1) The Company's redeemable non-controlling interests were less than its redemption value. The adjustment to increase
carrying value reduces earnings available to the Company's shareholders.
3 Months Ended March 31,
2017 2016
Net (loss)/income applicable to GAIN Capital Holdings Inc. (18.9)$ 8.4$
Adjustment(1) 0.1 0.1
Net (loss)/income available to GAIN common shareholders (18.8)$ 8.5$
(Loss)/Earnings per common share
Basic ($0.39) $0.17
Diluted ($0.39) $0.17
Weighted average common shares outstanding used
in computing (loss)/earnings per common share:
Basic 47,894,546 48,622,816
Diluted 47,894,546 48,983,880

RECONCILIATION OF SEGMENT PROFIT TO INCOME BEFORE INCOME TAX EXPENSE
23 Note: Dollars in millions. Columns may not add due to rounding.
Reconciliation of operating segment profit to Income before income tax expense
3 Months Ended March 31,
2017 2016
Retail segment ($11.0) $36.3
Institutional segment 1.3 1.5
Futures segment 0.3 1.0
Corporate and other (4.0) (7.0)
Segment (loss)/profit ($13.4) $31.7
Depreciation and amortization $4.0 $3.2
Purchased intangible amortization 3.6 3.9
Restructuring expenses - 0.8
Integration expenses - 0.8
Legal settlement - 9.4
Operating (loss)/profit ($21.0) $13.7
Interest expense on long term borrowings 2.7 2.6
(Loss)/income before income tax (benefit)/expense ($23.7) $11.1

OPERATING EXPENSES
24
Note: Dollars in millions. Columns may not add due to rounding.
2016 2017
Q1 Q2 Q3 Q4 Q1
Total Op. Expenses 83.9$ 80.7$ 68.9$ 78.9$ 73.0$
Bad Debt and other variable 1.8 1.7 0.2 2.2 0.1
Referral Fees 20.7 17.6 15.2 17.3 16.4
Marketing 6.4 6.8 5.3 10.2 9.3
Fixed Op. Expenses 55.0$ 54.6$ 48.2$ 49.1$ 47.2$

RETAIL REVENUE PER MILLION
25
$79
$110
$62
$94
$105
$93
$107
$0
$20
$40
$60
$80
$100
$120
$140
$160
Q1 15 Q2 15 Q3 15 Q4 15 Q1 16 Q2 16 Q3 16 Q4 16 Q1 17
Quarterly Trailing 12 Months Trailing 12 Months - Pro Forma

QUARTERLY OPERATING METRICS
26
Note: Volumes in billions; assets in millions. Definitions for all operating metrics are available on page 29.
(1) GAIN has updated its historical active account disclosures to reflect a change in definition for certain accounts.
Three Months Ended,
Dec-15 Mar-16 Jun-16 Sep-16 Dec-16 Mar-17
Retail
OTC Trading Volume $812.6 $861.7 $710.9 $612.4 $637.0 $619.3
OTC Average Daily Volume $12.5 $13.5 $10.9 $9.3 $9.8 $9.5
Active OTC Accounts (1) 142,836 132,452 135,369 129,921 126,528 136,829
Institutional
ECN Volume $415.4 $531.6 $526.9 $509.9 $612.2 $759.6
CN Average Daily Volume $6.4 $8.3 $8.1 $7.7 $9.4 $11.7
Swap Dealer Volume $184.3 $186.6 $186.2 $190.0 $216.6 $225.5
Swap Dealer Average Daily Volume $2.8 $2.9 $2.9 $2.9 $3.3 $3.5
Futures
Futures Contracts 1,982,985 2,334,308 2,223,501 1,912,174 1,834,393 2,060,631
Futures Average Daily Contracts 31,476 38,267 34,742 29,878 29,117 33,236
Active Futures Accounts 8,668 8,890 8,822 8,594 8,368 8,201

APRIL 2017 OPERATING METRICS
27
$12.2
$10.2
$10.5
$10.1
$8.3
$9.4
$9.1
$11.7
$8.6
$9.5
$8.5
$10.4
$9.3
$0.0
$2.0
$4.0
$6.0
$8.0
$10.0
$12.0
$14.0
OTC Average Daily Volume ($ bns)
136.3 135.1 135.4 135.5 132.4 129.9 128.4 128.4 126.5 124.9
131.2
136.8 135.9
-
20.0
40.0
60.0
80.0
100.0
120.0
140.0
160.0
Active OTC Accounts (000s)
36.5
34.7
33.1
29.6
28.3
3 .9
28.3
32.9
26.2
32.2
31.0
36.0
28.7
0.0
5.0
10.0
15.0
20.0
25.0
30.0
35.0
40.0
Futures Average Daily Contracts (000s)
$7.8
$6.9
$9.6
$8.3
$6.5
$8.5 $8.7
$10.3
$9.2
$12.1
$11.1
$11.8 $11.5
$0.0
$2.0
$4.0
$6.0
$8.0
$10.
$12.
$14
ECN Average Daily Volume ($ bns)
$3.3
$2.9
$2.4 $2.4
$3.2 $3.1
$2.8
$4.0
$3.2
$4.4
$3.1
$2.9
$2.5
$0.0
$0.5
$1.0
$1.5
$2.0
$2.5
$3.0
$3.5
$4.0
$4.5
$5.0
Swap Dealer Average Daily Volume ($ bns)
8.9 8.9 8.8 8.7 8.6 8.6 8.5 8.5 8.4 8.3 8.2 8.2 8.1
0.0
1.0
2.0
3.0
4.0
5.0
6.0
7
8.0
9.0
10.0
Active Futures Accounts (000s)

PROVEN SUCCESS AS AN INDUSTRY CONSOLIDATOR
28
Ten acquisitions since IPO in 2010
2008
Client Assets:
$124mm
2010
Client Assets:
$257mm
2012
Client Assets:
$446mm
2016
Client Assets:
$946mm
2013
Client Assets:
$739mm
Fortune Capital
(Retail Forex)
MG Financial
(Retail
Forex)
CMS
(Retail
Forex)
dbFX
(Retail Forex)
Open E Cry
(Futures)
GFT U.S.
(Retail Forex)
FX Solutions
(Retail Forex)
GFT
(Retail Forex &
Institutional)
GAA and
Top Third
(Futures)
Galvan
Research
(Advisory)
City Index
(Retail Forex)
Post-IPO Pre-IPO
Mar. 18,
2008
Sept. 13,
2010
Oct. 18,
2010
Feb. 22,
2013
Dec. 6,
2012
Sept. 6,
2012 April 21,
2011
Sept. 24,
2013
March
13, 2014
April 7,
2014
Oct. 31,
2014
FXCM
(Retail Forex)
Feb. 7,
2017
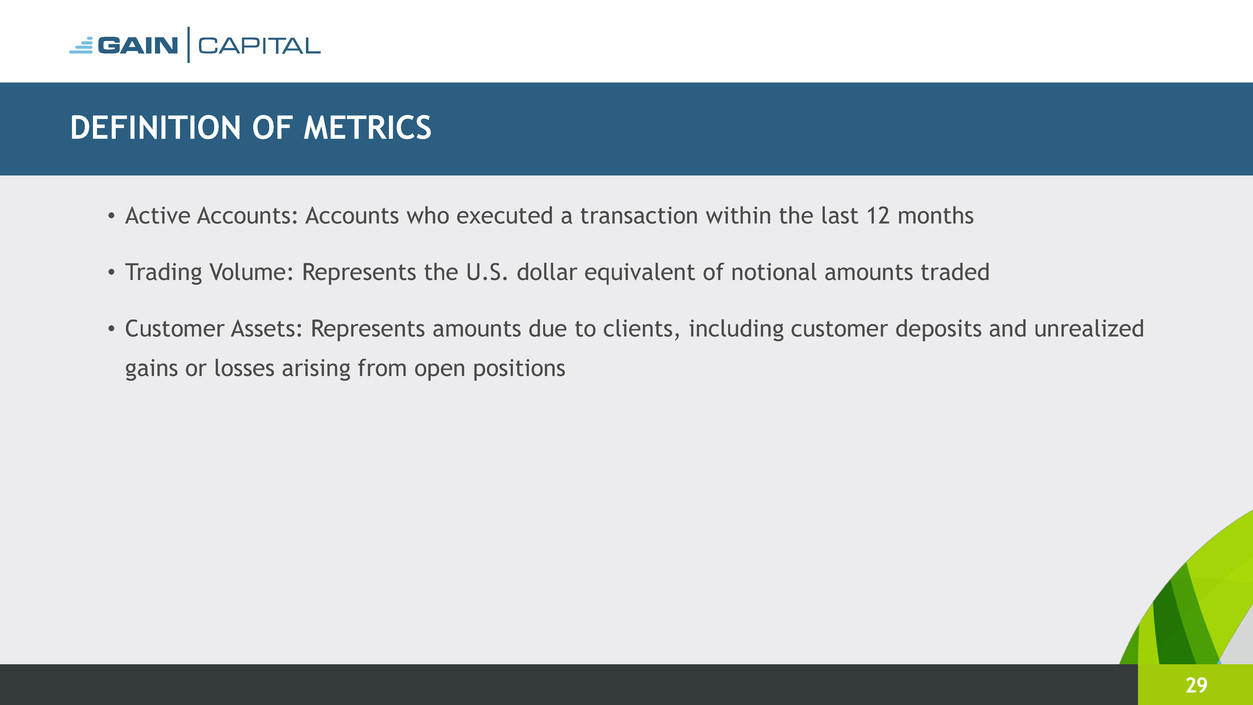
DEFINITION OF METRICS
29
• Active Accounts: Accounts who executed a transaction within the last 12 months
• Trading Volume: Represents the U.S. dollar equivalent of notional amounts traded
• Customer Assets: Represents amounts due to clients, including customer deposits and unrealized
gains or losses arising from open positions

Q1 2017 Results
30
May 2017
