Attached files
| file | filename |
|---|---|
| EX-99.1 - EX-99.1 - NEWFIELD EXPLORATION CO /DE/ | a17-12312_1ex99d1.htm |
| 8-K - 8-K - NEWFIELD EXPLORATION CO /DE/ | a17-12312_18k.htm |
Exhibit 99.2
@NFX – 1Q17 Update
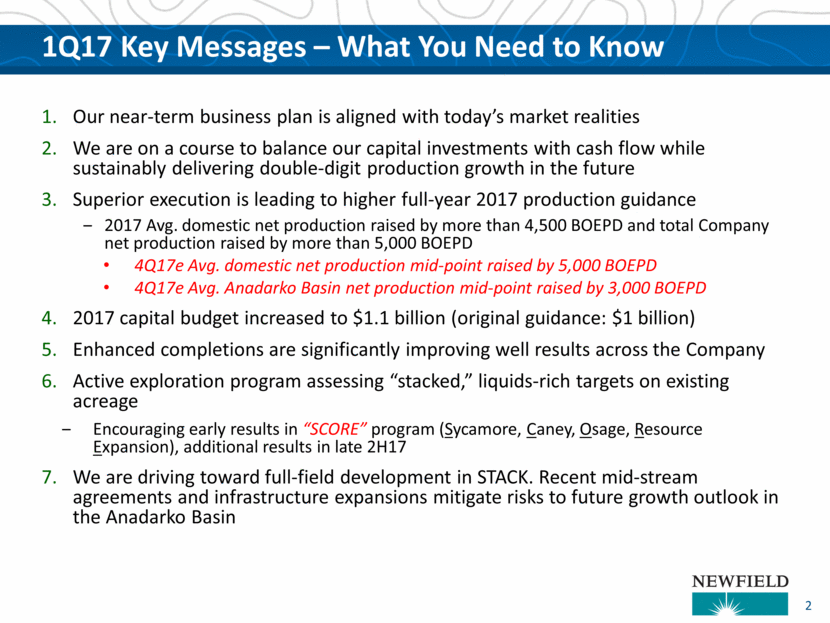
1Q17 Key Messages – What You Need to Know Our near-term business plan is aligned with today’s market realities We are on a course to balance our capital investments with cash flow while sustainably delivering double-digit production growth in the future Superior execution is leading to higher full-year 2017 production guidance 2017 Avg. domestic net production raised by more than 4,500 BOEPD and total Company net production raised by more than 5,000 BOEPD 4Q17e Avg. domestic net production mid-point raised by 5,000 BOEPD 4Q17e Avg. Anadarko Basin net production mid-point raised by 3,000 BOEPD 2017 capital budget increased to $1.1 billion (original guidance: $1 billion) Enhanced completions are significantly improving well results across the Company Active exploration program assessing “stacked,” liquids-rich targets on existing acreage Encouraging early results in “SCORE” program (Sycamore, Caney, Osage, Resource Expansion), additional results in late 2H17 We are driving toward full-field development in STACK. Recent mid-stream agreements and infrastructure expansions mitigate risks to future growth outlook in the Anadarko Basin 2
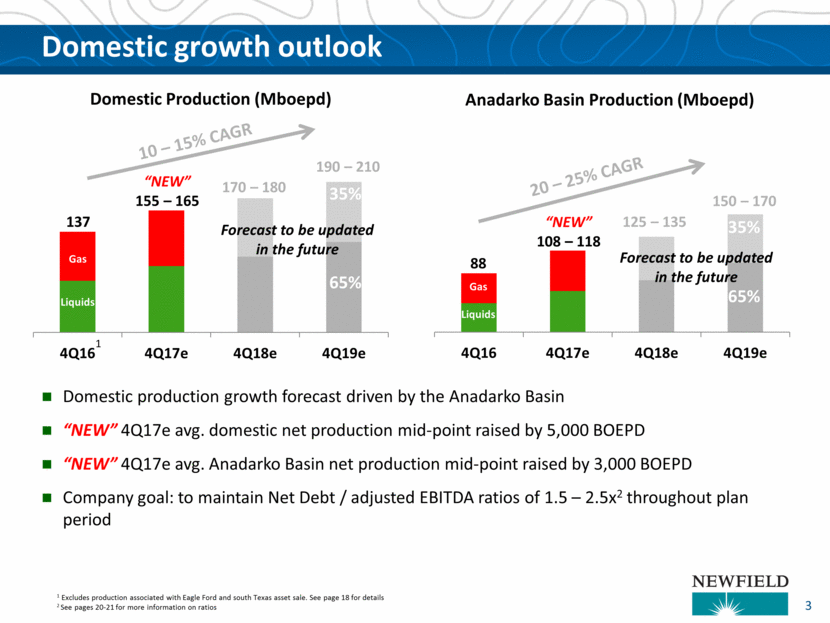
Domestic growth outlook 10 – 15% CAGR 20 – 25% CAGR 88 “NEW” 108 – 118 125 – 135 137 “NEW” 155 – 165 170 – 180 Liquids Gas Liquids Gas 190 – 210 150 – 170 65% 65% 35% 35% 3 1 Excludes production associated with Eagle Ford and south Texas asset sale. See page 18 for details 2 See pages 20-21 for more information on ratios 1 Forecast to be updated in the future Forecast to be updated in the future Domestic production growth forecast driven by the Anadarko Basin “NEW” 4Q17e avg. domestic net production mid-point raised by 5,000 BOEPD “NEW” 4Q17e avg. Anadarko Basin net production mid-point raised by 3,000 BOEPD Company goal: to maintain Net Debt / adjusted EBITDA ratios of 1.5 – 2.5x2 throughout plan period 4Q16 4Q17e 4Q18e 4Q19e Anadarko Basin Production ( Mboepd )
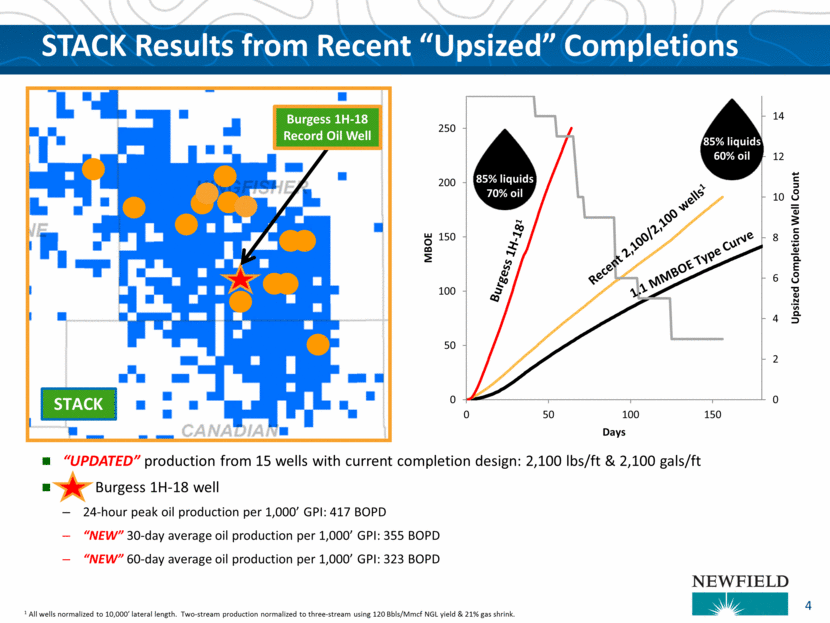
“UPDATED” production from 15 wells with current completion design: 2,100 lbs/ft & 2,100 gals/ft Burgess 1H-18 well 24-hour peak oil production per 1,000’ GPI: 417 BOPD “NEW” 30-day average oil production per 1,000’ GPI: 355 BOPD “NEW” 60-day average oil production per 1,000’ GPI: 323 BOPD 1 All wells normalized to 10,000’ lateral length. Two-stream production normalized to three-stream using 120 Bbls/Mmcf NGL yield & 21% gas shrink. STACK 1.1 MMBOE Type Curve Recent 2,100/2,100 wells1 Burgess 1H-181 85% liquids 70% oil 85% liquids 60% oil STACK Results from Recent “Upsized” Completions Burgess 1H-18 Record Oil Well 4 0 2 4 6 8 10 12 14 0 50 100 150 200 250 0 50 100 150 Upsized Completion Well Count MBOE Days
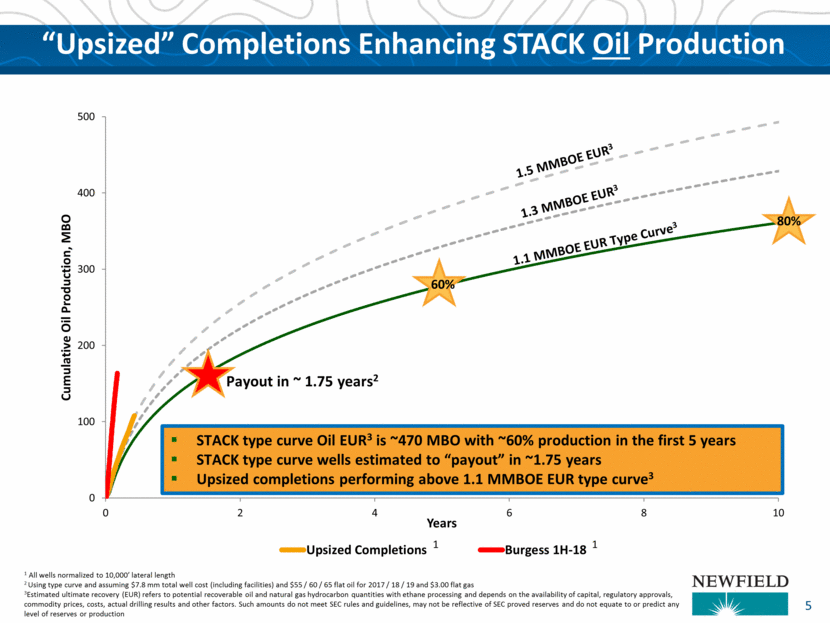
1 All wells normalized to 10,000’ lateral length 2 Using type curve and assuming $7.8 mm total well cost (including facilities) and $55 / 60 / 65 flat oil for 2017 / 18 / 19 and $3.00 flat gas 3Estimated ultimate recovery (EUR) refers to potential recoverable oil and natural gas hydrocarbon quantities with ethane processing and depends on the availability of capital, regulatory approvals, commodity prices, costs, actual drilling results and other factors. Such amounts do not meet SEC rules and guidelines, may not be reflective of SEC proved reserves and do not equate to or predict any level of reserves or production “Upsized” Completions Enhancing STACK Oil Production 1.1 MMBOE EUR Type Curve3 STACK type curve Oil EUR3 is ~470 MBO with ~60% production in the first 5 years STACK type curve wells estimated to “payout” in ~1.75 years Upsized completions performing above 1.1 MMBOE EUR type curve3 Payout in ~ 1.75 years2 60% 80% 1.3 MMBOE EUR3 1.5 MMBOE EUR3 5 1 1 0 100 200 300 400 500 0 2 4 6 8 10 Cumulative Oil Production, MBO Years Upsized Completions Burgess 1H-18
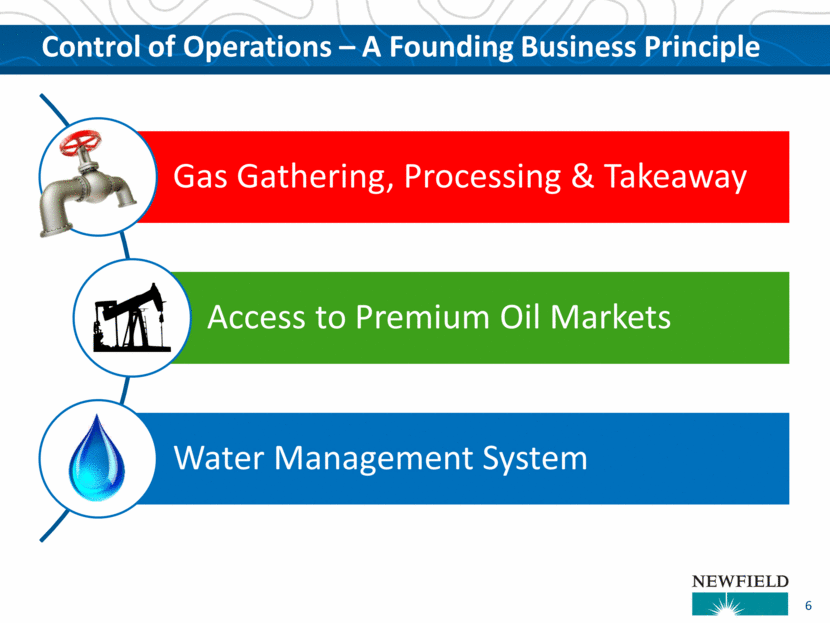
Control of Operations – A Founding Business Principle 6 Gas Gathering, Processing & Takeaway Access to Premium Oil Markets Water Management System
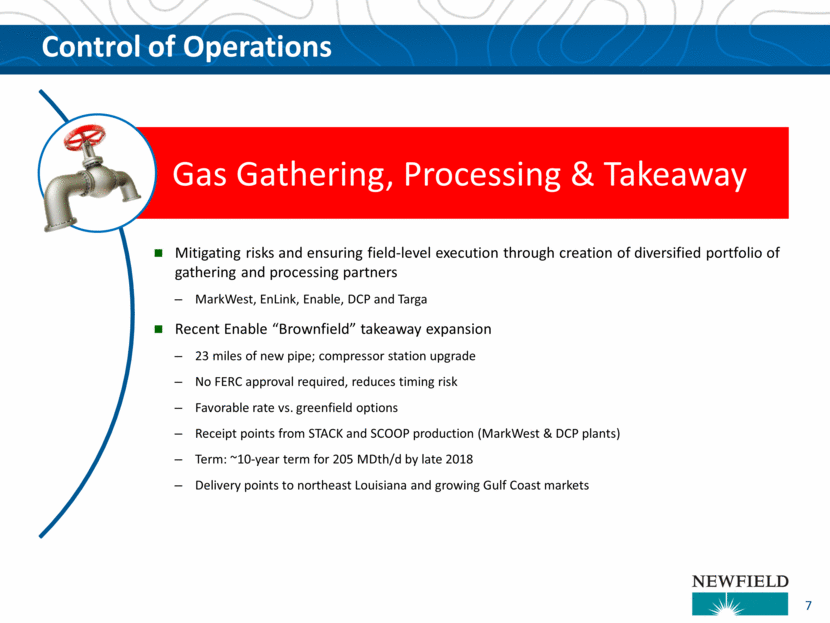
Control of Operations 7 Gas Gathering, Processing & Takeaway Mitigating risks and ensuring field-level execution through creation of diversified portfolio of gathering and processing partners MarkWest, EnLink, Enable, DCP and Targa Recent Enable “Brownfield” takeaway expansion 23 miles of new pipe; compressor station upgrade No FERC approval required, reduces timing risk Favorable rate vs. greenfield options Receipt points from STACK and SCOOP production (MarkWest & DCP plants) Term: ~10-year term for 205 MDth/d by late 2018 Delivery points to northeast Louisiana and growing Gulf Coast markets
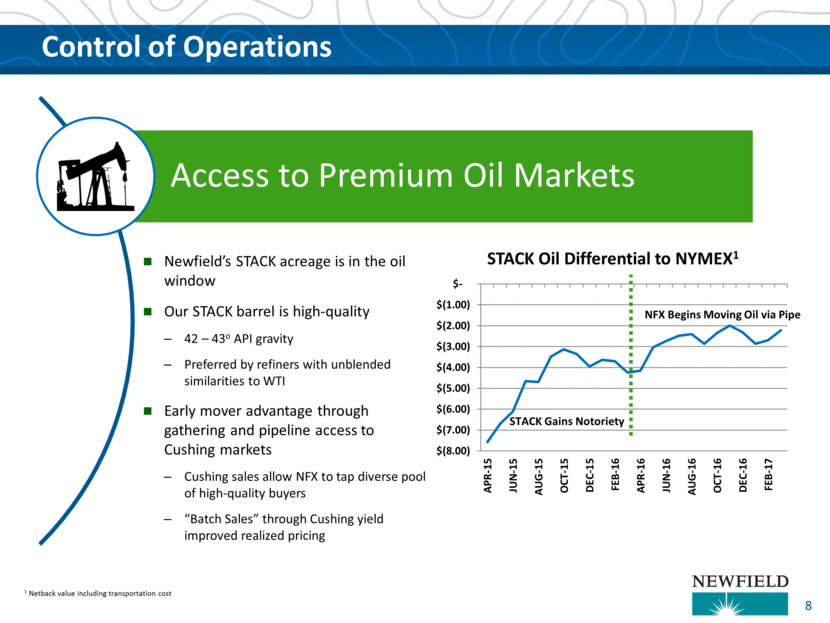
Control of Operations Access to Premium Oil Markets NFX Begins Moving Oil via Pipe STACK Gains Notoriety Newfield’s STACK acreage is in the oil window Our STACK barrel is high-quality 42 – 43o API gravity Preferred by refiners with unblended similarities to WTI Early mover advantage through gathering and pipeline access to Cushing markets Cushing sales allow NFX to tap diverse pool of high-quality buyers “Batch Sales” through Cushing yield improved realized pricing 8 1 Netback value including transportation cost $(8.00) $(7.00) $(6.00) $(5.00) $(4.00) $(3.00) $(2.00) $(1.00) $- APR-15 JUN-15 AUG-15 OCT-15 DEC-15 FEB-16 APR-16 JUN-16 AUG-16 OCT-16 DEC-16 FEB-17 STACK Oil Differential to NYMEX 1
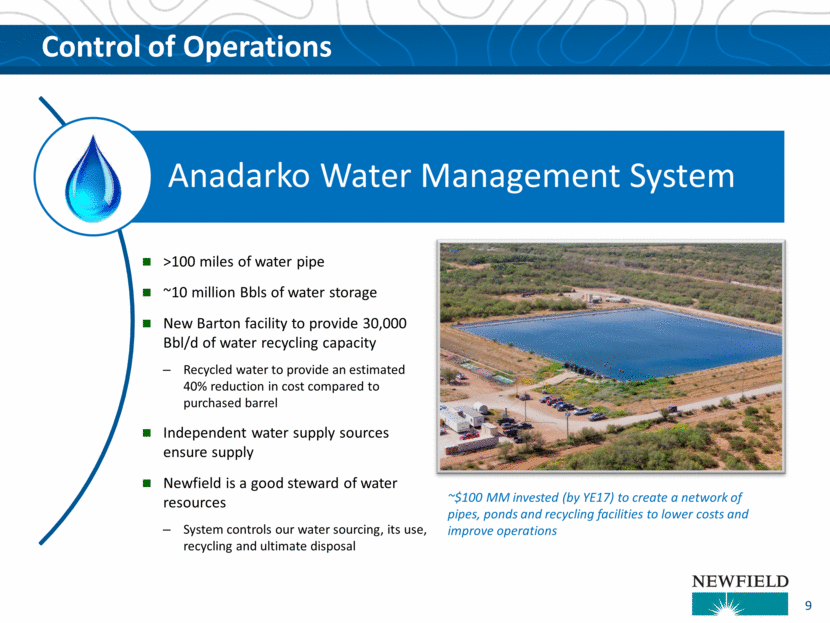
Control of Operations Anadarko Water Management System >100 miles of water pipe ~10 million Bbls of water storage New Barton facility to provide 30,000 Bbl/d of water recycling capacity Recycled water to provide an estimated 40% reduction in cost compared to purchased barrel Independent water supply sources ensure supply Newfield is a good steward of water resources System controls our water sourcing, its use, recycling and ultimate disposal 9 ~$100 MM invested (by YE17) to create a network of pipes, ponds and recycling facilities to lower costs and improve operations
Appendix

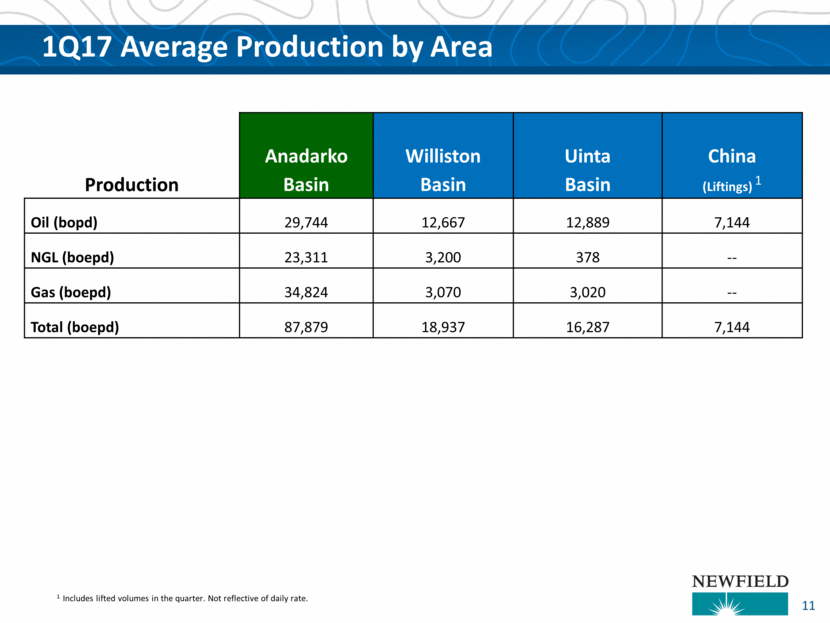
1Q17 Average Production by Area Production Anadarko Basin Williston Basin Uinta Basin China (Liftings) 1 Oil (bopd) 29,744 12,667 12,889 7,144 NGL (boepd) 23,311 3,200 378 -- Gas (boepd) 34,824 3,070 3,020 -- Total (boepd) 87,879 18,937 16,287 7,144 1 Includes lifted volumes in the quarter. Not reflective of daily rate. 11
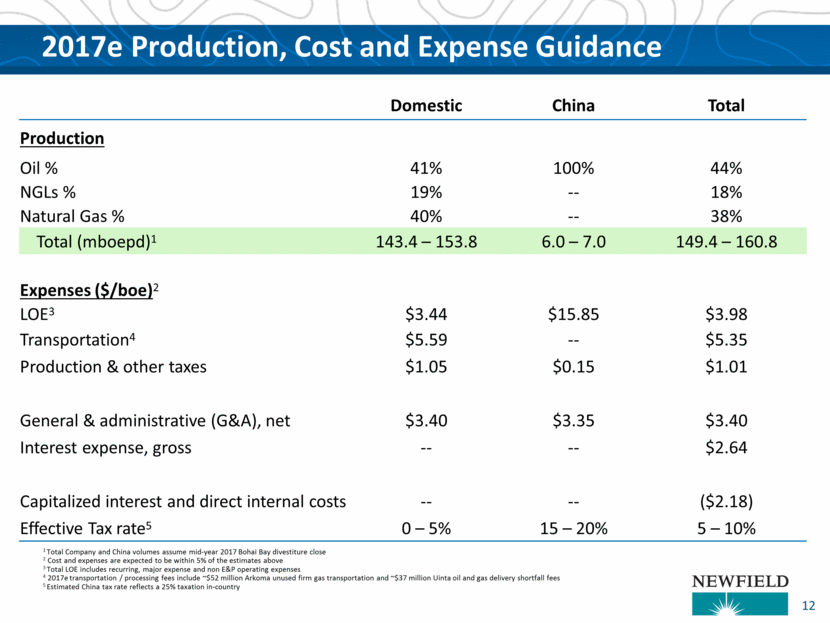
2017e Production, Cost and Expense Guidance 12 Domestic China Total Production Oil % 41% 100% 44% NGLs % 19% -- 18% Natural Gas % 40% -- 38% Total (mboepd)1 143.4 – 153.8 6.0 – 7.0 149.4 – 160.8 Expenses ($/boe)2 LOE3 $3.44 $15.85 $3.98 Transportation4 $5.59 -- $5.35 Production & other taxes $1.05 $0.15 $1.01 General & administrative (G&A), net $3.40 $3.35 $3.40 Interest expense, gross -- -- $2.64 Capitalized interest and direct internal costs -- -- ($2.18) Effective Tax rate5 0 – 5% 15 – 20% 5 – 10% 1 Total Company and China volumes assume mid-year 2017 Bohai Bay divestiture close 2 Cost and expenses are expected to be within 5% of the estimates above 3 Total LOE includes recurring, major expense and non E&P operating expenses 4 2017e transportation / processing fees include ~$52 million Arkoma unused firm gas transportation and ~$37 million Uinta oil and gas delivery shortfall fees 5 Estimated China tax rate reflects a 25% taxation in-country
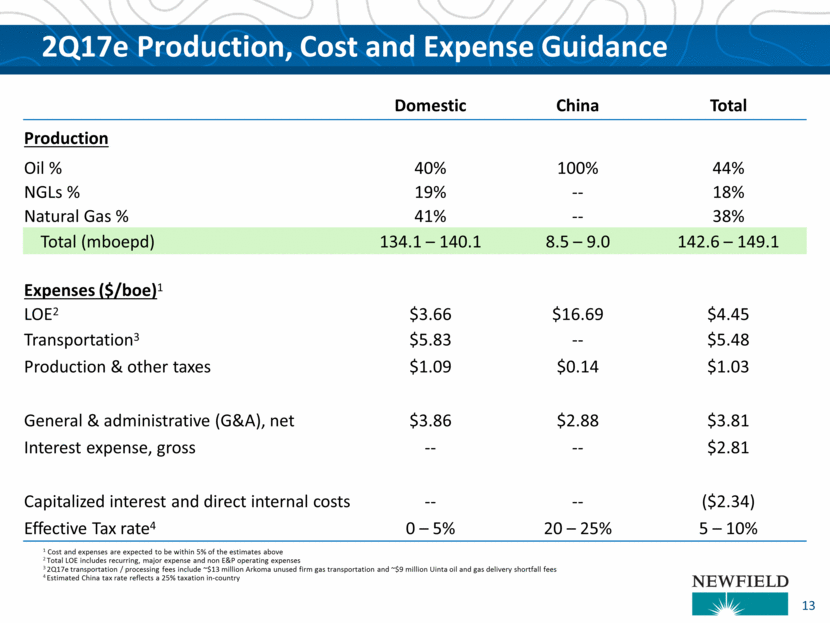
2Q17e Production, Cost and Expense Guidance 13 Domestic China Total Production Oil % 40% 100% 44% NGLs % 19% -- 18% Natural Gas % 41% -- 38% Total (mboepd) 134.1 – 140.1 8.5 – 9.0 142.6 – 149.1 Expenses ($/boe)1 LOE2 $3.66 $16.69 $4.45 Transportation3 $5.83 -- $5.48 Production & other taxes $1.09 $0.14 $1.03 General & administrative (G&A), net $3.86 $2.88 $3.81 Interest expense, gross -- -- $2.81 Capitalized interest and direct internal costs -- -- ($2.34) Effective Tax rate4 0 – 5% 20 – 25% 5 – 10% 1 Cost and expenses are expected to be within 5% of the estimates above 2 Total LOE includes recurring, major expense and non E&P operating expenses 3 2Q17e transportation / processing fees include ~$13 million Arkoma unused firm gas transportation and ~$9 million Uinta oil and gas delivery shortfall fees 4 Estimated China tax rate reflects a 25% taxation in-country
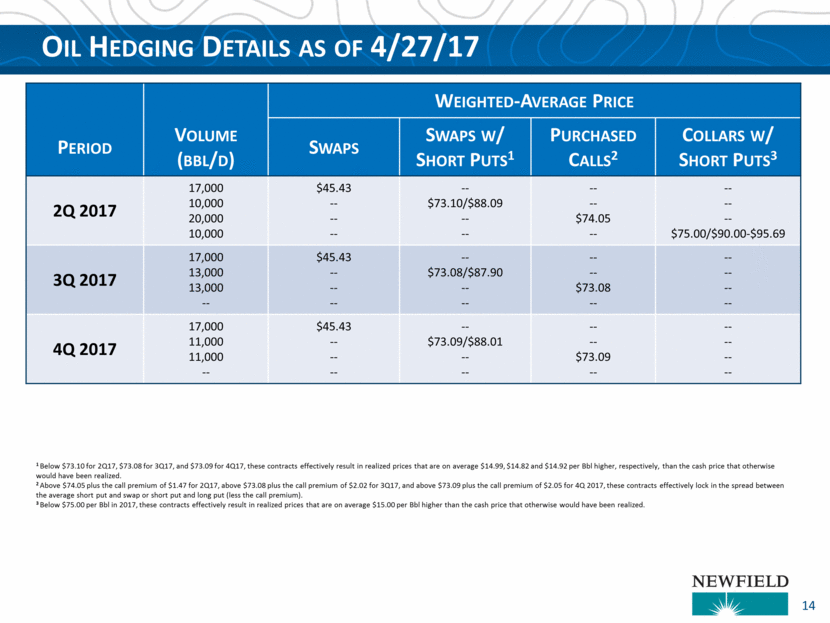
Oil Hedging Details as of 4/27/17 14 Weighted-Average Price Period Volume (bbl/d) Swaps Swaps w/ Short Puts1 Purchased Calls2 Collars w/ Short Puts3 2Q 2017 17,000 10,000 20,000 10,000 $45.43 -- -- -- -- $73.10/$88.09 -- -- -- -- $74.05 -- -- -- -- $75.00/$90.00-$95.69 3Q 2017 17,000 13,000 13,000 -- $45.43 -- -- -- -- $73.08/$87.90 -- -- -- -- $73.08 -- -- -- -- -- 4Q 2017 17,000 11,000 11,000 -- $45.43 -- -- -- -- $73.09/$88.01 -- -- -- -- $73.09 -- -- -- -- -- 1 Below $73.10 for 2Q17, $73.08 for 3Q17, and $73.09 for 4Q17, these contracts effectively result in realized prices that are on average $14.99, $14.82 and $14.92 per Bbl higher, respectively, than the cash price that otherwise would have been realized. 2 Above $74.05 plus the call premium of $1.47 for 2Q17, above $73.08 plus the call premium of $2.02 for 3Q17, and above $73.09 plus the call premium of $2.05 for 4Q 2017, these contracts effectively lock in the spread between the average short put and swap or short put and long put (less the call premium). 3 Below $75.00 per Bbl in 2017, these contracts effectively result in realized prices that are on average $15.00 per Bbl higher than the cash price that otherwise would have been realized.
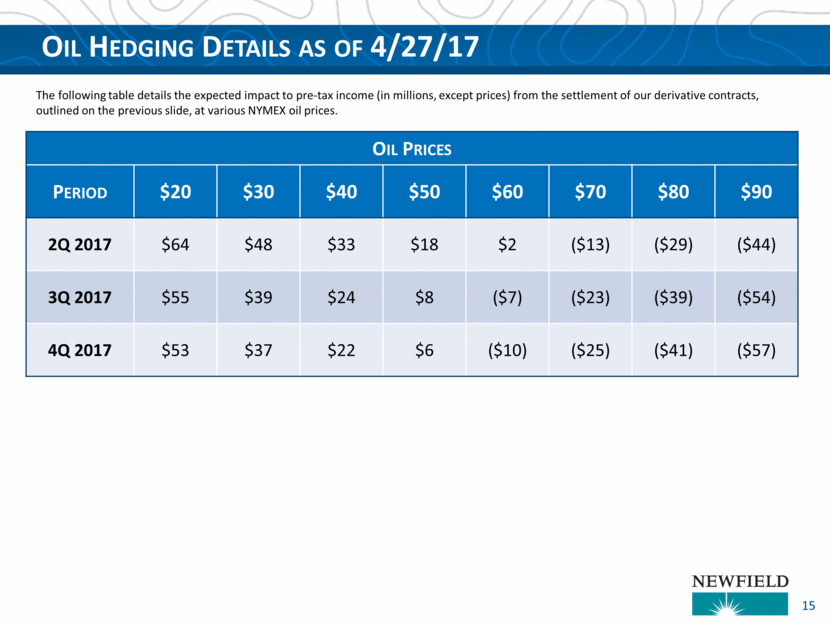
Oil Hedging Details as of 4/27/17 15 Oil Prices Period $20 $30 $40 $50 $60 $70 $80 $90 2Q 2017 $64 $48 $33 $18 $2 ($13) ($29) ($44) 3Q 2017 $55 $39 $24 $8 ($7) ($23) ($39) ($54) 4Q 2017 $53 $37 $22 $6 ($10) ($25) ($41) ($57) The following table details the expected impact to pre-tax income (in millions, except prices) from the settlement of our derivative contracts, outlined on the previous slide, at various NYMEX oil prices.
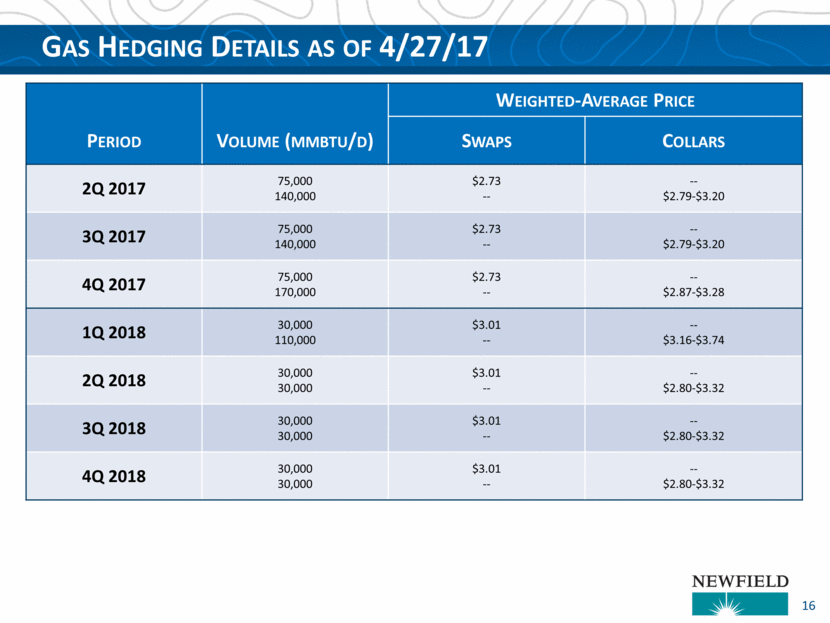
Gas Hedging Details as of 4/27/17 16 Weighted-Average Price Period Volume (mmbtu/d) Swaps Collars 2Q 2017 75,000 140,000 $2.73 -- -- $2.79-$3.20 3Q 2017 75,000 140,000 $2.73 -- -- $2.79-$3.20 4Q 2017 75,000 170,000 $2.73 -- -- $2.87-$3.28 1Q 2018 30,000 110,000 $3.01 -- -- $3.16-$3.74 2Q 2018 30,000 30,000 $3.01 -- -- $2.80-$3.32 3Q 2018 30,000 30,000 $3.01 -- -- $2.80-$3.32 4Q 2018 30,000 30,000 $3.01 -- -- $2.80-$3.32
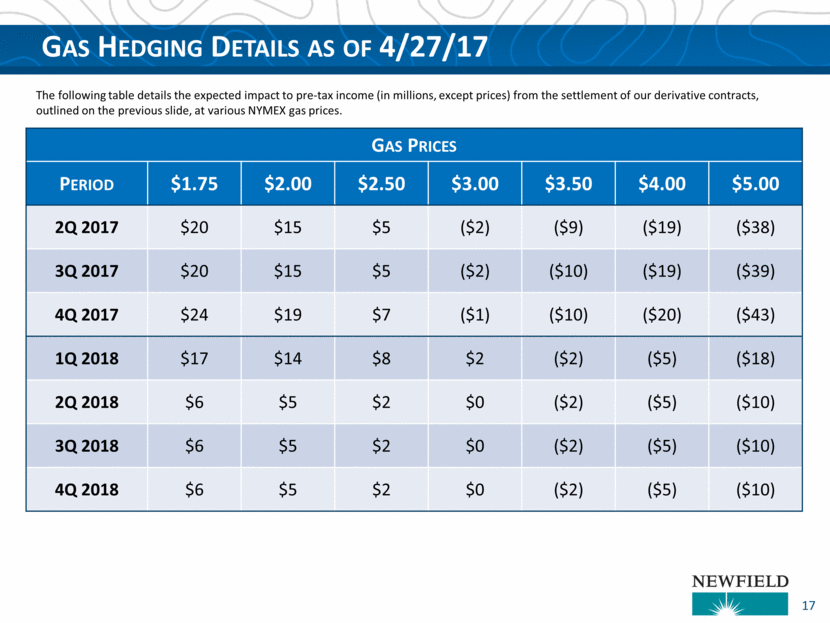
Gas Hedging Details as of 4/27/17 17 Gas Prices Period $1.75 $2.00 $2.50 $3.00 $3.50 $4.00 $5.00 2Q 2017 $20 $15 $5 ($2) ($9) ($19) ($38) 3Q 2017 $20 $15 $5 ($2) ($10) ($19) ($39) 4Q 2017 $24 $19 $7 ($1) ($10) ($20) ($43) 1Q 2018 $17 $14 $8 $2 ($2) ($5) ($18) 2Q 2018 $6 $5 $2 $0 ($2) ($5) ($10) 3Q 2018 $6 $5 $2 $0 ($2) ($5) ($10) 4Q 2018 $6 $5 $2 $0 ($2) ($5) ($10) The following table details the expected impact to pre-tax income (in millions, except prices) from the settlement of our derivative contracts, outlined on the previous slide, at various NYMEX gas prices.
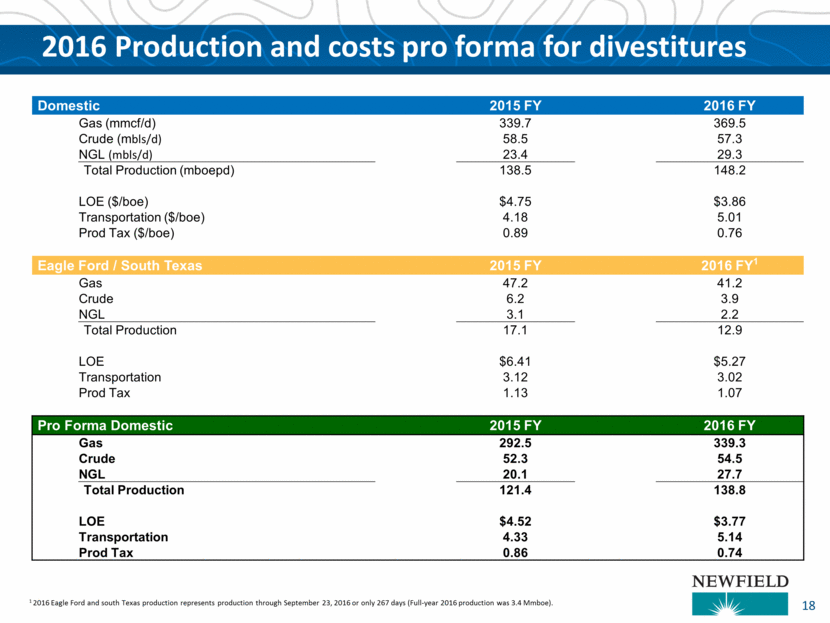
2016 Production and costs pro forma for divestitures Domestic 2015 FY 2016 FY Gas (mmcf/d) 339.7 369.5 Crude (mbls/d) 58.5 57.3 NGL (mbls/d) 23.4 29.3 Total Production (mboepd) 138.5 148.2 LOE ($/boe) $4.75 $3.86 Transportation ($/boe) 4.18 5.01 Prod Tax ($/boe) 0.89 0.76 Eagle Ford / South Texas 2015 FY 2016 FY1 Gas 47.2 41.2 Crude 6.2 3.9 NGL 3.1 2.2 Total Production 17.1 12.9 LOE $6.41 $5.27 Transportation 3.12 3.02 Prod Tax 1.13 1.07 Pro Forma Domestic 2015 FY 2016 FY Gas 292.5 339.3 Crude 52.3 54.5 NGL 20.1 27.7 Total Production 121.4 138.8 LOE $4.52 $3.77 Transportation 4.33 5.14 Prod Tax 0.86 0.74 18 1 2016 Eagle Ford and south Texas production represents production through September 23, 2016 or only 267 days (Full-year 2016 production was 3.4 Mmboe).
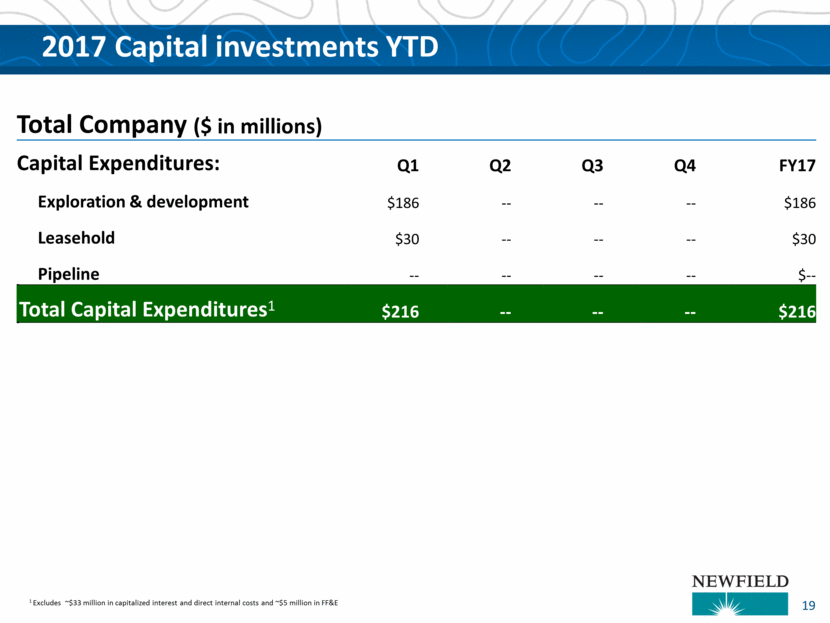
2017 Capital investments YTD Total Company ($ in millions) Capital Expenditures: Q1 Q2 Q3 Q4 FY17 Exploration & development $186 -- -- -- $186 Leasehold $30 -- -- -- $30 Pipeline -- -- -- -- $-- Total Capital Expenditures1 $216 -- -- -- $216 1 Excludes ~$33 million in capitalized interest and direct internal costs and ~$5 million in FF&E 19
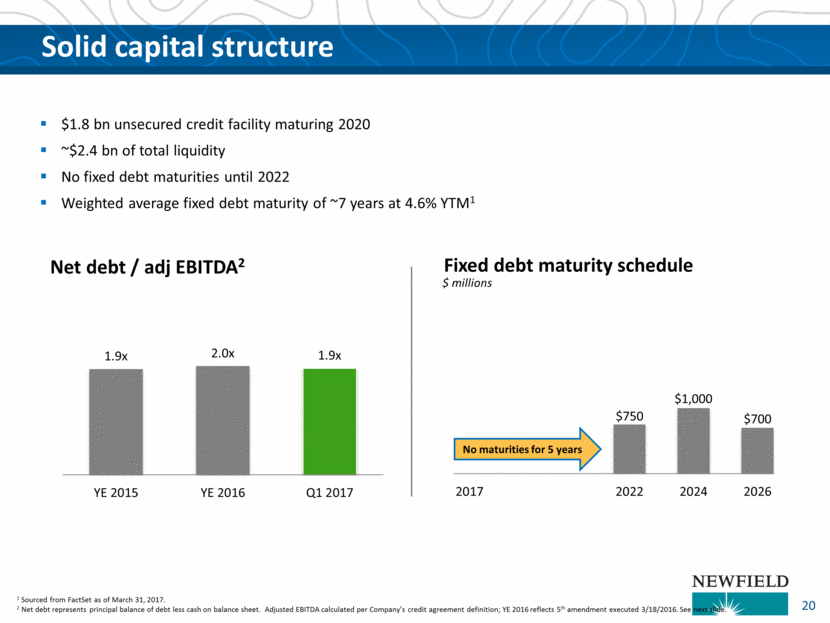
Solid capital structure $1.8 bn unsecured credit facility maturing 2020 ~$2.4 bn of total liquidity No fixed debt maturities until 2022 Weighted average fixed debt maturity of ~7 years at 4.6% YTM1 1 Sourced from FactSet as of March 31, 2017. 2 Net debt represents principal balance of debt less cash on balance sheet. Adjusted EBITDA calculated per Company’s credit agreement definition; YE 2016 reflects 5th amendment executed 3/18/2016. See next slide. Net debt / adj EBITDA2 Fixed debt maturity schedule $ millions No maturities for 5 years 20 $750 $1,000 $700 2017 2018 2019 2020 2021 2022 2023 2024 2025 2026 1.9x 2.0x 1.9x YE 2015 YE 2016 Q1 2017
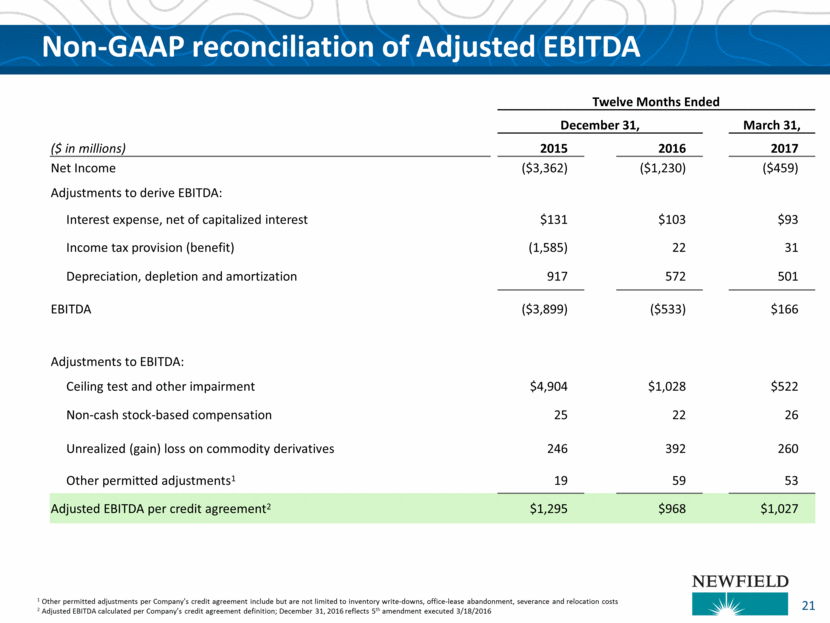
Non-GAAP reconciliation of Adjusted EBITDA 21 Twelve Months Ended December 31, March 31, ($ in millions) 2015 2016 2017 Net Income ($3,362) ($1,230) ($459) Adjustments to derive EBITDA: Interest expense, net of capitalized interest $131 $103 $93 Income tax provision (benefit) (1,585) 22 31 Depreciation, depletion and amortization 917 572 501 EBITDA ($3,899) ($533) $166 Adjustments to EBITDA: Ceiling test and other impairment $4,904 $1,028 $522 Non-cash stock-based compensation 25 22 26 Unrealized (gain) loss on commodity derivatives 246 392 260 Other permitted adjustments1 19 59 53 Adjusted EBITDA per credit agreement2 $1,295 $968 $1,027 1 Other permitted adjustments per Company’s credit agreement include but are not limited to inventory write-downs, office-lease abandonment, severance and relocation costs 2 Adjusted EBITDA calculated per Company’s credit agreement definition; December 31, 2016 reflects 5th amendment executed 3/18/2016
This presentation contains forward-looking statements within the meaning of Section 27A of the Securities Act of 1933, as amended, and Section 21E of the Securities Exchange Act of 1934, as amended. The words ““may,” “forecast,” “outlook,” “could,” “budget,” “objectives,” “strategy,” “believe,” “expect,” “anticipate,” “intend,” “estimate,” “project,” “target,” “goal,” “plan,” “should,” “will,” “predict,” “guidance,” “potential” or other similar expressions are intended to identify forward-looking statements. Other than historical facts included in this presentation, all information and statements, including but not limited to information regarding planned capital expenditures, estimated reserves, estimated production targets, drilling and development plans, the timing of production, planned capital expenditures, and other plans and objectives for future operations, are forward-looking statements. Although, as of the date of this presentation, Newfield believes that these expectations are reasonable, this information is based upon assumptions and anticipated results that are subject to numerous uncertainties and risks. Actual results may vary significantly from those anticipated due to many factors, including but not limited to commodity prices, drilling results, our liquidity and the availability of capital resources, operating risks, industry conditions, U.S. and China governmental regulations, financial counterparty risks, the prices of goods and services, the availability of drilling rigs and other support services, our ability to monetize assets and repay or refinance our existing indebtedness, labor conditions, severe weather conditions, new regulations or changes in tax or environmental legislation, environmental liabilities not covered by indemnity or insurance, legislation or regulatory initiatives intended to address seismic activity, and other operating risks. Please see Newfield’s 2016 Annual Report on Form 10-K, Q1 2017 Quarterly Report on Form 10-Q and subsequent public filings, all filed with the U.S. Securities and Exchange Commission (SEC), for a discussion of other factors that may cause actual results to vary. Unpredictable or unknown factors not discussed herein or in Newfield’s SEC filings could also have material adverse effects on Newfield’s actual results as compared to its anticipated results. Readers are cautioned not to place undue reliance on forward-looking statements, which speak only as of the date of this presentation. Unless legally required, Newfield undertakes no obligation to publicly update or revise any forward-looking statements, whether as a result of new information, future events or otherwise. This presentation has been prepared by Newfield and includes market data and other statistical information from sources believed by Newfield to be reliable, including independent industry publications, government publications or other published independent sources. Some data are also based on Newfield’s good faith estimates, which are derived from its review of internal sources as well as the independent sources described above. Although Newfield believes these sources are reliable, it has not independently verified the information and cannot guarantee its accuracy and completeness. Actual quantities that may be ultimately recovered from Newfield’s interests may differ substantially from the estimates in this presentation. Factors affecting ultimate recovery include the scope of Newfield’s ongoing drilling program, which will be directly affected by commodity prices, the availability of capital, drilling and production costs, availability of drilling services and equipment, drilling results, lease expirations, transportation constraints, regulatory approvals and other factors, and actual drilling results, including geological and mechanical factors affecting recovery rates. Newfield may use terms in this presentation, such as “EURs”, “upside potential”, “net unrisked resource”, “gross EURs”, and similar terms that the SEC’s guidelines strictly prohibit in SEC filings. These terms include reserves with substantially less certainty than proved reserves, and no discount or other adjustment is included in the presentation of such reserve numbers. Investors are urged to consider closely the oil and gas disclosures in Newfield’s 2016 Annual Report on Form 10-K, its Q1 2017 Quarterly Report on Form 10-Qand subsequent public filings, available at www.newfield.com, www.sec.gov or by writing Newfield at 4 Waterway Square Place, Suite 100, The Woodlands, Texas 77380 Attn: Investor Relations. In addition, this presentation contains non-GAAP financial measures, which include, but are not limited to, Adjusted EBITDA. Newfield defines EBITDA as net income/loss before income tax expense/benefit, interest expense and depreciation, depletion and amortization. Adjusted EBITDA, as presented herein, is EBITDA before ceiling test impairments, gains/losses on asset sales, non-cash compensation expense, net unrealized (gains) / losses on commodity derivatives and other permitted adjustments. Adjusted EBITDA is not a recognized term under GAAP and does not represent net income as defined under GAAP, and should not be considered an alternative to net income as an indicator of operating performance or to cash flows as a measure of liquidity. Adjusted EBITDA is a supplemental financial measure used by Newfield’s management and by securities analysts, lenders, ratings agencies and others who follow the industry as an indicator of Newfield’s ability to internally fund exploration and development activities. Forward Looking Statements & Related Matters 22