Attached files
| file | filename |
|---|---|
| EX-99.2 - EXHIBIT 99.2 - NEWFIELD EXPLORATION CO /DE/ | a2017exhibit992.htm |
| EX-99.1 - EXHIBIT 99.1 - NEWFIELD EXPLORATION CO /DE/ | a2017exhibit991.htm |
| EX-32.2 - EXHIBIT 32.2 - NEWFIELD EXPLORATION CO /DE/ | a2017exhibit322.htm |
| EX-32.1 - EXHIBIT 32.1 - NEWFIELD EXPLORATION CO /DE/ | a2017exhibit321.htm |
| EX-31.2 - EXHIBIT 31.2 - NEWFIELD EXPLORATION CO /DE/ | a2017exhibit312.htm |
| EX-31.1 - EXHIBIT 31.1 - NEWFIELD EXPLORATION CO /DE/ | a2017exhibit311.htm |
| EX-24.1 - EXHIBIT 24.1 - NEWFIELD EXPLORATION CO /DE/ | a2017exhibit241.htm |
| EX-23.3 - EXHIBIT 23.3 - NEWFIELD EXPLORATION CO /DE/ | a2017exhibit233.htm |
| EX-23.2 - EXHIBIT 23.2 - NEWFIELD EXPLORATION CO /DE/ | a2017exhibit232.htm |
| EX-23.1 - EXHIBIT 23.1 - NEWFIELD EXPLORATION CO /DE/ | a2017exhibit231.htm |
| EX-21.1 - EXHIBIT 21.1 - NEWFIELD EXPLORATION CO /DE/ | a2017exhibit211.htm |
UNITED STATES SECURITIES AND EXCHANGE COMMISSION
Washington, D.C. 20549
Form 10-K
þ | ANNUAL REPORT PURSUANT TO SECTION 13 OR 15(d) OF THE SECURITIES EXCHANGE ACT OF 1934 | |
For the fiscal year ended December 31, 2017 | ||
or
¨ | TRANSITION REPORT PURSUANT TO SECTION 13 OR 15(d) OF THE SECURITIES EXCHANGE ACT OF 1934 | |
For the transition period from to . | ||
Commission file number: 1-12534
Newfield Exploration Company
(Exact name of registrant as specified in its charter)
Delaware | 72-1133047 | |
(State of incorporation) | (I.R.S. Employer Identification No.) | |
4 Waterway Square Place, Suite 100, The Woodlands, Texas | 77380 (Zip Code) | |
(Address of principal executive offices) | ||
Registrant’s telephone number, including area code:
(281) 210-5100
Securities Registered Pursuant to Section 12(b) of the Act:
Title of Each Class | Name of Each Exchange on Which Registered | |
Common Stock, par value $0.01 per share | New York Stock Exchange | |
Securities Registered Pursuant to Section 12(g) of the Act:
None
Indicate by check mark if the registrant is a well-known seasoned issuer, as defined in Rule 405 of the Securities Act. Yes þ No ¨
Indicate by check mark if the registrant is not required to file reports pursuant to Section 13 or 15(d) of the Act. Yes ¨ No þ
Indicate by check mark whether the registrant (1) has filed all reports required to be filed by Section 13 or 15(d) of the Securities Exchange Act of 1934 during the preceding 12 months (or for such shorter period that the registrant was required to file such reports) and (2) has been subject to such filing requirements for the past 90 days. Yes þ No ¨
Indicate by check mark whether the registrant has submitted electronically and posted on its corporate Web site, if any, every Interactive Data File required to be submitted and posted pursuant to Rule 405 of Regulation S-T (§ 232.405) during the preceding 12 months (or for such shorter period that the registrant was required to submit and post such files). Yes þ No ¨
Indicate by check mark if disclosure of delinquent filers pursuant to Item 405 of Regulation S-K (§ 229.405) is not contained herein, and will not be contained, to the best of the registrant’s knowledge, in definitive proxy or information statements incorporated by reference in Part III of this Form 10-K or any amendment to this Form 10-K. ¨
Indicate by check mark whether the registrant is a large accelerated filer, an accelerated filer, a non-accelerated filer, a smaller reporting company or an emerging growth company. See the definitions of "large accelerated filer," "accelerated filer," "smaller reporting company," and "emerging growth company" in Rule 12b-2 of the Exchange Act. (Check one):
Large accelerated filer þ | Accelerated filer ¨ | Non-accelerated filer ¨ | Smaller reporting company ¨ | Emerging growth company ¨ |
(Do not check if a smaller reporting company) | ||||
If an emerging growth company, indicate by check mark if the registrant has elected not to use the extended transition period for complying with any new or revised financial accounting standards provided pursuant to Section 13(a) of the Exchange Act. ¨
Indicate by check mark whether the registrant is a shell company (as defined in Rule 12b-2 of the Act). Yes ¨ No þ
The aggregate market value of the voting and non-voting common equity held by non-affiliates of the registrant was approximately $5.6 billion as of June 30, 2017 (based on the last sale price of such stock as quoted on the New York Stock Exchange).
As of February 15, 2018, there were 199,722,409 shares of the registrant’s common stock, par value $0.01 per share, outstanding.
Documents incorporated by reference: Portions of the Proxy Statement of Newfield Exploration Company for the Annual Meeting of Stockholders to be held May 15, 2018, which is incorporated by reference to the extent specified in Part III of this Form 10-K.
[THIS PAGE INTENTIONALLY LEFT BLANK]
i
TABLE OF CONTENTS
Page | ||
PART I | ||
Items 1 and 2. | ||
Item 1A. | ||
Item 1B. | ||
Item 3. | ||
Item 4. | ||
PART II | ||
Item 5. | ||
Item 6. | ||
Item 7. | ||
Page | ||
Item 7A. | ||
Item 8. | ||
Item 9. | ||
Item 9A. | ||
Item 9B. | ||
PART III | ||
Item 10. | ||
Item 11. | ||
Item 12. | ||
Item 13. | ||
Item 14. | ||
PART IV | ||
Item 15. | ||
If you are not familiar with any of the oil and gas terms used in this report, we have provided explanations of many of them under the caption "Commonly Used Oil and Gas Terms" at the end of Items 1 and 2 of this report. Unless the context otherwise requires, all references in this report to "Newfield," "we," "us," "our" or the "Company" are to Newfield Exploration Company and its subsidiaries. Unless otherwise noted, all information in this report relating to oil and gas reserves and the estimated future net cash flows attributable to those reserves are based on estimates we prepared and are net to our interest.
Forward-Looking Information
This report contains "forward-looking statements" within the meaning of Section 27A of the Securities Act of 1933, as amended, and Section 21E of the Securities Exchange Act of 1934, as amended (Exchange Act). All statements, other than statements of historical facts included in this report, are forward-looking, including information relating to anticipated future events or results, such as planned capital expenditures, the availability and sources of capital resources to fund capital expenditures, estimates of reserves, projected production timing and targets, estimates of future operating costs and other expenses and other financial measures, acquisitions and divestitures, planned exploratory or developed drilling, projected cash flows and liquidity, estimated future tax rates, business strategy and other plans and objectives for future operations. Forward-looking statements are typically identified by use of terms such as "may," "believe," "expect," "anticipate," "intend," "estimate," "project," "target," "goal," "plan," "should," "will," "predict," "guidance," "potential," "forecast," "outlook," "could," "budget," "objectives," "strategy" and similar expressions that convey the uncertainty of future events or outcomes. Although we believe that the expectations reflected in such forward-looking statements are reasonable as of the date of this report, this information is based upon assumptions and anticipated results that are subject to numerous uncertainties and risks and no assurance can be given that such expectations will prove to have been correct. Actual results may vary significantly from those anticipated due to many factors, including but not limited to, the following:
• | oil, natural gas and natural gas liquids prices; |
• | actions of the Organization of the Petroleum Exporting Countries (OPEC), its members and other state-controlled oil companies relating to oil price and production controls; |
• | environmental liabilities that are not covered by an effective indemnity or insurance; |
• | legislation or regulatory initiatives intended to address seismic activity; |
• | the timing and our success in discovering, producing and estimating reserves; |
• | sustained decline in commodity prices resulting in impairments of assets; |
• | ability to develop existing reserves or acquire new reserves; |
• | the availability and volatility of the securities, capital or credit markets and the cost of capital; |
• | maintaining sufficient liquidity to fund our operations and business strategies; |
• | the accuracy of and fluctuations in our reserves estimates due to sustained low commodity prices, incorrect assumptions and other causes; |
• | operating hazards inherent in the exploration for and production of oil and natural gas; |
• | general economic, financial, industry or business trends or conditions; |
• | the impact of, and changes in, legislation, law and governmental regulations, including the Tax Cuts and Jobs Act (the Tax Act) and those related to hydraulic fracturing, the environment, natural resources, climate change and over-the-counter derivatives; |
• | land, legal, regulatory, and ownership complexities inherent in the U.S. and Chinese oil and gas industries; |
• | the impact of regulatory approvals; |
• | the ability and willingness of current or potential lenders, derivative contract counterparties, customers and working interest owners to fulfill their obligations to us or to enter into transactions with us in the future on terms that are acceptable to us, including the creditworthiness of such counterparties; |
• | the prices and quantities of commodities reflected in our commodity derivative arrangements as compared to the actual prices or quantities of commodities we produce or use; |
• | the volatility, instrument terms and liquidity in the commodity futures and commodity and financial derivatives markets; |
• | drilling risks and results; |
• | the prices and availability of goods and services; |
• | the cost and availability of drilling rigs and other oilfield services; |
• | global events that may impact our domestic and international operating contracts, markets and prices; |
• | our ability to monetize non-strategic assets, repay or refinance our existing indebtedness and the impact of changes in our investment ratings; |
• | labor conditions; |
• | severe weather conditions; |
• | competitive conditions; |
• | terrorism or civil or political unrest in a region or country; |
• | electronic, cyber or physical security breaches; |
• | changes in federal or state tax rates; |
• | inflation rates; |
• | the effect of worldwide energy conservation measures; |
• | the price and availability of, and demand for, competing energy sources; |
• | our ability to successfully execute our business and financial plans and strategies; |
• | the availability (or lack thereof) of acquisition, disposition or combination opportunities; and |
• | the other factors affecting our business described under the captions "Risk Factors" and "Management’s Discussion and Analysis of Financial Condition and Results of Operations — Critical Accounting Policies and Estimates." |
Should one or more of the risks described above occur, or should underlying assumptions prove incorrect, our actual results and plans could differ materially from those expressed in any forward-looking statements.
All forward-looking statements in this report, as well as all other written and oral forward-looking statements attributable to us or persons acting on our behalf, are expressly qualified in their entirety by the cautionary statements contained in this section and elsewhere in this report. See Items 1 and 2, "Business and Properties," Item 1A, "Risk Factors," Item 3, "Legal Proceedings," Item 7, "Management’s Discussion and Analysis of Financial Condition and Results of Operations" and Item 7A, "Quantitative and Qualitative Disclosures About Market Risk" for additional information about factors that may affect our business and operating results. These factors are not necessarily all of the important factors that could affect us. Use caution and common sense when considering these forward-looking statements. Unless securities laws require us to do so, we do not undertake any obligation to publicly correct or update any forward- looking statements whether as a result of changes in internal estimates or expectations, new information, subsequent events or circumstances or otherwise.
PART I
Items 1 and 2. | Business and Properties |
General
Newfield Exploration is an independent exploration and production company with estimated consolidated proved reserves of approximately 680 million barrels of oil equivalent. Substantially all proved reserves and approximately 97% of our daily production are located onshore in the United States. We are a Delaware corporation, incorporated in 1988 and publicly traded on the New York Stock Exchange (NYSE) since 1993. We have been a member of the S&P 500 Index since 2010. Our U.S. operations are onshore and focus primarily on large scale, liquids-rich resource plays in the Anadarko and Arkoma basins of Oklahoma, the Williston Basin of North Dakota and the Uinta Basin of Utah. In addition, we have oil assets offshore China.
2017 Executive Summary
• | Invested $1.156 billion (excluding acquisitions, capitalized interest and capitalized internal costs) primarily in our highest value plays, SCOOP and STACK, located in the Anadarko Basin of Oklahoma; |
• | Increased 2017 average daily domestic production by 10% over 2016 to 152(1) MBOEPD (excluding 9.4 MBOEPD for the sale of our Texas assets sold in 2016); |
• | The Anadarko Basin contributed more than 36 MMBOE in production and comprised more than 63% of total company production. Anadarko Basin production grew 16% year-over-year in 2017 with oil volumes increasing 17% over the same period. The Anadarko Basin holds our greatest concentration of proved reserves with over 475 MMBOE. At year-end 2017, we held approximately 369,000 net acres in the Anadarko Basin; |
• | Increased year-end 2017 estimated proved reserves 33% to 680 MMBOE (59% proved developed). Substantially all of the total proved reserves are located onshore in the United States (total domestic reserves are approximately 37% oil, 21% NGLs and 42% natural gas); |
• | The PV-10(2) associated with our proved reserves increased by 84% to $4.9 billion compared to the prior year-end primarily due to higher commodity prices and the significant increase in proved reserves, partially offset by higher drilling and development costs related to more intensive hydraulic fracturing completions; |
• | Lowered our average domestic lease operating expenses 4%, on a per barrel basis, during 2017; |
• | Completed and commissioned the Barton Creek Water Recycle Facility in STACK, located in Kingfisher County, Oklahoma, which is now processing more than 30,000 barrels of water per day; and |
• | At year-end 2017, we had $326 million of cash and cash equivalents on our consolidated balance sheet and had no borrowings outstanding under our revolving credit facility or money market lines of credit. |
_________________
(1) | Includes 2 MBOEPD of natural gas produced and consumed in operations. |
(2) | PV-10 is a non-GAAP financial measure and generally differs from the standardized measure of discounted future net cash flows (the most directly comparable measure calculated and presented under U.S. generally accepted accounting principles) because it does not include the effects of income taxes on future net revenues. Neither PV-10 nor the standardized measure represents an estimate of the fair market value of our crude oil and natural gas properties. PV-10 is used in the oil and natural gas industry as a measure to compare the relative size and value of proved reserves held by companies without regard to the specific income tax characteristics of such entities. The following table shows a reconciliation of the standardized measure to PV-10: |
Domestic | China | Total | ||||||||||
(In millions) | ||||||||||||
December 31, 2017: | ||||||||||||
Standardized measure of discounted future net cash flows | $ | 4,354 | $ | 47 | $ | 4,401 | ||||||
Present value of future income tax expense | 545 | — | 545 | |||||||||
Proved reserve PV-10 value (before tax) | $ | 4,899 | $ | 47 | $ | 4,946 | ||||||
December 31, 2016: | ||||||||||||
Standardized measure of discounted future net cash flows | $ | 2,520 | $ | 64 | $ | 2,584 | ||||||
Present value of future income tax expense | 101 | — | 101 | |||||||||
Proved reserve PV-10 value (before tax) | $ | 2,621 | $ | 64 | $ | 2,685 | ||||||
2018 Outlook
Our 2018 business plan was created to deliver the following key objectives:
• | Improve our rates of return through continued high-grading of our capital investments; |
• | Continue to grow oil production; |
• | Exercise capital discipline; and |
• | Improve or maintain our leverage ratios as defined under our revolving credit facility. |
Although oil prices have averaged just over $48 per barrel (NYMEX WTI) over the last three years (2015 - 2017), a significant recovery began in late 2017 and has extended into early 2018. The price improvement is largely attributable to strong compliance and extension of OPEC supply cuts, the drawdown of global oil inventories to more normal levels and the strength of demand related to global growth. The same three-year period of lower prices forced the industry to dramatically reduce its capital investments, cut operating expenses and find innovative ways to enhance profit margins. We altered our investment levels and business strategies during this period to ensure that our key operational initiatives were progressing while maintaining a strong capital structure. Although prices have recovered, we expect that our levels of drilling activity will remain relatively constant, and our capital investments will increase about 10% to reflect more completions. As of February 15, 2018, NYMEX WTI was $61.34 per barrel, and the three-year forward curve averaged $55.39 per barrel.
Our 2018 capital investment plan is approximately $1.3 billion (excluding approximately $120 million of expected capitalized interest and direct internal costs). Approximately 80% and 10% of our investments will be allocated to the Anadarko and Williston basins, respectively - our two highest return areas. Approximately 10% of our capital is earmarked primarily for HBP drilling in the Central Basin area of the Uinta Basin. We expect to fund our 2018 investments primarily through cash flows from operations and cash on hand. Should commodity prices significantly weaken, we may elect to curtail our investments to limit borrowings and preserve liquidity.
Our 2018 domestic production is expected to be approximately 64.5 MMBOE, up 16% when compared to our 2017 production of 55.6(1) MMBOE. Consolidated production in 2018 is expected to be approximately 66 MMBOE, up 15% when compared to our consolidated 2017 production of 57.3(1) MMBOE.
_________________
(1) | Includes 4.5 Bcf of natural gas produced and consumed in operations. |
Our Business Strategy
Our long-term business strategies are focused on creating lasting stockholder value through the consistent and profitable growth of cash flow, production and proved reserves by investing in oil and liquids-rich onshore resource plays in the U.S. Today, our primary growth area is the Anadarko Basin of Oklahoma where we have an extensive inventory of drilling locations. SCOOP and STACK are characterized by wells with consistent and strong production rates, high initial oil cuts and low operating expenses.
Our business strategy includes the following:
Focusing on organic opportunities through disciplined capital investments. While we consider various growth opportunities, including strategic acquisitions, our primary focus is on organic growth. Our capital program is primarily designed to allocate investments based on projects that maximize our returns while delivering production and reserve growth.
High-grade investments based on rate of return. In line with this element of our strategy and the current commodity price environment, approximately 80% of our 2018 investments in drilling and completions will be allocated to SCOOP and STACK. The Anadarko Basin has a deep inventory of product-diverse drilling locations with high rates of returns, which have proven to have commodity price-resiliency. As we move to more development-driven activity, we expect to see improvements in operational efficiencies in 2018.
Continuously improving operations and returns. Controlling the costs to find, develop and produce oil, natural gas and NGLs is critical to creating long-term stockholder value. Our focus areas are characterized by large, contiguous acreage positions and multiple stacked geologic horizons. In 2017, we continued our efforts to reduce average well costs through faster drilling times and innovative completion optimizations. These savings have been used to test upsized completions to enhance returns and estimated ultimate recoveries. We also have multiple initiatives underway to manage our base production, improve operational efficiencies and enhance future margins.
Executing select, strategic acquisitions and divestitures. We target complementary acquisitions in existing core areas and focus on acquisition opportunities where our operating and technical knowledge is transferable and well results can be forecasted with confidence. During the second quarter of 2017, we divested our interest in the Bohai Bay field in China, which did not materially impact our consolidated results of operations for the year ended December 31, 2017.
Attracting and retaining quality employees who are aligned with stockholder interests. We believe in hiring top-tier talent and are committed to our employees' career development. We believe that employees should be rewarded based on their performance and that their interests should be aligned with those of our stockholders. As a result, we reward and encourage our employees through performance-based annual compensation and long-term equity-based incentives.
Description of Properties
Anadarko Basin. SCOOP and STACK have been our fastest growing plays over the last several years. At year-end 2017, the Anadarko Basin represented approximately 70% of our consolidated proved reserves and daily domestic production. After recent additions and acquisitions, we now hold approximately 369,000 net acres in SCOOP and STACK. Our average net production from the basin in the fourth quarter of 2017 was approximately 117 MBOEPD (33% oil and 28% NGLs), an increase of 33% compared to the fourth quarter of 2016.
Williston Basin. We have approximately 82,000 net acres in the Williston Basin. This basin represents about 10% of our consolidated proved reserves at year-end 2017. Fourth quarter 2017 net production averaged approximately 20 MBOEPD (68% oil and 17% NGLs), an increase of 20% compared to the fourth quarter of 2016.
Uinta Basin. We have approximately 221,000 net acres in the Uinta Basin, which represents about 11% of our consolidated proved reserves at year-end 2017. Our Uinta Basin operations can be divided into two areas: the Central Basin and the Greater Monument Butte Unit (GMBU) waterflood. Over the past two years, we have placed 23 wells on production in the Central Basin. We plan to invest 10% of our capital budget in the Central Basin to HBP our remaining acreage. Our net production from the Uinta Basin during the fourth quarter of 2017 averaged approximately 17 MBOEPD (85% oil and 2% NGLs), an increase of 14% as compared to the fourth quarter of 2016.
Arkoma Basin. We have significant dry gas production in the Arkoma Basin, representing approximately 9% of our total consolidated proved reserves at year-end 2017. Our investment levels in this area have been significantly curtailed in recent years due to low natural gas prices. As of December 31, 2017, we had approximately 144,000 net acres in the Arkoma Basin, approximately all of which are held by production, and our net production for the fourth quarter of 2017 was approximately 14 MBOEPD (98% dry gas).
China. Approximately 2 MMBbls of our proved reserves at year-end 2017 are located offshore China. Production from our Pearl development, located in the South China Sea, was suspended during the third and fourth quarters of 2017 due to mechanical issues associated with a third-party floating production, storage and offloading vessel (FPSO). We resumed
production in early 2018. No additional development drilling is currently planned at Pearl, and cash flow from China is funding a portion of our domestic drilling programs.
Acquisitions and Divestitures
During 2017, we divested our interest in the Bohai Bay field in China for approximately $32 million and other non-strategic domestic assets for $72 million. Production from our interest in Bohai Bay was 171 MBbls for the year ended December 31, 2017. These sales were consistent with our strategy to monetize non-strategic assets to improve our focus on domestic resource plays, reduce overall debt and enhance liquidity. During 2017, we acquired various additional domestic assets for $100 million, subject to customary post-close adjustments.
Reserves
Estimates of Proved Reserves
All reserve information in this report was based on estimates prepared by our petroleum engineering staff and is the responsibility of management. The preparation of our oil and gas reserves estimates was completed in accordance with our prescribed internal control procedures, which include verification of data input into our reserves forecasting and economics evaluation software, as well as multi-discipline management reviews, as described below. The technical employee responsible for overseeing the preparation of the reserves estimates has a Bachelor of Science in Petroleum Engineering, with more than 35 years of industry experience (including over 25 years of experience in reserve estimation).
Ryder Scott Company (Ryder Scott) and DeGolyer and MacNaughton (D&M) performed audits of the internally prepared reserve estimates on certain fields aggregating 97% of 2017 year-end reported proved reserve quantities on a barrel of oil equivalent basis. The purpose of these audits was to provide additional assurance on the reasonableness of internally prepared reserve estimates. Newfield's proved reserves were determined to be, in the aggregate, reasonable and within the established audit tolerance guidelines of 10 percent, as set forth in the auditing standards published by the Society of Petroleum Engineers. The reports of Ryder Scott dated January 12, 2018 and D&M dated January 16, 2018 contain further discussion of the reserve estimates and their audit procedures, as well as the qualifications of the technical person primarily responsible for overseeing such estimates. Both reports are attached as exhibits to this annual report and incorporated herein by reference. See Exhibits 99.1 and 99.2.
Our reserves estimates use available geological and reservoir data as well as production performance data. Our petroleum engineering staff review estimates annually with management and revise the estimates, either upward or downward, as warranted by available data. The data reviewed includes, among other things, seismic data, well logs, production tests, reservoir pressures and individual well and field performance data. The data incorporated into our interpretations includes structure and isopach maps, individual well and field performance and other engineering and geological work products such as material balance calculations and reservoir simulation to arrive at conclusions about individual well and field projections. Additionally, offset performance data, operating expenses, marketing agreements, capital costs and product prices factor into estimating quantities of reserves. Revisions are necessary due to changes in, among other things, reservoir performance, prices, economic conditions and governmental regulations, as well as changes in the expected recovery rates associated with development drilling. Sustained decreases in prices, for example, may cause a reduction in some reserves due to reaching their economic limits sooner.
Actual quantities of reserves recovered will most likely vary from the estimates set forth below. Reserves and cash flow estimates rely on interpretations of data and require assumptions that may be inaccurate. For a discussion of these interpretations and assumptions, see "Actual quantities of oil, natural gas and NGL reserves and future cash flows from those reserves will most likely vary from our estimates" under Item 1A, "Risk Factors," of this report. See "Supplementary Financial Information — Supplementary Oil and Gas Disclosures" to our consolidated financial statements in Item 8 of this report for additional reserves disclosures.
The following table shows a summary of our estimates of proved oil and gas reserves by country at December 31, 2017.
Oil and Condensate | Natural Gas | NGLs | Total | |||||||||
(MMBbls) | (Bcf) | (MMBbls) | (MMBOE) | |||||||||
Proved Developed Reserves: | ||||||||||||
Domestic | 136 | 1,099 | 78 | 398 | ||||||||
China | 2 | — | — | 2 | ||||||||
Total proved developed | 138 | 1,099 | 78 | 400 | ||||||||
Proved Undeveloped Reserves: | ||||||||||||
Domestic | 112 | 605 | 68 | 280 | ||||||||
China | — | — | — | — | ||||||||
Total proved undeveloped | 112 | 605 | 68 | 280 | ||||||||
Total proved reserves | 250 | 1,704 | 146 | 680 | ||||||||
Total Proved Reserves
Our estimates of proved reserves and related standardized measure of future net cash flows and PV-10 as of December 31, 2017 are calculated based upon SEC pricing, which uses a twelve-month unweighted average first-day-of-the-month oil and natural gas benchmark prices, adjusted for marketing and other differentials. Future changes in SEC pricing will impact future estimated proved reserves and related standardized measure of future net cash flows and PV-10.
Our year-end 2017 proved reserves of 680 MMBOE consisted of 392 MMBOE proved developed producing, 8 MMBOE proved developed non-producing and 280 MMBOE proved undeveloped reserves. Our proved liquids reserves at year-end 2017 were 396 MMBbls, compared to 285 MMBbls at year-end 2016, an increase of 39%. During 2017, crude oil and condensate reserves increased 60 MMBbls while NGL reserves increased 51 MMBbls. At year-end 2017, 63% of our proved liquids reserves were crude oil or condensate. At December 31, 2017, our proved natural gas reserves were 1,704 Bcf, a 25% increase compared to 2016.
At December 31, 2017, SEC pricing was $2.98 per MMBtu for natural gas and $51.34 per barrel for oil, a 20% increase for both compared to 2016. The increase in SEC pricing resulted in an upward reserve revision of 14 MMBOE. When combined with 139 MMBOE of performance and development related revisions primarily associated with the Anadarko Basin, total revisions for the year increased reserves by 153 MMBOE.
During 2017, we added proved reserves of 76 MMBOE, which included 2 MMBOE of reserves purchased and 74 MMBOE through extensions, discoveries and other additions. Additionally, we sold non-strategic assets of 4 MMBOE and produced 58 MMBOE. Consistent with our continued focus on domestic liquids, our 2017 additions through extensions, discoveries and other additions were entirely domestic and 66% liquids (35 MMBbls of oil and 14 MMBbls of NGLs).
Proved Undeveloped Reserves
Our estimates of proved undeveloped reserves at December 31, 2017 were 280 MMBOE compared to 199 MMBOE at December 31, 2016. Liquids comprised 64% of our total proved undeveloped reserves at December 31, 2017. SCOOP and STACK represented 20% and 66% of our year-end proved undeveloped reserves, respectively. During 2017, we invested $431 million of drilling, completion and facilities-related capital to convert 43 MMBOE of our December 31, 2016 proved undeveloped reserves into proved developed reserves. In 2017, we had proved revisions of 81 MMBOE primarily due to adding infill drilling locations. During 2017, we added 48 MMBOE of new proved undeveloped reserves through extensions, discoveries and other additions. Sales and acquisitions in 2017 did not have a material impact on our proved undeveloped reserves.
Estimates of proved undeveloped reserve quantities are limited by development drilling activity we intend to undertake during the five-year period ending December 31, 2022. For additional information regarding the changes in our proved reserves, see our "Supplementary Financial Information — Supplementary Oil and Gas Disclosures" to our consolidated financial statements in Item 8 of this report.
During the years 2015, 2016 and 2017, we developed 20%, 14% and 22%, respectively, of our prior year-end proved undeveloped reserves. We annually review all proved undeveloped reserves to ensure an appropriate development plan exists. Changes in commodity pricing between the time of preparation of the reserve report and actual investment, investment alternatives that may have been added to our portfolio of assets, changes in the availability and costs of oilfield services, and other economic factors may lead to changes in our future development plans. As a result, the future rate at which we develop our proved undeveloped reserves may vary from historical development rates. Declines in oil and natural gas prices in the future could also render some of our proved undeveloped reserves uneconomic or compel us to reevaluate our project commitments to certain development projects.
Reserves Concentration
The table below sets forth the concentration of our proved reserves attributable to our fields. Our two largest fields, SCOOP and STACK, accounted for approximately 70% of our total proved reserves at December 31, 2017.
Proved Reserves | Percentage of Proved Reserves | |||||
(MMBOE) | ||||||
Domestic: | ||||||
STACK | 284 | 42 | % | |||
SCOOP | 193 | 28 | % | |||
Williston Basin | 67 | 10 | % | |||
Arkoma | 59 | 9 | % | |||
Central Basin | 44 | 6 | % | |||
GMBU | 31 | 5 | % | |||
Total domestic | 678 | 100 | % | |||
International: | ||||||
China | 2 | — | % | |||
Total | 680 | 100 | % | |||
Largest Fields. The table below sets forth the annual production volumes, average realized prices and related production cost structure on a per unit-of-production basis for our two largest fields. For a discussion regarding our total domestic and international annual production volumes, average realized prices, related cost structure and information about our contractual obligations and delivery commitments, see Item 7, "Management’s Discussion and Analysis of Financial Condition and Results of Operations," which disclosure is incorporated herein by reference.
Production | Average Realized Prices(1) | Average Production Cost(2) | |||||||||||||||||||||||||||||||||
Crude oil and condensate | Natural gas | NGLs | Total | Crude oil and condensate | Natural gas | NGLs | Total | Lease Operating Expense | Transportation and processing | ||||||||||||||||||||||||||
(MBbls) | (Bcf) | (MBbls) | (MBOE) | (Per Bbl) | (Per Mcf) | (Per Bbl) | (Per BOE) | (Per BOE) | (Per BOE) | ||||||||||||||||||||||||||
2017: | |||||||||||||||||||||||||||||||||||
SCOOP | 3,944 | 48.2 | 5,640 | 17,619 | $ | 49.06 | $ | 2.77 | $ | 25.97 | $ | 26.87 | $ | 1.26 | $ | 4.31 | |||||||||||||||||||
STACK | 8,403 | 35.1 | 4,456 | 18,717 | 50.47 | 2.65 | 28.01 | 34.33 | 2.26 | 3.86 | |||||||||||||||||||||||||
2016: | |||||||||||||||||||||||||||||||||||
SCOOP | 4,125 | 47.9 | 5,356 | 17,467 | $ | 39.27 | $ | 2.24 | $ | 19.63 | $ | 21.45 | $ | 1.14 | $ | 4.19 | |||||||||||||||||||
STACK | 6,464 | 25.7 | 3,175 | 13,929 | 41.59 | 2.29 | 19.86 | 28.14 | 2.54 | 3.37 | |||||||||||||||||||||||||
2015: | |||||||||||||||||||||||||||||||||||
SCOOP | 3,779 | 43.2 | 4,871 | 15,857 | $ | 42.67 | $ | 2.38 | $ | 18.97 | $ | 22.49 | $ | 1.33 | $ | 4.15 | |||||||||||||||||||
STACK | 3,645 | 11.0 | 1,396 | 6,886 | 42.99 | 2.49 | 19.02 | 30.61 | 2.58 | 2.04 | |||||||||||||||||||||||||
_________________
(1) | Does not include impact of derivative gains or losses. |
(2) | Production costs include cost to operate and maintain our wells, related equipment and supporting facilities, including the cost of labor, well service and repair, gathering, processing, transportation, as well as production-related general and administrative costs. Production costs exclude severance taxes and property taxes. |
Drilling Activity
The following table sets forth the number of oil and gas wells completed for each of the last three years.
2017 | 2016 | 2015 | ||||||||||||||||
Gross | Net | Gross | Net | Gross | Net | |||||||||||||
Exploratory wells: | ||||||||||||||||||
Domestic: | ||||||||||||||||||
Productive | 203 | 46 | 136 | 60 | 123 | 57 | ||||||||||||
Nonproductive | — | — | — | — | 1 | 1 | ||||||||||||
China: | ||||||||||||||||||
Productive | — | — | — | — | — | — | ||||||||||||
Nonproductive | — | — | — | — | — | — | ||||||||||||
Exploratory well total | 203 | 46 | 136 | 60 | 124 | 58 | ||||||||||||
Development wells: | ||||||||||||||||||
Domestic: | ||||||||||||||||||
Productive | 146 | 74 | 47 | 31 | 158 | 78 | ||||||||||||
China: | ||||||||||||||||||
Productive | — | — | — | — | 16 | 3 | ||||||||||||
Development well total | 146 | 74 | 47 | 31 | 174 | 81 | ||||||||||||
Total wells | 349 | 120 | 183 | 91 | 298 | 139 | ||||||||||||
We were in the process of drilling or completing 48 gross (21 net) domestic wells at December 31, 2017.
Productive Wells
As of December 31, 2017, we had the following productive oil and gas wells.
Company Operated Wells | Outside Operated Wells | Total Productive Wells | ||||||||||||||||
Gross | Net | Gross | Net | Gross | Net | |||||||||||||
Domestic: | ||||||||||||||||||
Oil | 2,866 | 2,271 | 1,187 | 94 | 4,053 | 2,365 | ||||||||||||
Natural gas | 843 | 623 | 1,012 | 124 | 1,855 | 747 | ||||||||||||
China: | ||||||||||||||||||
Oil | 6 | 3 | — | — | 6 | 3 | ||||||||||||
Total: | ||||||||||||||||||
Oil | 2,872 | 2,274 | 1,187 | 94 | 4,059 | 2,368 | ||||||||||||
Natural gas | 843 | 623 | 1,012 | 124 | 1,855 | 747 | ||||||||||||
Total | 3,715 | 2,897 | 2,199 | 218 | 5,914 | 3,115 | ||||||||||||
The day-to-day operations of oil and gas properties are the responsibility of the operator designated under pooling or operating agreements or production sharing contracts. The operator supervises production, maintains production records, employs or contracts field personnel and performs other functions.
Acreage Data
The following tables list by geographic area interests we owned in developed and undeveloped oil and gas acreage at December 31, 2017, along with a summary by year of our undeveloped acreage scheduled to expire in the next five years. In most cases, the drilling of a commercial well or the filing and approval of a development plan or suspension of operations will hold the acreage beyond the expiration date. Domestic ownership interests are onshore and generally take the form of "working interests" in oil and gas leases that have varying terms. International ownership interests are offshore and arise from participation in production sharing contracts.
Total Acreage
Developed Acres | Undeveloped Acres | |||||||||||
Gross | Net | Gross | Net | |||||||||
(In thousands) | ||||||||||||
Domestic: | ||||||||||||
Anadarko Basin | 561 | 311 | 119 | 58 | ||||||||
Arkoma Basin | 310 | 143 | 4 | 1 | ||||||||
Uinta Basin | 222 | 159 | 202 | 62 | ||||||||
Williston Basin | 131 | 76 | 7 | 6 | ||||||||
Other | 482 | 185 | 165 | 98 | ||||||||
Total domestic | 1,706 | 874 | 497 | 225 | ||||||||
China: | 12 | 6 | — | — | ||||||||
Total | 1,718 | 880 | 497 | 225 | ||||||||
The developed acres in the table above include mineral interests in 404,000 gross and 112,000 net acres which generally do not expire.
Expiring Acreage
Undeveloped Acres Expiring | ||||||||||||||||||||||||||||||
2018 | 2019 | 2020 | 2021 | 2022 | ||||||||||||||||||||||||||
Gross | Net | Gross | Net | Gross | Net | Gross | Net | Gross | Net | |||||||||||||||||||||
(In thousands) | ||||||||||||||||||||||||||||||
Domestic: | ||||||||||||||||||||||||||||||
Anadarko Basin | 42 | 21 | 43 | 28 | 13 | 8 | — | — | — | — | ||||||||||||||||||||
Arkoma Basin | — | — | — | — | 1 | — | — | — | — | — | ||||||||||||||||||||
Uinta Basin | 13 | 5 | 18 | 15 | 21 | 9 | 13 | 7 | 26 | 20 | ||||||||||||||||||||
Williston Basin | 1 | 1 | 1 | — | 1 | — | — | — | — | — | ||||||||||||||||||||
Other | 96 | 53 | 26 | 13 | 18 | 12 | 12 | 9 | 1 | — | ||||||||||||||||||||
Total | 152 | 80 | 88 | 56 | 54 | 29 | 25 | 16 | 27 | 20 | ||||||||||||||||||||
Title to Properties
We believe that we have satisfactory title to substantially all of our producing properties in accordance with generally accepted industry standards. Individual properties may be subject to burdens such as royalty, overriding royalty, carried, net profits, working and other outstanding interests customary in the industry. In addition, interests may be subject to obligations or duties under applicable laws or burdens such as production payments, joint development agreements, ordinary course liens incidental to operating agreements and for current taxes, development obligations under oil and gas leases or capital commitments under our production sharing contracts in China. Prior to acquiring undeveloped properties, we perform a title investigation that is thorough but less vigorous than the title investigation we conduct prior to drilling, which is consistent with standard practice in the oil and gas industry. Generally, before we commence drilling operations on properties that we operate, we conduct a title examination and perform curative work with respect to significant defects that we identify. We believe that we have performed title examinations with respect to substantially all of our active properties that we operate.
Marketing
All of our oil, natural gas and NGLs are sold at market-based prices adjusted for location and quality differentials to a variety of purchasers. For a list of purchasers of our production that accounted for 10% or more of our total revenues for the three preceding calendar years, see Note 1, "Organization and Summary of Significant Accounting Policies — Major Customers," to our consolidated financial statements in Item 8 of this report, which information is incorporated herein by reference. We believe that the loss of any of these purchasers would not have a material adverse effect on us because alternative purchasers are available.
Historically, our access to refining capacity outside the Salt Lake City area has been restricted due to limited transportation and refining options because of the paraffin content of our Uinta Basin production. As such, we have two long-term agreements with two refineries in the Salt Lake City area that run through 2020 and 2025. See further discussion under "Contractual Obligations" in Item 7 of this report.
Competition
Competition in the oil and gas industry is intense, particularly with respect to the acquisition of properties and access to capital and credit markets. See the discussion under "Competition for, or the loss of, our senior management or experienced technical personnel may negatively impact our operations or financial results" and "Competition in the oil and gas industry is intense" in Item 1A of this report, which information is incorporated herein by reference.
Segment Information
For more information on our operations by segment, see Note 18, "Segment Information," to our consolidated financial statements in Item 8 of this report.
Employees
As of February 15, 2018, we had 1,010 employees. All but 33 of our employees were located in the United States. None of our employees are covered by a collective bargaining agreement. We believe that relationships with our employees are satisfactory.
Regulation
Exploration and development and the production and sale of oil and gas are subject to extensive federal, state, provincial, tribal, local, foreign and international laws and regulations. Failure to comply with applicable laws and regulations can result in substantial penalties. An overview of these laws and regulations is set forth below. We believe we are in substantial compliance with currently applicable laws and regulations and that continued substantial compliance with existing requirements will not have a material adverse effect on our financial position, cash flows or results of operations. However, current regulatory requirements may change, unforeseen resource or environmental incidents may occur or past noncompliance with or liabilities arising under environmental laws or regulations may be discovered. See the additional discussion under the caption "We are subject to complex laws and regulatory actions that can affect the cost, manner, feasibility or timing of doing business," in Item 1A of this report.
General Overview. Our oil and gas operations are subject to various federal, state, provincial, tribal, local, foreign and international laws and regulations. Generally speaking, these regulations relate to matters that include, but are not limited to:
• | acquisition of seismic data; |
• | location of wells; |
• | size of drilling and spacing units or proration units; |
• | number of wells that may be drilled in a unit; |
• | unitization or pooling of oil and gas properties; |
• | drilling, casing and cementing of wells; |
• | issuance of permits in connection with exploration, drilling and production; |
• | well production; |
• | spill prevention plans; |
• | protection of private and public surface and ground water supplies; |
• | emissions reporting, permitting or limitations; |
• | protection of endangered species and habitat; |
• | occupational safety and health; |
• | use, transportation, storage and disposal of fluids and materials incidental to oil and gas operations; |
• | surface usage and the restoration of properties upon which wells have been drilled; |
• | calculation and disbursement of royalty payments and production taxes; |
• | plugging and abandoning of wells; |
• | transportation of production; and |
• | export of natural gas. |
Federal Regulation of Drilling and Production. We have domestic oil and gas leases granted by the federal government and administered by the Bureau of Indian Affairs, the Office of Natural Resources Revenue or the Bureau of Land Management (BLM), all federal agencies. BLM leases contain relatively standardized terms and require compliance with detailed regulations. Many onshore leases contain stipulations limiting activities that may be conducted on the lease. Some stipulations are unique to particular geographic areas and may limit the time during which activities on the lease may be conducted, the manner in which certain activities may be conducted or, in some cases, may ban surface activity. Under certain circumstances, the BLM may require that our operations on federal leases be suspended or terminated. Any such suspension or termination could materially and adversely affect our financial condition, cash flows and results of operations.
State and Local Regulation of Drilling and Production. We own interests in properties located onshore in a number of states. These states regulate drilling and operating activities by requiring, among other things, permits for the drilling of wells, maintaining bonding requirements in order to drill or operate wells, and regulating the location of wells, the method of drilling and casing wells, disclosure of hydraulic fracturing fluid composition, the surface use and restoration of properties upon which wells are drilled and the plugging and abandonment of wells. The laws of these states also govern a number of environmental and conservation matters, including the handling and disposing or discharge of waste materials, the size of drilling and spacing units or proration units and the density of wells that may be drilled, unitization and pooling of oil and gas properties and establishment of maximum rates of production from oil and gas wells. Some states have the power to prorate production to the market demand for oil and gas. The effect of these regulations is to limit the amounts of oil and gas we can produce from our wells and to limit the number of wells or the locations at which we can drill.
Environmental Regulations. We are subject to various federal, state, provincial, tribal, local, foreign and international laws and regulations concerning occupational safety and health, oil and gas production, as well as the discharge of materials into, and the protection of, the environment. Environmental laws and regulations relate to, among other things:
• | assessing the environmental impact of seismic acquisition, drilling or construction activities; |
• | the generation, storage, transportation and disposal of waste materials (including hazardous wastes) and flowback or produced water; |
• | the emission of certain gases, including greenhouse gases, or other materials into the atmosphere; |
• | the construction and placement of wells; |
• | the investigation, monitoring, abandonment, reclamation and remediation of wells and other sites, including sites of former operations; |
• | various environmental reporting and permitting requirements; |
• | the development of emergency response and spill contingency plans; |
• | disclosure of chemicals used in hydraulic fracturing; |
• | health and safety of workers and the public; and |
• | protection of private and public surface and ground water supplies. |
We consider the costs of environmental regulatory compliance and occupational safety and health compliance necessary and manageable parts of our business. We have been able to plan for and comply with environmental regulations without materially altering our operating strategy or incurring significant unreimbursed expenditures. However, based on regulatory trends and increased stringency, our capital expenditures and operating expenses related to the protection of the environment and occupational safety and health compliance have increased over the years and will likely continue to increase. We cannot predict with any reasonable degree of certainty our future exposure concerning such matters, and the cost of compliance could be significant. Failure to comply with these laws and regulations may result in the assessment of administrative, civil and criminal penalties, the imposition of remedial, property and natural resource damage payment obligations, or the issuance of injunctive relief (including orders to limit or cease operations altogether).
Oil and gas activities have increasingly faced opposition from environmental organizations and, in certain areas, have been restricted or banned by governmental authorities in response to concerns regarding the prevention of pollution or the protection
of the environment. Moreover, some environmental laws and regulations may impose strict liability regardless of fault or knowledge, which could subject us to liability for conduct that was lawful at the time it occurred or conduct or conditions caused by prior operators or third parties at sites we currently own or where we have sent wastes for disposal.
To the extent future laws or regulations are implemented or other governmental action is taken that prohibits, restricts or materially increases the costs of drilling, or imposes environmental protection requirements that result in increased costs to the oil and gas industry in general, our business and financial results could be adversely affected. The following is a summary of some of the environmental, health and safety laws to which our operations are subject.
Hazardous Wastes and Substances. The Resource Conservation and Recovery Act (RCRA) generally regulates the disposal of solid and hazardous wastes and imposes certain environmental cleanup obligations. Although RCRA specifically excludes from the definition of hazardous waste "drilling fluids, produced waters and other wastes associated with the exploration, development or production of crude oil, natural gas or geothermal energy," the U.S. Environmental Protection Agency (the EPA) and state agencies may regulate these wastes as solid wastes. However, it is possible that certain oil and natural gas exploration and production wastes now classified as non-hazardous could be classified as hazardous wastes in the future. For example, in December 2016, the EPA and environmental groups entered into a consent decree to address the EPA's alleged failure to timely access its RCRA Subtitle D criteria regulations exempting certain exploration and production related oil and gas wastes from regulation as hazardous wastes under RCRA. The consent decree requires the EPA to propose a rulemaking no later than March 15, 2019 for revision of certain Subtitle D criteria regulations pertaining to oil and gas wastes or to sign a determination that revision of the regulations is not necessary. Removal of RCRA's exemption for exploration and production wastes has the potential to significantly increase our waste disposal costs, which in turn will result in increased operating costs and could adversely impact our results of operations. Moreover, ordinary industrial wastes, such as paint wastes, waste solvents, laboratory wastes and waste oils, may be regulated as hazardous waste, if they have hazardous characteristics.
The Comprehensive Environmental Response, Compensation, and Liability Act, also known as CERCLA or Superfund, and comparable state laws impose liability, without regard to fault or the legality of the original conduct, on persons that are considered to have contributed to the release of a "hazardous substance" into the environment. Such "responsible parties" may be subject to joint and several liability under the Superfund law for the costs of cleaning up the hazardous substances that have been released into the environment and for damages to natural resources, and it is not uncommon for neighboring landowners and other third parties to file claims for personal injury and property damage allegedly caused by the hazardous substances released into the environment. We currently own or lease onshore properties that have been used for the exploration and production of oil and natural gas for a number of years. Many of these onshore properties have been operated by third parties whose treatment and disposal or release of hydrocarbons or other wastes was not under our control. These properties and any wastes that may have been disposed or released on them may be subject to the Superfund law, RCRA and analogous state laws and common law obligations, and we potentially could be required to investigate and remediate such properties, including soil or groundwater contamination by prior owners or operators, pay for damage to natural resources, or to perform remedial plugging or pit closure operations to prevent future contamination.
Air Emissions & Climate Change. The federal Clean Air Act (CAA) and comparable state statutes regulate and limit the emission of air pollutants by the Company and affect our oil and gas operations. New facilities may be required to obtain separate construction and operating permits before construction work can begin or operations may start, and existing facilities may be required to incur capital costs in order to remain in compliance. Also, the EPA has developed and continues to develop more stringent regulations governing emissions of air pollutants, and is considering the expanded regulation of existing air pollutants and additional air pollutants.
In May 2016, the EPA issued amendments to certain New Source Performance Standards (NSPS) rules focused on achieving additional methane and volatile organic compound reductions from oil and natural gas operations. Among other things, these amendments impose new requirements for leak detection and repair, control requirements for oil well completions, and additional control requirements for gathering, boosting, and compressor stations. On May 26, 2017, the EPA announced a 90-day stay of certain portions of the NSPS standards, which stay was vacated in part by the U.S. Court of Appeals for the D.C. Circuit on July 3, 2017. The EPA also proposed a two-year stay of certain portions of the NSPS standards on June 12, 2017, which stay is currently under consideration and the court emphasized is not impacted by its July 3 decision. Concurrently with these methane rules, the EPA finalized a new rule regarding source determinations and permitting requirements for the onshore oil and gas industry under the CAA. The EPA also published Control Technique Guidelines aimed at providing states with guidance on Reasonable Achievable Control Technology for the oil and gas industry in areas of ozone non-attainment.
Additionally, in October 2015 the EPA lowered the National Ambient Air Quality Standard (NAAQS) for ozone from 75 to 70 parts per billion for both the 8-hour primary and secondary standards. State implementation of the revised NAAQS could
result in stricter permitting requirements, delay or prohibit our ability to obtain such permits, and result in increased expenditures for pollution control equipment, the costs of which could be significant. In addition, the EPA promulgated regulations that are designed to reduce the emission of volatile organic chemicals (VOCs) by requiring oil and gas companies to utilize "green completions" to capture VOCs and other air pollutants when natural gas wells are fracked. In June 2016, the EPA finalized rules regarding criteria for aggregating multiple small surface sites into a single source for air-quality permitting purposes applicable to the oil and gas industry. This rule could cause small facilities, on an aggregate basis, to be deemed a major source, thereby triggering more stringent air permitting processes and requirements. Such regulations may increase the costs of compliance for some facilities or the market price for oil and natural gas.
Additionally, in response to findings that emissions of carbon dioxide, methane and other greenhouse gases (GHGs) present an endangerment to public health and the environment, the EPA has adopted regulations under existing provisions of the federal Clean Air Act that, among other things, establish Prevention of Significant Deterioration (PSD) pre-construction and Title V operating permit reviews for certain large stationary sources. Facilities required to obtain PSD permits for their GHG emissions also will be required to meet "best available control technology" standards that will be established by the states or, in some cases, by the EPA on a case by case basis. These EPA rules could adversely affect our operations and restrict or delay our ability to obtain air permits for new or modified sources. In addition, the EPA has adopted rules requiring the monitoring and reporting of GHG emissions from specified onshore and offshore oil and gas production sources in the United States on an annual basis, which include certain of our operations. Furthermore, in June 2016, the EPA finalized rules that establish new controls for emissions of methane from new, modified or reconstructed sources in the oil and natural gas source category, including production, processing, transmission, and storage activities.
The rules include first-time standards to address emissions of methane from equipment and processes across the source category, including hydraulically fractured oil and natural gas well completions. In addition, the rules impose leak detection and repair requirements intended to address methane leaks known as "fugitive emissions" from equipment, such as valves, connectors, open-ended lines, pressure-relief devices, compressors, instruments and meters. The EPA has also announced that it intends to impose methane emission standards for existing sources as well; while the agency has issued information collection requests to operators, to date, it has not yet issued a proposal. Compliance with these rules will require enhanced record-keeping practices, the purchase of new equipment, such as optical gas imaging instruments to detect leaks, and increased frequency of maintenance and repair activities to address emissions leakage. The rules will also likely require additional personnel time to support these activities or the engagement of third party contractors to assist with and verify compliance. These new and proposed rules could result in increased compliance costs on our operations.
The BLM finalized similar regulations designed to reduce methane emissions for oil and gas activities on federal lands in November 2016 that seek to impose limits on venting and flaring and would require enhanced leak detection and repair programs. The current Congress has taken efforts to repeal the BLM methane rules. In early February 2017, the U.S. House of Representatives voted to eliminate the BLM methane rules using the Congressional Review Act (CRA). However, the CRA requires majority approval from the Senate and approval of the President to officially repeal these rules and the Senate failed to approve the repeal in May 2017. Additionally, the Department of the Interior (the parent department of BLM) announced in October 2017 that it would delay the implementation of the BLM methane rules that were to become effective in January 2018 to January 2019. States and environmental groups filed suit in December 2017 to stop this delay. Increased regulation of methane and other GHGs have the potential to result in increased compliance costs and, consequently, adversely affect our operations.
While Congress has from time to time considered legislation to reduce emissions of GHGs, there has not been significant activity in the form of adopted legislation to reduce GHG emissions at the federal level in recent years. Most recently, the EPA finalized rules to further reduce GHG emissions, primarily from coal-fired power plants, under its Clean Power Plan. However, on October 9, 2017, the EPA announced that it will repeal the Clean Power Plan. In addition, the United States reached agreement during the December 2015 United Nations climate change conference to reduce its GHG emissions by 26-28% by 2025 compared with 2005 levels, and also to provide periodic updates on its progress. On June 1, 2017, President Trump announced that the United States would withdraw from the Paris Agreement and that it would potentially seek to renegotiate the Agreement on more favorable terms. Although President Trump has the authority to unilaterally withdraw the United States from the Paris Agreement, per the terms of the Agreement, such a withdrawal may not be made until three years from the effective date of the Agreement, which is November 4, 2019, and any such withdrawal only becomes effective one year after the notice of withdrawal is provided. Further, certain cities and states have individually committed to take actions to further the goals of the Paris Agreement.
In the absence of such federal climate legislation, a number of state and regional cap and trade programs have emerged that typically require major sources of GHG emissions, such as electric power plants, to acquire and surrender emission allowances in return for emitting those GHGs. Although it is not possible at this time to predict how legislation or new regulations that may be adopted to address GHG emissions would impact our business, any such future laws and regulations imposing reporting obligations on, or limiting emissions of GHGs from, our equipment and operations could require us to incur costs to reduce emissions of GHGs associated with our operations. Severe limitations on GHG emissions could also adversely affect demand for the oil and natural gas we produce and lower the value of our reserves. Finally, it should be noted that some scientists have concluded that increasing concentrations of GHGs in the Earth’s atmosphere may produce climate changes that have significant physical effects, such as increased frequency and severity of storms, floods, droughts, and other extreme climatic events; if any such effects were to occur, they could have an adverse effect on our exploration and production operations. At this time, we have not developed a plan to address the potential social, political, economic and physical impacts of climate change on our operations.
Hydraulic Fracturing. Hydraulic fracturing is an essential and common practice in the oil and gas industry used to stimulate production of natural gas and/or oil from dense subsurface rock formations. We routinely apply hydraulic fracturing techniques on almost all of our U.S. onshore oil and natural gas properties. Hydraulic fracturing involves using water, sand or other proppant materials, and certain chemicals to fracture the hydrocarbon-bearing rock formation to allow flow of hydrocarbons into the wellbore.
As explained in more detail below, the hydraulic fracturing process is typically regulated by state oil and natural gas agencies, although the EPA, the BLM, and other federal regulatory agencies have taken steps to review or impose federal regulatory requirements. Certain states in which we operate, have adopted, and other states are considering adopting, regulations that could impose more stringent permitting, public disclosure and well construction requirements on hydraulic fracturing operations or otherwise seek to ban fracturing activities altogether. Certain municipalities have already banned hydraulic fracturing, and courts have upheld those moratoria in some instances. In the past several years, dozens of states have approved or considered additional legislative mandates or administrative rules on hydraulic fracturing.
At the federal level, the EPA has issued or proposed regulations pursuant to multiple laws addressing varying aspects of hydraulic fracturing, including final CAA regulations in May 2012 that involve performance standards for the capture of air emissions released during hydraulic fracturing; finalized CWA regulations in June 2016 that prohibit the discharge of wastewater from hydraulic fracturing operations to publicly owned wastewater treatment plants; and an Advanced Notice of Proposed Rulemaking in May 2014 seeking comment on its intent to develop regulations under the Toxic Substances Control Act (TSCA) to require companies to disclose information regarding the chemicals used in hydraulic fracturing (though no such rule has yet been enacted). Also, the BLM finalized rules in March 2015 that impose new or more stringent standards for performing hydraulic fracturing on federal and American Indian lands including, for example, notice to and pre-approval by BLM of the proposed hydraulic fracturing activities; development and pre-approval by BLM of a plan for managing and containing flowback fluids and produced water recovered during the hydraulic fracturing process; implementation of measures designed to protect usable water from hydraulic fracturing activities; and public disclosure of the chemicals used in the hydraulic fracturing fluid. The rule has been challenged in federal court, but the 10th Circuit Court of Appeals dismissed the appeal from the decision vacating the rule and the underlying case on September 21, 2017, after an announcement that the current administration proposed retracting the underlying BLM rule. BLM rescinded the rule on December 29, 2017. However, California and environmental groups filed lawsuits in January 2018 challenging the BLM's rescission of the rule.
In addition, the U.S. Occupational Safety and Health Administration has proposed stricter standards for worker exposure to silica, which would apply to use of sand as a proppant for hydraulic fracturing.
In addition, from time to time, legislation has been introduced, but not enacted, in Congress to provide for federal regulation of hydraulic fracturing and to require disclosure of the chemicals used in the fracturing process. The adoption of new federal rules or regulations relating to hydraulic fracturing could lead to increased operating costs, delays and curtailment in the pursuit of exploration, development or production activities, which in turn could materially adversely affect our operations. Several governmental reviews are underway that focus on environmental aspects of hydraulic fracturing activities. For example, in December 2016, the EPA released its final report on the potential impacts of hydraulic fracturing on drinking water resources. The final report concluded that "water cycle" activities associated with hydraulic fracturing may impact drinking water resources "under some circumstances," noting that the following hydraulic fracturing water cycle activities and local- or regional-scale factors are more likely than others to result in more frequent or more severe impacts: water withdrawals for fracturing in times or areas of low water availability; surface spills during the management of fracturing fluids, chemicals or produced water; injection of fracturing fluids into wells with inadequate mechanical integrity; injection of fracturing fluids
directly into groundwater resources; discharge of inadequately treated fracturing wastewater to surface waters; and disposal or storage of fracturing wastewater in unlined pits.
Based on the foregoing, increased regulation and attention given to the hydraulic fracturing process from federal agencies, various states and local governments could lead to greater opposition, including litigation, to oil and gas production activities using hydraulic fracturing techniques. Additional legislation or regulation could also lead to operational delays or increased operating costs in the production of oil and natural gas, including from the developing shale plays, or could make it more difficult to perform hydraulic fracturing. The adoption of any federal, state or local laws or the implementation of regulations regarding hydraulic fracturing could potentially cause a decrease in the completion of new oil and gas wells and increased compliance costs and time, which could adversely affect our financial position, results of operations and cash flows.
Clean Water Act. Discharges to waters of the U.S. are further regulated and limited under the federal Clean Water Act (CWA) and analogous state and tribal laws. The CWA prohibits any discharge of pollutants into waters of the United States, including wetland areas, except in compliance with permits issued by federal and state governmental agencies. In September 2015, new EPA and U.S. Army Corps of Engineers (the Corps) rules defining the scope of the EPA’s and the Corps’ jurisdiction became effective. On June 27, 2017, the EPA proposed a rule to rescind the Clean Water Act rule and re-codify the regulatory text that existed prior to 2015 defining the "waters of the United States." In January 2018, the EPA and the Corps finalized a two-year postponement of the effective date of the CWA rule. As such, the scope of the jurisdictional reach of the CWA will likely remain uncertain for several years. To the extent the rule would expand the scope of the CWA’s jurisdiction, we could face increased costs and delays with respect to obtaining permits for dredge and fill activities in wetland areas. The process for obtaining permits has the potential to delay the development of natural gas and oil projects.
Safe Drinking Water Act. In addition, the federal Safe Drinking Water Act (SDWA) generally excludes hydraulic fracturing from the definition of underground injection. The federal Energy Policy Act of 2005 amended the Underground Injection Control provisions of the SDWA to expressly exclude certain hydraulic fracturing from the definition of "underground injection," but disposal of hydraulic fracturing fluids and produced water or their injection for enhanced oil recovery is not excluded. In 2014, the EPA issued draft permitting guidance governing hydraulic fracturing with diesel fuels. While we do not use diesel fuels in our hydraulic fracturing fluids, we may become subject to federal permitting under SDWA if our fracturing formula changes. In addition, the SDWA grants the EPA broad authority to take action to protect public health when an underground source of drinking water is threatened with pollution that presents an imminent and substantial endangerment to humans. The SDWA also regulates saltwater disposal wells under the Underground Injection Control Program.
Seismic Regulations. Recent concerns related to the operation of saltwater disposal wells and induced seismicity have led some states to impose limits on the total volume of produced water such wells can dispose of, order disposal wells to cease operations, or ban the construction of new wells. These seismic events have also resulted in environmental groups and local residents filing lawsuits against operators in areas where the events occur seeking damages and injunctions limiting or prohibiting saltwater disposal well construction activities and operations.
A lack of saltwater disposal wells in the areas in which we operate could result in increased disposal costs for our operations if we are forced to transport produced water by truck, pipeline, or other method over long distances.
Oil Pollution Act. The Oil Pollution Act of 1990 (OPA) establishes strict liability for owners and operators of facilities that are the site of a release of oil into waters of the U.S. The OPA and its associated regulations impose a variety of requirements on responsible parties, including owners and operators of certain facilities from which oil is released, related to the prevention of oil spills and liability for damages resulting from such spills. While liability limits apply in some circumstances, a party cannot take advantage of liability limits if the spill was caused by gross negligence or willful misconduct, resulted from violation of a federal safety, construction or operating regulation, or if the party fails to report a spill or to cooperate fully in the cleanup. Few defenses exist to the liability imposed by the OPA. The OPA imposes ongoing requirements on a responsible party, including the preparation of oil spill response plans and proof of financial responsibility to cover environmental cleanup and restoration costs that could be incurred in connection with an oil spill.
National Environmental Policy Act. The National Environmental Policy Act (NEPA) requires federal agencies, including the Department of Interior, to evaluate major agency actions having the potential to significantly impact the environment. Compliance with this requirement may lead to additional costs and delays in permitting for operators as the BLM may need to prepare additional Environmental Assessments and more detailed Environmental Impact Statements, which would be available for public review and comment. Such reviews are often subject to legal challenges, which can result in additional operational delays. In addition, the White House Council on Environmental Quality recently issued final guidance requiring consideration
of climate change impacts in NEPA reviews, which may result in requirements to deploy additional air pollution control measures. These additional requirements could increase our compliance costs and delay the completion of our exploration and development projects. See "We are subject to complex laws and regulatory actions that can affect the cost, manner, feasibility or timing of doing business" in Item 1A of this report for more information.
Endangered or Protected Species. The Endangered Species Act restricts activities that may affect federally-identified endangered and threatened species or their habitats through the implementation of operating restrictions or a temporary, seasonal or permanent ban on operations in affected areas. Similarly, the Migratory Bird Treaty Act (MBTA) implements various treaties and conventions between the U.S. and certain other nations for the protection of migratory birds. Under the MBTA, the taking, killing or possessing of migratory birds is unlawful without a permit, thereby potentially requiring the implementation of operating restrictions or a temporary, seasonal or permanent ban in affected areas.
Occupational Health and Safety. The Occupational Safety and Health Act (OSHA) and comparable state statutes regulate the protection of the health and safety of workers. The OSHA hazard communication standard requires maintenance of information about hazardous materials used or produced in operations and provision of such information to employees. Other OSHA standards regulate specific worker safety aspects of our operations. Failure to comply with OSHA requirements can lead to the imposition of penalties. Further, in December 2015, the Department of Labor and the Department of Justice, Environment and Natural Resources Division released a Memorandum of Understanding announcing an inter-agency effort to increase the enforcement of workplace safety crimes that occur in conjunction with environmental crimes.
Federal Regulation of Sales and Transportation of Natural Gas. Our sales of natural gas are affected directly or indirectly by the availability, terms and cost of natural gas transportation. The prices and terms for access to pipeline transportation of natural gas are subject to extensive federal and state regulation. The transportation and sale for resale of natural gas in interstate commerce is regulated primarily under the Natural Gas Act (NGA) and by regulations and orders promulgated under the NGA by the FERC. In certain limited circumstances, intrastate transportation and wholesale sales of natural gas may also be affected directly or indirectly by laws enacted by Congress and by FERC regulations.
Pursuant to authority delegated to it by the Energy Policy Act of 2005 (EPAct 2005) FERC promulgated anti-manipulation regulations establishing violation enforcement mechanisms which make it unlawful for any entity, directly or indirectly, in connection with the purchase or sale of natural gas or the purchase or sale of transportation services subject to the jurisdiction of FERC to use or employ any device, scheme, or artifice to defraud, to make any untrue statement of a material fact or to omit to state a material fact necessary in order to make the statements made, in the light of the circumstances under which they were made, not misleading, or to engage in any act, practice, or course of business that operates or would operate as a fraud or deceit upon any entity. Violation of these requirements, similar to violations of other NGA and FERC enforcement authorities, may be subject to investigation and penalties of up to $1 million per day per violation. FERC may also order disgorgement of profit and corrective action. We believe, however, that neither the EPAct 2005 nor the regulations promulgated by FERC as a result of the EPAct 2005 will affect us in a way that materially differs from the way they affect other natural gas producers, gatherers and marketers with which we compete.
The FERC has issued certain market transparency rules for the gas industry pursuant to its EPAct 2005 authority, which may affect some or all of our operations. The FERC issued a final rule in 2007, as amended by subsequent orders on rehearing (Order 704), which requires wholesale buyers and sellers of more than 2.2 million MMBtu of physical gas in the previous calendar year, including gas producers, gatherers, processors and marketers, to report, on May 1 of each year, beginning in 2009, aggregate volumes of gas purchased or sold at wholesale in the prior calendar year to the extent such transactions utilize, contribute to or may contribute to the formation of price indices, as explained in Order 704. It is the responsibility of the reporting entity to determine which transactions should be reported based on the guidance of Order 704. The FERC issued a Notice of Inquiry in Docket No. RM13-1-000 seeking comments from the industry regarding whether it should require more detailed information from sellers of gas. In November 2015, the FERC issued an order determining that the Notice of Inquiry's proposed reporting requirement was not necessary, and Docket No. RM13-1-000 was terminated.
Our sales of oil and natural gas are also subject to anti-manipulation and anti-disruptive practices authority under the Commodity Exchange Act (CEA) as amended by the Dodd-Frank Wall Street Reform Act and Consumer Reform Act (the Dodd-Frank Act), and regulations promulgated thereunder by the Commodity Futures Trading Commission (CFTC). The CEA, as amended by the Dodd-Frank Act, prohibits any person from using or employing any manipulative or deceptive device in connection with any swap, or a contract of sale of any commodity, or for future delivery on such commodity, in contravention of the CFTC’s rules and regulations. The CEA, as amended by the Dodd-Frank Act, also prohibits knowingly delivering or
causing to be delivered false or misleading or inaccurate reports concerning market information or conditions that affect or tend to affect the price of any commodity.
The current statutory and regulatory framework governing interstate natural gas transactions is subject to change in the future, and the nature of such changes is impossible to predict. Additional proposals and proceedings that might affect the natural gas industry are pending before Congress, the EPA, the FERC, the CFTC and the courts. The natural gas industry historically has been very heavily regulated. In the past, the federal government regulated the prices at which natural gas could be sold. Congress removed all price and non-price controls affecting wellhead sales of natural gas effective January 1, 1993. There is always some risk, however, that Congress may reenact price controls in the future. Changes in law and to FERC policies and regulations may adversely affect the availability and reliability of firm and/or interruptible transportation service on interstate pipelines, and we cannot predict what future action the FERC will take. Therefore, there is no assurance that the current regulatory approach recently pursued by the FERC and Congress will continue. We do not believe, however, that any regulatory changes will affect us in a way that materially differs from the way they will affect other natural gas producers, gatherers and marketers with which we compete.
Federal Regulation of Sales and Transportation of Crude Oil. Our sales of crude oil and condensate are currently not regulated. In a number of instances, however, the ability to transport and sell such products is dependent on pipelines whose rates, terms and conditions of service are subject to FERC jurisdiction under the Interstate Commerce Act. Certain regulations implemented by the FERC in recent years could result in an increase in the cost of transportation service on certain petroleum products pipelines. However, we do not believe that these regulations affect us any differently than other crude oil and condensate producers. In addition, certain emergency orders issued in 2014 by the U.S. Department of Transportation imposed additional restrictions on the shipment of crude oil by rail from the Bakken Shale. The Pipeline and Hazardous Materials Safety Administration (the "PHMSA") and the Federal Railroad Administration (the "FRA") also adopted final rules in 2015 supplementing the emergency orders that enhance existing tank car safety requirements and add sampling and testing requirements for product transported by rail. More recently, in January 2017 PHMSA published an advanced notice of proposed rulemaking stating that the agency is considering establishing vapor pressure limits for the transportation of crude oil and potentially all Class 3 flammable liquid hazardous materials, regardless of the method of transportation. These developments could increase the costs associated with moving our products.
International Regulations. Our exploration and production operations in China are subject to various types of regulations similar to those described above. These regulations are imposed by various agencies under the People's Republic of China (PRC). For example, laws under the Provisional Regulations on Administration and Management of the Abandonment of Offshore Oil and Gas Producing Facilities enacted in 2010, regulate our development and production activities offshore China. There are several departments in charge of aspects of energy industry regulation in China, including, the Bureau of Energy, the Ministry of Land and Resources, the Ministry of Housing and Urban-Rural Development, the State Administration of Work Safety, the Ministry of Environmental Protection, and the State Bureau of Tax. The PRC continues to develop environmental laws, regulations and controls surrounding offshore developments. In many cases, the legal requirements may be similar in form to the U.S. regulations; however, they impose additional or more stringent conditions or controls that can significantly alter or delay the development of a project or substantially increase the cost of doing business in China.
Financial Information
Financial information regarding the geographic areas in which we operate is incorporated herein by reference to Part II, Item 7, "Management’s Discussion and Analysis of Financial Condition and Results of Operations" and Item 8, "Financial Statements and Supplementary Data." Risks associated with our international operations are discussed under Item 1A, "Risk Factors," which information is incorporated herein by reference.
Commonly Used Oil and Gas Terms
Below are explanations of some commonly used terms in the oil and gas business and in this report.
Barrel or Bbl. One stock tank barrel or 42 U.S. gallons of liquid volume.
Basis risk. The risk associated with the sales point price for oil or gas production varying from the reference (or settlement) price for a particular derivative transaction.
Bcf. Billion cubic feet.
Bcfe. Billion cubic feet equivalent. Determined using the ratio of six Mcf of natural gas to one barrel of crude oil.
BLM. The Bureau of Land Management of the United States Department of the Interior.
BOE. One barrel of oil equivalent determined using the ratio of six Mcf of natural gas to one barrel of crude oil or condensate, or 42 U.S. gallons for NGLs.
BOEPD. Barrels of oil equivalent per day. Determined using the ratio of six Mcf of natural gas to one barrel of crude oil.
BOPD. Barrels of oil per day.
Btu. British thermal unit, which is the heat required to raise the temperature of a one-pound mass of water from 58.5 to 59.5 degrees Fahrenheit.
Completion. The installation of permanent equipment for the production of oil or natural gas.
Developed acres. The number of acres that are allocated or assignable to producing wells or wells capable of production.
Development well. A well drilled within the proved area of an oil or gas reservoir to the depth of a stratigraphic horizon known to be productive.
Exploration well. A well drilled to find a new field or new reservoir. Generally, an exploratory well is any well that is not a development well, an extension well, a service well or a stratigraphic test well.
FERC. The Federal Energy Regulatory Commission.
Field. An area consisting of a single reservoir or multiple reservoirs all grouped on or related to the same individual geological structural feature or stratigraphic condition. Used synonymously with the term "Resource play."
FPSO. A floating production, storage and off-loading vessel commonly used overseas to produce oil from locations where pipeline infrastructure is not available.
Gross acres or gross wells. The total acres or wells in which we own a working interest.
HBP. Held by production is a provision in an oil, gas and mineral lease that allows a company to continue drilling activities on the property as long as it is producing oil or gas.
Henry Hub. Henry Hub is a distribution hub for natural gas located in Louisiana and is the pricing point for natural gas futures contracts traded on the NYMEX.
Infill drilling or infill well. A well drilled between known producing wells to improve oil and gas reserve recovery.
Liquids. Crude oil and NGLs.
Liquids-rich. Formations that contain crude oil or NGLs instead of, or as well as, natural gas.
MBbls. One thousand barrels of crude oil or other liquid hydrocarbons.
MBOE. One thousand barrels of oil equivalent. Determined using the ratio of six Mcf of natural gas to one barrel of crude oil.
MBOEPD. One thousand barrels of oil equivalent per day. Determined using the ratio of six Mcf of natural gas to one barrel of crude oil.
MBOPD. One thousand barrels of oil per day.
Mcf. One thousand cubic feet of natural gas.
Mcfe. One thousand cubic feet equivalent, determined using the ratio of six Mcf of natural gas to one barrel of crude oil or condensate.
MMBbls. One million barrels of crude oil or other liquid hydrocarbons.
MMBOE. One million barrels of oil equivalent. Determined using the ratio of six Mcf of natural gas to one barrel of crude oil.
MMBtu. One million British thermal units.
MMcf. One million cubic feet of natural gas.
MMcf/d. One million cubic feet of natural gas produced per day.
MMcfe. One million cubic feet equivalent. Determined using the ratio of six Mcf of natural gas to one barrel of crude oil.
MMMBtu. One billion British thermal units.
Net acres or net wells. The sum of the fractional working interests we own in gross acres or gross wells.
NGL. Natural gas liquid. Hydrocarbons which can be extracted from wet natural gas and become liquid under various combinations of increasing pressure and lower temperature. NGLs consist primarily of ethane, propane, butane and natural gasolines.
NYMEX. The New York Mercantile Exchange.
Play. A group of fields or prospects in the same region that are part of the same petroleum system with similar geology. See also "Resource play."
Productive well. A well that is found to be capable of producing hydrocarbons in sufficient quantities such that proceeds from the sale of such production exceed production expenses and taxes.
Proved developed reserves. In general, proved reserves that can be expected to be recovered from existing wells with existing equipment and operating methods. The SEC provides a complete definition of developed oil and gas reserves in Rule 4-10(a)(6) of Regulation S-X.
Proved reserves. Those quantities of oil and natural gas, which by analysis of geoscience and engineering data, can be estimated with reasonable certainty to be economically producible – from a given date forward, from known reservoirs and under existing economic conditions, operating methods and government regulations — prior to the time at which contracts providing the right to operate expire, unless evidence indicates that renewal is reasonably certain, regardless of whether deterministic or probabilistic methods are used for the estimation. The project to extract the hydrocarbons must have commenced or the operator must be reasonably certain that it will commence the project within a reasonable time.
Proved undeveloped reserves. In general, proved reserves that are expected to be recovered from new wells on undrilled acreage or from existing wells where a relatively major expenditure is required for recompletion. The SEC provides a complete definition of undeveloped oil and gas reserves in Rule 4-10(a)(31) of Regulation S-X.
PV-10. The pre-tax present value of estimated future gross revenues from the production of proved reserves, based on year-end SEC pricing, net of estimated future production, development and abandonment costs, based on year-end costs, discounted at an annual discount rate of 10%. After-tax PV-10 is referred to as the standardized measure.
Reserve life index. This index is calculated by dividing total proved reserves on an equivalent basis at year end by annual production to estimate the number of years of remaining production.
Resource play. A play targeting tight sand, coal bed or shale reservoirs. The reservoirs tend to cover large areas and lack the readily apparent traps, seals and discrete hydrocarbon-water boundaries that typically define conventional reservoirs. These reservoirs generally require horizontal drilling and stimulation treatments or other special recovery processes in order to be produced economically.
SCOOP. A resource play in the Anadarko Basin of Oklahoma.
SEC pricing. The unweighted average first-day-of-the-month commodity price for crude oil (WTI) or natural gas (NYMEX) for the prior 12 months. The SEC provides a complete definition of the pricing methodology in their guidance "Modernization of Oil and Gas Reporting."
STACK. A resource play in the Anadarko Basin of Oklahoma.
Tcf. One trillion cubic feet of natural gas.
Type Curve. A production type curve is a representative production profile of a well for a specific play or area over the life of the well.
Undeveloped acreage. Lease acreage on which wells have not been drilled or completed to a point that would permit the production of commercial quantities of oil and gas regardless of whether such acreage contains proved reserves.
Working interest. The operating interest that gives the owner the right to drill, produce and conduct operating activities on the property and a share of production and requires the owner to pay a share of the costs of drilling and production operations.
WTI. West Texas Intermediate, a light, sweet grade of crude oil produced in the United States, that serves as the benchmark for oil pricing on the NYMEX and is primarily used by the United States oil market.
Additional Information
Through our website, www.newfield.com, Newfield provides access to electronic copies of our governance documents free of charge, including our Board of Directors’ Corporate Governance Guidelines and the charters of the committees of our Board of Directors. In addition, Newfield provides access to the documents we file with the U.S. Securities and Exchange Commission (SEC), including our annual reports on Form 10-K, quarterly reports on Form 10-Q and current reports on Form 8-K, including all amendments thereto, as soon as reasonably practicable after we file or furnish them.
The public also may request printed copies of our SEC filings or governance documents, free of charge, by writing to our corporate secretary at the address on the cover of this report. Additionally, current information about our various corporate responsibility initiatives is available on our website. Information contained on our website is not incorporated herein by reference and should not be considered part of this report.
In addition, the public may read and copy any materials we file with the SEC at the SEC’s Public Reference Room at 100 F Street, N.E., Washington, DC 20549. The public may obtain information on the operation of the Public Reference Room by calling the SEC at 1-800-SEC-0330. The SEC maintains an Internet site (www.sec.gov) that contains reports, proxy and information statements and other information regarding issuers that file electronically with the SEC.
Our corporate headquarters are located at 4 Waterway Square Place, Suite 100, The Woodlands, Texas 77380, and our telephone number is (281) 210-5100.
Item 1A. Risk Factors
There are many factors that may affect Newfield’s business and results of operations. Described below are certain risks that we believe are particularly applicable to our business and the oil and gas industry in which we operate, which may adversely affect our business, financial condition, results of operations or cash flows. You should carefully consider, in addition to the other information contained in this report, the risks described below. We may experience additional risks and uncertainties not currently known to us or, as a result of development occurring in the future, conditions that we currently deem to be immaterial may also adversely affect our business, financial condition, results of operations or cash flows.
Oil, natural gas and NGL prices fluctuate widely, and lower prices for an extended period of time are likely to have a material adverse impact on our business. Our revenues, profitability, cash flows and future growth, as well as liquidity and ability to access additional sources of capital, depend substantially on prevailing prices for oil, natural gas and NGLs and the relative mix of these commodities in our reserves and production. Sustained lower prices will reduce the amount of oil, natural gas and NGLs that we can economically produce and may result in impairments of our proved reserves or reduction of our proved undeveloped reserves. Oil, natural gas and NGL prices also affect the amount of cash flow available for capital expenditures and our ability to borrow and raise additional capital. See Items 1 and 2, "Business and Properties — 2018 Outlook," for additional information about the commodity price environment.
The market prices for oil, natural gas and NGLs depend on factors beyond our control. Some, but not all, of the factors that can cause fluctuations include:
• | the domestic and foreign supply of, and demand for, oil, natural gas and NGLs; |
• | domestic and world-wide economic conditions; |
• | the level and effect of trading in commodity futures markets, including commodity price speculators and others; |
• | military, economic and political conditions in oil and gas producing regions; |
• | the actions taken by OPEC and other foreign oil and gas producing nations, including the ability of members of OPEC to agree to and maintain production controls; |
• | the impact of the U.S. dollar exchange rates on oil, natural gas and NGL prices; |
• | the price and availability of, and demand for, alternative fuels; |
• | weather conditions and climate change; |
• | world-wide conservation measures; |
• | technological advances affecting energy consumption and production; |
• | changes in the price of oilfield services and technologies; |
• | the price and level of foreign imports; |
• | expansion of U.S. exports of oil, natural gas and/or NGLs; |
• | the availability, proximity and capacity of transportation, processing, storage and refining facilities; |
• | the costs of exploring for, developing, producing, transporting and marketing oil, natural gas and NGLs; and |
• | the nature and extent of domestic and foreign governmental regulations and taxation, including environmental regulations. |
While we cannot predict commodity prices, we have previously made adjustments in response to the then current strong supply and relatively soft demand for oil, natural gas and NGLs, such as adapting our 2017 capital investment plan to reflect anticipated commodity prices, historical drilling success, and markets for our products. In the current commodity price environment, we have increased our 2018 capital investment plan, but this capital investment plan is subject to adjustments such as those taken in 2017. These adjustments are likely to influence our profitability and could adversely affect our business, financial condition, results of operations and cash flows. In addition, our stock price in the market is influenced by fluctuations in oil, natural gas and NGL prices.
Sustained material declines in oil, natural gas or NGL prices may have the following effects on our business:
• | limit our access to sources of capital, such as equity and long-term debt; |
• | cause us to delay or postpone capital projects; |
• | cause us to lose certain leases because we fail to meet obligations of the leases prior to expiration; |
• | reduce reserve estimates and the amount of products we can economically produce; |
• | downgrade or other negative rating action with respect to our credit rating; |
• | reduce revenues, income and cash flows available for capital expenditures, repayment of indebtedness and other corporate purposes; or |
• | reduce the carrying value of our assets in our balance sheet through ceiling test impairments. |
We may be responsible for decommissioning liabilities for offshore interests we no longer own. Under state and federal law, oil and gas companies are obligated to plug and abandon (P&A) a well and restore the lease to pre-operating conditions after operations cease. U.S. state and federal regulations allow the government to call upon predecessors in interest of oil and gas leases to pay for P&A, restoration and decommissioning obligations if the current operator fails to fulfill those obligations. Moreover, offshore P&A liabilities can be very significant. As part of our strategic shift from offshore Gulf of Mexico operations to onshore U.S. operations, we divested our assets on the outer continental shelf (OCS) in the Gulf of Mexico (GoM). In connection with those divestitures, we entered into various arrangements with the purchasers whereby the purchasers assumed our P&A liabilities and other liabilities related to decommissioning such GoM assets. Since we entered into these arrangements, several onshore and offshore E&P companies have sought bankruptcy protection. If purchasers of our former GoM assets, or any successor owners of those assets, are unable to meet their P&A and other decommissioning obligations due to bankruptcy, dissolution or other related liquidity issues, we may be unable to rely on our arrangements with them to fulfill (or provide reimbursement for) those obligations. In those circumstances, the government may seek to impose the bankrupt entity’s P&A obligations on us and any other predecessors in interest. Such payments could be significant and adversely affect our business, results of operations, financial condition and cash flows.
Moreover, recent changes to the Bureau of Ocean Energy Management’s (BOEM) bonding requirements have the potential to adversely impact the financial condition of operators in the GoM and increase the number of operators seeking bankruptcy protection, given the current commodities market. In July 2016, BOEM issued a Notice to Lessees and Operators (NTL) that augments requirements for the posting of additional financial assurance by offshore lessees, among others, to assure that sufficient funds are available to perform decommissioning obligations with respect to offshore wells, platforms, pipelines and other facilities. The NTL, which became effective in September 2016, eliminates the agency’s past practice of waiving supplemental bonding obligations where a company could demonstrate a certain level of financial strength. Instead, BOEM will allow companies to "self-insure," but only up to 10% of a company’s "tangible net worth," which is defined as the difference between a company’s total assets and the value of all liabilities and intangible assets.
The NTL provides new procedures for how BOEM determines a lessee’s decommissioning obligations, and the agency continues to negotiate with offshore operators to post additional financial assurance and develop tailored plans to meet BOEM’s revised estimates for offshore decommissioning obligations. Projected decommissioning costs of operations in the GoM continue to increase, and the volatile price of oil and gas has adversely affected the net worth of many operators. BOEM’s revisions to its supplemental bonding process could result in demands for the posting of increased financial assurance by the entities to whom we divested our GoM assets as well as other operators in the GoM. This will force operators to obtain surety bonds or other forms of financial assurance, the costs of which could be significant. Moreover, BOEM’s NTL is likely to result in the loss of supplemental bonding waivers for a large number of operators on the OCS, which will in turn force these operators to seek additional surety bonds and could, consequently, exceed the surety bond market’s ability to provide such additional financial assurance. Operators who have already leveraged their assets as a result of the volatile oil market could face difficulty obtaining surety bonds because of concerns the surety may have about the priority of their lien on the operators' collateral. Consequently, BOEM’s changes could result in additional operators in the GoM initiating bankruptcy proceedings, which in turn could result in the government seeking to impose P&A costs on predecessors in interest in the event that the current operator cannot meet its P&A obligations. As a result, we could find ourselves liable to pay for the P&A costs of any entity we divested our GoM assets to, which payments could be significant and adversely affect our business, results of operations, financial condition and cash flows.
Legislation or regulatory initiatives intended to address seismic activity in Oklahoma and elsewhere could increase our costs of compliance or lead to operational delays, which could have a material adverse effect on our business, results of operations, cash flows or financial condition. Water sourcing, use and disposal are common practices in oil and gas operations. We dispose of large volumes of water produced alongside oil and natural gas “produced water” or "saltwater" in connection with our drilling and production operations, pursuant to permits issued to us by governmental authorities overseeing such disposal activities. While these permits are issued under existing laws and regulations, these legal requirements are subject to change, which could result in the imposition of more stringent operating constraints or new monitoring and reporting requirements, owing to, among other things, concerns of the public or governmental authorities regarding such gathering or disposal activities.
There exists a growing concern that the injection of produced water into belowground disposal wells triggers seismic events in certain areas, including Oklahoma, where we operate. In response to recent seismic events near underground water disposal wells, federal and some state agencies are investigating whether certain high volume disposal wells have caused or
contributed to increased seismic activity, and some states have restricted, suspended or shut down the use of such disposal wells that are located in close proximity to areas of increased seismic activity.
The Oklahoma Corporation Commission (OCC) evaluates existing disposal wells to assess their continued operation, or operation with restrictions, based on location relative to faults, seismicity and other factors, with well operators in certain geographic locations required to make frequent, or even daily, volume and pressure reports. In addition, the OCC has adopted rules requiring operators of certain saltwater disposal wells in the state to, among other things, conduct additional mechanical integrity testing or make certain demonstrations of such wells’ depth that, depending on the depth, could require the plugging back of such wells to shallower depths and/or the reduction of volumes disposed in such wells. As a result of these measures, the OCC from time to time has developed and implemented plans calling for wells within Areas of Interest where seismic incidents have occurred to restrict or suspend disposal well operations in an attempt to mitigate the occurrence of such incidents. For example, OCC has established a 15 thousand square mile Area of Interest in the Arbuckle formation located primarily north and east of the Anadarko Basin in the Mississippi Lime play. Since 2013, OCC has prohibited disposal into the basement rock and ordered reduction of disposal volumes into the overlying Arbuckle formation and directed the shut-in of a number of Arbuckle disposal wells in response to seismic activity. In addition, in January 2016, the Governor of Oklahoma announced a grant of $1.4 million in emergency funds to support earthquake research to be directed by the OCC and the Oklahoma Geological Survey (OGS). During September and November 2016, in response to the occurrence of earthquakes in Cushing and Pawnee, Oklahoma, located in the northeast area of the Anadarko Basin, the OCC developed action plans in conjunction with the OGS and the EPA. The plans require reductions in disposal volumes in three concentric zones from the center of the earthquake activity in both Cushing and Pawnee, Oklahoma, with the greatest reductions in the zone located closest to the center of the largest quakes. These actions are in addition to any previous orders to shut in wells or reduce disposal volumes. Prior measures had already reduced disposal volumes in the areas of concern by up to 50 percent for some disposal wells. In the Pawnee area, the action plan covers a total of 38 Arbuckle disposal wells under OCC jurisdiction and 26 Arbuckle disposal wells under EPA jurisdiction and in the Cushing area the plan covers a total of 58 Arbuckle disposal wells. Local residents have also recently filed lawsuits against saltwater disposal well operators in these areas for damages resulting from the increased seismic activity.
Additionally, in recent years there has been increased public concern regarding an alleged potential for hydraulic fracturing to induce seismic events. In December 2016, the OCC announced the development of seismicity guidelines focused on operators in SCOOP and STACK to directly address concerns related to induced seismicity and hydraulic fracturing. The OCC has established three action levels to be followed if events are detected at a M2.5 or above and within 1.24 miles (2 km) of hydraulic fracturing activities.
Magnitude 2.5 — OCC contacts the operator, discusses mitigation plan, operations may continue
Magnitude 3.0 — required minimum six-hour pause, technical call with OCC regarding mitigations, operations continue with an approved and revised completion plan
Magnitude 3.5 — required operations suspension, technical meeting with OCC and decision made to resume or halt operations based on approved and revised completion plan
On March 1, 2017, the OCC also issued a statement saying that further actions to reduce the earthquake rate in Oklahoma could be expected.
Restrictions on disposal well volumes or a lack of sufficient disposal wells, the filing of lawsuits, or curtailment or restrictions on oil and gas activity generally in response to concerns related to induced seismicity, could cause us to delay, curb or discontinue our exploration and development plans. Increased costs associated with restrictions on hydraulic fracturing or the transportation and disposal of produced water, including the cost of complying with regulations concerning produced water disposal or hydraulic fracturing, such as mandated produced water recycling in some portion or all of our operations or prohibitions on performing hydraulic fracturing in certain areas, may reduce our profitability.
These developments may result in additional levels of regulation, or increased complexity and costs with respect to existing regulations, that could lead to operational delays or increased operating and compliance costs, which could have a material adverse effect on our business, results of operations, cash flows or financial condition.
Our use of oil, natural gas and NGL price derivative contracts may limit future revenues and cash flows from price increases and involves the risk that our counterparties may be unable to satisfy their obligations to us. Any inability to
maintain our current derivative positions in the future specifically could result in financial losses or could reduce our income and cash flows. As part of our risk management program, we generally use derivative contracts to protect a substantial, but varying, portion of our anticipated future oil, gas and NGL production to reduce our exposure to fluctuations in oil, natural gas and NGL prices. A portion of our oil derivative contracts include sold puts. If market prices remain below our sold puts at contract settlement, we will receive the difference between our floors or swaps and the associated sold puts, limiting the downside protection of these contracts. In the case of acquisitions, we may use derivative contracts to protect acquired production from commodity price volatility for a longer period. While the use of derivative contracts may limit or reduce the downside risk of adverse price movements, their use also may limit future benefits from favorable price movements and expose us to the risk of financial loss in certain circumstances. Those circumstances include instances where our production is less than the volume subject to derivative contracts, there is a widening of price basis differentials between delivery points for our production and the delivery points assumed in the derivative transactions or there are issues with regard to the legal enforceability of such instruments.
The use of derivative transactions also involves the risk that counterparties, which generally are financial institutions, will be unable to perform their financial and other obligations under such transactions. If any of our counterparties were to default on its obligations to us under the derivative contracts, enter receivership or seek bankruptcy or similar protection, that could result in an economic loss to us and could have a material adverse effect on our ability to fund our planned activities and could result in a larger percentage of our future production being subject to commodity price changes. In addition, in poor economic environments and tight financial markets, the risk of a counterparty default is heightened, and it is possible that fewer counterparties will participate in future derivative transactions, which could result in greater concentration of our exposure to any one counterparty or a larger percentage of our future production being subject to commodity price changes.
Additionally, in the past we have concluded that utilizing derivative contracts to lock in historically low prices for oil and natural gas for some of our anticipated future production is not in the best interest of the Company, and we may come to that conclusion again in the future. As a result, a meaningful portion of our future oil production could remain unhedged and subject to fluctuating market prices. If we are ultimately unable to, or choose not to, hedge additional expected oil production volumes for future periods, we will be subject to further potential commodity price volatility, which may result in lower than expected cash flows, revenues and income.
Our limited hedging of our NGL production and commodity basis differentials could adversely impact our cash flows and revenue. The market for hedging NGL and commodity basis differentials is less robust than for oil and natural gas priced at WTI and Henry Hub, respectively. The current direct NGL and commodity basis differential hedging market is constrained in terms of price, volume, duration and number of counterparties. This limits our ability to hedge our NGL production and price difference based on point of sale effectively or at all. As a result, currently, we primarily hedge our oil and natural gas production priced at WTI and Henry Hub, respectively, and only recently began hedging a small portion of our NGL production. If the current price levels for NGLs continue or decrease in the future or the commodity basis differentials versus WTI or Henry Hub negatively increase, such as is the case with respect to our wax crude oil production, our cash flows and results of operations would be affected.
We have substantial capital requirements to fund our business plans that could be greater than cash flows from operations. Limited liquidity would likely negatively impact our ability to execute our business plan. Our 2018 capital investment levels may exceed our projected cash flows from operations. As a result, we may use available cash or borrow funds under our credit facility, due in part to our decision to continue our drilling program in order to avoid future lease renewals to retain certain acreage. If necessary, we may continue to use cash on hand, sell non- strategic assets or potentially access public debt and/or equity markets to fund any shortfall. Our ability to generate operating cash flows is subject to many risks and variables, such as the level of production from existing wells; prices of oil, natural gas and NGLs; production costs; availability of economical gathering, processing, storage and transportation in our operating areas; our success in developing and producing new reserves and the other risk factors discussed in this Annual Report. Actual levels of capital expenditures may vary significantly due to many factors, including drilling results, commodity prices, industry conditions, the prices and availability of goods and services, unbudgeted acquisitions and the promulgation of new regulatory requirements. In addition, in the past, we often have increased our capital budget during the year as a result of acquisitions or changes in drilling plans. Alternatively, we may have to reduce capital expenditures, and our ability to execute our business plans could be adversely affected, if:
• | we generate less operational cash flow than we anticipate; |
• | we are unable to sell non-strategic assets at acceptable prices; |
• | our customers or working interest owners default on their obligations to us; |
• | one or more of the lenders under our existing credit arrangements fails to honor its contractual obligation to lend to us; |
• | investors limit funding or refrain from funding oil and gas companies; or |
• | we are unable to access the capital markets at a time when we would like, or need, to raise capital. |
Our level of indebtedness and the restrictive covenants in the agreements governing our indebtedness and other financial obligations may reduce our operating flexibility. As of December 31, 2017, we had total indebtedness of $2.4 billion. The indentures governing our outstanding notes and the agreements governing our other indebtedness and financial obligations contain, and any indenture that will govern other debt securities issued by us and any future agreements governing our other indebtedness and financial obligations may contain, various covenants that limit our ability and the ability of specified subsidiaries of ours to, among other things:
• | incur additional indebtedness; |
• | purchase or redeem our outstanding equity interests or subordinated debt; |
• | make specified investments; |
• | create liens; |
• | sell assets; |
• | engage in specified transactions with affiliates; |
• | engage in sale-leaseback transactions; and |
• | effect a merger or consolidation with or into other companies or a sale of all or substantially all of our properties or assets. |
These restrictions and our level of indebtedness could limit our ability to:
• | obtain future financing; |
• | make needed capital expenditures; |
• | plan for, or react to, changes in our business and the industry in which we operate; |
• | compete with similar companies that have less debt; |
• | withstand a future downturn in our business or the economy in general; or |
• | conduct operations or otherwise take advantage of business opportunities that may arise. |
Some of the agreements governing our indebtedness and other financial obligations also require the maintenance of specified financial ratios and the satisfaction of other financial conditions. Our ability to meet those financial ratios and conditions, and to comply with other covenants and restrictions in our financing agreements, can be affected by unexpected downturns in business operations beyond our control, such as a volatile commodity cost environment or an economic downturn. Accordingly, we may be unable to meet these obligations. This failure could impair our results of operations and cash flows and could restrict our ability to incur debt.
Our breach of any of these covenants could result in a default under the terms of the relevant indebtedness, which could cause such indebtedness or other financial obligations to become immediately due and payable. If the lenders accelerate the repayment of borrowings or other amounts owed, we may not have sufficient assets to repay our indebtedness or other financial obligations, including our outstanding notes and any future debt securities. If we are unable to satisfy our obligations with cash on hand, we could attempt to refinance such debt, or repay such debt with the proceeds from a sale of assets or a public offering of securities. Factors that will affect our ability to successfully complete a public offering, refinance our debt or conduct an asset sale include financial market conditions and our market value, asset valuations and operating performance at the time of such offering or other financing.
A downgrade in our credit rating could negatively impact our cost of and ability to access capital. We receive debt ratings from the major credit rating agencies in the United States. Factors that may impact our credit ratings include debt levels, planned asset purchases or sales, and near-term and long-term production growth opportunities. Liquidity, asset quality, cost structure, product mix, and commodity pricing levels are also considered by the rating agencies. A ratings downgrade could adversely impact our ability to access debt markets in the future, increase the cost of future debt, and potentially require us to
post letters of credit or other forms of collateral for certain obligations. A downgrade in our credit rating could negatively impact our cost of capital, our ability to issue future debt under terms similar to our existing debt or our ability to effectively execute aspects of our strategy. If we were downgraded, it could be difficult for us to raise debt in the public debt markets and the cost of any new debt could be much higher than our outstanding debt. See Note 11, "Debt," to our consolidated financial statements in Item 8 of this report for additional information.
Actual quantities of oil, natural gas and NGL reserves and future cash flows from those reserves will most likely vary from our estimates. Estimating quantities of oil, natural gas and NGL reserves is complex and inexact. The process relies on interpretations of geologic, geophysical, engineering and production data. The extent, quality and reliability of these data can vary. The process also requires a number of economic assumptions, such as oil, natural gas and NGL prices, the relative mix of oil, natural gas and NGLs that will be ultimately produced, drilling and operating expenses, capital expenditures, the effect of government regulation, taxes and availability of funds. The accuracy of a reserve estimate is a function of:
• | the quality and quantity of available data; |
• | the interpretation of that data; |
• | the accuracy of various mandated economic assumptions and our expected development plan; and |
• | the judgment of the persons preparing the estimate. |
Actual quantities of oil, natural gas and NGL reserves, future oil, natural gas and NGL production and the relative mix of oil, natural gas and NGLs that will be ultimately produced, oil, natural gas and NGL prices, revenues, taxes, capital expenditures, effects of regulations, funding availability and drilling and operating expenses will most likely vary from our estimates. In addition, the methodologies and evaluation techniques that we use, which include the use of multiple technologies, data sources and interpretation methods, may be different than those used by our competitors. Further, reserve estimates are subject to the evaluator’s criteria and judgment and show important variability, particularly in the early stages of development. Any significant variance could be systematic and undetected for an extended period of time, which would materially affect the quantities and net present value of our reserves. In addition, we may adjust estimates of reserves to reflect production history, results of exploration and development activities, prevailing oil, natural gas and NGL prices and other factors, many of which are beyond our control. Our reserves also may be susceptible to drainage by operators on adjacent properties.
In accordance with SEC requirements, we calculate the estimated discounted future net cash flows from proved reserves using the SEC’s pricing methodology for calculating proved reserves, adjusted for market differentials and costs in effect at year end discounted at 10%. Actual future prices and costs may be materially higher or lower than the prices and costs we used as of the date of an estimate. In addition, actual production rates for future periods may vary significantly from the rates assumed in the calculation. You should not assume that the present value of future net cash flows is the current market value of our proved reserves.
To maintain and grow our production and cash flows, we must continue to develop existing reserves and locate or acquire new reserves. Through our drilling programs and the acquisition of properties, we strive to maintain and grow our production and cash flows. However, as we produce from our properties, our reserves decline. Unless we successfully replace the reserves that we produce, the decline in our reserves will eventually result in a decrease in oil, natural gas and NGL production and lower revenue, income and cash flows from operations. Future oil, natural gas and NGL production is, therefore, highly dependent on our success in efficiently finding, developing or acquiring additional reserves that are economically recoverable. We may be unable to find, develop or acquire additional reserves or production at an acceptable cost, if at all. In addition, these activities require substantial capital expenditures.
Lower oil and gas prices and other factors have resulted in ceiling test impairments in the past and may result in future ceiling test or other impairments. We use the full cost method of accounting for our oil and gas producing activities. Under this method, all costs incurred in the acquisition, exploration and development of oil and gas properties are capitalized into cost centers that are established on a country-by-country basis. The net capitalized costs of our oil and gas properties may not exceed the present value of estimated future net revenues from proved reserves, discounted at 10%, plus the lower of cost or fair value of unproved properties. If net capitalized costs of our oil and gas properties exceed the cost center ceiling, we are subject to a ceiling test impairment to the extent of such excess. If required, a ceiling test impairment reduces income and stockholders’ equity in the period of occurrence.
The risk that we will be required to further impair the carrying value of our oil and gas properties increases when oil, natural gas or NGL prices are low or volatile for a prolonged period of time. In addition, impairments may occur if we
experience substantial downward adjustments to our estimated proved reserves or our unproved property values, or if estimated future development costs increase.
Drilling is a costly and high-risk activity. In addition to the numerous operating risks described in more detail below, the drilling of wells involves the risk that no commercially productive oil or gas reservoirs will be encountered. The seismic data and other technologies we use do not allow us to know conclusively prior to drilling a well that oil, natural gas or NGLs are present or may be produced economically. In addition, we are often uncertain of the future cost or timing of drilling, completing and producing wells. Furthermore, our drilling operations may be curtailed, delayed or canceled as a result of a variety of factors, including:
• | increases in the costs of, or shortages or delays in the availability of, drilling rigs, equipment and materials; |
• | decreases in oil, natural gas and NGLs prices; |
• | limited availability to us of financing on acceptable terms; |
• | adverse weather conditions and changes in weather patterns; |
• | unexpected operational events and drilling conditions; |
• | abnormal pressure or irregularities in geologic formations; |
• | surface access restrictions; |
• | access to, and costs for, water needed in our waterflood project in the Greater Monument Butte Unit (GMBU); |
• | the presence of underground sources of drinking water, previously unknown water or other extraction wells or endangered or threatened species; |
• | embedded oilfield drilling and service tools; |
• | equipment failures or accidents; |
• | lack of necessary services or qualified personnel; |
• | availability and timely issuance of required governmental permits and licenses; |
• | loss of title and other title-related issues; |
• | availability, costs and terms of contractual arrangements, such as leases, pipelines and related facilities to gather, process and compress, transport and market oil, natural gas and NGLs; and |
• | compliance with, or changes in, environmental, tax and other laws and regulations. |
As we implement pad development and increase the lateral length and size of hydraulic fracturing stimulations of our horizontal wells, the costs and other impacts associated with any curtailment, delay or cancellation may increase due to the concentration of capital expenditures prior to bringing production online. Future drilling activities may not be successful, and if unsuccessful, this could have an adverse effect on our future results of operations, cash flows and financial condition.
The oil and gas business involves many operating risks that can cause substantial losses. Our oil and gas exploration and production activities are subject to all of the operating risks associated with drilling for and producing oil and gas, including the risk of:
• | fires and explosions; |
• | blow-outs and cratering; |
• | uncontrollable or unknown flows of oil, gas or well fluids; |
• | pipe or cement failures and casing collapses; |
• | pipeline or other facility ruptures and spills; |
• | equipment malfunctions or operator error; |
• | discharges of toxic gases; |
• | induced seismic events; |
• | environmental costs and liabilities due to our use, generation, handling and disposal of materials, including wastes, hydrocarbons and other chemicals; and |
• | environmental damages caused by previous owners of property we purchase and lease. |
Some of these risks or hazards could materially and adversely affect our results of operations and cash flows by reducing or shutting in production from wells, loss of equipment or otherwise negatively impacting the projected economic performance of our prospects. If any of these risks occur, we could incur substantial losses as a result of:
• | injury or loss of life; |
• | severe damage or destruction of property, natural resources and equipment; |
• | pollution and other environmental damage; |
• | investigatory and clean-up responsibilities; |
• | regulatory investigation and penalties or lawsuits; |
• | limitation on or suspension of our operations; and |
• | repairs and remediation costs to resume operations. |
The magnitude of these risks may increase due to the increase in lateral length, larger multi-stage hydraulic fracturing stimulations for our horizontal wells and the implementation of pad development because of the larger amounts of liquids, chemicals and proppants involved.
Further, offshore operations are subject to a variety of additional operating risks, such as capsizing, collisions and damage or loss from typhoons or other adverse weather conditions. These conditions could cause substantial damage to facilities and interrupt production. Our China operations are dependent upon the availability, proximity and capacity of gathering systems and processing facilities that we do not own. Necessary infrastructures have been in the past, and may be in the future, temporarily unavailable due to adverse weather conditions or other reasons, or they may not be available to us in the future on acceptable terms or at all. For example, production from our operated Pearl field in the South China Sea was suspended during the third quarter of 2017 due to a mechanical issue associated with a third-party floating production, storage and offloading vessel located approximately 10 miles from the field, resulting in only one lifting during the quarter.
In addition, our hydraulic fracturing operations require significant quantities of water. Regions in which we operate have recently experienced drought conditions. Any diminished access to water for use in hydraulic fracturing, whether due to usage restrictions or drought or other weather conditions, could curtail our operations or otherwise result in delays in operations or increased costs related to finding alternative water sources.
Failure or loss of equipment, as the result of equipment malfunctions, cyber-attacks or natural disasters, could result in property damages, personal injury, environmental pollution and other damages for which we could be liable. Catastrophic occurrences giving rise to litigation, such as a well blowout, explosion or fire at a location where our equipment and services are used, may result in substantial claims for damages. Ineffective containment of a drilling well blowout or pipeline rupture could result in extensive environmental pollution and substantial remediation expenses, as well as governmental fines and penalties. If our production is interrupted significantly, our efforts at containment are ineffective or litigation arises as the result of a catastrophic occurrence, our cash flows, and in turn, our results of operations, could be materially and adversely affected.
In connection with our operations, we generally require our contractors, which include the contractor, its parent, subsidiaries and affiliate companies, its subcontractors, their agents, employees, directors and officers, to agree to indemnify us for injuries and deaths of their employees, contractors, subcontractors, agents and directors, and any property damage suffered by the contractors. There may be times, however, that we are required to indemnify our contractors for injuries and other losses resulting from the events described above, which indemnification claims could result in substantial losses to us. Contractor or customer contracts may also contain inadequate indemnity clauses, exposing us to unexpected losses or an unfavorable litigation position, and could, in turn, have a material adverse effect on our business, financial condition, results of operations and cash flows.
While we maintain insurance against some potential losses or liabilities arising from our operations, our insurance does not protect us against all operational risks. The occurrence of any of the foregoing events and any costs or liabilities incurred as a result of such events, if uninsured or in excess of our insurance coverage or not indemnified, could reduce revenue, income and
cash flows and the funds available to us for our exploration, development and production activities and could, in turn, have a material adverse effect on our business, financial condition, results of operations and cash flows. See also "— We may not be insured against all of the operating risks to which our business is exposed."
Our identified drilling locations are scheduled out over several years, making them susceptible to uncertainties that could materially alter the occurrence or timing of their drilling. Our management has specifically identified and scheduled drilling locations as an estimation of our future multi-year drilling activities on our existing acreage. These drilling locations represent a significant part of our growth strategy. Our ability to drill and develop these locations is subject to a number of uncertainties, including oil, natural gas and NGL prices, the availability of capital, costs, drilling results, regulatory approvals, available transportation capacity, and other factors. If future drilling results in these projects do not establish sufficient reserves to achieve an economic return, we may curtail drilling in these projects. Additionally, as we transition STACK and SCOOP to pad development, there may be significant delays in bringing new wells online, which could result in inconsistent growth and possibly short term declines in our production from those plays.
Because of these uncertainties, we do not know if the numerous potential drilling locations we have identified will ever be drilled or if we will be able to produce oil, natural gas or NGLs from these or any other potential drilling locations. In addition, unless production is established within the spacing units covering the undeveloped acres on which some of the locations are identified, the leases for such acreage will expire. As such, our actual drilling activities may materially differ from those presently identified. Currently low oil prices, reduced capital spending and numerous other factors, many of which are beyond our control, could result in our failure to establish production on undeveloped acreage, and, if we are not able to renew leases before they expire, any proved undeveloped reserves associated with such leases will be removed from our proved reserves. The combined net acreage expiring in the next three years represents 73% of our total net undeveloped acreage at December 31, 2017. At that date, we had leases representing approximately 80,000 net undeveloped acres expiring in 2018, approximately 56,000 net undeveloped acres expiring in 2019, and approximately 29,000 net undeveloped acres expiring in 2020. Our actual drilling activities may materially differ from those presently identified, which could adversely affect our business, results of operations, financial condition and cash flows.
Our proved undeveloped reserves may not be ultimately developed or produced. The development of our proved undeveloped reserves may take longer and may require higher levels of capital expenditures than we currently anticipate. At December 31, 2017, approximately 41% of our total estimated proved reserves (by volume) were undeveloped and may not be ultimately developed or produced. Recovery of undeveloped reserves requires significant capital expenditures and successful drilling operations. Our reserve estimates assume we can and will make these expenditures and conduct these operations successfully. These assumptions, however, may not prove to be accurate. We cannot be certain that the estimated costs of the development of these reserves are accurate, that development will occur as scheduled, or that the results of such development will be as estimated. If we choose not to spend the capital to develop these reserves, or if we are not otherwise able to successfully develop these reserves, we will be required to remove the associated volumes from our reported proved reserves. In addition, under the SEC’s reserve rules, because proved undeveloped reserves may be booked only if they relate to wells scheduled to be drilled within five years of the date of booking, we may be required to remove any proved undeveloped reserves that are not developed within this five-year time frame. A removal of such reserves could adversely affect our business and financial condition.
The potential adoption of federal, state, tribal and local legislative and regulatory initiatives related to hydraulic fracturing could result in operating restrictions or delays in the completion of oil and gas wells. Hydraulic fracturing is an essential and common practice in the oil and gas industry used to stimulate production of natural gas and/or oil from dense subsurface rock formations. We routinely apply hydraulic fracturing techniques on almost all of our U.S. onshore oil and natural gas properties. Hydraulic fracturing involves using water, sand or other proppant materials, and certain chemicals to fracture the hydrocarbon-bearing rock formation to allow flow of hydrocarbons into the wellbore.
As explained in more detail below, the hydraulic fracturing process is typically regulated by state oil and natural gas agencies, although the EPA, the BLM and other federal regulatory agencies have taken steps to review or impose federal regulatory requirements. Certain states in which we operate, have adopted, and other states are considering adopting, regulations that could impose more stringent permitting, public disclosure and well construction requirements on hydraulic fracturing operations or otherwise seek to ban fracturing activities altogether. Certain municipalities have already banned hydraulic fracturing, and courts have upheld those moratoria in some instances. In the past several years, dozens of states have approved or considered additional legislative mandates or administrative rules on hydraulic fracturing. See the risk factor "Legislation or regulatory initiatives intended to address seismic activity in Oklahoma and elsewhere could increase our costs of compliance or lead to operational delays, which could have a material adverse effect on our business, results of operations,
cash flows or financial condition" for more information on action taken by certain states to regulate hydraulic fracturing activity.
At the federal level, the EPA has taken numerous actions. See Items 1 and 2, "Business and Properties — Regulation —Environmental Regulations — Hydraulic Fracturing," for more information on such actions. The adoption of new federal rules or regulations relating to hydraulic fracturing could require us to obtain additional permits or approvals or to install expensive pollution control equipment for our operations, which in turn could lead to increased operating costs, delays and curtailment in the pursuit of exploration, development or production activities, which in turn could materially adversely affect our operations.
In December 2016, the EPA released its final report on the potential impacts of hydraulic fracturing on drinking water resources. The final report concluded that "water cycle" activities associated with hydraulic fracturing may impact drinking water resources "under some circumstances," noting that the following hydraulic fracturing water cycle activities and local- or regional-scale factors are more likely than others to result in more frequent or more severe impacts: water withdrawals for fracturing in times or areas of low water availability; surface spills during the management of fracturing fluids, chemicals or produced water; injection of fracturing fluids into wells with inadequate mechanical integrity; injection of fracturing fluids directly into groundwater resources; discharge of inadequately treated fracturing wastewater to surface waters; and disposal or storage of fracturing wastewater in unlined pits. Since the report did not find a direct link between hydraulic fracturing itself and contamination of groundwater resources, we do not believe that this multi-year study report provides any basis for further regulation of hydraulic fracturing at the federal level.
Based on the foregoing, increased regulation and attention given to the hydraulic fracturing process from federal agencies, various states and local governments could lead to greater opposition, including litigation, to oil and gas production activities using hydraulic fracturing techniques. Additional legislation or regulation could also lead to operational delays or increased operating costs in the production of oil, natural gas and NGLs, including from the developing shale plays, or could make it more difficult to perform hydraulic fracturing. The adoption of any federal, state or local laws or the implementation of regulations regarding hydraulic fracturing could potentially cause a decrease in the completion of new oil and gas wells and increased compliance costs and time, which could adversely affect our business, financial condition, results of operations and cash flows.
Our ability to produce oil, natural gas and NGLs economically and in commercial quantities could be impaired if we are unable to acquire adequate supplies of water for our drilling operations or are unable to dispose of or recycle the water we use economically and in an environmentally safe manner. Development activities require the use of water. For example, the hydraulic fracturing process that we employ to produce commercial quantities of NGLs, natural gas and oil from many reservoirs requires the use and disposal of significant quantities of water in addition to the water we use to develop our waterflood in the GMBU. In certain regions, there may be insufficient local capacity to provide a source of water for drilling activities. In these cases, water must be obtained from other sources and transported to the drilling site, adding to the operating cost. Our inability to secure sufficient amounts of water, or to dispose of or recycle the water used in our operations, could adversely impact our operations in certain areas. Moreover, the imposition of new environmental initiatives and regulations could include restrictions on our ability to conduct certain operations, such as hydraulic fracturing or disposal of waste, including, but not limited to, produced water, drilling fluids and other materials associated with the exploration, development or production of NGLs, natural gas and oil. In recent history, public concern surrounding increased seismicity has heightened focus on our industry’s use of water in operations, which may cause increased costs, regulations or environmental initiatives impacting our use or disposal of water. See the risk factor "Legislation or regulatory initiatives intended to address seismic activity in Oklahoma and elsewhere could increase our costs of compliance or lead to operational delays, which could have a material adverse effect on our business, results of operations, cash flows or financial condition" for more information on action taken by certain states to regulate hydraulic fracturing activity with respect to induced seismicity. Furthermore, future environmental regulations governing the withdrawal, storage and use of surface water or groundwater necessary for hydraulic fracturing of wells could cause delays, interruptions or termination of operations, which may result in increased operating costs and have an effect on our business, results of operations, cash flows or financial condition.
The marketability of our production is dependent upon transportation and processing facilities over which we may have no control. The marketability of our production depends in part upon the availability, proximity and capacity of pipelines, natural gas gathering systems and processing facilities. We deliver oil, natural gas and NGLs through gathering systems and pipelines that we do not own. The lack of available capacity on these systems and facilities could reduce the price offered for our production or result in the shut-in of producing wells or the delay or discontinuance of development plans for properties. Although we have some contractual control over the transportation of our production through some firm transportation arrangements, third-party systems and facilities may be temporarily unavailable due to market conditions or mechanical or
other reasons, or may not be available to us in the future at a price that is acceptable to us. New regulations on the transportation of oil by rail, like those finalized by the U.S. Department of Transportation (DOT) in 2015, may increase our transportation costs. In addition, federal and state regulation of natural gas and oil production, processing and transportation, tax and energy policies, changes in supply and demand, pipeline pressures, damage to or destruction of pipelines, infrastructure or capacity constraints and general economic conditions could adversely affect our ability to produce, gather and transport natural gas. Any significant change in market factors or other conditions affecting these infrastructure systems and facilities, as well as any delays in constructing new infrastructure systems and facilities, could harm our business and, in turn, our financial condition, results of operations and cash flows.
We may be involved in legal proceedings that could result in substantial liabilities. Like many companies in the oil and gas industry, we are from time to time involved in various legal and other proceedings, such as title, royalty or contractual disputes, regulatory compliance matters and personal injury or property damage matters, in the ordinary course of our business. Such legal proceedings are inherently uncertain and their results cannot be predicted. Regardless of the outcome, such proceedings could have an adverse impact on us because of legal costs, diversion of management and other personnel and other factors. In addition, it is possible that a resolution of one or more such proceedings could result in liability, penalties or sanctions, as well as judgments, consent decrees or orders requiring a change in our business practices, which could materially and adversely affect our business, results of operations, cash flow and financial condition. Accruals for such liability, penalties or sanctions may be insufficient. Judgments and estimates to determine accruals or range of losses related to legal and other proceedings could change from one period to the next, and such changes could be material.
We are subject to complex laws and regulatory actions that can affect the cost, manner, feasibility or timing of doing business. Existing and potential regulatory actions could increase our costs and reduce our liquidity, delay our operations or otherwise alter the way we conduct our business. Exploration and development and the production and sale of oil, natural gas and NGLs are subject to extensive federal, state, provincial, tribal, local and international regulation. We may be required to make large expenditures to comply with environmental, natural resource protection, and other governmental regulations. Matters subject to regulation include the following, in addition to the other matters discussed under the caption "Regulation" in Items 1 and 2 of this report:
• | restrictions for the protection of wildlife that regulate the time, place and manner in which we conduct operations; |
• | the amounts, types and manner of substances and materials that may be released into the environment; |
• | response to unexpected releases into the environment; |
• | reports and permits concerning exploration, drilling, production and other operations; |
• | the placement and spacing of wells; |
• | cement and casing strength; |
• | unitization and pooling of properties; |
• | calculating royalties on oil and gas produced under federal and state leases; and |
• | taxation. |
Under these laws, we could be liable for personal injuries, property damage, oil spills, discharge of hazardous materials into the environment, remediation and clean-up costs, natural resource risk mitigation, damages and other environmental or habitat damages. We also could be required to install and operate expensive pollution controls, engage in environmental risk management, incur increased waste disposal costs, or limit or even cease activities on lands located within wilderness, wetlands or other environmentally or politically sensitive areas.
In addition, failure to comply with applicable laws also may result in the suspension or termination of our operations and subject us to administrative, civil and criminal penalties as well as the imposition of corrective action orders. Any such liabilities, penalties, suspensions, terminations or regulatory changes could have a material adverse effect on our business, financial condition, results of operations or cash flows.
The matters described above and other potential legislative proposals, along with any applicable legislation introduced and passed in Congress or new rules or regulations promulgated by state or the US federal government, could increase our costs, reduce our liquidity, delay our operations or otherwise alter the way we conduct our business, negatively impacting our financial condition, results of operations and cash flows. See also "— The potential adoption of federal, state, tribal and local
legislative and regulatory initiatives related to hydraulic fracturing could result in operating restrictions or delays in the completion of oil and gas wells."
Although it is not possible at this time to predict whether proposed legislation or regulations will be adopted as initially written, if at all, or how legislation or new regulation that may be adopted would impact our business, any such future laws and regulations could result in increased compliance costs or additional operating restrictions. Additional costs or operating restrictions associated with legislation or regulations could have a material adverse effect on our results of operations and cash flows, in addition to the demand for the oil, natural gas and NGLs that we produce.
Climate change laws and regulations restricting emissions of "greenhouse gases" could result in increased operating costs and reduced demand for the oil and natural gas that we produce while potential physical effects of climate change could disrupt our production and cause us to incur significant costs in preparing for or responding to those effects. In response to findings that emissions of carbon dioxide, methane and other greenhouse gases (GHGs) present an endangerment to public health and the environment, the EPA has adopted regulations under existing provisions of the federal Clean Air Act that, among other things address GHG emissions for certain sources.
Although it is not possible at this time to predict how legislation or new regulations that may be adopted to address GHG emissions would impact our business, any such future laws and regulations imposing reporting obligations on, or limiting emissions of GHGs from, our equipment and operations could require us to incur costs to reduce emissions of GHGs associated with our operations. Severe limitations on GHG emissions could also adversely affect demand for the oil, natural gas and NGLs we produce and lower the value of our reserves, which in turn could have a material adverse effect on our business, financial condition, results of operations or cash flows. Moreover, incentives to conserve energy or use alternative energy sources as a means of addressing climate change could reduce demand for natural gas, oil and NGL. Finally, it should be noted that some scientists have concluded that increasing concentrations of GHGs in the Earth’s atmosphere may produce climate changes that have significant physical effects, such as increased frequency and severity of storms, floods, droughts and other extreme climatic events; if any such effects were to occur, they could have an adverse effect on our exploration and production operations.
We could be adversely affected by the credit risk of financial institutions. We have exposure to different counterparties, and we have entered into transactions with counterparties in the financial services industry, including commercial banks, investment banks, insurance companies, investment funds and other institutions. In the event of default of a counterparty, we would be exposed to credit risks. Deterioration in the credit markets may impact the credit ratings of our current and potential counterparties and affect their ability to fulfill their existing obligations to us and their willingness to enter into future transactions with us. We have exposure to financial institutions in the form of derivative contracts and insurance companies in the form of claims under our policies. In addition, if any lender under our credit facility or our money market lines of credit is unable to fund its commitment, our liquidity will be reduced by an amount up to the aggregate amount of such lender’s commitment under our credit facility or our money market lines of credit.
We are exposed to counterparty credit risk as a result of our receivables. We are exposed to risk of financial loss from trade, joint venture, joint interest billing, and other receivables. We sell our oil, natural gas and NGLs to a variety of purchasers. Some of our purchasers and non-operating partners may experience credit downgrades or liquidity problems and may not be able to meet their financial obligations to us. Nonperformance by a trade creditor or non-operating partner could result in financial losses.
Federal legislation regarding swaps could adversely affect the costs of, or our ability to enter into, those transactions. Title VII of the Dodd-Frank Wall Street Reform and Consumer Protection Act (the Dodd-Frank Act), which was passed by Congress and signed into law in July 2010, amends the Commodity Exchange Act (CEA) to establish a comprehensive new regulatory framework for over-the-counter derivatives, or swaps, and swaps market participants, such as Newfield. The Dodd-Frank Act requires certain swaps to be cleared through a derivatives clearing organization, unless an exception from mandatory clearing is available, and if the swap is subject to a clearing requirement, to be executed on a designated contract market or swap execution facility. To date, the CFTC has designated certain interest rate swaps and credit default swaps for mandatory clearing. The CFTC has not yet required the clearing of any other classes of swaps, including commodity swaps. Although we expect to qualify for the end-user exception from the clearing requirement for our swaps entered into to hedge our commercial risks, the application of the mandatory clearing requirements to other market participants, such as swap dealers, along with changes to the markets for swaps as a result of the trade execution requirement, may change the cost and availability of the swaps we use for hedging. If any of our swaps do not qualify for the commercial end-user exception, or if the cost of entering into uncleared swaps becomes prohibitive, we may be required to clear such transactions or execute them on a derivatives contract market or swap execution facility. In addition, certain banking regulators and the CFTC have adopted final rules
establishing minimum margin requirements for uncleared swaps. Although we expect to qualify for the end-user exception from margin requirements for swaps entered into to hedge our commercial risks, the application of such requirements to other market participants, such as swap dealers, may change the cost and availability of the swaps we use for hedging. If any of our swaps do not qualify for the commercial end-user exception, the posting of collateral could reduce our liquidity and cash available for capital expenditures and could reduce our ability to manage commodity price volatility and the volatility in our revenues and cash flows. Therefore, we are unable to determine the future costs on our derivative activities at this time.
Higher costs associated with the Dodd-Frank Act can create disincentives for end-users like Newfield to hedge their commercial risks, including market price fluctuations associated with anticipated production of oil and gas. The Dodd-Frank Act and related rules and regulations promulgated by CFTC could potentially increase the cost of Newfield’s risk management activities, which could adversely affect our available liquidity, materially alter the terms of our swap contracts, reduce the availability of swaps to hedge or mitigate risks we encounter, reduce our ability to monetize or restructure existing swap contracts, and increase our regulatory compliance costs related to our swap activities. In addition, if we reduce our use of swaps, our results of operations and cash flows may be adversely affected, including by becoming more volatile and less predictable, which also could adversely affect our ability to plan for and fund capital expenditures. It is also possible that the Dodd-Frank Act and related rules and regulations could affect prices for commodities that we purchase, use or sell, which, in turn, could adversely affect our liquidity, revenues, cash flows and financial condition.
In December 2013, the CFTC re-proposed rules to amend the CEA to establish position limits for certain commodity futures and options contracts, and physical commodity swaps that are economically equivalent to such contracts, including those derivative instruments that we use. If the CFTC position limit regulations are ultimately adopted substantially in the form proposed, they could result in additional compliance costs and alter our ability to effectively manage our commercial risks. Until the CFTC adopts final rules with respect to position limits and any exemptions for bona fide derivative transactions or off-setting positions from those limits, we will be unable to determine whether the CFTC’s proposed rules could result in additional derivative costs or adversely affect our ability to effectively manage our commercial risks.
In addition, the European Union and other non-U.S. jurisdictions are implementing regulations with respect to the derivatives market. To the extent Newfield transacts with counterparties in foreign jurisdictions, we may become subject to such regulations. At this time, the impact of such regulations is not clear.
A substantial majority of our producing properties are located in the SCOOP and STACK areas of Oklahoma, making us vulnerable to risks associated with operating in a single geographic area. A substantial majority of our producing properties are geographically concentrated in the SCOOP and STACK areas of Oklahoma. At December 31, 2017, 70% of our total estimated proved reserves were attributable to properties located in these areas. As a result of this concentration, we may be disproportionately exposed to the impact of regional supply and demand factors, delays or interruptions of production from wells in these areas caused by governmental regulation, processing or transportation capacity constraints, market limitations, availability of equipment and personnel, water shortages or other drought related conditions or interruption of the processing or transportation of oil, natural gas or NGLs. Such delays or interruptions could have a material adverse effect on our financial condition and results of operations.
Additionally, in November 2018 voters are likely to consider a ballot measure that would raise gross production taxes on wells drilled on or after July 1, 2015, from the current rate of 2 percent for 36 months and 7 percent thereafter for the life of the well to a flat rate of 7 percent. Such an increase in taxes could affect the economic viability of future drilling locations and current wells, affect our operating income and costs, possibly resulting in reserve reductions and impairments, and could have a material adverse effect on the Company’s financial position, results of operations and cash flows.
Some of our undeveloped leasehold acreage is subject to leases that will expire unless production is established on the leases or units containing the leasehold acreage. For the year ended December 31, 2017, approximately 80% of our total net acreage was held by production. Leases on oil and gas properties normally have a term of three to five years and will expire unless, prior to expiration of the lease term, production in paying quantities is established. If the leases expire and we are unable to renew them, we will lose the right to develop the related properties. The risk of the foregoing increases in periods of sustained low commodity prices due to the corresponding impact on our drilling plans and the likely decrease in what is considered economic production under the leases. Our drilling plans for these areas are subject to change based upon various factors, including commodity prices, drilling results, the availability and cost of capital, drilling and production costs, the availability of drilling services and equipment, gathering system and pipeline transportation constraints and regulatory approvals.
Certain U.S. federal income tax deductions currently available with respect to natural gas and oil exploration and development may be eliminated as a result of future legislation. In past years, legislation has been proposed that would, if enacted into law, make significant changes to U.S. tax laws, including to certain key U.S. federal income tax provisions currently available to oil and gas companies. Such legislative changes have included, but not been limited to:
• | the repeal of the percentage depletion allowance for oil and natural gas properties; |
• | the elimination of current deductions for intangible drilling and development costs; |
• | the elimination of the deduction for certain domestic production activities; and |
• | an extension of the amortization period for certain geological and geophysical expenditures. |
Although these provisions were largely unchanged in the Tax Act, which was signed on December 22, 2017, Congress could consider, and could include, some or all of these proposals as part of future tax reform legislation, to accompany lower federal income tax rates. Moreover, other more general features of any additional tax reform legislation, including changes to cost recovery rules, may be developed that also would change the taxation of oil and gas companies. It is unclear whether these or similar changes will be enacted in future legislation and, if enacted, how soon any such changes could take effect. The passage of any legislation as a result of these proposals or any similar changes in U.S. federal income tax laws could eliminate or postpone certain tax deductions that currently are available with respect to oil and gas development or increase costs, and any such changes could have an adverse effect on the Company’s financial position, results of operations and cash flows.
We have risks associated with our China operations. Ownership of property interests and production operations in China are subject to the various risks inherent in international operations. These risks may include:
• | currency restrictions, exchange rate fluctuations, or other activities that disrupt markets and restrict payments or the movement of funds; |
• | loss of revenue, property and equipment as a result of hazards such as expropriation, nationalization, war, piracy, acts of terrorism, insurrection, civil unrest and other political risks or other changes in government; |
• | difficulties obtaining permits or governmental approvals as a foreign operator; |
• | taxation policies, including increases in taxes and governmental royalties, retroactive tax claims and investment restrictions; |
• | transparency issues in general and, more specifically, the U.S. Foreign Corrupt Practices Act and other anticorruption compliance laws and issues; |
• | disruptions in international oil cargo shipping activities; |
• | physical, digital, internal and external security breaches; |
• | forced renegotiation of, unilateral changes to, or termination of contracts with, governmental entities and quasi- governmental agencies; |
• | changes in laws and policies governing operations in China; |
• | our limited ability to influence or control the operation or future development of non-operated properties; |
• | the operator’s expertise or other labor problems; |
• | cultural differences; |
• | difficulties enforcing our rights against a governmental entity because of the doctrine of sovereign immunity and foreign sovereignty over our China operations; and |
• | other uncertainties arising out of foreign government sovereignty over our China operations. |
Our China operations also may be adversely affected by the laws and policies of the United States affecting foreign trade, taxation, investment and transparency issues. In addition, if a dispute arises with respect to our China operations, we may be subject to the exclusive jurisdiction of non-U.S. courts or may not be successful in subjecting non-U.S. persons to the jurisdiction of the courts of the United States. Realization of any of the factors listed above could materially and adversely affect our financial position, results of operations or cash flows.
Competition for, or the loss of, our senior management or experienced technical personnel may negatively impact our operations or financial results. To a large extent, we depend on the services of our senior management and technical personnel and the loss of any key personnel could have a material adverse effect on our business, financial condition, results of operations and cash flows. Our continued drilling success and the success of other activities integral to our operations will depend, in part, on our ability to attract and retain a seasoned management team and experienced explorationists, engineers, geologists and other professionals. In the past, competition for these professionals was strong, and in a continuing price recovery environment may become strong again, which could result in future retention and attraction issues.
Competition in the oil and gas industry is intense. We operate in a highly competitive environment for acquiring properties and marketing oil, natural gas and NGLs. Our competitors include multinational oil and gas companies, major oil and gas companies, independent oil and gas companies, individual producers, financial buyers as well as participants in other industries supplying energy and fuel to consumers. During these periods, there is often a shortage of drilling rigs and other oilfield services. Many of our competitors have greater and more diverse resources than we do. In addition, high commodity prices, asset valuations and stiff competition for acquisitions have in the past, and may in the future, significantly increase the cost of available properties. We compete for the personnel and equipment required to explore, develop and operate properties. Our competitors also may have established long-term strategic positions and relationships in areas in which we may seek new entry. As a consequence, our competitors may be able to address these competitive factors more effectively than we can. If we are not successful in our competition for oil and gas reserves or in our marketing of production, our financial condition, cash flows and results of operations may be adversely affected.
Shortages of oilfield equipment, services, supplies and qualified field personnel could adversely affect our financial condition, results of operations and cash flows. Historically, there have been shortages of drilling rigs, hydraulic fracturing stimulation equipment and crews, and other oilfield equipment as demand for that equipment has increased along with the number of wells being drilled. The demand for qualified and experienced field personnel to drill wells, conduct hydraulic fracturing stimulations and conduct field operations can fluctuate significantly, often in correlation with natural gas and oil prices, causing periodic shortages. These factors have caused significant increases in costs for equipment, services and personnel. Higher oil, natural gas, and NGL prices generally stimulate demand and result in increased prices for drilling rigs and crews, hydraulic fracturing stimulation equipment and crews and associated supplies, equipment, services and raw materials. Similarly, lower oil, natural gas and NGL prices generally result in a decline in service costs due to reduced demand for drilling and completion services.
Decreased levels of drilling activity in the oil and gas industry in recent periods have led to declining costs of some oilfield equipment, services and supplies. However, if the current oil and gas market changes, and commodity prices continue to recover, we may face shortages of field personnel, drilling rigs, hydraulic fracturing stimulation equipment and crews or other equipment or supplies, which could delay or adversely affect our exploration and development operations and have a material adverse effect on our business, financial condition, results of operations or cash flows, or restrict operations.
We may not be insured against all of the operating risks to which our business is exposed. Our operations are subject to all of the risks normally incident to the exploration for and the production of oil and natural gas, such as well blowouts, explosions, oil spills, releases of gas or well fluids, fires, pollution and adverse weather conditions, which could result in substantial losses to us. See also "— The oil and gas business involves many operating risks that can cause substantial losses." Exploration and production activities are also subject to risk from political developments such as terrorist acts, piracy, civil disturbances, war, expropriation or nationalization of assets, which can cause loss of or damage to our property. We maintain insurance against many, but not all, potential losses or liabilities arising from our operations in accordance with what we believe are customary industry practices and in amounts and at costs that we believe to be prudent and commercially practicable. Our insurance includes deductibles that must be met prior to recovery, as well as sub-limits and/or self-insurance. Additionally, our insurance is subject to exclusions and limitations. Our insurance does not cover every potential risk associated with our operations, including the potential loss of significant revenues. We can provide no assurance that our insurance coverage will adequately protect us against liability from all potential consequences, damages and losses.
We currently have insurance policies covering our onshore and offshore operations that include coverage for general liability, excess liability, physical damage to our oil and gas properties, operational control of wells, oil pollution, third- party liability, workers’ compensation and employers’ liability and other coverages. Consistent with insurance coverage generally available to the industry, our insurance policies provide limited coverage for losses or liabilities relating to pollution and other environmental issues, with broader coverage for sudden and accidental occurrences. For example, we maintain operators extra expense coverage provided by third-party insurers for obligations, expenses or claims that we may incur from a sudden incident that results in negative environmental effects, including obligations, expenses or claims related to seepage and pollution, cleanup and containment, evacuation expenses and control of the well (subject to policy terms and conditions). In the specific
event of a well blowout or out-of-control well resulting in negative environmental effects, such operators extra expense coverage would be our primary source of coverage, with the general liability and excess liability coverage referenced above also providing certain coverage.
In the event we make a claim under our insurance policies, we will be subject to the credit risk of the insurers. Volatility and disruption in the financial and credit markets may adversely affect the credit quality of our insurers and impact their ability to pay claims.
Further, we may elect not to obtain insurance if we believe that the cost of available insurance is excessive relative to the risks presented. Some forms of insurance may become unavailable in the future or unavailable on terms that we believe are economically acceptable. No assurance can be given that we will be able to maintain insurance in the future at rates that we consider reasonable, and we may elect to maintain minimal or no insurance coverage. If we incur substantial liability from a significant event and the damages are not covered by insurance or are in excess of policy limits, then we would have lower revenues and funds available to us for our operations, that could, in turn, have a material adverse effect on our business, financial condition, results of operations and cash flows.
We may face various risk associated with the long term trend toward increased activism against oil and gas exploration and development activities. Opposition toward oil and gas drilling and development activity has been growing globally. Companies in the oil and gas industry are often the target of activist efforts from both individuals and non-governmental organizations regarding safety, environmental compliance and business practices. Anti-development activists are working to, among other things, reduce access to federal and state government lands and delay or cancel certain projects such as the development of oil or gas shale plays. For example, environmental activists continue to advocate for increased regulations or bans on shale drilling and hydraulic fracturing in the United States, even in jurisdictions that are among the most stringent in their regulation of the industry. Future activist efforts could result in the following:
• | delay or denial of drilling permits; |
• | shortening of lease terms or reduction in lease size; |
• | restrictions on installation or operation of production, gathering or processing facilities; |
• | restrictions on the use of certain operating practices, such as hydraulic fracturing, or the disposal of related waste materials, such as hydraulic fracturing fluids and produced water; |
• | increased severance and/or other taxes; |
• | cyber-attacks; |
• | legal challenges or lawsuits; |
• | negative publicity about our business or the oil and gas industry in general; |
• | increased costs of doing business; |
• | reduction in demand for our products; and |
• | other adverse effects on our ability to develop our properties and expand production. |
We may need to incur significant costs associated with responding to these initiatives. Complying with any resulting additional legal or regulatory requirements that are substantial could have a material adverse effect on our business, financial condition, cash flows and results of operations.
We may be subject to risks in connection with acquisitions and divestitures. As part of our business strategy, we have made and will likely continue to make acquisitions of oil and gas properties and to divest non-strategic assets. Suitable acquisition properties or suitable buyers of our non-strategic assets may not be available on terms and conditions we find acceptable or not at all.
Acquisitions pose substantial risks to our business, financial condition, cash flows and results of operations. These risks include that the acquired properties may not produce revenues, reserves, earnings or cash flows at anticipated levels. Also, the integration of properties we acquire could be difficult. In pursuing acquisitions, we compete with other companies, many of which have greater financial and other resources. The successful acquisition of properties requires an assessment of several factors, including:
• | recoverable reserves; |
• | exploration potential; |
• | future oil, natural gas and NGL prices and their relevant differentials; |
• | operating costs and production taxes; and |
• | potential environmental and other liabilities. |
These assessments are complex and the accuracy of these assessments is inherently uncertain. In connection with these assessments, we perform a review of the subject properties that we believe to be generally consistent with industry practices. Our review will not reveal all existing or potential problems, nor will it permit us to become sufficiently familiar with the properties to fully assess their deficiencies and capabilities.
In addition, our divestitures may pose significant residual risks to the Company, such as divestitures where we retain certain liabilities or we have legal successor liability due to the bankruptcy or dissolution of the purchaser. See for example "— We may be responsible for decommissioning liabilities for offshore interests we no longer own." Generally, uneconomic or unsuccessful acquisitions and divestitures may divert management’s attention and financial resources away from our existing operations, which could have a material adverse effect on our financial condition, results of operations and cash flow.
We depend on computer and telecommunications systems, and failures in our systems or cyber security attacks could significantly disrupt our business operations. The oil and gas industry has become increasingly dependent upon digital technologies to conduct day-to-day operations including certain exploration, development and production activities. We have entered into agreements with third parties for hardware, software, telecommunications and other information technology services in connection with our business. In addition, we have developed proprietary software systems, management techniques and other information technologies incorporating software licensed from third parties. We depend on digital technology to estimate quantities of oil, natural gas and NGL reserves, process and record financial and operating data, analyze seismic and drilling information, and communicate with our employees and third party partners. Our business partners, including vendors, service providers, purchasers of our production and financial institutions, are also dependent on digital technology. It is possible we could incur interruptions from cyber security attacks, computer viruses or malware. We believe that we have positive relations with our related vendors and maintain adequate anti-virus and malware software and controls; however, any cyber incidents or interruptions to our arrangements with third parties, to our computing and communications infrastructure or our information systems could lead to data corruption, communication interruption, unauthorized release, gathering, monitoring, misuse or destruction of proprietary or other information, or otherwise significantly disrupt our business operations. As cyber threats continue to evolve, we may be required to expend significant additional resources to continue to modify or enhance our protective measures or to investigate and remediate any information security vulnerabilities.
Hurricanes, typhoons, tornadoes, earthquakes and other natural disasters could have a material adverse effect on our business, financial condition, results of operations and cash flow. Hurricanes, typhoons, tornadoes, earthquakes and other natural disasters can potentially destroy thousands of business structures and homes and, if occurring in the Gulf Coast region of the United States, could disrupt the supply chain for oil and gas products. Disruptions in supply could have a material adverse effect on our business, financial condition, results of operations and cash flow. Damages and higher prices caused by hurricanes, typhoons, tornadoes, earthquakes and other natural disasters could also have an adverse effect on our business, financial condition, results of operations and cash flow due to the impact on the business, financial condition, results of operations and cash flow of our customers.
Our certificate of incorporation, bylaws, some of our arrangements with employees and Delaware law contain provisions that could discourage an acquisition or change of control of us. Our certificate of incorporation and bylaws contain provisions that may make it more difficult to affect a change of control, to acquire us or to replace incumbent management, including, for example, limitations on stockholders’ ability to remove directors, call special meetings and to propose and nominate directors or otherwise propose actions for approval at stockholder meetings, as well as the ability of our board of directors to amend our certificate of incorporation and bylaws and to issue and set the terms of preferred stock without the approval of our stockholders. In addition, our change of control severance plan, change of control severance agreements with certain officers and our omnibus stock plans and deferred compensation plan contain provisions that provide for severance payments and accelerated vesting of benefits, including accelerated vesting of equity awards and acceleration of deferred compensation, upon a change of control. Section 203 of the Delaware General Corporation Law also imposes restrictions on mergers and other business combinations between us and any holder of 15% or more of our outstanding common stock. These provisions could discourage or prevent a change of control, even if it may be beneficial to our stockholders, or could reduce the price our stockholders receive in an acquisition of us.
Delays in obtaining licenses, permits, and other government authorizations required to conduct our operations could adversely affect our business. Our operations require licenses, permits, and in some cases renewals of licenses and permits from various governmental authorities. Our ability to obtain, sustain or renew such licenses and permits on acceptable terms is subject to changes in regulations and policies and to the discretion of the applicable government agencies, among other factors. Our inability to obtain, or our loss of or denial of extension, to any of these licenses or permits could hamper our ability to produce income, revenues or cash flows from our operations.
We may incur losses as a result of title defects in the properties in which we invest. The existence of a material title deficiency can render a lease worthless and can adversely affect our results of operations and financial condition. While we typically obtain title opinions prior to commencing drilling operations on a lease or in a unit, the failure of title may not be discovered until after a well is drilled, in which case we may lose the lease and the right to produce all or a portion of the interest under the property.
As we continue to expand our operations in Oklahoma, North Dakota or Utah, we may operate within the boundaries of Native American reservations and become subject to certain tribal laws and regulations. An entirely separate and distinct set of laws and regulations applies to operators and other parties within the boundaries of Native American reservations in the United States. Various federal agencies within the U.S. Department of the Interior, particularly the Bureau of Indian Affairs, the Office of Natural Resources Revenue and Bureau of Land Management (BLM), and the EPA, together with each Native American tribe, promulgate and enforce regulations pertaining to oil and gas operations on Native American reservations. These regulations include lease provisions, environmental standards, tribal employment contractor preferences and numerous other matters.
Native American tribes are subject to various federal statutes and oversight by the Bureau of Indian Affairs and BLM. However, each Native American tribe is a sovereign nation and has the right to enact and enforce certain other laws and regulations entirely independent from federal, state and local statutes and regulations, as long as they do not supersede or conflict with such federal statutes. These tribal laws and regulations include various fees, taxes, requirements to employ Native American tribal members or use tribal owned service businesses and numerous other conditions that apply to lessees, operators and contractors conducting operations within the boundaries of a Native American reservation. Further, lessees and operators within a Native American reservation are often subject to the Native American tribal court system, unless there is a specific waiver of sovereign immunity by the Native American tribe allowing resolution of disputes between the Native American tribe and those lessees or operators to occur in federal or state court.
We therefore may become subject to various laws and regulations pertaining to Native American oil and gas leases, fees, taxes and other burdens, obligations and issues unique to oil and gas operations within Native American reservations. One or more of these Native American requirements, or delays in obtaining necessary approvals or permits necessary to operate on tribal lands pursuant to these regulations, may increase our costs of doing business on Native American tribal lands and have an impact on the economic viability of any well or project on those lands.
Item 1B. Unresolved Staff Comments
Not applicable.
Item 3. Legal Proceedings
We have been named as a defendant in a number of lawsuits and are involved in various other disputes, all arising in the ordinary course of our business, such as (a) claims from royalty owners for disputed royalty payments, (b) commercial disputes, (c) personal injury claims and (d) property damage claims. Although the outcome of these lawsuits and disputes cannot be predicted with certainty, we do not expect these matters to have a material adverse effect on our financial position, cash flows or results of operations.
On October 19, 2017, we received notice of a request for arbitration from SapuraKencana Petroleum Berhad (SapuraKencana), the purchaser of our Malaysian business in February 2014. SapuraKencana is asserting that the Company owes approximately $89 million in damages for breach of contract and for a tax indemnity, plus interest and legal and other costs. We filed our response to the request for arbitration in December 2017. We continue to be committed to fully contesting the claims and intend to vigorously defend the Company's interest.
In August 2016, the North Dakota Department of Health (NDDH) announced its intent to resolve alleged systemic violations of the North Dakota air pollution control laws, N.D.C.C. ch. 23-25, N.D. Admin. Code art. 33-15, the North Dakota State Implementation Plan, and those provisions of the federal Clean Air Act and its body of implementing regulations for which the NDDH has been delegated authority by the U.S. Environmental Protection Agency at certain facilities in North Dakota, including facilities owned and operated by the Company, through a voluntary Consent Decree process. The Company entered into a Consent Decree in February 2017 that includes a payment of civil penalties, imposes additional facility design review and, potentially, air permitting obligations, as well as enhanced maintenance and inspection program obligations, but does not contain any admission of liability. The Consent Decree was approved by the North Dakota District Court in Burleigh County on March 14, 2017. The Consent Decree is subject to termination upon consent from the NDDH that all obligations of the Consent Decree have been completed or after two years, the Company may petition the court for termination. The Company paid the penalty in September 2017, which was less than $1 million.
In addition, from time to time we receive notices of violation from governmental and regulatory authorities in areas in which we operate related to alleged violations of environmental statutes or rules and regulations promulgated thereunder. We cannot predict with certainty whether these notices of violation will result in fines or penalties, or if such fines or penalties are imposed, that they would individually or in the aggregate exceed $100,000. If any federal government fines or penalties are in fact imposed that are greater than $100,000, then we will disclose such fact in our subsequent filings.
Item 4. | Mine Safety Disclosures |
Not applicable.
Executive Officers of the Registrant
The following table sets forth the names, ages (as of February 15, 2018) and positions held by our executive officers. Our executive officers serve at the discretion of our Board of Directors.
Name | Age | Position | Total Years of Service with Newfield | |||
Lee K. Boothby | 56 | President, Chief Executive Officer and Chairman of the Board | 18 | |||
Lawrence S. Massaro | 54 | Executive Vice President and Chief Financial Officer | 7 | |||
Gary D. Packer | 55 | Executive Vice President and Chief Operating Officer | 22 | |||
George T. Dunn | 60 | Senior Vice President — Development | 25 | |||
John H. Jasek | 48 | Senior Vice President — Operations | 18 | |||
Stephen C. Campbell | 49 | Vice President — Investor Relations | 18 | |||
George W. Fairchild, Jr. | 50 | Chief Accounting Officer | 6 | |||
Timothy D. Yang | 45 | General Counsel and Corporate Secretary | 3 | |||
Matthew R. Vezza | 44 | Regional Vice President | 5 | |||
John D. Ford | 58 | Regional Vice President | 1 | |||
Lee K. Boothby was named Chairman of the Board of Directors in May 2010, Chief Executive Officer in May 2009 and President in February 2009. Prior to this, he was Senior Vice President — Acquisitions and Business Development. From 2002 to 2007, he was Vice President — Mid-Continent. From 1999 to 2001, Mr. Boothby was Vice President and Managing Director — Newfield Exploration Australia Ltd. and managed operations in the Timor Sea (divested in 2003) from Perth, Australia. Prior to joining Newfield in 1999, Mr. Boothby worked for Cockrell Oil Corporation, British Gas and Tenneco Oil Company. He previously served as a board member for America’s Natural Gas Alliance until 2015. He currently serves as a Board member of the American Exploration and Production Council and the American Petroleum Institute, where he serves on the Market Development Committee. He is a member of the Louisiana State University Craft & Hawkins Department of Petroleum Engineering Advisory Committee, the Society of Petroleum Engineers, the Independent Petroleum Association of America, the Rice University Jones Graduate School of Business Council of Overseers and the National Petroleum Council, where he serves on the Finance Committee. He holds a degree in Petroleum Engineering from Louisiana State University and a Master of Business Administration from Rice University.
Lawrence S. Massaro was named Executive Vice President and Chief Financial Officer in November 2013. Mr. Massaro is an integral part of Newfield’s executive team and provides oversight to the Company’s strategy, planning, business development, marketing, risk management, tax and accounting. Mr. Massaro has been with Newfield since March 2011, when he joined as Vice President of Corporate Development. Prior to joining Newfield, he was a Managing Director at J.P. Morgan in its oil and gas investment banking group. He has held a number of management and professional positions at various companies including Amerada Hess and British Petroleum. Mr. Massaro holds a degree in petroleum engineering from Texas A&M University and is a registered professional engineer in the state of Texas. He also holds a masters degree in business administration from Southern Methodist University.
Gary D. Packer was promoted to the position of Executive Vice President and Chief Operating Officer in May 2009. Prior thereto, he was promoted from Gulf of Mexico General Manager to Vice President — Rocky Mountains in November 2004. Mr. Packer joined the Company in 1995. Prior to joining Newfield, Mr. Packer worked for Amerada Hess Corporation in both the Rocky Mountains and Gulf of Mexico divisions. Prior to these roles, he worked for Tenneco Oil Company. Mr. Packer currently serves as Chairman of the Pennsylvania State University Petroleum and Natural Gas Engineering Industrial and Professional Advisory Council. He also serves as a board member for the Independent Petroleum Association of America and as Chairman of Panther Creek Inspiration Ranch. He holds a degree in Petroleum and Natural Gas Engineering from Pennsylvania State University.
George T. Dunn was promoted to Senior Vice President — Development in September 2012, previously serving as Vice President — Mid-Continent beginning in October 2007. He managed our onshore Gulf Coast operations from 2001 to October 2007, and was promoted from General Manager to Vice President in November 2004. Before managing our Gulf Coast operations, Mr. Dunn was the General Manager of our Western Gulf of Mexico division. Prior to joining Newfield in 1992,
Mr. Dunn was employed by Meridian Oil Company and Tenneco Oil Company. He holds a degree in Petroleum Engineering from the Colorado School of Mines.
John H. Jasek was promoted to Senior Vice President — Operations in October of 2014, after serving as Vice President — Onshore Gulf Coast since February 2011. Prior to that, Mr. Jasek served as Vice President — Gulf of Mexico from December 2008 until February 2011 and as Vice President — Gulf Coast from October 2007 until December 2008. He previously managed our Gulf of Mexico operations from March 2005 until October 2007, and was promoted from General Manager to Vice President — Gulf of Mexico in November 2006. Prior to March 2005, he was a petroleum engineer in the Western Gulf of Mexico. Before joining Newfield, Mr. Jasek worked for Anadarko Petroleum Corporation and Amoco Production Company. He has a degree in Petroleum Engineering from Texas A&M University.
Stephen C. Campbell was promoted to Vice President — Investor Relations in December 2005, after serving as Newfield’s Manager — Investor Relations since 1999. Prior to joining Newfield, Mr. Campbell was the Investor Relations Manager at Anadarko Petroleum Corporation from 1993 to 1999 and the Assistant Vice President of Marketing & Communications at United Way, Texas Gulf Coast from 1990 to 1993. He is a member of the National Investor Relations Institute. He holds a Bachelor of Science degree in Journalism from Texas A&M University.
George W. Fairchild, Jr. was named Chief Accounting Officer in November 2013. Mr. Fairchild joined Newfield in August of 2012 as Controller and has served as the Company’s Principal Accounting Officer since joining the Company. Prior to joining Newfield, Mr. Fairchild served as Controller for Sheridan Production Company LLC, a privately-held oil and gas company, beginning in 2009 and was Vice President and Controller of Davis Petroleum Corporation, also a privately-held oil and gas company, from 2006 to 2009. Prior thereto, Mr. Fairchild was with Burlington Resources Inc., a publicly-held oil and gas company, serving as Senior Manager — Accounting Policy & Research from 2001 to 2006 and Manager — Internal Audit from 2000 to 2001. Before joining Burlington Resources Inc., he was with PricewaterhouseCoopers LLP from 1993 to 2000. Mr. Fairchild served in the U.S. Air Force from 1986 to 1990. He holds a Bachelor of Business Administration in Accounting from The University of Texas at Austin and is a Certified Public Accountant in the state of Texas.
Timothy D. Yang joined Newfield as General Counsel and Corporate Secretary in July 2015. Prior to joining Newfield, Mr. Yang served as Senior Vice President, Land & Legal, General Counsel, Chief Compliance Officer and Secretary of Sabine Oil & Gas Corporation from December 2014 to July 2015. Mr. Yang was previously promoted to Senior Vice President, General Counsel, Chief Compliance Officer and Secretary in February 2013 after beginning service at Sabine in 2011 as Vice President, General Counsel and Secretary. Prior to Sabine, Mr. Yang served as Associate General Counsel and Assistant Corporate Secretary for Eagle Rock Energy Partners, L.P. from 2009 to 2011. His legal experience covers both public and private companies within the energy and investment industries including Invesco Ltd./AIM Investments, Pogo Producing Company and AEI Services LLC. Mr. Yang holds a Bachelor of Arts in Biology from Trinity University, obtained his Juris Doctor from the University of Houston Law Center and is a member of the Texas and Kansas state bar associations.
Matthew R. Vezza began serving as Regional Vice President following the consolidation of the Company's Mid-Continent business unit in 2016. He was previously promoted to Vice President — Western Region in August of 2015 when the Company's Onshore Gulf Coast and Rocky Mountain business units were combined. He served as Vice President — Rocky Mountains beginning in June of 2014. Mr. Vezza joined Newfield in August 2012 as General Manager of our Rocky Mountains business unit after 16 years with Marathon Oil Company. Mr. Vezza began his career at Marathon in 1996 as a production engineer and then moved through the organization in various technical and managerial roles in Oklahoma, Texas, Louisiana, Colorado and Wyoming. While at Marathon, Mr. Vezza's last position, from August 2009 to August 2012, was serving as Asset Manager - Wyoming. Mr. Vezza is a member of the Society of Petroleum Engineers and holds a Bachelor of Science in Petroleum and Natural Gas Engineering from Penn State University.
John D. Ford began serving as Regional Vice President in June 2017. He is responsible for managing Newfield’s assets in its Anadarko Basin STACK play and in the Arkoma Basin of Oklahoma. A 35-year veteran of the oil and gas industry, Mr. Ford joined Newfield from Anadarko Petroleum Corporation where he most recently served as Vice President of Exploration and Production Services. While at Anadarko, Mr. Ford held a number of senior level roles including Vice President of Operations – West Texas; General Manager – Wattenberg Field, Colorado; and Director of Global Portfolio Planning and Reserves Administration. He started his career with Sun Exploration and Production Company before moving to Oryx Energy Corporation; Amerada – Hess Corporation; and Kerr McGee Corporation. Mr. Ford holds a B.S. in petroleum engineering from Texas A&M University. He also attended the United States Military Academy, West Point, NY, and is a member of the Society of Petroleum Engineers.
PART II
Item 5. | Market for Registrant’s Common Equity, Related Stockholder Matters and Issuer Purchases of Equity Securities |
Market for Common Stock
Our common stock is listed on the New York Stock Exchange (NYSE) under the symbol "NFX." The following table sets forth, for each of the periods indicated, the high and low reported sales price of our common stock on the NYSE.
High | Low | |||||||
2016: | ||||||||
First Quarter | $ | 34.97 | $ | 20.84 | ||||
Second Quarter | 44.79 | 30.88 | ||||||
Third Quarter | 47.56 | 39.25 | ||||||
Fourth Quarter | 50.00 | 37.17 | ||||||
2017: | ||||||||
First Quarter | $ | 43.74 | $ | 33.00 | ||||
Second Quarter | 37.61 | 27.22 | ||||||
Third Quarter | 30.05 | 24.41 | ||||||
Fourth Quarter | 33.33 | 27.77 | ||||||
2018: | ||||||||
First Quarter (through February 15, 2018) | $ | 35.20 | $ | 24.56 | ||||
On February 15, 2018, the last reported sales price of our common stock on the NYSE was $25.69. As of that date, there were 1,338 record holders of our common stock.
Dividends
We have not paid any cash dividends on our common stock and do not intend to do so in the foreseeable future. We intend to retain earnings for the future operation and development of our business. Any future cash dividends to holders of our common stock would depend on future earnings, capital requirements, our financial condition and other factors determined by our Board of Directors. The covenants contained in our credit facility and in the indentures governing our 5¾% Senior Notes due 2022, our 5⅝% Senior Notes due 2024 and our 5⅜% Senior Notes due 2026 could restrict our ability to pay cash dividends. See "Contractual Obligations" under Item 7 of this report and Note 11, "Debt," to our consolidated financial statements in Item 8 of this report.
Issuer Purchases of Equity Securities
The following table sets forth certain information with respect to repurchases of our common stock during the three months ended December 31, 2017.
Period | Total Number of Shares Purchased(1) | Average Price Paid per Share | Total Number of Shares Purchased as Part of Publicly Announced Plans or Programs | Maximum Number (or Approximate Dollar Value) of Shares that May Yet be Purchased under the Plans or Programs | |||||||
October 1 — October 31, 2017 | 4,313 | $ | 29.40 | — | — | ||||||
November 1 — November 30, 2017 | 8,025 | 31.14 | — | — | |||||||
December 1 — December 31, 2017 | 6,873 | 31.35 | — | — | |||||||
Total | 19,211 | $ | 30.82 | — | — | ||||||
_________________
(1) | All of the shares repurchased were surrendered by employees to pay tax withholding upon the vesting of restricted stock awards and restricted stock units. These repurchases were not part of a publicly announced program to repurchase shares of our common stock. |
See information incorporated by reference in Note 15, "Stock-Based Compensation," to our consolidated financial statements in Item 8 of this report and Item 12 of this report regarding securities authorized for issuance under the Company's equity compensation plans.
Stockholder Return Performance Presentation
The performance presentation below is furnished pursuant to applicable rules of the SEC. As required by these rules, the performance graph was prepared based upon the following assumptions:
• | $100 was invested in our common stock, the S&P 500 Index, the S&P Oil & Gas Exploration & Production Select Industry Index and our peer group on December 31, 2012, at the closing price on such date; |
• | Investment in our peer group was weighted based on the stock market capitalization of each individual company within the peer group at the beginning of the period; and |
• | Dividends were reinvested on the relevant payment dates. |
Peer Group. Our peer group consists of Bill Barrett Corporation, Carrizo Oil & Gas, Inc., Concho Resources Inc., Chesapeake Energy Corporation, Cimarex Energy Co., Continental Resources Inc., Devon Energy Corporation, Energen Corp., EP Energy Corp., Jones Energy, Marathon Oil Corporation, Matador Resources Company, Noble Energy, Inc., PDC Energy, Pioneer Natural Resources Company, QEP Resources Inc., SM Energy Co., Whiting Petroleum Corporation and WPX Energy Inc.
Comparison of Five-Year Cumulative Total Return
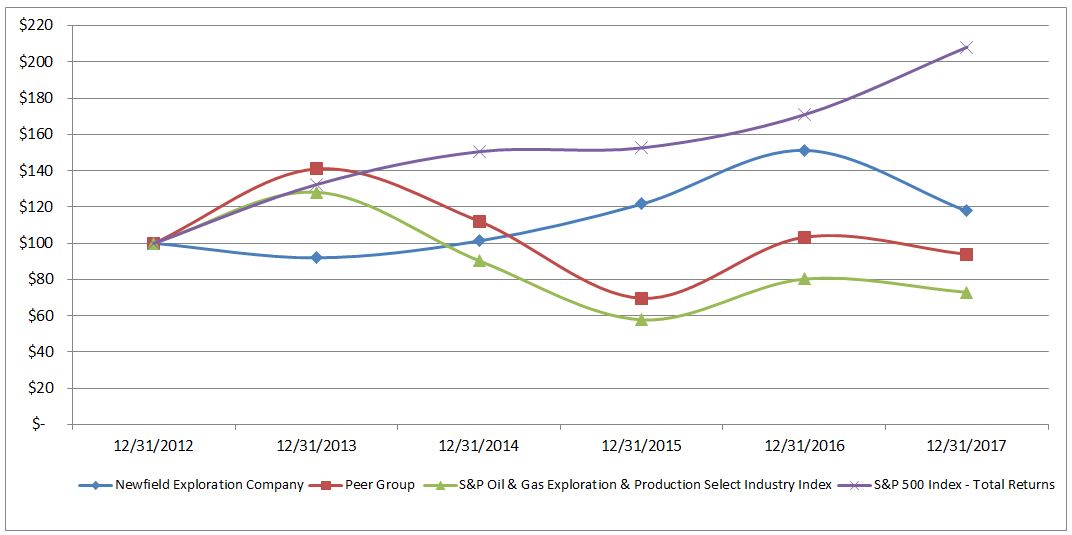
Total Return Analysis | 12/31/2012 | 12/31/2013 | 12/31/2014 | 12/31/2015 | 12/31/2016 | 12/31/2017 | ||||||||||||||||||
Newfield Exploration Company | $ | 100.00 | $ | 91.97 | $ | 101.27 | $ | 121.58 | $ | 151.23 | $ | 117.74 | ||||||||||||
Peer Group | 100.00 | 140.99 | 112.11 | 69.65 | 103.34 | 93.90 | ||||||||||||||||||
S&P Oil & Gas Exploration & Production Select Industry Index | 100.00 | 128.15 | 90.38 | 57.80 | 80.23 | 72.96 | ||||||||||||||||||
S&P 500 Index - Total Returns | 100.00 | 132.39 | 150.51 | 152.59 | 170.84 | 208.14 | ||||||||||||||||||
Item 6. Selected Financial Data
SELECTED FIVE-YEAR FINANCIAL DATA
The following table shows selected consolidated financial data derived from our consolidated financial statements set forth in Item 8 of this report. The data should be read in conjunction with Items 1 and 2, "Business and Properties," and Item 7, "Management’s Discussion and Analysis of Financial Condition and Results of Operations," of this report.
Year Ended December 31, | |||||||||||||||||||||
2017 | 2016 | 2015 | 2014 | 2013 | |||||||||||||||||
(In millions, except per share data) | |||||||||||||||||||||
Statement of Operations Data: | |||||||||||||||||||||
Oil, gas and NGL revenues(1) | $ | 1,767 | $ | 1,472 | $ | 1,557 | $ | 2,288 | $ | 1,857 | |||||||||||
Income (loss) from continuing operations | 427 | (1,230 | ) | (3,362 | ) | 650 | 73 | ||||||||||||||
Net income (loss) | 427 | (1,230 | ) | (3,362 | ) | 900 | 147 | ||||||||||||||
Earnings (loss) per share: | |||||||||||||||||||||
Diluted: | |||||||||||||||||||||
Income (loss) from continuing operations | $ | 2.13 | $ | (6.36 | ) | $ | (21.18 | ) | $ | 4.71 | $ | 0.39 | |||||||||
Earnings (loss) per share | 2.13 | (6.36 | ) | (21.18 | ) | 6.52 | 0.94 | ||||||||||||||
Weighted-average number of shares outstanding for diluted earnings (loss) per share | 200 | 193 | 159 | 138 | 136 | ||||||||||||||||
Balance Sheet Data (at end of period): | |||||||||||||||||||||
Total assets | $ | 4,961 | $ | 4,312 | $ | 4,768 | $ | 9,580 | $ | 9,297 | |||||||||||
Long-term debt | 2,434 | 2,431 | 2,467 | 2,874 | 3,670 | ||||||||||||||||
_________________
(1) | Continuing operations only (excludes Malaysia, which was sold in February 2014). |
Item 7. Management’s Discussion and Analysis of Financial Condition and Results of Operations
Overview
We are an independent energy company engaged in the exploration, development and production of crude oil, natural gas and natural gas liquids. Our U.S. operations are onshore and focus primarily on large scale, liquids-rich resource plays in the Anadarko and Arkoma basins of Oklahoma, the Williston Basin of North Dakota and the Uinta Basin of Utah. In addition, we have a producing oil field offshore China.
To maintain and grow our production and cash flows, we must continue to develop existing proved reserves and locate or acquire new oil and natural gas reserves to replace produced reserves. Our revenues, profitability, cash flows and future growth depend substantially on prevailing prices for oil, natural gas and NGLs and on our ability to find, acquire and develop oil and natural gas reserves that are economically recoverable. Prices for oil, natural gas and NGLs fluctuate widely and affect:
•the amount of cash flows available for capital investments;
•our ability to borrow and raise additional capital; and
•the quantity of oil, natural gas and NGLs that we can economically produce.
For a summary of our 2017 highlights and outlook for 2018 see Item 1 of this report.
Results of Operations
Consolidated Revenues and Production. Revenues for the year ended December 31, 2017 reflect a partial reversal of commodity price decreases that started in late 2014. After experiencing lower realized prices for oil and natural gas in 2015 and 2016, which negatively impacted revenues during those periods, prices strengthened in 2017 resulting in an increase in consolidated revenues of approximately $388 million versus 2016. Partially offsetting the impact of higher realized prices on 2017 revenues was a decrease in production in China due to the sale of our interest in the Bohai Bay field in May of 2017, and natural declines in our Pearl field, combined with the mid-year suspension of production in the field due to a mechanical issue associated with the third-party operated FPSO. Domestic production increased 3% in 2017 compared to 2016 and 8% in 2016 compared to 2015.
The average oil price we received decreased from 2015 through late 2016 primarily due to continued high global petroleum inventories and strong supply growth from OPEC. Oil prices began to improve in late 2016 following OPEC’s decision to curb production for the first six months of 2017, and with the announcement in May 2017 that these production cuts would extend into 2018. Furthermore, the domestic oil markets have rebounded despite the rise in U.S. shale oil supply due to strengthening in the U.S. and global economies. NGL prices rebounded significantly in 2017 due to increased propane exports which led to lower U.S.inventory levels. Natural gas prices partially recovered in 2017 due to inventory draw downs caused by greater exports and growth in industrial demand.
Domestic production increases over the three-year period were primarily the result of our drilling programs in the Anadarko Basin, partially offset by the sale of our Texas assets in 2016 and the natural declines in areas where drilling activity has been reduced or eliminated.
The following table reflects our production/liftings and average realized commodity prices (excluding the impact of commodity derivative gains and losses):
2015 | Price Variance | Production Variance | 2016 | Price Variance | Production Variance | 2017 | |||||||||||||||||||||
Domestic:(1) | |||||||||||||||||||||||||||
Crude oil and condensate | |||||||||||||||||||||||||||
Price (per Bbl) | $ | 39.89 | $ | (3.50 | ) | $ | 36.39 | $ | 9.63 | $ | 46.02 | ||||||||||||||||
Production (MBbls) | 21,346 | (374 | ) | 20,972 | 1,352 | 22,324 | |||||||||||||||||||||
Crude oil and condensate revenues | $ | 852 | $ | (74 | ) | $ | (15 | ) | $ | 763 | $ | 215 | $ | 50 | $ | 1,028 | |||||||||||
Natural gas | |||||||||||||||||||||||||||
Price (per Mcf) | $ | 2.40 | $ | (0.22 | ) | $ | 2.18 | $ | 0.52 | $ | 2.70 | ||||||||||||||||
Production (Bcf) | 116.3 | 13.6 | 129.9 | (4.3 | ) | 125.6 | |||||||||||||||||||||
Natural gas revenues | $ | 279 | $ | (28 | ) | $ | 33 | $ | 284 | $ | 64 | $ | (9 | ) | $ | 339 | |||||||||||
Natural gas liquids | |||||||||||||||||||||||||||
Price (per Bbl) | $ | 18.40 | $ | 0.65 | $ | 19.05 | $ | 7.97 | $ | 27.02 | |||||||||||||||||
Production (MBbls) | 8,553 | 2,167 | 10,720 | 842 | 11,562 | ||||||||||||||||||||||
Natural gas liquids revenues | $ | 157 | $ | 7 | $ | 40 | $ | 204 | $ | 92 | $ | 16 | $ | 312 | |||||||||||||
Total Domestic | |||||||||||||||||||||||||||
Price (per BOE) | $ | 26.14 | $ | (2.68 | ) | $ | 23.46 | $ | 7.16 | $ | 30.62 | ||||||||||||||||
Production (MBOE) | 49,277 | 4,067 | 53,344 | 1,473 | 54,817 | ||||||||||||||||||||||
Total domestic oil and gas revenues | $ | 1,288 | $ | (95 | ) | $ | 58 | $ | 1,251 | $ | 371 | $ | 57 | $ | 1,679 | ||||||||||||
China:(2) | |||||||||||||||||||||||||||
Crude oil and condensate | |||||||||||||||||||||||||||
Price (per Bbl) | $ | 48.50 | $ | (8.15 | ) | $ | 40.35 | $ | 10.12 | $ | 50.47 | ||||||||||||||||
Production/liftings (MBbls) | 5,399 | (29 | ) | 5,370 | (3,658 | ) | 1,712 | ||||||||||||||||||||
China oil and condensate revenues | $ | 262 | $ | (44 | ) | $ | (1 | ) | $ | 217 | $ | 17 | $ | (148 | ) | $ | 86 | ||||||||||
Total: | |||||||||||||||||||||||||||
Crude oil and condensate | |||||||||||||||||||||||||||
Price (per Bbl) | $ | 41.63 | $ | (4.43 | ) | $ | 37.20 | $ | 9.13 | $ | 46.33 | ||||||||||||||||
Production/liftings (MBbls) | 26,745 | (403 | ) | 26,342 | (2,306 | ) | 24,036 | ||||||||||||||||||||
Crude oil and condensate revenues | $ | 1,114 | $ | (118 | ) | $ | (16 | ) | $ | 980 | $ | 232 | $ | (98 | ) | $ | 1,114 | ||||||||||
Natural gas | |||||||||||||||||||||||||||
Price (per Mcf) | $ | 2.40 | $ | (0.22 | ) | $ | 2.18 | $ | 0.52 | $ | 2.70 | ||||||||||||||||
Production (Bcf) | 116.3 | 13.6 | 129.9 | (4.3 | ) | 125.6 | |||||||||||||||||||||
Natural gas revenues | $ | 279 | $ | (28 | ) | $ | 33 | $ | 284 | $ | 64 | $ | (9 | ) | $ | 339 | |||||||||||
Natural gas liquids | |||||||||||||||||||||||||||
Price (per Bbl) | $ | 18.40 | $ | 0.65 | $ | 19.05 | $ | 7.97 | $ | 27.02 | |||||||||||||||||
Production (MBbls) | 8,553 | 2,167 | 10,720 | 842 | 11,562 | ||||||||||||||||||||||
Natural gas liquids revenues | $ | 157 | $ | 7 | $ | 40 | $ | 204 | $ | 92 | $ | 16 | $ | 312 | |||||||||||||
Total consolidated | |||||||||||||||||||||||||||
Price (per BOE) | $ | 28.35 | $ | (3.35 | ) | $ | 25.00 | $ | 6.22 | $ | 31.22 | ||||||||||||||||
Production/liftings (MBOE) | 54,676 | 4,038 | 58,714 | (2,185 | ) | 56,529 | |||||||||||||||||||||
Total consolidated oil and gas revenues | $ | 1,550 | $ | (139 | ) | $ | 57 | $ | 1,468 | $ | 388 | $ | (91 | ) | $ | 1,765 | |||||||||||
_________________
(1) | Excludes natural gas produced and consumed in operations of 4.5 Bcf in 2017, 5.3 Bcf in 2016 and 7.7 Bcf in 2015. |
(2) | Represents our net share of volumes sold regardless of when produced. |
Operating Expenses.
Year ended December 31, 2017 compared to December 31, 2016
The following table presents information about operating expenses:
Unit-of-Production | Total Amount | |||||||||||||||||||||
Year Ended December 31, | Percentage Increase (Decrease) | Year Ended December 31, | Percentage Increase (Decrease) | |||||||||||||||||||
2017 | 2016 | 2017 | 2016 | |||||||||||||||||||
(Per BOE) | (In millions) | |||||||||||||||||||||
Domestic: | ||||||||||||||||||||||
Lease operating | $ | 3.42 | $ | 3.55 | (4 | )% | $ | 188 | $ | 189 | (1 | )% | ||||||||||
Transportation and processing | 5.48 | 5.09 | 8 | % | 300 | 272 | 11 | % | ||||||||||||||
Production and other taxes | 1.16 | 0.77 | 50 | % | 64 | 41 | 54 | % | ||||||||||||||
Depreciation, depletion and amortization | 8.07 | 8.58 | (6 | )% | 443 | 458 | (3 | )% | ||||||||||||||
General and administrative | 3.54 | 3.84 | (8 | )% | 194 | 205 | (5 | )% | ||||||||||||||
Ceiling test and other impairments | — | 18.04 | (100 | )% | — | 962 | (100 | )% | ||||||||||||||
Other | 0.10 | 0.38 | (74 | )% | 5 | 20 | (73 | )% | ||||||||||||||
Total operating expenses | 21.77 | 40.25 | (46 | )% | 1,194 | 2,147 | (44 | )% | ||||||||||||||
China: | ||||||||||||||||||||||
Lease operating | $ | 15.79 | $ | 10.31 | 54 | % | $ | 27 | $ | 55 | (51 | )% | ||||||||||
Production and other taxes | 0.18 | 0.15 | 23 | % | — | 1 | (61 | )% | ||||||||||||||
Depreciation, depletion and amortization | 14.14 | 21.17 | (33 | )% | 24 | 114 | (79 | )% | ||||||||||||||
General and administrative | 3.79 | 1.43 | >100% | 6 | 8 | (16 | )% | |||||||||||||||
Ceiling test impairment | — | 12.30 | (100 | )% | — | 66 | (100 | )% | ||||||||||||||
Other | 0.20 | — | >100% | 1 | — | (9 | )% | |||||||||||||||
Total operating expenses | 34.10 | 45.36 | (25 | )% | 58 | 244 | (76 | )% | ||||||||||||||
Total: | ||||||||||||||||||||||
Lease operating | $ | 3.80 | $ | 4.16 | (9 | )% | $ | 215 | $ | 244 | (12 | )% | ||||||||||
Transportation and processing | 5.31 | 4.62 | 15 | % | 300 | 272 | 11 | % | ||||||||||||||
Production and other taxes | 1.13 | 0.72 | 58 | % | 64 | 42 | 52 | % | ||||||||||||||
Depreciation, depletion and amortization | 8.25 | 9.74 | (15 | )% | 467 | 572 | (18 | )% | ||||||||||||||
General and administrative | 3.54 | 3.62 | (2 | )% | 200 | 213 | (6 | )% | ||||||||||||||
Ceiling test and other impairments | — | 17.51 | (100 | )% | — | 1,028 | (100 | )% | ||||||||||||||
Other | 0.10 | 0.35 | (71 | )% | 6 | 20 | (72 | )% | ||||||||||||||
Total operating expenses | 22.13 | 40.72 | (46 | )% | 1,252 | 2,391 | (48 | )% | ||||||||||||||
Domestic Operations. For the year ended December 31, 2017, total operating expenses per BOE decreased significantly compared to the year ended December 31, 2016 primarily due to ceiling test impairments in 2016. Other variances include:
• | Lease operating expense per BOE decreased 4% primarily due to an increased concentration of total production in STACK where operating costs are lower. Total lease operating expense was flat period over period due to increased production, higher well servicing costs in the Williston Basin and additional costs incurred to protect our wells against offset hydraulic fracturing operations by other operators in the Williston Basin, offset by the reduction of costs associated with the sale of our Texas assets in the third quarter of 2016. |
• | Transportation and processing expense per BOE increased 8% due to increased oil deficiency fees of $13 million in the Uinta Basin and higher utilization of oil pipelines in the STACK play, which allows us to transport oil to more favorable markets and thus receive a higher sales price. |
• | Production and other taxes per BOE increased 50% primarily due to higher commodity prices compared to 2016, combined with regulatory changes in Oklahoma that increased tax rates for certain wells effective July 2017 and December 2017. |
• | Depreciation, depletion and amortization (DD&A) per BOE decreased 6% primarily due to the impact of ceiling test impairments during the first half of 2016. |
• | General and administrative expense (G&A) decreased 5%, primarily due to reduction in workforce and restructuring charges recorded in 2016. This decrease was partially offset by increased stock compensation expense due to accelerated recognition of expense related to changes made to our qualified retirement plan during 2017. The following table presents information regarding G&A expenses for our domestic operations: |
Unit-of-Production | Total Amount | |||||||||||||||||||||
Year Ended December 31, | Percentage Increase (Decrease) | Year Ended December 31, | Percentage Increase (Decrease) | |||||||||||||||||||
2017 | 2016 | 2017 | 2016 | |||||||||||||||||||
(Per BOE) | (In millions) | |||||||||||||||||||||
G&A expense (net of amounts capitalized) | $ | 3.54 | $ | 3.84 | (8 | )% | $ | 194 | $ | 205 | (5 | )% | ||||||||||
Capitalized direct internal costs | 1.18 | 1.31 | (10 | )% | 65 | 70 | (7 | )% | ||||||||||||||
Gross G&A expense | 4.72 | 5.15 | (8 | )% | 259 | 275 | (6 | )% | ||||||||||||||
Other items affecting comparability: | ||||||||||||||||||||||
Reduction in workforce and restructuring(1) | $ | (0.03 | ) | $ | (0.53 | ) | (94 | )% | $ | (2 | ) | $ | (28 | ) | (94 | )% | ||||||
Total | 4.69 | 4.62 | 1 | % | 257 | 247 | 4 | % | ||||||||||||||
_________________
(1) | Includes severance costs for workforce reductions, as well as office-lease abandonment and other organizational restructuring costs related to the consolidation of our Denver, Houston and Tulsa offices into our headquarters in The Woodlands, Texas. See Note 17, "Restructuring Costs," to our consolidated financial statements in Item 8 of this report for additional details regarding our restructuring activities. |
• | During 2017, no ceiling test impairments were required. During 2016, we recorded ceiling test impairments of $962 million due to a net decrease in the discounted value of our proved reserves. |
• | Other operating expense decreased $15 million primarily due to the settlement of a lawsuit against the Company during the third quarter of 2016. See Note 12, "Commitments and Contingencies," to our consolidated financial statements in Item 8 of this report. |
China Operations. The primary components within our operating expenses are as follows:
• | Lease operating expense per BOE increased 54% primarily due to lower lifting volumes and higher production handling fees per BOE, which increase as oil prices increase. Total lease operating expense decreased 51% due to lower lifting volumes. |
• | DD&A expense per BOE decreased 33% primarily due to a reduction of our DD&A rate as a result of the ceiling test impairments during 2015 and the first half of 2016. |
• | During 2017, no ceiling test impairments were required. During the first half of 2016, we recorded non-cash ceiling test impairments of $66 million. |
Year ended December 31, 2016 compared to December 31, 2015
The following table presents information about our operating expenses:
Unit-of-Production | Total Amount | |||||||||||||||||||||
Year Ended December 31, | Percentage Increase (Decrease) | Year Ended December 31, | Percentage Increase (Decrease) | |||||||||||||||||||
2016 | 2015 | 2016 | 2015 | |||||||||||||||||||
(Per BOE) | (In millions) | |||||||||||||||||||||
Domestic: | ||||||||||||||||||||||
Lease operating | $ | 3.55 | $ | 4.69 | (24 | )% | $ | 189 | $ | 231 | (18 | )% | ||||||||||
Transportation and processing | 5.09 | 4.29 | 19 | % | 272 | 212 | 28 | % | ||||||||||||||
Production and other taxes | 0.77 | 0.91 | (15 | )% | 41 | 45 | (8 | )% | ||||||||||||||
Depreciation, depletion and amortization | 8.58 | 15.31 | (44 | )% | 458 | 754 | (39 | )% | ||||||||||||||
General and administrative | 3.84 | 4.80 | (20 | )% | 205 | 237 | (13 | )% | ||||||||||||||
Ceiling test and other impairments | 18.04 | 97.13 | (81 | )% | 962 | 4,786 | (80 | )% | ||||||||||||||
Other | 0.38 | 0.19 | 100 | % | 20 | 9 | >100% | |||||||||||||||
Total operating expenses | 40.25 | 127.32 | (68 | )% | 2,147 | 6,274 | (66 | )% | ||||||||||||||
China: | ||||||||||||||||||||||
Lease operating | $ | 10.31 | $ | 10.07 | 2 | % | $ | 55 | $ | 54 | 1 | % | ||||||||||
Production and other taxes | 0.15 | 0.15 | — | % | 1 | 1 | (2 | )% | ||||||||||||||
Depreciation, depletion and amortization | 21.17 | 30.09 | (30 | )% | 114 | 163 | (30 | )% | ||||||||||||||
General and administrative | 1.43 | 1.31 | 9 | % | 8 | 7 | 9 | % | ||||||||||||||
Ceiling test impairment | 12.30 | 21.84 | (44 | )% | 66 | 118 | (44 | )% | ||||||||||||||
Other | — | 0.21 | (100 | )% | — | 1 | (100 | )% | ||||||||||||||
Total operating expenses | 45.36 | 63.67 | (29 | )% | 244 | 344 | (29 | )% | ||||||||||||||
Total: | ||||||||||||||||||||||
Lease operating | $ | 4.16 | $ | 5.22 | (20 | )% | $ | 244 | $ | 285 | (14 | )% | ||||||||||
Transportation and processing | 4.62 | 3.87 | 19 | % | 272 | 212 | 28 | % | ||||||||||||||
Production and other taxes | 0.72 | 0.84 | (14 | )% | 42 | 46 | (8 | )% | ||||||||||||||
Depreciation, depletion and amortization | 9.74 | 16.77 | (42 | )% | 572 | 917 | (38 | )% | ||||||||||||||
General and administrative | 3.62 | 4.46 | (19 | )% | 213 | 244 | (13 | )% | ||||||||||||||
Ceiling test and other impairments | 17.51 | 89.69 | (80 | )% | 1,028 | 4,904 | (79 | )% | ||||||||||||||
Other | 0.35 | 0.19 | 84 | % | 20 | 10 | 98 | % | ||||||||||||||
Total operating expenses | 40.72 | 121.04 | (66 | )% | 2,391 | 6,618 | (64 | )% | ||||||||||||||
Domestic Operations. For the year ended December 31, 2016, total operating expenses per BOE decreased significantly compared to the year ended December 31, 2015. The primary reasons for the decrease follow:
• | Total LOE decreased 18% despite an 8% increase in total production due to our focus on cost-reduction initiatives in all basins. On a per BOE basis, LOE was 24% lower due to successful cost reduction efforts combined with our focused growth in the Anadarko Basin, which has lower operating costs than our other basins. |
• | Transportation and processing expense per BOE increased 19% primarily due to an increase in NGL and natural gas volumes produced of 25% and 12%, respectively. Additionally, oil transportation costs increased due to deficiency fees |
in the Uinta Basin (see further discussion below in "Contractual Obligations") and higher utilization of pipelines to transport oil in the STACK play and Williston Basin, which allows us to transport oil to more favorable markets and thus receive a higher net price.
• | Production and other taxes decreased 15% per BOE year over year primarily due to our 2016 development activities occurring in areas with lower production tax rates. |
• | DD&A expense per BOE decreased 44% primarily due to the impact of ceiling test impairments of $4.8 billion recorded in 2015 and $962 million recorded in the first half of 2016. |
• | G&A decreased 13%. G&A expenses for both years included capitalized direct internal costs and costs associated with workforce reductions and organizational restructuring. Excluding these items that affect comparability, gross G&A costs decreased 11% year over year, primarily due to cost savings initiatives including a more than 15% reduction of our workforce. The following table presents information regarding G&A expenses for our domestic operations: |
Unit-of-Production | Total Amount | |||||||||||||||||||||
Year Ended December 31, | Percentage Increase (Decrease) | Year Ended December 31, | Percentage Increase (Decrease) | |||||||||||||||||||
2016 | 2015 | 2016 | 2015 | |||||||||||||||||||
(Per BOE) | (In millions) | |||||||||||||||||||||
G&A expense (net of amounts capitalized) | $ | 3.84 | $ | 4.80 | (20 | )% | $ | 205 | $ | 237 | (13 | )% | ||||||||||
Capitalized direct internal costs | 1.31 | 1.52 | (14 | )% | 70 | 75 | (7 | )% | ||||||||||||||
Gross G&A expense | 5.15 | 6.32 | (19 | )% | 275 | 312 | (12 | )% | ||||||||||||||
Other items affecting comparability: | ||||||||||||||||||||||
Reduction in workforce and restructuring(1) | $ | (0.53 | ) | $ | (0.77 | ) | (32 | )% | $ | (28 | ) | $ | (39 | ) | (27 | )% | ||||||
SVAP program(2) | — | 0.05 | (100 | )% | — | 3 | (100 | )% | ||||||||||||||
Total | 4.62 | 5.60 | (17 | )% | 247 | 276 | (11 | )% | ||||||||||||||
_________________
(1) | Includes severance costs for workforce reductions, as well as office-lease abandonment and other organizational restructuring costs related to the consolidation of our Denver, Houston and Tulsa offices into our headquarters in The Woodlands, Texas. See Note 17, "Restructuring Costs," to our consolidated financial statements in Item 8 of this report for additional details regarding our restructuring activities. |
(2) | SVAP program decrease is associated with the decrease in the estimated fair value of the liability for our Stockholder Value Appreciation Program (SVAP), which ended December 31, 2015. |
• | During 2016, we recorded ceiling test impairments of $962 million due to a net decrease in the discounted value of our proved reserves. The decrease primarily resulted from a 15% decrease in crude oil SEC pricing and a 4% decrease in natural gas SEC pricing since December 31, 2015. During 2015, we recorded ceiling test impairments of $4.8 billion due to a net decrease in the discounted value of our proved reserves. The decrease primarily resulted from a 47% decrease in crude oil SEC pricing and a 40% decrease in natural gas SEC pricing since December 31, 2014. These commodity price decreases were partially offset by the impact of current service cost reductions on our cash flow estimates. |
• | Other operating expense increased $11 million primarily due to the settlement of a lawsuit against the Company during the third quarter of 2016. See Note 12, "Commitments and Contingencies," to our consolidated financial statements in Item 8 of this report. |
China Operations. The primary components within our operating expenses are as follows:
• | Lease operating expense remained flat year over year. |
• | DD&A expense per BOE decreased 30% primarily due to a reduction of our DD&A rate as a result of the ceiling test impairments during the first half of 2016. |
• | During 2016, we recorded non-cash ceiling test impairments of $66 million due to a net decrease in the discounted value of our proved reserves. The decrease primarily resulted from a 15% decrease in crude oil SEC pricing since December 31, 2015. |
Interest Expense. The following table presents information about interest expense for each of the years ended
December 31. Interest expense associated with unproved oil and gas properties is capitalized into oil and gas properties.
2017 | 2016 | 2015 | ||||||||||
(In millions) | ||||||||||||
Gross interest expense: | ||||||||||||
Credit arrangements | $ | 9 | $ | 14 | $ | 10 | ||||||
Senior notes | 140 | 140 | 132 | |||||||||
Senior subordinated notes | — | — | 21 | |||||||||
Other | 1 | — | 1 | |||||||||
Total gross interest expense | 150 | 154 | 164 | |||||||||
Capitalized interest | (61 | ) | (51 | ) | (33 | ) | ||||||
Net interest expense | $ | 89 | $ | 103 | $ | 131 | ||||||
Gross interest expense decreased in 2017 as compared to 2016 due to $3 million of financing costs related to amending our revolving credit facility recognized in March 2016. Gross interest expense decreased in 2016 as compared to 2015 due to the April 2015 retirement of our $700 million aggregate principal of 6⅞% Senior Subordinated Notes due 2020 using the proceeds from the lower interest rate $700 million 5⅜% Senior Notes due 2026 issued in March 2015. See Note 11, "Debt," to our consolidated financial statements in Item 8 of this report.
Capitalized interest increased in 2017 over the previous two years due to a significant increase in the average amount of unproved oil and gas properties resulting from the acquisition of $398 million of unproved properties in June 2016.
Commodity Derivative Income (Expense). The fluctuations in commodity derivative income (expense) from period to period are due to the volatility of commodity prices and changes in our outstanding derivative contracts during these periods. The amount of unrealized gain (loss) on derivatives is the result of the change in the total fair value of our derivative positions from the prior year.
Year ended December 31, 2017
The $47 million loss recognized in "Commodity derivative income (expense)" in our 2017 consolidated statement of operations and comprehensive income is comprised of a $36 million realized gain and an $83 million unrealized loss. The unrealized loss is primarily attributable to the increase in oil and NGL prices between periods. During 2017, forward curve prices increased 2.6% for oil and 21.8% for propane. The components of the change in the fair value of our net derivative asset (liability) follow:
Positions Settled in 2017 | Positions Settling in 2018 and Thereafter | Total | ||||||||||
(In millions) | ||||||||||||
Net derivative asset (liability) at December 31, 2016 | $ | (22 | ) | $ | (3 | ) | $ | (25 | ) | |||
Change in fair value of settled positions | 58 | — | 58 | |||||||||
Realized settlements | (36 | ) | — | (36 | ) | |||||||
Change in fair value of outstanding positions | — | (105 | ) | (105 | ) | |||||||
Total unrealized gain (loss) | 22 | (105 | ) | (83 | ) | |||||||
Net derivative asset (liability) at December 31, 2017 | $ | — | $ | (108 | ) | $ | (108 | ) | ||||
Year ended December 31, 2016
The $191 million loss recognized in "Commodity derivative income (expense)" in our 2016 consolidated statement of operations and comprehensive income is comprised of a $201 million realized gain and a $392 million unrealized loss. The unrealized loss is primarily attributable to the increase in commodity prices between periods. Forward curve prices increased 21.6% for oil and 28.5% for natural gas for the year ended December 31, 2016. The components of the change in the fair value of our net derivative asset (liability) follow:
Positions Settled in 2016 | Positions Settling in 2017 and Thereafter | Total | ||||||||||
(In millions) | ||||||||||||
Net derivative asset (liability) at December 31, 2015 | $ | 272 | $ | 95 | $ | 367 | ||||||
Change in fair value of settled positions | (71 | ) | — | (71 | ) | |||||||
Realized settlements | (201 | ) | — | (201 | ) | |||||||
Change in fair value of outstanding positions | — | (120 | ) | (120 | ) | |||||||
Total unrealized gain (loss) | (272 | ) | (120 | ) | (392 | ) | ||||||
Net derivative asset (liability) at December 31, 2016 | $ | — | $ | (25 | ) | $ | (25 | ) | ||||
Tax reform. On December 22, 2017, the United States (U.S.) enacted the Tax Cuts and Jobs Act (the Tax Act), which made significant changes to U.S. federal income tax law affecting the Company. We expect that these changes will positively impact future after-tax earnings in the U.S., primarily due to the lower federal statutory tax rate. Set forth below is a discussion of certain provisions of the Tax Act and our assessment of the impact of such provisions on our results of operations, cash flows and consolidated financial statements.
• | Beginning January 1, 2018, our U.S. income will be taxed at the 21% federal corporate rate. Further, we were required to recognize the effect of this rate change on our deferred tax assets and liabilities in 2017, the period the tax rate change was enacted. We maintain a full valuation allowance on our net deferred tax asset balance, therefore the rate change resulted in a non-cash decrease to the deferred tax asset and a corresponding and offsetting decrease in the valuation allowance balances of approximately $199 million for the quarter ended December 31, 2017. |
• | The Tax Act also repealed the corporate alternative minimum tax (AMT) for tax years beginning January 1, 2018, and provides that existing AMT credit carryovers are refundable beginning in 2019. We had approximately $42 million of AMT credit carryovers at the end of 2017 that are expected to be fully refunded between 2019 and 2022. The valuation allowance related to this deferred tax asset was released and a noncurrent receivable was established, which resulted in a tax benefit of $42 million for the quarter ended December 31, 2017. |
• | Further, the Tax Act modified the taxation of foreign earnings and the utilization of foreign tax credits (FTCs). As of December 31, 3017, we had $408 million of FTCs that have no value under the Tax Act which resulted in a non-cash reduction to the deferred tax asset and a corresponding and offsetting decrease in the valuation allowance. |
The Tax Act is a comprehensive bill containing several other provisions, such as limitations on the deductibility of interest expense and certain executive compensation, that are not expected to materially affect us.
Taxes. The effective tax rates for the years ended December 31, 2017 and 2016 were (11)% and (2)%, respectively. Taxes for the year were impacted by our ability to monetize $19 million of the AMT credit carryover on the 2017 tax provision by an election to refund AMT credits in lieu of bonus depreciation. The Tax Act repealed the corporate AMT for tax years beginning January 1, 2018, and provides that any remaining AMT credit carryovers are refundable beginning in 2019. We had approximately $42 million of AMT credit carryovers at the end of 2017 that will be fully refunded between 2019 and 2022. The valuation allowance related to this deferred tax asset was released and a noncurrent receivable was established, which resulted in a tax benefit of $42 million for the year ended December 31, 2017. Also, included in the net tax benefit for the year were refunds of $17 million related to the carryback of net operating losses to previously filed U.S. federal returns.
Our effective tax rate differs from the federal statutory rate of 35% due to the change in valuation allowances, non-deductible expenses, state income taxes, the differences between international and U.S. federal statutory rates, and the impact of taxation of our China earnings in both the U.S and China. Our future effective tax rates may also be impacted by additional ceiling test impairments or other items which generate deferred tax assets, deferred tax asset valuation allowances, and/or reversal of such valuation allowances. Due to the ceiling test impairments of our oil and gas properties in prior periods, we
moved from a deferred tax liability position to a deferred tax asset position in most taxing jurisdictions. We have recorded a full valuation allowance against these deferred tax assets. We continue maintaining a full valuation allowance on our deferred tax assets until there is sufficient evidence to support adjusting the reversal of these allowances. Release of the valuation allowance would result in the recognition of certain deferred tax assets and a decrease to income tax expense in the period the release is recorded. However, the exact timing and amount of the valuation allowance release are subject to change on the basis of the level of profitability that we are able to actually achieve.
See the components of our income tax provision (benefit) below:
Year Ended December 31, | |||||||
2017 | 2016 | ||||||
(In millions) | |||||||
Alternative Minimum Tax credits | $ | (61 | ) | $ | (13 | ) | |
Carryback of net operating losses | (17 | ) | — | ||||
Provision to return adjustment | (1 | ) | — | ||||
China in-country tax expense (credits) | 1 | 22 | |||||
Current income tax provision (benefit) | (78 | ) | 9 | ||||
Oklahoma state deferred tax | 37 | 13 | |||||
Deferred tax expense (benefit) | 37 | 13 | |||||
Total income tax provision (benefit) | $ | (41 | ) | $ | 22 | ||
See Note 8, "Income Taxes" to our consolidated financial statements in Item 8 of this report for additional disclosures.
Liquidity and Capital Resources
We establish a capital budget at the beginning of each calendar year and review it during the course of the year. Our capital budgets (excluding acquisitions) are based upon our estimate of internally generated sources of cash, as well as cash on hand and the available borrowing capacity of our revolving credit facility and money market lines of credit.
We ended the year with $2.1 billion of liquidity consisting of a $1.8 billion undrawn credit facility and $326 million of cash and cash equivalents on hand.
We expect to finance our 2018 capital budget with cash flows from operations, and cash on hand. Should commodity prices significantly weaken, we may elect to curtail our investments to limit borrowings and preserve liquidity. Our 2018 capital budget, excluding estimated capitalized interest and direct internal costs of approximately $120 million, is expected to be approximately $1.3 billion, which reflects our current outlook for commodity prices in 2018.
Actual capital expenditure levels may vary significantly due to many factors, including drilling results; oil, natural gas and NGL prices; industry conditions; the prices and availability of goods and services; and the extent to which properties are acquired or non-strategic assets are sold. We continue to screen for attractive acquisition opportunities; however, the timing and size of acquisitions is unpredictable. We believe we have the operational flexibility to react quickly with our capital expenditures to changes in circumstances or fluctuations in our cash flows.
We continuously monitor our liquidity needs, coordinate our capital expenditure program with our expected cash flows and projected debt-repayment schedule, and evaluate our available alternative sources of liquidity, including accessing debt and equity capital markets in light of current and expected economic conditions. We believe that our liquidity position and ability to generate cash flows from our operations will be adequate to fund 2018 operations and continue to meet our other obligations. We may from time to time seek to retire or purchase our outstanding debt through cash purchases and/or exchanges for other debt or equity securities, in open market purchases, privately negotiated transactions or otherwise. Such repurchases or exchanges, if any, will depend on prevailing market conditions, our liquidity requirements, contractual restrictions and other factors. The amounts involved may be material.
Credit Arrangements and Other Financing Activities. We have a revolving credit facility that matures in June 2020 and provides borrowing capacity of $1.8 billion. We also have money market lines of credit which, subject to compliance with restrictive covenants in our credit facility, have available borrowing capacity of $125 million at December 31, 2017.
At December 31, 2017, we had no borrowings under our money market lines of credit or revolving credit facility and had no letters of credit outstanding. We have no scheduled maturities of senior notes until 2022. For a more detailed description of the terms of our credit arrangements and senior notes, see Note 11, "Debt," to our consolidated financial statements in Item 8 of this report.
Our credit facility has restrictive financial covenants that include the maintenance of a ratio of total debt to book capitalization not to exceed 0.6 to 1.0 and the maintenance of a ratio of earnings before gain or loss on the disposition of assets, interest expense, income taxes and certain non-cash items (such as depreciation, depletion and amortization expense, unrealized gains and losses on commodity derivatives and ceiling test impairments) to interest expense of at least 2.5 to 1.0. At December 31, 2017, we were in compliance with all of our debt covenants and do not foresee this changing in 2018.
As of February 15, 2018, we had no borrowings under our money market lines of credit or revolving credit facility and had no letters of credit outstanding.
Working Capital. Our working capital balance fluctuates primarily as a result of the timing and amount of borrowings or repayments under our credit arrangements, changes in the fair value of our outstanding commodity derivative instruments as well as the timing of receiving reimbursement of amounts paid by us for the benefit of joint venture partners. At December 31, 2017, we had negative working capital of $72 million compared to positive working capital of $265 million at December 31, 2016.
Cash Flows from Operations. Our primary source of capital and liquidity is cash flows provided by operations, which are primarily affected by the quantities of oil, natural gas and NGLs sold, as well as commodity prices.
Our net cash flows from operations were $952 million in 2017, $826 million in 2016 and $1.2 billion in 2015. The primary drivers of higher operating cash flows in 2017 were higher revenues as a result of higher commodity prices and higher production, partially offset by lower realized derivative gains.
Cash Flows from Investing Activities. Net cash used in investing activities was $1.2 billion, $1 billion and $1.6 billion in 2017, 2016 and 2015, respectively.
During 2017, we:
• | spent $1.156 billion for capital additions to oil and gas properties, an increase of $288 million compared to the same period of 2016 due to increased drilling activity in the Anadarko Basin; |
• | acquired additional interest in oil and gas properties of $110 million; |
• | divested $72 million of non-strategic domestic assets; |
• | redeemed a short-term certificate of deposit of $25 million; and |
• | divested our interest in the Bohai Bay field in China for approximately $32 million, including customary post-closing adjustments. |
For a more detailed description of the Bohai Bay divestiture, see Note 6, "Oil and Gas Properties," to our consolidated financial statements in Item 8 of this report.
During 2016, we reduced capital spending on oil and gas properties as compared to 2015 due to the economic environment for our industry, acquired additional properties in the Anadarko Basin STACK play for $476 million, subject to customary post-close adjustments and divested substantially all our oil and gas assets in Texas for approximately $380 million.
Cash Flows from Financing Activities. Net cash provided by (used in) financing activities was $(13) million, $715 million and $380 million in 2017, 2016 and 2015, respectively.
During 2016, we issued 34.5 million additional shares of common stock through a public equity offering for net proceeds of approximately $776 million.
During 2015, we:
• | issued 25.3 million additional shares of common stock through a public equity offering and received net proceeds of approximately $815 million, which we used primarily to repay all borrowings under our credit facility and money market lines of credit; and |
• | issued $700 million 5⅜% Senior Notes due 2026 through a public debt offering and received net proceeds of $691 million in March 2015. In April 2015, we used the proceeds and cash on hand to redeem our $700 million aggregate principal of our 6⅞% Senior Subordinated Notes due 2020. |
Restructuring
In April 2015 and May 2016, we announced plans to restructure our organization primarily in response to the commodity price environment and to improve margins, processes and cost efficiencies in operations. See Note 17, "Restructuring Costs," to our consolidated financial statements in Item 8 of this report for additional details regarding our restructuring activities.
Contractual Obligations
The table below summarizes our significant contractual obligations due by year as of December 31, 2017.
Total | 2018 | 2019 | 2020 | 2021 | 2022 | Thereafter | ||||||||||||||||||||||
(In millions) | ||||||||||||||||||||||||||||
Long-term debt: | ||||||||||||||||||||||||||||
5¾% Senior Notes due 2022 | $ | 750 | $ | — | $ | — | $ | — | $ | — | $ | 750 | $ | — | ||||||||||||||
5⅝% Senior Notes due 2024 | 1,000 | — | — | — | — | — | 1,000 | |||||||||||||||||||||
5⅜% Senior Notes due 2026 | 700 | — | — | — | — | — | 700 | |||||||||||||||||||||
Total long-term debt | 2,450 | — | — | — | — | 750 | 1,700 | |||||||||||||||||||||
Other obligations(1): | ||||||||||||||||||||||||||||
Interest payments | 908 | 137 | 137 | 137 | 137 | 116 | 244 | |||||||||||||||||||||
Asset retirement obligations | 133 | 3 | 5 | 46 | 6 | 2 | 71 | |||||||||||||||||||||
Operating leases and other(2) | 181 | 67 | 37 | 29 | 25 | 6 | 17 | |||||||||||||||||||||
Firm transportation | 336 | 79 | 78 | 31 | 21 | 21 | 106 | |||||||||||||||||||||
Total other obligations | 1,558 | 286 | 257 | 243 | 189 | 145 | 438 | |||||||||||||||||||||
Total contractual obligations | $ | 4,008 | $ | 286 | $ | 257 | $ | 243 | $ | 189 | $ | 895 | $ | 2,138 | ||||||||||||||
_________________
(1) | Excludes assets and liabilities associated with our derivative contracts, which are dependent on the commodity price at the time of the contract settlement. For a discussion regarding our derivative contracts, see Note 4, "Derivative Financial Instruments," to our consolidated financial statements in Item 8 of this report. |
(2) | Includes agreements for office space, drilling rigs and other equipment, as well as certain service contracts. The majority of these obligations relate to contracts for office space and drilling rigs and are included at the gross contractual value. Due to our various working interests where the drilling rig contracts will be utilized, it is not feasible to estimate a net contractual obligation. Net payments under these contracts are accounted for as capital additions to our oil and gas properties and could be less than the gross obligation disclosed. |
We have crude oil minimum volume delivery commitments that relate to our Uinta Basin production with two Salt Lake City, Utah refiners. One delivery commitment is for approximately 15,000 barrels of oil per day through May 2020. The second commitment is for 16,000 barrels of oil per day through August 2025. In the event that we are unable to meet our crude oil volume delivery commitments, we incur deficiency fees ranging from $3.50 to $6.50 per barrel. During 2017, we incurred $29 million of Uinta Basin deficiency fees. Based on forecasted production levels, we expect to incur $19 million in deficiency fees related to these delivery commitments in 2018. See Items 1 and 2, "Business and Properties" for a description of our production and proved reserves. As of December 31, 2017, our delivery commitments through 2025 were as follows:
Total | 2018 | 2019 | 2020 | 2021 | 2022 | Thereafter | |||||||||||||||
Oil (MBbls) | 58,951 | 12,220 | 11,315 | 8,136 | 5,840 | 5,840 | 15,600 | ||||||||||||||
Commitments under Joint Operating Agreements. Most of our properties are operated through joint ventures under joint operating or similar agreements. Typically, the operator under a joint operating agreement enters into contracts, such as drilling contracts, for the benefit of all joint venture partners. Through the joint operating agreement, the non-operators reimburse, and in some cases advance, the funds necessary to meet the contractual obligations entered into by the operator. These obligations are typically shared on a "working interest" basis. The joint operating agreement provides remedies to the operator if a non-operator does not satisfy its share of the contractual obligations. Occasionally, the operator is permitted by the joint operating agreement to enter into lease obligations and other contractual commitments that are then passed on to the non-operating joint interest owners as lease operating expenses, frequently without any identification as to the long-term nature of any commitments underlying such expenses.
Oil, Natural Gas and NGL Derivatives
We use derivative contracts to manage the variability in cash flows caused by commodity price fluctuations associated with our anticipated oil, natural gas and NGL production. We do not use derivative instruments for trading purposes.
For a further discussion of our derivative activities, see "Critical Accounting Policies and Estimates — Commodity Derivative Activities" below and "Oil, Natural Gas and NGL Prices" in Item 7A of this report. See the discussion and tables in Note 4, "Derivative Financial Instruments," and Note 5, "Fair Value Measurements," to our consolidated financial statements in Item 8 of this report for additional information regarding the accounting applicable to our derivative contracts, a listing of open contracts and the estimated fair market value of those contracts as of December 31, 2017.
Between January 1, 2018 and February 15, 2018, we entered into additional derivative contracts as set forth below. A listing of our outstanding derivative contracts as of February 15, 2018 follows:
Crude Oil
NYMEX Contract Price Per Bbl | |||||||||||||||||||
Collars | |||||||||||||||||||
Period and Type of Instrument | Volume in MBbls | Swaps (Weighted Average) | Puts (Weighted Average) | Floors (Weighted Average) | Ceilings (Weighted Average) | ||||||||||||||
2018: | |||||||||||||||||||
Swaptions | — | $ | 59.00 | $ | — | $ | — | $ | — | ||||||||||
Fixed-price swaps | 11,711 | 54.48 | — | — | — | ||||||||||||||
Fixed-price swaps with sold puts | 644 | ||||||||||||||||||
Fixed-price swaps | 56.78 | — | — | — | |||||||||||||||
Sold puts | — | 44.00 | — | — | |||||||||||||||
Collars | 1,274 | — | — | 50.59 | 56.70 | ||||||||||||||
Collars with sold puts: | 4,941 | ||||||||||||||||||
Collars | — | — | 48.65 | 56.44 | |||||||||||||||
Sold puts | — | 39.65 | — | — | |||||||||||||||
2019: | |||||||||||||||||||
Collars with sold puts: | 10,566 | ||||||||||||||||||
Collars | — | — | 50.59 | 57.13 | |||||||||||||||
Sold puts | — | 40.60 | — | — | |||||||||||||||
Natural Gas
Period and Type of Instrument | NYMEX Contract Price Per MMBtu | |||||||||||||||||||
Collars | ||||||||||||||||||||
Volume in MMMBtus | Swaps (Weighted Average) | Puts (Weighted Average) | Floors (Weighted Average) | Ceilings (Weighted Average) | ||||||||||||||||
2018: | ||||||||||||||||||||
Fixed-price swaps | 40,330 | $ | 2.99 | $ | — | $ | — | $ | — | |||||||||||
Fixed-price swaps with sold puts | 14,680 | |||||||||||||||||||
Fixed-price swaps | 3.00 | — | — | — | ||||||||||||||||
Sold puts | — | 2.62 | ||||||||||||||||||
Collars | 11,700 | — | — | 3.02 | 3.49 | |||||||||||||||
Collars with sold puts | 6,420 | |||||||||||||||||||
Collars | — | — | 2.87 | 3.32 | ||||||||||||||||
Sold puts | — | 2.30 | — | — | ||||||||||||||||
2019: | ||||||||||||||||||||
Fixed-price swaps | 3,650 | 2.91 | — | — | — | |||||||||||||||
Collars | 9,000 | — | — | 3.00 | 3.47 | |||||||||||||||
Natural Gas Liquids (Propane)
Period and Type of Instrument | Mont Belvieu Contract Price Per Gallon | |||||||
Volume in MBbls | Swaps (Weighted Average) | |||||||
2018: | ||||||||
Fixed-price swaps | 1,394 | $ | 0.81 | |||||
Off-Balance Sheet Arrangements
We do not currently utilize any off-balance sheet arrangements with unconsolidated entities to enhance liquidity and capital resource positions, or for any other purpose.
Critical Accounting Policies and Estimates
The discussion and analysis of our financial condition and results of operations are based upon our consolidated financial statements, which have been prepared in accordance with accounting principles generally accepted in the United States. The preparation of our financial statements requires us to make estimates and assumptions that affect our reported results of operations and the amount of reported assets, liabilities and proved oil, natural gas, and NGL reserves. Some accounting policies involve judgments and uncertainties to such an extent that there is reasonable likelihood that materially different amounts could have been reported under different conditions or if different assumptions had been used. We evaluate our estimates and assumptions on a regular basis. We base our estimates on historical experience and various other assumptions that we believe are reasonable under the circumstances, the results of which form the basis for our judgments about the carrying values of assets and liabilities that are not readily apparent from other sources. Actual results may differ from these estimates and assumptions used in preparation of our financial statements. See Note 1, "Organization and Summary of Significant Accounting Policies," to our consolidated financial statements in Item 8 of this report for a full description of the critical accounting policies and estimates below, as well as other accounting policies and estimates we make. Below are the most significant policies we apply in preparing our financial statements, some of which are subject to alternative treatments under generally accepted accounting principles. We also describe the most significant estimates and assumptions we make in applying these policies. We discussed the development, selection and disclosure of each of these with the Audit Committee of our Board of Directors.
Oil and Gas Activities. Two generally accepted accounting methods are available for accounting for oil and gas producing activities — successful efforts and full cost. The most significant differences between these methods are the treatment of exploration costs and the manner in which the carrying values of oil and gas properties are amortized and evaluated for impairment. The successful efforts method requires unsuccessful exploration costs to be expensed, while these costs are capitalized under the full cost method. Both methods provide for the periodic amortization of capitalized costs based on proved reserve quantities. Impairment of oil and gas properties under the successful efforts method is a two-step test that compares the carrying value of the properties to the undiscounted cash flows to assess for impairment. If required, the impairment is the difference between the carrying value of individual oil and gas properties and their estimated fair value using forward-looking prices. Impairment under the full cost method requires an evaluation of the after-tax carrying value of oil and gas properties included in a cost center against the after-tax net present value of future cash flows from the related proved reserves, using SEC pricing, costs in effect at year end and a 10% discount rate.
We use the full cost method of accounting for our oil and gas activities. Our financial position and results of operations would have been significantly different had we used the successful efforts method.
Proved Oil, Natural Gas and NGL Reserves. Our engineering estimates of proved oil, natural gas and NGL reserves directly impact financial accounting estimates, including DD&A expense and the full cost ceiling limitation. Proved oil, natural gas and NGL reserves are the estimated quantities of oil, natural gas and NGL reserves that geological and engineering data demonstrates with reasonable certainty to be recoverable in future years from known reservoirs based on SEC pricing and under period-end economic and operating conditions. The process of estimating quantities of proved reserves is complex, requiring significant subjective decisions in the evaluation of all geological, engineering and economic data for each reservoir. The data for a given reservoir may change substantially over time as a result of numerous factors, including development activity, evolving production history and continual reassessment of the viability of production under varying economic conditions. Changes in commodity prices, operating costs and expected performance from a given reservoir will result in future revisions to our estimated proved reserves quantities. All reserve information in this report is based on estimates prepared by our petroleum engineering staff.
Full Cost Pool. Under the full cost method, all costs incurred in the acquisition, exploration and development of oil and gas properties, including salaries, benefits, interest and other internal costs directly attributable to these activities, are capitalized into country-based cost centers. Proceeds from the sale of oil and gas properties are applied to reduce the costs in the applicable cost center unless the reduction would significantly alter the relationship between capitalized costs and proved reserves, in which case a gain or loss is recognized. Future development and abandonment costs are added, and unevaluated costs are withheld from the net costs capitalized in cost centers to represent a full cost pool, which is amortized and assessed for impairment.
Future Development and Abandonment Costs. Future development costs include expected costs to obtain access to proved reserves such as drilling costs and the installation of production equipment. Future abandonment costs include costs to dismantle and relocate or dispose of our gathering systems, production platforms and related structures, and restoration costs of land and seabed. We estimate these costs for each of our properties based upon their geographic location, type of production structure, water depth, reservoir depth and characteristics, market demand for equipment, currently available procedures and information from our engineering consultants. Because these costs typically extend many years into the future, estimation is difficult and requires judgments that are subject to revisions based upon numerous factors, including changing technology and the political and regulatory environment. We review our assumptions and estimates of future development and abandonment costs annually, or more frequently if circumstances change.
The accounting guidance for future abandonment costs requires that a liability and corresponding long-lived asset for the discounted fair value of an asset retirement obligation be recorded in the period in which it is incurred. The liability is increased to its present value each period, and the capitalized cost is depreciated over the useful life of the related asset.
Holding all other factors constant, if our estimate of future development and abandonment costs is revised upward, earnings would decrease due to higher DD&A expense. Likewise, if these estimates are revised downward, earnings would increase due to lower DD&A expense. To change our diluted earnings per share by $0.01 for the year ended December 31, 2017, our domestic DD&A rate would need to change by $0.12 per BOE, which would require a change in estimate of our domestic future development and abandonment costs of approximately 3%, or $83 million.
Unevaluated Costs Withheld From Amortization. Costs associated with unevaluated properties are excluded from our full cost pool until we have evaluated the properties or impairment is indicated. The costs associated with unevaluated leasehold
acreage, related seismic data and capitalized interest and direct internal costs are initially excluded from our full cost pool. Leasehold costs are either transferred to our full cost pool with the costs of drilling a well on the lease or are assessed at least annually for possible impairment or reduction in value. Leasehold costs are transferred to our full cost pool to the extent a reduction in value has occurred, or a charge is made against earnings if the costs were incurred in a country for which a reserve base has not been established. Currently, there are no unevaluated properties for our China business.
Our decision to withhold costs from amortization and the timing of the transfer of those costs into our full cost pool involves a significant amount of judgment and may be subject to changes over time based on several factors, including our drilling plans, availability of capital, project economics and drilling results from adjacent acreage. At December 31, 2017, we had a total of $1.2 billion of costs excluded from the respective full cost pools, all of which related to our domestic full cost pool. Inclusion of these costs in our domestic full cost pool, without adding any associated reserves, would have resulted in additional DD&A expense.
Depreciation, Depletion and Amortization. The full cost pool for each country is amortized using a unit-of-production method based on proved reserves associated with the cost center. Estimated proved reserves are a significant component of the calculation of DD&A expense, and revisions in such estimates may alter the rate of future expense. Holding all other factors constant, if reserves are revised upward, earnings would increase due to lower depletion expense. Likewise, if reserves are revised downward, earnings would decrease due to higher depletion expense or due to a ceiling test impairment. To change our diluted earnings per share by $0.01 for the year ended December 31, 2017, our domestic DD&A rate would need to change by $0.12 per BOE, which would require a change in the estimate of our domestic proved reserves of approximately 2%, or 10 MMBOE.
Full Cost Ceiling. Under the full cost method, we are subject to quarterly calculations of a "ceiling" or limitation on the amount of oil and gas property costs that can be capitalized on our balance sheet. The discounted present value of our proved reserves is a major component of the ceiling calculation and represents the component that requires the most subjective judgments. The ceiling value of oil, natural gas and NGL reserves is calculated based on SEC pricing and costs in effect as of the last day of the quarter. Once recorded, a ceiling test impairment is not reversible even if oil and gas prices increase.
We do not anticipate a ceiling test impairment in either the U.S. or China in the first quarter of 2018, as the current strip prices as of February 15, 2018 are above the current SEC pricing for oil and natural gas. It is difficult to predict with reasonable certainty the amount of expected future impairments given the many factors impacting the ceiling test calculation including, but not limited to, future pricing, operating and development costs, upward or downward reserve revisions, reserve additions and tax attributes. Subject to these numerous factors and inherent limitations, it is possible that we could experience additional ceiling test impairments in the future. See Note 6, "Oil and Gas Properties — Ceiling Test Impairments," to our consolidated financial statements in Item 8 of this report.
Allocation of Purchase Price in Business Combinations. The purchase price in an acquisition is allocated to the assets acquired and liabilities assumed based on their fair values as of the acquisition date. Our most significant estimates in our allocation typically relate to the value assigned to future recoverable oil and natural gas reserves and unproved properties. As the allocation of the purchase price is subject to significant estimates and judgments, the accuracy of this allocation is inherently uncertain and could lead to materially different amounts allocated between proved and unproved oil and gas properties which would result in differences in recognizing depletion and amortization in future periods.
Commodity Derivative Activities. Under accounting rules, we may elect to designate certain derivative contracts that qualify for hedge accounting as cash flow hedges against the price that we will receive for our future oil and gas production. However, we do not designate any of our derivative contracts as accounting hedges. As our derivative contracts are not designated as hedges, they are accounted for on a mark-to-market basis. We have in the past experienced, and are likely in the future to experience non-cash volatility in our reported earnings during periods of commodity price volatility. As of December 31, 2017, we had a net derivative liability of $108 million, of which 74%, based on total contracted volumes, was measured based upon a modified Black-Scholes valuation model. The model considers various inputs including forward prices for commodities, time value, volatility factors, counterparty credit risk and current market and contractual prices for the underlying instruments. As a result, the value of these contracts at their respective settlement dates could be significantly different than their fair value as of December 31, 2017. We periodically validate our valuations using independent third-party quotations. For further discussion of our derivative instruments and activities, see "Oil, Natural Gas and NGL Prices," in Item 7A of this report. Also see Note 4, "Derivative Financial Instruments," and Note 5, "Fair Value Measurements," to our consolidated financial statements in Item 8 of this report for additional information regarding the accounting applicable to our
oil, gas and NGL derivative contracts, a listing of open contracts and the estimated fair market value of those contracts as of December 31, 2017.
Stock-Based Compensation. We apply a fair value-based method of accounting for stock-based compensation, which requires recognition in the financial statements of the cost of services received in exchange for equity and liability awards. For equity awards, compensation expense is based on the fair value on the grant or modification date and is recognized in our financial statements over the vesting period. We utilize the Black-Scholes option-pricing model to measure the fair value of stock options and a Monte Carlo lattice-based model for our market-based restricted stock units. We also have cash-settled restricted stock units that are accounted for under the liability method, which requires us to recognize the fair value of each award based on the Company's stock price at the end of each period. See Note 15, "Stock-Based Compensation," to our consolidated financial statements in Item 8 of this report for a full discussion of our stock-based compensation.
Income Taxes. The amount of income taxes recorded by the Company requires significant judgment by management and is reviewed and adjusted routinely based on changes in facts and circumstances. We use the liability method of accounting for income taxes. Under this method, deferred tax assets and liabilities are determined by applying tax regulations existing at the end of a reporting period to the cumulative temporary differences between the tax bases of assets and liabilities and their reported amounts in our financial statements. Utilization of deferred tax assets is dependent upon generating sufficient future taxable income in the appropriate jurisdictions within the carryforward period. Estimates of future taxable income can be significantly affected by changes in oil, natural gas and NGL prices; estimates of the timing and amount of future production; and estimates of future operating and capital costs. Therefore, no certainty exists that we will be able to fully utilize deferred tax assets. We assess the available positive and negative evidence to estimate if sufficient taxable income will be generated to utilize deferred tax assets. A valuation allowance is established to reduce deferred tax assets if it is more likely than not that the related deferred tax benefits will not be realized. Changes in judgment regarding future realizability of deferred tax assets may result in the reversal of all or a portion of the valuation allowance. In the period that determination is made, our net income will benefit from a lower effective tax rate. See Note 8, "Income Taxes," to our consolidated financial statements in Item 8 of this report for a full discussion of income taxes.
New Accounting Requirements
See Note 1, "Organization and Summary of Significant Accounting Policies," to our consolidated financial statements in Item 8 of this report for a discussion of new accounting requirements.
Regulation
Exploration, development, production and the sale of oil, natural gas and NGLs are subject to extensive federal, state, provincial, tribal, local and international regulations. An overview of these regulations is set forth in Items 1 and 2, "Business and Properties — Regulation." We believe we are in substantial compliance with currently applicable laws and regulations and that continued substantial compliance with existing requirements will not have a material adverse effect on our financial position, cash flows or results of operations. However, current regulatory requirements may change, currently unforeseen environmental incidents may occur or past non-compliance with environmental laws or regulations may be discovered. See the discussion under the caption "We are subject to complex laws and regulatory actions that can affect the cost, manner, feasibility or timing of doing business," in Item 1A of this report.
Item 7A. Quantitative and Qualitative Disclosures About Market Risk
We are exposed to market risk from changes in oil, natural gas and NGL prices, interest rates and foreign currency exchange rates as discussed below.
Oil, Natural Gas and NGL Prices
Our decision on the quantity and price at which we choose to enter into derivative contracts is based in part on our view of current and future market conditions. While the use of derivative instruments may limit or partially reduce the downside risk of adverse commodity price movements, their use also may limit future income from favorable commodity price movements. In addition, the use of derivative contracts may involve basis risk. All of our derivative transactions have been carried out in the over-the-counter market. The use of derivative contracts also involves the risk that the counterparties, which generally are financial institutions, will be unable to meet the financial terms of such transactions. Our derivative contracts are with multiple counterparties to minimize our exposure to any individual counterparty. At December 31, 2017, 10 of our 15 counterparties accounted for approximately 82% of our contracted volumes with the largest counterparty accounting for approximately 12%.
As of December 31, 2017, 30,260 MBbls of our expected 2018 and 2019 crude oil production were protected against price volatility using collars and fixed-price swaps, over 84% of which have associated sold puts. The sold puts limit our downward price protection below the weighted average of our sold puts of $40.05 per barrel. If the market price remains below $40.05 per barrel, we receive the market price for our associated production plus the difference between our sold puts and the associated floors or fixed-price swaps, which averages $9.48 per barrel. For further discussion of our derivative activities, see Note 4, "Derivative Financial Instruments," and Note 5, "Fair Value Measurements," to our consolidated financial statements in Item 8 of this report.
Interest Rates
We consider our interest rate exposure to be minimal as 100% of our outstanding debt was at fixed rates at December 31, 2017. A 10% increase in LIBOR would not impact our interest costs on debt outstanding at December 31, 2017, but would decrease the fair value of our outstanding debt, as well as increase interest costs associated with future debt issuances or borrowings under our revolving credit facility and money market lines of credit.
Foreign Currency Exchange Rates
The functional currency for our China operations is the U.S. dollar. To the extent that business transactions in a foreign country are not denominated in the U.S. dollar, we are exposed to foreign currency exchange risk. We consider our current risk exposure to exchange rate movements, based on net cash flows, to be immaterial. We did not have any open derivative contracts related to foreign currencies at December 31, 2017.
Item 8. Financial Statements and Supplementary Data
NEWFIELD EXPLORATION COMPANY
TABLE OF CONTENTS
CONSOLIDATED FINANCIAL STATEMENTS
AND SUPPLEMENTARY INFORMATION
Page | |
MANAGEMENT’S REPORT ON INTERNAL CONTROL OVER FINANCIAL REPORTING
Our Company’s management is responsible for establishing and maintaining adequate internal control over financial reporting, as such term is defined in Exchange Act Rule 13a-15(f). Internal control over financial reporting is a process designed to provide reasonable assurance regarding the reliability of financial reporting and the preparation of our financial statements for external purposes in accordance with generally accepted accounting principles. Under the supervision and with the participation of our Company’s management, including the Chief Executive Officer and the Chief Financial Officer, we conducted an evaluation of the effectiveness of our internal control over financial reporting based on the framework in Internal Control — Integrated Framework (2013) issued by the Committee of Sponsoring Organizations of the Treadway Commission.
Our internal control over financial reporting includes those policies and procedures that: (1) pertain to the maintenance of records that, in reasonable detail, accurately and fairly reflect the transactions and dispositions of our assets; (2) provide reasonable assurance that transactions are recorded as necessary to permit preparation of our financial statements in accordance with generally accepted accounting principles, and that our receipts and expenditures are being made only in accordance with authorizations of our management and directors; and (3) provide reasonable assurance regarding prevention or timely detection of unauthorized acquisition, use or disposition of our assets that could have a material effect on our financial statements.
Because of its inherent limitations, internal control over financial reporting may not prevent or detect misstatements. Also, projections of any evaluation of effectiveness to future periods are subject to the risk that controls may become inadequate because of changes in conditions, or that the degree of compliance with the policies or procedures may deteriorate.
Based on our evaluation under the framework in Internal Control — Integrated Framework (2013), the management of our Company concluded that our internal control over financial reporting was effective as of December 31, 2017.
The effectiveness of our internal control over financial reporting as of December 31, 2017 has been audited by PricewaterhouseCoopers LLP, an independent registered public accounting firm, as stated in their report that follows.
 |  | |
Lee K. Boothby | Lawrence S. Massaro | |
Chairman, President and Chief Executive Officer | Executive Vice President and Chief Financial Officer | |
The Woodlands, Texas
February 20, 2018
Report of Independent Registered Public Accounting Firm
To the Board of Directors and Stockholders of Newfield Exploration Company
Opinions on the Financial Statements and Internal Control over Financial Reporting
We have audited the accompanying consolidated balance sheets of Newfield Exploration Company and its subsidiaries as of December 31, 2017 and 2016, and the related consolidated statements of operations and comprehensive income, cash flows and stockholders’ equity for each of the three years in the period ended December 31, 2017, including the related notes (collectively referred to as the “consolidated financial statements”). We also have audited the Company’s internal control over financial reporting as of December 31, 2017, based on criteria established in Internal Control - Integrated Framework (2013) issued by the Committee of Sponsoring Organizations of the Treadway Commission (COSO).
In our opinion, the consolidated financial statements referred to above present fairly, in all material respects, the financial position of the Company as of December 31, 2017 and 2016, and the results of their operations and their cash flows for each of the three years in the period ended December 31, 2017 in conformity with accounting principles generally accepted in the United States of America. Also in our opinion, the Company maintained, in all material respects, effective internal control over financial reporting as of December 31, 2017, based on criteria established in Internal Control - Integrated Framework (2013) issued by the COSO.
Basis for Opinions
The Company’s management is responsible for these consolidated financial statements, for maintaining effective internal control over financial reporting, and for its assessment of the effectiveness of internal control over financial reporting, included in the accompanying Management’s Report on Internal Control over Financial Reporting. Our responsibility is to express opinions on the Company’s consolidated financial statements and on the Company’s internal control over financial reporting based on our audits. We are a public accounting firm registered with the Public Company Accounting Oversight Board (United States) (“PCAOB”) and are required to be independent with respect to the Company in accordance with the U.S. federal securities laws and the applicable rules and regulations of the Securities and Exchange Commission and the PCAOB.
We conducted our audits in accordance with the standards of the PCAOB. Those standards require that we plan and perform the audits to obtain reasonable assurance about whether the consolidated financial statements are free of material misstatement, whether due to error or fraud, and whether effective internal control over financial reporting was maintained in all material respects.
Our audits of the consolidated financial statements included performing procedures to assess the risks of material misstatement of the consolidated financial statements, whether due to error or fraud, and performing procedures that respond to those risks. Such procedures included examining, on a test basis, evidence regarding the amounts and disclosures in the consolidated financial statements. Our audits also included evaluating the accounting principles used and significant estimates made by management, as well as evaluating the overall presentation of the consolidated financial statements. Our audit of internal control over financial reporting included obtaining an understanding of internal control over financial reporting, assessing the risk that a material weakness exists, and testing and evaluating the design and operating effectiveness of internal control based on the assessed risk. Our audits also included performing such other procedures as we considered necessary in the circumstances. We believe that our audits provide a reasonable basis for our opinions.
Definition and Limitations of Internal Control over Financial Reporting
A company’s internal control over financial reporting is a process designed to provide reasonable assurance regarding the reliability of financial reporting and the preparation of financial statements for external purposes in accordance with generally accepted accounting principles. A company’s internal control over financial reporting includes those policies and procedures that (i) pertain to the maintenance of records that, in reasonable detail, accurately and fairly reflect the transactions and dispositions of the assets of the company; (ii) provide reasonable assurance that transactions are recorded as necessary to permit preparation of financial statements in accordance with generally accepted accounting principles, and that receipts and expenditures of the company are being made only in accordance with authorizations of management and directors of the company; and (iii) provide reasonable assurance regarding prevention or timely detection of unauthorized acquisition, use, or disposition of the company’s assets that could have a material effect on the financial statements.
Because of its inherent limitations, internal control over financial reporting may not prevent or detect misstatements. Also, projections of any evaluation of effectiveness to future periods are subject to the risk that controls may become inadequate because of changes in conditions, or that the degree of compliance with the policies or procedures may deteriorate.
/s/ PricewaterhouseCoopers LLP
Houston, Texas
February 20, 2018
We have served as the Company’s auditor since 1993.
NEWFIELD EXPLORATION COMPANY
CONSOLIDATED BALANCE SHEET
(In millions, except share data)
December 31, | ||||||||
2017 | 2016 | |||||||
ASSETS | ||||||||
Current assets: | ||||||||
Cash and cash equivalents | $ | 326 | $ | 555 | ||||
Short-term investments | — | 25 | ||||||
Accounts receivable, net | 292 | 232 | ||||||
Inventories | 15 | 16 | ||||||
Derivative assets | 15 | 75 | ||||||
Other current assets | 98 | 46 | ||||||
Total current assets | 746 | 949 | ||||||
Oil and gas properties, net — full cost method ($1,200 and $1,238 were excluded from amortization at December 31, 2017 and 2016, respectively) | 3,931 | 3,140 | ||||||
Other property and equipment, net | 168 | 167 | ||||||
Derivative assets | 1 | — | ||||||
Long-term investments | 24 | 19 | ||||||
Restricted cash | 40 | 25 | ||||||
Other assets | 51 | 12 | ||||||
Total assets | $ | 4,961 | $ | 4,312 | ||||
LIABILITIES AND STOCKHOLDERS' EQUITY | ||||||||
Current liabilities: | ||||||||
Accounts payable | $ | 46 | $ | 33 | ||||
Accrued liabilities | 591 | 498 | ||||||
Advances from joint owners | 80 | 54 | ||||||
Asset retirement obligations | 3 | 2 | ||||||
Derivative liabilities | 98 | 97 | ||||||
Total current liabilities | 818 | 684 | ||||||
Other liabilities | 69 | 63 | ||||||
Derivative liabilities | 26 | 3 | ||||||
Long-term debt | 2,434 | 2,431 | ||||||
Asset retirement obligations | 130 | 154 | ||||||
Deferred taxes | 76 | 39 | ||||||
Total long-term liabilities | 2,735 | 2,690 | ||||||
Commitments and contingencies (Note 12) | ||||||||
Stockholders' equity: | ||||||||
Preferred stock ($0.01 par value, 5,000,000 shares authorized; no shares issued) | — | — | ||||||
Common stock ($0.01 par value, 300,000,000 shares authorized at December 31, 2017 and 2016; 201,363,345 and 200,150,392 shares issued at December 31, 2017 and 2016, respectively) | 2 | 2 | ||||||
Additional paid-in capital | 3,303 | 3,247 | ||||||
Treasury stock (at cost, 1,658,476 and 1,195,809 shares at December 31, 2017 and 2016, respectively) | (59 | ) | (44 | ) | ||||
Accumulated other comprehensive income (loss) | — | (2 | ) | |||||
Retained earnings (deficit) | (1,838 | ) | (2,265 | ) | ||||
Total stockholders' equity | 1,408 | 938 | ||||||
Total liabilities and stockholders' equity | $ | 4,961 | $ | 4,312 | ||||
The accompanying notes to consolidated financial statements are an integral part of this statement.
NEWFIELD EXPLORATION COMPANY
CONSOLIDATED STATEMENT OF OPERATIONS AND COMPREHENSIVE INCOME
(In millions, except per share data)
Year Ended December 31, | ||||||||||||
2017 | 2016 | 2015 | ||||||||||
Oil, gas and NGL revenues | $ | 1,767 | $ | 1,472 | $ | 1,557 | ||||||
Operating expenses: | ||||||||||||
Lease operating | 215 | 244 | 285 | |||||||||
Transportation and processing | 300 | 272 | 212 | |||||||||
Production and other taxes | 64 | 42 | 46 | |||||||||
Depreciation, depletion and amortization | 467 | 572 | 917 | |||||||||
General and administrative | 200 | 213 | 244 | |||||||||
Ceiling test and other impairments | — | 1,028 | 4,904 | |||||||||
Other | 6 | 20 | 10 | |||||||||
Total operating expenses | 1,252 | 2,391 | 6,618 | |||||||||
Income (loss) from operations | 515 | (919 | ) | (5,061 | ) | |||||||
Other income (expense): | ||||||||||||
Interest expense | (150 | ) | (154 | ) | (164 | ) | ||||||
Capitalized interest | 61 | 51 | 33 | |||||||||
Commodity derivative income (expense) | (47 | ) | (191 | ) | 259 | |||||||
Other, net | 7 | 5 | (14 | ) | ||||||||
Total other income (expense) | (129 | ) | (289 | ) | 114 | |||||||
Income (loss) before income taxes | 386 | (1,208 | ) | (4,947 | ) | |||||||
Income tax provision (benefit): | ||||||||||||
Current | (78 | ) | 9 | 17 | ||||||||
Deferred | 37 | 13 | (1,602 | ) | ||||||||
Total income tax provision (benefit) | (41 | ) | 22 | (1,585 | ) | |||||||
Net income (loss) | $ | 427 | $ | (1,230 | ) | $ | (3,362 | ) | ||||
Earnings (loss) per share: | ||||||||||||
Basic | $ | 2.14 | $ | (6.36 | ) | $ | (21.18 | ) | ||||
Diluted | $ | 2.13 | $ | (6.36 | ) | $ | (21.18 | ) | ||||
Weighted-average number of shares outstanding for basic earnings (loss) per share | 199 | 193 | 159 | |||||||||
Weighted-average number of shares outstanding for diluted earnings (loss) per share | 200 | 193 | 159 | |||||||||
Comprehensive income (loss): | ||||||||||||
Net income (loss) | $ | 427 | $ | (1,230 | ) | $ | (3,362 | ) | ||||
Other comprehensive income (loss), net of tax | 2 | — | (1 | ) | ||||||||
Comprehensive income (loss) | $ | 429 | $ | (1,230 | ) | $ | (3,363 | ) | ||||
The accompanying notes to consolidated financial statements are an integral part of this statement.
NEWFIELD EXPLORATION COMPANY
CONSOLIDATED STATEMENT OF CASH FLOWS
(In millions)
Year Ended December 31, | ||||||||||||
2017 | 2016 | 2015 | ||||||||||
Cash flows from operating activities: | ||||||||||||
Net income (loss) | $ | 427 | $ | (1,230 | ) | $ | (3,362 | ) | ||||
Adjustments to reconcile net income (loss) to net cash provided by (used in) operating activities: | ||||||||||||
Depreciation, depletion and amortization | 467 | 572 | 917 | |||||||||
Deferred tax provision (benefit) | 37 | 13 | (1,602 | ) | ||||||||
Stock-based compensation | 34 | 22 | 25 | |||||||||
Unrealized (gain) loss on derivative contracts | 83 | 392 | 246 | |||||||||
Ceiling test and other impairments | — | 1,028 | 4,904 | |||||||||
Other, net | 14 | 13 | 43 | |||||||||
Changes in operating assets and liabilities: | ||||||||||||
(Increase) decrease in accounts receivable | (60 | ) | 22 | 83 | ||||||||
Increase (decrease) in accounts payable and accrued liabilities | 27 | (3 | ) | (45 | ) | |||||||
Other items, net | (77 | ) | (3 | ) | — | |||||||
Net cash provided by (used in) operating activities | 952 | 826 | 1,209 | |||||||||
Cash flows from investing activities: | ||||||||||||
Additions to oil and gas properties | (1,156 | ) | (868 | ) | (1,607 | ) | ||||||
Acquisitions of oil and gas properties | (110 | ) | (486 | ) | (125 | ) | ||||||
Proceeds from sales of oil and gas properties | 96 | 405 | 90 | |||||||||
Additions to other property and equipment | (23 | ) | (17 | ) | (13 | ) | ||||||
Proceeds from insurance settlement, net | — | — | 57 | |||||||||
Redemptions of investments | 50 | — | — | |||||||||
Purchases of investments | (25 | ) | (25 | ) | — | |||||||
Net cash provided by (used in) investing activities | (1,168 | ) | (991 | ) | (1,598 | ) | ||||||
Cash flows from financing activities: | ||||||||||||
Proceeds from borrowings under credit arrangements | — | 536 | 1,908 | |||||||||
Repayments of borrowings under credit arrangements | — | (575 | ) | (2,315 | ) | |||||||
Proceeds from issuance of senior notes | — | — | 691 | |||||||||
Repayment of senior subordinated notes | — | — | (700 | ) | ||||||||
Debt issue costs | — | — | (8 | ) | ||||||||
Proceeds from issuances of common stock, net | 3 | 779 | 819 | |||||||||
Purchases of treasury stock, net | (15 | ) | (22 | ) | (12 | ) | ||||||
Other | (1 | ) | (3 | ) | (3 | ) | ||||||
Net cash provided by (used in) financing activities | (13 | ) | 715 | 380 | ||||||||
Increase (decrease) in cash and cash equivalents | (229 | ) | 550 | (9 | ) | |||||||
Cash and cash equivalents, beginning of period | 555 | 5 | 14 | |||||||||
Cash and cash equivalents, end of period | $ | 326 | $ | 555 | $ | 5 | ||||||
The accompanying notes to consolidated financial statements are an integral part of this statement.
NEWFIELD EXPLORATION COMPANY
CONSOLIDATED STATEMENT OF STOCKHOLDERS' EQUITY
(In millions)
Common Stock | Treasury Stock | Additional Paid-in Capital | Retained Earnings (Deficit) | Accumulated Other Comprehensive Income (Loss) | Total Stockholders' Equity | ||||||||||||||||||||||||||
Shares | Amount | Shares | Amount | ||||||||||||||||||||||||||||
Balance, December 31, 2014 | 137.6 | $ | 1 | (0.3 | ) | $ | (10 | ) | $ | 1,576 | $ | 2,327 | $ | (1 | ) | $ | 3,893 | ||||||||||||||
Issuances of common stock | 26.5 | 1 | 818 | 819 | |||||||||||||||||||||||||||
Stock-based compensation | 42 | 42 | |||||||||||||||||||||||||||||
Treasury stock, net | (0.3 | ) | (12 | ) | — | (12 | ) | ||||||||||||||||||||||||
Net income (loss) | (3,362 | ) | (3,362 | ) | |||||||||||||||||||||||||||
Other comprehensive income (loss), net of tax | (1 | ) | (1 | ) | |||||||||||||||||||||||||||
Balance, December 31, 2015 | 164.1 | 2 | (0.6 | ) | (22 | ) | 2,436 | (1,035 | ) | (2 | ) | 1,379 | |||||||||||||||||||
Issuances of common stock | 36.1 | — | 779 | 779 | |||||||||||||||||||||||||||
Stock-based compensation | 32 | 32 | |||||||||||||||||||||||||||||
Treasury stock, net | (0.6 | ) | (22 | ) | — | — | (22 | ) | |||||||||||||||||||||||
Net income (loss) | (1,230 | ) | (1,230 | ) | |||||||||||||||||||||||||||
Balance, December 31, 2016 | 200.2 | 2 | (1.2 | ) | (44 | ) | 3,247 | (2,265 | ) | (2 | ) | 938 | |||||||||||||||||||
Issuances of common stock | 1.2 | — | 3 | 3 | |||||||||||||||||||||||||||
Stock-based compensation | 53 | 53 | |||||||||||||||||||||||||||||
Treasury stock, net | (0.5 | ) | (15 | ) | — | (15 | ) | ||||||||||||||||||||||||
Net income (loss) | 427 | 427 | |||||||||||||||||||||||||||||
Other comprehensive income (loss), net of tax | 2 | 2 | |||||||||||||||||||||||||||||
Balance, December 31, 2017 | 201.4 | $ | 2 | (1.7 | ) | $ | (59 | ) | $ | 3,303 | $ | (1,838 | ) | $ | — | $ | 1,408 | ||||||||||||||
The accompanying notes to consolidated financial statements are an integral part of this statement.
NEWFIELD EXPLORATION COMPANY
NOTES TO CONSOLIDATED FINANCIAL STATEMENTS
1. | Organization and Summary of Significant Accounting Policies |
Organization and Principles of Consolidation
We are an independent energy company engaged in the exploration, development and production of crude oil, natural gas and natural gas liquids (NGLs). Our U.S. operations are onshore and focus primarily on large scale, liquids-rich resource plays in the Anadarko and Arkoma basins of Oklahoma, the Williston Basin of North Dakota and the Uinta Basin of Utah. In addition, we have oil assets offshore China.
Our consolidated financial statements include the accounts of Newfield Exploration Company, a Delaware corporation, and its subsidiaries. We proportionately consolidate our interests in oil and natural gas exploration and production joint ventures and partnerships in accordance with industry practice. All significant intercompany balances and transactions have been eliminated. Unless otherwise specified or the context otherwise requires, all references in these notes to "Newfield," "we," "us," "our" or the "Company" are to Newfield Exploration Company and its subsidiaries.
Risks and Uncertainties
As an independent oil and natural gas producer, our revenue, profitability and future rate of growth are substantially dependent on prevailing prices for oil, natural gas and NGLs. Historically, the energy markets have been very volatile, and there can be no assurance that commodity prices will not be subject to wide fluctuations in the future. A substantial or extended decline in commodity prices could have a material adverse effect on our financial position, results of operations, cash flows, access to capital and on the quantities of oil, natural gas and NGL reserves that we can economically produce. Other risks and uncertainties that could affect us in a volatile commodity price environment include, but are not limited to, counterparty credit risk for our receivables, responsibility for decommissioning liabilities for offshore interests we no longer own, inability to access credit markets, regulatory risks and our ability to meet financial ratios and covenants in our financing agreements.
Use of Estimates
The preparation of financial statements in accordance with accounting principles generally accepted in the United States of America (U.S. GAAP) requires our management to make estimates and assumptions that affect the reported amounts of assets and liabilities; disclosure of contingent assets and liabilities at the date of the financial statements; the reported amounts of revenues and expenses during the reporting period; and the quantities and values of proved oil, natural gas and NGL reserves used in calculating depletion and assessing impairment of our oil and gas properties. Actual results could differ significantly from these estimates. Our most significant estimates are associated with the quantities of proved oil, natural gas and NGL reserves, the timing and amount of transfers of our unevaluated properties into our amortizable full cost pool, the recoverability of our deferred tax assets and the fair value of our derivative contracts.
Restructuring Costs
Restructuring costs include severance and related benefit costs, costs associated with abandoned office space, employee relocation costs and other associated costs. Employee severance and related benefit costs are recognized on a straight-line basis over the required service period, if any. Employee relocation costs are expensed as incurred. On the date a leased property ceases to be used, a liability for non-cancellable office-lease costs associated with restructuring is recognized and measured at fair value on our consolidated balance sheet. Fair value estimates include assumptions regarding estimated future sublease payments. These estimates could materially differ from actual results and may require revision to initial estimates of the liability. See Note 17, "Restructuring Costs," for additional disclosures.
NEWFIELD EXPLORATION COMPANY
NOTES TO CONSOLIDATED FINANCIAL STATEMENTS — (Continued)
Revenue Recognition
All of our oil, natural gas and NGLs are sold at market-based prices adjusted for location and quality differentials to a variety of purchasers. We record revenue when we deliver our production to the customer and collectability is reasonably assured. Revenues from the production of oil, natural gas and NGLs on properties in which we have joint ownership are recorded under the sales method. Under the sales method, the Company and other joint owners may sell more or less than their entitled share of production. Should the Company’s excess sales exceed our share of estimated remaining recoverable reserves, a liability is recorded.
Foreign Currency
The functional currency for our China operations is the U.S. dollar. Gains and losses incurred on transactions in a currency other than the U.S. dollar are recorded under the caption "Other income (expense) — Other, net" on our consolidated statement of operations.
Cash and Cash Equivalents
Cash and cash equivalents include highly liquid investments with a maturity of three months or less when acquired and are stated at cost, which approximates fair value. We invest cash in excess of near-term capital and operating requirements in U.S. Treasury Notes, Eurodollar time deposits and money market funds, which are classified as cash and cash equivalents on our consolidated balance sheet.
Restricted Cash
Restricted cash consists of amounts held in escrow accounts to satisfy future plug and abandonment obligations for our China operations. These amounts are restricted as to their current use and will be released as we plug and abandon wells and facilities in China. Consistent with our other plug and abandonment activities, changes in restricted cash are included in cash flows from operating activities in our consolidated statement of cash flows.
Investments
Long-term investments consist of debt and equity securities, a majority of which are classified as "available-for-sale" and stated at fair value. Accordingly, unrealized gains and losses and the related deferred income tax effects are excluded from earnings and reported in other comprehensive income within our consolidated statement of stockholders' equity. The portion of accumulated other comprehensive income within our consolidated statement of stockholders' equity related to investments was $3 million at December 31, 2017 and $1 million at December 31, 2016 and 2015. Realized gains or losses are computed based on specific identification of the securities sold. We regularly assess our investments for impairment and consider any impairment to be other than temporary if we intend to sell the security, it is more likely than not that we will be required to sell the security, or we do not expect to recover our cost of the security.
Allowance for Doubtful Accounts
We routinely assess material trade and other receivables to determine their collectability. Many of our receivables are from joint interest owners of properties we operate. Thus, we may have the ability to withhold future revenue disbursements to recover any non-payment of related joint interest billings. Generally, our oil and gas receivables are collected within 45 to 60 days of production. We accrue a reserve on a receivable when, based on the judgment of management, it is probable that a receivable will not be collected.
Other Current Assets
Other current assets primarily consist of federal income tax refunds receivable, capital and lease operating expense prepayments and other prepaid items, including but not limited to, rent and insurance. For the years ended December 31, 2017 and 2016, federal income tax refunds receivable were $53 million and $24 million, respectively. See Note 8, "Income Taxes," for further discussion.
NEWFIELD EXPLORATION COMPANY
NOTES TO CONSOLIDATED FINANCIAL STATEMENTS — (Continued)
Inventories
Inventories primarily consist of tubular goods and well equipment held for use in our oil and natural gas operations and oil produced but not sold in our China operations. Inventories are carried at the lower of cost or net realizable value. Substantially all of the crude oil from our offshore operations in China is produced into floating storage facilities and sold periodically as barge quantities accumulate. The carrying value of oil inventory is the sum of related production costs and depletion expense. See Note 3, "Inventories," for further discussion.
Oil and Gas Properties
We use the full cost method of accounting for our oil and gas activities. Under this method, all costs incurred in the acquisition, exploration and development of oil and gas properties, including salaries, benefits, interest and other internal costs directly attributable to these activities, are capitalized into country-based cost centers. Proceeds from the sale of oil and gas properties are applied to reduce the costs in the applicable cost center unless the reduction would significantly alter the relationship between capitalized costs and proved reserves, in which case a gain or loss is recognized.
Capitalized costs and estimated future development costs are amortized using a unit-of-production method based on proved reserves associated with the applicable cost center. For each cost center, the net capitalized costs of oil and gas properties are limited to the lower of the unamortized cost or the cost center ceiling. A particular cost center ceiling is equal to the sum of:
• | the present value (10% per annum discount rate) of estimated future net revenues from proved reserves using oil, natural gas and NGL reserve estimation requirements, which require use of the unweighted average first-day-of-the-month commodity prices for the prior 12 months (SEC pricing), adjusted for market differentials applicable to our reserves (including the effects of derivative contracts that are designated for hedge accounting, if any); plus |
• | the costs of properties not included in the costs being amortized, if any; less |
• | related income tax effects. |
If net capitalized costs of oil and gas properties exceed the cost center ceiling, we are subject to a ceiling test impairment to the extent of such excess. If required, a ceiling test impairment reduces earnings and stockholders’ equity in the period of occurrence and, holding other factors constant, results in lower depreciation, depletion and amortization expense in future periods.
The risk that we will be required to impair the carrying value of our oil and gas properties increases when oil, natural gas and NGL prices decrease significantly for a prolonged period, or if we have substantial downward revisions in our estimated proved reserves.
Costs associated with unevaluated properties are excluded from our full cost pool until we have evaluated the properties or impairment is indicated. The costs associated with unevaluated leasehold acreage, related seismic data and capitalized interest and direct internal costs are initially excluded from our full cost pool. Leasehold costs are either transferred to our full cost pool with the costs of drilling a well on the lease or are assessed at least annually for possible impairment or reduction in value. Leasehold costs are transferred to our full cost pool to the extent a reduction in value has occurred, or a charge is made against earnings if the costs were incurred in a country for which a reserve base has not been established.
See Note 6, "Oil and Gas Properties," for a detailed discussion regarding our oil and gas property and our asset acquisitions and sales transactions.
Other Property and Equipment
Furniture, fixtures and equipment are recorded at cost and depreciated using the straight-line method over their estimated useful lives, which range from three to seven years. Gathering systems and equipment are recorded at cost and depreciated using the straight-line method over their estimated useful lives of 25 years.
NEWFIELD EXPLORATION COMPANY
NOTES TO CONSOLIDATED FINANCIAL STATEMENTS — (Continued)
Asset Retirement Obligations
If a reasonable estimate of the fair value of an obligation to perform site reclamation, dismantle facilities or plug and abandon wells can be made, we record a liability (an asset retirement obligation or ARO) on our consolidated balance sheet and capitalize the present value of the asset retirement cost in oil and gas properties in the period in which the ARO is incurred. Settlements include payments made to satisfy the AROs, as well as transfer of the AROs to purchasers of our divested properties.
In general, the amount of the initial recorded ARO and the costs capitalized will equal the estimated future costs to satisfy the abandonment obligation assuming normal operation of the asset, using current prices that are escalated by an assumed inflation factor up to the estimated settlement date, which is then discounted back to the date that the abandonment obligation was incurred using the credit adjusted risk-free rate for our Company. After recording these amounts, the ARO is accreted to its future estimated value and the original capitalized costs are depreciated on a unit-of-production basis within the related full cost pool. Both the accretion and depreciation are included in depreciation, depletion and amortization expense on our consolidated statement of operations. See Note 10, "Asset Retirement Obligations," for further discussion.
Contingencies
We are subject to legal proceedings, claims, liabilities and environmental matters that arise in the ordinary course of business. We accrue for losses when such losses are considered probable and the amounts can be reasonably estimated. See Note 12, "Commitments and Contingencies," for a more detailed discussion regarding our contingencies.
Environmental Matters
Environmental costs that relate to current operations are expensed as incurred. Remediation costs that relate to an existing condition caused by past operations are accrued when it is probable that those costs will be incurred and can be reasonably estimated based upon evaluations of currently available facts related to each site.
Income Taxes
We use the liability method of accounting for income taxes. Under this method, deferred tax assets and liabilities are determined by applying tax regulations existing at the end of a reporting period to the cumulative temporary differences between the tax bases of assets and liabilities and their reported amounts in our financial statements. We assess the available positive and negative evidence to estimate if sufficient taxable income will be generated to utilize deferred tax assets. A valuation allowance is established to reduce deferred tax assets if it is more likely than not that the related tax benefits will not be realized. We also evaluate potential uncertain tax positions, and if necessary, establish accruals for such items. See Note 8, "Income Taxes," for further discussion.
Stock-Based Compensation
We apply a fair value-based method of accounting for stock-based compensation, which requires recognition in the financial statements of the cost of services received in exchange for equity and liability awards. For equity awards, compensation expense is based on the fair value on the grant or modification date and is recognized in our financial statements over the applicable service period. The fair value of our service based restricted stock and restricted stock units are based on the Company's stock price on the date of grant. We utilize the Black-Scholes option-pricing model to measure the fair value of stock options and a Monte Carlo lattice-based model for our market-based restricted stock units. We also have cash-settled restricted stock units that are accounted for under the liability method, which requires us to recognize the fair value of each award based on the Company's stock price at the end of each period. See Note 15, "Stock-Based Compensation," for a full discussion of our stock-based compensation.
NEWFIELD EXPLORATION COMPANY
NOTES TO CONSOLIDATED FINANCIAL STATEMENTS — (Continued)
Concentration of Credit Risk
We operate a substantial portion of our oil and gas properties. As the operator of a property, we make full payment for costs associated with the property and seek reimbursement from the other joint interest owners in the property for their share of those costs. In addition, when warranted, we require prepayments from our joint interest owners for drilling and completion projects. Our joint interest owners consist primarily of independent oil and gas producers whose ability to reimburse us could be negatively impacted by adverse market conditions.
The purchasers of our oil, gas and NGL production consist primarily of independent marketers, major oil and gas companies, refiners and gas pipeline companies. We perform credit evaluations of the purchasers of our production and monitor their financial condition on an ongoing basis. Based on our evaluations and monitoring, we obtain cash escrows, letters of credit or parental guarantees from some purchasers.
All of our derivative transactions were carried out in the over-the-counter market and are not typically subject to margin-deposit requirements. We monitor the credit ratings of our derivative counterparties on an ongoing basis and have netting arrangements that provide for offsetting payables against receivables by counterparty. Although we have entered into derivative contracts with multiple counterparties to mitigate our exposure to any individual counterparty, if any of our counterparties were to default on its obligations to us under the derivative contracts or seek bankruptcy protection, it could have a material adverse effect on our ability to fund our planned activities and could result in a larger percentage of our future production being subject to commodity price volatility. In addition, in poor economic environments and tight financial markets, the risk of a counterparty default is heightened and fewer counterparties may participate in derivative transactions, which could result in greater concentration of our exposure to any one counterparty or a larger percentage of our future production being subject to commodity price changes. The use of derivative transactions involves the risk that the counterparties, which generally are financial institutions, will be unable to meet the financial terms of such transactions. Our derivative contracts are with multiple counterparties to minimize our exposure to any individual counterparty, and we have netting arrangements with all of our counterparties that provide for offsetting payables against receivables by counterparty.
At December 31, 2017, 10 of our 15 counterparties accounted for approximately 82% of our contracted volumes, with the largest counterparty accounting for approximately 12%. At December 31, 2017, approximately 79% of our volumes subject to derivative instruments are with lenders under our credit facility. Our credit facility, senior notes and substantially all of our derivative instruments contain provisions that provide for cross defaults and acceleration of those debt and derivative instruments in certain situations.
Major Customers
None of our customers accounted for 10% or more of our total revenues in 2017. During 2016, China National Offshore Oil Corporation Ltd. accounted for 12% of our total revenues. During 2015, China National Offshore Oil Corporation Ltd., MidCon Gathering LLC and Sunoco Logistics Partners Operations GP LLC accounted for 13%, 11% and 10%, respectively, of our total revenues. We believe that the loss of a major customer would not have a material adverse effect on us because alternative purchasers are available.
Derivative Financial Instruments
Our derivative instruments are recorded on the consolidated balance sheet at fair value as either an asset or a liability with changes in fair value recognized currently in earnings. While we utilize our derivative instruments to manage the price risk attributable to our expected oil, gas and NGL production, we have elected not to designate our derivative instruments as accounting hedges under the accounting guidance.
The related cash flow impact of our derivative activities is reflected as cash flows from operating activities unless the derivatives are determined to have a significant financing element at inception, in which case they are classified within financing activities. See Note 4, "Derivative Financial Instruments," for a more detailed discussion of our derivative activities.
NEWFIELD EXPLORATION COMPANY
NOTES TO CONSOLIDATED FINANCIAL STATEMENTS — (Continued)
Offsetting Assets and Liabilities
Our derivative financial instruments are subject to master netting arrangements and are reflected on our consolidated balance sheet accordingly. See Note 4, "Derivative Financial Instruments," for details regarding the gross amounts, as well as the impact of our netting arrangements on our net derivative position.
New Accounting Requirements
In May 2014, the Financial Accounting Standards Board (FASB) issued guidance regarding the accounting for revenue from contracts with customers. The guidance is effective for interim and annual periods beginning after December 15, 2017 and may be applied retrospectively or using a modified retrospective approach to adjust retained earnings (deficit). We will adopt the guidance in the first quarter of 2018 using the modified retrospective approach to adjust retained earnings (deficit). We have completed the process of evaluating our current revenue recognition policies to the new requirements for each of our revenue categories and have not identified any material differences in the amount and timing of revenue recognition.
In November 2016, the FASB issued guidance regarding the classification and presentation of changes in restricted cash on the statement of cash flows. The guidance requires that a statement of cash flows explains the change during the period in the total of cash, cash equivalents and amounts generally described as restricted cash or restricted cash equivalents using a retrospective approach. The guidance is effective for interim and annual periods beginning after December 15, 2017. Adoption of this standard will impact our cash flow from operations in periods with changes in restricted cash.
In January 2016, the FASB issued guidance regarding several broad topics related to the recognition and measurement of financial assets and liabilities. The guidance is effective for interim and annual periods beginning after December 15, 2017. We do not expect this guidance to have a material impact on our financial statements.
In February 2016, the FASB issued guidance regarding the accounting for leases. The guidance requires recognition of most leases on the balance sheet. The guidance requires lessees and lessors to recognize and measure leases at the beginning of the earliest period presented using a modified retrospective approach. The guidance is effective for interim and annual periods beginning after December 15, 2018. We are currently evaluating the impact of this guidance on our financial statements.
2. Accounts Receivable
Accounts receivable consisted of the following at December 31:
2017 | 2016 | |||||||
(In millions) | ||||||||
Revenue | $ | 175 | $ | 163 | ||||
Joint interest | 108 | 53 | ||||||
Other | 25 | 32 | ||||||
Reserve for doubtful accounts | (16 | ) | (16 | ) | ||||
Total accounts receivable, net | $ | 292 | $ | 232 | ||||
Reserve for doubtful accounts at December 31, 2017 and 2016 includes an allowance for $15 million related to the sale of our Malaysia operations in 2014. See Note 12, "Commitments and Contingencies" to our consolidated financial statements in Item 8 of this report for additional details regarding our Malaysia litigation.
3. | Inventories |
During 2017, 2016 and 2015, we had inventory writedowns of $2 million, $1 million and $5 million, respectively. These writedowns are included in "Operating expenses — Other" on our consolidated statement of operations and comprehensive income. At December 31, 2017, we had no crude oil inventory in China due to the shut-in of production in our Pearl field and the lifting of remaining barrels in August 2017. At December 31, 2016, the crude oil inventory from our China operations consisted of approximately 11,500 barrels.
NEWFIELD EXPLORATION COMPANY
NOTES TO CONSOLIDATED FINANCIAL STATEMENTS — (Continued)
4. | Derivative Financial Instruments |
Commodity Derivative Instruments
We utilize derivative strategies that consist of either a single derivative instrument or a combination of instruments to manage the variability in cash flows associated with the forecasted sale of our future domestic oil, natural gas, and NGL production. While the use of derivative instruments may limit or partially reduce the downside risk of adverse commodity price movements, their use also may limit future income from favorable commodity price movements.
• | Fixed-price swaps. With respect to a swap position, the counterparty is required to make a payment to us if the settlement price for any settlement period is less than the swap strike price, and we are required to make a payment to the counterparty if the settlement price for any settlement period is greater than the swap strike price. |
• | Fixed-price swaps with sold puts. A swap with a sold put position consists of a standard swap position plus a put sold by us with a strike price below the associated fixed-price swap. This structure enables us to increase the fixed-price swap with the value received through the sale of the put. If the settlement price for any settlement period falls equal to or below the put strike price, then we will only receive the difference between the swap price and the put strike price. If the settlement price is greater than the put strike price, the result is the same as it would have been with a standard swap only. |
• | Swaptions. A swaption is an option to exercise a swap where the buyer (counterparty) of the swaption purchases the right from the seller (Newfield), but not the obligation, to enter into a fixed-price swap with the seller on a predetermined date (expiration date). The swap price is a fixed price determined at the time of the swaption contract. If the swaption is exercised, the contract will become a swap treated consistent with our other fixed-price swaps. |
• | Collars (combination of purchased put options (floor) and sold call options (ceiling)). For a collar position, the counterparty is required to make a payment to us if the settlement price for any settlement period is below the floor strike price while we are required to make payment to the counterparty if the settlement price for any settlement period is above the ceiling strike price. Neither party is required to make a payment to the other party if the settlement price for any settlement period is equal to or greater than the floor strike price and equal to or less than the ceiling strike price. |
• | Collars with sold puts. A collar with a sold put position consists of a standard collar position plus a put sold by us with a strike price below the floor strike price of the collar. This structure enables us to improve the collar strike prices with the value received through the sale of the additional put. If the settlement price for any settlement period falls equal to or below the additional put strike price, then we will receive the difference between the floor strike price and the additional put strike price. If the settlement price is greater than the additional put strike price, the result is the same as it would have been with a standard collar only. |
While we do not use derivatives for speculative trading purposes, periodically, we may restructure our derivative positions by purchasing, selling or unwinding certain derivative instruments. The detailed outstanding derivative position tables below represent our net positions after considering the impacts of any applicable restructuring. For discussion of the accounting policies associated with our derivative financial instruments (including the offsetting of derivative assets and liabilities), see Note 1, "Organization and Summary of Significant Accounting Policies."
Our oil and gas derivative contracts are settled based upon reported prices on the NYMEX, and our NGLs are settled on posted prices at Mont Belvieu. The estimated fair value of these contracts is based upon various factors, including future prices, over-the-counter quotations, estimated volatility, non-performance risk adjustments using counterparty rates of default and time to maturity. The calculation of the fair value of options requires the use of an option-pricing model. See Note 5, "Fair Value Measurements."
NEWFIELD EXPLORATION COMPANY
NOTES TO CONSOLIDATED FINANCIAL STATEMENTS — (Continued)
At December 31, 2017, we had outstanding derivative positions as set forth in the tables below.
Crude Oil
NYMEX Contract Price Per Bbl | |||||||||||||||||||||||
Collars | Estimated Fair Value Asset (Liability) | ||||||||||||||||||||||
Period and Type of Instrument | Volume in MBbls | Swaps (Weighted Average) | Puts (Weighted Average) | Floors (Weighted Average) | Ceilings (Weighted Average) | ||||||||||||||||||
(In millions) | |||||||||||||||||||||||
2018: | |||||||||||||||||||||||
Swaptions (1) | — | $ | 59.00 | $ | — | $ | — | $ | — | $ | (1 | ) | |||||||||||
Fixed-price swaps | 2,733 | 51.54 | — | — | — | (21 | ) | ||||||||||||||||
Fixed-price swaps with sold puts | 644 | ||||||||||||||||||||||
Fixed-price swaps | 56.78 | — | — | — | (1 | ) | |||||||||||||||||
Sold puts(2) | — | 44.00 | — | — | — | ||||||||||||||||||
Collars | 2,002 | 50.59 | 56.70 | (9 | ) | ||||||||||||||||||
Collars with sold puts: | 14,315 | ||||||||||||||||||||||
Collars | — | — | 48.42 | 56.42 | (62 | ) | |||||||||||||||||
Sold puts | — | 39.46 | — | — | (2 | ) | |||||||||||||||||
2019: | |||||||||||||||||||||||
Collars with sold puts: | 10,566 | ||||||||||||||||||||||
Collars | — | — | 50.59 | 57.13 | (15 | ) | |||||||||||||||||
Sold puts | — | 40.60 | — | — | (11 | ) | |||||||||||||||||
Total | $ | (122 | ) | ||||||||||||||||||||
_________________
(1) | During the fourth quarter of 2017, we sold crude oil swaption contracts that, if exercised on their expiration date in the first quarter of 2018, would protect 273,000 Bbls of second quarter 2018 production from future commodity price volatility. These contracts give the counterparties the option to enter into swap contracts with us at $59.00/bbl for second quarter 2018. |
(2) | For the fixed-price swaps with sold puts, if the market price remains below our sold puts at contract settlement, we will receive the market price plus the difference between our swaps and our sold puts. |
Natural Gas
Period and Type of Instrument | NYMEX Contract Price Per MMBtu | |||||||||||||||||||||||
Collars | ||||||||||||||||||||||||
Volume in MMMBtus | Swaps (Weighted Average) | Puts (Weighted Average) | Floors (Weighted Average) | Ceilings (Weighted Average) | Estimated Fair Value Asset (Liability) | |||||||||||||||||||
(In millions) | ||||||||||||||||||||||||
2018: | ||||||||||||||||||||||||
Fixed-price swaps | 42,100 | $ | 2.99 | $ | — | $ | — | $ | — | $ | 7 | |||||||||||||
Collars | 23,500 | — | — | 3.08 | 3.61 | 7 | ||||||||||||||||||
Collars with sold puts | 6,420 | |||||||||||||||||||||||
Collars | — | — | 2.87 | 3.32 | 1 | |||||||||||||||||||
Sold puts | — | 2.30 | — | — | — | |||||||||||||||||||
2019: | ||||||||||||||||||||||||
Fixed-price swaps | 3,650 | 2.91 | — | — | — | |||||||||||||||||||
Collars | 9,000 | — | 3.00 | 3.47 | 1 | |||||||||||||||||||
Total | $ | 16 | ||||||||||||||||||||||
NEWFIELD EXPLORATION COMPANY
NOTES TO CONSOLIDATED FINANCIAL STATEMENTS — (Continued)
Natural Gas Liquids (Propane)
Period and Type of Instrument | Mont Belvieu Contract Price Per Gallon | |||||||||||
Volume in MBbls | Swaps (Weighted Average) | Estimated Fair Value Asset (Liability) | ||||||||||
(In millions) | ||||||||||||
2018: | ||||||||||||
Fixed-price swaps | 1,184 | $ | 0.81 | $ | (2 | ) | ||||||
Total | $ | (2 | ) | |||||||||
Additional Disclosures about Derivative Financial Instruments
We had derivative financial instruments recorded in our consolidated balance sheet as assets (liabilities) at their respective estimated fair value, as set forth below.
Derivative Assets | Derivative Liabilities | |||||||||||||||||||||||||||||||
Gross Fair Value | Offset in Balance Sheet | Balance Sheet Location | Gross Fair Value | Offset in Balance Sheet | Balance Sheet Location | |||||||||||||||||||||||||||
Current | Noncurrent | Current | Noncurrent | |||||||||||||||||||||||||||||
December 31, 2017 | (In millions) | (In millions) | ||||||||||||||||||||||||||||||
Oil positions | $ | 48 | $ | (48 | ) | $ | — | $ | — | $ | (170 | ) | $ | 48 | $ | (96 | ) | $ | (26 | ) | ||||||||||||
Natural gas positions | 22 | (6 | ) | 15 | 1 | (6 | ) | 6 | — | — | ||||||||||||||||||||||
NGL positions | — | — | — | — | (2 | ) | — | (2 | ) | — | ||||||||||||||||||||||
Total | $ | 70 | $ | (54 | ) | $ | 15 | $ | 1 | $ | (178 | ) | $ | 54 | $ | (98 | ) | $ | (26 | ) | ||||||||||||
December 31, 2016 | ||||||||||||||||||||||||||||||||
Oil positions | $ | 226 | $ | (151 | ) | $ | 75 | $ | — | $ | (197 | ) | $ | 151 | $ | (46 | ) | $ | — | |||||||||||||
Natural gas positions | 10 | (10 | ) | — | — | (64 | ) | 10 | (51 | ) | (3 | ) | ||||||||||||||||||||
NGL positions | — | — | — | — | — | — | — | — | ||||||||||||||||||||||||
Total | $ | 236 | $ | (161 | ) | $ | 75 | $ | — | $ | (261 | ) | $ | 161 | $ | (97 | ) | $ | (3 | ) | ||||||||||||
The amount of gain (loss) recognized in "Commodity derivative income (expense)" in our consolidated statement of operations and comprehensive income related to our derivative financial instruments follows:
Year Ended December 31, | ||||||||||||
2017 | 2016 | 2015 | ||||||||||
(In millions) | ||||||||||||
Derivatives not designated as hedging instruments: | ||||||||||||
Realized gain (loss) on oil positions | $ | 48 | $ | 199 | $ | 375 | ||||||
Realized gain (loss) on natural gas positions | (12 | ) | 2 | 130 | ||||||||
Realized gain (loss) on NGL positions | — | — | — | |||||||||
Total realized gain (loss) | 36 | 201 | 505 | |||||||||
Unrealized gain (loss) on oil positions | (152 | ) | (316 | ) | (165 | ) | ||||||
Unrealized gain (loss) on natural gas positions | 71 | (76 | ) | (81 | ) | |||||||
Unrealized gain (loss) on NGL positions | (2 | ) | — | — | ||||||||
Total unrealized gain (loss) | (83 | ) | (392 | ) | (246 | ) | ||||||
Total | $ | (47 | ) | $ | (191 | ) | $ | 259 | ||||
NEWFIELD EXPLORATION COMPANY
NOTES TO CONSOLIDATED FINANCIAL STATEMENTS — (Continued)
5. | Fair Value Measurements |
Fair value is the price that would be received to sell an asset or paid to transfer a liability in an orderly transaction between market participants at the measurement date (exit price). The authoritative guidance requires disclosure of the framework for measuring fair value and requires that fair value measurements be classified and disclosed in one of the following categories:
Level 1: | Unadjusted quoted prices in active markets that are accessible at the measurement date for identical, unrestricted assets or liabilities. We consider active markets as those in which transactions for the assets or liabilities occur with sufficient frequency and volume to provide pricing information on an ongoing basis. |
Level 2: | Quoted prices in markets that are not active, or inputs that are observable, either directly or indirectly, for substantially the full term of the asset or liability. This category includes those derivative instruments that we value using observable market data. Substantially all of these inputs are observable in the marketplace throughout the full term of the derivative instrument, can be derived from observable data or are supported by observable levels at which transactions are executed in the marketplace. Instruments in this category include non-exchange traded derivatives such as over-the-counter commodity fixed-price swaps and, as of the third quarter of 2017, commodity options (i.e. price collars, sold puts, purchased calls or swaptions). |
We use a modified Black-Scholes option pricing valuation model for option and swaption derivative contracts that considers various inputs including: (a) forward prices for commodities, (b) time value, (c) volatility factors, (d) counterparty credit risk and (e) current market and contractual prices for the underlying instruments.
Level 3: | Measured based on prices or valuation models that require inputs that are both significant to the fair value measurement and less observable from objective sources (i.e., supported by little or no market activity). |
Financial assets and liabilities are classified based on the lowest level of input that is significant to the fair value measurement. Our assessment of the significance of a particular input to the fair value measurement requires judgment and may affect the valuation of the fair value of assets and liabilities and their placement within the fair value hierarchy. We continue to evaluate our inputs to ensure the fair value level classification is appropriate. When transfers between levels occur, it is our policy to assume that the transfer occurred at the date of the event or change in circumstances that caused the transfer.
The determination of the fair values of our derivative contracts incorporates various factors, which include not only the impact of our non-performance risk on our liabilities but also the credit standing of the counterparties involved. We utilize counterparty rate of default values to assess the impact of non-performance risk when evaluating receivables from counterparties and our credit rate when evaluating liabilities.
NEWFIELD EXPLORATION COMPANY
NOTES TO CONSOLIDATED FINANCIAL STATEMENTS — (Continued)
Recurring Fair Value Measurements
The following table summarizes the valuation of our assets and liabilities that are measured at fair value on a recurring basis.
Fair Value Measurement Classification | ||||||||||||||||
Quoted Prices in Active Markets for Identical Assets or (Liabilities) (Level 1) | Significant Other Observable Inputs (Level 2) | Significant Unobservable Inputs (Level 3) | Total | |||||||||||||
(In millions) | ||||||||||||||||
As of December 31, 2017: | ||||||||||||||||
Money market fund investments | $ | 162 | $ | — | $ | — | $ | 162 | ||||||||
Deferred compensation plan assets | 7 | — | — | 7 | ||||||||||||
Equity securities available-for-sale | 12 | — | — | 12 | ||||||||||||
Oil, gas and NGL derivative contracts | — | (108 | ) | — | (108 | ) | ||||||||||
Stock-based compensation liability awards | (7 | ) | — | — | (7 | ) | ||||||||||
Total | $ | 174 | $ | (108 | ) | $ | — | $ | 66 | |||||||
As of December 31, 2016: | ||||||||||||||||
Money market fund investments | $ | 320 | $ | — | $ | — | $ | 320 | ||||||||
Deferred compensation plan assets | 6 | — | — | 6 | ||||||||||||
Equity securities available-for-sale | 9 | — | — | 9 | ||||||||||||
Oil and gas derivative swap contracts | — | 50 | — | 50 | ||||||||||||
Oil and gas derivative option contracts | — | — | (75 | ) | (75 | ) | ||||||||||
Stock-based compensation liability awards | (11 | ) | — | — | (11 | ) | ||||||||||
Total | $ | 324 | $ | 50 | $ | (75 | ) | $ | 299 | |||||||
NEWFIELD EXPLORATION COMPANY
NOTES TO CONSOLIDATED FINANCIAL STATEMENTS — (Continued)
Level 3 Fair Value Measurements
The following table sets forth a reconciliation of changes in the fair value of financial assets and liabilities classified as Level 3 in the fair value hierarchy for the indicated periods.
Derivatives | Stock-Based Compensation | Total | ||||||||||
(In millions) | ||||||||||||
Balance at January 1, 2015 | $ | (381 | ) | $ | (3 | ) | $ | (384 | ) | |||
Unrealized gains (losses) included in earnings | (217 | ) | 3 | (214 | ) | |||||||
Purchases, issuances, sales and settlements: | ||||||||||||
Settlements | 290 | — | 290 | |||||||||
Transfers into Level 3 | — | — | — | |||||||||
Transfers out of Level 3 | — | — | — | |||||||||
Balance at December 31, 2015 | $ | (308 | ) | $ | — | $ | (308 | ) | ||||
Change in unrealized gains or losses included in earnings relating to Level 3 instruments still held at December 31, 2015 | $ | (143 | ) | $ | 3 | $ | (140 | ) | ||||
Balance at January 1, 2016 | $ | (308 | ) | $ | — | $ | (308 | ) | ||||
Unrealized gains (losses) included in earnings | (33 | ) | — | (33 | ) | |||||||
Purchases, issuances, sales and settlements: | ||||||||||||
Settlements | 220 | — | 220 | |||||||||
Transfers into Level 3 | — | — | — | |||||||||
Transfers out of Level 3(1) | 46 | — | 46 | |||||||||
Balance at December 31, 2016 | $ | (75 | ) | $ | — | $ | (75 | ) | ||||
Change in unrealized gains or losses included in earnings relating to Level 3 instruments still held at December 31, 2016 | $ | 13 | $ | — | $ | 13 | ||||||
Balance at January 1, 2017 | $ | (75 | ) | $ | — | $ | (75 | ) | ||||
Unrealized gains (losses) included in earnings | (17 | ) | — | (17 | ) | |||||||
Purchases, issuances, sales and settlements: | ||||||||||||
Settlements | 30 | — | 30 | |||||||||
Transfers into Level 3 | — | — | — | |||||||||
Transfers out of Level 3(2) | 62 | — | 62 | |||||||||
Balance at December 31, 2017 | $ | — | $ | — | $ | — | ||||||
Change in unrealized gains or losses included in earnings relating to Level 3 instruments still held at December 31, 2017 | $ | — | $ | — | $ | — | ||||||
_________________
(1) | During the second quarter of 2016, we transferred $46 million of derivative option contracts out of the Level 3 category as a result of our Level 3 swaptions being exercised by the counterparties as swaps in June 2016. |
(2) | During the third quarter of 2017, we transferred $62 million of derivative option contracts out of the Level 3 hierarchy into Level 2 hierarchy as a result of our ability to derive volatility inputs from directly observable sources. |
Fair Value of Debt
The estimated fair value of our notes, based on quoted prices in active markets (Level 1) as of December 31, was as follows:
2017 | 2016 | |||||||
(In millions) | ||||||||
5¾% Senior Notes due 2022 | $ | 802 | $ | 789 | ||||
5⅝% Senior Notes due 2024 | 1,089 | 1,044 | ||||||
5⅜% Senior Notes due 2026 | 739 | 714 | ||||||
NEWFIELD EXPLORATION COMPANY
NOTES TO CONSOLIDATED FINANCIAL STATEMENTS — (Continued)
Any amounts outstanding under our revolving credit facility and money market lines of credit as of the indicated dates are stated at cost, which approximates fair value. See Note 11, "Debt."
6. | Oil and Gas Properties |
At December 31, oil and gas properties consisted of the following:
2017 | 2016 | |||||||
(In millions) | ||||||||
Proved | $ | 23,272 | $ | 21,998 | ||||
Unproved | 1,200 | 1,238 | ||||||
Gross oil and gas properties | 24,472 | 23,236 | ||||||
Accumulated depreciation, depletion and amortization | (10,032 | ) | (9,587 | ) | ||||
Accumulated impairment | (10,509 | ) | (10,509 | ) | ||||
Net oil and gas properties | $ | 3,931 | $ | 3,140 | ||||
We capitalized approximately $124 million, $121 million and $107 million of interest and direct internal costs in 2017, 2016 and 2015, respectively.
Costs withheld from amortization as of December 31, 2017 consisted of the following:
Costs Incurred In | ||||||||||||||||||||
2017 | 2016 | 2015 | 2014 | Total | ||||||||||||||||
(In millions) | ||||||||||||||||||||
Acquisition costs | $ | 108 | $ | 483 | $ | 274 | $ | 46 | $ | 911 | ||||||||||
Exploration costs | — | — | — | — | — | |||||||||||||||
Capitalized internal cost | 38 | 49 | 32 | 15 | 134 | |||||||||||||||
Capitalized interest | 61 | 51 | 33 | 10 | 155 | |||||||||||||||
Total costs withheld from amortization | $ | 207 | $ | 583 | $ | 339 | $ | 71 | $ | 1,200 | ||||||||||
NEWFIELD EXPLORATION COMPANY
NOTES TO CONSOLIDATED FINANCIAL STATEMENTS — (Continued)
Ceiling Test Impairments
Under the full cost method, we are subject to quarterly calculations of a "ceiling" or limitation on the amount of oil and gas property costs that can be capitalized on our balance sheet. At December 31, 2017, the ceiling value of our reserves was calculated based upon SEC pricing of $51.34 per barrel for oil and $2.98 per MMBtu for natural gas. Using these prices, our ceiling values exceeded the net capitalized costs of oil and gas properties for the U.S. and China, respectively, and no ceiling test impairment was required in 2017. Future declines in SEC pricing or downward revisions to our estimated proved reserves could result in additional ceiling test impairments of our oil and gas properties in subsequent periods. Ceiling test impairments during 2016 and 2015 consisted of the following:
SEC Pricing | US Ceiling Test Impairments | China Ceiling Test Impairments | Total Ceiling Test Impairments | ||||||||||||||||||||||||||||
Oil | Natural Gas | Gross | Net of Tax(1) | Gross | Net of Tax(1) | Gross | Net of Tax(1) | ||||||||||||||||||||||||
(Per Bbl) | (Per MMBtu) | (In millions) | |||||||||||||||||||||||||||||
2016 Quarter Ended: | |||||||||||||||||||||||||||||||
March 31 | $ | 46.23 | $ | 2.40 | $ | 461 | $ | 461 | $ | 45 | $ | 45 | $ | 506 | $ | 506 | |||||||||||||||
June 30 | 43.14 | 2.24 | 501 | 501 | 21 | 21 | 522 | 522 | |||||||||||||||||||||||
September 30 | 41.73 | 2.28 | — | — | — | — | — | — | |||||||||||||||||||||||
December 31 | 42.82 | 2.48 | — | — | — | — | — | — | |||||||||||||||||||||||
Total 2016 | $ | 962 | $ | 962 | $ | 66 | $ | 66 | $ | 1,028 | $ | 1,028 | |||||||||||||||||||
2015 Quarter Ended: | |||||||||||||||||||||||||||||||
March 31(2) | $ | 82.60 | $ | 3.88 | $ | 788 | $ | 496 | $ | — | $ | — | $ | 788 | $ | 496 | |||||||||||||||
June 30 | 71.56 | 3.39 | 1,521 | 958 | — | — | 1,521 | 958 | |||||||||||||||||||||||
September 30 | 59.09 | 3.06 | 1,817 | 1,193 | 72 | 29 | 1,889 | 1,222 | |||||||||||||||||||||||
December 31 | 50.11 | 2.59 | 656 | 620 | 46 | 31 | 702 | 651 | |||||||||||||||||||||||
Total 2015(2) | $ | 4,782 | $ | 3,267 | $ | 118 | $ | 60 | $ | 4,900 | $ | 3,327 | |||||||||||||||||||
_________________
(1) | Starting in the first quarter of 2016, there was no tax impact due to a full valuation allowance on our deferred tax assets. See Note 8, "Income Taxes," for additional information regarding the deferred tax asset valuation allowance. |
(2) | Excludes domestic rig impairment of $4 million. |
Bohai Bay (China) Sales Agreement
In May 2017, we closed our previously disclosed sale transaction with certain of our joint venture partners to divest our interest in the Bohai Bay field in China for approximately $32 million, including customary post-close adjustments. Upon completion of our assessment, the sale of our Bohai Bay assets did not significantly alter the relationship between capitalized costs and proved reserves for our China full cost pool and, as such, all proceeds were recorded as adjustments to our China full cost pool with no gain or loss recognized. These consolidated financial statements include the results of our Bohai Bay operations through the date of sale.
Texas Asset Sale
In September 2016, we closed the sale of substantially all of our oil and gas assets in Texas for approximately $380 million, subject to customary post-close adjustments. The sale of our Texas assets did not significantly alter the relationship between capitalized costs and proved reserves for our U.S. cost pool, and as such, all proceeds were recorded as adjustments to our domestic full cost pool with no gain or loss recognized. These consolidated financial statements include the results of our Texas operations through the date of sale.
NEWFIELD EXPLORATION COMPANY
NOTES TO CONSOLIDATED FINANCIAL STATEMENTS — (Continued)
Anadarko Basin Acquisition
In June 2016, we acquired additional properties in the Anadarko Basin STACK play for an adjusted cash purchase price of $476 million, subject to customary post-close adjustments. We also assumed asset retirement obligations of $8 million. We allocated $398 million to unproved properties and wells in progress and $86 million to proved oil and gas properties.
Other Asset Acquisitions and Sales
During 2017, 2016 and 2015, we acquired various other oil and gas properties for approximately $100 million, $7 million and $125 million, respectively, and sold certain other oil and gas properties for proceeds of approximately $72 million, $39 million and $90 million, respectively. The related cash flows and results of operations for these divested assets are included in our consolidated financial statements up to the date of sale. All of the proceeds associated with our asset sales were recorded as adjustments to our domestic full cost pool.
7. | Other Property and Equipment |
At December 31, other property and equipment consisted of the following:
2017 | 2016 | |||||||
(In millions) | ||||||||
Furniture, fixtures and equipment | $ | 165 | $ | 150 | ||||
Gathering systems and equipment | 115 | 115 | ||||||
Accumulated depreciation and amortization | (112 | ) | (98 | ) | ||||
Net other property and equipment | $ | 168 | $ | 167 | ||||
During 2017, we sold $11 million of furniture, fixtures and equipment and removed the associated asset and accumulated depreciation accordingly.
8. | Income Taxes |
For the years ended December 31, income (loss) before income taxes consisted of the following:
2017 | 2016 | 2015 | ||||||||||
(In millions) | ||||||||||||
U.S. | $ | 357 | $ | (1,181 | ) | $ | (4,865 | ) | ||||
International | 29 | (27 | ) | (82 | ) | |||||||
Total income (loss) before income taxes | $ | 386 | $ | (1,208 | ) | $ | (4,947 | ) | ||||
NEWFIELD EXPLORATION COMPANY
NOTES TO CONSOLIDATED FINANCIAL STATEMENTS — (Continued)
For the years ended December 31, the total provision (benefit) for income taxes consisted of the following:
2017 | 2016 | 2015 | ||||||||||
(In millions) | ||||||||||||
Current taxes: | ||||||||||||
U.S. federal | $ | (79 | ) | $ | (13 | ) | $ | (12 | ) | |||
U.S. state | — | — | (2 | ) | ||||||||
International | 1 | 22 | 31 | |||||||||
(78 | ) | 9 | 17 | |||||||||
Deferred taxes: | ||||||||||||
U.S. federal | 4 | 10 | (1,507 | ) | ||||||||
U.S. state | 37 | 13 | (27 | ) | ||||||||
International | (4 | ) | (10 | ) | (68 | ) | ||||||
$ | 37 | $ | 13 | $ | (1,602 | ) | ||||||
Total provision (benefit) for income taxes | $ | (41 | ) | $ | 22 | $ | (1,585 | ) | ||||
Taxes for the year were impacted by our ability to monetize $19 million of the alternative minimum tax (AMT) credit carryover on the 2017 U.S federal tax provision by an election to refund AMT credits in lieu of bonus depreciation. The newly enacted Tax Cuts and Jobs Act (the Tax Act) repealed the corporate AMT for tax years beginning January 1, 2018, and provides that any remaining AMT credit carryovers are refundable beginning in 2019. We had approximately $42 million of AMT credit carryovers at the end of 2017 that will be fully refunded between 2019 and 2022. The valuation allowance related to this deferred tax asset was released and a noncurrent receivable was established, which resulted in a tax benefit of $42 million for the year ended December 31, 2017. Also included in the net tax benefit for the year were refunds of $17 million related to the carryback of net operating losses to previously filed U.S. federal returns.
The provision for state deferred income taxes on the consolidated statement of operations for the year ended December 31, 2017 was attributable to Oklahoma state deferred tax expense. Other state taxing jurisdictions were in a net deferred tax asset position for which a corresponding valuation allowance was recorded resulting in zero deferred tax benefit for those jurisdictions.
Our effective tax rate for 2017 differs from the U.S. statutory rate primarily due to domestic and international deferred tax asset valuation allowances discussed below. The amount for state income taxes in the rate reconciliation table below is the net deferred tax expenses before valuation allowances, if any, generated from all states. This table presents a reconciliation of the United States statutory income tax rate to our effective income tax rate.
2017 | 2016 | 2015 | |||||||
U.S. statutory income tax rate | 35.0 | % | 35.0 | % | 35.0 | % | |||
State and local income taxes, net of federal effect | 6.9 | — | 0.9 | ||||||
Valuation allowance, domestic | (210.1 | ) | (35.5 | ) | (4.0 | ) | |||
Valuation allowance, international | (1.2 | ) | (2.4 | ) | (0.3 | ) | |||
Foreign tax on foreign earnings | 1.5 | 0.6 | 0.4 | ||||||
Impact of Tax Act | 157.4 | — | — | ||||||
Other | — | 0.5 | — | ||||||
Effective income tax rate | (10.5 | )% | (1.8 | )% | 32.0 | % | |||
NEWFIELD EXPLORATION COMPANY
NOTES TO CONSOLIDATED FINANCIAL STATEMENTS — (Continued)
At December 31, 2017 and 2016 respectively, the components of our deferred tax asset (liability) were as follows:
2017(1) | 2016 | ||||||
Deferred tax asset: | |||||||
Net operating loss carryforwards | $ | 314 | $ | 301 | |||
Alternative Minimum Tax credit | — | 73 | |||||
Stock-based compensation | 11 | 15 | |||||
Oil and gas properties | 15 | 306 | |||||
Commodity derivatives | 19 | 9 | |||||
Foreign tax credit | — | 593 | |||||
Other | 3 | 13 | |||||
Total deferred tax asset | 362 | 1,310 | |||||
Deferred tax asset valuation allowances | (362 | ) | (1,310 | ) | |||
Net deferred tax asset | — | — | |||||
Deferred tax liability: | |||||||
Commodity derivatives | — | — | |||||
Oil and gas properties | (76 | ) | (39 | ) | |||
Total deferred tax liability | (76 | ) | (39 | ) | |||
Net deferred tax liability | $ | (76 | ) | $ | (39 | ) | |
_________________
(1) | The December 31, 2017 deferred tax asset (liability) has been adjusted for the lower federal statutory rate under the Tax Act. |
At December 31, 2017 we have a net deferred tax liability in Oklahoma of $76 million. All other taxing jurisdictions are in a net deferred tax asset position, for which we recorded an offsetting full valuation allowance, as prescribed by the accounting standards.
Beginning January 1, 2018, our U.S. income will be taxed at a 21 percent federal corporate rate under the Tax Act. We were required to recognize the effect of this rate change on our deferred tax assets and liabilities in 2017, the period the tax rate change was enacted. We maintain a full valuation allowance on the net deferred tax asset balance, therefore the rate change resulted in a non-cash decrease to the deferred tax asset and a corresponding and offsetting decrease in the valuation allowance balances of approximately $199 million for the year ended December 31, 2017.
As of December 31, 2017 and 2016, we had gross net operating loss (NOL) carryforwards of approximately $1.75 billion and $849 million, respectively, for federal income tax and $1.5 billion for state income tax purposes, which may be used in future years to offset taxable income. To the extent not utilized, the federal NOL carryforwards will begin to expire during the years 2019 through 2037.
As of December 31, 2017 and 2016, we had foreign tax credits of approximately $0 million and $593 million, respectively, which would have expired during the years 2022 through 2026. During 2017, we filed amended returns to deduct $185 million of the foreign taxes paid, thereby converting the credit to a net operating loss carryforward. We are unable to utilize the remaining $408 million under the Tax Act and therefore, removed the deferred tax asset and the corresponding valuation allowance.
Utilization of deferred tax assets is dependent upon generating sufficient future taxable income in the appropriate jurisdictions within the carryforward period. Estimates of future taxable income can be significantly affected by changes in oil, gas and NGL prices; estimates of the timing and amount of future production; and estimates of future operating and capital costs. Therefore, no certainty exists that we will be able to fully utilize our existing deferred tax assets.
NEWFIELD EXPLORATION COMPANY
NOTES TO CONSOLIDATED FINANCIAL STATEMENTS — (Continued)
The change in our deferred tax asset valuation allowance is as follows at December 31:
2017 | 2016 | 2015 | ||||||||||
(In millions) | ||||||||||||
Balance at the beginning of the year | $ | (1,310 | ) | $ | (790 | ) | $ | (549 | ) | |||
Charged to provision for income taxes: | ||||||||||||
U.S. state net operating loss carryforwards | 7 | (4 | ) | (1 | ) | |||||||
U.S. federal and state valuation allowance | 343 | (466 | ) | (202 | ) | |||||||
Foreign tax credit valuation allowance | 593 | (21 | ) | (25 | ) | |||||||
China valuation allowance | 5 | (29 | ) | (13 | ) | |||||||
Balance at the end of the year | $ | (362 | ) | $ | (1,310 | ) | $ | (790 | ) | |||
Due to the ceiling test impairments of our oil and gas properties in prior periods, we moved from a deferred tax liability position to a deferred tax asset position in most taxing jurisdictions. We consider it more likely than not that the related tax benefits will not be realized and therefore, we recorded a full valuation allowance on our deferred tax assets of $362 million and $1.3 billion for the years ended December 31, 2017 and 2016, respectively. The net change in the U.S. federal and state valuation allowance for 2017 of $343 million included a decrease of $199 million for the corporate tax rate reduction under the Tax Act. The net change in the U.S. federal and state valuation allowance for 2016 of $466 million included an increase of $37 million for the early adoption of the simplification of employee share-based payment transactions. The net change in the foreign tax credit valuation allowance for 2017 of $593 million included a decrease of $185 million for the conversion of the credit to a net operating loss and a decrease of $408 million for the permanent loss of the foreign tax credit under the Tax Act. We recorded a full valuation allowance on our China deferred tax assets of $37 million and $42 million for the years ended December 31, 2017 and 2016, respectively.
As of December 31, 2017, we did not have a liability for uncertain tax positions, and as such, we did not accrue related interest or penalties. The tax years 2013 through 2016 remain open to examination for federal income tax purposes and by the other major taxing jurisdictions to which we are subject.
9. Accrued Liabilities
Accrued liabilities consisted of the following at December 31:
2017 | 2016 | |||||||
(In millions) | ||||||||
Revenue payable | $ | 239 | $ | 196 | ||||
Accrued capital costs | 173 | 92 | ||||||
Accrued lease operating expenses | 22 | 37 | ||||||
Employee incentive expense | 44 | 48 | ||||||
Accrued interest on debt | 67 | 67 | ||||||
Taxes payable | 11 | 15 | ||||||
Other | 35 | 43 | ||||||
Total accrued liabilities | $ | 591 | $ | 498 | ||||
NEWFIELD EXPLORATION COMPANY
NOTES TO CONSOLIDATED FINANCIAL STATEMENTS — (Continued)
10. | Asset Retirement Obligations |
The change in our ARO for each of the three years ended December 31, is set forth below:
2017 | 2016 | 2015 | ||||||||||
(In millions) | ||||||||||||
Balance at January 1 | $ | 156 | $ | 194 | $ | 186 | ||||||
Accretion expense | 9 | 10 | 10 | |||||||||
Additions(1) | 3 | 15 | 6 | |||||||||
Revisions(2) | (25 | ) | (23 | ) | (2 | ) | ||||||
Settlements(3) | (10 | ) | (40 | ) | (6 | ) | ||||||
Balance at December 31 | 133 | 156 | 194 | |||||||||
Less: Current portion of ARO at December 31 | (3 | ) | (2 | ) | (2 | ) | ||||||
Total long-term ARO at December 31 | $ | 130 | $ | 154 | $ | 192 | ||||||
_________________
(1) | For the year ended December 31, 2016, additions include $8 million of abandonment obligations assumed through our Anadarko Basin acquisition. |
(2) | Revisions are primarily due to changes in cost estimates and timing of expected abandonment. |
(3) | For the year ended December 31, 2017, settlements include $7 million related to the sale of our interest in the Bohai Bay field in China. For the year ended December 31, 2016, settlements include $35 million related to the sale of our Texas assets. See Note 6, "Oil and Gas Properties." |
11. | Debt |
At December 31, our debt consisted of the following:
2017 | 2016 | |||||||
(In millions) | ||||||||
Senior unsecured debt: | ||||||||
5¾% Senior Notes due 2022 | $ | 750 | $ | 750 | ||||
5⅝% Senior Notes due 2024 | 1,000 | 1,000 | ||||||
5⅜% Senior Notes due 2026 | 700 | 700 | ||||||
Total senior unsecured debt | 2,450 | 2,450 | ||||||
Debt issuance costs | (16 | ) | (19 | ) | ||||
Total long-term debt | $ | 2,434 | $ | 2,431 | ||||
Credit Arrangements
As of December 31, 2017, we had no borrowings under our money market lines of credit or revolving credit facility and had no letters of credit outstanding. We have a revolving credit facility that matures in June 2020 and provides borrowing capacity of $1.8 billion. As of December 31, 2017, the largest individual loan commitment by any lender was 12% of total commitments.
Subject to compliance with restrictive covenants in our credit facility, our available borrowing capacity (before any amounts drawn) under our money market lines of credit with various institutions, the availability of which is at the discretion of those financial institutions, was $125 million at December 31, 2017.
Loans under the credit facility bear interest, at our option, equal to (a) the Alternate Base Rate (as defined in the Credit Agreement), plus a margin that is based on a grid of our debt rating (100 basis points per annum at December 31, 2017) or (b) the Adjusted Eurodollar Rate (as defined in the Credit Agreement), plus a margin that is based on a grid of our debt rating (200 basis points per annum at December 31, 2017).
NEWFIELD EXPLORATION COMPANY
NOTES TO CONSOLIDATED FINANCIAL STATEMENTS — (Continued)
Under our credit facility, we pay commitment fees on available but undrawn amounts based on a grid of our debt rating (37.5 basis points per annum at December 31, 2017). We incurred aggregate commitment fees under our credit facility of approximately $7 million, $7 million and $5 million for each of the years ended December 31, 2017, 2016 and 2015, respectively, which were recorded in “Interest expense” on our consolidated statement of operations and comprehensive income. We incurred approximately $3 million of financing costs related to amending our revolving credit facility in March 2016, which were also included in "Interest expense" on our consolidated statement of operations and comprehensive income.
Our credit facility has restrictive financial covenants that include the maintenance of a ratio of total debt to book capitalization not to exceed 0.6 to 1.0 and the maintenance of a ratio of earnings before gain or loss on the disposition of assets, interest expense, income taxes and certain non-cash items (such as depreciation, depletion and amortization expense, unrealized gains and losses on commodity derivatives and ceiling test impairments) to interest expense of at least 2.5 to 1.0. At December 31, 2017, we were in compliance with all of our debt covenants.
Letters of credit are subject to a fronting fee of 20 basis points and annual fees based on a grid of our debt rating (200 basis points at December 31, 2017).
The credit facility includes events of default relating to customary matters, including, among other things, nonpayment of principal, interest or other amounts; violation of covenants; inaccuracy of representations and warranties in any material respect when made; a change of control; or certain other material adverse changes in our business. Our senior notes also contain standard events of default. If any of the foregoing defaults were to occur, our lenders under the credit facility could terminate future lending commitments, and our lenders under both the credit facility and our notes could declare the outstanding borrowings due and payable. In addition, our credit facility, senior notes and substantially all of our derivative arrangements contain provisions that provide for cross defaults and acceleration of those debt and derivative instruments in certain situations. See Note 1, "Organization and Summary of Significant Accounting Policies – Concentration of Credit Risk," for additional details.
Senior Subordinated Notes
Interest on our senior notes is payable semi-annually. The notes are unsecured and unsubordinated obligations and rank equally with all of our other existing and future unsecured and unsubordinated obligations. We may redeem some or all of our senior notes at any time before their maturity at a redemption price based on a make-whole amount plus accrued and unpaid interest to the date of redemption. The indentures governing our senior notes contain covenants that may limit our ability to, among other things, incur debt secured by liens; enter into sale/leaseback transactions; and enter into merger or consolidation transactions. The indentures also provide that if any of our subsidiaries guarantee any of our indebtedness at any time in the future, then we will cause our senior notes to be equally and ratably guaranteed by that subsidiary.
12. | Commitments and Contingencies |
We have various commitments for firm transportation, operating lease agreements for office space and other agreements. As of December 31, 2017, future minimum payments under these non-cancelable agreements are as follows:
Firm Transportation | Operating Leases (Office Space) | Drilling-Related | Other | Total | ||||||||||||||||
(In millions) | ||||||||||||||||||||
Year Ending December 31, | ||||||||||||||||||||
2018 | $ | 79 | $ | 25 | $ | 25 | $ | 18 | $ | 147 | ||||||||||
2019 | 78 | 23 | — | 14 | 115 | |||||||||||||||
2020 | 31 | 21 | — | 7 | 59 | |||||||||||||||
2021 | 21 | 22 | — | 3 | 46 | |||||||||||||||
2022 | 21 | 4 | — | 2 | 27 | |||||||||||||||
Thereafter | 106 | — | — | 17 | 123 | |||||||||||||||
Total minimum future payments | $ | 336 | $ | 95 | $ | 25 | $ | 61 | $ | 517 | ||||||||||
NEWFIELD EXPLORATION COMPANY
NOTES TO CONSOLIDATED FINANCIAL STATEMENTS — (Continued)
Firm transportation is comprised of various agreements with third parties for oil and gas gathering and transportation. Rent expense with respect to our lease commitments for office space for the years ended December 31, 2017, 2016 and 2015 was $16 million, $21 million and $35 million, respectively. Our other agreements are primarily other equipment leases. Payments under our drilling-related contracts are accounted for as capital additions to our oil and gas properties and will be less than the gross obligation disclosed in wells in which we do not own a 100% working interest.
Not included in the table above are crude oil minimum volume delivery commitments that relate to our Uinta Basin production with two Salt Lake City, Utah refiners. One delivery commitment is for approximately 15,000 barrels of oil per day through May 2020. The second commitment is for 16,000 barrels of oil per day through August 2025. As of December 31, 2017, our delivery commitments through 2025 were as follows:
Oil | |||
Year Ending December 31, | (MBbls) | ||
2018 | 12,220 | ||
2019 | 11,315 | ||
2020 | 8,136 | ||
2021 | 5,840 | ||
2022 | 5,840 | ||
Thereafter | 15,600 | ||
Total delivery commitments | 58,951 | ||
Given the volatility in oil and natural gas prices and the related impact on our 2018 planned capital investments, as well as the potential impact on development plans in future years, we could fail to deliver the minimum production required under these commitments. In the event that we are unable to meet our crude oil volume delivery commitments, we would incur deficiency fees ranging from $3.50 to $6.50 per barrel. During 2017, 2016 and 2015, we incurred $29 million, $16 million, and $0 million, of Uinta Basin deficiency fees.
Litigation
On October 19, 2017, we received notice of a request for arbitration from SapuraKencana Petroleum Berhad (SapuraKencana), the purchaser of our Malaysian business in February 2014. SapuraKencana is asserting that the Company owes approximately $89 million in damages for breach of contract and for a tax indemnity, plus interest and legal and other costs. We filed our response to the request for arbitration in December 2017. We continue to be committed to fully contesting the claims and intend to vigorously defend the Company's interest.
In May 2015, a lawsuit was filed against the Company alleging certain plugging and abandonment predecessor-in-interest liabilities related to offshore assets sold by the Company in 2010. The Company responded to the petition, denied the allegations and vigorously defended the case. The court held that the Company must bear a "portion" of the plugging and abandonment costs, but the "exact percentage" of such costs should be determined in arbitration and stayed the case pending arbitration. Through settlement negotiations surrounding the arbitration proceeding, the Company and the plaintiff reached a mutual settlement on September 23, 2016 involving a cash payment by the Company totaling $18 million. The settlement was recorded under the caption "Operating expenses — Other" on our consolidated statement of operations. On October 3, 2016, the court dismissed the case with prejudice.
We have been named as a defendant in a number of lawsuits and are involved in various other disputes, all arising in the ordinary course of our business, such as (a) claims from royalty owners for disputed royalty payments, (b) commercial disputes, (c) personal injury claims and (d) property damage claims. Although the outcome of these lawsuits and disputes cannot be predicted with certainty, we do not expect these matters to have a material adverse effect on our financial position, cash flows or results of operations.
NEWFIELD EXPLORATION COMPANY
NOTES TO CONSOLIDATED FINANCIAL STATEMENTS — (Continued)
13. | Stockholders' Equity Activity |
Common Stock
During the first quarter of 2016, we issued 34.5 million additional shares of common stock through a public equity offering for net proceeds of approximately $776 million. A portion of the proceeds was used to acquire additional properties in the Anadarko Basin STACK play and to repay borrowings under our credit facility and money market lines of credit. The remainder was available for general corporate purposes.
During the first quarter of 2015, we issued 25.3 million additional shares of common stock through a public equity offering. We received net proceeds of approximately $815 million, which were used primarily to repay all borrowings under our credit facility and money market lines of credit that were outstanding at that time.
Treasury Stock
Upon vesting of employee restricted stock awards and restricted stock units, we typically repurchase a portion of the vested shares for payment of employee tax withholding. Such repurchases are not part of a publicly announced program to repurchase shares of our common stock.
14. | Earnings Per Share |
Basic earnings per share (EPS) is calculated by dividing net income less any applicable adjustments (the numerator) by the weighted-average number of shares of common stock (excluding unvested restricted stock and restricted stock units) outstanding during the period (the denominator). Diluted EPS incorporates the dilutive impact of outstanding stock options and unvested restricted stock and restricted stock units (using the treasury stock method). Under the treasury stock method, the amount the employee must pay for exercising stock options, the amount of unrecognized compensation expense related to unvested restricted stock awards and restricted stock units and the amount of excess tax benefits that would be recorded when the award becomes deductible are assumed to be used to repurchase shares. See Note 15, "Stock-Based Compensation."
The following is the calculation of basic and diluted weighted-average shares outstanding and EPS for the indicated years.
2017 | 2016 | 2015 | ||||||||||
(In millions, except per share data) | ||||||||||||
Net income (loss) | $ | 427 | $ | (1,230 | ) | $ | (3,362 | ) | ||||
Weighted-average shares (denominator): | ||||||||||||
Weighted-average shares — basic | 199 | 193 | 159 | |||||||||
Dilution effect of stock options and unvested restricted stock and restricted stock units outstanding at end of period | 1 | — | — | |||||||||
Weighted-average shares — diluted | 200 | 193 | 159 | |||||||||
Excluded due to anti-dilutive effect | 1 | 2 | 3 | |||||||||
Earnings (loss) per share: | ||||||||||||
Basic | $ | 2.14 | $ | (6.36 | ) | $ | (21.18 | ) | ||||
Diluted | $ | 2.13 | $ | (6.36 | ) | $ | (21.18 | ) | ||||
NEWFIELD EXPLORATION COMPANY
NOTES TO CONSOLIDATED FINANCIAL STATEMENTS — (Continued)
15. | Stock-Based Compensation |
For the years ended December 31, our stock-based compensation expense consisted of the following:
2017 | 2016 | 2015 | ||||||||||
(In millions) | ||||||||||||
Equity awards | $ | 53 | $ | 32 | $ | 42 | ||||||
Liability awards | 5 | 21 | 12 | |||||||||
Total stock-based compensation expense | 58 | 53 | 54 | |||||||||
Capitalized in oil and gas properties | (17 | ) | (17 | ) | (18 | ) | ||||||
Net stock-based compensation expense | $ | 41 | $ | 36 | $ | 36 | ||||||
As of December 31, 2017, we had approximately $54 million of total unrecognized stock-based compensation expense related to unvested stock-based compensation awards that vest within four years. On December 31, 2017, the last reported sales price of our common stock on the New York Stock Exchange was $31.53 per share.
During the first quarter of 2017, we changed our qualified retirement requirements for existing market-based restricted stock units and all subsequently issued equity and liability awards. An employee becomes eligible for qualified retirement based on a combination of years of service and age. Under the revised requirements, qualified retirement allows an employee to continue vesting between 50% and 100% of awards with no additional service requirement beyond a six-month notification period. This change resulted in the accelerated recognition of stock-based compensation expense for unvested market-based restricted stock units previously issued and all subsequently issued equity and liability awards.
Equity Awards
Equity awards consist of service-based and market-based restricted stock and restricted stock units, stock options and stock purchase options under the Employee Stock Purchase Plan (ESPP). In May 2017, Newfield adopted the 2017 Omnibus Incentive Plan, as amended (2017 Plan), which replaced the 2011 Omnibus Stock Plan as the vehicle for granting equity-based compensation awards. The fair value of grants is determined utilizing the Black-Scholes option-pricing model for stock options and a Monte Carlo lattice-based model for our market-based restricted stock and restricted stock units. Compensation expense for equity awards is expected to be recognized on a straight-line basis over the required service periods.
Shares available for grant under our 2017 Plan are reduced by 1.67 times the number of shares of restricted stock or restricted stock units awarded under the plan and are reduced by 1 times the number of shares subject to stock options awarded under the plan. At December 31, 2017, we had approximately (1) 9.5 million shares available for issuance under our 2017 Plan if all future awards are stock options, or (2) 5.7 million shares available for issuance under our 2017 Plan if all future awards are restricted stock or restricted stock units. Thus far, all awards under our 2017 Plan have been granted as restricted stock or restricted stock units. We issue common shares on the grant date for restricted stock and on the exercise or vesting date for options and restricted stock units.
Restricted Stock and Restricted Stock Units. At December 31, 2017, approximately 2.0 million shares of non-vested restricted stock awards and restricted stock units were outstanding. These shares primarily vest over one to four years and vesting is dependent upon the recipient meeting applicable service requirements. In addition, at December 31, 2017, our employees held approximately 0.7 million shares of restricted stock units subject to performance-based vesting criteria (all of which are currently considered market-based restricted stock under authoritative accounting guidance).
NEWFIELD EXPLORATION COMPANY
NOTES TO CONSOLIDATED FINANCIAL STATEMENTS — (Continued)
The following table summarizes the activity for our restricted stock and restricted stock unit activity.
Service-Based Shares | Weighted- Average Grant Date Fair Value per Share | Market-Based Shares | Weighted- Average Grant Date Fair Value per Share | Total Shares | |||||||||||||
(In thousands, except per share data) | |||||||||||||||||
Non-vested shares outstanding at January 1, 2015 | 1,902 | $ | 30.79 | 945 | $ | 28.61 | 2,847 | ||||||||||
Granted | 1,036 | 31.20 | 414 | 22.85 | 1,450 | ||||||||||||
Forfeited | (367 | ) | 21.69 | (97 | ) | 36.72 | (464 | ) | |||||||||
Vested | (871 | ) | 32.10 | (188 | ) | 39.42 | (1,059 | ) | |||||||||
Non-vested shares outstanding at December 31, 2015 | 1,700 | 30.30 | 1,074 | 23.76 | 2,774 | ||||||||||||
Granted | 990 | 37.95 | 436 | (1) | 28.94 | 1,426 | |||||||||||
Forfeited | (217 | ) | 29.15 | (77 | ) | 43.04 | (294 | ) | |||||||||
Vested | (899 | ) | 29.34 | (574 | ) | 21.36 | (1,473 | ) | |||||||||
Non-vested shares outstanding at December 31, 2016 | 1,574 | 35.56 | 859 | 26.28 | 2,433 | ||||||||||||
Granted | 1,244 | 29.81 | 323 | (2) | 39.57 | 1,567 | |||||||||||
Forfeited | (91 | ) | 34.43 | (55 | ) | 37.14 | (146 | ) | |||||||||
Vested | (694 | ) | 34.67 | (386 | ) | 29.43 | (1,080 | ) | |||||||||
Non-vested shares outstanding at December 31, 2017 | 2,033 | $ | 32.41 | 741 | $ | 30.65 | 2,774 | ||||||||||
_________________
(1) | In February 2016, we granted approximately 436,000 restricted stock units, which based on achievement of certain criteria, could vest within a range of 0% to 200% of shares granted upon completion of the period ending December 31, 2018. |
(2) | In February 2017, we granted approximately 323,000 restricted stock units, which based on achievement of certain criteria, could vest within a range of 0% to 200% of shares granted upon completion of the period ending December 31, 2019. |
The total fair value of all restricted stock and restricted stock units that vested during the years ended December 31, 2017, 2016 and 2015 was $35 million, $39 million and $35 million, respectively.
Stock Options. Options generally expire ten years from the grant date and become exercisable at the rate of 20% per year. The exercise price of options cannot be less than the fair market value per share of our common stock on the grant date. We issue new shares of stock when stock options are exercised. No stock options have been granted since 2008, except for ESPP options as discussed in the Employee Stock Purchase Plan section below.
The following table provides information about outstanding stock options.
Number of Shares Underlying Options | Weighted-Average Exercise Price per Share | Weighted-Average Remaining Contractual Life | Aggregate Intrinsic Value(1) | ||||||||||
(In thousands) | (In years) | (In millions) | |||||||||||
Outstanding and exercisable at: | |||||||||||||
December 31, 2015 | 195 | $ | 48.45 | 2.1 | $ | — | |||||||
December 31, 2016 | 177 | 48.45 | 1.1 | — | |||||||||
December 31, 2017 | 155 | 48.45 | 0.1 | — | |||||||||
_________________
(1) The intrinsic value of a stock option is the amount by which the market value of our common stock at the indicated date, or at the time of exercise, exceeds the exercise price of the option.
Employee Stock Purchase Plan. In May 2010, our stockholders approved the Newfield Exploration Company 2010 Employee Stock Purchase Plan with one million shares of our common stock available for issuance. In May 2017, our stockholders approved the amended and restated ESPP, increasing the number of our common stock available for issuance by an additional two million shares. Pursuant to our employee stock purchase plan, for each six-month period beginning on January 1 or July 1 during the plan term, each eligible employee has the opportunity to purchase our common stock for a
NEWFIELD EXPLORATION COMPANY
NOTES TO CONSOLIDATED FINANCIAL STATEMENTS — (Continued)
purchase price equal to 85% of the lesser of the fair market value of our common stock on the first or last day of the period. Each employee may purchase up to $25,000 in common stock per calendar year. Employees of our China business are not eligible to participate in the plan. At December 31, 2017, approximately two million shares of our common stock remained available for issuance under the current plan.
The fair value of the options granted was determined using the Black-Scholes option valuation method assuming no dividends and an expected life of six months. For the years ended December 31, our ESPP issuances and valuation assumptions consisted of the following:
Options Issued | Weighted-Average Fair Value per Share | Risk-free Interest Rate | Weighted-Average Volatility | ||||||||||
(In thousands) | |||||||||||||
2015 | 136 | $ | 8.71 | 0.12 | % | 49.41 | % | ||||||
2016 | 99 | 10.51 | 0.43 | 47.94 | |||||||||
2017 | 124 | 9.03 | 0.87 | 39.13 | |||||||||
Liability Awards
Liability awards consist of service-based awards that are settled in cash instead of shares, as discussed below.
Cash-Settled Restricted Stock Units. The value of the cash-settled restricted stock units, and the associated stock-based compensation expense, is based on the Company's stock price at the end of each period. As of December 31, 2017, we had a liability of $7 million related to these awards. The following table provides information about cash-settled restricted stock unit activity.
Cash-Settled Restricted Stock Units | |||
(In thousands) | |||
Non-vested units outstanding at January 1, 2015 | 1,216 | ||
Granted | 211 | ||
Forfeited | (257 | ) | |
Vested | (462 | ) | |
Non-vested units outstanding at December 31, 2015 | 708 | ||
Granted | 299 | ||
Forfeited | (101 | ) | |
Vested | (446 | ) | |
Non-vested units outstanding at December 31, 2016 | 460 | ||
Granted | 241 | ||
Forfeited | (32 | ) | |
Vested | (318 | ) | |
Non-vested units outstanding at December 31, 2017 | 351 | ||
16. | Employee Benefit Plans |
Post-Retirement Medical Plan
We sponsor a post-retirement medical plan that covers all eligible retired employees until they reach age 65. An employee may become eligible upon reaching age 55 and providing 5 years of service. At December 31, 2017, both our accumulated benefit obligation and our accrued benefit costs were $22 million. Our net periodic benefit cost was approximately $3 million for each of the years ended December 31, 2017, 2016 and 2015.
NEWFIELD EXPLORATION COMPANY
NOTES TO CONSOLIDATED FINANCIAL STATEMENTS — (Continued)
The expected future benefit payments under our post-retirement medical plan for the next ten years include $8 million for the five-year period 2018 through 2022 and $10 million for the five-year period 2023 through 2027.
Annual Cash Incentive Compensation Plan
During 2010, our Board of Directors, with the recommendation of the Compensation & Management Development Committee, approved a new annual cash incentive compensation plan for all employees (the 2011 Annual Incentive Plan). Under the 2011 Annual Incentive Plan, the Compensation & Management Development Committee determines the annual award pool for all employees based upon a number of factors including the Company’s performance against stated performance goals and in comparison with peer companies in our industry. All employees are eligible if employed on October 1 and December 31 of the performance period. Beginning with the year ended December 31, 2010, our annual cash incentive compensation is paid in a single payment to employees during the first quarter after the performance period ends.
Total incentive compensation expense under the 2011 Annual Incentive Plan for the years ended December 31, 2017, 2016 and 2015 was $31 million, $35 million and $41 million, respectively.
401(k) and Deferred Compensation Plans
We sponsor a 401(k) profit sharing plan under Section 401(k) of the Internal Revenue Code. This plan covers all of our employees, excluding those of our foreign subsidiaries. We match $1.00 for each $1.00 of employee deferral, with our contribution not to exceed 8% of an employee’s salary, subject to limitations imposed by the IRS. We also sponsor a highly compensated employee deferred compensation plan. This non-qualified plan allows an eligible employee to defer a portion of his or her salary or bonus on an annual basis. We match $1.00 for each $1.00 of employee deferral, with our contribution not to exceed 8% of an employee’s salary, subject to limitations imposed by the plan. Our contribution with respect to each participant in the deferred compensation plan is reduced by the amount of contribution made by us to our 401(k) plan for that participant. Our combined contributions to these two plans were $6 million for each of the years ended December 31, 2017 and 2016, and $7 million for the year ended December 31, 2015.
17. Restructuring Costs
In April 2015 and May 2016, we announced plans to consolidate and reorganize domestic operating functions to our headquarters in The Woodlands, Texas, which resulted in a reduction of employees and closure of our offices in Denver, Colorado; North Houston (Greenspoint), Texas; and Tulsa, Oklahoma. Our decision to restructure the organization was primarily in response to the oil and gas commodity price environment. Substantially all restructuring-related costs have been recognized as expense as of December 31, 2016.
Restructuring costs recorded in our consolidated statement of operations for the years ended December 31 are set forth below.
Type of Restructuring Cost | Location in the Consolidated Statement of Operations | 2017 | 2016 | 2015 | ||||||||||
(In millions) | ||||||||||||||
Severance and related benefit costs | Operating expenses - General and administrative | $ | — | $ | 17 | $ | 7 | |||||||
Relocation costs | Operating expenses - General and administrative | 2 | 5 | 5 | ||||||||||
Office-lease abandonment costs | Operating expenses - General and administrative | — | 6 | 14 | ||||||||||
Other associated costs | Operating expenses - Depreciation, depletion and amortization | — | — | 1 | ||||||||||
Total | $ | 2 | $ | 28 | $ | 27 | ||||||||
NEWFIELD EXPLORATION COMPANY
NOTES TO CONSOLIDATED FINANCIAL STATEMENTS — (Continued)
The following table summarizes our restructuring costs and related liability.
Severance and Related Benefit Costs | Office-lease Abandonment Costs(1) | Relocation Costs | Other Associated Costs | Total | |||||||||||||||
(In millions) | |||||||||||||||||||
Restructuring liability at January 1, 2015 | $ | — | $ | — | $ | — | $ | — | $ | — | |||||||||
Additions | 7 | 14 | 5 | 1 | 27 | ||||||||||||||
Settlements | (6 | ) | (1 | ) | (5 | ) | (1 | ) | (13 | ) | |||||||||
Revisions | — | — | — | — | — | ||||||||||||||
Restructuring liability at December 31, 2015 | $ | 1 | $ | 13 | $ | — | $ | — | $ | 14 | |||||||||
Cumulative costs as of December 31, 2015 | $ | 7 | $ | 14 | $ | 5 | $ | 1 | $ | 27 | |||||||||
Restructuring liability at January 1, 2016 | $ | 1 | $ | 13 | $ | — | $ | — | $ | 14 | |||||||||
Additions | 17 | 3 | 5 | — | 25 | ||||||||||||||
Settlements | (17 | ) | (5 | ) | (5 | ) | — | (27 | ) | ||||||||||
Revisions | — | 3 | — | — | 3 | ||||||||||||||
Restructuring liability at December 31, 2016 | $ | 1 | $ | 14 | $ | — | $ | — | $ | 15 | |||||||||
Cumulative costs as of December 31, 2016 | $ | 24 | $ | 20 | $ | 10 | $ | 1 | $ | 55 | |||||||||
Restructuring liability at January 1, 2017 | $ | 1 | $ | 14 | $ | — | $ | — | $ | 15 | |||||||||
Additions | — | — | 2 | — | 2 | ||||||||||||||
Settlements | (1 | ) | (6 | ) | (2 | ) | — | (9 | ) | ||||||||||
Revisions | — | — | — | — | — | ||||||||||||||
Restructuring liability at December 31, 2017 | $ | — | $ | 8 | $ | — | $ | — | $ | 8 | |||||||||
Cumulative costs as of December 31, 2017 | $ | 24 | $ | 20 | $ | 12 | $ | 1 | $ | 57 | |||||||||
Expected total costs | $ | 24 | $ | 20 | $ | 12 | $ | 1 | $ | 57 | |||||||||
_________________
(1) | The office-lease abandonment liability will be relieved as lease payments are made and sublease income is received over the life of the lease ending 2022. |
18. | Segment Information |
While we only have operations in the oil and gas exploration and production industry, we are organizationally structured along geographic operating segments. Our current operating segments are the United States and China. The accounting policies of our operating segments are the same as those described in Note 1, "Organization and Summary of Significant Accounting Policies."
The following tables provide the geographic operating segment information for the years ended December 31, 2017, 2016 and 2015.
NEWFIELD EXPLORATION COMPANY
NOTES TO CONSOLIDATED FINANCIAL STATEMENTS — (Continued)
Domestic | China | Total | ||||||||||
(In millions) | ||||||||||||
Year Ended December 31, 2017: | ||||||||||||
Oil, gas and NGL revenues | $ | 1,679 | $ | 86 | $ | 1,765 | ||||||
Lease operating | 188 | 27 | 215 | |||||||||
Transportation and processing | 300 | — | 300 | |||||||||
Production and other taxes | 64 | — | 64 | |||||||||
Depreciation, depletion and amortization | 443 | 24 | 467 | |||||||||
Results of operations for oil and gas producing activities before tax | 684 | 35 | 719 | |||||||||
Other revenues | 2 | — | 2 | |||||||||
General and administrative | 194 | 6 | 200 | |||||||||
Other | 5 | 1 | 6 | |||||||||
Allocated income tax (benefit)(1) | 180 | 17 | ||||||||||
Net income (loss) from oil and gas properties | $ | 307 | $ | 11 | ||||||||
Total revenues | 1,767 | |||||||||||
Total operating expenses | 1,252 | |||||||||||
Income (loss) from operations | 515 | |||||||||||
Interest expense, net of interest income, capitalized interest and other | (82 | ) | ||||||||||
Commodity derivative income (expense) | (47 | ) | ||||||||||
Income (loss) from operations before income taxes | $ | 386 | ||||||||||
Total assets | $ | 4,875 | $ | 86 | $ | 4,961 | ||||||
Additions to long-lived assets | $ | 1,288 | $ | 1 | $ | 1,289 | ||||||
_________________
(1) | Allocated income tax based on estimated combined federal and state statutory tax rates in effect during the period, comprised of 37% for domestic and 60% for China. |
NEWFIELD EXPLORATION COMPANY
NOTES TO CONSOLIDATED FINANCIAL STATEMENTS — (Continued)
Domestic | China | Total | ||||||||||
(In millions) | ||||||||||||
Year Ended December 31, 2016: | ||||||||||||
Oil, gas and NGL revenues | $ | 1,251 | $ | 217 | $ | 1,468 | ||||||
Lease operating | 189 | 55 | 244 | |||||||||
Transportation and processing | 272 | — | 272 | |||||||||
Production and other taxes | 41 | 1 | 42 | |||||||||
Depreciation, depletion and amortization | 458 | 114 | 572 | |||||||||
Ceiling test and other impairments | 962 | 66 | 1,028 | |||||||||
Results of operations for oil and gas producing activities before tax | (671 | ) | (19 | ) | (690 | ) | ||||||
Other revenues | 4 | — | 4 | |||||||||
General and administrative | 205 | 8 | 213 | |||||||||
Other | 20 | — | 20 | |||||||||
Allocated income tax (benefit)(1) | (330 | ) | (16 | ) | ||||||||
Net income (loss) from oil and gas properties | $ | (562 | ) | $ | (11 | ) | ||||||
Total revenues | 1,472 | |||||||||||
Total operating expenses | 2,391 | |||||||||||
Income (loss) from operations | (919 | ) | ||||||||||
Interest expense, net of interest income, capitalized interest and other | (98 | ) | ||||||||||
Commodity derivative income (expense) | (191 | ) | ||||||||||
Income (loss) from operations before income taxes | $ | (1,208 | ) | |||||||||
Total assets | $ | 4,166 | $ | 146 | $ | 4,312 | ||||||
Additions to long-lived assets | $ | 1,369 | $ | 2 | $ | 1,371 | ||||||
_________________
(1) | Allocated income tax based on estimated combined federal and state statutory tax rates in effect during the period, comprised of 37% for domestic and 60% for China. |
NEWFIELD EXPLORATION COMPANY
NOTES TO CONSOLIDATED FINANCIAL STATEMENTS — (Continued)
Domestic | China | Total | ||||||||||
(In millions) | ||||||||||||
Year Ended December 31, 2015: | ||||||||||||
Oil, gas and NGL revenues | $ | 1,288 | $ | 262 | $ | 1,550 | ||||||
Lease operating | 231 | 54 | 285 | |||||||||
Transportation and processing | 212 | — | 212 | |||||||||
Production and other taxes | 45 | 1 | 46 | |||||||||
Depreciation, depletion and amortization | 754 | 163 | 917 | |||||||||
Ceiling test and other impairments | 4,786 | 118 | 4,904 | |||||||||
Results of operations for oil and gas producing activities before tax | (4,740 | ) | (74 | ) | (4,814 | ) | ||||||
Other revenues | 7 | — | 7 | |||||||||
General and administrative | 237 | 7 | 244 | |||||||||
Other | 9 | 1 | 10 | |||||||||
Allocated income tax (benefit)(1) | (1,842 | ) | (49 | ) | ||||||||
Net income (loss) from oil and gas properties | $ | (3,137 | ) | $ | (33 | ) | ||||||
Total revenues | 1,557 | |||||||||||
Total operating expenses | 6,618 | |||||||||||
Income (loss) from operations | (5,061 | ) | ||||||||||
Interest expense, net of interest income, capitalized interest and other | (145 | ) | ||||||||||
Commodity derivative income (expense) | 259 | |||||||||||
Income (loss) from operations before income taxes | $ | (4,947 | ) | |||||||||
Total assets | $ | 4,452 | $ | 316 | $ | 4,768 | ||||||
Additions to long-lived assets | $ | 1,645 | $ | 100 | $ | 1,745 | ||||||
_________________
(1) | Allocated income tax based on estimated combined federal and state statutory tax rates in effect during the period, comprised of 37%% for domestic and 60% for China. |
19. | Supplemental Cash Flow Information |
The following table presents information about supplemental cash flows for each of the three years ended December 31:
2017 | 2016 | 2015 | ||||||||||
(In millions) | ||||||||||||
Cash Payments: | ||||||||||||
Interest payments | $ | 84 | $ | 97 | $ | 119 | ||||||
Income tax payments (refunds) | (2 | ) | 17 | 25 | ||||||||
Non-cash investing and financing activities excluded from the statement of cash flows: | ||||||||||||
(Increase) decrease in receivables for property sales | $ | — | $ | 6 | $ | 6 | ||||||
(Increase) decrease in accrued capital expenditures | (81 | ) | 33 | 225 | ||||||||
(Increase) decrease in asset retirement costs | 31 | 46 | (4 | ) | ||||||||
NEWFIELD EXPLORATION COMPANY
NOTES TO CONSOLIDATED FINANCIAL STATEMENTS — (Continued)
20. | Quarterly Results of Operations (Unaudited) |
The results of operations by quarter for the indicated periods are as follows:
2017 Quarter Ended | ||||||||||||||||
March 31 | June 30 | September 30 | December 31 | |||||||||||||
(In millions, except per share data) | ||||||||||||||||
Oil, gas and NGL revenues | $ | 417 | $ | 402 | $ | 439 | $ | 509 | ||||||||
Income (loss) from operations | 121 | 99 | 112 | 183 | ||||||||||||
Net income (loss) | 147 | 98 | 87 | 95 | ||||||||||||
Basic earnings (loss) per share(1) | 0.74 | 0.49 | 0.44 | 0.47 | ||||||||||||
Diluted earnings (loss) per share(1) | 0.73 | 0.49 | 0.44 | 0.47 | ||||||||||||
2016 Quarter Ended | ||||||||||||||||
March 31 | June 30 | September 30 | December 31 | |||||||||||||
(In millions, except per share data) | ||||||||||||||||
Oil, gas and NGL revenues | $ | 284 | $ | 381 | $ | 392 | $ | 415 | ||||||||
Ceiling test and other impairments | 506 | 522 | — | — | ||||||||||||
Income (loss) from operations(2) | (578 | ) | (498 | ) | 45 | 112 | ||||||||||
Net income (loss)(2) | (624 | ) | (667 | ) | 48 | 13 | ||||||||||
Basic earnings (loss) per share(1) | (3.52 | ) | (3.36 | ) | 0.24 | 0.07 | ||||||||||
Diluted earnings (loss) per share(1) | (3.52 | ) | (3.36 | ) | 0.24 | 0.07 | ||||||||||
_________________
(1) | The sum of the individual quarterly earnings (loss) per share may not agree with year-to-date earnings (loss) per share as each quarterly computation is based on the income or loss for that quarter and the weighted-average number of shares outstanding during that quarter. |
(2) | Income (loss) from operations and Net income (loss) for the third quarter of 2016 include a legal settlement of $18 million. See Note 12, "Commitments and Contingencies — Litigation" for additional information. |
Net income increased quarter over quarter by $8 million for the period ended December 31, 2017, driven by higher revenues partially offset by hedging losses. Tax benefits of $45 million were recognized in the fourth quarter of 2017, compared to $26 million in the prior quarter.
NEWFIELD EXPLORATION COMPANY
SUPPLEMENTARY FINANCIAL INFORMATION
SUPPLEMENTARY OIL AND GAS DISCLOSURES — UNAUDITED
Costs Incurred
The following tables present costs incurred for oil and gas property acquisitions, exploration and development for the respective years:
Domestic | China | Total | ||||||||||
(In millions) | ||||||||||||
2017: | ||||||||||||
Property acquisitions: | ||||||||||||
Unproved | $ | 98 | $ | — | $ | 98 | ||||||
Proved | 104 | — | 104 | |||||||||
Exploration | 704 | — | 704 | |||||||||
Development | 430 | 5 | 435 | |||||||||
Total costs incurred(1) | $ | 1,336 | $ | 5 | $ | 1,341 | ||||||
2016: | ||||||||||||
Property acquisitions: | ||||||||||||
Unproved | $ | 491 | $ | — | $ | 491 | ||||||
Proved | 88 | — | 88 | |||||||||
Exploration | 535 | — | 535 | |||||||||
Development | 210 | (1 | ) | 209 | ||||||||
Total costs incurred(1) | $ | 1,324 | $ | (1 | ) | $ | 1,323 | |||||
2015: | ||||||||||||
Property acquisitions: | ||||||||||||
Unproved | $ | 283 | $ | 1 | $ | 284 | ||||||
Proved | 21 | — | 21 | |||||||||
Exploration | 578 | — | 578 | |||||||||
Development | 630 | 15 | 645 | |||||||||
Total costs incurred(1) | $ | 1,512 | $ | 16 | $ | 1,528 | ||||||
_________________
(1) | Includes net changes in asset retirement costs of $(20) million, $(8) million and $4 million for 2017, 2016 and 2015, respectively. |
NEWFIELD EXPLORATION COMPANY
SUPPLEMENTARY FINANCIAL INFORMATION
SUPPLEMENTARY OIL AND GAS DISCLOSURES — UNAUDITED — (Continued)
Capitalized Costs
Capitalized costs for our oil and gas producing activities consisted of the following:
Domestic | China | Total | ||||||||||
(In millions) | ||||||||||||
December 31, 2017: | ||||||||||||
Proved properties | $ | 22,638 | $ | 634 | $ | 23,272 | ||||||
Unproved properties | 1,200 | — | 1,200 | |||||||||
23,838 | 634 | 24,472 | ||||||||||
Accumulated depreciation, depletion and amortization | (9,614 | ) | (418 | ) | (10,032 | ) | ||||||
Accumulated impairment | (10,325 | ) | (184 | ) | (10,509 | ) | ||||||
Net capitalized costs | $ | 3,899 | $ | 32 | $ | 3,931 | ||||||
December 31, 2016: | ||||||||||||
Proved properties | $ | 21,331 | $ | 667 | $ | 21,998 | ||||||
Unproved properties | 1,238 | — | 1,238 | |||||||||
22,569 | 667 | 23,236 | ||||||||||
Accumulated depreciation, depletion and amortization | (9,192 | ) | (395 | ) | (9,587 | ) | ||||||
Accumulated impairment | (10,325 | ) | (184 | ) | (10,509 | ) | ||||||
Net capitalized costs | $ | 3,052 | $ | 88 | $ | 3,140 | ||||||
Items reducing the capitalized costs of our oil and gas properties which are not included in total costs incurred are as follows:
2017 | 2016 | |||||||
(In millions) | ||||||||
Property sales — Domestic | $ | 65 | $ | 398 | ||||
Property sales — Domestic asset retirement costs | 3 | 37 | ||||||
Property sales — China | 31 | — | ||||||
Property sales — China asset retirement costs | 7 | — | ||||||
Ceiling test impairment — Domestic | — | 962 | ||||||
Ceiling test impairment — China | — | 66 | ||||||
$ | 106 | $ | 1,463 | |||||
Reserves
Users of this information should be aware that the process of estimating quantities of proved and proved developed oil and gas reserves is very complex, requiring significant subjective decisions in the evaluation of all available geological, engineering and economic data for each reservoir. The data for a given reservoir also may change substantially over time as a result of numerous factors, including additional development activity, evolving production history and continual reassessment of the viability of production under varying economic conditions. Consequently, material revisions to existing reserve estimates may occur from time to time.
Reserves Estimates. All reserve information in this report is based on estimates prepared by our petroleum engineering staff and is the responsibility of management. The preparation of our oil and gas reserves estimates is completed in accordance with our prescribed internal control procedures, which include verification of data input into our reserves forecasting and economics evaluation software, as well as multi-discipline management reviews. The technical employee responsible for overseeing the preparation of the reserves estimates has a Bachelor of Science in Petroleum Engineering, with more than 35 years of industry experience (including over 25 years of experience in reserve estimation).
Our reserves estimates use available geological and reservoir data as well as production performance data. Our petroleum engineering staff review estimates annually with management and revise the estimates, either upward or downward, as warranted by available data. The data reviewed includes, among other things, seismic data, well logs, production tests, reservoir pressures and individual well and field performance data. The data incorporated into our interpretations includes structure and
NEWFIELD EXPLORATION COMPANY
SUPPLEMENTARY FINANCIAL INFORMATION
SUPPLEMENTARY OIL AND GAS DISCLOSURES — UNAUDITED — (Continued)
isopach maps, individual well and field performance and other engineering and geological work products such as material balance calculations and reservoir simulation to arrive at conclusions about individual well and field projections. Additionally, offset performance data, operating expenses, capital costs and product prices factor into estimating quantities of reserves. Revisions are necessary due to changes in, among other things, reservoir performance, prices, economic conditions and governmental regulations, as well as changes in the expected recovery rates associated with development drilling. Sustained decreases in prices, for example, may cause a reduction in some reserves due to reaching economic limits sooner.
Reserves Activity Overview. The following is a discussion of our proved reserves and reserve additions and revisions.
Year Ended December 31, | |||||||||
2017 | 2016 | 2015 | |||||||
(MMBOE) | |||||||||
Proved Reserves: | |||||||||
Beginning of year | 513 | 509 | 645 | ||||||
Reserve additions | 76 | 77 | 102 | ||||||
Reserve revisions | 153 | 21 | (174 | ) | |||||
Sales of properties | (4 | ) | (35 | ) | (8 | ) | |||
Production | (58 | ) | (59 | ) | (56 | ) | |||
End of year | 680 | 513 | 509 | ||||||
During 2017, our proved reserves increased 167 MMBOE primarily as a result of positive performance revisions of 139 MMBOE and revisions of 14 MMBOE resulting from commodity price increases. During 2017, we added proved reserves of 76 MMBOE, which included 2 MMBOE of reserves purchased and 74 MMBOE added through extensions, discoveries and other additions. We also sold non-strategic assets of 4 MMBOE and produced 58 MMBOE.
During 2016, our proved reserves increased 4 MMBOE primarily as a result of positive performance revisions of 36 MMBOE and cost structure improvement revisions of 7 MMBOE. Performance revisions and cost structure improvements were partially offset by negative revisions of 22 MMBOE resulting from commodity price decreases. During 2016, we added proved reserves of 77 MMBOE, which included 35 MMBOE of reserves purchased and 42 MMBOE added through extensions, discoveries and other additions. We also sold non-strategic assets of 35 MMBOE and produced 59 MMBOE.
During 2015, our proved reserves decreased 136 MMBOE primarily as a result of negative revisions of 286 MMBOE resulting from commodity price decreases. Price revisions were partially offset by positive revisions of 24 MMBOE and cost structure improvement revisions of 88 MMBOE. During 2015 we added proved reserves (through extensions, discoveries, improved recovery and other additions) of 102 MMBOE. We also sold non-strategic assets of 8 MMBOE and produced 56 MMBOE.
NEWFIELD EXPLORATION COMPANY
SUPPLEMENTARY FINANCIAL INFORMATION
SUPPLEMENTARY OIL AND GAS DISCLOSURES — UNAUDITED — (Continued)
Estimated Net Quantities of Proved Oil and Gas Reserves
The following table sets forth our total net proved reserves and our total net proved developed and undeveloped reserves as of December 31, 2014, 2015, 2016 and 2017 and the changes in our total net proved reserves during the three-year period ended December 31, 2017:
Crude Oil and Condensate (MMBbls) | Natural Gas (Bcf) | |||||||||||||||||
Domestic | China(1) | Total | Domestic | China(1) | Total | |||||||||||||
Proved developed and undeveloped reserves as of: | ||||||||||||||||||
December 31, 2014 | 278 | 23 | 301 | 1,607 | — | 1,607 | ||||||||||||
Revisions of previous estimates | (105 | ) | (7 | ) | (112 | ) | (352 | ) | — | (352 | ) | |||||||
Extensions, discoveries and other additions | 49 | — | 49 | 187 | — | 187 | ||||||||||||
Purchases of properties | 1 | — | 1 | 2 | — | 2 | ||||||||||||
Sales of properties | (5 | ) | — | (5 | ) | (15 | ) | — | (15 | ) | ||||||||
Production | (21 | ) | (6 | ) | (27 | ) | (124 | ) | — | (124 | ) | |||||||
December 31, 2015 | 197 | 10 | 207 | 1,305 | — | 1,305 | ||||||||||||
Revisions of previous estimates | (9 | ) | — | (9 | ) | 116 | — | 116 | ||||||||||
Extensions, discoveries and other additions | 19 | — | 19 | 92 | — | 92 | ||||||||||||
Purchases of properties | 12 | — | 12 | 90 | — | 90 | ||||||||||||
Sales of properties | (13 | ) | — | (13 | ) | (102 | ) | — | (102 | ) | ||||||||
Production | (21 | ) | (5 | ) | (26 | ) | (135 | ) | — | (135 | ) | |||||||
December 31, 2016 | 185 | 5 | 190 | 1,366 | — | 1,366 | ||||||||||||
Revisions of previous estimates | 50 | 2 | 52 | 318 | — | 318 | ||||||||||||
Extensions, discoveries and other additions | 35 | — | 35 | 151 | — | 151 | ||||||||||||
Purchases of properties | 1 | — | 1 | 2 | — | 2 | ||||||||||||
Sales of properties | (1 | ) | (3 | ) | (4 | ) | (3 | ) | — | (3 | ) | |||||||
Production | (22 | ) | (2 | ) | (24 | ) | (130 | ) | — | (130 | ) | |||||||
December 31, 2017 | 248 | 2 | 250 | 1,704 | — | 1,704 | ||||||||||||
Proved developed reserves as of: | ||||||||||||||||||
December 31, 2014 | 135 | 9 | 144 | 938 | — | 938 | ||||||||||||
December 31, 2015 | 115 | 10 | 125 | 942 | — | 942 | ||||||||||||
December 31, 2016 | 104 | 5 | 109 | 928 | — | 928 | ||||||||||||
December 31, 2017 | 136 | 2 | 138 | 1,099 | — | 1,099 | ||||||||||||
Proved undeveloped reserves as of: | ||||||||||||||||||
December 31, 2014 | 143 | 14 | 157 | 669 | — | 669 | ||||||||||||
December 31, 2015 | 82 | — | 82 | 363 | — | 363 | ||||||||||||
December 31, 2016 | 81 | — | 81 | 438 | — | 438 | ||||||||||||
December 31, 2017 | 112 | — | 112 | 605 | — | 605 | ||||||||||||
_________________
(1) | All of our reserves in China are associated with production sharing contracts and are calculated using the economic interest method. |
NEWFIELD EXPLORATION COMPANY
SUPPLEMENTARY FINANCIAL INFORMATION
SUPPLEMENTARY OIL AND GAS DISCLOSURES — UNAUDITED — (Continued)
Estimated Net Quantities of Proved Oil and Gas Reserves — (Continued)
NGLs (MMBbls) | Total (MMBOE) | |||||||||||||||||
Domestic | China(1) | Total | Domestic | China(1) | Total | |||||||||||||
Proved developed and undeveloped reserves as of: | ||||||||||||||||||
December 31, 2014 | 76 | — | 76 | 622 | 23 | 645 | ||||||||||||
Revisions of previous estimates | (3 | ) | — | (3 | ) | (167 | ) | (7 | ) | (174 | ) | |||||||
Extensions, discoveries and other additions | 20 | — | 20 | 101 | — | 101 | ||||||||||||
Purchases of properties | — | — | — | 1 | — | 1 | ||||||||||||
Sales of properties | — | — | — | (8 | ) | — | (8 | ) | ||||||||||
Production | (9 | ) | — | (9 | ) | (50 | ) | (6 | ) | (56 | ) | |||||||
December 31, 2015 | 84 | — | 84 | 499 | 10 | 509 | ||||||||||||
Revisions of previous estimates | 13 | — | 13 | 21 | — | 21 | ||||||||||||
Extensions, discoveries and other additions | 8 | — | 8 | 42 | — | 42 | ||||||||||||
Purchases of properties | 7 | — | 7 | 35 | — | 35 | ||||||||||||
Sales of properties | (6 | ) | — | (6 | ) | (35 | ) | — | (35 | ) | ||||||||
Production | (11 | ) | — | (11 | ) | (54 | ) | (5 | ) | (59 | ) | |||||||
December 31, 2016 | 95 | — | 95 | 508 | 5 | 513 | ||||||||||||
Revisions of previous estimates | 49 | — | 49 | 151 | 2 | 153 | ||||||||||||
Extensions, discoveries and other additions | 14 | — | 14 | 74 | — | 74 | ||||||||||||
Purchases of properties | — | — | — | 2 | — | 2 | ||||||||||||
Sales of properties | — | — | — | (1 | ) | (3 | ) | (4 | ) | |||||||||
Production | (12 | ) | — | (12 | ) | (56 | ) | (2 | ) | (58 | ) | |||||||
December 31, 2017 | 146 | — | 146 | 678 | 2 | 680 | ||||||||||||
Proved developed reserves as of: | ||||||||||||||||||
December 31, 2014 | 38 | — | 38 | 329 | 9 | 338 | ||||||||||||
December 31, 2015 | 47 | — | 47 | 319 | 10 | 329 | ||||||||||||
December 31, 2016 | 50 | — | 50 | 309 | 5 | 314 | ||||||||||||
December 31, 2017 | 78 | — | 78 | 398 | 2 | 400 | ||||||||||||
Proved undeveloped reserves as of: | ||||||||||||||||||
December 31, 2014 | 38 | — | 38 | 293 | 14 | 307 | ||||||||||||
December 31, 2015 | 37 | — | 37 | 180 | — | 180 | ||||||||||||
December 31, 2016 | 45 | — | 45 | 199 | — | 199 | ||||||||||||
December 31, 2017 | 68 | — | 68 | 280 | — | 280 | ||||||||||||
_________________
(1) | All of our reserves in China are associated with production sharing contracts and are calculated using the economic interest method. |
NEWFIELD EXPLORATION COMPANY
SUPPLEMENTARY FINANCIAL INFORMATION
SUPPLEMENTARY OIL AND GAS DISCLOSURES — UNAUDITED — (Continued)
Standardized Measure of Discounted Future Net Cash Flows Relating to Proved Oil and Gas Reserves
The standardized measure of discounted future net cash flows from our estimated proved oil and gas reserves is as follows:
Domestic | China | Total | ||||||||||
(In millions) | ||||||||||||
December 31, 2017: | ||||||||||||
Future cash inflows | $ | 20,346 | $ | 120 | $ | 20,466 | ||||||
Less related future: | ||||||||||||
Production costs | (8,193 | ) | (53 | ) | (8,246 | ) | ||||||
Development and abandonment costs | (2,786 | ) | (16 | ) | (2,802 | ) | ||||||
Future net cash flows before income taxes | 9,367 | 51 | 9,418 | |||||||||
Future income tax expense | (1,091 | ) | — | (1,091 | ) | |||||||
Future net cash flows before 10% discount | 8,276 | 51 | 8,327 | |||||||||
10% annual discount for estimating timing of cash flows | (3,922 | ) | (4 | ) | (3,926 | ) | ||||||
Standardized measure of discounted future net cash flows | $ | 4,354 | $ | 47 | $ | 4,401 | ||||||
December 31, 2016: | ||||||||||||
Future cash inflows | $ | 11,778 | $ | 220 | $ | 11,998 | ||||||
Less related future: | ||||||||||||
Production costs | (5,191 | ) | (96 | ) | (5,287 | ) | ||||||
Development and abandonment costs | (1,993 | ) | (44 | ) | (2,037 | ) | ||||||
Future net cash flows before income taxes | 4,594 | 80 | 4,674 | |||||||||
Future income tax expense | (207 | ) | — | (207 | ) | |||||||
Future net cash flows before 10% discount | 4,387 | 80 | 4,467 | |||||||||
10% annual discount for estimating timing of cash flows | (1,867 | ) | (16 | ) | (1,883 | ) | ||||||
Standardized measure of discounted future net cash flows | $ | 2,520 | $ | 64 | $ | 2,584 | ||||||
December 31, 2015: | ||||||||||||
Future cash inflows | $ | 12,932 | $ | 512 | $ | 13,444 | ||||||
Less related future: | ||||||||||||
Production costs | (5,914 | ) | (202 | ) | (6,116 | ) | ||||||
Development and abandonment costs | (2,262 | ) | (44 | ) | (2,306 | ) | ||||||
Future net cash flows before income taxes | 4,756 | 266 | 5,022 | |||||||||
Future income tax expense | (211 | ) | 3 | (208 | ) | |||||||
Future net cash flows before 10% discount | 4,545 | 269 | 4,814 | |||||||||
10% annual discount for estimating timing of cash flows | (1,991 | ) | (47 | ) | (2,038 | ) | ||||||
Standardized measure of discounted future net cash flows | $ | 2,554 | $ | 222 | $ | 2,776 | ||||||
NEWFIELD EXPLORATION COMPANY
SUPPLEMENTARY FINANCIAL INFORMATION
SUPPLEMENTARY OIL AND GAS DISCLOSURES — UNAUDITED — (Continued)
Set forth in the table below is a summary of the changes in the standardized measure of discounted future net cash flows for our proved oil and gas reserves during each of the years in the three-year period ended December 31, 2017:
Domestic | China | Total | ||||||||||
(In millions) | ||||||||||||
2017: | ||||||||||||
Beginning of the period | $ | 2,520 | $ | 64 | $ | 2,584 | ||||||
Revisions of previous estimates: | ||||||||||||
Changes in prices and costs | 1,393 | (9 | ) | 1,384 | ||||||||
Changes in quantities | 1,387 | 42 | 1,429 | |||||||||
Changes in future development costs | (728 | ) | 13 | (715 | ) | |||||||
Previously estimated development costs incurred during the period | 456 | 1 | 457 | |||||||||
Additions to proved reserves resulting from extensions, discoveries and improved recovery, less related costs | 658 | — | 658 | |||||||||
Purchases and sales of reserves in place, net | 21 | (46 | ) | (25 | ) | |||||||
Accretion of discount | 247 | 6 | 253 | |||||||||
Sales of oil and gas, net of production costs | (1,127 | ) | (59 | ) | (1,186 | ) | ||||||
Net change in income taxes | (444 | ) | — | (444 | ) | |||||||
Production timing and other | (29 | ) | 35 | 6 | ||||||||
Net increase (decrease) | 1,834 | (17 | ) | 1,817 | ||||||||
End of period | $ | 4,354 | $ | 47 | $ | 4,401 | ||||||
2016: | ||||||||||||
Beginning of the period | $ | 2,554 | $ | 222 | $ | 2,776 | ||||||
Revisions of previous estimates: | ||||||||||||
Changes in prices and costs | (481 | ) | (27 | ) | (508 | ) | ||||||
Changes in quantities | 153 | 4 | 157 | |||||||||
Changes in future development costs | 186 | 2 | 188 | |||||||||
Previously estimated development costs incurred during the period | 228 | — | 228 | |||||||||
Additions to proved reserves resulting from extensions, discoveries and improved recovery, less related costs | 418 | — | 418 | |||||||||
Purchases and sales of reserves in place, net | 135 | — | 135 | |||||||||
Accretion of discount | 235 | 16 | 251 | |||||||||
Sales of oil and gas, net of production costs | (749 | ) | (161 | ) | (910 | ) | ||||||
Net change in income taxes | 63 | — | 63 | |||||||||
Production timing and other | (222 | ) | 8 | (214 | ) | |||||||
Net increase (decrease) | (34 | ) | (158 | ) | (192 | ) | ||||||
End of period | $ | 2,520 | $ | 64 | $ | 2,584 | ||||||
2015: | ||||||||||||
Beginning of the period | $ | 5,330 | $ | 882 | $ | 6,212 | ||||||
Revisions of previous estimates: | ||||||||||||
Changes in prices and costs | (6,126 | ) | (528 | ) | (6,654 | ) | ||||||
Changes in quantities | (1,140 | ) | (181 | ) | (1,321 | ) | ||||||
Changes in future development costs | 2,179 | 14 | 2,193 | |||||||||
Previously estimated development costs incurred during the period | 630 | 16 | 646 | |||||||||
Additions to proved reserves resulting from extensions, discoveries and improved recovery, less related costs | 522 | 4 | 526 | |||||||||
Purchases and sales of reserves in place, net | (21 | ) | — | (21 | ) | |||||||
Accretion of discount | 855 | 88 | 943 | |||||||||
Sales of oil and gas, net of production costs | (800 | ) | (207 | ) | (1,007 | ) | ||||||
Net change in income taxes | 2,229 | 182 | 2,411 | |||||||||
Production timing and other | (1,104 | ) | (48 | ) | (1,152 | ) | ||||||
Net increase (decrease) | (2,776 | ) | (660 | ) | (3,436 | ) | ||||||
End of period | $ | 2,554 | $ | 222 | $ | 2,776 | ||||||
Item 9. Changes in and Disagreements with Accountants on Accounting and Financial Disclosure
None.
Item 9A. Controls and Procedures
Disclosure Controls and Procedures
As of the end of the period covered by this report, we carried out an evaluation, under the supervision and with the participation of our Chief Executive Officer and our Chief Financial Officer, of the effectiveness of our disclosure controls and procedures (as defined in Rule 13a-15(e) of the Securities Exchange Act of 1934). Based on that evaluation, our Chief Executive Officer and our Chief Financial Officer concluded that our disclosure controls and procedures were effective as of December 31, 2017.
Management’s Report on Internal Control over Financial Reporting and Report of Independent Registered Public Accounting Firm
The information required to be furnished pursuant to this item is set forth under the captions "Management’s Report on Internal Control over Financial Reporting" and "Report of Independent Registered Public Accounting Firm" in Item 8 of this report.
Changes in Internal Control over Financial Reporting
As of the end of the period covered by this report, we carried out an evaluation, under the supervision and with the participation of our Chief Executive Officer and our Chief Financial Officer, of our internal control over financial reporting to determine whether any changes occurred during the fourth quarter of 2017 that have materially affected, or are reasonably likely to materially affect, our internal control over financial reporting. Based on that evaluation, there were no changes in our internal control over financial reporting that have materially affected, or are reasonably likely to materially affect, our internal control over financial reporting.
Item 9B. Other Information
None.
PART III
Item 10. Directors, Executive Officers and Corporate Governance
The information appearing under the headings "Proposal 1: Election of Directors," "Section 16(a) Beneficial Ownership Reporting Compliance," "Board Leadership Structure," "Director Independence" and "Audit Committee" in our proxy statement for our 2018 annual meeting of stockholders to be held on May 15, 2018 (the "2018 Proxy Statement") and the information set forth under the heading "Executive Officers of the Registrant" in this report are incorporated herein by reference.
Corporate Code of Business Conduct and Ethics
We have adopted a corporate code of business conduct and ethics for directors, officers (including our principal executive officer, principal financial officer and controller or principal accounting officer) and employees. In addition, we have adopted a financial code of ethics applicable to our Chief Executive Officer, Chief Financial Officer and Chief Accounting Officer. Both of these codes are available under the “Corporate Responsibility — Governance” tab on our website at www.newfield.com.
We intend to satisfy the disclosure requirements of Item 5.05 of Form 8-K regarding any amendment to, or waiver of, a provision of the corporate code of business conduct and ethics or the financial code of ethics that applies to our principal executive officer, principal financial officer, principal accounting officer or controller and relates to any element of the definition of code of ethics set forth in Item 406(b) of Regulation S-K by posting such information under the “Corporate Responsibility - Governance” tab of our website at www.newfield.com.
Item 11. Executive Compensation
The information appearing in our 2018 Proxy Statement under the headings "Executive Compensation," "Executive Compensation Tables," "Director Compensation" and "Corporate Governance - Board Committees - Compensation & Management Development Committee" is incorporated herein by reference.
Item 12. Security Ownership of Certain Beneficial Owners and Management and Related Stockholder Matters
The information appearing in our 2018 Proxy Statement under the headings "Security Ownership of Certain Beneficial Owners and Management" and "Executive Compensation Tables - Equity Compensation Plan Information" is incorporated herein by reference.
Item 13. Certain Relationships and Related Transactions, and Director Independence
The information appearing in our 2018 Proxy Statement under the headings "Corporate Governance - Director Independence," "Corporate Governance - Board Leadership Structure" and "Corporate Governance - Related Person Transactions" is incorporated herein by reference.
Item 14. Principal Accounting Fees and Services
The information appearing in our 2018 Proxy Statement under the heading "Principal Accounting Fees and Services" is incorporated herein by reference.
PART IV
Item 15. Exhibits and Financial Statement Schedules
Financial Statements
Reference is made to the table of contents set forth on page 64 of this report.
Financial Statement Schedules
Financial statement schedules listed under SEC rules but not included in this report are omitted because they are not applicable or the required information is provided in the notes to our consolidated financial statements.
Exhibits
Exhibit Number | Title | |
3.1 | — | |
3.2 | — | |
4.1 | — | |
4.1.1 | — | |
4.1.2 | — | |
4.1.3 | — | |
4.2 | — | |
†10.1 | — | |
†10.1.1 | — | |
†10.1.2 | — | |
†10.1.3 | — | |
†10.1.4 | — | |
†10.1.5 | — | |
†10.1.6 | — | |
†10.1.7 | — | |
†10.1.8 | — | |
†10.1.9 | — | |
†10.1.10 | — | |
†10.1.11 | — | |
†10.1.12 | — | |
†10.1.13 | — | |
†10.1.14 | — | |
†10.1.15 | — | |
†10.1.16 | — | |
†10.1.17 | — | |
†10.1.18 | — | |
†10.2 | — | |
†10.2.1 | — | |
†10.2.2 | — | |
†10.2.3 | — | |
†10.3 | — | |
†10.3.1 | — | |
†10.4 | — | |
†10.5 | — | |
†10.5.1 | — | |
†10.5.2 | — | |
†10.6 | — | |
†10.7 | — | |
†10.8 | — | |
†10.9 | — | |
†10.10 | — | |
†10.11 | — | |
†10.12 | — | |
10.13 | — | |
10.13.1 | — | |
10.13.2 | — | |
10.13.3 | — | |
10.13.4 | — | |
10.13.5 | — | |
10.14 | — | |
*21.1 | — | |
*23.1 | — | |
*23.2 | — | |
*23.3 | — | |
*24.1 | — | |
*31.1 | — | |
*31.2 | — | |
*32.1 | — | |
*32.2 | — | |
*99.1 | — | |
*99.2 | — | |
*101.INS | — | XBRL Instance Document |
*101.SCH | — | XBRL Schema Document |
*101.CAL | — | XBRL Calculation Linkbase Document |
*101.LAB | — | XBRL Label Linkbase Document |
*101.PRE | — | XBRL Presentation Linkbase Document |
*101.DEF | — | XBRL Definition Linkbase Document |
_________________
* | Filed or furnished herewith. |
† | Identifies management contracts and compensatory plans or arrangements. |
SIGNATURES
Pursuant to the requirements of Section 13 or 15(d) of the Securities Exchange Act of 1934, the Registrant has duly caused this report to be signed on its behalf by the undersigned, thereunto duly authorized, on the 20th day of February 2018.
NEWFIELD EXPLORATION COMPANY | ||
By: | /s/ LEE K. BOOTHBY | |
Lee K. Boothby President and Chief Executive Officer | ||
Pursuant to the requirements of the Securities Exchange Act of 1934, this report has been signed below by the following persons on behalf of the Registrant and in the capacities indicated and on the 20th day of February 2018.
Signature | Title | ||
/S/ LEE K. BOOTHBY | President, Chief Executive Officer and Chairman of the Board | ||
Lee K. Boothby | (Principal Executive Officer) | ||
/S/ LAWRENCE S. MASSARO | Executive Vice President and Chief Financial Officer | ||
Lawrence S. Massaro | (Principal Financial Officer) | ||
/S/ GEORGE W. FAIRCHILD, JR. | Chief Accounting Officer | ||
George W. Fairchild, Jr. | (Principal Accounting Officer) | ||
/S/ PAMELA J. GARDNER* | Director | ||
Pamela J. Gardner | |||
/S/ STEVEN W. NANCE* | Director | ||
Steven W. Nance | |||
/S/ ROGER B. PLANK* | Director | ||
Roger B. Plank | |||
/S/ THOMAS G. RICKS* | Director | ||
Thomas G. Ricks | |||
/S/ JUANITA M. ROMANS* | Director | ||
Juanita M. Romans | |||
/S/ JOHN W. SCHANCK* | Director | ||
John W. Schanck | |||
/S/ J. TERRY STRANGE* | Director | ||
J. Terry Strange | |||
/S/ J. KENT WELLS* | Director | ||
J. Kent Wells | |||
/S/ EDGAR R. GIESINGER* | Director | ||
Edgar R. Giesinger | |||
*By: | /s/ GEORGE W. FAIRCHILD, JR. | ||
George W. Fairchild, Jr. as Attorney-in-Fact | |||
EXHIBIT INDEX
Exhibit Number | Title | |
3.1 | — | Fourth Amended and Restated Certificate of Incorporation of Newfield Exploration Company dated July 20, 2015 (incorporated by reference to Exhibit 3.1 to Newfield’s Current Report on Form 8-K filed with the SEC on July 27, 2015 (File No. 1-12534)) |
3.2 | — | Amended and Restated Bylaws of Newfield Exploration Company, as amended by the First Amendment dated November 11, 2016 (incorporated by reference to Exhibit 3.2 to Newfield’s Annual Report on Form 10-K for the year ended December 31, 2016 (File No. 1-12534)) |
4.1 | — | Senior Indenture dated as of February 28, 2001 between Newfield and First Union National Bank, as Trustee (the "Senior Indenture") (incorporated by reference to Exhibit 4.1 to Newfield’s Current Report on Form 8-K filed with the SEC on February 28, 2001 (File No. 1-12534)) |
4.1.1 | — | Second Supplemental Indenture, dated as of September 30, 2011, to Senior Indenture between Newfield and U.S. Bank National Association (as successor to Wachovia Bank, National Association (formerly First Union National Bank)), as Trustee (incorporated by reference to Exhibit 4.2 to Newfield’s Current Report on Form 8-K filed with the SEC on September 30, 2011 (File No. 1-12534)) |
4.1.2 | — | Third Supplemental Indenture, dated as of June 26, 2012, to Senior Indenture between Newfield and U.S. Bank National Association (as successor to Wachovia Bank, National Association (formerly First Union National Bank)), as Trustee (incorporated by reference to Exhibit 4.2 to Newfield’s Current Report on Form 8-K filed with the SEC on June 26, 2012 (File No. 1-12534)) |
4.1.3 | — | Fourth Supplemental Indenture, dated as of March 10, 2015, to Senior Indenture between Newfield and U.S. Bank National Association (as successor to Wachovia Bank, National Association (formerly First Union National Bank)), as Trustee (incorporated by reference to Exhibit 4.2 to Newfield's Current Report on Form 8-K filed with the SEC on March 12, 2015 (File No. 1-12534)) |
4.2 | — | Subordinated Indenture dated as of December 10, 2001 between Newfield and First Union National Bank, as Trustee (the "Subordinated Indenture") (incorporated by reference to Exhibit 4.5 to Newfield’s Registration Statement on Form S-3/A filed with the SEC on December 13, 2001 (File No. 333-71348)) |
†10.1 | — | Newfield Exploration Company 2011 Omnibus Stock Plan (the "2011 Omnibus Stock Plan") (incorporated by reference to Exhibit 99.1 to Newfield's Registration Statement on Form S-8 filed with the SEC on May 5, 2011 (File No. 333-173964)) |
†10.1.1 | — | Newfield Exploration Company 2011 Omnibus Stock Plan (As Amended and Restated May 2, 2013)(incorporated by reference to Exhibit 10.1 to Newfield’s Current Report on Form 8-K filed with the SEC on May 3, 2013 (File No. 1-12534)) |
†10.1.2 | — | Newfield Exploration Company 2011 Omnibus Stock Plan (As Amended and Restated May 15, 2015) (incorporated by reference to Exhibit 99.1 to Newfield’s Registration Statement on Form S-8 filed with the SEC on June 3, 2015 (File No. 333-204694)) |
†10.1.3 | — | First Amendment to the Newfield Exploration Company 2011 Omnibus Stock Plan (As Amended and Restated May 15, 2015), effective April 12, 2016 (incorporated by reference to Exhibit 10.1 to Newfield’s Quarterly Report on Form 10-Q for the quarterly period ended June 30, 2016 (File No. 1-12534)) |
†10.1.4 | — | Form of 2015 Executive Officer TSR Restricted Stock Unit Award Agreement under the 2011 Omnibus Stock Plan (incorporated by reference to Exhibit 10.3 to Newfield's Quarterly Report on Form 10-Q for the quarterly period ended March 31, 2015 (File No. 1-12534)) |
†10.1.5 | — | Form of 2015 Cash-Settled Restricted Stock Unit Award Agreement (incorporated by reference to Exhibit 10.20 to Newfield's Annual Report on Form 10-K for the year ended December 31, 2015 (File No. 1-12534)) |
†10.1.6 | — | Form of 2015 Notice of Restricted Stock Unit Award and Attached Terms and Conditions under the 2011 Omnibus Stock Plan (incorporated by reference to Exhibit 10.21 to Newfield's Annual Report on Form 10-K for the year ended December 31, 2015 (File No. 1-12534)) |
†10.1.7 | — | Form of 2016 Executive Officer Notice of Restricted Stock Unit Award Total Stockholder Return (TSR) and Attached Terms and Conditions under the 2011 Omnibus Stock Plan (incorporated by reference to Exhibit 10.2 to Newfield's Quarterly Report on Form 10-Q for the quarterly period ended March 31, 2016 (File No. 1-12534)) |
†10.1.8 | — | Form of 2016 Cash-Settled Restricted Stock Unit Award Agreement and Attached Terms and Conditions (incorporated by reference to Exhibit 10.3 to Newfield's Quarterly Report on Form 10-Q for the quarterly period ended March 31, 2016 (File No. 1-12534)) |
†10.1.9 | — | Form of 2016 Notice of Restricted Stock Unit Award and Attached Terms and Conditions under the 2011 Omnibus Stock Plan (incorporated by reference to Exhibit 10.1 to Newfield's Quarterly Report on Form 10-Q for the quarterly period ended March 31, 2016 (File No. 1-12534)) |
†10.1.10 | — | Form of 2016 Restricted Stock Agreement for Non-Employee Directors under the 2011 Omnibus Stock Plan (incorporated by reference to Exhibit 10.2 to Newfield's Quarterly Report on Form 10-Q for the quarterly period ended June 30, 2016 (File No. 1-12534)) |
†10.1.11 | — | Form of 2016 Restricted Stock Unit Award Agreement for Non-Employee Directors under the 2011 Omnibus Stock Plan and the Newfield Exploration Company Non-Employee Directors' Deferred Compensation Plan (incorporated by reference to Exhibit 10.3 to Newfield's Quarterly Report on Form 10-Q for the quarterly period ended June 30, 2016 (File No. 1-12534)) |
†10.1.12 | — | Form of Tax Election Regarding Restricted Stock Unit Awards under the 2011 Omnibus Stock Plan (incorporated by reference to Exhibit 10.1 to Newfield's Quarterly Report on Form 10-Q for the quarterly period ended September 30, 2016 (File No. 1-12534)) |
†10.1.13 | — | Form of 2017 Notice of Restricted Stock Unit Award Total Stockholder Return (TSR) and Attached Terms and Conditions under the 2011 Omnibus Stock Plan (incorporated by reference to Exhibit 10.1 to Newfield's Quarterly Report on Form 10-Q for the quarterly period ended March 31, 2017 (File No. 1-12534)) |
†10.1.14 | — | Form of 2017 Cash-Settled Restricted Stock Unit Award Agreement and Attached Terms and Conditions (incorporated by reference to Exhibit 10.2 to Newfield's Quarterly Report on Form 10-Q for the quarterly period ended March 31, 2017 (File No. 1-12534)) |
†10.1.15 | — | Form of 2017 Notice of Restricted Stock Unit Award and Attached Terms and Conditions (Officer Form) under the 2011 Omnibus Stock Plan (incorporated by reference to Exhibit 10.3 to Newfield's Quarterly Report on Form 10-Q for the quarterly period ended March 31, 2017 (File No. 1-12534)) |
†10.1.16 | — | Amendment to Total Stockholder Return (TSR) Notice of Restricted Stock Unit Award and Attached Terms and Conditions under the 2011 Omnibus Stock Plan (incorporated by reference to Exhibit 10.4 to Newfield's Quarterly Report on Form 10-Q for the quarterly period ended March 31, 2017 (File No. 1-12534)) |
†10.1.17 | — | Form of 2017 Notice of Restricted Stock Unit Award and Attached Terms and Conditions (for Supplemental Awards) under the 2011 Omnibus Stock Plan (incorporated by reference to Exhibit 10.5 to Newfield's Quarterly Report on Form 10-Q for the quarterly period ended March 31, 2017 (File No. 1-12534)) |
†10.1.18 | — | Form of 2017 Cash-Settled Restricted Stock Unit Award Agreement and Attached Terms and Conditions (for Supplemental Awards) (incorporated by reference to Exhibit 10.6 to Newfield's Quarterly Report on Form 10-Q for the quarterly period ended March 31, 2017 (File No. 1-12534)) |
†10.2 | — | Newfield Exploration Company 2017 Omnibus Incentive Plan (incorporated by reference to Exhibit 99.1 to Newfield's Registration Statement on Form S-8, filed with the SEC on May 16, 2017 (File No. 333-218027) |
†10.2.1 | — | Form of 2017 Restricted Stock Agreement for Non-Employee Directors under the 2017 Omnibus Incentive Plan (incorporated by reference to Exhibit 10.3 to Newfield's Quarterly Report on Form 10-Q for the quarterly period ended June 30, 2017 (File No. 1-12534)) |
†10.2.2 | — | Form of 2017 Restricted Stock Unit Award Agreement for Non-Employee Directors under the 2017 Omnibus Incentive Plan and the Non-Employee Directors' Deferred Compensation Plan (incorporated by reference to Exhibit 10.4 to Newfield's Quarterly Report on Form 10-Q for the quarterly period ended June 30, 2017 (File No. 1-12534)) |
†10.2.3 | — | Form of 2017 Notice of Restricted Stock Unit Award and Attached Terms and Conditions (New Hire and Promotions) under the 2017 Omnibus Incentive Plan (incorporated by reference to Exhibit 10.5 to Newfield's Quarterly Report on Form 10-Q for the quarterly period ended June 30, 2017 (File No. 1-12534)) |
†10.3 | — | Newfield Exploration Company 2011 Annual Incentive Compensation Plan (incorporated by reference to Exhibit 10.25 to Newfield's Annual Report on Form 10-K for the year ended December 31, 2010 (File No. 1-12534)) |
†10.3.1 | — | Newfield Exploration Company Amended and Restated 2011 Annual Incentive Compensation Plan (incorporated by reference to Exhibit 10.4 to Newfield's Quarterly Report on Form 10-Q, for the quarterly period ended March 31, 2016 (File No. 1-12534)) |
†10.4 | — | Newfield Exploration Company Deferred Compensation Plan (As Amended and Restated effective May 15, 2015) (incorporated by reference to Exhibit 10.5 to Newfield's Annual Report on Form 10-K, for the year ended December 31, 2015 (File No. 1-12534)) |
†10.5 | — | Newfield Exploration Company 2010 Employee Stock Purchase Plan (incorporated by reference to Exhibit 99.1 to Newfield's Registration Statement on Form S-8 filed with the SEC on May 10, 2010 (File No. 333-166672)) |
†10.5.1 | — | Amendment No. 1 to the Newfield Exploration Company 2010 Employee Stock Purchase Plan (incorporated by reference to Exhibit 10.1 to Newfield's Current Report on Form 8-K filed with the SEC on February 11, 2014 (File No. 1-12534)) |
†10.5.2 | — | Newfield Exploration Company Amended and Restated 2010 Employee Stock Purchase Plan (incorporated by reference to Exhibit 99.1 to Newfield's Registration Statement on Form S-8, filed with the SEC on May 16, 2017 (File No. 333-218026) |
†10.6 | — | Newfield Exploration Company Non-Employee Directors' Deferred Compensation Plan (Effective as of October 27, 2015) (incorporated by reference to Exhibit 10.24 to Newfield's Annual Report on Form 10-K for the year ended December 31, 2015 (File No. 1-12534)) |
†10.7 | — | Fourth Amended and Restated Newfield Exploration Company Change of Control Severance Plan (incorporated by reference to Exhibit 10.18 to Newfield’s Annual Report on Form 10-K for the year ended December 31, 2012 (File No. 1-12534)) |
†10.8 | — | Form of Third Amended and Restated Change of Control Severance Agreement between Newfield and Lee K. Boothby dated effective as of January 1, 2009 (incorporated by reference to Exhibit 10.31 to Newfield’s Annual Report on Form 10-K for the year ended December 31, 2010 (File No. 1-12534)) |
†10.9 | — | Form of Second Amended and Restated Change of Control Severance Agreement between Newfield and each of John H. Jasek and James T. Zernell dated effective as of January 1, 2009 (incorporated by reference to Exhibit 10.32 to Newfield’s Annual Report on Form 10-K for the year ended December 31, 2010 (File No. 1-12534)) |
†10.10 | — | Form of Fourth Amended and Restated Change of Control Severance Agreement between Newfield and each of George T. Dunn and Gary D. Packer dated effective as of January 1, 2009 (incorporated by reference to Exhibit 10.33 to Newfield’s Annual Report on Form 10-K for the year ended December 31, 2010 (File No. 1-12534)) |
†10.11 | — | Amended and Restated Change of Control Severance Agreement, by and between the Company and Lawrence S. Massaro, effective as of February 10, 2016 (incorporated by reference to Exhibit 10.1 to Newfield's Current Report on Form 8-K filed with the SEC on February 12, 2016 (File No. 1-12534)) |
†10.12 | — | Form of Indemnification Agreement between Newfield and each of its directors and executive officers (incorporated by reference to Exhibit 10.20 to Newfield’s Current Report on Form 8-K filed with the SEC on February 6, 2009 (File No. 1-12534)) |
10.13 | — | Credit Agreement, dated as of June 2, 2011, by and among Newfield, the Lenders party thereto, and JPMorgan Chase Bank, N.A., as Administrative Agent, Wells Fargo Bank, N.A., as Syndication Agent, and BBVA Compass, The Bank of Tokyo-Mitsubishi UFJ, Ltd., and DNB Nor Bank ASA, as Co-Documentation Agents (incorporated by reference to Exhibit 10.1 to Newfield’s Quarterly Report on Form 10-Q for the quarterly period ended September 30, 2011 (File No. 1-12534)) |
10.13.1 | — | First Amendment to Credit Agreement, dated as of September 27, 2011, by and among Newfield, as Borrower, JPMorgan Chase Bank, N.A., as Administrative Agent, and the Lenders party thereto (incorporated by reference to Exhibit 10.2 to Newfield’s Quarterly Report on Form 10-Q for the quarterly period ended September 30, 2011 (File No. 1-12534)) |
10.13.2 | — | Second Amendment to Credit Agreement, dated as of April 29, 2013, by and among Newfield, as Borrower, JPMorgan Chase Bank, N.A., as Administrative Agent, and the Lenders party thereto (incorporated by reference to Exhibit 10.36.2 to Newfield’s Annual Report on Form 10-K for the year ended December 31, 2013 (File No. 1-12534)) |
10.13.3 | — | Third Amendment to Credit Agreement, dated as of June 25, 2013, by and among Newfield, as Borrower, the Lenders party thereto, and JPMorgan Chase Bank, N.A., as Administrative Agent, Wells Fargo Bank, N.A., as Syndication Agent, and BBVA Compass, The Bank of Tokyo-Mitsubishi UFJ, Ltd., DNB Bank ASA, Sumitomo Mitsui Banking Corporation and U.S. Bank National Association, as Documentation Agents (incorporated by reference to Exhibit 10.2 to Newfield’s Quarterly Report on Form 10-Q for the quarterly period ended June 30, 2013 (File No. 1-12534)) |
10.13.4 | — | Fourth Amendment to Credit Agreement, dated as of March 5, 2015, by and among Newfield, as Borrower, the Lenders party thereto, and JPMorgan Chase Bank, N.A., as Administrative Agent, Wells Fargo Bank, N.A., as Syndication Agent, The Bank of Tokyo-Mitsubishi UFJ, Ltd., The Bank of Nova Scotia, U.S. Bank National Association, Sumitomo Mitsui Banking Corporation and Credit Suisse AG, Cayman Islands Branch, as Documentation Agents, and BMO Harris Bank N.A., Canadian Imperial Bank of Commerce, New York Branch, Goldman Sachs Bank USA and Mizuho Bank Ltd., as Managing Agents (incorporated by reference to Exhibit 10.2 to Newfield's Quarterly Report on Form 10-Q for the quarterly period ended March 31, 2015 (File No. 1-12534)) |
10.13.5 | — | Fifth Amendment to Credit Agreement, dated as of March 18, 2016, by and among Newfield and JPMorgan Chase Bank, N.A., as Administrative Agent, Wells Fargo Bank, N.A., as Syndication Agent, and the Lenders party thereto (incorporated by reference to Exhibit 10.5 to Newfield's Quarterly Report on Form 10-Q for the quarterly period ended March 31, 2016 (File No. 1-12534)) |
10.14 | — | Retirement Agreement of William D. Schneider (incorporated by reference to Exhibit 10.1 to Newfield’s Current Report on Form 8-K filed with the SEC on January 14, 2015 (File No. 1-12534)) |
*21.1 | — | List of Significant Subsidiaries |
*23.1 | — | Consent of PricewaterhouseCoopers LLP |
*23.2 | — | Consent of Ryder Scott Company, L.P. |
*23.3 | — | Consent of DeGolyer and MacNaughton |
*24.1 | — | Power of Attorney |
*31.1 | — | Certification of Chief Executive Officer of Newfield Exploration Company pursuant to 15 U.S.C. Section 7241, as adopted pursuant to Section 302 of the Sarbanes-Oxley Act of 2002 |
*31.2 | — | Certification of Chief Financial Officer of Newfield Exploration Company pursuant to 15 U.S.C. Section 7241, as adopted pursuant to Section 302 of the Sarbanes-Oxley Act of 2002 |
*32.1 | — | Certification of Chief Executive Officer of Newfield Exploration Company pursuant to 18 U.S.C. Section 1350, as adopted pursuant to Section 906 of the Sarbanes-Oxley Act of 2002 |
*32.2 | — | Certification of Chief Financial Officer of Newfield Exploration Company pursuant to 18 U.S.C. Section 1350, as adopted pursuant to Section 906 of the Sarbanes-Oxley Act of 2002 |
*99.1 | — | Reserve Audit Report of Ryder Scott Company, L.P., dated January 12, 2018 |
*99.2 | — | Reserve Audit Report of DeGolyer and MacNaughton, dated January 16, 2018 |
*101.INS | — | XBRL Instance Document |
*101.SCH | — | XBRL Schema Document |
*101.CAL | — | XBRL Calculation Linkbase Document |
*101.LAB | — | XBRL Label Linkbase Document |
*101.PRE | — | XBRL Presentation Linkbase Document |
*101.DEF | — | XBRL Definition Linkbase Document |
_________________
* | Filed or furnished herewith. |
† | Identifies management contracts and compensatory plans or arrangements. |