Attached files
| file | filename |
|---|---|
| EX-99.1 - EX-99.1 - AMEDISYS INC | d376054dex991.htm |
| 8-K - 8-K - AMEDISYS INC | d376054d8k.htm |

Amedisys First Quarter 2017 Earnings Call Supplemental Slides May 3, 2017 Exhibit 99.2
This presentation may include forward-looking statements as defined by the Private Securities Litigation Reform Act of 1995. These forward-looking statements are based upon current expectations and assumptions about our business that are subject to a variety of risks and uncertainties that could cause actual results to differ materially from those described in this presentation. You should not rely on forward-looking statements as a prediction of future events. Additional information regarding factors that could cause actual results to differ materially from those discussed in any forward-looking statements are described in reports and registration statements we file with the SEC, including our Annual Report on Form 10-K and subsequent Quarterly Reports on Form 10-Q and Current Reports on Form 8-K, copies of which are available on the Amedisys internet website http://www.amedisys.com or by contacting the Amedisys Investor Relations department at (225) 292-2031. We disclaim any obligation to update any forward-looking statements or any changes in events, conditions or circumstances upon which any forward-looking statement may be based except as required by law. www.amedisys.com NASDAQ: AMED We encourage everyone to visit the Investors Section of our website at www.amedisys.com, where we have posted additional important information such as press releases, profiles concerning our business and clinical operations and control processes, and SEC filings. Forward-looking statements
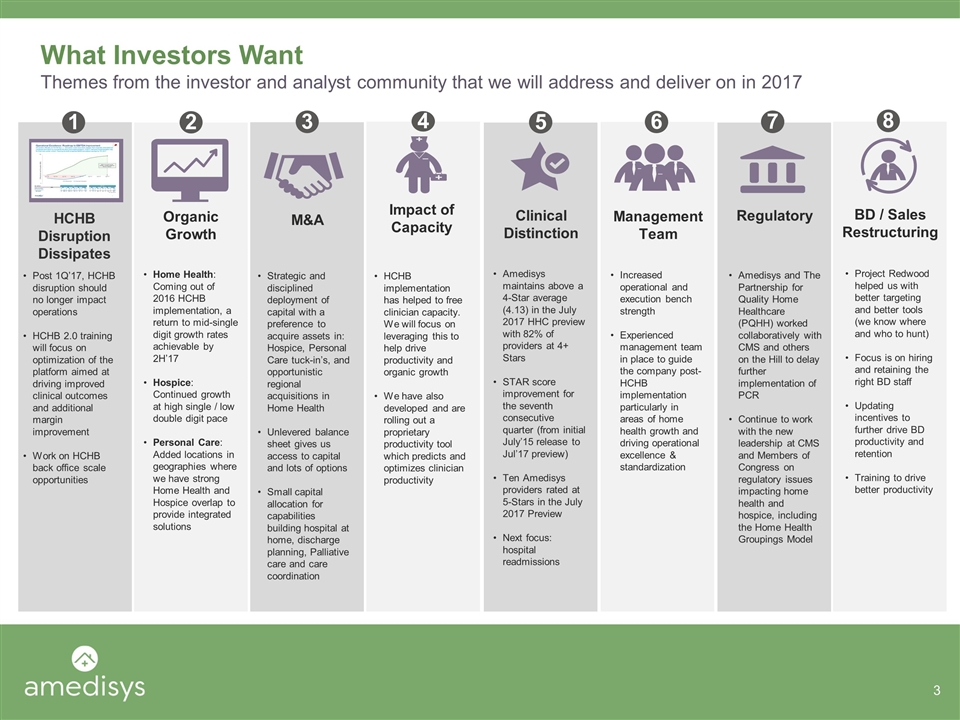
What Investors Want Themes from the investor and analyst community that we will address and deliver on in 2017 Post 1Q’17, HCHB disruption should no longer impact operations HCHB 2.0 training will focus on optimization of the platform aimed at driving improved clinical outcomes and additional margin improvement Work on HCHB back office scale opportunities Home Health: Coming out of 2016 HCHB implementation, a return to mid-single digit growth rates achievable by 2H’17 Hospice: Continued growth at high single / low double digit pace Personal Care: Added locations in geographies where we have strong Home Health and Hospice overlap to provide integrated solutions Amedisys maintains above a 4-Star average (4.13) in the July 2017 HHC preview with 82% of providers at 4+ Stars STAR score improvement for the seventh consecutive quarter (from initial July’15 release to Jul’17 preview) Ten Amedisys providers rated at 5-Stars in the July 2017 Preview Next focus: hospital readmissions 1 2 5 HCHB Disruption Dissipates Organic Growth Clinical Distinction Increased operational and execution bench strength Experienced management team in place to guide the company post- HCHB implementation particularly in areas of home health growth and driving operational excellence & standardization 6 Management Team HCHB implementation has helped to free clinician capacity. We will focus on leveraging this to help drive productivity and organic growth We have also developed and are rolling out a proprietary productivity tool which predicts and optimizes clinician productivity 4 Impact of Capacity Strategic and disciplined deployment of capital with a preference to acquire assets in: Hospice, Personal Care tuck-in’s, and opportunistic regional acquisitions in Home Health Unlevered balance sheet gives us access to capital and lots of options Small capital allocation for capabilities building hospital at home, discharge planning, Palliative care and care coordination 3 M&A 7 Regulatory Amedisys and The Partnership for Quality Home Healthcare (PQHH) worked collaboratively with CMS and others on the Hill to delay further implementation of PCR Continue to work with the new leadership at CMS and Members of Congress on regulatory issues impacting home health and hospice, including the Home Health Groupings Model 8 BD / Sales Restructuring Project Redwood helped us with better targeting and better tools (we know where and who to hunt) Focus is on hiring and retaining the right BD staff Updating incentives to further drive BD productivity and retention Training to drive better productivity
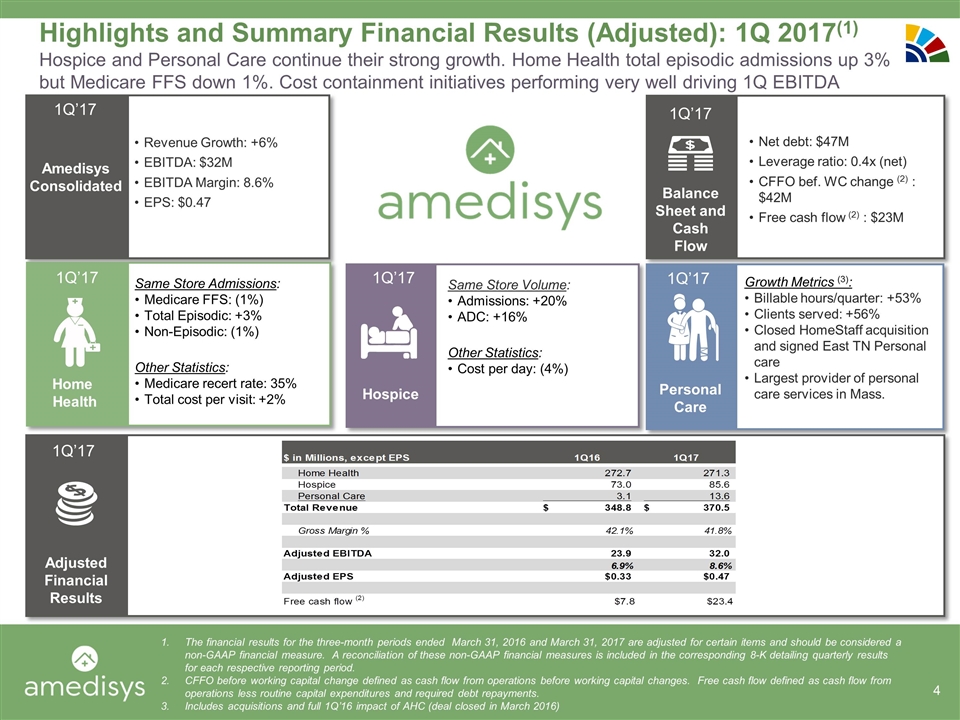
Highlights and Summary Financial Results (Adjusted): 1Q 2017(1) Hospice and Personal Care continue their strong growth. Home Health total episodic admissions up 3% but Medicare FFS down 1%. Cost containment initiatives performing very well driving 1Q EBITDA Amedisys Consolidated Revenue Growth: +6% EBITDA: $32M EBITDA Margin: 8.6% EPS: $0.47 1Q’17 Net debt: $47M Leverage ratio: 0.4x (net) CFFO bef. WC change (2) : $42M Free cash flow (2) : $23M Balance Sheet and Cash Flow 1Q’17 Same Store Admissions: Medicare FFS: (1%) Total Episodic: +3% Non-Episodic: (1%) Other Statistics: Medicare recert rate: 35% Total cost per visit: +2% Home Health Growth Metrics (3): Billable hours/quarter: +53% Clients served: +56% Closed HomeStaff acquisition and signed East TN Personal care Largest provider of personal care services in Mass. Personal Care Same Store Volume: Admissions: +20% ADC: +16% Other Statistics: Cost per day: (4%) Hospice 1Q’17 1Q’17 1Q’17 Adjusted Financial Results 1Q’17 The financial results for the three-month periods ended March 31, 2016 and March 31, 2017 are adjusted for certain items and should be considered a non-GAAP financial measure. A reconciliation of these non-GAAP financial measures is included in the corresponding 8-K detailing quarterly results for each respective reporting period. CFFO before working capital change defined as cash flow from operations before working capital changes. Free cash flow defined as cash flow from operations less routine capital expenditures and required debt repayments. Includes acquisitions and full 1Q’16 impact of AHC (deal closed in March 2016)
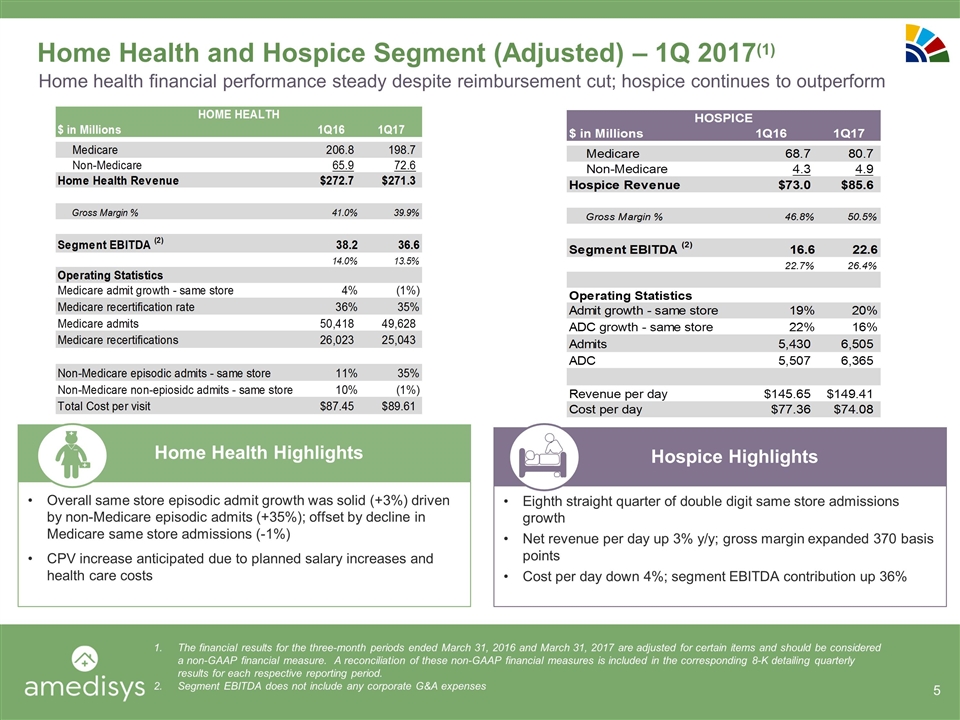
Home Health and Hospice Segment (Adjusted) – 1Q 2017(1) Overall same store episodic admit growth was solid (+3%) driven by non-Medicare episodic admits (+35%); offset by decline in Medicare same store admissions (-1%) CPV increase anticipated due to planned salary increases and health care costs Home Health Highlights Eighth straight quarter of double digit same store admissions growth Net revenue per day up 3% y/y; gross margin expanded 370 basis points Cost per day down 4%; segment EBITDA contribution up 36% Hospice Highlights The financial results for the three-month periods ended March 31, 2016 and March 31, 2017 are adjusted for certain items and should be considered a non-GAAP financial measure. A reconciliation of these non-GAAP financial measures is included in the corresponding 8-K detailing quarterly results for each respective reporting period. Segment EBITDA does not include any corporate G&A expenses Home health financial performance steady despite reimbursement cut; hospice continues to outperform
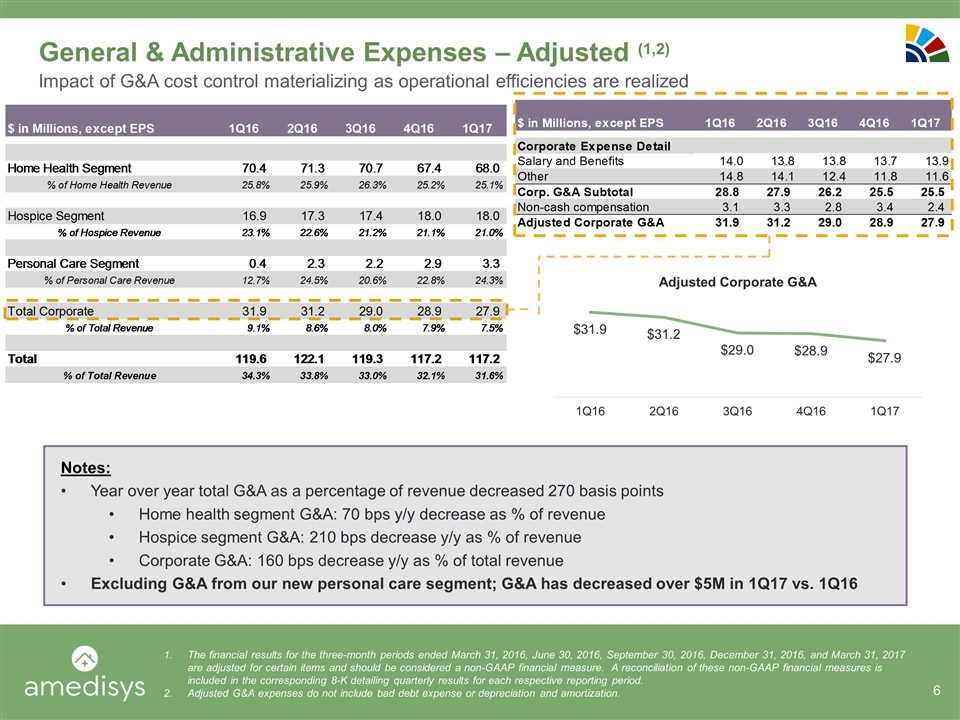
General & Administrative Expenses – Adjusted (1,2) Notes: Year over year total G&A as a percentage of revenue decreased 270 basis points Home health segment G&A: 70 bps y/y decrease as % of revenue Hospice segment G&A: 210 bps decrease y/y as % of revenue Corporate G&A: 160 bps decrease y/y as % of total revenue Excluding G&A from our new personal care segment; G&A has decreased over $5M in 1Q17 vs. 1Q16 The financial results for the three-month periods ended March 31, 2016, June 30, 2016, September 30, 2016, December 31, 2016, and March 31, 2017 are adjusted for certain items and should be considered a non-GAAP financial measure. A reconciliation of these non-GAAP financial measures is included in the corresponding 8-K detailing quarterly results for each respective reporting period. Adjusted G&A expenses do not include bad debt expense or depreciation and amortization. Impact of G&A cost control materializing as operational efficiencies are realized
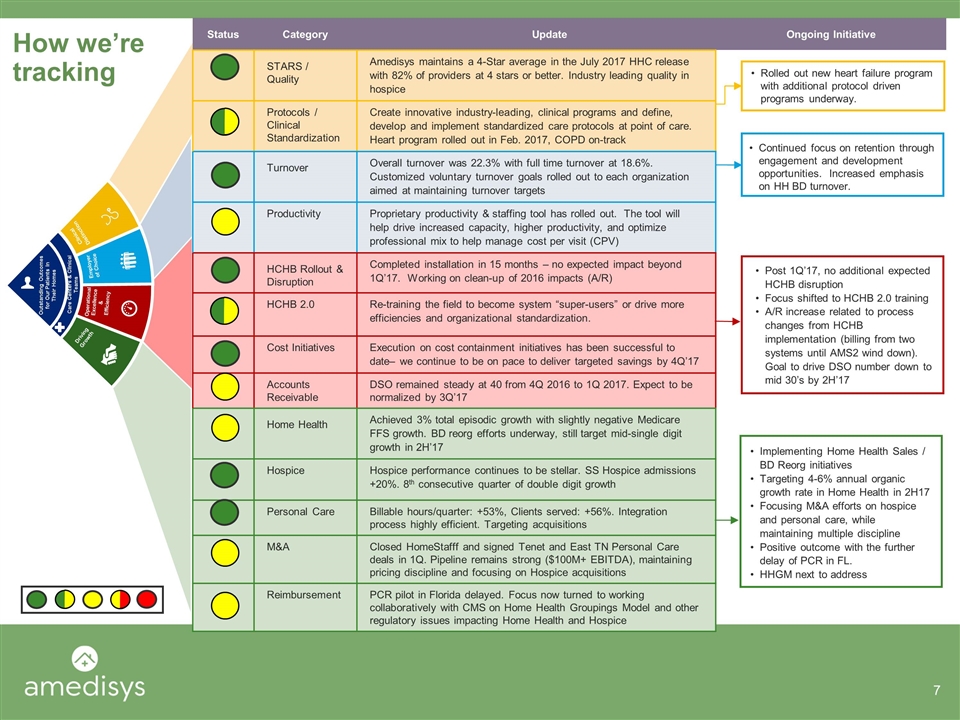
How we’re tracking Clinical Distinction Employer of Choice Operational Excellence & Efficiency Driving Growth Outstanding Outcomes for Our Patients In Their Homes Care Centers & Clinical Teams Status Category Update Ongoing Initiative STARS / Quality Amedisys maintains a 4-Star average in the July 2017 HHC release with 82% of providers at 4 stars or better. Industry leading quality in hospice Protocols / Clinical Standardization Create innovative industry-leading, clinical programs and define, develop and implement standardized care protocols at point of care. Heart program rolled out in Feb. 2017, COPD on-track Turnover Overall turnover was 22.3% with full time turnover at 18.6%. Customized voluntary turnover goals rolled out to each organization aimed at maintaining turnover targets Productivity Proprietary productivity & staffing tool has rolled out. The tool will help drive increased capacity, higher productivity, and optimize professional mix to help manage cost per visit (CPV) HCHB Rollout & Disruption Completed installation in 15 months – no expected impact beyond 1Q’17. Working on clean-up of 2016 impacts (A/R) HCHB 2.0 Re-training the field to become system “super-users” or drive more efficiencies and organizational standardization. Cost Initiatives Execution on cost containment initiatives has been successful to date– we continue to be on pace to deliver targeted savings by 4Q’17 Accounts Receivable DSO remained steady at 40 from 4Q 2016 to 1Q 2017. Expect to be normalized by 3Q’17 Home Health Achieved 3% total episodic growth with slightly negative Medicare FFS growth. BD reorg efforts underway, still target mid-single digit growth in 2H’17 Hospice Hospice performance continues to be stellar. SS Hospice admissions +20%. 8th consecutive quarter of double digit growth Personal Care Billable hours/quarter: +53%, Clients served: +56%. Integration process highly efficient. Targeting acquisitions M&A Closed HomeStafff and signed Tenet and East TN Personal Care deals in 1Q. Pipeline remains strong ($100M+ EBITDA), maintaining pricing discipline and focusing on Hospice acquisitions Reimbursement PCR pilot in Florida delayed. Focus now turned to working collaboratively with CMS on Home Health Groupings Model and other regulatory issues impacting Home Health and Hospice Rolled out new heart failure program with additional protocol driven programs underway. Continued focus on retention through engagement and development opportunities. Increased emphasis on HH BD turnover. Implementing Home Health Sales / BD Reorg initiatives Targeting 4-6% annual organic growth rate in Home Health in 2H17 Focusing M&A efforts on hospice and personal care, while maintaining multiple discipline Positive outcome with the further delay of PCR in FL. HHGM next to address Post 1Q’17, no additional expected HCHB disruption Focus shifted to HCHB 2.0 training A/R increase related to process changes from HCHB implementation (billing from two systems until AMS2 wind down). Goal to drive DSO number down to mid 30’s by 2H’17
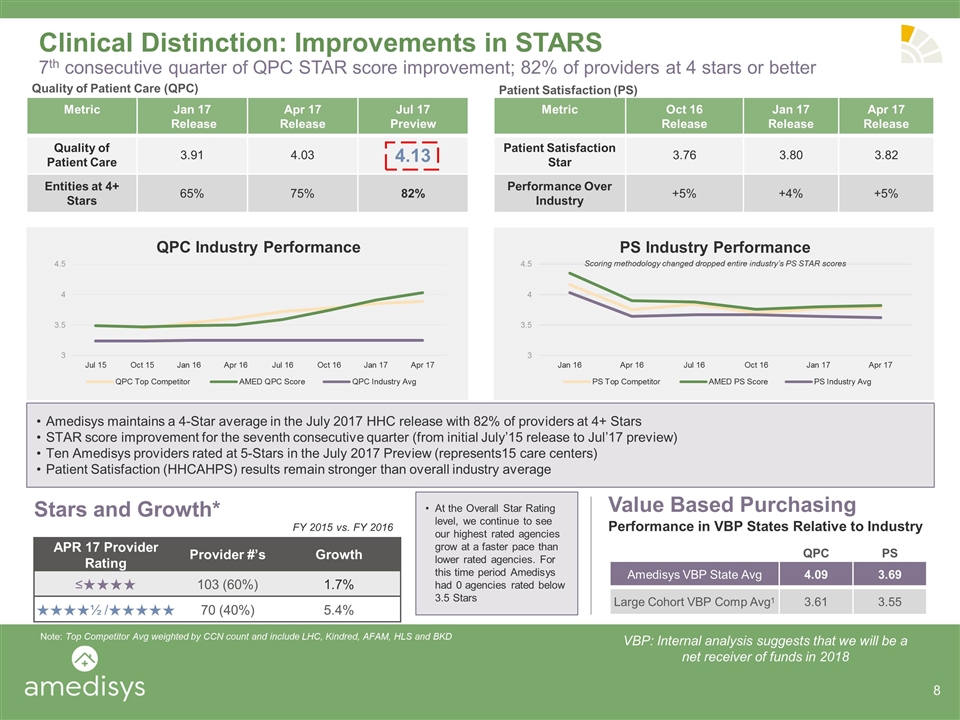
Clinical Distinction: Improvements in STARS 7th consecutive quarter of QPC STAR score improvement; 82% of providers at 4 stars or better Metric Jan 17 Release Apr 17 Release Jul 17 Preview Quality of Patient Care 3.91 4.03 4.13 Entities at 4+ Stars 65% 75% 82% Metric Oct 16 Release Jan 17 Release Apr 17 Release Patient Satisfaction Star 3.76 3.80 3.82 Performance Over Industry +5% +4% +5% Quality of Patient Care (QPC) Patient Satisfaction (PS) QPC Industry Performance PS Industry Performance Scoring methodology changed dropped entire industry’s PS STAR scores Amedisys maintains a 4-Star average in the July 2017 HHC release with 82% of providers at 4+ Stars STAR score improvement for the seventh consecutive quarter (from initial July’15 release to Jul’17 preview) Ten Amedisys providers rated at 5-Stars in the July 2017 Preview (represents15 care centers) Patient Satisfaction (HHCAHPS) results remain stronger than overall industry average Value Based Purchasing QPC PS Amedisys VBP State Avg 4.09 3.69 Large Cohort VBP Comp Avg1 3.61 3.55 Performance in VBP States Relative to Industry VBP: Internal analysis suggests that we will be a net receiver of funds in 2018 Note: Top Competitor Avg weighted by CCN count and include LHC, Kindred, AFAM, HLS and BKD Stars and Growth* At the Overall Star Rating level, we continue to see our highest rated agencies grow at a faster pace than lower rated agencies. For this time period Amedisys had 0 agencies rated below 3.5 Stars APR 17 Provider Rating Provider #’s Growth ≤★★★★ 103 (60%) 1.7% ★★★★½ /★★★★★ 70 (40%) 5.4% FY 2015 vs. FY 2016
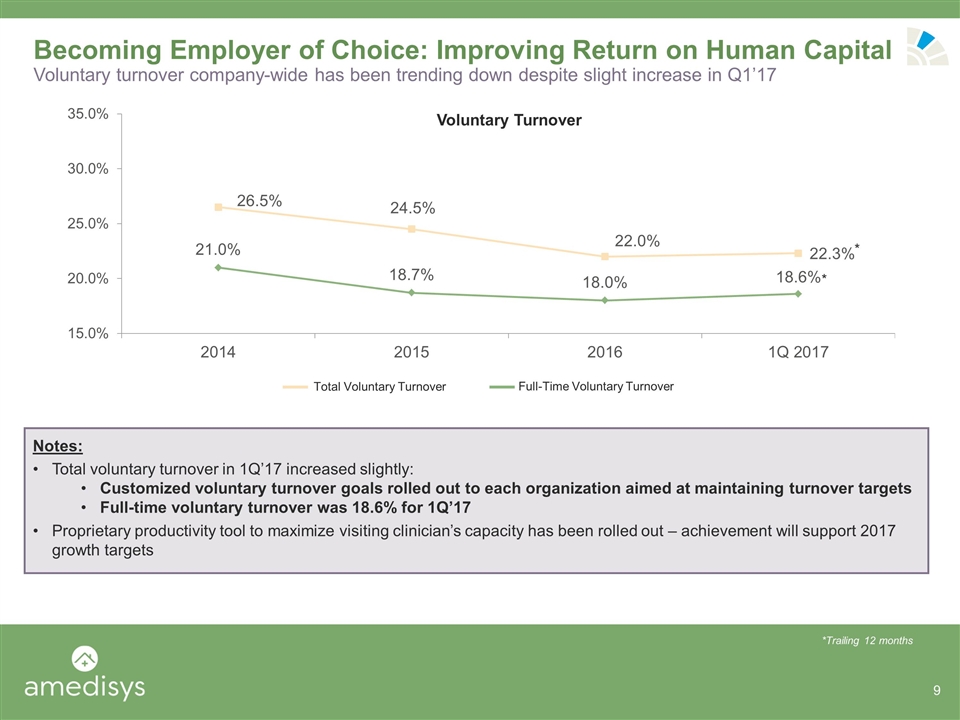
Becoming Employer of Choice: Improving Return on Human Capital Voluntary turnover company-wide has been trending down despite slight increase in Q1’17 Notes: Total voluntary turnover in 1Q’17 increased slightly: Customized voluntary turnover goals rolled out to each organization aimed at maintaining turnover targets Full-time voluntary turnover was 18.6% for 1Q’17 Proprietary productivity tool to maximize visiting clinician’s capacity has been rolled out – achievement will support 2017 growth targets Voluntary Turnover Total Voluntary Turnover Full-Time Voluntary Turnover *Trailing 12 months * *
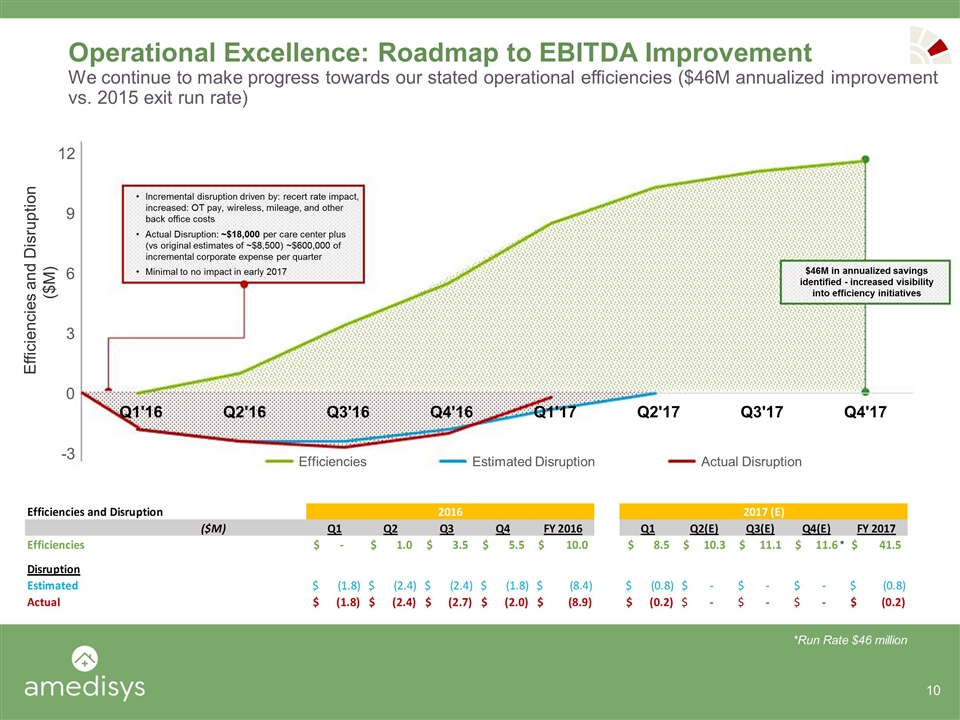
Operational Excellence: Roadmap to EBITDA Improvement We continue to make progress towards our stated operational efficiencies ($46M annualized improvement vs. 2015 exit run rate) *Run Rate $46 million * Efficiencies and Disruption ($M) - 3 0 3 6 9 12 Q1'16 Q2'16 Q3'16 Q4'16 Q1'17 Q2'17 Q3'17 Q4'17 Efficiencies Estimated Disruption Actual Disruption Incremental disruption driven by: recert rate impact, increased: OT pay, wireless, mileage, and other back office costs Actual Disruption: ~$18,000 per care center plus (vs original estimates of ~$8,500) ~$600,000 of incremental corporate expense per quarter Minimal to no impact in early 2017 $46M in annualized savings identified - increased visibility into efficiency initiatives
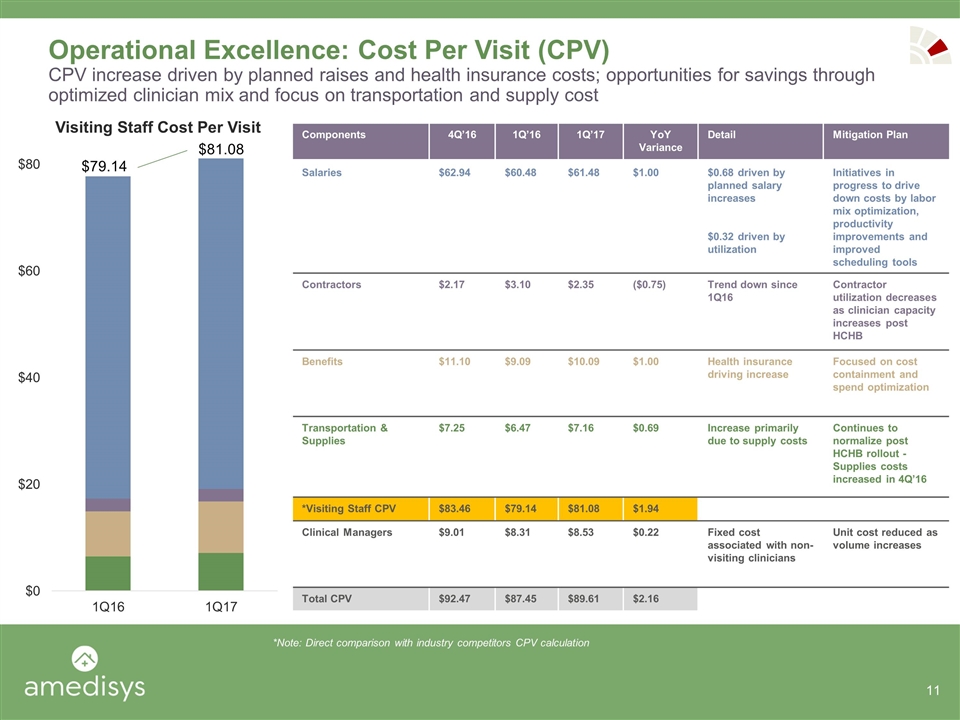
$81.08 $79.14 Components 4Q’16 1Q’16 1Q’17 YoY Variance Detail Mitigation Plan Salaries $62.94 $60.48 $61.48 $1.00 $0.68 driven by planned salary increases $0.32 driven by utilization Initiatives in progress to drive down costs by labor mix optimization, productivity improvements and improved scheduling tools Contractors $2.17 $3.10 $2.35 ($0.75) Trend down since 1Q16 Contractor utilization decreases as clinician capacity increases post HCHB Benefits $11.10 $9.09 $10.09 $1.00 Health insurance driving increase Focused on cost containment and spend optimization Transportation & Supplies $7.25 $6.47 $7.16 $0.69 Increase primarily due to supply costs Continues to normalize post HCHB rollout - Supplies costs increased in 4Q’16 *Visiting Staff CPV $83.46 $79.14 $81.08 $1.94 Clinical Managers $9.01 $8.31 $8.53 $0.22 Fixed cost associated with non-visiting clinicians Unit cost reduced as volume increases Total CPV $92.47 $87.45 $89.61 $2.16 Operational Excellence: Cost Per Visit (CPV) CPV increase driven by planned raises and health insurance costs; opportunities for savings through optimized clinician mix and focus on transportation and supply cost *Note: Direct comparison with industry competitors CPV calculation
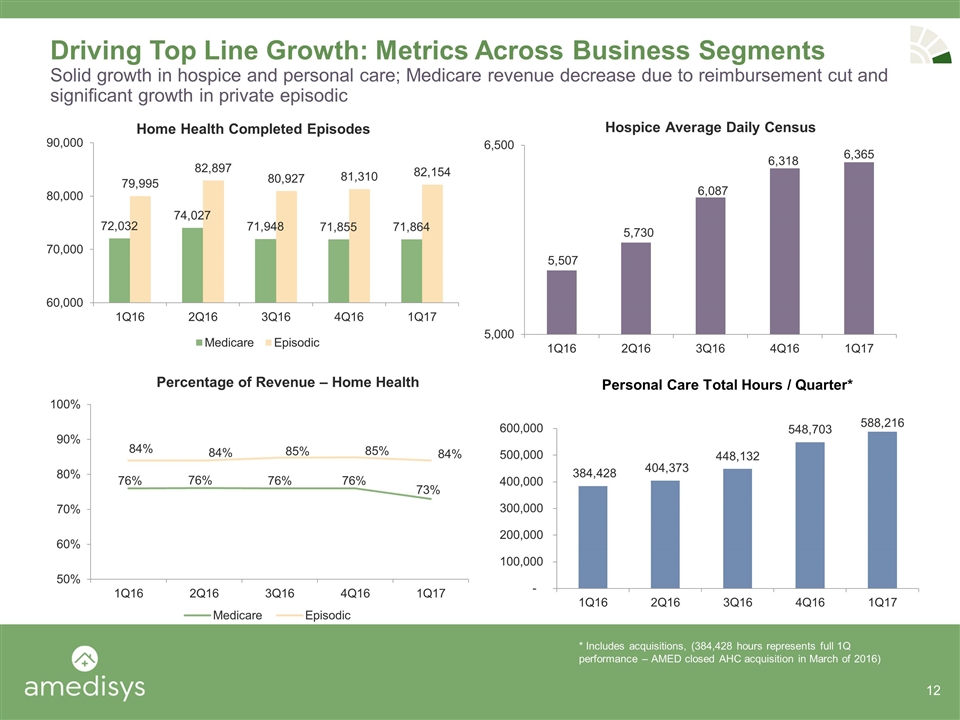
Driving Top Line Growth: Metrics Across Business Segments Solid growth in hospice and personal care; Medicare revenue decrease due to reimbursement cut and significant growth in private episodic 234 Opportunities Prospected 45 Opportunities Under Review 13 Active Processes Personal Care Total Hours / Quarter* * Includes acquisitions, (384,428 hours represents full 1Q performance – AMED closed AHC acquisition in March of 2016)
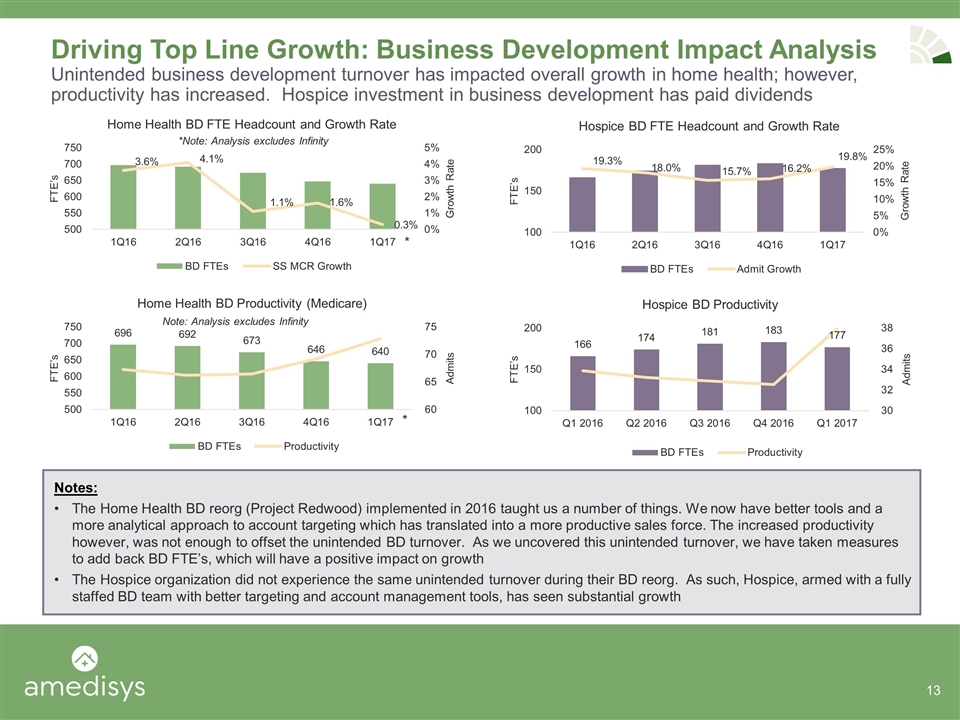
Driving Top Line Growth: Business Development Impact Analysis Unintended business development turnover has impacted overall growth in home health; however, productivity has increased. Hospice investment in business development has paid dividends Notes: The Home Health BD reorg (Project Redwood) implemented in 2016 taught us a number of things. We now have better tools and a more analytical approach to account targeting which has translated into a more productive sales force. The increased productivity however, was not enough to offset the unintended BD turnover. As we uncovered this unintended turnover, we have taken measures to add back BD FTE’s, which will have a positive impact on growth The Hospice organization did not experience the same unintended turnover during their BD reorg. As such, Hospice, armed with a fully staffed BD team with better targeting and account management tools, has seen substantial growth *Note: Analysis excludes Infinity Note: Analysis excludes Infinity * *
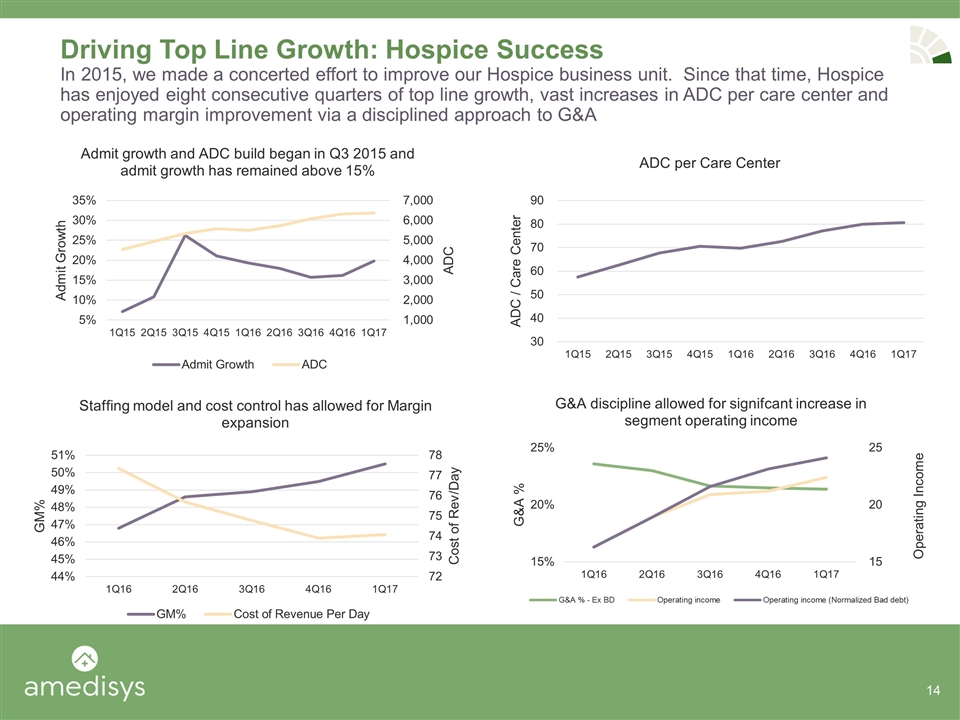
Driving Top Line Growth: Hospice Success In 2015, we made a concerted effort to improve our Hospice business unit. Since that time, Hospice has enjoyed eight consecutive quarters of top line growth, vast increases in ADC per care center and operating margin improvement via a disciplined approach to G&A 14
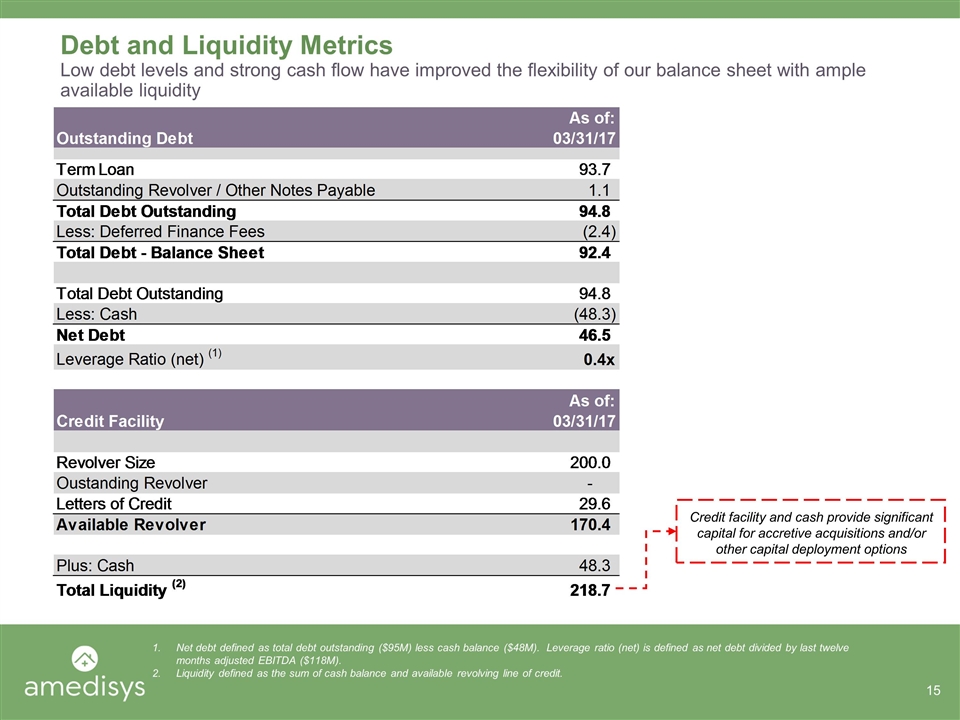
Debt and Liquidity Metrics Low debt levels and strong cash flow have improved the flexibility of our balance sheet with ample available liquidity Net debt defined as total debt outstanding ($95M) less cash balance ($48M). Leverage ratio (net) is defined as net debt divided by last twelve months adjusted EBITDA ($118M). Liquidity defined as the sum of cash balance and available revolving line of credit. Credit facility and cash provide significant capital for accretive acquisitions and/or other capital deployment options
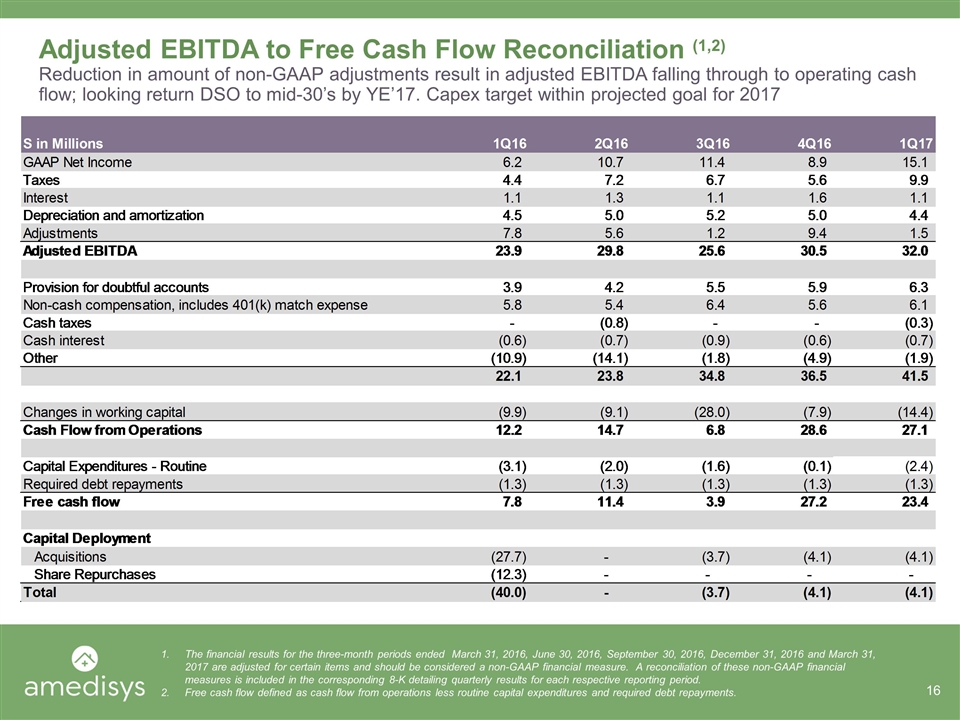
Adjusted EBITDA to Free Cash Flow Reconciliation (1,2) Reduction in amount of non-GAAP adjustments result in adjusted EBITDA falling through to operating cash flow; looking return DSO to mid-30’s by YE’17. Capex target within projected goal for 2017 The financial results for the three-month periods ended March 31, 2016, June 30, 2016, September 30, 2016, December 31, 2016 and March 31, 2017 are adjusted for certain items and should be considered a non-GAAP financial measure. A reconciliation of these non-GAAP financial measures is included in the corresponding 8-K detailing quarterly results for each respective reporting period. Free cash flow defined as cash flow from operations less routine capital expenditures and required debt repayments.
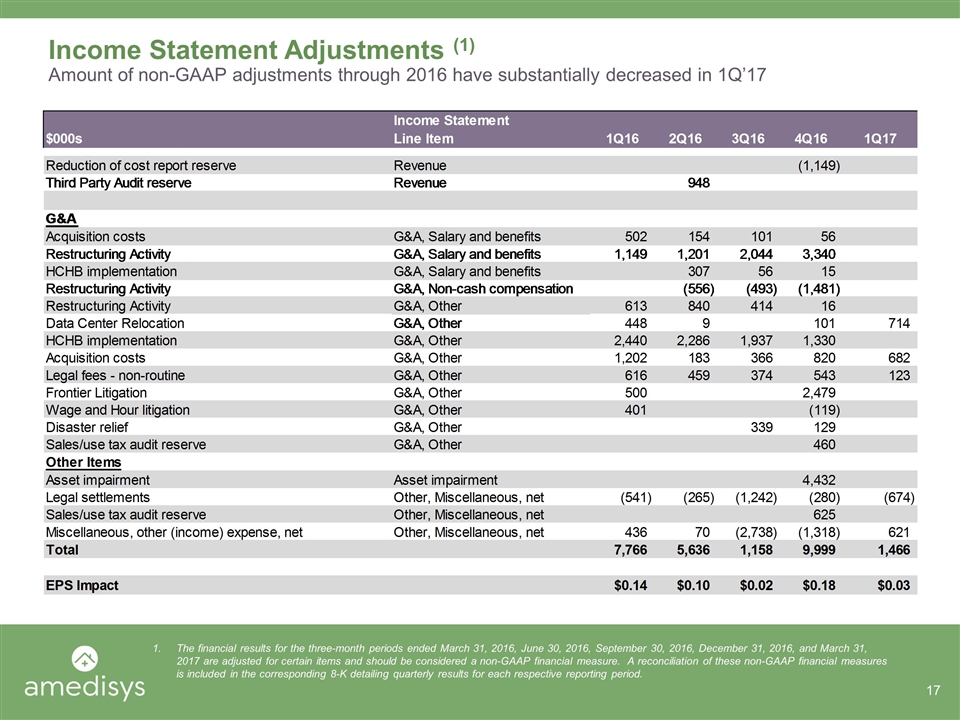
Income Statement Adjustments (1) Amount of non-GAAP adjustments through 2016 have substantially decreased in 1Q’17 The financial results for the three-month periods ended March 31, 2016, June 30, 2016, September 30, 2016, December 31, 2016, and March 31, 2017 are adjusted for certain items and should be considered a non-GAAP financial measure. A reconciliation of these non-GAAP financial measures is included in the corresponding 8-K detailing quarterly results for each respective reporting period. 17
