Attached files
| file | filename |
|---|---|
| EX-32.2 - EXHIBIT 32.2 - AMEDISYS INC | exhibit322.htm |
| EX-32.1 - EXHIBIT 32.1 - AMEDISYS INC | exhibit321.htm |
| EX-31.2 - EXHIBIT 31.2 - AMEDISYS INC | exhibit312.htm |
| EX-31.1 - EXHIBIT 31.1 - AMEDISYS INC | exhibit311.htm |
| EX-23.1 - EXHIBIT 23.1 - AMEDISYS INC | d332070dex231.htm |
| EX-21.1 - EXHIBIT 21.1 - AMEDISYS INC | exhibit211.htm |
UNITED STATES
SECURITIES AND EXCHANGE COMMISSION
Washington, D.C. 20549
FORM 10-K
(Mark One)
x | ANNUAL REPORT PURSUANT TO SECTION 13 OR 15(d) OF THE SECURITIES EXCHANGE ACT OF 1934 |
For the fiscal year ended: December 31, 2017
OR
o | TRANSITION REPORT PURSUANT TO SECTION 13 OR 15(d) OF THE SECURITIES EXCHANGE ACT OF 1934 |
For the transition period from to
Commission File Number: 0-24260

AMEDISYS, INC.
(Exact Name of Registrant as Specified in its Charter)
Delaware | 11-3131700 | |
(State or other jurisdiction of incorporation or organization) | (I.R.S. Employer Identification No.) | |
3854 American Way, Suite A, Baton Rouge, LA 70816
(Address of principal executive offices, including zip code)
(225) 292-2031 or (800) 467-2662
(Registrant’s telephone number, including area code)
Securities registered pursuant to Section 12(b) of the Act:
Title of Each Class | Name of Each Exchange on Which Registered | |
Common Stock, par value $0.001 per share | The NASDAQ Global Select Market | |
Securities registered pursuant to Section 12(g) of the Act: None
Indicate by check mark if the registrant is a well-known seasoned issuer, as defined in Rule 405 of the Securities Act. Yes þ No o
Indicate by check mark if the registrant is not required to file reports pursuant to Section 13 or 15(d) of the Act. Yes o No þ
Indicate by check mark whether the registrant (1) has filed all reports required to be filed by Section 13 or 15(d) of the Securities Exchange Act of 1934 during the preceding 12 months (or for such shorter period that the registrant was required to file such reports), and (2) has been subject to such filing requirements for the past 90 days. Yes þ No o
Indicate by check mark whether the registrant has submitted electronically and posted on its corporate Web site, if any, every Interactive Data File required to be submitted and posted pursuant to Rule 405 of Regulation S-T (§ 232.405 of this chapter) during the preceding 12 months (or for such shorter period that the registrant was required to submit and post such files). Yes þ No o
Indicate by check mark if disclosure of delinquent filers pursuant to Item 405 of Regulation S-K (§ 229.405 of this chapter) is not contained herein, and will not be contained, to the best of registrant’s knowledge, in definitive proxy or information statements incorporated by reference in Part III of this Form 10-K or any amendment to this Form 10-K. þ
Indicate by check mark whether the registrant is a large accelerated filer, an accelerated filer, a non-accelerated filer, a smaller reporting company, or an emerging growth company. See the definitions of “large accelerated filer,” “accelerated filer,” “smaller reporting company,” and "emerging growth company" in Rule 12b-2 of the Exchange Act.
Large accelerated filer þ | Accelerated filer o | |
Non-accelerated filer o (Do not check if a smaller reporting company) | Smaller reporting company ☐ | |
Emerging growth company ☐ | ||
If an emerging growth company, indicate by check mark if the registrant has elected not to use the extended transition period for complying with any new or revised financial accounting standards provided pursuant to Section 13(a) of the Exchange Act. o
Indicate by check mark whether the registrant is a shell company (as defined in Rule 12b-2 of the Act). Yes o No þ
The aggregate market value of the voting and non-voting common stock held by non-affiliates of the registrant, based on the last sale price as quoted by the NASDAQ Global Select Market on June 30, 2017 (the last business day of the registrant’s most recently completed second fiscal quarter) was $1.5 billion. For purposes of this determination shares beneficially owned by executive officers, directors and ten percent stockholders have been excluded, which does not constitute a determination that such persons are affiliates.
As of February 23, 2018, the registrant had 33,984,771 shares of Common Stock outstanding.
DOCUMENTS INCORPORATED BY REFERENCE
Portions of the registrant’s definitive Proxy Statement for its 2018 Annual Meeting of Stockholders (the “2018 Proxy Statement”) to be filed pursuant to the Securities Exchange Act of 1934 with the Securities and Exchange Commission within 120 days of December 31, 2017 are incorporated herein by reference into Part III of this Annual Report on Form 10-K.
TABLE OF CONTENTS
EX-10.3 COMPOSITE AMEDISYS, INC. 2008 OMNIBUS INCENTIVE COMPENSATION PLAN, AS AMENDED | ||
EX-10.15 AMEDISYS HOLDING, L.L.C. SEVERANCE PLAN FOR KEY EXECUTIVES, AS AMENDED | ||
EX-21.1 LIST OF SUBSIDIARIES | ||
EX-23.1 CONSENT OF KPMG LLP | ||
EX-101 INTERACTIVE DATA FILE | ||
SPECIAL CAUTION CONCERNING FORWARD-LOOKING STATEMENTS
When included in this Annual Report on Form 10-K, or in other documents that we file with the Securities and Exchange Commission (“SEC”) or in statements made by or on behalf of the Company, words like “believes,” “belief,” “expects,” “plans,” “anticipates,” “intends,” “projects,” “estimates,” “may,” “might,” “would,” “should” and similar expressions are intended to identify forward-looking statements as defined by the Private Securities Litigation Reform Act of 1995. These forward-looking statements involve a variety of risks and uncertainties that could cause actual results to differ materially from those described therein. These risks and uncertainties include, but are not limited to the following: changes in Medicare and other medical payment levels, our ability to open care centers, acquire additional care centers and integrate and operate these care centers effectively, changes in or our failure to comply with existing federal and state laws or regulations or the inability to comply with new government regulations on a timely basis, competition in the healthcare industry, our ability to integrate our personal care segment into our business efficiently, changes in the case mix of patients and payment methodologies, changes in estimates and judgments associated with critical accounting policies, our ability to maintain or establish new patient referral sources, our ability to attract and retain qualified personnel, changes in payments and covered services due to an economic downturn and deficit spending by federal and state governments, future cost containment initiatives undertaken by third-party payors, our access to financing, our ability to meet debt service requirements and comply with covenants in debt agreements, business disruptions due to natural disasters or acts of terrorism, our ability to integrate, manage and keep our information systems secure, our ability to comply with requirements stipulated in our corporate integrity agreement and changes in law or developments with respect to any litigation relating to the Company, including various other matters, many of which are beyond our control.
Because forward-looking statements are inherently subject to risks and uncertainties, some of which cannot be predicted or quantified, you should not rely on any forward-looking statement as a prediction of future events. We expressly disclaim any obligation or undertaking and we do not intend to release publicly any updates or changes in our expectations concerning the forward-looking statements or any changes in events, conditions or circumstances upon which any forward-looking statement may be based, except as required by law. For a discussion of some of the factors discussed above as well as additional factors, see Part I, Item 1A, “Risk Factors” and Part II, Item 7, “Critical Accounting Estimates” within “Management’s Discussion and Analysis of Financial Condition and Results of Operations.”
Unless otherwise provided, “Amedisys,” “we,” “us,” “our,” and the “Company” refer to Amedisys, Inc. and our consolidated subsidiaries and when we refer to 2017, 2016 and 2015, we mean the twelve month period then ended December 31, unless otherwise provided.
A copy of this Annual Report on Form 10-K for the year ended December 31, 2017 as filed with the SEC, including all exhibits, is available on our internet website at http://www.amedisys.com on the “Investors” page under the “SEC Filings” link.
1
PART I
ITEM 1. BUSINESS
Overview
Amedisys, Inc. is a leading healthcare services company focused on providing care in the home. Our operations involve servicing patients across the United States through our three operating divisions: home health, hospice and personal care. We deliver clinically distinct care that best suits our patients' needs, whether that is home-based recovery and rehabilitation after an operation or injury, care that empowers patients to manage a chronic disease, hospice care at the end of life, or providing assistance with daily activities through our personal care division.
We are among the largest, pure play providers of home health and hospice care in the United States, with 421 care centers in 34 states within the United States and the District of Columbia. Our 17,900 employees deliver the highest quality care making more than nine million patient visits to approximately 369,000 patients annually. Over 3,000 hospitals and 59,000 physicians nationwide have chosen us as a partner in post-acute care.
Our services are primarily paid for by Medicare due to the age demographics of our patient base. Medicare represented approximately 75% to 80% of our net service revenue over the last three years. We also remain focused on maintaining a profitable and strategically important managed care contract portfolio.
Amedisys is headquartered in Baton Rouge, Louisiana, with an executive office in Nashville, Tennessee. Our common stock is currently traded on NASDAQ Global Select Market under the trading symbol “AMED”. Founded and incorporated in Louisiana in 1982, Amedisys was reincorporated as a Delaware corporation prior to becoming a publicly traded company in August, 1994.
Our strategy is to become the best choice for care wherever our patients call home by excelling in clinical distinction, being the employer of choice, delivering operational excellence and efficiency and driving growth. Our mission is to provide compassionate home health, hospice and personal care services that apply the most advanced clinical practices toward allowing our patients to maintain a sense of independence, quality of life and dignity while delivering best in-class outcomes. We believe that focusing on providing excellent care and becoming an employer of choice across the United States differentiates us from our competitors.
Our Home Health Segment:
Amedisys Home Health provides experienced, compassionate healthcare to help our patients recover from surgery or illness, live with chronic diseases, and prevent avoidable hospital readmissions. We have grown our home health footprint to 323 care centers located in 34 states within the United States and the District of Columbia. Within these care centers, we deploy our care teams which include skilled nurses who are trained and certified to administer medications, care for wounds, monitor vital signs and provide a wide range of other nursing services; therapists specialized in physical, speech and occupational therapy; and aides who assist our patients with completing important personal tasks.
We take an empowering approach to helping our patients and their families understand their condition, how to manage it and how to live life to the fullest with a chronic disease or other health condition. Our professional and compassionate clinicians are trained to understand the whole patient – not just their medical diagnosis.
This commitment to clinical distinction is most evident in our clinical performance measures such as Star Ratings. In the Center for Medicare and Medicaid Services (“CMS”) reports for the January 2018 release, the Quality of Patient Care star average across all Amedisys providers is 4.22 with 88% of our providers at 4+ stars. Our Patient Satisfaction average as of the last known release was 3.56, outperforming the industry average of 3.36. Our goal is to have all of our care centers achieve a 4.0 Quality Star Rating, and we are implementing targeted action plans to continue to improve the quality of care we deliver for our patients.
Our Hospice Segment:
Hospice care is designed to provide comfort and support for those who are dealing with a terminal illness. It is a compassionate form of care that promotes dignity and affirms quality of life for the patient, family members and other loved ones. Individuals with a terminal illness such as heart disease, pulmonary disease, Alzheimer’s, HIV/AIDS or cancer may be eligible for hospice care, if they have a life expectancy of six months or less.
We operate 83 hospice care centers in 22 states within the United States.
At Amedisys Hospice, our focus is on building and retaining an exceptional team, delivering the highest quality care and service to our patients and their families, and establishing Amedisys as the preferred and preeminent hospice provider in each community
2
we serve. In order to realize these goals, we invest in tailored training, development, and recognition programs for our employees, including medical record training, employee skills training and leadership development. This has led to our team’s consistent achievement at or above the national average in family satisfaction results and quality scores, as well as the trust of the healthcare community.
Another element of our approach is our outreach strategy to more fully engage the entire community of eligible patients. These outreach efforts have built our hospice patient population to more accurately represent the causes of death in the communities we serve, with a specific focus on heart disease, lung disease, and dementia in order to address the historical underrepresentation of non-cancer diagnoses.
By working to accept every eligible patient who seeks compassionate end-of-life care, we fulfill our hospice mission and strengthen our standing in the community.
Our Personal Care Segment:
On March 1, 2016, Amedisys acquired its first personal care company – an important step in executing our strategy of improving the continuity of care our patients receive as their clinical needs change. We continued our strategy to expand our personal care segment in 2017 as we completed two additional acquisitions and currently operate 14 personal-care care centers in Massachusetts and one personal-care care center in Florida. We are continually looking to expand our personal care footprint to states where we have a strong home health and hospice presence.
Personal care provides assistance with the essential activities of daily living. We believe that personal care services are highly synergistic with our core skilled home health and hospice businesses, and that by acquiring these capabilities we will be able to provide our patients and payor partners with a true continuum of care.
Responding to Changing Regulatory and Reimbursement Environment:
As the government continues to seek opportunities to refine payment models, we believe that our strategy of becoming a leader in providing a range of service across the at-home continuum positions us well for the future. Our ability to provide quality home health, hospice and personal care allows us to partner with health systems and managed care organizations to improve care coordination, reduce hospitalizations and lower costs.
Acquisitions:
On February 1, 2017, we acquired the assets of Home Staff, L.L.C. for a total purchase price of $4.0 million. Home Staff, L.L.C. owned and operated three personal-care care centers servicing the state of Massachusetts.
On May 1, 2017 we acquired three home health centers (one each in Illinois, Massachusetts and Texas) and two hospice care centers (one each in Arizona and Massachusetts) from Tenet Healthcare for a total purchase price of $20.5 million.
On October 1, 2017, we acquired the assets of Intercity Home Care for a total purchase price of $9.6 million. Intercity Home Care owned and operated four personal-care care centers servicing the state of Massachusetts.
Financial Information:
Financial information for our home health, hospice and personal care segments can be found in our consolidated financial statements included in this Annual Report on Form 10-K.
Our Employees
As of February 23, 2018, we employed approximately 17,900 employees, consisting of approximately 10,900 home health care employees, 3,200 hospice care employees, 3,100 personal care employees and 700 corporate and divisional support employees.
3
Payment for Our Services
Home Health Medicare
The Medicare home health benefit is available both for patients who need care following discharge from a hospital and patients who suffer from chronic conditions that require ongoing but intermittent care. As a condition of participation under Medicare, beneficiaries must be homebound (meaning that the beneficiary is unable to leave his/her home without a considerable and taxing effort), require intermittent skilled nursing, physical therapy or speech therapy services, and receive treatment under a plan of care established and periodically reviewed by a physician. Medicare rates are based on the severity of the patient’s condition, his or her service needs and other factors relating to the cost of providing services and supplies, bundled into 60-day episodes of care. An episode starts with the first day a billable visit is performed and ends 60 days later or upon discharge, if earlier. If a patient is still in treatment on the 60th day, a recertification assessment is undertaken to determine whether the patient needs additional care. If the patient’s physician determines that further care is necessary, another episode begins on the 61st day (regardless of whether a billable visit is rendered on that day) and ends 60 days later. The first day of a consecutive episode, therefore, is not necessarily the new episode’s first billable visit.
Annually, the Medicare program base episodic rates are set through federal legislation, as follows:
Period | Base Episode Payment | ||
January 1, 2015 through December 31, 2015 | $ | 2,961 | |
January 1, 2016 through December 31, 2016 | $ | 2,965 | |
January 1, 2017 through December 31, 2017 | $ | 2,990 | |
January 1, 2018 through December 31, 2018 | $ | 3,040 | |
Payments can be adjusted for: (a) an outlier payment if our patient’s care was unusually costly (capped at 10% of total reimbursement per provider number); (b) a low utilization payment adjustment (“LUPA”) if the number of visits during the episode was fewer than five; (c) a partial payment if our patient transferred to another provider or we received a patient from another provider before an episode was complete; (d) a payment adjustment based upon the level of therapy services required (with various incremental adjustments made for additional visits, with larger payment increases associated with the sixth, fourteenth and twentieth visit thresholds); (e) a payment adjustment if we are unable to perform periodic therapy assessments; (f) the number of episodes of care provided to a patient, regardless of whether the same home health provider provided care for the entire series of episodes; (g) changes in the base episode payments established by the Medicare program; (h) adjustments to the base episode payments for case mix and geographic wages; and (i) recoveries of overpayments. Medicare can also make various adjustments to payments received if we are unable to produce appropriate billing documentation or acceptable authorizations. In addition, we make adjustments to Medicare revenue if we find that we are unable to obtain appropriate billing documentation, authorizations or face to face documentation.
Home Health Non-Medicare
Payments from Medicaid and private insurance carriers are episodic-based rates (60-day episode of care) or per-visit rates depending upon the terms and conditions established with such payors. Episodic-based rates paid by our non-Medicare payors are paid in a similar manner and subject to the same adjustments as discussed above for Medicare; however, these rates can vary based upon negotiated terms which generally range from 90% to 100% of Medicare rates.
Hospice Medicare
The Medicare hospice benefit is also available to Medicare-eligible patients with terminal illnesses, certified by a physician, where life expectancy is six months or less. Medicare rates are based on standard prospective rates for delivering care over a base 90-day or 60-day period (90-day episodes of care for the first two episodes and 60-day episodes of care for any subsequent episodes). Payments are based on daily rates for each day a beneficiary is enrolled in the hospice benefit. Rates are set based on specific levels of care, are adjusted by a wage index to reflect health care labor costs across the country and are established annually through federal legislation. We make adjustments to Medicare revenue when we find we are unable to obtain appropriate billing documentation, authorizations or face to face documentation and other reasons unrelated to credit risk. The levels of care are routine care, general inpatient care, continuous home care and respite care. Beginning January 1, 2016, CMS has provided for two separate payment rates for routine care: payments for the first 60 days of care and care beyond 60 days. In addition to the two routine rates, on January 1, 2016, Medicare also began reimbursing for a service intensity add-on (“SIA”). The SIA is based on visits made in the last seven days of life by a registered nurse (“RN”) or medical social worker (“MSW”) for patients in a routine level of care.
4
We bill Medicare for hospice services on a monthly basis and our payments are subject to two fixed annual caps, which are assessed on a provider number basis. Generally, each hospice care center has its own provider number. However, where we have created branch care centers to help our parent care centers serve a geographic location, the parent and branch may have the same provider number. In the 2017 final rule, CMS finalized a provision to align the cap accounting year for both the inpatient cap and the hospice aggregate cap for the years 2017 and beyond. As a result of this alignment, the annual caps per patient, known as hospice caps, which are calculated and published by the Medicare fiscal intermediary on an annual basis now cover the twelve month period from October 1 through September 30. The caps can be subject to annual and retroactive adjustments, which can cause providers to be required to reimburse the Medicare program if such caps are exceeded.
The two caps are detailed below:
• | Inpatient Cap. When we provide hospice care on an inpatient basis, the payments that we are entitled to receive at the higher inpatient reimbursement rate are subject to a cap. This cap limits the number of days that are paid at the inpatient care rate (both respite and general) under a provider number to 20% of the total number of days of hospice care (both inpatient and in-home) that is furnished to all Medicare patients served by the provider. The daily Medicare payment rate for any inpatient days of service that exceed the cap is at the routine home care rate, and the provider is required to reimburse Medicare for any amounts it receives in excess of the cap; and |
• | Overall Payment Cap. This cap is calculated by the Medicare fiscal intermediary at the end of each hospice cap period to determine the maximum allowable payments per provider number. We estimate our potential cap exposure using information available for both inpatient day limits as well as per beneficiary cap amounts. The total cap amount for each provider is calculated by multiplying the number of beneficiaries electing hospice care during the period by a statutory amount that is indexed for inflation. |
Our ability to stay within these limitations depends on a number of factors, each determined on a provider number basis, including the average length of stay and mix in level of care.
Hospice Non-Medicare
Non-Medicare payors pay at rates different from established Medicare rates for hospice services, which are based on separate, negotiated agreements. We bill and are paid by these non-Medicare payors based on such negotiated agreements.
Personal Care Non-Medicare
Personal care payments are received from payor clients including state and local governmental agencies, managed care organizations, commercial insurers and private consumers, based on rates that are either contractual or fixed by legislation.
Controls over Our Business System Infrastructure
We establish and maintain processes and controls over coding, clinical operations, billing, patient recertifications and compliance to help monitor and promote adherence with Medicare requirements.
• | Coding – Specified ICD diagnosis codes are assigned to each of our patients based on their particular health conditions (such as diabetes, coronary artery disease or congestive heart failure). Because coding regulations are complex and are subject to frequent change, we maintain controls surrounding our coding process. In order to reduce associated risk of coding failures, we provide coding training and annual update training to clinical managers; provide training during orientation for new employees to ensure accurate information is gathered and provided to our coding team; provide monthly specialized coding education; obtain outside expert coding instruction; have certified clinician coders review all patient outcome and assessment information sets (“OASIS”) and assign the appropriate ICD code. Our electronic medical records system (Homecare Homebase) includes automated coding edits based on pre-defined compliance metrics. |
• | Clinical Operations – Regulatory requirements allow patients to be admitted to home health care if they are considered homebound and require skilled nursing, physical therapy or speech therapy services. These clinical services may include: educating the patient about their disease; assessment and observation of disease status; delivery of clinical skills such as wound care; administration of injections or intravenous fluids; management and evaluation of a patient’s plan of care; physical therapy services to assist patients with functional limitations and speech therapy services for speech or swallowing disorders. In order to help monitor and promote compliance with regulatory requirements, we provide education on Medicare Guidelines and Conditions of participation; hold recurrent homecare regulatory education; utilize outside expert regulatory services; and have a toll-free hotline to offer additional assistance. |
• | Billing – We maintain controls over our billing processes to help promote accurate and complete billing. In order to promote the accuracy and completeness of our billing, we have annual billing compliance testing; use formalized billing |
5
attestations; limit access to billing systems; use automated daily billing operational indicators; and take prompt corrective action with employees who knowingly fail to follow our billing policies and procedures in accordance with a well-publicized “Zero Tolerance Policy”.
• | Patient Recertification – In order to be recertified for an additional episode of care, a patient must continue to meet qualifying criteria and have a continuing medical need. This could be caused by changes in the patient’s condition requiring changes to the patient’s medical regimen or modified care protocols within the episode of care. The patient’s progress towards goals is evaluated prior to recertification. As with the initial episode of care, a recertification requires orders from the patient’s physician. Before any employee recommends recertification to a physician, we conduct a care center level, multidisciplinary care team conference. Specific tools (e.g., recert/discharge decision tree) are used to ensure that the patient continues to meet coverage criteria prior to recertifying. |
• | Compliance – We develop, implement and maintain ethics and compliance programs as a component of the centralized corporate services provided to our home health, hospice and personal-care care centers. Our ethics and compliance program includes a Code of Conduct for our employees, officers, directors, contractors and affiliates and a disclosure program for reporting regulatory or ethical concerns to our compliance team through a confidential hotline, which is augmented by exit interviews of departing employees. We promote a culture of compliance within our company through educational presentations, regular newsletters and persistent messaging from our senior leadership to our employees stressing the importance of strict compliance with legal requirements and company policies and procedures. Additionally, we have mandatory compliance training and testing for all new employees upon hire and annually for all staff thereafter. We also maintain a robust compliance audit program focusing on key risk areas. |
Our Regulatory Environment
We are highly regulated by federal, state and local authorities. Regulations and policies frequently change, and we monitor changes through trade and governmental publications and associations. Our home health and hospice subsidiaries are certified by CMS and therefore are eligible to receive payment for services through the Medicare system.
We are also subject to federal, state and local laws and regulations dealing with issues such as occupational safety, employment, medical leave, insurance, civil rights, discrimination, building codes, environmental issues and adverse event reporting and recordkeeping. Federal, state and local governments are expanding the number of regulatory requirements on businesses.
We have set forth below a discussion of the regulations that we believe most significantly affect our home health and hospice businesses.
Licensure, Certificates of Need (CON) and Permits of Approval (POA)
Home health and hospice care centers operate under licenses granted by the health authorities of their respective states. Additionally, certain states, including a number in which we operate, carefully restrict new entrants into the market based on demographic and/or demonstrative usage of additional providers. In such states, expansion by existing providers or entry into the market by new providers is permitted only where a given amount of unmet need exists, resulting either from population increases or a reduction in competing providers. These states ration the entry of new providers or services and the expansion of existing providers or services in their markets through a CON process, which is periodically evaluated and updated as required by applicable state law. Currently, state health authorities in 17 states and the District of Columbia require a CON or, in the State of Arkansas, a POA, in order to establish and operate a home health care center, and state health authorities in 12 states and the District of Columbia require a CON to operate a hospice care center.
We operate home health care centers in the following CON states: Alabama, Arkansas (POA), Georgia, Kentucky, Maryland, Mississippi, New Jersey, New York, North Carolina, South Carolina, Tennessee, Washington and West Virginia, as well as the District of Columbia. We provide hospice related services in the following CON states: Alabama, Maryland, North Carolina, Tennessee and West Virginia.
In every state where required, our care centers possess a license and/or CON or POA issued by the state health authority that determines the local service areas for the home health or hospice care center. In general, the process for opening a home health or hospice care center begins by a provider submitting an application for licensure and certification to the state and federal regulatory bodies, which is followed by a testing period of transmitting data from the applicant to CMS. Once this process is complete, the care center receives a provider agreement and corresponding number and can begin billing for services that it provides unless a CON or POA is required. For those states that require a CON or POA, the provider must also complete a separate application process before billing can commence and receive required approvals for capital expenditures exceeding amounts above prescribed thresholds.
6
State CON and POA laws generally provide that, prior to the addition of new capacity, the construction of new facilities or the introduction of new services, a designated state health planning agency must determine that a need exists for those beds, facilities or services. The process is intended to promote comprehensive health care planning, assist in providing high-quality health care at the lowest possible cost and avoid unnecessary duplication by ensuring that only those health care facilities and operations that are needed will be built and opened.
Medicare Participation
Our care centers must comply with regulations promulgated by the United States Department of Health and Human Services and CMS in order to participate in the Medicare program and receive Medicare payments. Among other things, these regulations, known as “conditions of participation (“COPs”),” relate to the type of facility, its personnel and its standards of medical care, as well as its compliance with state and local laws and regulations. CMS has adopted alternative sanction enforcement options which allow CMS (i) to impose temporary management, direct plans of correction, or direct training, and (ii) to impose payment suspensions and civil monetary penalties in each case on providers out of compliance with the conditions of participation. On January 12, 2017, CMS finalized new COPs for home health agencies and published them in the Federal Register. These new COPs, which went into effect on January 13, 2018, focus on the safe delivery of quality care provided to patients and the impact of that care on patient outcomes through the protection and promotion of patients' rights, care planning, delivery and coordination of services, and streamlining of regulatory requirements.
CMS has engaged a number of third party firms, including Recovery Audit Contractors (“RACs”), Program Safeguard Contractors (“PSCs”), Zone Program Integrity Contractors (“ZPICs”) and Medicaid Integrity Contributors (“MICs”), to conduct extensive reviews of claims data and state and Federal Government health care program laws and regulations applicable to healthcare providers. These audits evaluate the appropriateness of billings submitted for payment. In addition to identifying overpayments, audit contractors can refer suspected violations of law to government enforcement authorities.
Federal and State Anti-Fraud and Anti-Kickback Laws
As a provider under the Medicare and Medicaid systems, we are subject to various anti-fraud and abuse laws, including the Federal health care programs’ anti-kickback statute and, where applicable, its state law counterparts. Subject to certain exceptions, these laws prohibit any offer, payment, solicitation or receipt of any form of remuneration to induce or reward the referral of business payable under a government health care program or in return for the purchase, lease, order, arranging for, or recommendation of items or services covered under a government health care program. Affected government health care programs include any health care plans or programs that are funded by the United States government (other than certain federal employee health insurance benefits/programs), including certain state health care programs that receive federal funds, such as Medicaid. A related law forbids the offer or transfer of anything of value, including certain waivers of co-payment obligations and deductible amounts, to a beneficiary of Medicare or Medicaid that is likely to influence the beneficiary’s selection of health care providers, again subject to certain exceptions. Violations of the anti-fraud and abuse laws can result in the imposition of substantial civil and criminal penalties and, potentially, exclusion from furnishing services under any government health care program. In addition, the states in which we operate generally have laws that prohibit certain direct or indirect payments or fee-splitting arrangements between health care providers where they are designed to obtain the referral of patients from a particular provider.
Stark Laws
Congress adopted legislation in 1989, known as the “Stark Law,” that generally prohibited a physician from ordering clinical laboratory services for a Medicare beneficiary where the entity providing that service has a financial relationship (including direct or indirect ownership or compensation relationships) with the physician (or a member of his/her immediate family), and further prohibits such entity from billing for or receiving payment for such services, unless a specified exception is available. The Stark Law was amended through additional legislation, known as “Stark II,” which became effective January 1, 1993. That legislation extended the Stark Law prohibitions beyond clinical laboratory services to a more extensive list of statutorily defined “designated health services,” which includes, among other things, home health services, durable medical equipment and outpatient prescription drugs. Violations of the Stark Law result in payment denials and may also trigger civil monetary penalties and program exclusion. Several of the states in which we conduct business have also enacted statutes similar in scope and purpose to the federal fraud and abuse laws and the Stark Laws. These state laws may mirror the Federal Stark Laws or may be different in scope. The available guidance and enforcement activity associated with such state laws varies considerably.
Federal and State Privacy and Security Laws
The Administrative Simplification provisions of the Health Insurance Portability and Accountability Act of 1996, as amended (“HIPAA”), directed that the Secretary of the U.S. Department of Health and Human Services (“HHS”) promulgate regulations
7
prescribing standard requirements for electronic health care transactions and establishing protections for the privacy and security of individually identifiable health information, known as “protected health information.” The HIPAA transactions regulations establish form, format and data content requirements for most electronic health care transactions, such as health care claims that are submitted electronically. The HIPAA privacy regulations establish comprehensive requirements relating to the use and disclosure of protected health information. The HIPAA security regulations establish minimum standards for the protection of protected health information that is stored or transmitted electronically. Violations of the privacy and security regulations are punishable by civil and criminal penalties.
The American Recovery and Economic Reinvestment Act of 2009 (“ARRA”), signed into law by President Obama on February 17, 2009, contained significant changes to the privacy and security provisions of HIPAA, including major changes to the enforcement provisions. Among other things, ARRA significantly increased the amount of civil monetary penalties that can be imposed for violations of HIPAA. ARRA also authorized state attorneys general to bring civil enforcement actions under HIPAA. These enhanced penalties and enforcement provisions went into effect immediately upon enactment of ARRA. ARRA also required that HHS promulgate regulations requiring that certain notifications be made to individuals, to HHS and potentially to the media in the event of breaches of the privacy of protected health information. These breach notification regulations went into effect on September 23, 2009, and HHS began to enforce violations on February 22, 2010. Violations of the breach notification provisions of HIPAA can trigger the increased civil monetary penalties described above.
ARRA’s numerous other changes to HIPAA delayed effective dates and required the issuance of implementing regulations by HHS. The Health Information Technology for Economic and Clinical Health (“HITECH”) Act was enacted in conjunction with ARRA. On January 25, 2013, HHS issued final modifications to the HIPAA Privacy, Security, and Enforcement Rules mandated by the HITECH Act, which had been previously issued as a proposed rule on July 14, 2010. Among other things, these modifications make business associates of covered entities directly liable for compliance with certain HIPAA requirements, strengthen the limitations on the use and disclosure of protected health information without individual authorizations, and adopt the additional HITECH Act enhancements, including enforcement of noncompliance with HIPAA due to willful neglect. The changes to HIPAA enacted as part of ARRA reflect a Congressional intent that HIPAA’s privacy and security provisions be more strictly enforced. These changes have stimulated increased enforcement activity and enhanced the potential that health care providers will be subject to financial penalties for violations of HIPAA.
In addition to the federal HIPAA regulations, most states also have laws that protect the confidentiality of health information. Also, in response to concerns about identity theft, many states have adopted so-called “security breach” notification laws that may impose requirements regarding the safeguarding of personal information, such as social security numbers and bank and credit card account numbers, and that impose an obligation to notify persons when their personal information has or may have been accessed by an unauthorized person. Some state security breach notification laws may also impose physical and electronic security requirements. Violation of state security breach notification laws can trigger significant monetary penalties.
The False Claims Act
The Federal False Claims Act gives the Federal Government an additional way to police false bills or requests for payment for health care services. Under the False Claims Act, the government may fine any person who knowingly submits, or participates in submitting, claims for payment to the Federal Government which are false or fraudulent, or which contain false or misleading information. Any person who knowingly makes or uses a false record or statement to avoid paying the Federal Government, or knowingly conceals or avoids an obligation to pay money to the Federal Government, may also be subject to fines under the False Claims Act. Under the False Claims Act, the term “person” means an individual, company, or corporation. The Federal Government has widely used the False Claims Act to prosecute Medicare and other governmental program fraud in areas such as violations of the Federal anti-kickback statute or the Stark Laws, coding errors, billing for services not provided, and submitting false cost reports. The False Claims Act has also been used to prosecute people or entities that bill services at a higher reimbursement rate than is allowed and that bill for care that is not medically necessary. In addition to government enforcement, the False Claims Act authorizes private citizens to bring qui tam or “whistleblower” lawsuits, greatly extending the practical reach of the False Claims Act. The penalty for violation of the False Claims Act is a minimum of $5,500 for each fraudulent claim plus three times the amount of damages caused to the government as a result of each fraudulent claim.
The Fraud Enforcement and Recovery Act of 2009 (“FERA”) amended the False Claims Act with the intent of enhancing the powers of government enforcement authorities and whistleblowers to bring False Claims Act cases. In particular, FERA attempts to clarify that liability may be established not only for false claims submitted directly to the government, but also for claims submitted to government contractors and grantees. FERA also seeks to clarify that liability exists for attempts to avoid repayment of overpayments, including improper retention of federal funds. FERA also included amendments to False Claims Act procedures, expanding the government’s ability to use the Civil Investigative Demand process to investigate defendants, and permitting
8
government complaints in intervention to relate back to the filing of the whistleblower’s original complaint. FERA is likely to increase both the volume and liability exposure of False Claims Act cases brought against health care providers.
In March of 2010, as part of the Patient Protection and Affordable Care Act (discussed in more detail below), Congress enacted new requirements related to identifying and returning overpayments made under Medicare and Medicaid. On February 12, 2016, CMS finalized regulations regarding this so-called “60-day rule,” which requires providers to report and return Medicare and Medicaid overpayments within 60 days of identifying the same. A provider who retains identified overpayments beyond 60 days may be liable under the False Claims Act. “Identification” occurs when a person “has, or should have through the exercise of reasonable diligence,” identified and quantified the amount of an overpayment. The final rule also established a six year lookback period, meaning overpayments must be reported and returned if a person identifies the overpayment within six years of the date the overpayment was received. Providers must report and return overpayments even if they did not cause the overpayment.
In November of 2015, the Federal Civil Penalties Inflation Adjustment Act Improvements Act of 2015 made the amounts of civil monetary penalties subject to adjustment for inflation and authorized a one-time catch-up adjustment for all penalties not previously subject to an inflation adjustment. In June of 2016, the Department of Justice issued a rule that more than doubled civil monetary penalties under the False Claims Act. These increases took effect on August 1, 2016 and apply to False Claims Act violations after November 2, 2015. Subsequent inflation adjustments have occurred by rule in February of 2017 and January of 2018. Each annual adjustment is applicable to penalties assessed after the date of the rule but applies only to conduct occurring after November 2, 2015.
In addition to the False Claims Act, the Federal Government may use several criminal statutes to prosecute the submission of false or fraudulent claims for payment to the Federal Government. Many states have similar false claims statutes that impose liability for the types of acts prohibited by the False Claims Act. As part of the Deficit Reduction Act of 2005 (the “DRA”), Congress provided states an incentive to adopt state false claims acts consistent with the Federal False Claims Act. Additionally, the DRA required providers who receive $5 million or more annually from Medicaid to include information on Federal and state false claims acts, whistleblower protections and the providers’ own policies on detecting and preventing fraud in their written employee policies.
Civil Monetary Penalties
The United States Department of Health and Human Services may impose civil monetary penalties for a variety of civil offenses related to federal health care programs. They may be imposed upon any person or entity who presents, or causes to be presented, certain ineligible claims for medical items or services, for providing improper inducements to beneficiaries to obtain services, for payments to limit services to patients, and for offenses related to relationships with excluded individuals, among other things. The amount of penalties varies depending on the offense. Pursuant to the Federal Civil Penalties Inflation Adjustment Act Improvements Act of 2015, the range of potential penalties significantly increased and, subject to annual inflation adjustments, range from over $4,000 to over $70,000, depending on the offense.
FDA Regulation
The U.S. Food and Drug Administration (“FDA”) regulates medical device user facilities, which include home health care providers. FDA regulations require user facilities to report patient deaths and serious injuries to FDA and/or the manufacturer of a device used by the facility if the device may have caused or contributed to the death or serious injury of any patient. FDA regulations also require user facilities to maintain files related to adverse events and to establish and implement appropriate procedures to ensure compliance with the above reporting and recordkeeping requirements. User facilities are subject to FDA inspection, and noncompliance with applicable requirements may result in warning letters or sanctions including civil monetary penalties, injunction, product seizure, criminal fines and/or imprisonment.
Patient Protection and Affordable Care Act
In March 2010, comprehensive health care reform legislation was signed into law in the United States through the passage of the Patient Protection and Affordable Care Act and the Health Care and Education Reconciliation Act (collectively, “PPACA”). Since the 2016 election, it has been widely discussed that the PPACA will be “repealed and replaced.” The effect of any major modification or repeal of the PPACA on our business, operations, or financial condition cannot be predicted at this time.
It is difficult to predict the full impact of PPACA due to the law’s complexity and phased in effective dates, as well as our inability to foresee how CMS and other participants in the health care industry will respond to the choices available to them under the law. PPACA calls for a number of changes to be made over time that will likely have a significant impact upon the health care delivery system. For example, PPACA mandates decreases in home health reimbursement rates, including a four-year phased rebasing of the home health payment system that began in 2014 and continued through 2017. These reimbursement changes are described in
9
detail in Part II, Item 7, “Management’s Discussion and Analysis of Financial Condition and Results of Operations: Overview – Economic and Industry Factors.” PPACA has established a number of new requirements impacting our business operations, and promises to give rise to other changes that could significantly impact our businesses in the future. For example, PPACA also mandates the creation of a home health value-based purchasing program, the development of quality measures, and the testing of alternative payment and delivery models, including Accountable Care Organizations ("ACOs") and the Bundled Payments for Care Improvement initiative. See Part I, Item 1A, “Risk Factors: Risks Related to Laws and Government Regulations” for a more complete discussion of PPACA and the risks it presents to our businesses.
The Improving Medicare Post-Acute Care Transformation Act
In October 2014, the Improving Medicare Post-Acute Care Transformation Act (“IMPACT Act”) was signed into law requiring the reporting of standardized patient assessment data for quality improvement, payment and discharge planning purposes across the spectrum of post-acute care providers (“PACs”), including skilled nursing facilities and home health agencies. The IMPACT Act requires PACs to begin reporting: (1) standardized patient assessment data at admission and discharge by October 1, 2018 for post-acute care providers, including skilled nursing facilities and by January 1, 2019 for home health agencies; (2) new quality measures, including functional status, skin integrity, medication reconciliation, incidence of major falls, and patient preference regarding treatment and discharge at various intervals between October 1, 2016 and January 1, 2019; and (3) resource use measures, including Medicare spending per beneficiary, discharge to community, and hospitalization rates of potentially preventable readmissions by October 1, 2016 for post-acute care providers, including skilled nursing facilities and by October 1, 2017 for home health agencies. Failure to report such data when required would subject a facility to a two percent reduction in market basket prices then in effect.
The IMPACT Act further requires HHS and the Medicare Payment Advisory Commission (“MedPAC”), a commission chartered by Congress to advise it on Medicare payment issues, to study alternative PAC payment models, including payment based upon individual patient characteristics and not care setting, with corresponding Congressional reports required based on such analysis. The IMPACT Act also included provisions impacting Medicare-certified hospices, including: (1) increasing survey frequency for Medicare-certified hospices to once every 36 months; (2) imposing a medical review process for facilities with a high percentage of stays in excess of 180 days; and (3) updating the annual aggregate Medicare payment cap.
Pre-Claim Review Demonstration for Home Health Services
On June 8, 2016, CMS announced the implementation of a three year Medicare pre-claim review demonstration for home health services provided to beneficiaries in the states of Illinois, Florida, Texas, Michigan and Massachusetts. The demonstration began in Illinois in August 2016 and was to expand to Florida for home health services that began on or after April 1, 2017; however, CMS suspended the program indefinitely but the agency can restart the demonstration in the announced states after providing 30 days' notice. The pre-claim review is a process through which a request for provisional affirmation of coverage is submitted for review before a final claim is submitted for payment. The pre-claim review demonstration may result in an increase in administrative costs or reimbursement delays related to home health services in such states, which could have an adverse effect on our results of operations and cash flow.
Home Health Value-Based Purchasing
On January 1, 2016, CMS implemented Home Health Value-Based Purchasing ("HHVBP"). The HHVBP model was designed to give Medicare-certified home health agencies incentives or penalties, through payment bonuses, to give higher quality and more efficient care. HHVBP was rolled out to nine pilot states: Arizona, Florida, Iowa, Maryland, Massachusetts, Nebraska, North Carolina, Tennessee and Washington, seven of which Amedisys currently has home health operations. Bonuses and penalties begin in 2018 with the maximum of plus or minus 3% growing to plus or minus 8% by 2022. Payment adjustments are calculated based on performance in 20 measures which include current Quality of Patient Care and Patient Satisfaction star measures, as well as measures based on submission of data to a CMS web portal. Based on the CMS published Total Performance Score results, we anticipate we will receive a net positive adjustment in 2018.
Home Health Payment Reform
In the Calendar Year 2018 Home Health Proposed Rule, released in July 2017, CMS proposed changes to the Home Health Prospective Payment System (“HHPPS”), known as the Home Health Groupings Model (“HHGM”). Among a number of major differences from the current payment system, the HHGM would have distinguished between referrals from institutions and those from the community, with community referrals receiving lower payments. In addition, a 60-day episode would consist of two 30-day periods, each paid separately, with the initial 30-day period paid higher than any other period. However, HHGM was not included in the final rule released in November 2017.
10
On February 9, 2018, Congress passed the Bipartisan Budget Act of 2018 ("BBA of 2018"), which funded government operations, set two-year government spending limits and enacted a variety of healthcare related policies. Specific to home health, the BBA of 2018 provides for a targeted extension of the home health rural add-on payment, a reduction of the 2020 market basket update, modification of eligibility documentation requirements and reform to the HHPPS. The HHPPS reform includes the following parameters:
• | For home health units of service beginning on January 1, 2020, a 30-day payment system will apply. |
• | The transition to the 30-day payment system must be budget neutral. |
• | CMS must conduct at least one Technical Expert Panel during 2018, prior to any notice and comment rulemaking process, related to the design of any new case-mix adjustment model. |
We are closely monitoring additional changes that may occur and will continue to work with industry stakeholders in directly engaging CMS and Congress on changes to the case-mix adjustment model.
Our Competitors
There are few barriers to entry in the home health and hospice jurisdictions that do not require certificates of need or permits of approval. Our primary competition in these jurisdictions comes from local privately and publicly-owned and hospital-owned health care providers. We compete based on the availability of personnel, the quality of services, expertise of visiting staff, and, in certain instances, on the price of our services. In addition, we compete with a number of non-profit organizations that finance acquisitions and capital expenditures on a tax-exempt basis or receive charitable contributions that are unavailable to us.
Available Information
Our company website address is www.amedisys.com. We use our website as a channel of distribution for important company information. Important information, including press releases, investor presentations and financial information regarding our company, is routinely posted on and accessible on the Investor Relations subpage of our website, which is accessible by clicking on the tab labeled “Investors” on our website home page. Visitors to our website can also register to receive automatic e-mail and other notifications alerting them when new information is made available on the “Investors” subpage of our website. In addition, we make available on the Investors subpage of our website (under the link “SEC Filings”), free of charge, our annual reports on Form 10-K, quarterly reports on Form 10-Q, current reports on Form 8-K, ownership reports on Forms 3, 4 and 5 and any amendments to those reports as soon as reasonably practicable after we electronically file or furnish such reports with the SEC. Further, copies of our Certificate of Incorporation and Bylaws, our Code of Ethical Business Conduct, our Corporate Governance Guidelines and the charters for the Audit, Compensation, Compliance and Ethics, Nominating and Corporate Governance and Quality of Care Committees of our Board are also available on the Investors subpage of our website (under the link “Corporate Governance”). Reference to our website does not constitute incorporation by reference of the information contained on the website and should not be considered part of this document.
Additionally, the public may read and copy any of the materials we file with the SEC at the SEC’s Public Reference Room at 100 F Street, NE, Room 1580, Washington, D.C. 20549. Information on the operation of the Public Reference Room may be obtained by calling the SEC at (800) SEC-0330. Our electronically filed reports can also be obtained on the SEC’s internet site at http://www.sec.gov.
ITEM 1A. RISK FACTORS
The risks described below, and risks described elsewhere in this Form 10-K, could have a material adverse effect on our business and consolidated financial condition, results of operations and cash flows and the actual outcome of matters as to which forward-looking statements are made in this Form 10-K. The risk factors described below and elsewhere in this Form 10-K are not the only risks faced by Amedisys. Our business and consolidated financial condition, results of operations and cash flows may also be materially adversely affected by factors that are not currently known to us, by factors that we currently consider immaterial or by factors that are not specific to us, such as general economic conditions.
If any of the following risks are actually realized, our business and consolidated financial condition, results of operations and cash flows could be materially adversely affected. In that case, the trading price of our common stock could decline.
You should refer to the explanation of the qualifications and limitations on forward-looking statements under “Special Caution Concerning Forward-Looking Statements.” All forward-looking statements made by us are qualified by the risk factors described below.
11
Risks Related to Reimbursement
Federal and state changes to reimbursement and other aspects of Medicare and Medicaid could have a material adverse effect on our business and consolidated financial condition, results of operations and cash flows.
Our net service revenue is primarily derived from Medicare, which accounted for 75%, 78% and 80% of our revenue during 2017, 2016 and 2015, respectively. Payments received from Medicare are subject to changes made through federal legislation. When such changes are implemented, we must also modify our internal billing processes and procedures accordingly, which can require significant time and expense. These changes, as further detailed in Part I, Item 1, “Business: Payment for Our Services,” can include changes to base episode payments and adjustments for home health services, changes to cap limits and per diem rates for hospice services and changes to Medicare eligibility and documentation requirements or changes designed to restrict utilization. Any such changes, including retroactive adjustments, adopted in the future by the Center for Medicare and Medicaid Services (“CMS”) could have a material adverse effect on our business and consolidated financial condition, results of operations and cash flows.
In April of 2015, Congress passed and President Obama signed the so-called “doc fix” in the form of the Medicare Access and CHIP Reauthorization Act of 2015 (“MACRA”). This law replaces a long-standing physician reimbursement formula with statutorily prescribed physician payment updates and provisions. MACRA provides for an increase of 3% of the payment amount otherwise made for home health services furnished in rural areas, and sets Medicare reimbursements for post-acute care providers to increase by 1.0% in fiscal year 2018.
On August 1, 2017, CMS published annual changes in Medicare hospice payment rates. As finalized, CMS estimates hospices will see a 1.0% increase in Medicare payments for fiscal year 2018, consistent with the required market basket set in fiscal year 2018 by MACRA. Absent the statutory cap on payment increases included in MACRA, CMS notes that the rate increase would have been a 2.2% net increase. CMS also increased the aggregate cap amount by 1.0% to $28,689.04. As of December 31, 2017, we expect the impact of the 2018 final rule on us to be in line with that of the hospice industry.
On November 1, 2017, CMS issued a final rule to update and revise Medicare home health reimbursement rates for calendar year 2018. CMS estimates that the net impact of the payment provisions of the final rule will result in a decrease of 0.4% in reimbursement to home health providers. This decrease is the result of a 1.0% home health payment update, a 0.9% adjustment to the national, standardized 60-day episode payment rate to account for nominal case-mix growth and the sunset of the rural add-on provision.
On February 9, 2018, Congress passed the Bipartisan Budget Act of 2018 ("BBA of 2018"), which funded government operations, set two-year government spending limits and enacted a variety of healthcare related policies. Specific to home health, the BBA of 2018 provides for a targeted extension of the home health rural add-on payment, a reduction of the 2020 market basket update, modification of eligibility documentation requirements and reform to the Home Health Prospective Payment System ("HHPPS"). As of February 9, 2018, we estimate the impact of the 2017 final rule and the BBA of 2018 on us to be a decrease in reimbursement of approximately 0.7%.
On February 2, 2016, CMS published a final rule adding new requirements for Medicaid home health services. Among other things, the final rule requires that for the initial ordering of home health services, the physician must document that a face-to-face encounter that is related to the primary reason the beneficiary requires home health services occurred no more than 90 days before or 30 days after the start of services. The final rule requires that for the initial ordering of certain medical equipment, the physician or authorized non-physician practitioner must document that a face-to-face encounter that is related to the primary reason the beneficiary requires medical equipment occurred no more than six months prior to the start of services. Although the final rule’s stated effective date is July 1, 2016, CMS created an exception for state legislation by giving state agencies that require state legislation to until July 1, 2017 or July 1, 2018 to publish requirements imposed by the rule.
There are continuing efforts to reform governmental health care programs that could result in major changes in the health care delivery and reimbursement system on a national and state level, including changes directly impacting the reimbursement systems for our home health and hospice care centers, including but not limited to, the sunset of the rural add-on and other extenders. Though we cannot predict what, if any, reform proposals will be adopted, health care reform and legislation may have a material adverse effect on our business and our financial condition, results of operations and cash flows through decreasing payments made for our services.
We could be affected adversely by the continuing efforts of governmental payors to contain health care costs. We cannot assure you that reimbursement payments under governmental payor programs, including Medicare supplemental insurance policies, will remain at levels comparable to present levels or will be sufficient to cover the costs allocable to patients eligible for reimbursement pursuant to these programs. Any such changes could have a material adverse effect on our business and consolidated financial condition, results of operations and cash flows.
12
Quality reporting requirements may negatively impact Medicare reimbursement.
Hospice quality reporting was mandated by PPACA, which directs the Secretary to establish quality reporting requirements for hospice programs. For fiscal year 2014, and each subsequent year, failure to submit required quality data will result in a 2 percentage point reduction to the market basket percentage increase for that fiscal year. This quality reporting program is currently “pay-for-reporting,” meaning it is the act of submitting data that determines compliance with program requirements.
Similarly, in the Calendar Year 2015 Home Health Final Rule, CMS proposed to establish a new “Pay-for-Reporting Performance Requirement” with which provider compliance with quality reporting program requirements can be measured. Home health agencies that do not submit quality measure data to CMS are subject to a 2.0% reduction in their annual home health payment update percentage. Home health agencies are required to report prescribed quality assessment data for a minimum of 70.0% of all patients with episodes of care that occur on or after July 1, 2015. This compliance threshold increases by 10.0% in each of two subsequent periods--i.e., for episodes beginning on or after July 1, 2016 and before June 30, 2017, home health agencies must score at least 80%, and for episodes beginning on or after July 1, 2017 and thereafter, the required performance level is at least 90%.
The Improving Medicare Post-Acute Care Transformation Act of 2014 (the “IMPACT Act”) requires the submission of standardized data by home health agencies and other providers. Specifically, the IMPACT Act requires, among other significant activities, the reporting of standardized patient assessment data with regard to quality measures, resource use, and other measures. Failure to report data as required will subject providers to a 2% reduction in market basket prices then in effect. Additionally, reporting activities associated with the IMPACT Act are anticipated to be quite burdensome.
There can be no assurance that all of our agencies will continue to meet quality reporting requirements in the future which may result in one or more of our agencies seeing a reduction in its Medicare reimbursements. Regardless, we, like other healthcare providers, are likely to incur additional expenses in an effort to comply with additional and changing quality reporting requirements.
Any economic downturn, deepening of an economic downturn, continued deficit spending by the Federal Government or state budget pressures may result in a reduction in payments and covered services.
Adverse developments in the United States could lead to a reduction in Federal Government expenditures, including governmentally funded programs in which we participate, such as Medicare and Medicaid. In addition, if at any time the Federal Government is not able to meet its debt payments unless the federal debt ceiling is raised, and legislation increasing the debt ceiling is not enacted, the Federal Government may stop or delay making payments on its obligations, including funding for government programs in which we participate, such as Medicare and Medicaid. Failure of the government to make payments under these programs could have a material adverse effect on our business and consolidated financial condition, results of operations and cash flows. Further, any failure by the United States Congress to complete the federal budget process and fund government operations may result in a Federal Government shutdown, potentially causing us to incur substantial costs without reimbursement under the Medicare program, which could have a material adverse effect on our business and consolidated financial condition, results of operations and cash flows. As an example, the failure of the 2011 Joint Select Committee to meet its Deficit Reduction goal resulted in an automatic reduction in Medicare home and hospice payments of 2% beginning April 1, 2013.
Historically, state budget pressures have resulted in reductions in state spending. Given that Medicaid outlays are a significant component of state budgets, we can expect continuing cost containment pressures on Medicaid outlays for our services.
In addition, sustained unfavorable economic conditions may affect the number of patients enrolled in managed care programs and the profitability of managed care companies, which could result in reduced payment rates and could have a material adverse effect on our business and consolidated financial condition, results of operations and cash flows.
Future cost containment initiatives undertaken by private third party payors may limit our future revenue and profitability.
Our non-Medicare revenue and profitability are affected by continuing efforts of third party payors to maintain or reduce costs of health care by lowering payment rates, narrowing the scope of covered services, increasing case management review of services and negotiating pricing. There can be no assurance that third party payors will make timely payments for our services, and there is no assurance that we will continue to maintain our current payor or revenue mix. We are continuing our efforts to develop our non-Medicare sources of revenue and any changes in payment levels from current or future third party payors could have a material adverse effect on our business and consolidated financial condition, results of operations and cash flows.
13
Risks Related to Laws and Government Regulations
We are operating under a Corporate Integrity Agreement. Violations of this agreement could result in substantial penalties or exclusion from participation in the Medicare program.
On April 23, 2014, with no admissions of liability on our part, we entered into a settlement agreement with the U.S. Department of Justice relating to certain of our clinical and business operations. Concurrently with our entry into this agreement, we entered into a Corporate Integrity Agreement (“CIA”) with the Office of Inspector General-HHS (“OIG”). The CIA, which has a term of five years, formalizes various aspects of our already existing ethics and compliance programs and contains other requirements designed to help ensure our ongoing compliance with federal health care program requirements. Among other things, the CIA requires us to maintain our existing compliance program, executive compliance committee and compliance committee of the Board of Directors; provide certain compliance training; continue screening new and current employees to ensure they are eligible to participate in federal health care programs; engage an independent review organization (“IRO”) to perform certain auditing and reviews and prepare certain reports regarding our compliance with federal health care programs, our billing submissions to federal health care programs and our compliance and risk mitigation programs; and provide certain reports and management certifications to the OIG. Additionally, the CIA specifically requires that we report substantial overpayments that we discover we have received from the federal health care programs, as well as probable violations of federal health care laws. Upon breach of the CIA, we could become liable for payment of certain stipulated penalties, or could be excluded from participation in federal health care programs. Although we believe that we are currently in compliance with the CIA, any violations of the agreement could have a material adverse effect on our business and consolidated financial condition, results of operations and cash flows.
We are subject to extensive government regulation. Any changes to the laws and regulations governing our business, or to the interpretation and enforcement of those laws or regulations, could have a material adverse effect on our business and consolidated financial condition, results of operations and cash flows.
Our industry is subject to extensive federal and state laws and regulations. See Part I, Item 1, “Our Regulatory Environment” for additional information on such laws and regulations. Federal and state laws and regulations impact how we conduct our business, the services we offer and our interactions with patients, our employees and the public and impose certain requirements on us such as:
• | licensure and certification; |
• | adequacy and quality of health care services; |
• | qualifications of health care and support personnel; |
• | quality and safety of medical equipment; |
• | confidentiality, maintenance and security issues associated with medical records and claims processing; |
• | relationships with physicians and other referral sources; |
• | operating policies and procedures; |
• | emergency preparedness risk assessments and policies and procedures; |
• | policies and procedures regarding employee relations; |
• | addition of facilities and services; |
• | billing for services; |
• | requirements for utilization of services; |
• | documentation required for billing and patient care; and |
• | reporting and maintaining records regarding adverse events. |
These laws and regulations, and their interpretations, are subject to change. Changes in existing laws and regulations, or their interpretations, or the enactment of new laws or regulations could have a material adverse effect on our business and consolidated financial condition, results of operations and cash flows by:
• | increasing our administrative and other costs; |
• | increasing or decreasing mandated services; |
• | causing us to abandon business opportunities we might have otherwise pursued; |
14
• | decreasing utilization of services; |
• | forcing us to restructure our relationships with referral sources and providers; or |
• | requiring us to implement additional or different programs and systems. |
Additionally, we are subject to various routine and non-routine reviews, audits and investigations by the Medicare and Medicaid programs and other federal and state governmental agencies, which have various rights and remedies against us if they establish that we have overcharged the programs or failed to comply with program requirements. Violation of the laws governing our operations, or changes in interpretations of those laws, could result in the imposition of fines, civil or criminal penalties, and the termination of our rights to participate in federal and state-sponsored programs and/or the suspension or revocation of our licenses. If we become subject to material fines, or if other sanctions or other corrective actions are imposed on us, our business and consolidated financial condition, results of operations and cash flows could be materially adversely affected.
We face periodic and routine reviews, audits and investigations under our contracts with federal and state government agencies and private payors, and these audits could have adverse findings that may negatively impact our business.
As a result of our participation in the Medicare and Medicaid programs, we are subject to various governmental reviews, audits and investigations to verify our compliance with these programs and applicable laws and regulations. We also are subject to audits under various government programs, including the RAC, ZPIC, PSC and MIC programs as well as in accordance with the requirements of our CIA, in which third party firms engaged by CMS or by the Company conduct extensive reviews of claims data and medical and other records to identify potential improper payments under the Medicare program. Private pay sources also reserve the right to conduct audits. If billing errors are identified in the sample of reviewed claims, the billing error can be extrapolated to all claims filed which could result in a larger overpayment than originally identified in the sample of reviewed claims. Our costs to respond to and defend reviews, audits and investigations may be significant and could have a material adverse effect on our business and consolidated financial condition, results of operations and cash flows. Moreover, an adverse review, audit or investigation could result in:
• | required refunding or retroactive adjustment of amounts we have been paid pursuant to the federal or state programs or from private payors; |
• | state or federal agencies imposing fines, penalties and other sanctions on us; |
• | loss of our right to participate in the Medicare program, state programs, or one or more private payor networks; or |
• | damage to our business and reputation in various markets. |
These results could have a material adverse effect on our business and consolidated financial condition, results of operations and cash flows.
If a care center fails to comply with the conditions of participation in the Medicare program, that care center could be subjected to sanctions or terminated from the Medicare program.
Each of our care centers must comply with required conditions of participation in the Medicare program. If we fail to meet the conditions of participation at a care center, we may receive a notice of deficiency from the applicable state surveyor. If that care center then fails to institute an acceptable plan of correction to remediate the deficiency within the correction period provided by the state surveyor, that care center could be terminated from the Medicare program or subjected to alternative sanctions. CMS outlined its alternative sanction enforcement options for home health care centers through a regulation published in 2012; under the regulation, CMS may impose temporary management, direct a plan of correction, direct training or impose payment suspensions and civil monetary penalties, in each case, upon providers who fail to comply with the conditions of participation. Termination of one or more of our care centers from the Medicare program for failure to satisfy the program’s conditions of participation, or the imposition of alternative sanctions, could disrupt operations, require significant attention by management, or have a material adverse effect on our business and reputation and consolidated financial condition, results of operations and cash flows.
We are subject to federal and state laws that govern our financial relationships with physicians and other health care providers, including potential or current referral sources.
We are required to comply with federal and state laws, generally referred to as “anti-kickback laws,” that prohibit certain direct and indirect payments or other financial arrangements between health care providers that are designed to encourage the referral of patients to a particular provider for medical services. In addition to these anti-kickback laws, the Federal Government has enacted specific legislation, commonly known as the “Stark Law,” that prohibits certain financial relationships, specifically including ownership interests and compensation arrangements, between physicians (and the immediate family members of
15
physicians) and providers of designated health services, such as home health care centers, to whom the physicians refer patients. Some of these same financial relationships are also subject to additional regulation by states. Although we believe we have structured our relationships with physicians and other potential referral sources to comply with these laws where applicable, we cannot assure you that courts or regulatory agencies will not interpret state and federal anti-kickback laws and/or the Stark Law and similar state laws regulating relationships between health care providers and physicians in ways that will adversely implicate our practices or that isolated instances of noncompliance will not occur. Violations of federal or state Stark or anti-kickback laws could lead to criminal or civil fines or other sanctions, including denials of government program reimbursement or even exclusion from participation in governmental health care programs, which could have a material adverse effect on our business and consolidated financial condition, results of operations and cash flows.
We may face significant uncertainty in the industry due to government health care reform.
The health care industry in the United States is subject to fundamental changes due to ongoing health care reform efforts and related political, economic and regulatory influences. In March 2010, comprehensive health care reform legislation was signed into law in the United States through the passage of the Patient Protection and Affordable Health Care Act and the Health Care and Education Reconciliation Act (collectively, “PPACA”). However, it is difficult to predict the full impact of PPACA due to the law’s complexity and phased-in effective dates, as well as our inability to foresee how CMS and other participants in the health care industry will respond to the choices available to them under the law.
PPACA makes a number of changes to Medicare payment rates and also calls for a rebasing of the home health payment system that began in 2014 and continued through 2017. These reimbursement changes are described in detail in Part II, Item 7, “Management’s Discussion and Analysis of Financial Condition and Results of Operations: Overview – Economic and Industry Factors.”
Regulations implementing the provisions of the PPACA and related initiatives may similarly increase our costs, decrease our revenues, expose us to expanded liability or require us to revise the ways in which we conduct our business.
PPACA also calls for a number of other changes to be made over time that will likely have a significant impact upon the health care delivery system. For example, PPACA mandates creation of a home health value-based purchasing program, the development of quality measures, and decreases in home health reimbursement rates, including rebasing, as further described in Part II, Item 7, “Management’s Discussion and Analysis of Financial Condition and Results of Operations: Overview – Economic and Industry Factors.”
In addition, various health care reform proposals similar to the federal reforms described above have also emerged at the state level, including in several states in which we operate. We cannot predict with certainty what health care initiatives, if any, will be implemented at the state level, or what the ultimate effect of federal health care reform or any future legislation or regulation may have on us or on our business and consolidated financial condition, results of operations and cash flows.
In addition to impacting our Medicare businesses, PPACA may also significantly affect our non-Medicare businesses. PPACA makes many changes to the underwriting and marketing practices of private payors. The resulting economic pressures could prompt these payors to seek to lower their rates of reimbursement for the services we provide. At this time, it is not possible to estimate what impact PPACA may have on our non-Medicare businesses.
Finally, efforts to repeal or substantially modify provisions of the PPACA continue in Congress. The ultimate outcomes of legislative efforts to repeal, substantially amend, eliminate or reduce funding for the PPACA is unknown. While these attempts have not been successful to date, the results of the Presidential and Congressional elections in 2016 could have a significant impact on future efforts to amend or repeal PPACA. In addition to the prospect for legislative repeal or revision, the President and members of his administration hostile to the PPACA could seek to impose substantial changes upon the PPACA through administrative action, including revised regulation and other Executive Branch action. The effect of any major modification or repeal of the PPACA on our business, operations, or financial condition cannot be predicted, but could be materially adverse.
Risks Related to our Growth Strategies
Our growth strategy depends on our ability to acquire additional care centers and integrate and operate these care centers effectively. If our growth strategy is unsuccessful or we are not able to successfully integrate newly acquired care centers into our existing operations, our business and consolidated financial condition, results of operations and cash flows could be materially adversely affected.
16
We may not be able to fully integrate the operations of our acquired businesses with our current business structure in an efficient and cost-effective manner. Acquisitions involve significant risks and uncertainties, including difficulties in recouping partial episode payments and other types of misdirected payments for services from the previous owners; difficulties integrating acquired personnel and business practices into our business; the potential loss of key employees, referral sources or patients of acquired care centers; the delay in payments associated with change in ownership, control and the internal process of the Medicare fiscal intermediary; and the assumption of liabilities and exposure to unforeseen liabilities of acquired care centers. Further, the financial benefits we expect to realize from many of our acquisitions are largely dependent upon our ability to improve clinical performance, overcome regulatory deficiencies, improve the reputation of the acquired business in the community and control costs. The failure to accomplish any of these objectives or to effectively integrate any of these businesses could have a material adverse effect on our business and consolidated financial condition, results of operations and cash flows.
State efforts to regulate the establishment or expansion of health care providers could impair our ability to expand our operations.
Some states require health care providers (including skilled nursing facilities, hospice care centers, home health care centers and assisted living facilities) to obtain prior approval, known as a CON or POA, in order to commence operations. See Part I, Item 1, “Our Regulatory Environment” for additional information on CONs and POAs. If we are not able to obtain such approvals, our ability to expand our operations could be impaired, which could have a material adverse effect on our business and consolidated financial condition, results of operations and cash flows.
Federal regulation may impair our ability to consummate acquisitions or open new care centers.
Changes in federal laws or regulations may materially adversely impact our ability to acquire care centers or open new start-up care centers. For example, PPACA authorized CMS to impose temporary moratoria on the enrollment of new Medicare providers, if deemed necessary to combat fraud, waste or abuse under government programs. The moratoria on new enrollments may be applied to categories of providers or to specific geographic regions. In 2012, the OIG released a report that concluded Medicare had overpaid home health agencies due to inappropriate and questionable billing practices. Citing this report, in 2014, CMS adopted a temporary moratorium on new home health agencies and home health agency branches in certain regions of Texas, Michigan, Florida and Illinois. On July 29, 2016, CMS announced it was extending such moratorium for an additional six months, and that the moratorium would be expanded statewide in each targeted state. On January 28, 2018, CMS announced that it was extending the enrollment moratoria for an additional six months. If a moratorium is imposed on the enrollment of new home health or hospice providers in a geographic area we desire to service, it could have a material impact on our ability to open new care centers. Additionally, in 2010, CMS implemented and amended a regulation known as the “36 Month Rule” that is applicable to home health care center acquisitions. Subject to certain exceptions, the 36 Month Rule prohibits buyers of certain home health care centers – those that either enrolled in Medicare or underwent a change in majority ownership fewer than 36 months prior to the acquisition – from assuming the Medicare billing privileges of the acquired care center. These changes in federal laws and regulations, and similar future changes, may further increase competition for acquisition targets and could have a material detrimental impact on our acquisition strategy.
We could face a variety of risks by expanding into our personal care line of business.
We established a personal care segment of our business with the acquisition of Associated Home Care, which closed on March 1, 2016. In 2017, we expanded our personal care line of business with the acquisition of the assets of Home Staff L.L.C. and Intercity Home Care. Risks of our entry into the new personal care segment include, without limitation: (i) potential diversion of management’s time and other resources from our existing home health and hospice businesses; (ii) unanticipated liabilities or contingencies; (iii) the need for additional capital and other resources to expand into this new line of business; and (iv) inefficient integration of operational and management systems and controls. Entry into a new line of business may also subject us to new laws and regulations with which we are not familiar, and may lead to increased litigation and regulatory risk. If we are unable to successfully implement our growth strategies, our revenue and profitability may not grow as we expect, our competitiveness may be materially and adversely affected, and our reputation and business may be harmed.
Risks Related to our Operations
Because we are limited in our ability to control rates received for our services, our business and consolidated financial condition, results of operations and cash flows could be materially adversely affected if we are not able to maintain or reduce our costs to provide such services.
As Medicare is our primary payor and rates are established through federal legislation, we have to manage our costs of providing care to achieve a desired level of profitability. Additionally, non-Medicare rates are difficult for us to negotiate as such payors are under pressure to reduce their own costs. As a result, we manage our costs in order to achieve a desired level of profitability
17
including, but not limited to, centralization of various processes, the use of technology and management of the number of employees utilized. If we are not able to continue to streamline our processes and reduce our costs, our business and consolidated financial condition, results of operations and cash flows could be materially adversely affected.
Our industry is highly competitive, with few barriers to entry in certain states.
There are few barriers to entry in home health markets that do not require a CON or POA. Our primary competition comes from local privately-owned and hospital-owned health care providers. We compete based on the availability of personnel; the quality of services, expertise of visiting staff; and in certain instances, on the price of our services. Increased competition in the future may limit our ability to maintain or increase our market share.
Further, the introduction of new and enhanced service offerings by others, in combination with industry consolidation and the development of strategic relationships by our competitors (including mergers of competitors with each other and with insurers), could cause a decline in revenue or loss of market acceptance of our services or make our services less attractive. Additionally, we compete with a number of non-profit organizations that can finance acquisitions and capital expenditures on a tax-exempt basis or receive charitable contributions that are unavailable to us.
Managed care organizations and other third party payors continue to consolidate, which enhances their ability to influence the delivery of health care services. Consequently, the health care needs of patients in the United States are increasingly served by a smaller number of managed care organizations. These organizations generally enter into service agreements with a limited number of providers. Our business and consolidated financial condition, results of operations and cash flows could be materially adversely affected if these organizations terminate us as a provider and/or engage our competitors as a preferred or exclusive provider. In addition, should private payors, including managed care payors, seek to negotiate additional discounted fee structures or the assumption by health care providers of all or a portion of the financial risk through prepaid capitation arrangements, our business and consolidated financial condition, results of operations and cash flows could be materially adversely affected.
If we are unable to react competitively to new developments, our operating results may suffer. State CON or POA laws often limit the ability of competitors to enter into a given market, are not uniform throughout the United States and are frequently the subject of efforts to limit or repeal such laws. If states remove existing CONs or POAs, we could face increased competition in these states. For example, New Hampshire repealed its CON laws in 2015, and legislation was recently introduced in South Carolina that would have limited the application of its CON program. There can be no assurances that other states will not seek to eliminate or limit their existing CON or POA programs, which could lead to increased competition in these states. Further, we cannot assure you that we will be able to compete successfully against current or future competitors, which could have a material adverse effect on our business and consolidated financial condition, results of operations and cash flows.
If we are unable to maintain relationships with existing patient referral sources, our business and consolidated financial condition, results of operations and cash flows could be materially adversely affected.
Our success depends on referrals from physicians, hospitals and other sources in the communities we serve and on our ability to maintain good relationships with existing referral sources. Our referral sources are not contractually obligated to refer patients to us and may refer their patients to other providers. Our growth and profitability depends, in part, on our ability to establish and maintain close working relationships with these patient referral sources and to increase awareness and acceptance of the benefits of home health and hospice care by our referral sources and their patients. Our loss of, or failure to maintain, existing relationships or our failure to develop new referral relationships could have a material adverse effect on our business and consolidated financial condition, results of operations and cash flows.
If we are unable to provide consistently high quality of care, our business will be adversely impacted.
Providing quality patient care is the cornerstone of our business. We believe that hospitals, physicians and other referral sources refer patients to us in large part because of our reputation for delivering quality care. Clinical quality is becoming increasingly important within our industry. Effective October 2012, Medicare began to impose a financial penalty upon hospitals that have excessive rates of patient readmissions within 30 days from hospital discharge. We believe this new regulation provides a competitive advantage to home health providers who can differentiate themselves based upon quality, particularly by achieving low patient acute care hospitalization readmission rates and by implementing disease management programs designed to be responsive to the needs of patients served by referring hospitals. We are focused intently upon improving our patient outcomes, particularly our patient acute care hospitalization readmission rates. If we should fail to attain our goals regarding acute care hospitalization readmission rates and other quality metrics, we expect our ability to generate referrals would be adversely impacted, which could have a material adverse effect upon our business and consolidated financial condition, results of operations and cash flows.
18
Additionally, Medicare has established consumer-facing websites, Home Health Compare and Hospice Compare, that present data regarding our performance on certain quality measures compared to state and national averages. If we should fail to achieve or exceed these averages, it may affect our ability to generate referrals, which could have a material adverse effect upon our business and consolidated financial condition, results of operations and cash flows.
Our business depends on our information systems. Our inability to effectively integrate, manage and keep our information systems secure and operational could disrupt our operations.
Our business depends on effective, secure and operational information systems which include systems provided by external contractors and other service providers. Problems with, or the failure of, our technology and systems or any system upgrades or programming changes associated with such technology and systems, including any problems we may experience with the implementation of the new clinical software system, could have a material adverse effect on data capture, medical documentation, billing, collections, assessment of internal controls and management and reporting capabilities. Any such problems or failures and the costs incurred in correcting any such problems or failures, could have a material adverse effect on our business and consolidated financial condition, results of operations and cash flows. Further, to the extent our external information technology contractors or other service providers become insolvent or fail to support the software or systems we have licensed from them, our operations could be materially adversely affected.
Our care centers also depend upon our information systems for accounting, billing, collections, risk management, quality assurance, human resources, payroll and other information. If we experience a reduction in the performance, reliability, or availability of our information systems, our operations and ability to produce timely and accurate reports could be materially adversely affected.
Our information systems and applications require continual maintenance, upgrading and enhancement to meet our operational needs. Our acquisition activity requires transitions and integration of various information systems. We regularly upgrade and expand our information systems’ capabilities. If we experience difficulties with the transition and integration of information systems or are unable to implement, maintain, or expand our systems properly, we could suffer from, among other things, operational disruptions, regulatory problems and increases in administrative expenses.
We may be required to expend significant capital and other resources to protect against the threat of security breaches or to alleviate problems caused by breaches, including unauthorized access to patient data and personally identifiable information stored in our information systems, and the introduction of computer viruses or other malicious software programs to our systems. Our security measures may be inadequate to prevent security breaches and our business operations could be materially adversely affected by federal and state fines and penalties, legal claims or proceedings, cancellation of contracts and loss of patients if security breaches are not prevented.
We have installed privacy protection systems and devices on our network and POC tablets in an attempt to prevent unauthorized access to information in our database. However, our technology may fail to adequately secure the confidential health information and personally identifiable information we maintain in our databases. In such circumstances, we may be held liable to our patients and regulators, which could result in fines, litigation or adverse publicity that could have a material adverse effect on our business and consolidated financial condition, results of operations and cash flows. Even if we are not held liable, any resulting negative publicity could harm our business and distract the attention of management.
Further, our information systems are vulnerable to damage or interruption from fire, flood, power loss, telecommunications failure, break-ins and similar events. A failure to restore our information systems after the occurrence of any of these events could have a material adverse effect on our business and consolidated financial condition, results of operations and cash flows. Because of the confidential health information we store and transmit, loss of electronically stored information for any reason could expose us to a risk of regulatory action and litigation and possible liability and loss.
We believe we have all the necessary licenses from third parties to use technology and software that we do not own. A third party could, however, allege that we are infringing its rights, which may deter our ability to obtain licenses on commercially reasonable terms from the third party, if at all, or cause the third party to commence litigation against us. In addition, we may find it necessary to initiate litigation to protect our trade secrets, to enforce our intellectual property rights and to determine the scope and validity of any proprietary rights of others. Any such litigation, or the failure to obtain any necessary licenses or other rights, could materially and adversely affect our business.
19
Possible changes in the case mix of patients, as well as payor mix and payment methodologies, could have a material adverse effect on our business and consolidated financial condition, results of operations and cash flows.
Our revenue is determined by a number of factors, including our mix of patients and the rates of payment among payors. Changes in the case mix of our patients, payment methodologies or the payor mix among Medicare, Medicaid and private payors could have a material adverse effect on our business and consolidated financial condition, results of operations and cash flows.
Our failure to negotiate favorable managed care contracts, or our loss of existing favorable managed care contracts, could have a material adverse effect on our business and consolidated financial condition, results of operations and cash flows.
One of our strategies is to diversify our payor sources by increasing the business we do with managed care companies, and we strive to put in place favorable contracts with managed care payors. However, we may not be successful in these efforts. Additionally, there is a risk that the favorable managed care contracts that we put in place may be terminated, and managed care contracts typically permit the payor to terminate the contract without cause, on very short notice, typically 60 days, which can provide payors leverage to reduce volume or obtain favorable pricing. Our failure to negotiate and put in place favorable managed care contracts, or our failure to maintain in place favorable managed care contracts, could have a material adverse effect on our business and consolidated financial condition, results of operations and cash flows.
A write off of a significant amount of intangible assets or long-lived assets could have a material adverse effect on our consolidated financial condition and results of operations.
A significant and sustained decline in our stock price and market capitalization, a significant decline in our expected future cash flows, a significant adverse change in the business climate, or slower growth rates could result in the need to perform an impairment analysis under Accounting Standard Codification (“ASC”) Topic 350 “Intangibles – Goodwill and Other” in future periods in addition to our annual impairment test. If we were to conclude that a write down of goodwill is necessary, then we would record the appropriate charge, which could result in material charges that are adverse to our consolidated financial condition and results of operations. See Part II, Item 8, Note 4 – Goodwill and Other Intangible Assets, Net to our consolidated financial statements for additional information.
Because we have grown in part through acquisitions, goodwill and other acquired intangible assets represent a substantial portion of our assets. Goodwill was approximately $319.9 million as of December 31, 2017 and if we make additional acquisitions, it is likely that we will record additional intangible assets in our consolidated financial statements. We also have long-lived assets consisting of property and equipment and other identifiable intangible assets of $77.2 million as of December 31, 2017, which we review both on a periodic basis for indefinite lived intangible assets as well as when events or circumstances indicate that the carrying amount of an asset may not be recoverable. If a determination that a significant impairment in value of our unamortized intangible assets or long-lived assets occurs, such determination could require us to write off a substantial portion of our assets. A write off of these assets could have a material adverse effect on our consolidated financial condition and results of operations.
A shortage of qualified registered nursing staff and other clinicians, such as therapists and nurse practitioners, could materially impact our ability to attract, train and retain qualified personnel and could increase operating costs.
We compete for qualified personnel with other healthcare providers. Our ability to attract and retain clinicians depends on several factors, including our ability to provide these personnel with attractive assignments and competitive salaries and benefits. We cannot be assured we will succeed in any of these areas. In addition, there are shortages of qualified health care personnel in some of our markets. As a result, we may face higher costs of attracting clinicians and providing them with attractive benefit packages than we originally anticipated which could have a material adverse effect on our business and consolidated financial condition, results of operations and cash flows. In addition, if we expand our operations into geographic areas where health care providers historically have been unionized, or if any of our care center employees become unionized, being subject to a collective bargaining agreement may have a negative impact on our ability to timely and successfully recruit qualified personnel and may increase our operating costs. Generally, if we are unable to attract and retain clinicians, the quality of our services may decline and we could lose patients and referral sources, which could have a material adverse effect on our business and consolidated financial condition, results of operations and cash flows.
Our insurance liability coverage may not be sufficient for our business needs.
As a result of operating in the home health industry, our business entails an inherent risk of claims, losses and potential lawsuits alleging incidents involving our employees that are likely to occur in a patient’s home. We maintain professional liability insurance to provide coverage to us and our subsidiaries against these risks. However, we cannot assure you claims will not be made in the future in excess of the limits of our insurance, nor can we assure you that any such claims, if successful and in excess of such
20
limits, will not have a material adverse effect on our business and consolidated financial condition, results of operations and cash flows. Our insurance coverage also includes fire, property damage and general liability with varying limits. We cannot assure you that the insurance we maintain will satisfy claims made against us or that insurance coverage will continue to be available to us at commercially reasonable rates, in adequate amounts or on satisfactory terms. Any claims made against us, regardless of their merit or eventual outcome, could damage our reputation and business.
We may be subject to substantial malpractice or other similar claims.
The services we offer involve an inherent risk of professional liability and related substantial damage awards. As of February 23, 2018, we had approximately 17,900 employees (10,900 home health, 3,200 hospice, 3,100 personal care and 700 corporate employees). In addition, we employ direct care workers on a contractual basis to support our existing workforce. Due to the nature of our business, we, through our employees and caregivers who provide services on our behalf, may be the subject of medical malpractice claims. A court could find these individuals should be considered our agents, and, as a result, we could be held liable for their acts or omissions. We cannot predict the effect that any claims of this nature, regardless of their ultimate outcome, could have on our business or reputation or on our ability to attract and retain patients and employees. While we maintain malpractice liability coverage that we believe is appropriate given the nature and breadth of our operations, any claims against us in excess of insurance limits, or multiple claims requiring us to pay deductibles, could have a material adverse effect on our business and consolidated financial condition, results of operations and cash flows.
If we are unable to maintain our corporate reputation, our business may suffer.
Our success depends on our ability to maintain our corporate reputation, including our reputation for providing quality patient care and for compliance with Medicare requirements and the other laws to which we are subject. Adverse publicity surrounding any aspect of our business, including the death or disability of any of our patients due to our failure to provide proper care, or due to any failure on our part to comply with Medicare requirements or other laws to which we are subject, could negatively affect our Company’s overall reputation and the willingness of referral sources to refer patients to us.
We depend on the services of our executive officers and other key employees.
We depend greatly on the efforts of our executive officers and other key employees to manage our operations. The loss or departure of any one of these executives or other key employees could have a material adverse effect on our business and consolidated financial condition, results of operations and cash flows.
Our operations could be impacted by natural disasters.
The occurrence of natural disasters in the markets in which we operate could not only impact the day-to-day operations of our care centers, but could also disrupt our relationships with patients, employees and referral sources located in the affected areas and, in the case of our corporate office, our ability to provide administrative support services, including billing and collection services. In addition, any episode of care that is not completed due to the impact of a natural disaster will generally result in lower revenue for the episode. For example, our corporate office and a number of our care centers are located in the southeastern United States and the Gulf Coast Region, increasing our exposure to hurricanes and flooding. Future hurricanes or other natural disasters may have a material adverse effect on our business and consolidated financial condition, results of operations and cash flows.
Risks Related to Liquidity
Delays in payment may cause liquidity problems.
Our business is characterized by delays from the time we provide services to the time we receive payment for these services. If we have difficulty in obtaining documentation, such as physician orders, experience information system problems or experience other issues that arise with Medicare or other payors, we may encounter additional delays in our payment cycle.
In addition, timing delays in billings and collections may cause working capital shortages. Working capital management, including prompt and diligent billing and collection, is an important factor in achieving our financial results and maintaining liquidity. It is possible that documentation support, system problems, Medicare or other provider issues or industry trends may extend our collection period, which may materially adversely affect our working capital, and our working capital management procedures may not successfully mitigate this risk.
In August 2016, CMS began implementing a three year Medicare pre-claim review demonstration for home health services provided to beneficiaries in the state of Illinois. The demonstration was to expand to the states of Florida, Michigan, Massachusetts, and Texas; however, CMS suspended the program indefinitely but can restart the demonstration in the announced states after providing
21
30 days' notice. If the program were to restart, this process could result in increased administrative costs or delays in reimbursement for home health services in states subject to the demonstration.
Additionally, our hospice operations may experience payment delays. We have experienced payment delays when attempting to collect funds from state Medicaid programs in certain instances. Delays in receiving payments from these programs may also materially adversely affect our working capital.
The volatility and disruption of the capital and credit markets and adverse changes in the United States and global economies could impact our ability to access both available and affordable financing, and without such financing, we may be unable to achieve our objectives for strategic acquisitions and internal growth.
While we intend to finance strategic acquisitions and internal growth with cash flows from operations and borrowings under our revolving credit facility, we may require sources of capital in addition to those presently available to us. Uncertainty in the capital and credit markets may impact our ability to access capital on terms acceptable to us (i.e. at attractive/affordable rates) or at all, and this may result in our inability to achieve present objectives for strategic acquisitions and internal growth. Further, in the event we need additional funds, and we are unable to raise the necessary funds on acceptable terms, our business and consolidated financial condition, results of operations and cash flows could be materially adversely affected.
Our indebtedness could impact our financial condition and impair our ability to fulfill other obligations.
As of December 31, 2017, we had total outstanding indebtedness of approximately $90.7 million, comprised mainly of indebtedness incurred in connection with our April 23, 2014 settlement agreement with the U.S. Department of Justice relating to certain of our clinical and business operations. Our level of indebtedness could have a material adverse effect on our business and consolidated financial position, results of operations and cash flows and impair our ability to fulfill other obligations in several ways, including:
• | it could require us to dedicate a portion of our cash flow from operations to payments on our indebtedness, which could reduce the availability of cash flow to fund acquisitions, start-ups, working capital, capital expenditures and other general corporate purposes; |
• | it could limit our ability to borrow money or sell stock for working capital, capital expenditures, debt service requirements and other purposes; |
• | it could limit our flexibility in planning for, and reacting to, changes in our industry or business; |
• | it could make us more vulnerable to unfavorable economic or business conditions; and |
• | it could limit our ability to make acquisitions or take advantage of other business opportunities. |
In the event we incur additional indebtedness, the risks described above could increase.
The agreements governing our indebtedness contain various covenants that limit our discretion in the operation of our business and our failure to satisfy requirements in these agreements could have a material adverse effect on our business and consolidated financial condition, results of operations and cash flows.
The agreements governing our indebtedness (the “Debt Agreements”) contain certain obligations, including restrictive covenants that require us to comply with or maintain certain financial covenants and ratios and restrict our ability to:
• | incur additional debt; |
• | redeem or repurchase stock, pay dividends or make other distributions; |
• | make certain investments; |
• | create liens; |
• | enter into transactions with affiliates; |
• | make acquisitions; |
• | enter into joint ventures; |
• | merge or consolidate; |
• | invest in foreign subsidiaries; |
• | amend acquisition documents; |
22
• | enter into certain swap agreements; |
• | make certain restricted payments; |
• | transfer, sell or leaseback assets; and |
• | make fundamental changes in our corporate existence and principal business. |
In addition, events beyond our control could affect our ability to comply with the Debt Agreements. Any failure by us to comply with or maintain all applicable financial covenants and ratios and to comply with all other applicable covenants could result in an event of default with respect to the Debt Agreements. If we are unable to obtain a waiver from our lenders in the event of any non-compliance, our lenders could accelerate the maturity of any outstanding indebtedness and terminate the commitments to make further extensions of credit (including our ability to borrow under our revolving credit facility). Any failure to comply with these covenants could have a material adverse effect on our business and consolidated financial condition, results of operations and cash flows.
Risks Related to Ownership of Our Common Stock
The price of our common stock may be volatile.
The price at which our common stock trades may be volatile. The stock market from time to time experiences significant price and volume fluctuations that impact the market prices of securities, particularly those of health care companies. The market price of our common stock may be influenced by many factors, including:
• | our operating and financial performance; |
• | variances in our quarterly financial results compared to research analyst expectations; |
• | the depth and liquidity of the market for our common stock; |
• | future purchases or sales of common stock by the Company or large stockholders or the perception that such purchases or sales could occur; |
• | investor, analyst and media perception of our business and our prospects; |
• | developments relating to litigation or governmental investigations; |
• | changes or proposed changes in health care laws or regulations or enforcement of these laws and regulations, or announcements relating to these matters; |
• | departure of key personnel; |
• | changes in the Medicare, Medicaid and private insurance payment rates for home health and hospice; |
• | announcements by us or our competitors of significant contracts, acquisitions, strategic partnerships, joint ventures or capital commitments; or |
• | general economic and stock market conditions. |
In addition, the stock market in general, and the NASDAQ Global Select Market (“NASDAQ”) in particular, has experienced price and volume fluctuations that we believe have often been unrelated or disproportionate to the operating performance of health care provider companies. These broad market and industry factors may materially reduce the market price of our common stock, regardless of our operating performance. Securities class-action cases have often been brought against companies following periods of volatility in the market price of their securities.
The activities of short sellers could reduce the price or prevent increases in the price of our common stock. “Short sale” is defined as the sale of stock by an investor that the investor does not own. Typically, investors who sell short believe the price of the stock will fall, and anticipate selling shares at a higher price than the purchase price at which they will buy the stock. As of December 31, 2017, investors held a short position of approximately 3.3 million shares of our common stock which represented 9.9% of our outstanding common stock. The anticipated downward pressure on our stock price due to actual or anticipated sales of our stock by some institutions or individuals who engage in short sales of our common stock could cause our stock price to decline.
23
Sales of substantial amounts of our common stock or the availability of those shares for future sale, could materially impact our stock price and limit our ability to raise capital.
The following table presents information about our outstanding common and preferred stock and our outstanding securities exercisable for or convertible into shares of common stock:
As of December 31, 2017 | ||
Common stock outstanding | 33,964,767 | |
Preferred stock outstanding | — | |
Common stock available under 2008 Omnibus Incentive Compensation Plan | 1,248,149 | |
Stock options outstanding | 909,730 | |
Stock options exercisable | 381,932 | |
Non-vested stock outstanding | 46,998 | |
Non-vested stock units outstanding | 487,790 | |
If we were to sell substantial amounts of our common stock in the public market or if there was a public perception that substantial sales could occur, the market price of our common stock could decline. These sales or the perception of substantial future sales may also make it difficult for us to sell common stock in the future to raise capital.
Our Board of Directors may use anti-takeover provisions or issue stock to discourage a change of control.
Our certificate of incorporation currently authorizes us to issue up to 60,000,000 shares of common stock and 5,000,000 shares of undesignated preferred stock. Our Board of Directors may cause us to issue additional stock to discourage an attempt to obtain control of our company. For example, shares of stock could be sold to purchasers who might support our Board of Directors in a control contest or to dilute the voting or other rights of a person seeking to obtain control. In addition, our Board of Directors could cause us to issue preferred stock entitling holders to vote separately on any proposed transaction, convert preferred stock into common stock, demand redemption at a specified price in connection with a change in control, or exercise other rights designed to impede a takeover.
The issuance of additional shares may, among other things, dilute the earnings and equity per share of our common stock and the voting rights of common stockholders.
We have implemented other anti-takeover provisions or provisions that could have an anti-takeover effect, including advance notice requirements for director nominations and stockholder proposals, no cumulative voting for directors, director vacancies are filled by remaining directors (including vacancies resulting from removal), and the number of directors is fixed by the Board of Directors, and the Board of Directors can increase or decrease the size of the Board of Directors without stockholder approval (within the range set forth in our Certificate of Incorporation and Bylaws). These provisions, and others that our Board of Directors may adopt hereafter, may discourage offers to acquire us and may permit our Board of Directors to choose not to entertain offers to purchase us, even if such offers include a substantial premium to the market price of our stock. Therefore, our stockholders may be deprived of opportunities to profit from a sale of control.
ITEM 1B. UNRESOLVED STAFF COMMENTS
None.
ITEM 2. PROPERTIES
Our executive office is located in Nashville, Tennessee in a leased property consisting of 15,825 square feet; our corporate headquarters is located in Baton Rouge, Louisiana in a leased property consisting of 75,243 square feet. We believe we have adequate space to accommodate our corporate staff located in these locations for the foreseeable future.
In addition to our executive office and corporate headquarters, we also lease facilities for our home health, hospice and personal-care care centers. Generally, these leases have an initial term of five years with a three year early termination option, but range from one to seven years. Most of these leases also contain an option to extend the lease period. The following table shows the location of our 323 Medicare-certified home health care centers, 83 Medicare-certified hospice care centers and 15 personal-care care centers at December 31, 2017:
24
State | Home Health | Hospice | Personal Care | State | Home Health | Hospice | Personal Care | |||||||||||||
Alabama | 30 | 7 | — | New Jersey | 2 | 1 | — | |||||||||||||
Arkansas | 5 | — | — | New York | 5 | — | — | |||||||||||||
Arizona | 3 | 1 | — | New Hampshire | 3 | 3 | — | |||||||||||||
California | 4 | — | — | North Carolina | 8 | 6 | — | |||||||||||||
Connecticut | 4 | 1 | — | Ohio | 1 | 2 | — | |||||||||||||
Delaware | 2 | — | — | Oklahoma | 6 | — | — | |||||||||||||
Florida | 20 | — | 1 | Oregon | 3 | 1 | — | |||||||||||||
Georgia | 62 | 6 | — | Pennsylvania | 7 | 6 | — | |||||||||||||
Illinois | 3 | — | — | Rhode Island | 1 | 2 | — | |||||||||||||
Indiana | 5 | 1 | — | South Carolina | 19 | 7 | — | |||||||||||||
Kansas | 1 | 1 | — | Tennessee | 43 | 11 | — | |||||||||||||
Kentucky | 17 | — | — | Texas | 1 | 1 | — | |||||||||||||
Louisiana | 10 | 4 | — | Virginia | 13 | 1 | — | |||||||||||||
Massachusetts | 6 | 9 | 14 | Washington | 1 | — | — | |||||||||||||
Maine | 2 | 4 | — | West Virginia | 11 | 6 | — | |||||||||||||
Maryland | 8 | 2 | — | Wisconsin | 1 | — | — | |||||||||||||
Mississippi | 9 | — | — | Washington, D.C. | 1 | — | — | |||||||||||||
Missouri | 6 | — | — | Total | 323 | 83 | 15 | |||||||||||||
ITEM 3. LEGAL PROCEEDINGS
See Part II, Item 8, Note 9 – Commitments and Contingencies for information concerning our legal proceedings.
ITEM 4. MINE SAFETY DISCLOSURES
Not applicable.
25
PART II
ITEM 5. MARKET FOR REGISTRANT’S COMMON EQUITY, RELATED STOCKHOLDER MATTERS AND ISSUER PURCHASES OF EQUITY SECURITIES
Market Information and Holders
Our common stock trades on the NASDAQ Global Select Market under the trading symbol “AMED”. The following table presents the range of high and low sales prices for our common stock for the periods indicated as reported on NASDAQ:
Price Range of Common Stock | |||||||
High | Low | ||||||
Year Ended December 31, 2017 | |||||||
First Quarter | $ | 54.27 | $ | 42.05 | |||
Second Quarter | 65.91 | 50.42 | |||||
Third Quarter | 63.13 | 45.67 | |||||
Fourth Quarter | 61.78 | 45.60 | |||||
Year Ended December 31, 2016 | |||||||
First Quarter | $ | 48.48 | $ | 31.16 | |||
Second Quarter | 54.42 | 46.12 | |||||
Third Quarter | 55.16 | 45.48 | |||||
Fourth Quarter | 48.13 | 34.58 | |||||
As of February 23, 2018, there were approximately 522 holders of record of our common stock.
Dividend Policy
We have not declared or paid any cash dividends on our common stock or any other of our securities and do not expect to pay cash dividends for the foreseeable future. We currently intend to retain our future earnings, if any, to fund the development and growth of our business. Future decisions concerning the payment of dividends will depend upon our results of operations, financial condition, capital expenditure plans and debt service requirements, as well as such other factors as our Board of Directors, in its sole discretion, may consider relevant. In addition, our outstanding indebtedness restricts, and we anticipate any additional future indebtedness may restrict, our ability to pay cash dividends; provided, however, that we may pay (i) dividends payable solely in our equity securities and (ii) dividends if (1) no default or event of default under the Credit Agreement shall have occurred and be continuing at the time of such dividend or would result therefrom, (2) we demonstrate that, upon giving pro forma effect to such dividend, our consolidated leverage ratio (as defined in the Credit Agreement) is less than 2.00 to 1.0 and (3) we demonstrate a minimum liquidity of $50 million upon giving effect to such dividend.
Purchases of Equity Securities
The following table provides the information with respect to purchases made by us of shares of our common stock during each of the months during the three-month period ended December 31, 2017:
Period | (a) Total Number of Shares (or Units) Purchased | (b) Average Price Paid per Share (or Unit) | (c) Total Number of Shares (or Units) Purchased as Part of Publicly Announced Plans or Programs | (d) Maximum Number (or Approximate Dollar Value) of Shares (or Units) That May Yet Be Purchased Under the Plans or Programs | |||||||||||
October 1, 2017 to October 31, 2017 | 991 | $ | 50.27 | — | $ | — | |||||||||
November 1, 2017 to November 30, 2017 | — | — | — | — | |||||||||||
December 1, 2017 to December 31, 2017 | 7,866 | 55.31 | — | — | |||||||||||
8,857 | (1) | $ | 54.75 | — | $ | — | |||||||||
(1) | Includes shares of common stock surrendered to us by certain employees to satisfy tax withholding obligations in connection with the vesting of stock previously awarded to such employees under our 2008 Omnibus Incentive Compensation Plan. |
26
Stock Performance Graph
The Performance Graph below compares the cumulative total stockholder return on our common stock, $0.001 par value per share, for the five-year period ended December 31, 2017, with the cumulative total return on the NASDAQ composite index and an industry peer group over the same period (assuming the investment of $100 in our common stock, the NASDAQ composite index and the industry peer group) on December 31, 2012 and the reinvestment of dividends. The peer group we selected is comprised of: LHC Group, Inc. (“LHCG”) and Almost Family, Inc. (“AFAM”). The cumulative total stockholder return on the following graph is historical and is not necessarily indicative of future stock price performance. No cash dividends have been paid on our common stock.
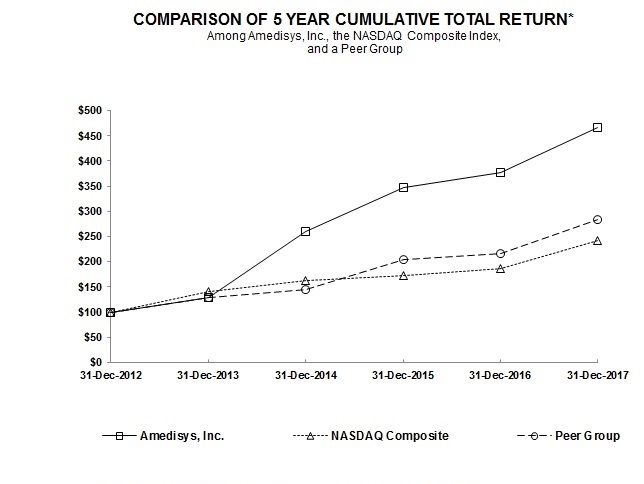
12/31/2012 | 12/31/2013 | 12/31/2014 | 12/31/2015 | 12/31/2016 | 12/31/2017 | ||||||||||||||||||
Amedisys, Inc. | $ | 100.00 | $ | 129.39 | $ | 259.58 | $ | 347.76 | $ | 377.03 | $ | 466.18 | |||||||||||
NASDAQ Composite | $ | 100.00 | $ | 141.63 | $ | 162.09 | $ | 173.33 | $ | 187.19 | $ | 242.29 | |||||||||||
Peer Group | $ | 100.00 | $ | 128.93 | $ | 145.45 | $ | 204.88 | $ | 216.08 | $ | 283.07 | |||||||||||
This stock performance information is “furnished” and shall not be deemed to be “soliciting material” or subject to Regulation 14A under the Securities Exchange Act of 1934 (the “Exchange Act”), shall not be deemed “filed” for purposes of Section 18 of the Exchange Act or otherwise subject to the liabilities of that section, and shall not be deemed incorporated by reference in any filing under the Securities Act of 1933, as amended, or the Exchange Act, whether made before or after the date of this report and irrespective of any general incorporation by reference language in any such filing, except to the extent we specifically incorporate the information by reference.
27
ITEM 6. SELECTED FINANCIAL DATA
The selected consolidated financial data presented below is derived from our audited consolidated financial statements for the five-year period ended December 31, 2017, based on our continuing operations. The financial data for the years ended December 31, 2017, 2016 and 2015 should be read together with our consolidated financial statements and related notes included in Item 8, “Financial Statements and Supplementary Data” and the information included in Item 7, “Management’s Discussion and Analysis of Financial Condition and Results of Operations” herein.
2017 (1) | 2016 (2) | 2015 (3) | 2014 (4) | 2013 (5) | |||||||||||||||
(Amounts in thousands, except per share data) | |||||||||||||||||||
Income Statement Data: | |||||||||||||||||||
Net service revenue | $ | 1,533,680 | $ | 1,437,454 | $ | 1,280,541 | $ | 1,204,554 | $ | 1,249,344 | |||||||||
Operating income (loss) from continuing operations | 78,524 | 57,340 | (9,166 | ) | $ | 24,047 | $ | (154,971 | ) | ||||||||||
Net income (loss) from continuing operations attributable to Amedisys, Inc. | $ | 30,301 | $ | 37,261 | $ | (3,021 | ) | $ | 12,992 | $ | (93,105 | ) | |||||||
Net income (loss) from continuing operations attributable to Amedisys, Inc. per basic share | $ | 0.90 | $ | 1.12 | $ | (0.09 | ) | $ | 0.40 | $ | (2.98 | ) | |||||||
Net income (loss) from continuing operations attributable to Amedisys, Inc. per diluted share | $ | 0.88 | $ | 1.10 | $ | (0.09 | ) | $ | 0.40 | $ | (2.98 | ) | |||||||
(1) | During 2017, we recorded charges related to the Securities Class Action Lawsuit settlement, net in the amount of $29.8 million ($18.1 million, net of tax). Additionally, we recorded a charge in the amount of $21.4 million as the result of H.R. 1 (Tax Cuts and Jobs Act) enacted on December 22, 2017. |
(2) | During 2016, we recorded charges related to Homecare Homebase (“HCHB”) implementation costs in the amount of $8.4 million ($5.1 million, net of tax) and recognized a non-cash charge to write off assets as a result of our conversion to the HCHB platform in the amount of $4.4 million ($2.7 million, net of tax). |
(3) | During 2015, we recorded non-cash charges to write off the software costs incurred related to the development of AMS3 Home Health and Hospice in the amount of $75.2 million ($45.5 million, net of tax) and to reduce the carrying value of our corporate headquarters in the amount of $2.1 million ($1.2 million, net of tax). |
(4) | During 2014, we recorded charges for relators’ fees and exit and restructuring activity in the amount of $13.9 million ($8.5 million, net of tax) and recognized non-cash other intangibles impairment charges of $3.1 million ($2.0 million, net of tax). |
(5) | During 2013, we recorded a charge for the accrual for the U.S. Department of Justice settlement, which amounted to $150.0 million ($93.9 million, net of tax) and recognized non-cash goodwill and other intangibles impairment charges of $9.5 million ($5.8 million, net of tax). |
2017 | 2016 | 2015 | 2014 | 2013 | |||||||||||||||
(Amounts in thousands) | |||||||||||||||||||
Balance Sheet Data: | |||||||||||||||||||
Total assets (1) | $ | 813,482 | $ | 734,029 | $ | 681,715 | $ | 666,956 | $ | 724,237 | |||||||||
Total debt, including current portion (1) | $ | 88,841 | $ | 93,029 | $ | 96,630 | $ | 113,586 | $ | 44,735 | |||||||||
Total Amedisys, Inc. stockholders’ equity | 515,321 | 460,203 | $ | 409,568 | $ | 397,167 | $ | 372,201 | |||||||||||
Cash dividends declared per common share | $ | — | $ | — | $ | — | $ | — | $ | — | |||||||||
(1) | Total assets and Total debt, including current portion have been recast to present our retrospective adoption of Accounting Standards Update 2015-03, Interest – Imputation of Interest (Subtopic 835-30): Simplifying the Presentation of Debt Issuance Costs. |
ITEM 7. MANAGEMENT’S DISCUSSION AND ANALYSIS OF FINANCIAL CONDITION AND RESULTS OF OPERATIONS
The following discussion and analysis provides information we believe is relevant to an assessment and understanding of our results of operations and financial condition for 2017, 2016 and 2015. This discussion should be read in conjunction with our audited financial statements included in Item 8, “Financial Statements and Supplementary Data” and Part I, Item 1, “Business” of this Annual Report on Form 10-K. The following analysis contains forward-looking statements about our future revenues,
28
operating results and expectations. See “Special Caution Concerning Forward-Looking Statements” for a discussion of the risks, assumptions and uncertainties affecting these statements as well as Part I, Item 1A, “Risk Factors.”
Overview
We are a provider of high-quality in-home healthcare and related services to the chronic, co-morbid, aging American population, with approximately 75%, 78% and 80% of our revenue derived from Medicare for 2017, 2016 and 2015 respectively.
Our operations involve servicing patients through our three reportable business segments: home health, hospice and personal care. Our home health segment delivers a wide range of services in the homes of individuals who may be recovering from an illness, injury or surgery. Our hospice segment provides care that is designed to provide comfort and support for those who are facing a terminal illness. Our personal care segment provides patients assistance with the essential activities of daily living. As of December 31, 2017, we owned and operated 323 Medicare-certified home health care centers, 83 Medicare-certified hospice care centers and 15 personal-care care centers, including unconsolidated joint ventures, in 34 states within the United States and the District of Columbia.
Care Centers Summary
Home Health | Hospice | Personal Care | ||||||
At December 31, 2014 | 316 | 80 | — | |||||
Acquisitions | 15 | 1 | — | |||||
Closed/Consolidated/Sold | (2 | ) | (2 | ) | — | |||
At December 31, 2015 | 329 | 79 | — | |||||
Acquisitions/Start-Ups | 1 | — | 14 | |||||
Closed/Consolidated | (3 | ) | — | — | ||||
At December 31, 2016 | 327 | 79 | 14 | |||||
Acquisitions/Start-Ups | 3 | 2 | 7 | |||||
Closed/Consolidated | (10 | ) | — | (6 | ) | |||
At December 31, 2017 | 320 | 81 | 15 | |||||
Unconsolidated Joint Ventures | 3 | 2 | — | |||||
Total Including Unconsolidated Joint Ventures at December 31, 2017 | 323 | 83 | 15 | |||||
When we refer to “same store business,” we mean home health, hospice and personal-care care centers that we have operated for at least the last twelve months; when we refer to “acquisitions,” we mean home health, hospice and personal-care care centers that we acquired within the last twelve months; and when we refer to “start-ups,” we mean home health, hospice and personal-care care centers opened by us in the last twelve months. Once a care center has been in operation for a twelve month period, the results for that particular care center are included as part of our same store business from that date forward. Non-Medicare revenue, admissions, recertifications or completed episodes includes home health revenue, admissions, recertifications or completed episodes of care for those payors that pay on an episodic or per visit basis, which includes Medicare Advantage programs and private payors.
2017 Developments
• | Acquired the assets of Home Staff, L.L.C and Intercity Home Care, solidifying our position as the largest personal care provider in Massachusetts. |
• | Made significant strides in delivering on our goal of clinical distinction with 88% of our care centers at 4+ Stars in the January 2018 Home Health Compare ("HHC") release. |
• | Increased total revenue 7% and operating income 37%. |
• | Realized planned reductions in operating expenses post-completion of our Homecare Homebase ("HCHB") rollout. |
• | Exceeded 7,000 in hospice average daily census. |
• | Lowered our business development staff vacancy rate to 1%. |
• | Lowered company voluntary turnover rate to 22%. |
• | Completed home health division restructure plan which is expected to generate between $7 million and $9 million in annualized savings. |
29
2018 Strategy
• | Continue to build on our industry-leading hospice platform by exploring various growth opportunities including small and large acquisitions and denovos. |
• | Continue to focus on organic growth and inorganic expansion in all three segments. |
• | Continue our commitment to clinical distinction with a goal of all care centers achieving a 4.0 Quality Star Rating. |
• | Focus on recruitment and retention of world class employees while fostering a culture of engagement to become the employer of choice in the industry. |
• | Improve productivity through increased proficiency in HCHB, productivity staffing tools and standardized scheduling processes. |
• | Optimize portfolio by focusing on margin improvement in underperforming care centers. |
Financial Performance
Results for the year ended December 31, 2017 were the culmination of our focused efforts on operational improvements that began during 2014.
Our home health care centers experienced same store episodic volume growth in 2017. The home health segment saw an increase in non-Medicare revenue which combined with cost controls were able to partially mitigate the impact of the 2017 CMS rate cut (see "Results of Operations”).
Our hospice segment achieved significant growth in admissions and average daily census combined with strong cost controls in 2017, all of which helped deliver a $27 million improvement in our operating income over the year ended December 31, 2016 (see “Results of Operations”).
Our personal care segment completed two acquisitions in 2017. These acquisitions contributed approximately $1 million in personal care operating income as a result of associated integration costs.
Economic and Industry Factors
Home health, hospice and personal care services are a highly fragmented and highly competitive industry. The degree of competitiveness varies based upon whether our care centers operate in states that require a certificate of need (CON) or permit of approval (POA). In such states, expansion by existing providers or entry into the market by new providers is permitted only where determination is made by state health authorities that a given amount of unmet healthcare need exists. Currently, 68% and 39% of our home health and hospice care centers, respectively operate in CON/POA states.
As the Federal government continues to debate a reduction in expenditures and a reform of the Medicare system, our industry continues to face reimbursement pressures. These reform efforts could result in major changes in the health care delivery and reimbursement system on a national and state level, including changes directly impacting the reimbursement systems for our home health and hospice care centers.
In the Calendar Year 2018 Home Health Proposed Rule, released in July 2017, CMS proposed changes to the Home Health Prospective Payment System (“HHPPS”), known as the Home Health Groupings Model (“HHGM”). Among a number of major differences from the current payment system, the HHGM would have distinguished between referrals from institutions and those from the community, with community referrals receiving lower payments. In addition, a 60-day episode would consist of two 30-day periods, each paid separately, with the initial 30-day period paid higher than any other period. However, HHGM was not included in the final rule released in November 2017.
On February 9, 2018, Congress passed the Bipartisan Budget Act of 2018 ("BBA of 2018"), which funded government operations, set two-year government spending limits and enacted a variety of healthcare related policies. Specific to home health, the BBA of 2018 provides for a targeted extension of the home health rural add-on payment, a reduction of the 2020 market basket update, modification of eligibility documentation requirements and reform to the HHPPS. The HHPPS reform includes the following parameters:
• | For home health units of service beginning on January 1, 2020, a 30-day payment system will apply. |
• | The transition to the 30-day payment system must be budget neutral. |
• | CMS must conduct at least one Technical Expert Panel during 2018, prior to any notice and comment rulemaking process, related to the design of any new case-mix adjustment model. |
30
The following payment adjustments are effective for each of the years indicated based on CMS’s final rules relative to Medicare reimbursement and the passage of the BBA of 2018:
Home Health | Hospice | ||||||||||||||||
2018 (1) | 2017 | 2016 | 2018 (2) | 2017 | 2016 | ||||||||||||
Market Basket Update | 1.0 | % | 2.8 | % | 2.3 | % | 1.0 | % | 2.7 | % | 2.4 | % | |||||
Rebasing | — | (2.3 | ) | (2.4 | ) | — | — | — | |||||||||
50/50 Blend of Wage Index | — | — | — | — | — | 0.2 | |||||||||||
Nominal Case Mix Adjustment | (0.9 | ) | (0.9 | ) | (0.9 | ) | — | — | — | ||||||||
PPACA Adjustment | — | — | — | — | (0.3 | ) | (0.3 | ) | |||||||||
Budget Neutrality Adjustment Factor | — | — | — | — | — | (0.7 | ) | ||||||||||
Productivity Adjustment | — | (0.3 | ) | (0.4 | ) | — | (0.3 | ) | (0.5 | ) | |||||||
Estimated Industry Impact | 0.1 | % | (0.7 | )% | (1.4 | )% | 1.0 | % | 2.1 | % | 1.1 | % | |||||
Estimated Company-Specific Impact (3) | (0.7 | )% | (2.0 | )% | (1.7 | )% | 1.0 | % | 2.0 | % | — | % | |||||
(1) | Effective for episodes scheduled to be completed on or after January 1, 2018. |
(2) | Effective for services provided from October 1, 2017 to September 30, 2018. |
(3) | Our company-specific impact of the final rules differs depending on differences in the wage index and the impact of coding and outlier changes. |
As part of the 2016 final rule issued in October 2015, CMS finalized their proposal to implement a Home Health Value-Based Purchasing ("HHVBP") model in nine states that seeks to test whether incentives for better care can improve outcomes in the delivery of home health services. Financial impacts from this change, either positive or negative, would begin January 1, 2018, applied to that calendar year based on 2016 performance data and for future years as detailed below.
Performance Year | Year Reward/ Penalty Imposed | Maximum Reward/ Penalty |
2016 | 2018 | 3% |
2017 | 2019 | 5% |
2018 | 2020 | 6% |
2019 | 2021 | 7% |
2020 | 2022 | 8% |
Care centers operating in the states included in the proposed model account for approximately 30% of our 2017 home health Medicare revenue. Based on our performance to date, we anticipate that we will receive approximately $1 million in 2018 related to HHVBP.
Governmental Inquiries and Investigations and Other Litigation
Corporate Integrity Agreement
In connection with a settlement agreement with the U.S. Department of Justice, on April 23, 2014, we entered into a corporate integrity agreement (“CIA”) with the Office of Inspector General-HHS (“OIG”). The CIA formalizes various aspects of our already existing ethics and compliance programs and contains other requirements designed to help ensure our ongoing compliance with federal health care program requirements. Among other things, the CIA requires us to maintain our existing compliance program, executive compliance committee and compliance committee of the Board of Directors; provide certain compliance training; continue screening new and current employees to ensure they are eligible to participate in federal health care programs; engage an independent review organization to perform certain auditing and reviews and prepare certain reports regarding our compliance with federal health care programs, our billing submissions to federal health care programs and our compliance and risk mitigation programs; and provide certain reports and management certifications to the OIG. Additionally, the CIA specifically requires that we report substantial overpayments that we discover we have received from federal health care programs, as well as probable violations of federal health care laws. Upon breach of the CIA, we could become liable for payment of certain stipulated penalties, or could be excluded from participation in federal health care programs. The CIA has a term of five years. We expect the CIA to impact operating expenses by approximately $1 million to $2 million annually.
31
Subpoena Duces Tecum Issued by the U.S. Department of Justice
On May 21, 2015, we received a Subpoena Duces Tecum (“Subpoena”) issued by the U.S. Department of Justice. The Subpoena requests the delivery of information regarding 53 identified hospice patients to the United States Attorney’s Office for the District of Massachusetts. It also requests the delivery of documents relating to our hospice clinical and business operations and related compliance activities.
Civil Investigative Demands Issued by the U.S. Department of Justice
On November 3, 2015, we received a civil investigative demand ("CID") issued by the U.S. Department of Justice pursuant to the federal False Claims Act relating to claims submitted to Medicare and/or Medicaid for hospice services provided through designated facilities in the Morgantown, West Virginia area.
On June 27, 2016, we received a CID issued by the U.S. Department of Justice pursuant to the federal False Claims Act relating to claims submitted to Medicare and/or Medicaid for hospice services provided through designated facilities in the Parkersburg, West Virginia area.
Florida Zone Program Integrity Contractor Audit
During the three-month period ended September 30, 2017, we received a request for medical records from SafeGuard Services, L.L.C. ("SafeGuard"), a Zone Program Integrity Contractor ("ZPIC") related to services provided by some of the care centers that the Company acquired from Infinity Home Care, L.L.C. The review period covers time periods both before and after our ownership of the care centers which were acquired on December 31, 2015. Subsequent to the request for medical records, we received Requests for Repayment from Palmetto GBA, L.L.C. ("Palmetto") regarding two of these care centers. As a result we recorded a reduction in revenue in our consolidated statement of operations of approximately $7 million during the three-month period ended September 30, 2017.
See Item 8, Note 9 – Commitments and Contingencies to our consolidated financial statements for additional information regarding our CIA, the Subpoena issued by the U.S. Department of Justice, the CIDs issued by the U.S. Department of Justice and the Florida ZPIC audit. No assurances can be given as to the timing or outcome of these items.
Results of Operations
Consolidated
The following table summarizes our consolidated results of operations (amounts in millions):
For the Years Ended December 31, | |||||||||||
2017 | 2016 | 2015 | |||||||||
Net service revenue | $ | 1,533.7 | $ | 1,437.4 | $ | 1,280.5 | |||||
Gross margin, excluding depreciation and amortization | 633.0 | 604.4 | 554.6 | ||||||||
% of revenue | 41.3 | % | 42.0 | % | 43.3 | % | |||||
Other operating expenses | 499.4 | 523.2 | 472.4 | ||||||||
% of revenue | 32.6 | % | 36.4 | % | 36.9 | % | |||||
Provision for doubtful accounts | 25.1 | 19.5 | 14.1 | ||||||||
Securities Class Action Lawsuit settlement, net | 28.7 | — | — | ||||||||
Asset impairment charge | 1.3 | 4.4 | 77.3 | ||||||||
Operating income (loss) | 78.5 | 57.3 | (9.2 | ) | |||||||
Total other income, net | 2.3 | 4.2 | 8.9 | ||||||||
Income tax expense | (50.1 | ) | (23.9 | ) | (2.0 | ) | |||||
Effective income tax rate | 62.0 | % | 38.9 | % | 650.6 | % | |||||
Net income (loss) | 30.7 | 37.6 | (2.3 | ) | |||||||
Net income attributable to noncontrolling interests | (0.4 | ) | (0.4 | ) | (0.7 | ) | |||||
Net income (loss) attributable to Amedisys, Inc. | $ | 30.3 | $ | 37.3 | $ | (3.0 | ) | ||||
32
Year Ended December 31, 2017 Compared to the Year Ended December 31, 2016
Overall, our operating income increased $21 million on a revenue increase of $96 million. Our decline in gross margin as a percentage of revenue was the result of the 2017 and 2018 changes to home health and hospice reimbursement which reduced revenue and gross margin by approximately $14 million, net. Our 2017 results are inclusive of a $30 million charge for the Securities Class Action Lawsuit settlement and related legal fees, a $7 million reduction in revenue as a result of the Florida ZPIC audit and charges of approximately $3 million related to our home health closures and restructuring plan. Our 37% increase in operating income despite the cumulative impact of $40 million from the items noted above was driven by the continued growth of our hospice division and continued reductions in operating expenses across the organization.
Our 2017 operating results include the results of our acquisition of three home health and two hospice care centers on May 1, 2017 and our personal care acquisitions of Home Staff, L.L.C and Intercity Home Care. These three acquisitions accounted for approximately $22 million of our $96 million increase in revenue and $5 million of our $525 million in other operating expenses.
Total other income, net includes the impact of the following items (amounts in millions):
For the Years Ended December 31, | |||||||
2017 | 2016 | ||||||
Legal settlements | $ | 2.0 | $ | 2.3 | |||
Equity in earnings from equity method investment | 0.8 | 3.5 | |||||
Interest expense related to tax audit reserve | — | (0.6 | ) | ||||
Interest expense related to Florida ZPIC audit | (0.3 | ) | — | ||||
Interest expense related to long-term obligations | (4.7 | ) | (4.5 | ) | |||
$ | (2.2 | ) | $ | 0.7 | |||
Excluding these items, total other income, net increased $1 million in 2017 from 2016.
Our 2017 income tax expense includes a $21 million charge related to the remeasurement of our deferred tax assets and liabilities to the enacted corporate income tax rate of 21% as required by the enactment of H.R. 1 (Tax Cuts and Jobs Act), on December 22, 2017 (see Item 8, Note 7 - Income Taxes to our consolidated financial statements).
Year Ended December 31, 2016 Compared to the Year Ended December 31, 2015
Our 2016 operating results include the results of Infinity HomeCare (“Infinity”), Associated Home Care and Professional Profiles beginning on the date of their acquisition. These three acquisitions accounted for $85 million of our $157 million increase in revenue and $35 million of our $56 million increase in other operating expenses. Our operating results were also impacted by an increase of approximately $21 million in costs associated with our move to HCHB. Approximately $8 million relates to implementation services provided by a third party while $4 million is the result of a non-cash charge to write off assets (primarily laptops) not compatible with our new platform. The remaining $9 million is related to disruption in care center operations as well as additional corporate resources to support multiple systems. In addition to the $21 million related to HCHB, we experienced an increase of $5 million in bad debt and contractual reserves due to increased write-offs and accounts receivable aging due to the HCHB disruption. While we anticipated these costs to continue as we completed the roll-out, our care centers generally returned to normal operating results approximately 60 to 90 days after implementation; we completed the HCHB roll-out during the three-month period ended December 31, 2016. Additionally, our results were impacted by approximately $12 million as a result of the 2016 CMS rate cut.
33
Total other income, net includes the impact of the following items (amounts in millions):
For the Years Ended December 31, | |||||||
2016 | 2015 | ||||||
Legal settlements | $ | 2.3 | $ | 7.4 | |||
Equity in earnings from equity method investment | 3.5 | 6.7 | |||||
Interest expense related to tax audit reserve | (0.6 | ) | — | ||||
Life insurance proceeds | — | 1.0 | |||||
Debt refinance costs | — | (3.2 | ) | ||||
Interest expense related to long-term obligations | (4.5 | ) | (7.6 | ) | |||
Gain (loss) on disposal of property and equipment or sale of care centers | — | 0.2 | |||||
$ | 0.7 | $ | 4.5 | ||||
Excluding these items, total other income, net decreased $1 million in 2016 from 2015.
34
Home Health Division
The following table summarizes our home health segment results of operations:
For the Years Ended December 31, | |||||||||||
2017 | 2016 | 2015 | |||||||||
Financial Information (in millions): | |||||||||||
Medicare | $ | 793.3 | $ | 822.4 | $ | 761.4 | |||||
Non-Medicare | 308.5 | 263.1 | 243.7 | ||||||||
Net service revenue | 1,101.8 | 1,085.5 | 1,005.1 | ||||||||
Cost of service | 670.9 | 643.7 | 584.2 | ||||||||
Gross margin | 430.9 | 441.8 | 420.9 | ||||||||
Provision for doubtful accounts | 17.9 | 13.8 | 12.2 | ||||||||
Asset impairment charge | 1.3 | — | — | ||||||||
Other operating expenses | 281.9 | 289.4 | 268.4 | ||||||||
Operating income | $ | 129.8 | $ | 138.6 | $ | 140.3 | |||||
Same Store Growth (1): | |||||||||||
Medicare revenue | (4 | )% | 2 | % | 3 | % | |||||
Non-Medicare revenue | 17 | % | 8 | % | 21 | % | |||||
Medicare admissions | (2 | )% | 3 | % | 3 | % | |||||
Total Episodic admissions | 1 | % | 4 | % | 3 | % | |||||
Total Episodic volume | 3 | % | 3 | % | 1 | % | |||||
Total admissions | 2 | % | 2 | % | 7 | % | |||||
Key Statistical Data - Total (2): | |||||||||||
Medicare: | |||||||||||
Admissions | 190,132 | 194,662 | 178,226 | ||||||||
Recertifications | 106,774 | 103,193 | 99,762 | ||||||||
Total volume | 296,906 | 297,855 | 277,988 | ||||||||
Completed episodes | 290,227 | 289,862 | 269,227 | ||||||||
Visits | 5,067,436 | 5,124,002 | 4,797,734 | ||||||||
Average revenue per completed episode (3) | $ | 2,823 | $ | 2,839 | $ | 2,825 | |||||
Visits per completed episode (4) | 17.3 | 17.5 | 17.5 | ||||||||
Non-Medicare: | |||||||||||
Admissions | 107,665 | 98,448 | 96,934 | ||||||||
Recertifications | 46,364 | 38,618 | 35,870 | ||||||||
Visits | 2,347,363 | 2,050,975 | 1,954,543 | ||||||||
Total (2): | |||||||||||
Visiting Clinician Cost per Visit | $ | 82.04 | $ | 81.18 | $ | 78.23 | |||||
Clinical Manager Cost per Visit | $ | 8.44 | $ | 8.53 | $ | 8.29 | |||||
Total Cost per Visit | $ | 90.48 | $ | 89.71 | $ | 86.52 | |||||
Visits | 7,414,799 | 7,174,977 | 6,752,277 | ||||||||
(1) | Same store information represents the percent increase (decrease) in our Medicare and Non-Medicare revenue, admissions or volume for the period as a percent of the Medicare and Non-Medicare revenue, admissions or volume of the prior period. |
(2) | Total includes acquisitions. |
(3) | Average Medicare revenue per completed episode is the average Medicare revenue earned for each Medicare completed episode of care. |
(4) | Medicare visits per completed episode are the home health Medicare visits on completed episodes divided by the home health Medicare episodes completed during the period. |
Year Ended December 31, 2017 Compared to the Year Ended December 31, 2016
Overall, our operating income decreased $9 million on a $16 million increase in revenue. Our decrease in gross margin as a percentage of revenue was the result of the 2017 and 2018 changes in reimbursement which reduced revenue and gross margin by $17 million. Additionally, our results include a $7 million reduction in revenue and gross margin related to a reserve recorded
35
as the result of a ZPIC audit in four care centers in Florida. Growth in episodic volumes and reductions in operating expenses helped to mitigate the impacts of the items noted above.
Net Service Revenue
Our Medicare revenue decreased approximately $29 million which includes a $7 million reduction in revenue related to the Florida ZPIC audit. Our total Medicare volumes (admissions plus recertifications) decreased by approximately 1,000 from 2016, and our revenue per episode decreased by 60 basis points which resulted in a reduction in revenue of approximately $5 million. Additionally, our provision for revenue adjustments increased approximately $7 million primarily related to the aging of Medicare receivables for our Florida care centers included in the ZPIC audit and the related billing hold. The decrease in revenue per episode is the result of the combined impact of the 2017 and 2018 CMS rate cuts on our episodes in progress which reduced our revenue by approximately $17 million; this reduction was offset by a $12 million increase related to the acuity level of our patients.
Our non-Medicare revenue increased approximately $45 million. Admissions from episodic payors increased 27% while our per visit payors increased 2%. We continue to focus on contract payors with significant concentrations in our markets and those that add incremental margin to our operations as we continue to evaluate our portfolio of managed care contracts.
Cost of Service, Excluding Depreciation and Amortization
Our cost of service consists of costs associated with direct clinician care in the homes of our patients as well as the cost of clinical managers who monitor the overall delivery of care. Our cost of service increased 4% on a 3% increase in total visits. Our cost per visit increased 1% as the result of annual wage increases and increases in health insurance costs. These increases were partially mitigated by improvements in clinician productivity.
Other Operating Expenses
Other operating expenses decreased $8 million despite incurring approximately $4 million in costs related to our home health restructuring plan. These charges were offset by decreases in other care center related expenses, primarily salaries and benefits as the result of planned decreases post our HCHB rollout. Other operating expenses include approximately $3 million related to acquisitions during 2017.
Our provision for doubtful accounts increased $4 million on a $45 million increase in revenue.
Year Ended December 31, 2016 Compared to the Year Ended December 31, 2015
Overall, our operating income decreased $2 million on a $21 million increase in gross margin offset by a $23 million increase in other operating expenses. These results are inclusive of Infinity which accounted for $49 million of our total revenue increase and $18 million of other operating expenses. Our results were negatively impacted by approximately $12 million related to the CMS rate cut which became effective January 1, 2016 and approximately $6 million as the result of disruptions associated with the roll-out of HCHB.
Net Service Revenue
Our Medicare revenue increased $61 million which is inclusive of $48 million from acquired care centers. The increase in same store revenue is due to higher admission volumes. Our revenue per episode was relatively flat despite the impact of the CMS rate cut in 2016; the increase was due to an increase in patient acuity.
Our non-Medicare revenue increased approximately $19 million, with revenues from episodic payors increasing 16% while our revenue from per visit payors grew 5%.
Cost of Service, Excluding Depreciation and Amortization
Our cost of service increased $59 million primarily as a result of a 6% increase in visits and a 4% increase in cost per visit. The increase in cost per visit is primarily due to higher health insurance expense, planned wage increases and additional costs related to our HCHB roll-out.
Other Operating Expenses
Other operating expenses increased $21 million due to increases in other care center related expenses, primarily salaries and benefits, travel and training expense and HCHB maintenance and hosting fees. Other operating expense related to care centers acquired from Infinity was approximately $18 million. We completed the consolidation of our legacy Florida operations with Infinity and the conversion of Infinity to our back office platform during 2016.
36
Our provision for doubtful accounts increased $2 million on a $19 million increase in revenue.
Hospice Division
The following table summarizes our hospice segment results of operations:
For the Years Ended December 31, | |||||||||||
2017 | 2016 | 2015 | |||||||||
Financial Information (in millions): | |||||||||||
Medicare | $ | 350.7 | $ | 297.7 | $ | 258.5 | |||||
Non-Medicare | 20.3 | 18.3 | 16.9 | ||||||||
Net service revenue | 371.0 | 316.0 | 275.4 | ||||||||
Cost of service | 184.8 | 163.1 | 141.7 | ||||||||
Gross margin | 186.2 | 152.9 | 133.7 | ||||||||
Provision for doubtful accounts | 5.9 | 5.5 | 1.9 | ||||||||
Other operating expenses | 77.5 | 71.5 | 64.1 | ||||||||
Operating income | $ | 102.8 | $ | 75.9 | $ | 67.7 | |||||
Same Store Growth (1): | |||||||||||
Medicare revenue | 17 | % | 15 | % | 13 | % | |||||
Non-Medicare revenue | 10 | % | 9 | % | 18 | % | |||||
Hospice admissions | 11 | % | 17 | % | 16 | % | |||||
Average daily census | 15 | % | 16 | % | 12 | % | |||||
Key Statistical Data - Total (2): | |||||||||||
Hospice admissions | 25,381 | 22,526 | 19,205 | ||||||||
Average daily census | 6,820 | 5,912 | 5,105 | ||||||||
Revenue per day, net | $ | 149.04 | $ | 146.05 | $ | 147.78 | |||||
Cost of service per day | $ | 74.25 | $ | 75.36 | $ | 76.06 | |||||
Average discharge length of stay | 93 | 96 | 92 | ||||||||
(1) | Same store information represents the percent increase (decrease) in our Medicare and Non-Medicare revenue, Hospice admissions or average daily census for the period as a percent of the Medicare and Non-Medicare revenue, Hospice admissions or average daily census of the prior period. |
(2) | Total includes acquisitions. |
Year Ended December 31, 2017 Compared to the Year Ended December 31, 2016
Overall, our operating income increased $27 million on a $33 million increase in gross margin offset by a $6 million increase in other operating expenses. Our significant growth in volumes and decrease in cost of service per day have resulted in a 22% increase in gross margin.
Net Service Revenue
Our hospice revenue increased approximately $55 million due to an increase in our average daily census as a result of an 11% increase in hospice admissions and an increase in reimbursement effective for services provided from each October 1, 2016 and 2017.
Cost of Service, Excluding Depreciation and Amortization
Our hospice cost of service increased $22 million as the result of a 15% increase in average daily census. Our cost of service per day decreased $1.11 primarily due to significant improvements in salary and pharmacy cost per day driven by cost controls and census growth.
Other Operating Expenses
Other operating expenses increased $6 million due to increases in other care center related expenses, primarily salaries and benefits, medical director fees and HCHB-related IT fees, driven by our census growth.
37
Year Ended December 31, 2016 Compared to the Year Ended December 31, 2015
Overall, our operating income increased $8 million on a $19 million increase in gross margin offset by an $11 million increase in other operating expenses.
Net Service Revenue
Our hospice revenue increased approximately $41 million during 2016 due to an increase in our average daily census as a result of a 17% increase in hospice admissions. We benefited from a 1.1% hospice rate increase effective October 1, 2015. Beginning January 1, 2016, CMS provided for two separate payment rates for routine care: payments for the first 60 days of care and care beyond 60 days. In addition to the two rates, beginning January 1, 2016, Medicare is also reimbursing for a service intensity add-on (“SIA”). The SIA is based on visits made in the last seven days of life by a registered nurse (“RN”) or medical social worker (“MSW”) for patients in a routine level of care.
Our revenue per day was impacted by an increase in contractual reserves and write-offs which occurred during the HCHB roll-out.
Cost of Service, Excluding Depreciation and Amortization
Our hospice cost of service increased $21 million as the result of a 16% increase in average daily census.
Other Operating Expenses
Other operating expenses increased $11 million due to increases in other care center related expenses, primarily salaries and benefits and HCHB maintenance and hosting fees.
We experienced an increase in days revenue outstanding, net as we transitioned to the HCHB platform. As such, our provision for doubtful accounts increased approximately $4 million, which is reflective of an increase in our accounts receivable aging.
Personal Care Division
The following table summarizes our personal care segment results of operations:
For the Years Ended December 31, | |||||||||||
2017 | 2016 | 2015 | |||||||||
Financial Information (in millions): | |||||||||||
Medicare | $ | — | $ | — | $ | — | |||||
Non-Medicare | 60.9 | 35.9 | — | ||||||||
Net service revenue | 60.9 | 35.9 | — | ||||||||
Cost of service | 45.0 | 26.3 | — | ||||||||
Gross margin | 15.9 | 9.6 | — | ||||||||
Provision for doubtful accounts | 1.3 | 0.2 | — | ||||||||
Other operating expenses | 13.8 | 7.9 | — | ||||||||
Operating income | $ | 0.8 | $ | 1.5 | $ | — | |||||
Key Statistical Data: | |||||||||||
Billable hours | 2,604,794 | 1,539,093 | — | ||||||||
Clients served | 16,826 | 10,219 | — | ||||||||
Shifts | 1,195,511 | 696,956 | — | ||||||||
Revenue per hour | 23.37 | 23.32 | — | ||||||||
Revenue per shift | 50.92 | 51.49 | — | ||||||||
Hours per shift | 2.2 | 2.2 | — | ||||||||
Year Ended December 31, 2017 Compared to the Year Ended December 31, 2016
On February 1, 2017, we acquired the assets of Home Staff LLC, which owned and operated three personal-care care centers, one of which was subsequently consolidated with one of our existing personal-care care centers. On October 1, 2017, we acquired the assets of Intercity Home Care, which owned and operated four personal-care care centers, three of which were subsequently consolidated with our existing personal-care care centers. Acquisitions are included in our consolidated financial statements from their respective acquisition dates. As a result, our personal care operating results for 2017 and 2016 are not fully comparable.
38
Operating income related to our personal care division decreased by approximately $1 million on a $6 million increase in gross margin offset by a $1 million increase in provision for doubtful accounts and a $6 million increase in other operating expenses. The increase in other operating expenses is driven by our acquisition activity.
Year Ended December 31, 2016
On March 1, 2016, we acquired Associated Home Care, a personal care home health care company with nine care centers. On September 1, 2016, we acquired the assets of Professional Profiles, Inc. which owned and operated four personal-care care centers. In addition, during the three-month period ended September 30, 2016 we opened a start-up personal-care care center. Operating income related to our new personal care division for 2016 was approximately $2 million on net service revenue of $36 million and cost of service of $26 million; other operating expenses were approximately $8 million.
Corporate
The following table summarizes our corporate results of operations:
For the Years Ended December 31, | |||||||||||
2017 | 2016 | 2015 | |||||||||
Financial Information (in millions): | |||||||||||
Other operating expenses | $ | 113.7 | $ | 141.9 | $ | 126.5 | |||||
Depreciation and amortization | 12.5 | 12.4 | 13.4 | ||||||||
Total operating expenses before asset impairment charge and Securities Class Action Lawsuit settlement, net | $ | 126.2 | $ | 154.3 | $ | 139.9 | |||||
Asset impairment charge | — | 4.4 | 77.3 | ||||||||
Securities Class Action Lawsuit settlement, net | $ | 28.7 | $ | — | $ | — | |||||
Total operating expenses | $ | 154.9 | $ | 158.7 | $ | 217.2 | |||||
Corporate expenses consist of costs relating to our executive management and administrative support functions, primarily information services, accounting, finance, billing and collections, legal, compliance, risk management, procurement, marketing, clinical administration, training, human resources and administration.
Year Ended December 31, 2017 Compared to the Year Ended December 31, 2016
Excluding the $30 million Securities Class Action Lawsuit settlement and related legal fees in 2017 and the asset impairment charge in 2016, corporate other operating expenses have decreased approximately $28 million primarily as a result of an $8 million reduction in HCHB implementation costs and an $11 million reduction in acquisition activity (including acquired corporate support and other acquisition costs). We also experienced reductions in various other operating expenses including salaries and benefits, non-cash compensation and personnel costs. These reductions are a direct result of planned reductions post installation of HCHB and a restructure plan initiated in 2016.
Year Ended December 31, 2016 Compared to the Year Ended December 31, 2015
Corporate other operating expenses increased approximately $14 million which is inclusive of approximately $12 million in corporate support expenses related to acquisitions, a $3 million increase in non-cash compensation and a $4 million increase related to HCHB implementation costs offset by decreases of approximately $5 million in various other costs (including a $2 million decrease in legal settlement expenses).
39
Liquidity and Capital Resources
Cash Flows
The following table summarizes our cash flows for the periods indicated (amounts in millions):
For the Years Ended December 31, | |||||||||||
2017 | 2016 | 2015 | |||||||||
Cash provided by operating activities | 105.7 | $ | 62.2 | 107.8 | |||||||
Cash used in investing activities | (44.0 | ) | (52.0 | ) | (67.4 | ) | |||||
Cash used in financing activities | (5.5 | ) | (7.5 | ) | (20.9 | ) | |||||
Net increase in cash and cash equivalents | 56.2 | 2.7 | 19.5 | ||||||||
Cash and cash equivalents at beginning of period | 30.2 | 27.5 | 8.0 | ||||||||
Cash and cash equivalents at end of period | $ | 86.4 | $ | 30.2 | $ | 27.5 | |||||
Cash provided by operating activities totaled $105.7 million for 2017, $62.2 million for 2016 and $107.8 million for 2015. During each year, we maintained sufficient liquidity to finance our capital expenditures, both routine and non-routine, and acquisitions.
Changes in our cash provided by operating activities during the past three years were primarily the result of fluctuations in the collections of our accounts receivable and timing of the payments of accrued expenses. During 2017, operating cash flows were negatively impacted by approximately $30 million in litigation fees related to the Securities Class Action Lawsuit settlement (see Item 8, Note 9 – Commitments and Contingencies to our consolidated financial statements). During 2016, operating cash flows were negatively impacted by approximately $20 million in fees related to the conversion to HCHB, severance costs related to a reorganization plan, acquisition costs and litigation.
Cash used in investing activities decreased $8.0 million during 2017 compared to 2016 primarily due to decreases in cash paid for acquisitions ($1.8 million), capital expenditures ($5.0 million) and investments ($0.6 million). Cash used in investing activities decreased $15.4 million during 2016 compared to 2015 primarily due to decreases in cash paid for acquisitions ($33.6 million), capital expenditures ($5.7 million) and investments ($2.4 million), offset by decreases in proceeds from the sale of property and equipment related to the sale of our former corporate headquarters.
Cash used in financing activities decreased $2.0 million during 2017 compared to 2016 primarily due to a decrease in tax benefits from stock compensation plans and repurchases of company stock pursuant to our stock repurchase program, offset by shares withheld upon stock vesting and proceeds from issuance of stock upon exercise of stock options. Cash used in financing activities decreased $13.4 million during 2016 compared to 2015 primarily due to tax benefits from stock compensation plans and a decrease in repayments of outstanding borrowings, offset by repurchases of company stock pursuant to our stock repurchase program.
Liquidity
Typically, our principal source of liquidity is the collection of our patient accounts receivable, primarily through the Medicare program. In addition to our collection of patient accounts receivable, from time to time, we can and do obtain additional sources of liquidity by the incurrence of additional indebtedness.
During 2017, we spent $10.7 million in capital expenditures compared to $15.7 million and $21.4 million during 2016 and 2015, respectively. Our capital expenditures for 2018 are expected to be approximately $7.0 million to $9.0 million.
As of December 31, 2017, we had $86.4 million in cash and cash equivalents and $167.3 million in availability under our $200.0 million Revolving Credit Facility.
During the three-month period ended September 30, 2017, we settled the Securities Class Action Lawsuit for approximately $43.7 million, of which approximately $15.0 million was paid by the Company's insurance carriers. We used cash on hand to make the required remaining $28.7 million payment during the three-month period ended September 30, 2017.
Based on our operating forecasts and our new debt service requirements, we believe we will have sufficient liquidity to fund our operations, capital requirements and debt service requirements.
Outstanding Patient Accounts Receivable
Our patient accounts receivable, net increased $35.1 million from December 31, 2016 to December 31, 2017. Our cash collection as a percentage of revenue was 99% for the twelve-month periods ended December 31, 2017 and 2016. Our days revenue outstanding, net at December 31, 2017 was 44.0 days which is an increase of 3.8 days from December 31, 2016. The Florida ZPIC
40
audit (see Item 8, Note 9 - Commitments and Contingencies to our consolidated financial statements) which resulted in $6.8 million of net receivables being placed on payment suspension as of December 31, 2017, has added 1.6 days to our days revenue outstanding, net. Additionally accounts receivable of the three home health and two hospice care centers acquired on May 1, 2017, has added 1.5 days to our days revenue outstanding, net. As is typical with newly acquired care centers, we experienced an increase in our aging of receivables due to regulatory delays related to the change of ownership process. We expect to have this completed during the first quarter of 2018.
Our patient accounts receivable includes unbilled receivables and are aged based upon our initial service date. We monitor unbilled receivables on a care center by care center basis to ensure that all efforts are made to bill claims within timely filing deadlines. Our unbilled patient accounts receivable can be impacted by acquisition activity, probe edits or regulatory changes which result in additional information or procedures needed prior to billing. The timely filing deadline for Medicare is one year from the date the episode was completed, varies by state for Medicaid-reimbursable services and varies among insurance companies and other private payors.
Our provision for estimated revenue adjustments (which is deducted from our service revenue to determine net service revenue) and provision for doubtful accounts were as follows for the periods indicated (amounts in millions). Our policy is to fully reserve for both our Medicare and other patient accounts receivable that are aged over 365 days; however, we have elected to not apply this policy to those accounts impacted by the Florida ZPIC audit.
For the Years Ended December 31, | |||||||
2017 | 2016 | ||||||
Provision for estimated revenue adjustments | $ | 14.4 | $ | 7.9 | |||
Provision for doubtful accounts | 25.1 | 19.5 | |||||
Total | $ | 39.5 | $ | 27.4 | |||
As a percent of revenue | 2.6 | % | 1.9 | % | |||
The following schedules detail our patient accounts receivable, net of estimated revenue adjustments, by payor class, aged based upon initial date of service (amounts in millions, except days revenue outstanding, net):
0-90 | 91-180 | 181-365 | Over 365 | Total | |||||||||||||||
At December 31, 2017: | |||||||||||||||||||
Medicare patient accounts receivable, net (1) | $ | 95.9 | $ | 16.1 | $ | 6.6 | $ | 0.6 | $ | 119.2 | |||||||||
Other patient accounts receivable: | |||||||||||||||||||
Medicaid | 14.8 | 3.7 | 2.5 | 0.3 | 21.3 | ||||||||||||||
Private | 54.3 | 10.3 | 9.7 | 7.3 | 81.6 | ||||||||||||||
Total | $ | 69.1 | $ | 14.0 | $ | 12.2 | $ | 7.6 | $ | 102.9 | |||||||||
Allowance for doubtful accounts (2) | (20.9 | ) | |||||||||||||||||
Non-Medicare patient accounts receivable, net | $ | 82.0 | |||||||||||||||||
Total patient accounts receivable, net | $ | 201.2 | |||||||||||||||||
Days revenue outstanding, net (3) | 44.0 | ||||||||||||||||||
0-90 | 91-180 | 181-365 | Over 365 | Total | |||||||||||||||
At December 31, 2016: | |||||||||||||||||||
Medicare patient accounts receivable, net (1) | $ | 82.7 | $ | 17.1 | $ | 1.4 | $ | — | $ | 101.2 | |||||||||
Other patient accounts receivable: | |||||||||||||||||||
Medicaid | 13.6 | 3.6 | 3.6 | 0.2 | 21.0 | ||||||||||||||
Private | 39.8 | 10.4 | 7.6 | 3.8 | 61.6 | ||||||||||||||
Total | $ | 53.4 | $ | 14.0 | $ | 11.2 | $ | 4.0 | $ | 82.6 | |||||||||
Allowance for doubtful accounts (2) | (17.7 | ) | |||||||||||||||||
Non-Medicare patient accounts receivable, net | $ | 64.9 | |||||||||||||||||
Total patient accounts receivable, net | $ | 166.1 | |||||||||||||||||
Days revenue outstanding, net (3) | 40.2 | ||||||||||||||||||
(1) | The following table summarizes the activity and ending balances in our estimated revenue adjustments (amounts in millions), which is recorded to reduce our Medicare outstanding patient accounts receivable to their estimated net realizable value, as we do not estimate an allowance for doubtful accounts for our Medicare claims. |
41
For the Years Ended December 31, | |||||||
2017 | 2016 | ||||||
Balance at beginning of period | $ | 4.1 | $ | 4.0 | |||
Provision for estimated revenue adjustments | 14.4 | 7.9 | |||||
Write offs | (12.3 | ) | (7.8 | ) | |||
Balance at end of period | $ | 6.2 | $ | 4.1 | |||
Our estimated revenue adjustments were 4.9% and 3.9% of our outstanding Medicare patient accounts receivable at December 31, 2017 and December 31, 2016, respectively.
(2) | The following table summarizes the activity and ending balances in our allowance for doubtful accounts (amounts in millions), which is recorded to reduce only our Medicaid and private payor outstanding patient accounts receivable to their estimated net realizable value. |
For the Years Ended December 31, | |||||||
2017 | 2016 | ||||||
Balance at beginning of period | $ | 17.7 | $ | 16.5 | |||
Provision for doubtful accounts | 25.1 | 19.5 | |||||
Write offs | (21.9 | ) | (18.3 | ) | |||
Balance at end of period | $ | 20.9 | $ | 17.7 | |||
Our allowance for doubtful accounts was 20.3% and 21.5% of our outstanding Medicaid and private patient accounts receivable at December 31, 2017 and December 31, 2016, respectively.
(3) | Our calculation of days revenue outstanding, net is derived by dividing our ending net patient accounts receivable (i.e., net of estimated revenue adjustments and allowance for doubtful accounts ) at December 31, 2017 and 2016 by our average daily net patient revenue for the three-month periods ended December 31, 2017 and 2016, respectively. |
Indebtedness
Credit Agreement
On August 28, 2015, we entered into a Credit Agreement that provides for senior secured facilities in an initial aggregate principal amount of up to $300 million.
The Credit Facilities are comprised of (a) a term loan facility in an initial aggregate principal amount of $100 million (the “Term Loan”); and (b) a revolving credit facility in an initial aggregate principal amount of up to $200 million (the “Revolving Credit Facility”). The Revolving Credit Facility provides for and includes within its $200 million limit a $25 million swingline facility and commitments for up to $50 million in letters of credit. Upon lender approval, we may increase the aggregate loan amount under the Credit Facilities by a maximum amount of $150 million.
The net proceeds of the Term Loan and existing cash on hand were used to pay off (i) our existing term loan under our Prior Credit Agreement, dated as of October 22, 2012, as amended (the “Prior Credit Agreement”) with a principal balance of $27 million and (ii) our existing term loan under our prior Second Lien Credit Agreement dated July 28, 2014 (the “Second Lien Credit Agreement”), with a principal balance of $70 million. The final maturity of the Term Loan is August 28, 2020. The Term Loan began amortizing on March 31, 2016 and will continue amortizing over 10 quarterly installments (eight remaining quarterly installments of $2.5 million beginning March 31, 2018, followed by two quarterly installments of $3.1 million beginning March 31, 2020, subject to adjustment for prepayments), with the remaining balance due upon maturity.
The Revolving Credit Facility may be used to provide ongoing working capital and for general corporate purposes of the Company and its subsidiaries, including permitted acquisitions, as defined in the Credit Agreement. The final maturity of the Revolving Credit Facility is August 28, 2020 and will be payable in full at that time.
The interest rate in connection with the Credit Facilities shall be selected from the following by us: (i) the Base Rate plus the Applicable Rate or (ii) the Eurodollar Rate plus the Applicable Rate. The “Base Rate” means a fluctuating rate per annum equal to the highest of (a) the federal funds rate plus 0.50% per annum, (b) the prime rate of interest established by the Administrative Agent, and (c) the Eurodollar Rate for an interest period of one month plus 1% per annum. The “Eurodollar Rate” means the rate at which Eurodollar deposits in the London interbank market for an interest period of one, two, three or six months (as selected
42
by us) are quoted. The “Applicable Rate” is based on the consolidated leverage ratio and is presented in the table below. As of December 31, 2017, the Applicable Rate is 1.00% per annum for Base Rate Loans and 2.00% per annum for Eurodollar Rate Loans. We are also subject to a commitment fee and letter of credit fee under the terms of the Credit Facilities, as presented in the table below.
Consolidated Leverage Ratio | Margin for ABR Loans | Margin for Eurodollar Loans | Commitment Fee | Letter of Credit Fee | ||||||||
≥ 2.75 to 1.0 | 2.00 | % | 3.00 | % | 0.40 | % | 3.00 | % | ||||
< 2.75 to 1.0 but ≥ 1.75 to 1.0 | 1.50 | % | 2.50 | % | 0.35 | % | 2.50 | % | ||||
< 1.75 to 1.0 but ≥ 0.75 to 1.0 | 1.00 | % | 2.00 | % | 0.30 | % | 2.00 | % | ||||
< 0.75 to 1.0 | 0.50 | % | 1.50 | % | 0.25 | % | 1.50 | % | ||||
Our weighted average interest rate for our $100.0 million Term Loan, under our Credit Agreement, was 3.1% and 2.5% for the period ended December 31, 2017 and December 31, 2016, respectively. Our weighted average interest rate for our $200.0 million Revolving Credit Facility was 3.5% for the period ended December 31, 2016.
As of December 31, 2017, our availability under our $200.0 million Revolving Credit Facility was $167.3 million as we had $32.7 million outstanding in letters of credit.
The Credit Agreement requires maintenance of two financial covenants: (i) a consolidated leverage ratio of funded indebtedness to EBITDA, as defined in the Credit Agreement, and (ii) a consolidated fixed charge coverage ratio of EBITDA plus rent expense (less cash taxes less capital expenditures) to scheduled debt repayments plus interest expense plus rent expense, all as defined in the Credit Agreement. Each of these covenants is calculated over rolling four-quarter periods and also is subject to certain exceptions and baskets. As of December 31, 2017, our consolidated leverage ratio was 0.9 and our consolidated fixed charge coverage ratio was 4.4 and we are in compliance with the Credit Agreement. The Credit Agreement also contains customary covenants, including, but not limited to, restrictions on: incurrence of liens; incurrence of additional debt; sales of assets and other fundamental corporate changes; investments; and declarations of dividends. These covenants contain customary exclusions and baskets.
The Credit Facilities are guaranteed by substantially all of our wholly-owned direct and indirect subsidiaries. The Credit Agreement requires at all times that we (i) provide guaranties from wholly-owned subsidiaries that in the aggregate represent not less than 95% of our consolidated net revenues and adjusted EBITDA from all wholly-owned subsidiaries and (ii) provide guarantees from subsidiaries that in the aggregate represent not less than 70% of consolidated adjusted EBITDA, subject to certain exceptions.
In connection with entering into the Credit Agreement, we entered into (i) a Security Agreement with the Administrative Agent dated August 28, 2015 and (ii) a Pledge Agreement with the Administrative Agent dated as of August 28, 2015 for the purpose of securing the payment of our obligations under the Credit Agreement. Pursuant to the Security Agreement and the Pledge Agreement, as of the effective date of the Credit Agreement, our obligations under the Credit Agreement are secured by (i) the grant of a first lien security interest in the non-real estate assets of substantially all of our direct and indirect, wholly-owned subsidiaries (subject to exceptions) and (ii) the pledge of the equity interests in (a) substantially all of our direct and indirect, wholly-owned corporate, limited liability company and limited partnership subsidiaries and (b) those joint ventures which constitute subsidiaries under the Credit Agreement (subject, in the case of the Pledge Agreement, to exceptions).
In connection with the entry into the Credit Agreement, on August 28, 2015, each of the Prior Credit Agreement and the Second Lien Credit Agreement were terminated. The Company paid a call premium of $700,000 associated with the termination of the Second Lien Credit Agreement and the voluntary prepayment of the amounts owed thereunder as of August 28, 2015, and expensed $2.5 million in deferred debt issuance costs during the three-month period ended September 30, 2015. Also in connection with our entry into the Credit Agreement, we recorded $2.4 million in deferred debt issuance costs as other assets in our consolidated balance sheet during 2015 which was reclassified to long-term obligations, less current portion during 2016 in accordance with Accounting Standards Update 2015-03, Interest – Imputation of Interest (Subtopic 835-30): Simplifying the Presentation of Debt Issuance Costs.
Stock Repurchase Program
On September 9, 2015, we announced that our Board of Directors authorized a stock repurchase program allowing for the repurchase of up to $75 million of our outstanding common stock on or before September 6, 2016, the date on which the stock repurchase program expired.
Under the terms of the program, we were allowed to repurchase shares from time to time in open market transactions, block purchases or in private transactions in accordance with applicable federal securities laws and other legal requirements. We were allowed to enter into Rule 10b5-1 plans to effect some or all of the repurchases. The timing and the amount of the repurchases
43
were determined by management based on a number of factors, including but not limited to share price, trading volume and general market conditions, as well as on working capital requirements, general business conditions and other factors.
Pursuant to this program, we repurchased 324,141 shares of our common stock at a weighted average price of $37.96 per share and a total cost of approximately $12.3 million during 2016 and 116,859 shares of our common stock at a weighted average price of $39.20 per share and a total cost of approximately $4.6 million during 2015. The repurchased shares are classified as treasury shares.
Contractual Obligations
Our future contractual obligations at December 31, 2017 were as follows (amounts in millions):
Payments Due by Period | |||||||||||||||||||
Total | Less than 1 Year | 1-3 Years | 4-5 Years | After 5 Years | |||||||||||||||
Long-term obligations | $ | 90.7 | $ | 10.6 | $ | 80.1 | $ | — | $ | — | |||||||||
Interest on long-term obligations (1) | 7.4 | 3.1 | 4.3 | — | — | ||||||||||||||
Operating leases | 80.8 | 23.6 | 31.7 | 13.9 | 11.6 | ||||||||||||||
Capital commitments | 0.7 | 0.7 | — | — | — | ||||||||||||||
Purchase obligations | 52.0 | 15.5 | 27.1 | 9.4 | — | ||||||||||||||
Uncertain tax positions | 2.7 | 0.6 | 2.1 | — | — | ||||||||||||||
$ | 234.3 | $ | 54.1 | $ | 145.3 | $ | 23.3 | $ | 11.6 | ||||||||||
(1) | Interest on debt with variable rates was calculated using the current rate of that particular debt instrument at December 31, 2017. |
Critical Accounting Estimates
The discussion and analysis of our financial condition and results of operations is based upon our consolidated financial statements, which have been prepared in accordance with U.S. generally accepted accounting principles (“U.S. GAAP”). The preparation of these financial statements requires us to make estimates and judgments that affect the reported amounts of assets, liabilities, revenue and expenses and related disclosures of contingent assets and liabilities. On an ongoing basis, we evaluate our estimates, including those related to revenue recognition, collectability of accounts receivable, reserves related to insurance and litigation, goodwill, intangible assets, income taxes and contingencies. We base these estimates on our historical experience and various other assumptions that we believe to be reasonable under the circumstances, the results of which form the basis for making judgments about the carrying values of assets and liabilities that are not readily apparent from other sources. Actual results experienced may vary materially and adversely from our estimates. To the extent there are material differences between our estimates and the actual results, our future results of operations may be affected.
We believe the following critical accounting policies represent our most significant judgments and estimates used in the preparation of our consolidated financial statements.
Revenue Recognition
We earn net service revenue through our home health, hospice and personal-care care centers by providing a variety of services almost exclusively in the homes of our patients. This net service revenue is earned and billed either on an episode of care basis, on a per visit basis, on a daily basis or based on authorized hours, visits or units, depending upon the payment terms and conditions established with each payor for services provided. We refer to home health revenue earned and billed on a 60-day episode of care as episodic-based revenue.
When we record our service revenue, we record it net of estimated revenue adjustments and contractual adjustments to reflect amounts we estimate to be realizable for services provided, as discussed below. We believe, based on information currently available to us and based on our judgment, that changes to one or more factors that impact the accounting estimates (such as our estimates related to revenue adjustments, contractual adjustments and episodes in progress) we make in determining net service revenue, which changes are likely to occur from period to period, will not materially impact our reported consolidated financial condition, results of operations, cash flows or our future financial results.
44
Home Health Revenue Recognition
Medicare Revenue
Net service revenue is recorded under the Medicare prospective payment system (“PPS”) based on a 60-day episode payment rate that is subject to adjustment based on certain variables. We make adjustments to Medicare revenue on completed episodes to reflect differences between estimated and actual payment amounts, and our discovered inability to obtain appropriate billing documentation or authorizations and other reasons unrelated to credit risk. We estimate the impact of such adjustments based on our historical experience, which primarily includes a historical collection rate of over 99% on Medicare claims, and record this estimate during the period in which services are rendered as an estimated revenue adjustment and a corresponding reduction to patient accounts receivable. In addition, management evaluates the potential for revenue adjustments and, when appropriate, provides allowances based upon the best available information.
In addition to revenue recognized on completed episodes, we also recognize a portion of revenue associated with episodes in progress. Episodes in progress are 60-day episodes of care that begin during the reporting period, but were not completed as of the end of the period. We estimate this revenue on a monthly basis based upon historical trends. The primary factors underlying this estimate are the number of episodes in progress at the end of the reporting period, expected Medicare revenue per episode and our estimate of the average percentage complete based on the number of days elapsed during an episode of care relative to the average length of an episode of care.
Non-Medicare Revenue
Episodic-based Revenue. We recognize revenue in a similar manner as we recognize Medicare revenue for episodic-based rates that are paid by other insurance carriers, including Medicare Advantage programs; however, these rates can vary based upon the negotiated terms which generally range from 90% to 100% of Medicare rates.
Non-episodic Based Revenue. Gross revenue is recorded on an accrual basis based upon the date of service at amounts equal to our established or estimated per-visit rates, as applicable. Contractual adjustments are recorded for the difference between our standard rates and the contracted rates to be realized from patients, third parties and others for services provided and are deducted from gross revenue to determine net service revenue and are also recorded as a reduction to our outstanding patient accounts receivable. In addition, we receive a minimal amount of our net service revenue from patients who are either self-insured or are obligated for an insurance co-payment.
Hospice Revenue Recognition
Hospice Medicare Revenue
Gross revenue is recorded on an accrual basis based upon the date of service at amounts equal to the estimated payment rates. The estimated payment rates are daily or hourly rates for each of the four levels of care we deliver. We make adjustments to Medicare revenue for our discovered inability to obtain appropriate billing documentation or authorizations and other reasons unrelated to credit risk. We estimate the impact of these adjustments based on our historical experience, which primarily includes our historical collection rate on Medicare claims, and record it during the period services are rendered as an estimated revenue adjustment and as a reduction to our outstanding patient accounts receivable.
Additionally, as Medicare hospice revenue is subject to an inpatient cap limit and an overall payment cap for each provider number, we monitor these caps and estimate amounts due back to Medicare if a cap has been exceeded. We record these adjustments as a reduction to revenue and an increase in other accrued liabilities. Beginning for the cap year ending September 30, 2017, providers are required to self-report and pay their estimated cap liability by February 28th of the following year. As of December 31, 2017, we have settled our Medicare hospice reimbursements for all fiscal years through October 31, 2012 and we have recorded $0.9 million for estimated amounts due back to Medicare in other accrued liabilities for the Federal cap years ended October 31, 2013 through September 30, 2018. As of December 31, 2016, we had recorded $0.8 million for estimated amounts due back to Medicare in other accrued liabilities for the Federal cap years ended October 31, 2013 through September 30, 2017.
Hospice Non-Medicare Revenue
We record gross revenue on an accrual basis based upon the date of service at amounts equal to our established rates or estimated per visit rates, as applicable. Contractual adjustments are recorded for the difference between our established rates and the amounts estimated to be realizable from patients, third parties and others for services provided and are deducted from gross revenue to determine our net service revenue and patient accounts receivable.
45
Personal Care Revenue Recognition
Personal Care Non-Medicare Revenue
We generate net service revenues by providing our services directly to patients primarily on a per hour, visit or unit basis. We receive payment for providing such services from our payor clients, including state and local governmental agencies, managed care organizations, commercial insurers and private consumers. Payor clients include the following elder service agencies: Aging Services Access Points (ASAPs), Senior Care Options (SCOs), Program of All-Inclusive Care for the Elderly (PACE) and the Veterans Administration (VA). Net service revenues are principally provided based on authorized hours, visits or units determined by the relevant agency, at a rate that is either contractual or fixed by legislation which are recognized as net service revenue at the time services are rendered.
Patient Accounts Receivable – Allowance for Doubtful Accounts
Our patient accounts receivable are uncollateralized and consist of amounts due from Medicare, Medicaid, other third-party payors and patients. Our policy is to fully reserve for accounts which are aged at 365 days or greater; however, we have elected to not apply this policy to those accounts impacted by the Florida ZPIC audit (see Item 8, Note 9 - Commitments and Contingencies to our consolidated financial statements for additional information). We write off accounts on a monthly basis once we have exhausted our collection efforts and deem an account to be uncollectible. We do not record an allowance for doubtful accounts for our Medicare patient accounts receivable, which are recorded at their net realizable value after recording estimated revenue adjustments as discussed above.
We believe there is a certain level of collectibility risk associated with non-Medicare payors. To provide for our non-Medicare patient accounts receivable that could become uncollectible in the future, we establish an allowance for doubtful accounts to reduce the carrying amount to its estimated net realizable value. We estimate an allowance for doubtful accounts based upon our assessment of historical and expected net collections, business and economic conditions, trends in payment and an evaluation of collectibility based upon the date that the service was provided. Based upon our best judgment, we believe the allowance for doubtful accounts adequately provides for accounts that will not be collected due to collectibility risk.
Insurance
We are obligated for certain costs associated with our insurance programs, including employee health, workers’ compensation and professional liability. While we maintain various insurance programs to cover these risks, we are self-insured for a substantial portion of our potential claims. We recognize our obligations associated with these costs in the period in which a claim is incurred, including with respect to both reported claims and claims incurred but not reported, up to specified deductible limits. These costs have generally been estimated based upon independent third-party actuarial calculations which consider historical claims data. Such estimates, and the resulting reserves, are reviewed and updated by us on a quarterly basis.
Goodwill and Other Intangible Assets
Goodwill represents the amount of the purchase price in excess of the fair values assigned to the underlying identifiable net assets of acquired businesses. Goodwill is not amortized, but is subject to an annual impairment test. Tests are performed more frequently if events occur or circumstances change that would more likely than not reduce the fair value of the reporting unit below its carrying amount. These events or circumstances include but are not limited to, a significant adverse change in the business environment; regulatory environment or legal factors; or a substantial decline in market capitalization of our stock.
Generally Accepted Accounting Principles ("GAAP") allows for impairment testing to be done on either a quantitative or qualitative basis. During 2017, we utilized a qualitative analysis for our annual impairment test and determined that there were no triggering events that would indicate that it were "more likely than not" that the carrying value of our reporting units were higher than their respective fair values. As a result, we did not record any goodwill impairment charges and none of the goodwill associated with our various reporting units were considered at risk of impairment as of October 31, 2017. Since the date of our last annual goodwill impairment test, there have been no material developments, events, changes in operating performance or other circumstances that would cause management to believe it is more likely than not that the fair value of any of our reporting units would be less than its carrying amount.
Intangible assets consist of Certificates of Need, licenses, acquired names and non-compete agreements. We amortize non-compete agreements and acquired names that we do not intend to use in the future on a straight-line basis over their estimated useful lives, which is generally three years for non-compete agreements and up to five years for acquired names. Our indefinite-lived intangible assets are reviewed for impairment annually or more frequently if events occur or circumstances change that would more likely than not reduce the fair value of the intangible asset below its carrying amount. During 2017, we performed a qualitative assessment to determine that our indefinite-lived intangible assets were not impaired. There have been no material developments, events,
46
changes in operating performance or other circumstances that would cause management to believe it is more likely than not that the fair value of any of our intangible assets would be less than its carrying amount.
Income Taxes
We use the asset and liability approach for measuring deferred tax assets and liabilities based on temporary differences existing at each balance sheet date using currently enacted tax rates. Our deferred tax calculation requires us to make certain estimates about future operations. Deferred tax assets are reduced by a valuation allowance when we believe it is more likely than not that some portion or all of the deferred tax assets will not be realized. The effect of a change in tax rate is recognized as income or expense in the period that includes the enactment date. As of December 31, 2017 and 2016 our net deferred tax assets were $56.1 million and $107.9 million, respectively. Our net deferred tax asset at December 31, 2017 includes a $21.4 million decrease resulting from the remeasurement of deferred taxes using the reduced U.S. corporate tax rates included in H.R. 1 (the Tax Cuts and Jobs Act) enacted on December 22, 2017.
Management regularly assesses the ability to realize deferred tax assets recorded in the Company’s entities based upon the weight of available evidence, including such factors as the recent earnings history and expected future taxable income. In the event future taxable income is below management’s estimates or is generated in tax jurisdictions different than projected, we could be required to increase the valuation allowance for deferred tax assets. This would result in an increase in our effective tax rate.
ITEM 7A. QUANTITATIVE AND QUALITATIVE DISCLOSURES ABOUT MARKET RISK
We are exposed to market risk from fluctuations in interest rates. Our Revolving Credit Facility and Term Loan carry a floating interest rate which is tied to the Eurodollar rate (i.e. LIBOR) or the Prime Rate and therefore, our consolidated statements of operations and our consolidated statements of cash flows are exposed to changes in interest rates. As of December 31, 2017, the total amount of outstanding debt subject to interest rate fluctuations was $90.0 million. A 1.0% interest rate change would cause interest expense to change by approximately $0.9 million annually.
47
ITEM 8. FINANCIAL STATEMENTS AND SUPPLEMENTARY DATA
Report of Independent Registered Public Accounting Firm
To the Stockholders and Board of Directors
Amedisys, Inc.:
Opinion on the Consolidated Financial Statements
We have audited the accompanying consolidated balance sheets of Amedisys, Inc. and subsidiaries ("the Company") as of December 31, 2017 and 2016, the related consolidated statements of operations, comprehensive income (loss), stockholders’ equity, and cash flows for each of the years in the three-year period ended December 31, 2017, and the related notes (collectively, "the consolidated financial statements"). In our opinion, the consolidated financial statements present fairly, in all material respects, the financial position of the Company as of December 31, 2017 and 2016, and the results of its operations and its cash flows for each of the years in the three-year period ended December 31, 2017, in conformity with U.S. generally accepted accounting principles.
We also have audited, in accordance with the standards of the Public Company Accounting Oversight Board (United States) ("PCAOB"), the Company's internal control over financial reporting as of December 31, 2017, based on criteria established in Internal Control – Integrated Framework (2013) issued by the Committee of Sponsoring Organizations of the Treadway Commission, and our report dated February 28, 2018 expressed an unqualified opinion on the effectiveness of the Company's internal control over financial reporting.
Basis for Opinion
These consolidated financial statements are the responsibility of the Company’s management. Our responsibility is to express an opinion on these consolidated financial statements based on our audits. We are a public accounting firm registered with the PCAOB and are required to be independent with respect to the Company in accordance with the U.S. federal securities laws and the applicable rules and regulations of the Securities and Exchange Commission and the PCAOB.
We conducted our audits in accordance with the standards of the PCAOB. Those standards require that we plan and perform the audit to obtain reasonable assurance about whether the consolidated financial statements are free of material misstatement, whether due to error or fraud. Our audits included performing procedures to assess the risks of material misstatement of the consolidated financial statements, whether due to error or fraud, and performing procedures that respond to those risks. Such procedures included examining, on a test basis, evidence regarding the amounts and disclosures in the consolidated financial statements. Our audits also included evaluating the accounting principles used and significant estimates made by management, as well as evaluating the overall presentation of the consolidated financial statements. We believe that our audits provide a reasonable basis for our opinion.
We have served as the Company's auditor since 2002.
/s/ KPMG LLP
Baton Rouge, Louisiana
February 28, 2018
48
AMEDISYS, INC. AND SUBSIDIARIES
CONSOLIDATED BALANCE SHEETS
(Amounts in thousands, except share data)
As of December 31, | |||||||
2017 | 2016 | ||||||
ASSETS | |||||||
Current assets: | |||||||
Cash and cash equivalents | $ | 86,363 | $ | 30,197 | |||
Patient accounts receivable, net of allowance for doubtful accounts of $20,866, and $17,716 | 201,196 | 166,056 | |||||
Prepaid expenses | 7,329 | 7,397 | |||||
Other current assets | 16,268 | 11,260 | |||||
Total current assets | 311,156 | 214,910 | |||||
Property and equipment, net of accumulated depreciation of $146,814 and $138,650 | 31,122 | 36,999 | |||||
Goodwill | 319,949 | 288,957 | |||||
Intangible assets, net of accumulated amortization of $30,610 and $27,864 | 46,061 | 46,755 | |||||
Deferred income taxes | 56,064 | 107,940 | |||||
Other assets, net | 49,130 | 38,468 | |||||
Total assets | $ | 813,482 | $ | 734,029 | |||
LIABILITIES AND EQUITY | |||||||
Current liabilities: | |||||||
Accounts payable | $ | 25,384 | $ | 30,358 | |||
Payroll and employee benefits | 89,936 | 82,480 | |||||
Accrued expenses | 89,104 | 63,290 | |||||
Current portion of long-term obligations | 10,638 | 5,220 | |||||
Total current liabilities | 215,062 | 181,348 | |||||
Long-term obligations, less current portion | 78,203 | 87,809 | |||||
Other long-term obligations | 3,791 | 3,730 | |||||
Total liabilities | 297,056 | 272,887 | |||||
Commitments and Contingencies – Note 9 | |||||||
Equity: | |||||||
Preferred stock, $0.001 par value, 5,000,000 shares authorized; none issued or outstanding | — | — | |||||
Common stock, $0.001 par value, 60,000,000 shares authorized; 35,747,134, and 35,253,577 shares issued; and 33,964,767 and 33,597,215 shares outstanding | 35 | 35 | |||||
Additional paid-in capital | 568,780 | 537,472 | |||||
Treasury stock at cost 1,782,367, and 1,656,362 shares of common stock | (53,713 | ) | (46,774 | ) | |||
Accumulated other comprehensive income | 15 | 15 | |||||
Retained earnings (deficit) | 204 | (30,545 | ) | ||||
Total Amedisys, Inc. stockholders’ equity | 515,321 | 460,203 | |||||
Noncontrolling interests | 1,105 | 939 | |||||
Total equity | 516,426 | 461,142 | |||||
Total liabilities and equity | $ | 813,482 | $ | 734,029 | |||
The accompanying notes are an integral part of these consolidated financial statements.
49
AMEDISYS, INC. AND SUBSIDIARIES
CONSOLIDATED STATEMENTS OF OPERATIONS
(Amounts in thousands, except per share data)
For the Years Ended December 31, | |||||||||||
2017 | 2016 | 2015 | |||||||||
Net service revenue | $ | 1,533,680 | $ | 1,437,454 | $ | 1,280,541 | |||||
Cost of service, excluding depreciation and amortization | 900,726 | 833,055 | 725,915 | ||||||||
General and administrative expenses: | |||||||||||
Salaries and benefits | 305,938 | 306,981 | 279,425 | ||||||||
Non-cash compensation | 16,295 | 16,401 | 11,824 | ||||||||
Other | 159,980 | 180,048 | 161,186 | ||||||||
Provision for doubtful accounts | 25,059 | 19,519 | 14,053 | ||||||||
Depreciation and amortization | 17,123 | 19,678 | 20,036 | ||||||||
Asset impairment charge | 1,323 | 4,432 | 77,268 | ||||||||
Securities Class Action Lawsuit settlement, net | 28,712 | — | — | ||||||||
Operating expenses | 1,455,156 | 1,380,114 | 1,289,707 | ||||||||
Operating income (loss) | 78,524 | 57,340 | (9,166 | ) | |||||||
Other income (expense): | |||||||||||
Interest income | 158 | 75 | 71 | ||||||||
Interest expense | (5,031 | ) | (5,164 | ) | (10,783 | ) | |||||
Equity in earnings from equity method investments | 3,381 | 5,588 | 9,823 | ||||||||
Miscellaneous, net | 3,769 | 3,727 | 9,747 | ||||||||
Total other income, net | 2,277 | 4,226 | 8,858 | ||||||||
Income (loss) before income taxes | 80,801 | 61,566 | (308 | ) | |||||||
Income tax expense | (50,118 | ) | (23,935 | ) | (2,004 | ) | |||||
Net income (loss) | 30,683 | 37,631 | (2,312 | ) | |||||||
Net income attributable to noncontrolling interests | (382 | ) | (370 | ) | (709 | ) | |||||
Net income (loss) attributable to Amedisys, Inc. | $ | 30,301 | $ | 37,261 | $ | (3,021 | ) | ||||
Basic earnings per common share: | |||||||||||
Income (loss) attributable to Amedisys, Inc. common stockholders | $ | 0.90 | $ | 1.12 | $ | (0.09 | ) | ||||
Weighted average shares outstanding | 33,704 | 33,198 | 33,018 | ||||||||
Diluted earnings per common share: | |||||||||||
Income (loss) attributable to Amedisys, Inc. common stockholders | $ | 0.88 | $ | 1.10 | $ | (0.09 | ) | ||||
Weighted average shares outstanding | 34,304 | 33,741 | 33,018 | ||||||||
The accompanying notes are an integral part of these consolidated financial statements.
50
AMEDISYS, INC. AND SUBSIDIARIES
CONSOLIDATED STATEMENTS OF COMPREHENSIVE INCOME (LOSS)
(Amounts in thousands)
For the Years Ended December 31, | |||||||||||
2017 | 2016 | 2015 | |||||||||
Net income (loss) | $ | 30,683 | $ | 37,631 | $ | (2,312 | ) | ||||
Other comprehensive income (loss) | — | — | — | ||||||||
Comprehensive income (loss) | 30,683 | 37,631 | (2,312 | ) | |||||||
Comprehensive income attributable to non-controlling interests | (382 | ) | (370 | ) | (709 | ) | |||||
Comprehensive income (loss) attributable to Amedisys, Inc. | $ | 30,301 | $ | 37,261 | $ | (3,021 | ) | ||||
The accompanying notes are an integral part of these consolidated financial statements.
51
AMEDISYS, INC. AND SUBSIDIARIES
CONSOLIDATED STATEMENTS OF STOCKHOLDERS’ EQUITY
(Amounts in thousands, except common stock shares)
Total | Common Stock | Additional Paid-in Capital | Treasury Stock | Accumulated Other Comprehensive Loss (Income) | Retained Earnings (Deficit) | Noncontrolling Interests | ||||||||||||||||||||||||
Shares | Amount | |||||||||||||||||||||||||||||
Balance, December 31, 2014 | $ | 397,762 | 34,569,526 | $ | 35 | $ | 481,762 | $ | (19,860 | ) | $ | 15 | $ | (64,785 | ) | $ | 595 | |||||||||||||
Issuance of stock – employee stock purchase plan | 2,204 | 79,323 | — | 2,204 | — | — | — | — | ||||||||||||||||||||||
Issuance of stock – 401(k) plan | 6,032 | 184,412 | — | 6,032 | — | — | — | — | ||||||||||||||||||||||
Exercise of stock options | 399 | 15,380 | — | 399 | — | — | — | — | ||||||||||||||||||||||
Issuance/(cancellation) of non-vested stock | — | (61,675 | ) | — | — | — | — | — | — | |||||||||||||||||||||
Non-cash compensation | 11,824 | — | — | 11,824 | — | — | — | — | ||||||||||||||||||||||
Tax benefit from stock options exercised and restricted stock vesting | 2,073 | — | — | 2,073 | — | — | — | — | ||||||||||||||||||||||
Tax deficit from stock options exercised and restricted stock vesting | (4 | ) | — | — | (4 | ) | — | — | — | — | ||||||||||||||||||||
Surrendered shares | (2,525 | ) | — | — | — | (2,525 | ) | — | — | — | ||||||||||||||||||||
Shares repurchased | (4,581 | ) | — | — | — | (4,581 | ) | — | — | — | ||||||||||||||||||||
Noncontrolling interest distribution | (436 | ) | — | — | — | — | — | — | (436 | ) | ||||||||||||||||||||
Net loss | (2,312 | ) | — | — | — | — | — | (3,021 | ) | 709 | ||||||||||||||||||||
Balance, December 31, 2015 | 410,436 | 34,786,966 | 35 | 504,290 | (26,966 | ) | 15 | (67,806 | ) | 868 | ||||||||||||||||||||
Issuance of stock – employee stock purchase plan | 2,483 | 63,688 | — | 2,483 | — | — | — | — | ||||||||||||||||||||||
Issuance of stock – 401(k) plan | 6,682 | 145,660 | — | 6,682 | — | — | — | — | ||||||||||||||||||||||
Issuance/(cancellation) of non-vested stock | — | 257,263 | — | — | — | — | — | — | ||||||||||||||||||||||
Non-cash compensation | 16,401 | — | — | 16,401 | — | — | — | — | ||||||||||||||||||||||
Tax benefit from stock options exercised and restricted stock vesting | 7,241 | — | — | 7,241 | — | — | — | — | ||||||||||||||||||||||
Surrendered shares | (7,493 | ) | — | — | — | (7,493 | ) | — | — | — | ||||||||||||||||||||
Shares repurchased | (12,315 | ) | — | — | — | (12,315 | ) | — | — | — | ||||||||||||||||||||
Noncontrolling interest distribution | (329 | ) | — | — | — | — | — | — | (329 | ) | ||||||||||||||||||||
Assets contributed to equity investment | 405 | — | — | 375 | — | — | — | 30 | ||||||||||||||||||||||
Net income | 37,631 | — | — | — | — | — | 37,261 | 370 | ||||||||||||||||||||||
Balance, December 31, 2016 | 461,142 | 35,253,577 | 35 | 537,472 | (46,774 | ) | 15 | (30,545 | ) | 939 | ||||||||||||||||||||
Issuance of stock – employee stock purchase plan | 2,382 | 53,848 | — | 2,382 | — | — | — | — | ||||||||||||||||||||||
Issuance of stock – 401(k) plan | 8,223 | 156,487 | — | 8,223 | — | — | — | — | ||||||||||||||||||||||
Issuance/(cancellation) of non-vested stock | — | 139,016 | — | — | — | — | — | — | ||||||||||||||||||||||
Exercise of stock options | 4,554 | 144,206 | — | 4,554 | ||||||||||||||||||||||||||
Non-cash compensation | 16,295 | — | — | 16,295 | — | — | — | — | ||||||||||||||||||||||
Tax benefit from stock options exercised and restricted stock vesting | 448 | — | — | — | — | — | 448 | — | ||||||||||||||||||||||
Surrendered shares | (6,939 | ) | — | — | — | (6,939 | ) | — | — | — | ||||||||||||||||||||
Noncontrolling interest distribution | (216 | ) | — | — | — | — | — | — | (216 | ) | ||||||||||||||||||||
Assets contributed to equity investment | (146 | ) | — | — | (146 | ) | — | — | — | |||||||||||||||||||||
Net income | 30,683 | — | — | — | — | — | 30,301 | 382 | ||||||||||||||||||||||
Balance, December 31, 2017 | $ | 516,426 | 35,747,134 | $ | 35 | $ | 568,780 | $ | (53,713 | ) | $ | 15 | $ | 204 | $ | 1,105 | ||||||||||||||
The accompanying notes are an integral part of these consolidated financial statements.
52
AMEDISYS, INC. AND SUBSIDIARIES
CONSOLIDATED STATEMENTS OF CASH FLOWS
(Amounts in thousands)
For the Years Ended December 31, | |||||||||||
2017 | 2016 | 2015 | |||||||||
Cash Flows from Operating Activities: | |||||||||||
Net income (loss) | $ | 30,683 | $ | 37,631 | $ | (2,312 | ) | ||||
Adjustments to reconcile net income (loss) to net cash provided by operating activities: | |||||||||||
Depreciation and amortization | 17,123 | 19,678 | 20,036 | ||||||||
Provision for doubtful accounts | 25,059 | 19,519 | 14,053 | ||||||||
Non-cash compensation | 16,295 | 16,401 | 11,824 | ||||||||
401(k) employer match | 8,754 | 6,875 | 6,089 | ||||||||
Write-off of investment | — | 196 | — | ||||||||
Loss on disposal of property and equipment | — | 582 | 775 | ||||||||
Gain on sale of care centers | — | — | (184 | ) | |||||||
Deferred income taxes | 52,178 | 24,547 | (677 | ) | |||||||
Write off of deferred debt issuance costs/debt discount | — | — | 2,512 | ||||||||
Equity in earnings from equity method investments | (3,381 | ) | (5,588 | ) | (9,823 | ) | |||||
Amortization of deferred debt issuance costs/debt discount | 735 | 740 | 959 | ||||||||
Return on equity investment | 5,321 | 4,323 | 5,610 | ||||||||
Asset impairment charge | 1,323 | 4,432 | 77,268 | ||||||||
Changes in operating assets and liabilities, net of impact of acquisitions: | |||||||||||
Patient accounts receivable | (59,731 | ) | (55,519 | ) | (36,493 | ) | |||||
Other current assets | (4,940 | ) | 4,231 | 6,455 | |||||||
Other assets | (12,749 | ) | (11,415 | ) | (3,523 | ) | |||||
Accounts payable | (2,843 | ) | 3,970 | 7,639 | |||||||
Accrued expenses | 31,843 | (7,618 | ) | 8,406 | |||||||
Other long-term obligations | 61 | (726 | ) | (829 | ) | ||||||
Net cash provided by operating activities | 105,731 | 62,259 | 107,785 | ||||||||
Cash Flows from Investing Activities: | |||||||||||
Proceeds from sale of deferred compensation plan assets | 622 | 230 | 1,229 | ||||||||
Proceeds from the sale of property and equipment | 249 | — | 20,000 | ||||||||
Purchases of deferred compensation plan assets | — | — | (19 | ) | |||||||
Purchases of property and equipment | (10,707 | ) | (15,717 | ) | (21,429 | ) | |||||
Purchase of investments | (476 | ) | (1,040 | ) | (3,485 | ) | |||||
Proceeds from sale of investment | — | — | 5,000 | ||||||||
Acquisitions of businesses, net of cash acquired | (33,715 | ) | (35,522 | ) | (69,130 | ) | |||||
Proceeds from disposition of care centers | — | — | 413 | ||||||||
Net cash used in investing activities | (44,027 | ) | (52,049 | ) | (67,421 | ) | |||||
Cash Flows from Financing Activities: | |||||||||||
Proceeds from issuance of stock upon exercise of stock options and warrants | 4,554 | — | 399 | ||||||||
Proceeds from issuance of stock to employee stock purchase plan | 2,382 | 2,483 | 2,204 | ||||||||
Shares withheld upon stock vesting | (6,939 | ) | — | — | |||||||
Tax benefit from stock options exercised and restricted stock vesting | — | 7,241 | 2,073 | ||||||||
Non-controlling interest distribution | (216 | ) | (329 | ) | (436 | ) | |||||
Proceeds from revolving line of credit | — | 134,500 | 63,400 | ||||||||
Repayments of revolving line of credit | — | (134,500 | ) | (78,400 | ) | ||||||
Proceeds from issuance of long-term obligations | — | — | 100,000 | ||||||||
Principal payments of long-term obligations | (5,319 | ) | (5,000 | ) | (103,000 | ) | |||||
Debt issuance costs | — | — | (2,553 | ) | |||||||
Purchase of company stock | — | (12,315 | ) | (4,581 | ) | ||||||
Assets contributed to equity investment | — | 405 | — | ||||||||
Net cash used in financing activities | (5,538 | ) | (7,515 | ) | (20,894 | ) | |||||
Net increase in cash and cash equivalents | 56,166 | 2,695 | 19,470 | ||||||||
Cash and cash equivalents at beginning of period | 30,197 | 27,502 | 8,032 | ||||||||
Cash and cash equivalents at end of period | $ | 86,363 | $ | 30,197 | $ | 27,502 | |||||
Supplemental Disclosures of Cash Flow Information: | |||||||||||
Cash paid for interest | $ | 2,697 | $ | 2,897 | $ | 6,175 | |||||
Cash paid for income taxes, net of refunds received | $ | 315 | $ | 755 | $ | (12,185 | ) | ||||
The accompanying notes are an integral part of these consolidated financial statements.
53
AMEDISYS, INC. AND SUBSIDIARIES
NOTES TO THE CONSOLIDATED FINANCIAL STATEMENTS
December 31, 2017
1. NATURE OF OPERATIONS, CONSOLIDATION AND PRESENTATION OF FINANCIAL STATEMENTS
Amedisys, Inc., a Delaware corporation, and its consolidated subsidiaries (“Amedisys,” “we,” “us,” or “our”) are a multi-state provider of home health, hospice and personal care services with approximately 75%, 78% and 80% of our revenue derived from Medicare for 2017, 2016 and 2015, respectively. As of December 31, 2017, we owned and operated 323 Medicare-certified home health care centers, 83 Medicare-certified hospice care centers and 15 personal-care care centers in 34 states within the United States and the District of Columbia.
Use of Estimates
Our accounting and reporting policies conform with U.S. Generally Accepted Accounting Principles (“U.S. GAAP”). In preparing the consolidated financial statements, we are required to make estimates and assumptions that impact the amounts reported in the consolidated financial statements and accompanying notes. Actual results could materially differ from those estimates.
Reclassifications and Comparability
Certain reclassifications have been made to prior periods’ financial statements in order to conform to the current period’s presentation.
Principles of Consolidation
These consolidated financial statements include the accounts of Amedisys, Inc., and our wholly owned subsidiaries. All significant intercompany accounts and transactions have been eliminated in our accompanying consolidated financial statements, and business combinations accounted for as purchases have been included in our consolidated financial statements from their respective dates of acquisition. In addition to our wholly owned subsidiaries, we also have certain equity investments that are accounted for as set forth below.
Equity Investments
We consolidate investments when the entity is a variable interest entity and we are the primary beneficiary or if we have controlling interests in the entity, which is generally ownership in excess of 50%. Third party equity interests in our consolidated joint ventures are reflected as noncontrolling interests in our consolidated financial statements. During the three-month period ended September 30, 2016, we sold a 30% interest in one of our care centers while maintaining controlling interest in the newly formed joint venture.
We account for investments in entities in which we have the ability to exercise significant influence under the equity method if we hold 50% or less of the voting stock and the entity is not a variable interest entity in which we are the primary beneficiary. The book value of investments that we accounted for under the equity method of accounting was $26.4 million as of December 31, 2017 and $27.8 million as of December 31, 2016. We account for investments in entities in which we have less than a 20% ownership interest under the cost method of accounting if we do not have the ability to exercise significant influence over the investee.
2. SUMMARY OF SIGNIFICANT ACCOUNTING POLICIES
Revenue Recognition
We earn net service revenue through our home health, hospice and personal-care care centers by providing a variety of services almost exclusively in the homes of our patients. This net service revenue is earned and billed either on an episode of care basis, on a per visit basis, on a daily basis or based on authorized hours, visits or units, depending upon the payment terms and conditions established with each payor for services provided. We refer to home health revenue earned and billed on a 60-day episode of care as episodic-based revenue.
When we record our service revenue, we record it net of estimated revenue adjustments and contractual adjustments to reflect amounts we estimate to be realizable for services provided, as discussed below. We believe, based on information currently available to us and based on our judgment, that changes to one or more factors that impact the accounting estimates (such as our estimates related to revenue adjustments, contractual adjustments and episodes in progress) we make in determining net service revenue, which changes are likely to occur from period to period, will not materially impact our reported consolidated financial condition, results of operations, cash flows or our future financial results.
54
AMEDISYS, INC. AND SUBSIDIARIES
NOTES TO THE CONSOLIDATED FINANCIAL STATEMENTS
December 31, 2017
Home Health Revenue Recognition
Medicare Revenue
Net service revenue is recorded under the Medicare prospective payment system (“PPS”) based on a 60-day episode payment rate that is subject to adjustment based on certain variables including, but not limited to: (a) an outlier payment if our patient’s care was unusually costly (capped at 10% of total reimbursement per provider number); (b) a low utilization payment adjustment (“LUPA”) if the number of visits was fewer than five; (c) a partial payment if our patient transferred to another provider or we received a patient from another provider before completing the episode; (d) a payment adjustment based upon the level of therapy services required (with various incremental adjustments made for additional visits, with larger payment increases associated with the sixth, fourteenth and twentieth visit thresholds); (e) adjustments to payments if we are unable to perform periodic therapy assessments; (f) the number of episodes of care provided to a patient, regardless of whether the same home health provider provided care for the entire series of episodes; (g) changes in the base episode payments established by the Medicare Program; (h) adjustments to the base episode payments for case mix and geographic wages; and (i) recoveries of overpayments. In addition, we make adjustments to Medicare revenue if we find that we are unable to produce appropriate documentation of a face to face encounter between the patient and physician.
We make adjustments to Medicare revenue to reflect differences between estimated and actual payment amounts, our discovered inability to obtain appropriate billing documentation or authorizations and other reasons unrelated to credit risk. We estimate the impact of such adjustments based on our historical experience, which primarily includes a historical collection rate of over 99% on Medicare claims, and record this estimate during the period in which services are rendered as an estimated revenue adjustment and a corresponding reduction to patient accounts receivable. Therefore, we believe that our reported net service revenue and patient accounts receivable will be the net amounts to be realized from Medicare for services rendered.
In addition to revenue recognized on completed episodes, we also recognize a portion of revenue associated with episodes in progress. Episodes in progress are 60-day episodes of care that begin during the reporting period, but were not completed as of the end of the period. We estimate this revenue on a monthly basis based upon historical trends. The primary factors underlying this estimate are the number of episodes in progress at the end of the reporting period, expected Medicare revenue per episode and our estimate of the average percentage complete based on the number of days elapsed during an episode of care relative to the average length of an episode of care. As of December 31, 2017 and 2016, the difference between the cash received from Medicare for a request for anticipated payment (“RAP”) on episodes in progress and the associated estimated revenue was immaterial and, therefore, the resulting credits were recorded as a reduction to our outstanding patient accounts receivable in our consolidated balance sheets for such periods.
Non-Medicare Revenue
Episodic-based Revenue. We recognize revenue in a similar manner as we recognize Medicare revenue for episodic-based rates that are paid by other insurance carriers, including Medicare Advantage programs; however, these rates can vary based upon the negotiated terms which generally range from 90% to 100% of Medicare rates.
Non-episodic based Revenue. Gross revenue is recorded on an accrual basis based upon the date of service at amounts equal to our established or estimated per-visit rates, as applicable. Contractual adjustments are recorded for the difference between our standard rates and the contracted rates to be realized from patients, third parties and others for services provided and are deducted from gross revenue to determine net service revenue and are also recorded as a reduction to our outstanding patient accounts receivable. In addition, we receive a minimal amount of our net service revenue from patients who are either self-insured or are obligated for an insurance co-payment.
Hospice Revenue Recognition
Hospice Medicare Revenue
Gross revenue is recorded on an accrual basis based upon the date of service at amounts equal to the estimated payment rates. The estimated payment rates are daily or hourly rates for each of the four levels of care we deliver. The four levels of care are routine care, general inpatient care, continuous home care and respite care. Routine care accounts for 99% of our total net Medicare hospice service revenue for each of 2017, 2016 and 2015, respectively. Beginning January 1, 2016, CMS has provided for two separate payment rates for routine care: payments for the first 60 days of care and care beyond 60 days. In addition to the two routine rates, beginning January 1, 2016, Medicare is also reimbursing for a service intensity add-on (“SIA”). The SIA is based on visits made in the last seven days of life by a registered nurse (“RN”) or medical social worker (“MSW”) for patients in a routine level of care.
55
AMEDISYS, INC. AND SUBSIDIARIES
NOTES TO THE CONSOLIDATED FINANCIAL STATEMENTS
December 31, 2017
We make adjustments to Medicare revenue for an inability to obtain appropriate billing documentation or acceptable authorizations and other reasons unrelated to credit risk. We estimate the impact of these adjustments based on our historical experience, which primarily includes our historical collection rate on Medicare claims, and record it during the period services are rendered as an estimated revenue adjustment and as a reduction to our outstanding patient accounts receivable.
Additionally, as Medicare hospice revenue is subject to an inpatient cap limit and an overall payment cap for each provider number, we monitor these caps and estimate amounts due back to Medicare if we estimate a cap has been exceeded. We record these adjustments as a reduction to revenue and an increase in other accrued liabilities. Beginning for the cap year ending October 31, 2017, providers are required to self-report and pay their estimated cap liability by February 28th of the following year. As of December 31, 2017, we have settled our Medicare hospice reimbursements for all fiscal years through October 31, 2012 and we have recorded $0.9 million for estimated amounts due back to Medicare in other accrued liabilities for the Federal cap years ended October 31, 2013 through September 30, 2018. As of December 31, 2016, we had recorded $0.8 million for estimated amounts due back to Medicare in other accrued liabilities for the Federal cap years ended October 31, 2013 through September 30, 2017.
Hospice Non-Medicare Revenue
We record gross revenue on an accrual basis based upon the date of service at amounts equal to our established rates or estimated per day rates, as applicable. Contractual adjustments are recorded for the difference between our established rates and the amounts estimated to be realizable from patients, third parties and others for services provided and are deducted from gross revenue to determine our net service revenue and patient accounts receivable.
Personal Care Revenue Recognition
Personal Care Non-Medicare Revenue
We generate net service revenues by providing our services directly to patients primarily on a per hour, visit or unit basis. We receive payment for providing such services from our payor clients, including state and local governmental agencies, managed care organizations, commercial insurers and private consumers. Payor clients include the following elder service agencies: Aging Services Access Points (ASAPs), Senior Care Options (SCOs), Program of All-Inclusive Care for the Elderly (PACE) and the Veterans Administration (VA). Net service revenues are principally provided based on authorized hours, visits or units determined by the relevant agency, at a rate that is either contractual or fixed by legislation, which are recognized as net service revenue at the time services are rendered.
Cash and Cash Equivalents
Cash and cash equivalents include certificates of deposit and all highly liquid debt instruments with maturities of three months or less when purchased.
Patient Accounts Receivable
Our patient accounts receivable are uncollateralized and consist of amounts due from Medicare, Medicaid, other third-party payors and patients. As of December 31, 2017, there is no single payor, other than Medicare, that accounts for more than 10% of our total outstanding patient receivables. Thus, we believe there are no other significant concentrations of receivables that would subject us to any significant credit risk in the collection of our patient accounts receivable. Our policy is to fully reserve for accounts which are aged at 365 days or greater; however, we have elected not to apply this policy to those accounts impacted by the Florida ZPIC audit (see Note 9 - Commitments and Contingencies). We write off accounts on a monthly basis once we have exhausted our collection efforts and deem an account to be uncollectible.
We believe the collectibility risk associated with our Medicare accounts, which represent 59% and 61% of our net patient accounts receivable at December 31, 2017 and December 31, 2016, respectively, is limited due to our historical collection rate of over 99% from Medicare and the fact that Medicare is a U.S. government payor. Accordingly, we do not record an allowance for doubtful accounts for our Medicare patient accounts receivable, which are recorded at their net realizable value after recording estimated revenue adjustments as discussed above. During 2017, 2016 and 2015, we recorded $14.4 million, $7.9 million and $6.1 million, respectively, in estimated revenue adjustments to Medicare revenue.
We believe there is a certain level of collectibility risk associated with non-Medicare payors. To provide for our non-Medicare patient accounts receivable that could become uncollectible in the future, we establish an allowance for doubtful accounts to reduce the carrying amount to its estimated net realizable value.
56
AMEDISYS, INC. AND SUBSIDIARIES
NOTES TO THE CONSOLIDATED FINANCIAL STATEMENTS
December 31, 2017
Medicare Home Health
For our home health patients, our pre-billing process includes verifying that we are eligible for payment from Medicare for the services that we provide to our patients. Our Medicare billing begins with a process to ensure that our billings are accurate through the utilization of an electronic Medicare claim review. We submit a RAP for 60% of our estimated payment for the initial episode at the start of care or 50% of the estimated payment for any subsequent episodes of care contiguous with the first episode for a particular patient. The full amount of the episode is billed after the episode has been completed (“final billed”). The RAP received for that particular episode is then deducted from our final payment. If a final bill is not submitted within the greater of 120 days from the start of the episode, or 60 days from the date the RAP was paid, any RAPs received for that episode will be recouped by Medicare from any other claims in process for that particular provider number. The RAP and final claim must then be resubmitted.
Medicare Hospice
For our hospice patients, our pre-billing process includes verifying that we are eligible for payment from Medicare for the services that we provide to our patients. Our Medicare billing begins with a process to ensure that our billings are accurate through the utilization of an electronic Medicare claim review. We bill Medicare on a monthly basis for the services provided to the patient.
Non-Medicare Home Health, Hospice, and Personal Care
For our non-Medicare patients, our pre-billing process primarily begins with verifying a patient’s eligibility for services with the applicable payor. Once the patient has been confirmed for eligibility, we will provide services to the patient and bill the applicable payor. Our review and evaluation of non-Medicare accounts receivable includes a detailed review of outstanding balances and special consideration to concentrations of receivables from particular payors or groups of payors with similar characteristics that would subject us to any significant credit risk. We estimate an allowance for doubtful accounts based upon our assessment of historical and expected net collections, business and economic conditions, trends in payment and an evaluation of collectability based upon the date that the service was provided. Based upon our best judgment, we believe the allowance for doubtful accounts adequately provides for accounts that will not be collected due to credit risk.
Property and Equipment
Property and equipment is stated at cost and we depreciate it on a straight-line basis over the estimated useful lives of the assets. Additionally, we have internally developed computer software for our own use. Additions and improvements (including interest costs for construction of qualifying long-lived assets) are capitalized. Maintenance and repair expenses are charged to expense as incurred. The cost of property and equipment sold or disposed of and the related accumulated depreciation are eliminated from the property and related accumulated depreciation accounts, and any gain or loss is credited or charged to other general and administrative expenses.
We consider our reporting units to represent asset groups for purposes of testing long-lived assets for impairment. We assess the impairment of a long-lived asset group whenever events or changes in circumstances indicate that the asset’s carrying value may not be recoverable. Factors we consider important that could trigger an impairment review include but are not limited to the following:
• | A significant change in the extent or manner in which the long-lived asset group is being used. |
• | A significant change in the business climate that could affect the value of the long-lived asset group. |
• | A significant change in the market value of the assets included in the asset group. |
If we determine that the carrying value of long-lived assets may not be recoverable, we compare the carrying value of the asset group to the undiscounted cash flows expected to be generated by the asset group. If the carrying value exceeds the undiscounted cash flows, an impairment charge is indicated. An impairment charge is recognized to the extent that the carrying value of the asset group exceeds its fair value.
57
AMEDISYS, INC. AND SUBSIDIARIES
NOTES TO THE CONSOLIDATED FINANCIAL STATEMENTS
December 31, 2017
We generally provide for depreciation over the following estimated useful service lives.
Years | |
Building | 39 |
Leasehold improvements | Lesser of life or lease or expected useful life |
Equipment and furniture | 3 to 7 |
Vehicles | 5 |
Computer software | 3 to 5 |
As of December 31, 2014, we had $75.8 million of internally developed software costs related to the development of AMS3 Home Health and Hospice (“AMS3”). Expanded beta testing to additional sites in February of 2015 demonstrated that AMS3 was disruptive to operations. Additional analysis of the system determined that the system was not ready to be fully implemented and would require significant time and investment to redesign. Therefore, during the three-month period ended March 31, 2015, we made the decision to discontinue AMS3 and recorded a non-cash asset impairment charge of $75.2 million to write-off the software costs incurred related to the development of AMS3.
During 2015, we began the transition of all our care centers from our proprietary operating system to Homecare Homebase (“HCHB”), a leading home health and hospice platform, with all of our care centers operating on HCHB as of December 31, 2016. As part of our conversion process, we determined that a number of assets (primarily laptops) were not compatible with HCHB and had no other alternative or secondary use. As a result, we recorded a non-cash asset impairment charge of $4.4 million to write-off these assets during the three-month period ended December 31, 2016.
During the three-month period ended September 30, 2015, we commenced an active program to sell our corporate headquarters located in Baton Rouge, Louisiana. In accordance with U.S. GAAP, we classified this asset as held for sale and reduced the carrying value of the asset to its estimated fair value less estimated costs to sell the asset; no further depreciation expense for the asset was recorded. As a result, we recorded a non-cash asset impairment charge of $2.1 million during the three-month period ended September 30, 2015. The asset was sold during the three-month period ended December 31, 2015 and the Company now leases equivalent office space.
The following table summarizes the balances related to our property and equipment for 2017 and 2016 (amounts in millions):
As of December 31, | |||||||
2017 | 2016 | ||||||
Building and leasehold improvements | 7.8 | 6.9 | |||||
Equipment and furniture | 72.9 | 71.9 | |||||
Computer software | 97.2 | 96.8 | |||||
177.9 | 175.6 | ||||||
Less: accumulated depreciation | (146.8 | ) | (138.6 | ) | |||
$ | 31.1 | $ | 37.0 | ||||
Depreciation expense for 2017, 2016 and 2015 was $14.4 million, $17.2 million and $20.0 million, respectively.
Goodwill and Other Intangible Assets
Goodwill represents the amount of the purchase price in excess of the fair values assigned to the underlying identifiable net assets of acquired businesses. Goodwill is not amortized, but is subject to an annual impairment test. Tests are performed more frequently if events occur or circumstances change that would more likely than not reduce the fair value of the reporting unit below its carrying amount. These events or circumstances include but are not limited to, a significant adverse change in the business environment; regulatory environment or legal factors; or a substantial decline in market capitalization of our stock.
Each of our operating segments described in Note 14 – Segment Information is considered to represent an individual reporting unit for goodwill impairment testing purposes. We consider each of our home health care centers to constitute an individual business for which discrete financial information is available. However, since these care centers have substantially similar operating and economic characteristics and resource allocation and significant investment decisions concerning these businesses are centralized and the benefits broadly distributed, we have aggregated these care centers and deemed them to constitute a single reporting unit. We have applied this same aggregation principle to our hospice care centers and personal-care care centers and have also deemed them to be a single reporting unit.
58
AMEDISYS, INC. AND SUBSIDIARIES
NOTES TO THE CONSOLIDATED FINANCIAL STATEMENTS
December 31, 2017
During 2017, we performed a qualitative assessment to determine if it is more likely than not that the fair value of the reporting units are less than its carrying value by evaluating relevant events and circumstances including financial performance, market conditions and share price. Based on this assessment, we did not record any goodwill impairment charges and none of the goodwill associated with our various reporting units was considered at risk of impairment as of October 31, 2017. Since the date of our last annual goodwill impairment test, there have been no material developments, events, changes in operating performance or other circumstances that would cause management to believe it is more likely than not that the fair value of any of our reporting units would be less than its carrying amount.
Intangible assets consist of Certificates of Need, licenses, acquired names and non-compete agreements. We amortize non-compete agreements and acquired names that we do not intend to use in the future on a straight-line basis over their estimated useful lives, which is generally three years for non-compete agreements and up to five years for acquired names. Our indefinite-lived intangible assets are reviewed for impairment annually or more frequently if events occur or circumstances change that would more likely than not reduce the fair value of the intangible asset below its carrying amount. During 2017, we performed a qualitative assessment to determine that our indefinite-lived intangible assets were not impaired. There have been no material developments, events, changes in operating performance or other circumstances that would cause management to believe it is more likely than not that the fair value of any of our intangible assets would be less than its carrying amount.
Debt Issuance Costs
We amortize deferred debt issuance costs related to our long-term obligations over its term through interest expense, unless the debt is extinguished, in which case unamortized balances are immediately expensed. We amortized $0.7 million, $0.7 million and $0.8 million in deferred debt issuance costs in 2017, 2016 and 2015, respectively. As of December 31, 2017 and 2016, we had unamortized debt issuance costs of $1.9 million and $2.7 million, respectively, recorded as long-term obligations, less current portion in our accompanying consolidated balance sheets. The unamortized debt issuance costs of $1.9 million at December 31, 2017, will be amortized over a weighted-average amortization period of 2.7 years.
Fair Value of Financial Instruments
The following details our financial instruments where the carrying value and the fair value differ (amounts in millions):
Fair Value at Reporting Date Using | |||||||||||||||
Financial Instrument | As of December 31, 2017 | Quoted Prices in Active Markets for Identical Items (Level 1) | Significant Other Observable Inputs (Level 2) | Significant Unobservable Inputs (Level 3) | |||||||||||
Long-term obligations | $ | 90.7 | $ | — | $ | 91.8 | $ | — | |||||||
The fair value hierarchy is based on three levels of inputs, of which the first two are considered observable and the last unobservable, that may be used to measure fair value. The three levels of inputs are as follows:
• | Level 1 – Quoted prices in active markets for identical assets and liabilities. |
• | Level 2 – Inputs other than Level 1 that are observable, either directly or indirectly, such as quoted prices for similar assets or liabilities; quoted prices in markets that are not active; or other inputs that are observable or can be corroborated by observable market data for substantially the full term of the assets or liabilities. |
• | Level 3 – Unobservable inputs that are supported by little or no market activity and are significant to the fair value of the assets or liabilities. |
Our deferred compensation plan assets are recorded at fair value and are considered a level 2 measurement. For our other financial instruments, including our cash and cash equivalents, patient accounts receivable, accounts payable, payroll and employee benefits and accrued expenses, we estimate the carrying amounts’ approximate fair value.
Income Taxes
We use the asset and liability approach for measuring deferred tax assets and liabilities based on temporary differences existing at each balance sheet date using currently enacted tax rates. Our deferred tax calculation requires us to make certain estimates about future operations. Deferred tax assets are reduced by a valuation allowance when we believe it is more likely than not that some portion or all of the deferred tax assets will not be realized. The effect of a change in tax rate is recognized as income or expense in the period that includes the enactment date. As of December 31, 2017 and 2016 our net deferred tax assets were $56.1 million and $107.9 million, respectively. Our net deferred tax asset at December 31, 2017 includes a $21.4 million decrease resulting
59
AMEDISYS, INC. AND SUBSIDIARIES
NOTES TO THE CONSOLIDATED FINANCIAL STATEMENTS
December 31, 2017
from the remeasurement of deferred taxes using the reduced U.S. corporate tax rates included in H.R. 1 (Tax Cuts and Jobs Act) enacted on December 22, 2017.
Management regularly assesses the ability to realize deferred tax assets recorded in the Company’s entities based upon the weight of available evidence, including such factors as the recent earnings history and expected future taxable income. In the event future taxable income is below management’s estimates or is generated in tax jurisdictions different than projected, we could be required to increase the valuation allowance for deferred tax assets. This would result in an increase in our effective tax rate.
Share-Based Compensation
We record all share-based compensation as expense in the financial statements measured at the fair value of the award. We recognize compensation cost on a straight-line basis over the requisite service period for each separately vesting portion of the award. We reflect the excess tax benefits related to stock option exercises as financing cash flows. Share-based compensation expense for 2017, 2016 and 2015 was $16.3 million, $16.4 million and $11.8 million, respectively, and the total income tax benefit recognized for these expenses was $6.4 million, $6.4 million and $4.7 million, respectively.
Weighted-Average Shares Outstanding
Net income (loss) per share attributable to Amedisys, Inc. common stockholders, calculated on the treasury stock method, is based on the weighted average number of shares outstanding during the period. The following table sets forth, for the periods indicated, shares used in our computation of the weighted-average shares outstanding, which are used to calculate our basic and diluted net income (loss) attributable to Amedisys, Inc. common stockholders (amounts in thousands):
For the Years Ended December 31, | ||||||||
2017 | 2016 | 2015 | ||||||
Weighted average number of shares outstanding – basic | 33,704 | 33,198 | 33,018 | |||||
Effect of dilutive securities: | ||||||||
Stock options | 281 | 162 | — | |||||
Non-vested stock and stock units | 319 | 381 | — | |||||
Weighted average number of shares outstanding – diluted | 34,304 | 33,741 | 33,018 | |||||
Anti-dilutive securities | 271 | 221 | 922 | |||||
Advertising Costs
We expense advertising costs as incurred. Advertising expense for 2017, 2016 and 2015 was $6.5 million, $7.8 million and $6.9 million, respectively.
Recently Issued Accounting Pronouncements
In May 2014, the Financial Accounting Standards Board (“FASB”) issued Accounting Standards Update (“ASU”) 2014-09, Revenue from Contracts with Customers (Topic 606), which requires an entity to recognize the amount of revenue for which it expects to be entitled for the transfer of promised goods or services to customers. The ASU will replace most existing revenue recognition guidance in U.S. GAAP. In August 2015, the FASB issued ASU 2015-14, Revenue from Contracts with Customers (Topic 606): Deferral of the Effective Date, to defer the effective date of the standard from January 1, 2017, to January 1, 2018, with an option that permits companies to adopt the standard as early as the original effective date. The new ASU reflects the decisions reached by the FASB at its meeting in July 2015. Early application prior to the original effective date is not permitted. The standard permits the use of either the retrospective or cumulative effect transition method. The Company will retrospectively adopt ASU 2014-09 and ASU 2015-14 (collectively, "ASC 606") on January 1, 2018 and as a result, substantially all amounts that were previously presented as provision for doubtful accounts in our consolidated statements of operations will now be considered an implicit price concession resulting in a reduction in net service revenue. Except for this adjustment, the company does not expect a material impact on its consolidated financial statements upon implementation of ASC 606 on January 1, 2018.
In April 2015, the FASB issued ASU 2015-03, Interest—Imputation of Interest (Subtopic 835-30): Simplifying the Presentation of Debt Issuance Costs. The amendments in this ASU required that debt issuance costs related to a recognized debt liability be presented in the balance sheet as a direct deduction from the carrying amount of that debt liability, consistent with debt discounts. The recognition and measurement guidance for debt issuance costs are not affected by the amendments in this ASU. ASU 2015-03 was effective for annual and interim periods beginning on or after December 15, 2015. We adopted this ASU during the three-month period ended March 31, 2016, and applied the change retrospectively for prior period balances of unamortized debt issuance
60
AMEDISYS, INC. AND SUBSIDIARIES
NOTES TO THE CONSOLIDATED FINANCIAL STATEMENTS
December 31, 2017
costs, resulting in a $3.4 million reduction in other assets, net and long-term obligations, less current portion, on our consolidated balance sheet as of December 31, 2015.
In February 2016, the FASB issued ASU 2016-02, Leases (Topic 842), which will require lessees to recognize a lease liability and right-of-use asset for all leases (with the exception of short-term leases) at the commencement date. The ASU is effective for annual and interim periods beginning on or after December 15, 2018. Early adoption is permitted. The standard requires a modified retrospective transition method which requires application of the new guidance for all periods presented. While the Company expects adoption of this standard to lead to a material increase in the assets and liabilities recorded on our balance sheet, we are still evaluating the overall impact on our consolidated financial statements and related disclosures and the effect of the standard on our ongoing financial reporting.
In March 2016, the FASB issued ASU 2016-09, Compensation – Stock Compensation (Topic 718): Improvement to Employee Share-Based Payment Accounting, which simplified the accounting for share-based payment award transactions, including income tax consequences, classification of awards as either equity or liability, and classification on the statement of cash flows. The ASU was effective for annual and interim periods beginning after December 15, 2016. We adopted this ASU effective January 1, 2017, and as a result, we recorded a $0.4 million increase to our non-current deferred tax asset and retained earnings for tax benefits that were not previously recognized under the prior rules. Additionally, on a prospective basis, we recorded excess tax benefits as a discrete item in our income tax provision within our consolidated statements of operations. We recorded excess tax benefits of $3.2 million within our consolidated statements of operations for the year ended December 31, 2017, respectively. Historically these amounts were recorded as additional paid-in capital in our consolidated balance sheet. We also elected to prospectively apply the change to the presentation of cash payments made to taxing authorities on the employees' behalf for shares withheld upon stock vesting on our consolidated statements of cash flows for the year ended December 31, 2017. We have also elected to continue our current policy of estimating forfeitures of stock-based compensation awards at grant date and revising in subsequent periods to reflect actual forfeitures.
In August 2016, the FASB issued ASU 2016-15, Statement of Cash Flows (Topic 230): Classification of Certain Cash Receipts and Cash Payments, which provides specific guidance on eight cash flow classification issues not specifically addressed by U.S. GAAP. The ASU is effective for annual and interim periods beginning after December 15, 2017. Early adoption is permitted. The standard should be applied using a retrospective transition method unless it is impractical to do so for some of the issues. In such case, the amendments for those issues would be applied prospectively as of the earliest date practicable. The Company does not expect an impact on its consolidated financial statements and related disclosures upon implementation of ASU 2016-15 on January 1, 2018.
In January 2017, the FASB issued ASU 2017-01, Business Combinations (Topic 805): Clarifying the Definition of a Business, which provides guidance to assist entities with evaluating whether transactions should be accounted for as acquisitions or disposals of assets or businesses. The ASU is effective for annual and interim periods beginning after December 15, 2017. We intend to implement ASU 2017-01 on January 1, 2018; the impact of implementation on our consolidated financial statements and related disclosures will depend on the facts and circumstances of any specific future transactions.
In January 2017, the FASB issued ASU 2017-04, Intangibles - Goodwill and Other (Topic 350) - Simplifying the Test for Goodwill Impairment, which eliminates the requirement to calculate the implied fair value of goodwill to measure a goodwill impairment charge (Step 2 of the goodwill impairment test). Instead, impairment will be measured using the difference of the carrying amount to the fair value of the reporting unit. The ASU is effective for annual and interim periods beginning after December 15, 2019. Early adoption is permitted. The Company is evaluating the effect that ASU 2017-04 will have on its consolidated financial statements and related disclosures and the effect of the standard on its ongoing financial reporting.
3. ACQUISITIONS
We complete acquisitions from time to time in order to pursue our strategy of increasing our market presence by expanding our service base and enhancing our position in certain geographic areas as a leading provider of home health, hospice and personal care services. The purchase price paid for acquisitions is negotiated through arm’s length transactions, with consideration based on our analysis of, among other things, comparable acquisitions and expected cash flows. Acquisitions are accounted for as purchases and are included in our consolidated financial statements from their respective acquisition dates. Goodwill generated from acquisitions is recognized for the excess of the purchase price over tangible and identifiable intangible assets because of the expected contributions of the acquisitions to our overall corporate strategy. We typically engage outside appraisal firms to assist in the fair value determination of identifiable intangible assets. Preliminary purchase price allocation is adjusted, as necessary, up
61
AMEDISYS, INC. AND SUBSIDIARIES
NOTES TO THE CONSOLIDATED FINANCIAL STATEMENTS
December 31, 2017
to one year after the acquisition closing date if management obtains more information regarding asset valuation and liabilities assumed.
2017 Acquisitions
Personal Care Division
On February 1, 2017, we acquired the assets of Home Staff, L.L.C. which owns and operates three personal-care care centers servicing the state of Massachusetts for a total purchase price of $4.0 million (subject to certain adjustments), of which $0.4 million was placed in a promissory note to be paid over 24 months, subject to any offsets or withholds for indemnification purposes. The purchase price was paid with cash on hand on the date of the transaction. During the three-month period ended March 31, 2017, we recorded goodwill ($3.8 million), other intangibles - non-compete agreements ($0.2 million) and other assets and liabilities, net ($0.5 million) in connection with the acquisition. We expect the entire amount of goodwill recorded for this acquisition to be deductible for income tax purposes over approximately 15 years.
On October 1, 2017, we acquired the assets of Intercity Home Care which owns and operates four personal-care care centers servicing the state of Massachusetts for a total purchase price of $9.6 million (subject to certain adjustments), of which $1.0 million was placed in escrow for indemnification purposes and working capital price adjustments. The purchase price was paid with cash on hand on the date of the transaction. During the three-month period ended December 31, 2017, we recorded goodwill ($9.1 million), other intangibles - non-compete agreements ($0.4 million) and other assets and liabilities, net ($0.1 million) in connection with the acquisition. We expect the entire amount of goodwill recorded for this acquisition to be deductible for income tax purposes over approximately 15 years.
Home Health and Hospice Divisions
On May 1, 2017, we acquired three home health care centers (one in each Illinois, Massachusetts, and Texas) and two hospice care centers (one in each Arizona and Massachusetts) from Tenet Healthcare for a total purchase price of $20.5 million, (subject to certain adjustments). The purchase price was paid with cash on hand on the date of the transaction. Based on our preliminary purchase price allocation, we recorded goodwill ($20.9 million) and other assets and liabilities, net ($0.8 million) in connection with this acquisition during the three-month period ended June 30, 2017. During the three-month period ended December 31, 2017, we received the final report from our outside appraisal firm. As a result, we reduced our preliminary goodwill by $2.8 million and recorded corresponding increases in other intangibles - Medicare licenses ($0.1 million) and other intangibles - acquired names of business ($2.7 million). We expect the entire amount of goodwill recorded for this acquisition to be deductible for income tax purposes over approximately 15 years.
The following table contains unaudited pro forma condensed consolidated statement of operations information for the years ended December 31, 2017 and 2016 assuming that our 2017 acquisitions closed on January 1, 2016 (amounts in millions, except per share data):
2017 | 2016 | ||||||
Net service revenue | $ | 1,557.6 | $ | 1,501.5 | |||
Operating income (loss) | 78.7 | 59.7 | |||||
Net income | 30.8 | 39.0 | |||||
Basic earnings (loss) per share | $ | 0.90 | $ | 1.16 | |||
Diluted earnings (loss) per share | $ | 0.89 | $ | 1.15 | |||
The pro forma information presented above includes adjustments for (i) amortization of identifiable intangible assets and (ii) income tax provision using the Company’s statutory tax rate. This pro forma information is presented for illustrative purposes only and may not be indicative of the results of operations that would have actually occurred. In addition, future results may vary significantly from the results reflected in the pro forma information.
2016 Acquisitions
Personal Care Division
On March 1, 2016, we acquired Associated Home Care ("AHC") for a total purchase price of $27.7 million, net of cash acquired (subject to certain adjustments), of which $0.5 million was placed in escrow for indemnification purposes and working capital price adjustments. The purchase price was paid with cash on hand on the date of the transaction. AHC owned and operated nine personal-care care centers servicing the state of Massachusetts. In connection with the acquisition, we recorded goodwill ($18.5 million), other intangibles ($4.8 million) and other assets and liabilities, net ($4.4 million). We expect the entire amount of goodwill recorded for this acquisition to be deductible for income tax purposes over approximately 15 years.
62
AMEDISYS, INC. AND SUBSIDIARIES
NOTES TO THE CONSOLIDATED FINANCIAL STATEMENTS
December 31, 2017
On September 1, 2016, we acquired the assets of Professional Profiles, Inc. ("PPI") for a total purchase price of $4.4 million, (subject to certain adjustments), of which $0.7 million was placed in a promissory note to be paid over 24 months, subject to any offsets or withholds for indemnification purposes. PPI owned and operated four personal-care care centers servicing the state of Massachusetts. In connection with the acquisition, we recorded goodwill ($4.2 million) and other intangibles – non-compete agreements ($0.2 million). We expect the entire amount of goodwill recorded for this acquisition to be deductible for income tax purposes over approximately 15 years.
Home Health Division
On October 20, 2016, we acquired the assets of a former nonprofit organization in New York for a purchase price of $4.6 million. In connection with the acquisition, we recorded goodwill ($4.4 million) and other intangibles – certificate of need ($0.2 million). We expect the entire amount of goodwill recorded for this acquisition to be deductible for income tax purposes over approximately 15 years.
2015 Acquisitions
Hospice Division
On July 24, 2015, we acquired one hospice care center in Tennessee for a total purchase price of $5.8 million. The purchase price was paid with cash on hand on the date of the transaction. In connection with the acquisition, we recorded goodwill ($5.5 million) and other intangibles ($0.3 million).
Home Health Division
On October 2, 2015, we acquired the assets of a home health care center in Georgia for a total purchase price of $0.3 million. The purchase price was paid with cash on hand on the date of the transaction. In connection with the acquisition, we recorded goodwill ($0.3 million).
On December 31, 2015, we acquired Infinity HomeCare (“Infinity”) for a total purchase price of $63 million, net of cash acquired (subject to certain adjustments), of which $3.2 million was placed in escrow for indemnification purposes and working capital price adjustments. The purchase price was paid with cash on hand on the date of the transaction. Infinity owned and operated 15 home health care centers servicing the state of Florida. In connection with the acquisition, we recorded goodwill ($50.2 million), other intangibles ($10.9 million) and other assets and liabilities, net ($1.9 million). Approximately $47.6 million of the $50.2 million recorded as goodwill is expected to be deductible for income tax purposes over approximately 15 years.
4. GOODWILL AND OTHER INTANGIBLE ASSETS, NET
During 2017, we did not record any goodwill impairment charges as a result of our annual impairment test and none of the goodwill associated with our various reporting units were considered at risk of impairment as of October 31, 2017. Since the date of our last annual goodwill impairment test, there have been no material developments, events, changes in operating performance or other circumstances that would cause management to believe it is more likely than not that the fair value of any of our reporting units would be less than its carrying amount.
During 2017, we recorded a non-cash impairment charge of $1.3 million related to those care centers that were closed or consolidated during 2017 as discussed in Note 12 - Exit and Restructuring Activities.
During the fiscal year 2016, we did not record any goodwill impairment charges as a result of our annual impairment test and none of the goodwill associated with our various reporting units were considered at risk of impairment.
During the fiscal year 2015, we did not record any goodwill impairment charges as a result of our annual impairment test and none of the goodwill associated with our various reporting units were considered at risk of impairment.
63
AMEDISYS, INC. AND SUBSIDIARIES
NOTES TO THE CONSOLIDATED FINANCIAL STATEMENTS
December 31, 2017
The following table summarizes the activity related to our goodwill for 2017, 2016 and 2015 (amounts in millions):
Goodwill | |||||||||||||||
Home Health | Hospice | Personal Care | Total | ||||||||||||
Balances at December 31, 2014 | $ | 16.5 | $ | 189.1 | $ | — | $ | 205.6 | |||||||
Additions | 50.6 | 5.5 | — | 56.1 | |||||||||||
Balances at December 31, 2015 | 67.1 | 194.6 | — | 261.7 | |||||||||||
Additions | 4.4 | — | 22.7 | 27.1 | |||||||||||
Adjustments related to acquisitions (1) | 0.1 | — | — | 0.1 | |||||||||||
Balances at December 31, 2016 | 71.6 | 194.6 | 22.7 | 288.9 | |||||||||||
Additions | 13.4 | 4.7 | 12.9 | 31.0 | |||||||||||
Balances at December 31, 2017 | $ | 85.0 | $ | 199.3 | $ | 35.6 | $ | 319.9 | |||||||
(1) | During 2016, we adjusted goodwill by $0.1 million as a result of our completion of the purchase price accounting for our 2015 acquisition of Infinity. |
The following table summarizes the activity related to our other intangible assets, net for 2017, 2016 and 2015 (amounts in millions):
Other Intangible Assets, Net | |||||||||||||||
Certificates of Need and Licenses | Acquired Names of Business | Non-Compete Agreements (2) | Total | ||||||||||||
Balances at December 31, 2014 | $ | 23.1 | $ | 10.1 | $ | — | $ | 33.2 | |||||||
Additions | 1.1 | 4.1 | 5.9 | 11.1 | |||||||||||
Write-off | (0.3 | ) | — | — | (0.3 | ) | |||||||||
Balances at December 31, 2015 | 23.9 | 14.2 | 5.9 | 44.0 | |||||||||||
Additions | 0.2 | 3.5 | 1.5 | 5.2 | |||||||||||
Amortization | — | — | (2.5 | ) | (2.5 | ) | |||||||||
Balances at December 31, 2016 | 24.1 | 17.7 | 4.9 | 46.7 | |||||||||||
Additions | 0.1 | 2.7 | 0.6 | 3.4 | |||||||||||
Write-off (1) | (0.5 | ) | (0.8 | ) | — | (1.3 | ) | ||||||||
Amortization | — | — | (2.7 | ) | (2.7 | ) | |||||||||
Balances at December 31, 2017 | $ | 23.7 | $ | 19.6 | $ | 2.8 | $ | 46.1 | |||||||
(1) | Write-off of intangible assets related to the closure and consolidation of care centers as discussed in Note 12 - Exit and Restructuring Activities. |
(2) | The weighted average amortization period of our non-compete agreements is 1.3 years. |
See Note 3 – Acquisitions for further details on additions to goodwill and other intangible assets, net.
The estimated aggregate amortization expense related to intangible assets for each of the five succeeding years is as follows (amounts in millions):
2018 | $ | 2.4 | |
2019 | 0.3 | ||
2020 | 0.1 | ||
2021 | — | ||
2022 | — | ||
$ | 2.8 | ||
64
5. DETAILS OF CERTAIN BALANCE SHEET ACCOUNTS
Additional information regarding certain balance sheet accounts is presented below (amounts in millions):
As of December 31, | |||||||
2017 | 2016 | ||||||
Other current assets: | |||||||
Payroll tax escrow | $ | 7.2 | $ | 6.7 | |||
Income tax receivable | 3.4 | 1.3 | |||||
Due from joint ventures | 2.0 | 1.7 | |||||
Other | 3.7 | 1.6 | |||||
$ | 16.3 | $ | 11.3 | ||||
Other assets: | |||||||
Workers’ compensation deposits | $ | 0.4 | $ | 0.4 | |||
Health insurance deposits | 0.5 | 0.5 | |||||
Other miscellaneous deposits | 0.9 | 0.9 | |||||
Indemnity receivable | 17.0 | 4.9 | |||||
Investments | 26.4 | 27.8 | |||||
Other | 3.9 | 4.0 | |||||
$ | 49.1 | $ | 38.5 | ||||
Accrued expenses: | |||||||
Health insurance | $ | 14.1 | $ | 10.6 | |||
Workers’ compensation | 29.3 | 26.8 | |||||
Florida ZPIC audit, gross liability | 17.4 | — | |||||
Legal and other settlements | 6.4 | 5.7 | |||||
Lease liability | 0.9 | 0.4 | |||||
Charity care | 1.5 | 1.4 | |||||
Estimated Medicare cap liability | 0.9 | 0.8 | |||||
Hospice cost of revenue | 9.1 | 7.2 | |||||
Patient liability | 5.3 | 4.3 | |||||
Other | 4.2 | 6.1 | |||||
$ | 89.1 | $ | 63.3 | ||||
Other long-term obligations: | |||||||
Reserve for uncertain tax positions | $ | — | $ | 0.3 | |||
Deferred compensation plan liability | 1.9 | 1.8 | |||||
Other | 1.9 | 1.6 | |||||
$ | 3.8 | $ | 3.7 | ||||
65
AMEDISYS, INC. AND SUBSIDIARIES
NOTES TO THE CONSOLIDATED FINANCIAL STATEMENTS
December 31, 2017
6. LONG-TERM OBLIGATIONS
Long-term debt consisted of the following for the periods indicated (amounts in millions):
As of December 31, | |||||||
2017 | 2016 | ||||||
$100.0 million Term Loan; principal payments plus accrued interest payable quarterly; interest rate at ABR Rate plus applicable percentage or Eurodollar Rate plus the applicable percentage (3.57% at December 31, 2017); due August 28, 2020 | $ | 90.0 | $ | 95.0 | |||
$200.0 million Revolving Credit Facility; interest only quarterly payments; interest rate at ABR Rate plus applicable percentage or Eurodollar Rate plus the applicable percentage; due August 28, 2020 | — | — | |||||
Promissory notes | 0.7 | 0.7 | |||||
Principal amount of long-term obligations | 90.7 | 95.7 | |||||
Deferred debt issuance costs | (1.9 | ) | (2.7 | ) | |||
88.8 | 93.0 | ||||||
Current portion of long-term obligations | (10.6 | ) | (5.2 | ) | |||
Total | $ | 78.2 | $ | 87.8 | |||
Maturities of debt as of December 31, 2017 are as follows (amounts in millions):
Long-term obligations | |||
2018 | $ | 10.6 | |
2019 | 10.1 | ||
2020 | 70.0 | ||
2021 | — | ||
2022 | — | ||
$ | 90.7 | ||
Credit Agreement
On August 28, 2015, we entered into a Credit Agreement that provides for senior secured facilities in an initial aggregate principal amount of up to $300 million (the “Credit Facilities”).
The Credit Facilities are comprised of (a) a term loan facility in an initial aggregate principal amount of $100 million (the “Term Loan”); and (b) a revolving credit facility in an initial aggregate principal amount of up to $200 million (the “Revolving Credit Facility”). The Revolving Credit Facility provides for and includes within its $200 million limit a $25 million swingline facility and commitments for up to $50 million in letters of credit. Upon lender approval, we may increase the aggregate loan amount under the Credit Facilities by a maximum amount of $150 million.
The net proceeds of the Term Loan and existing cash on hand were used to pay off (i) our existing term loan under our prior Credit Agreement, dated as of October 22, 2012, as amended (the “Prior Credit Agreement”) with a principal balance of $27 million and (ii) our existing term loan under our prior Second Lien Credit Agreement dated July 28, 2014 (the “Second Lien Credit Agreement”), with a principal balance of $70 million. The final maturity of the Term Loan is August 28, 2020. The Term Loan began amortizing on March 31, 2016 and will continue amortizing over 10 quarterly installments (eight remaining quarterly installments of $2.5 million beginning March 31, 2018, followed by two quarterly installments of $3.1 million beginning March 31, 2020, subject to adjustment for prepayments), with the remaining balance due upon maturity.
The Revolving Credit Facility may be used to provide ongoing working capital and for general corporate purposes of the Company and our subsidiaries, including permitted acquisitions, as defined in the Credit Agreement. The final maturity of the Revolving Credit Facility is August 28, 2020 and will be payable in full at that time.
The interest rate in connection with the Credit Facilities shall be selected from the following by us: (i) the Base Rate plus the Applicable Rate or (ii) the Eurodollar Rate plus the Applicable Rate. The “Base Rate” means a fluctuating rate per annum equal to the highest of (a) the federal funds rate plus 0.50% per annum, (b) the prime rate of interest established by the Administrative Agent, and (c) the Eurodollar Rate for an interest period of one month plus 1% per annum. The “Eurodollar Rate” means the rate at which Eurodollar deposits in the London interbank market for an interest period of one, two, three or six months (as selected by us) are quoted. The “Applicable Rate” is based on the consolidated leverage ratio and is presented in the table below. As of
66
AMEDISYS, INC. AND SUBSIDIARIES
NOTES TO THE CONSOLIDATED FINANCIAL STATEMENTS
December 31, 2017
December 31, 2017, the Applicable Rate is 1.00% per annum for Base Rate Loans and 2.00% per annum for Eurodollar Rate Loans. We are also subject to a commitment fee and letter of credit fee under the terms of the Credit Facilities, as presented in the table below.
Consolidated Leverage Ratio | Margin for ABR Loans | Margin for Eurodollar Loans | Commitment Fee | Letter of Credit Fee | ||||||||
≥ 2.75 to 1.0 | 2.00 | % | 3.00 | % | 0.40 | % | 3.00 | % | ||||
< 2.75 to 1.0 but ≥ 1.75 to 1.0 | 1.50 | % | 2.50 | % | 0.35 | % | 2.50 | % | ||||
< 1.75 to 1.0 but ≥ 0.75 to 1.0 | 1.00 | % | 2.00 | % | 0.30 | % | 2.00 | % | ||||
< 0.75 to 1.0 | 0.50 | % | 1.50 | % | 0.25 | % | 1.50 | % | ||||
Our weighted average interest rate for our $100.0 million Term Loan, under our Credit Agreement, was 3.1% and 2.5% for the period ended December 31, 2017 and December 31, 2016, respectively. Our weighted average interest rate for our $200.0 million Revolving Credit Facility was 3.5% for the period ended December 31, 2016.
As of December 31, 2017, our availability under our $200.0 million Revolving Credit Facility was $167.3 million as we had $32.7 million outstanding in letters of credit.
The Credit Agreement requires maintenance of two financial covenants: (i) a consolidated leverage ratio of funded indebtedness to EBITDA, as defined in the Credit Agreement, and (ii) a consolidated fixed charge coverage ratio of EBITDA plus rent expense (less cash taxes less capital expenditures) to scheduled debt repayments plus interest expense plus rent expense, all as defined in the Credit Agreement. Each of these covenants is calculated over rolling four-quarter periods and also is subject to certain exceptions and baskets. As of December 31, 2017, our consolidated leverage ratio was 0.9 and our consolidated fixed charge coverage ratio was 4.4 and we are in compliance with the Credit Agreement. The Credit Agreement also contains customary covenants, including, but not limited to, restrictions on: incurrence of liens; incurrence of additional debt; sales of assets and other fundamental corporate changes; investments; and declarations of dividends. These covenants contain customary exclusions and baskets.
The Credit Facilities are guaranteed by substantially all of our wholly-owned direct and indirect subsidiaries. The Credit Agreement requires at all times that we (i) provide guarantees from wholly-owned subsidiaries that in the aggregate represent not less than 95% of our consolidated net revenues and adjusted EBITDA from all wholly-owned subsidiaries and (ii) provide guarantees from subsidiaries that in the aggregate represent not less than 70% of consolidated adjusted EBITDA, subject to certain exceptions.
In connection with entering into the Credit Agreement, we entered into (i) a Security Agreement with the Administrative Agent dated August 28, 2015 and (ii) a Pledge Agreement with the Administrative Agent dated as of August 28, 2015 for the purpose of securing the payment of our obligations under the Credit Agreement. Pursuant to the Security Agreement and the Pledge Agreement, as of the effective date of the Credit Agreement, our obligations under the Credit Agreement are secured by (i) the grant of a first lien security interest in the non-real estate assets of substantially all of our direct and indirect, wholly-owned subsidiaries (subject to exceptions) and (ii) the pledge of the equity interests in (a) substantially all of our direct and indirect, wholly-owned corporate, limited liability company and limited partnership subsidiaries and (b) those joint ventures which constitute subsidiaries under the Credit Agreement (subject, in the case of the Pledge Agreement, to exceptions).
In connection with our entry into the Credit Agreement, on August 28, 2015, each of the Prior Credit Agreement and the Second Lien Credit Agreement were terminated. The Company paid a call premium of $700,000 associated with the termination of the Second Lien Credit Agreement and the voluntary prepayment of the amounts owed thereunder as of August 28, 2015, and expensed $2.5 million in deferred debt issuance costs during the three-month period ended September 30, 2015. Also in connection with our entry into the Credit Agreement, we recorded $2.4 million in deferred debt issuance costs as other assets in our consolidated balance sheet during 2015 which was reclassified to long-term obligations, less current portion during 2016 in accordance with ASU 2015-03.
Promissory Notes
Our promissory notes outstanding of $0.7 million, issued in conjunction with acquisitions, bear an interest rate in a range of 2.6% to 2.9%.
67
AMEDISYS, INC. AND SUBSIDIARIES
NOTES TO THE CONSOLIDATED FINANCIAL STATEMENTS
December 31, 2017
7. INCOME TAXES
Income taxes attributable to continuing operations consist of the following (amounts in millions):
For the Years Ended December 31, | |||||||||||
2017 | 2016 | 2015 | |||||||||
Current income tax expense/(benefit): | |||||||||||
Federal | $ | (2.0 | ) | $ | (0.5 | ) | $ | 2.2 | |||
State and local | (0.1 | ) | (0.1 | ) | 0.5 | ||||||
(2.1 | ) | (0.6 | ) | 2.7 | |||||||
Deferred income tax expense/(benefit): | |||||||||||
Federal | 51.2 | 22.1 | (0.5 | ) | |||||||
State and local | 1.0 | 2.4 | (0.1 | ) | |||||||
Foreign | — | — | (0.1 | ) | |||||||
52.2 | 24.5 | (0.7 | ) | ||||||||
Income tax expense | $ | 50.1 | $ | 23.9 | $ | 2.0 | |||||
Total income tax expense for the years ended December 31, 2017, 2016 and 2015 was allocated as follows (amounts in millions):
For the Years Ended December 31, | |||||||||||
2017 | 2016 | 2015 | |||||||||
Income from continuing operations | $ | 50.1 | $ | 23.9 | $ | 2.0 | |||||
Interest expense | — | (0.1 | ) | 0.2 | |||||||
Goodwill | — | — | (0.1 | ) | |||||||
Stockholders’ equity | (0.3 | ) | (7.2 | ) | (2.1 | ) | |||||
$ | 49.8 | $ | 16.6 | $ | — | ||||||
A reconciliation of significant differences between the reported amount of income tax expense and the expected amount of income tax expense that would result from applying the U.S. federal statutory income tax rate of 35 percent to income before taxes is as follows:
For the Years Ended December 31, | ||||||||
2017 | 2016 | 2015 (1) | ||||||
Income tax expense at U.S. federal statutory rate | 35.0 | % | 35.0 | % | 35.0 | % | ||
State and local income taxes, net of federal income tax benefit | 3.8 | 4.8 | (7.1 | ) | ||||
Excess tax benefits from share-based compensation (2) | (3.5 | ) | — | — | ||||
Valuation allowance | 0.2 | 0.1 | 79.1 | |||||
Tax credits | (0.8 | ) | (0.6 | ) | 136.0 | |||
Tax rate change (3) | 26.5 | — | — | |||||
Uncertain tax positions | (0.3 | ) | (1.0 | ) | (230.3 | ) | ||
Other items, net (4) | 1.1 | 0.6 | (663.3 | ) | ||||
Income tax expense/(benefit) | 62.0 | % | 38.9 | % | (650.6 | )% | ||
(1) | The information provided for the year ended December 31, 2015 does not provide a meaningful reconciliation of the effective tax rate or comparable to other periods. The effective tax rate for the year is influenced by the relationship of the amount of “effective tax rate drivers” (i.e. non-deductible expenses, non-taxable income, tax credits, valuation allowance, uncertain tax positions, etc.) to income or loss before taxes. A significant asset impairment was recorded in the first quarter of 2015, resulting in a scenario where the company’s loss before tax for the year was near zero. Consequently, for 2015, the relationship between the “effective tax rate drivers” and loss before taxes is distorted. |
(2) | In March 2016, the FASB issued ASU 2016-09, Compensation - Stock Compensation (Topic 718): Improvements to Employee Share-Based Payment Accounting, which simplified the accounting for share-based payment award transactions, including income tax consequences. The new guidelines required excess tax benefits and tax deficiencies to be recorded in the income statement when stock awards vest or are settled. As a result, the Company recognized a $2.9 million federal income tax benefit in the consolidated statement of operations (rather than additional paid-in capital) for the year ended December 31, 2017 from share-based compensation excess tax benefits. |
68
AMEDISYS, INC. AND SUBSIDIARIES
NOTES TO THE CONSOLIDATED FINANCIAL STATEMENTS
December 31, 2017
(3) | On December 22, 2017, H.R. 1 (Tax Cuts and Jobs Act), which reduces the U.S. federal corporate tax rate to 21% from 35%, effective January 1, 2018 was enacted. According to ASC 740, Income Taxes, deferred tax assets and liabilities are remeasured to reflect the effects of enacted changes in tax rates at the date of enactment, even though the tax rate changes are not effective until a future period. The Company's remeasurement of its deferred tax assets and liabilities to reflect the enacted reduced tax rate resulted in a $21.4 million deferred income tax expense during the three-month period ended December 31, 2017. |
(4) | Includes various items such as, non-deductible expenses, non-taxable income and return-to-accrual adjustments. |
As of December 31, 2017 and 2016, the Company had income taxes receivable of $3.4 million and $1.3 million, respectively, included in other current assets. The income tax receivable at December 31, 2017 includes a $2.3 million Alternative Minimum Tax (AMT) Credit carryforward. The Tax Cuts and Jobs Act repeals the AMT for corporations and makes it refundable in years 2018 through 2020. Since the AMT credit carryforward is refundable from 2018 through 2020 and the company plans to utilize its AMT credit carryforward to reduce taxable income in 2018, the AMT credit carryforward was reclassified from deferred tax assets to other current assets as of December 31, 2017.
Deferred tax assets (liabilities) consist of the following components (amounts in millions):
As of December 31, | |||||||
2017 (1) | 2016 | ||||||
Deferred tax assets: | |||||||
Allowance for doubtful accounts | $ | 5.3 | $ | 6.9 | |||
Accrued payroll & employee benefits | 9.0 | 11.4 | |||||
Workers’ compensation | 7.9 | 10.9 | |||||
Amortization of intangible assets | 26.0 | 56.3 | |||||
Share-based compensation | 6.1 | 7.8 | |||||
Net operating loss carryforwards (2) | 20.1 | 44.2 | |||||
Tax credit carryforwards (3) | 4.6 | 4.8 | |||||
Other | 2.4 | 1.1 | |||||
Gross deferred tax assets | 81.4 | 143.4 | |||||
Less: valuation allowance | (0.7 | ) | (0.4 | ) | |||
Net deferred tax assets | 80.7 | 143.0 | |||||
Deferred tax (liabilities): | |||||||
Property and equipment | (4.0 | ) | (7.8 | ) | |||
Deferred revenue | (18.0 | ) | (23.2 | ) | |||
Investment in partnerships | (2.1 | ) | (3.2 | ) | |||
Other liabilities | (0.5 | ) | (0.9 | ) | |||
Gross deferred tax liabilities | (24.6 | ) | (35.1 | ) | |||
Net deferred tax assets (liabilities) | $ | 56.1 | $ | 107.9 | |||
(1) | On December 22, 2017, H.R. 1 (Tax Cuts and Jobs Act), which reduces the U.S. federal corporate tax rate to 21% from 35%, effective January 1, 2018, was enacted. According to ASC 740, Income Taxes, deferred tax assets and liabilities are remeasured to reflect the effects of enacted changes in tax rates at the date of enactment, even though the tax rate changes are not effective until a future period. The Company's remeasurement of its deferred tax assets and liabilities to reflect the enacted reduced tax rate resulted in a $21.4 million deferred income tax expense during the three-month period ended December 31, 2017. |
(2) | The net operating loss (“NOL”) carry forwards in the income tax returns include unrecognized tax benefits resulting from uncertain tax positions. Accordingly, the deferred tax assets recognized for the NOL carry forwards, as of December 31, 2017 and 2016, are presented net of unrecognized tax benefits of $2.1 million and $3.1 million, respectively. |
(3) | The tax credit carry forwards in the income tax returns include unrecognized tax benefits resulting from uncertain tax positions. Accordingly, the deferred tax assets recognized for the tax credit carry forwards are presented net of unrecognized tax benefits of $0.7 million for each of the years ended December 31, 2017 and 2016. |
As of December 31, 2017, we have U.S. net operating loss (“NOL”) carry forwards of $52.6 million that are available to reduce future taxable income and begin to expire in 2034. In addition, we have research and development tax credits and employment tax credits of $1.9 million and $0.4 million, respectively, available to reduce future U.S. federal income taxes which begin to expire in 2032.
69
AMEDISYS, INC. AND SUBSIDIARIES
NOTES TO THE CONSOLIDATED FINANCIAL STATEMENTS
December 31, 2017
As of December 31, 2017, we have state NOL carry forwards of $223.0 million that are available to reduce future taxable income. In addition, we have $3.8 million of various state tax credits available to reduce future taxable income. The state NOL and tax credit carry forwards begin to expire at various times.
The valuation allowance for deferred tax assets as of December 31, 2017 and 2016 was $0.7 million and $0.4 million, respectively. The net change in the total valuation allowance for the year ended December 31, 2017 and December 31, 2016 was an increase of $0.3 million and $0.1 million, respectively. The valuation allowance is primarily related to certain state NOL and state tax credit carry forwards.
In assessing the realizability of deferred tax assets, management considers whether it is more likely than not that some portion or all of the deferred tax assets will not be realized. The ultimate realization of deferred tax assets is dependent upon the generation of future taxable income in those jurisdictions during the periods in which those temporary differences become deductible. Management considers the scheduled reversal of deferred tax liabilities (including the impact of available carry back and carry forward periods), projected future taxable income, and tax-planning strategies in making this assessment. In order to fully realize the deferred tax assets, the Company will need to generate future taxable income before the expiration of the carry forwards governed by the tax code. Based on the current level of pretax earnings, the Company will generate the minimum amount of future taxable income needed to support the realization of the deferred tax assets. As a result, as of December 31, 2017, management believes that it is more likely than not that we will realize the benefits of these deferred tax assets, net of the existing valuation allowances. The amount of the deferred tax asset considered realizable, however, could be reduced in the near term if estimates of future taxable income during the carry forward period are reduced.
Uncertain Tax Positions
We account for uncertain tax positions in accordance with the authoritative guidance for uncertain tax positions. A reconciliation of the beginning and ending amount of unrecognized tax benefits is as follows (amounts in millions):
For the Years Ended December 31, | |||||||
2017 | 2016 | ||||||
Balance at beginning of period | $ | 4.1 | $ | 4.7 | |||
Additions for tax positions related to current year | — | — | |||||
Additions for tax positions related to prior year | — | — | |||||
Reductions for tax positions related to prior years | — | — | |||||
Lapse of statute of limitations | (0.3 | ) | (0.6 | ) | |||
Change in statutory tax rate | (1.1 | ) | — | ||||
Settlements | — | — | |||||
Balance at end of period | $ | 2.7 | $ | 4.1 | |||
The Company's remeasurement of its deferred tax assets and liabilities to reflect the enacted reduced tax rate as a result of the recent tax reform resulted in a $1.1 million reduction in its uncertain tax positions recorded in net deferred tax assets at December 31, 2017. As of December 31, 2017, there is $2.7 million of unrecognized tax benefits recorded in deferred income taxes within the consolidated balance sheet that, if recognized in future periods, would impact our effective tax rate.
During the years ended December 31, 2017 and 2016, we recognized less than $(0.1) million and $(0.1) million of interest and penalties, respectively, as components of penalties or interest expense in connection with our reserve for uncertain tax positions. Interest and penalties, related to uncertain tax positions, included in the consolidated balance sheet at December 31, 2017 and 2016 were less than $0.1 million.
We are subject to income taxes in the U.S. and in many of the 50 individual states, with significant operations in Louisiana, Alabama, Georgia, Massachusetts and Tennessee. We are open to examination in the U.S. and in various individual states for tax years ended December 31, 2014 through December 31, 2017. We are also open to examination in various states for the years ended 2001 – 2017 resulting from net operating losses generated and available for carry forward from those years.
8. CAPITAL STOCK AND SHARE-BASED COMPENSATION
We are authorized by our Certificate of Incorporation to issue 60,000,000 shares of common stock, $0.001 par value and 5,000,000 shares of preferred stock, $0.001 par value. As of December 31, 2017, there were 35,747,134 and 33,964,767 shares of common stock issued and outstanding, respectively, and no shares of preferred stock issued or outstanding. Our Board of Directors is
70
AMEDISYS, INC. AND SUBSIDIARIES
NOTES TO THE CONSOLIDATED FINANCIAL STATEMENTS
December 31, 2017
authorized to fix the dividend rights and terms, conversion and voting rights, redemption rights and other privileges and restrictions applicable to our preferred stock.
Share-Based Awards
Our 2008 Omnibus Incentive Compensation Plan (the “Plan”) authorizes the grant of various types of equity-based awards, such as stock awards, restricted stock units, stock appreciation rights and stock options to eligible participants, which include all of our employees and all employees of our 50% or more owned subsidiaries, our non-employee directors and certain consultants. The vesting terms of the awards may be tied to continued employment (or, for our non-employee directors, continued service on the Board of Directors) and/or achievement of certain pre-determined performance goals. We refer to stock awards subject to service-based vesting conditions as “non-vested stock” and restricted stock units subject to service-based or a combination of service-based and performance-based vesting conditions as “non-vested stock units.” The Plan is administered by the Compensation Committee of our Board of Directors, which determines, within the provisions of the Plan, those eligible employees to whom, and the times at which, awards shall be granted. The Compensation Committee, in its discretion, may delegate its authority and duties under the Plan to specified officers; however, only the Compensation Committee may approve the terms of awards to our executive officers.
Equity-based awards may be granted for a number of shares not to exceed, in the aggregate, approximately 5.5 million shares of common stock, and we had approximately 1.2 million shares available at December 31, 2017. The price per share for stock options shall be of no less than the greater of (a) 100% of the fair value of a share of common stock on the date the option is granted or (b) the aggregate par value of the shares of our common stock on the date the option is granted. If a stock option is granted to any owner of 10% or more of our total combined voting power of us and our subsidiaries, the price is to be at least 110% of the fair value of a share of our common stock on the date the award is granted. Each equity-based award vests ratably over a 12 month to six year period, with the exception of those issued under contractual arrangements that specify otherwise, that may be exercised during a period as determined by our Compensation Committee or as otherwise approved by our Compensation Committee. The contractual terms of stock options exercised shall not exceed ten years from the date such option is granted.
Employee Stock Purchase Plan (“ESPP”)
We have a plan whereby our eligible employees may purchase our common stock at 85% of the market price at the time of purchase. On June 7, 2012, our stockholders ratified an amendment adopted by our Board of Directors to increase the total number of shares of our common stock authorized for the issuance under our ESPP from 2,500,000 shares to 4,500,000 shares, and as of December 31, 2017, there were 1,410,511 shares available for future issuance. The following is a detail of the purchases that were made or pending Board of Director approval under the plan:
Employee Stock Purchase Plan Period | Shares Issued | Price | ||||
2015 and Prior | 2,977,712 | $ | 14.20 | |||
January 1, 2016 to March 31, 2016 | 13,850 | 41.09 | ||||
April 1, 2016 to June 30, 2016 | 14,236 | 42.91 | ||||
July 1, 2016 to September 30, 2016 | 16,520 | 40.32 | ||||
October 1, 2016 to December 31, 2016 | 16,882 | 36.24 | ||||
January 1, 2017 to March 31, 2017 | 13,244 | 43.43 | ||||
April 1, 2017 to June 30, 2017 | 11,446 | 53.39 | ||||
July 1, 2017 to September 30, 2017 | 12,276 | 47.57 | ||||
October 1, 2017 to December 31, 2017 | 13,323 | 44.80 | ||||
3,089,489 | ||||||
ESPP expense included in general and administrative expense in our accompanying consolidated statements of operations was 0.4 million for each of 2017, 2016 and 2015, respectively.
Stock Options
We use the Black-Scholes option pricing model to estimate the fair value of our stock options. There were 308,292, 268,538 and 590,647 options granted during 2017, 2016 and 2015, respectively. Stock option compensation expense included in general and administrative expense in our accompanying consolidated statements of operations was $5.6 million, $6.3 million and $3.8 million for 2017, 2016 and 2015, respectively.
The fair value of the 2017 awards were estimated using the following assumptions:
71
AMEDISYS, INC. AND SUBSIDIARIES
NOTES TO THE CONSOLIDATED FINANCIAL STATEMENTS
December 31, 2017
Risk Free Rate | 1.99% - 2.16% |
Expected Volatility | 50.18% - 51.81% |
Expected Term | 5.78 - 6.25 years |
Weighted Average Fair Value | $28.02 |
We used the simplified method to estimate the expected term for the stock options granted during 2017.
The following table presents our stock option activity for 2017:
Number of Shares | Weighted Average Exercise Price | Weighted Average Contractual Life (Years) | ||||||
Outstanding options at January 1, 2017 | 1,008,157 | $ | 31.54 | 8.42 | ||||
Granted | 308,292 | 43.13 | ||||||
Exercised | (144,206 | ) | 31.58 | |||||
Canceled, forfeited or expired | (262,513 | ) | 39.18 | |||||
Outstanding options at December 31, 2017 | 909,730 | $ | 33.25 | 7.62 | ||||
Exercisable options at December 31, 2017 | 381,932 | $ | 28.73 | 7.20 | ||||
The aggregate intrinsic value of our outstanding options and exercisable options at December 31, 2017 was $18.1 million and $9.2 million, respectively. Total intrinsic value of options exercised was $3.9 million and $0.2 million for 2017 and 2015, respectively; there were no options exercised during 2016.
The following table presents our non-vested stock option award activity for 2017:
Number of Shares | Weighted Average Exercise Price | |||||
Non-vested stock options at January 1, 2017 | 726,699 | $ | 32.58 | |||
Granted | 308,292 | 43.13 | ||||
Vested | (260,814 | ) | 30.54 | |||
Forfeited | (246,379 | ) | 39.48 | |||
Non-vested stock options at December 31, 2017 | 527,798 | $ | 36.52 | |||
At December 31, 2017, there was $5.8 million of unrecognized compensation cost related to stock options that we expect to be recognized over a weighted-average period of 1.9 years.
Non-Vested Stock
We issue shares of non-vested stock with vesting terms ranging from one to six years. The compensation expense is determined based on the market price of our common stock at the date of grant applied to the total number of shares that are anticipated to fully vest. Non-vested stock compensation expense included in general and administrative expenses in our accompanying consolidated statements of operations was $1.7 million, $2.3 million and $5.0 million for 2017, 2016 and 2015, respectively.
The following table presents our non-vested stock award activity for 2017:
Number of Shares | Weighted Average Grant Date Fair Value | |||||
Non-vested stock at January 1, 2017 | 209,378 | $ | 22.20 | |||
Granted | 19,152 | 62.67 | ||||
Vested | (170,292 | ) | 21.61 | |||
Canceled, forfeited or expired | (11,240 | ) | 19.51 | |||
Non-vested stock at December 31, 2017 | 46,998 | $ | 41.48 | |||
The weighted average grant date fair value of non-vested stock granted was $62.67, $50.55 and $28.48 in 2017, 2016 and 2015, respectively.
72
AMEDISYS, INC. AND SUBSIDIARIES
NOTES TO THE CONSOLIDATED FINANCIAL STATEMENTS
December 31, 2017
At December 31, 2017, there was $0.7 million of unrecognized compensation cost related to non-vested stock award payments that we expect to be recognized over a weighted average period of 0.5 years.
Non-Vested Stock Units
We issue non-vested stock unit awards that are service-based, performance-based or a combination of both with vesting terms ranging from one to six years. Based on the terms and conditions of these awards, we determine if the awards should be recorded as either equity or liability instruments. The compensation expense is determined based on the market price of our common stock at the date of grant, applied to the total number of units that are anticipated to vest, unless the award specifies differently. We account for such awards similar to our non-vested stock awards; however, no shares of stock are issued to the recipient until the stock unit awards have vested and after the pre-determined delivery date has occurred.
Non-Vested Stock Units – Service-Based
Service-based non-vested stock unit compensation expense included in general and administrative expenses in our accompanying consolidated statements of operations was $3.6 million, $3.6 million and $1.0 million for 2017, 2016 and 2015, respectively.
The following table presents our service-based non-vested stock units activity for 2017:
Number of Shares | Weighted Average Grant Date Fair Value | |||||
Non-vested stock units at January 1, 2017 | 249,429 | $ | 42.05 | |||
Granted | 126,447 | 53.79 | ||||
Vested | (57,106 | ) | 42.41 | |||
Canceled, forfeited or expired | (83,928 | ) | 44.00 | |||
Non-vested stock units at December 31, 2017 | 234,842 | $ | 47.58 | |||
The weighted average grant date fair value of service-based non-vested stock units granted was $53.79, $45.60 and $37.98 in 2017, 2016 and 2015, respectively.
At December 31, 2017, there was $6.7 million of unrecognized compensation cost related to our service-based non-vested stock units that we expect to be recognized over a weighted average period of 2.1 years.
Non-Vested Stock Units – Service-Based and Performance-Based Awards
During 2017, we awarded performance-based awards to certain employees. The target level established by the award, which is based on the Company’s 2017 adjusted earnings before interest, taxes and depreciation (“EBITDA”), provided for the recipients to receive 194,109 non-vested stock units if the target was achieved. The target number of shares to be potentially awarded has been reduced by forfeitures as indicated in the table below. Performance-based non-vested stock units compensation expense included in general and administrative expenses in our consolidated statements of operations was $5.0 million, $3.7 million and $1.3 million for 2017, 2016 and 2015, respectively.
The following table presents our performance-based non-vested stock units activity for 2017:
Number of Shares | Weighted Average Grant Date Fair Value | |||||
Non-vested stock units at January 1, 2017 | 224,857 | $ | 45.08 | |||
Granted | 194,109 | 52.99 | ||||
Vested | (73,998 | ) | 45.23 | |||
Canceled, forfeited or expired | (92,020 | ) | 47.50 | |||
Non-vested stock units at December 31, 2017 | 252,948 | $ | 51.15 | |||
The weighted average grant date fair value of performance-based non-vested stock units granted was $52.99, $46.29 and $39.54 in 2017, 2016 and 2015, respectively.
At December 31, 2017, there were $7.7 million in unrecognized compensation costs related to our performance-based non-vested stock units that we expect to be recognized over a weighted average period of 2.0 years.
73
AMEDISYS, INC. AND SUBSIDIARIES
NOTES TO THE CONSOLIDATED FINANCIAL STATEMENTS
December 31, 2017
9. COMMITMENTS AND CONTINGENCIES
Legal Proceedings – Ongoing
We are involved in the following legal actions:
Subpoena Duces Tecum Issued by the U.S. Department of Justice
On May 21, 2015, we received a Subpoena Duces Tecum (“Subpoena”) issued by the U.S. Department of Justice. The Subpoena requests the delivery of information regarding 53 identified hospice patients to the United States Attorney’s Office for the District of Massachusetts. It also requests the delivery of documents relating to our hospice clinical and business operations and related compliance activities. The Subpoena generally covers the period from January 1, 2011, through May 21, 2015. We are fully cooperating with the U.S. Department of Justice with respect to this investigation. Based on the information currently available to us, we cannot predict the timing or outcome of this investigation or reasonably estimate the amount or range of potential losses, if any, which may arise from this matter.
Civil Investigative Demand Issued by the U.S. Department of Justice
On November 3, 2015, we received a civil investigative demand (“CID”) issued by the U.S. Department of Justice pursuant to the federal False Claims Act relating to claims submitted to Medicare and/or Medicaid for hospice services provided through designated facilities in the Morgantown, West Virginia area. The CID requests the delivery of information to the United States Attorney’s Office for the Northern District of West Virginia regarding 66 identified hospice patients, as well as documents relating to our hospice clinical and business operations in the Morgantown area. The CID generally covers the period from January 1, 2009 through August 31, 2015. We are fully cooperating with the U.S. Department of Justice with respect to this investigation. Based on the information currently available to us, we cannot predict the timing or outcome of this investigation or reasonably estimate the amount or range of potential losses, if any, which may arise from this matter.
On June 27, 2016, we received a CID issued by the U.S. Department of Justice pursuant to the federal False Claims Act relating to claims submitted to Medicare and/or Medicaid for hospice services provided through designated facilities in the Parkersburg, West Virginia area. The CID requests the delivery of information to the United States Attorney’s Office for the Southern District of West Virginia regarding 68 identified hospice patients, as well as documents relating to our hospice clinical and business operations in the Parkersburg area. The CID generally covers the period from January 1, 2011 through June 20, 2016. We are fully cooperating with the U.S. Department of Justice with respect to this investigation. Based on the information currently available to us, we cannot predict the timing or outcome of this investigation or reasonably estimate the amount or range of potential losses, if any, which may arise from this matter.
In addition to the matters referenced in this note, we are involved in legal actions in the normal course of business, some of which seek monetary damages, including claims for punitive damages. We do not believe that these normal course actions, when finally concluded and determined, will have a material impact on our consolidated financial condition, results of operations or cash flows.
Legal Proceedings – Settled
Wage and Hour Litigation
On July 25, 2012, a putative collective and class action complaint was filed in the United States District Court for the District of Connecticut against us in which three former employees allege wage and hour law violations. The former employees claim that they were not paid overtime for all hours worked over 40 hours in violation of the Federal Fair Labor Standards Act (“FLSA”), as well as the Pennsylvania Minimum Wage Act. More specifically, they allege they were paid on both a per-visit and an hourly basis, and that such a pay scheme resulted in their misclassification as exempt employees, thereby denying them overtime pay.
On June 10, 2015, the Company and plaintiffs participated in a mediation whereby they agreed to fully resolve all of plaintiffs’ claims in the lawsuit for $8.0 million, subject to approval by the Court. As of September 30, 2015, we had an accrual of $8.0 million for this matter. On January 29, 2016, the Court approved the final settlement of this case. The settlement became effective on February 26, 2016. As a result of the final amount calculated by the settlement administrator based on claims timely submitted, we reduced our accrual to $5.3 million as of December 31, 2015; this amount was paid during the three-month period ended March 31, 2016.
On September 13, 2012, a putative collective and class action complaint was filed in the United States District Court for the Northern District of Illinois against us in which a former employee alleges wage and hour law violations. The former employee
74
AMEDISYS, INC. AND SUBSIDIARIES
NOTES TO THE CONSOLIDATED FINANCIAL STATEMENTS
December 31, 2017
claims she was paid on both a per-visit and an hourly basis, and that such a pay scheme resulted in her misclassification as an exempt employee, thereby denying her overtime. The plaintiff alleges violations of federal and state law and seeks damages under the FLSA and the Illinois Minimum Wage Law. On December 23, 2015, the parties agreed to explore the possibility of a mediated settlement of the Illinois case, and a mediation occurred on April 18, 2016. The parties agreed to settle the case for $0.8 million, subject to court approval, which the Company had accrued as of September 30, 2016. On August 4, 2016, the Court approved the final settlement of this case. The final payment of $0.6 million was paid on November 21, 2016.
Frontier Litigation
On April 2, 2015, Frontier Home Health and Hospice, L.L.C. (“Frontier”) filed a complaint against the Company in the United States District Court for the District of Connecticut alleging breach of contract, negligent misrepresentation and unfair and deceptive trade practices under Conn. Gen. Stat. §42-110b. Frontier acquired our interest in five home health and four hospice care centers in Wyoming and Idaho in April 2014. The complaint alleges that certain of the hospice patients on service at the time of the acquisition did not meet Medicare eligibility requirements and that we breached certain of the representations and warranties under the purchase agreement and therefore, the businesses were worth less than the purchase price. Under the complaint, Frontier seeks declaratory judgment from the District Court that, under the terms of the purchase agreement with Frontier, we are obligated to determine the amount of the alleged Medicare overpayments and reimburse the government for the same in a timely manner, as well as unspecified compensatory and punitive damages, attorneys’ fees and pre- and post-judgment interest. The Company resolved the Frontier litigation for $2.9 million during the three-month period ended December 31, 2016.
Securities Class Action Lawsuits
As previously disclosed, between June 10 and July 28, 2010, several putative securities class action complaints were filed in the United States District Court for the Middle District of Louisiana (the “District Court”) against the Company and certain of our former senior executives. The cases were consolidated into the first-filed action Bach, et al. v. Amedisys, Inc., et al. Case No. 3:10-cv-00395, and the District Court appointed as co-lead plaintiffs the Public Employees’ Retirement System of Mississippi and the Puerto Rico Teachers’ Retirement System (the “Co-Lead Plaintiffs”).
The Plaintiffs were granted leave to file a First Amended Consolidated Complaint (the “First Amended Securities Complaint”) on behalf of all purchasers or acquirers of Amedisys’ securities between August 2, 2005 and September 30, 2011. The First Amended Securities Complaint alleges that the Company and seven individual defendants violated Section 10(b), Section 20(a), and Rule 10b-5 of the Securities Exchange Act of 1934 by materially misrepresenting the Company’s financial results and concealing a scheme to obtain higher Medicare reimbursements and additional patient referrals by (1) providing medically unnecessary care to patients, including certifying and re-certifying patients for medically unnecessary 60-day treatment episodes; (2) implementing clinical tracks such as “Balanced for Life” and wound care programs that provided a pre-set number of therapy visits irrespective of medical need; (3) “upcoding” patients’ Medicare forms to attribute a “primary diagnosis” to a medical condition associated with higher billing rates; and (4) providing improper and illegal remuneration to physicians to obtain patient certifications or re-certifications. The First Amended Securities Complaint seeks certification of the case as a class action and an unspecified amount of damages, as well as interest and an award of attorneys’ fees.
On June 12, 2017, the Company reached an agreement-in-principle to settle this matter. All parties to the action executed a binding term sheet that, subject to final documentation and court approval, provided in part for a settlement payment of approximately $43.7 million, which we accrued as of June 30, 2017, and the dismissal with prejudice of the litigation. Approximately $15.0 million of the settlement amount paid by the Company’s insurance carriers during the three-month period ended September 30, 2017, was previously recorded with other current assets in our condensed consolidated balance sheet as of June 30, 2017. The net of these two amounts, $28.7 million, was recorded as a charge in our condensed consolidated statements of operations during the three-month period ended June 30, 2017 and paid with cash on hand during the three-month period ended September 30, 2017. On December 19, 2017, the Court entered the final order and judgment on the case.
Other Investigative Matters – Ongoing
Corporate Integrity Agreement
On April 23, 2014, with no admissions of liability on our part, we entered into a settlement agreement with the U.S. Department of Justice relating to certain of our clinical and business operations. Concurrently with our entry into this agreement, we entered into a corporate integrity agreement (“CIA”) with the Office of Inspector General-HHS (“OIG”). The CIA formalizes various aspects of our already existing ethics and compliance programs and contains other requirements designed to help ensure our ongoing compliance with federal health care program requirements. Among other things, the CIA requires us to maintain our existing compliance program, executive compliance committee and compliance committee of the Board of Directors; provide
75
AMEDISYS, INC. AND SUBSIDIARIES
NOTES TO THE CONSOLIDATED FINANCIAL STATEMENTS
December 31, 2017
certain compliance training; continue screening new and current employees to ensure they are eligible to participate in federal health care programs; engage an independent review organization to perform certain auditing and reviews and prepare certain reports regarding our compliance with federal health care programs, our billing submissions to federal health care programs and our compliance and risk mitigation programs; and provide certain reports and management certifications to the OIG. Additionally, the CIA specifically requires that we report substantial overpayments that we discover we have received from federal health care programs, as well as probable violations of federal health care laws. Upon breach of the CIA, we could become liable for payment of certain stipulated penalties, or could be excluded from participation in federal health care programs. The corporate integrity agreement has a term of five years.
Idaho and Wyoming Self-Report
During 2016, the Company engaged an independent auditing firm to perform a clinical audit of the hospice care centers acquired by Frontier Home Health and Hospice in April 2014. No assurances can be given as to the timing or outcome of the audit on the Company, its consolidated financial condition, results of operations or cash flows, which could be material, individually or in the aggregate.
Other Investigative Matters – Settled
Computer Inventory and Data Security Reporting
On March 1 and March 2, 2015, we provided official notice under federal and state data privacy laws concerning the outcome of an extensive risk management process to locate and verify our large computer inventory. The process identified approximately 142 encrypted computers and laptops for which reports were required under federal and state data privacy laws. The devices at issue were originally assigned to Company clinicians and other team members who left the Company between 2011 and 2014. We reported these devices to the U.S. Department of Health and Human Services, state agencies, and individuals whose information may be involved, as required under applicable law because we could not rule out unauthorized access to patient data on the devices. In accordance with our CIA, we notified the OIG of this matter. As of September 30, 2017, this matter has been resolved, and the Company incurred no penalties or fees.
Corporate Integrity Agreement
During the course of our compliance with the CIA, the Company identified several reportable events and notified the OIG as required. As of December 31, 2015, the Company had an accrual of $4.7 million for these matters. On May 5, 2016, the company entered into a settlement agreement with the OIG and the matters were fully resolved for $4.7 million; this amount was paid during the three-month period ended June 30, 2016.
Third Party Audits – Ongoing
From time to time, in the ordinary course of business, we are subject to audits under various governmental programs in which third party firms engaged by the Centers for Medicare and Medicaid Services (“CMS”) conduct extensive review of claims data to identify potential improper payments under the Medicare program.
In July 2010, our subsidiary that provides hospice services in Florence, South Carolina received from a Zone Program Integrity Contractor (“ZPIC”) a request for records regarding a sample of 30 beneficiaries who received services from the subsidiary during the period of January 1, 2008 through March 31, 2010 (the “Review Period”) to determine whether the underlying services met pertinent Medicare payment requirements. We acquired the hospice operations subject to this review on August 1, 2009; the Review Period covers time periods both before and after our ownership of these hospice operations. Based on the ZPIC’s findings for 16 beneficiaries, which were extrapolated to all claims for hospice services provided by the Florence subsidiary billed during the Review Period, on June 6, 2011, the MAC for the subsidiary issued a notice of overpayment seeking recovery from our subsidiary of an alleged overpayment. We dispute these findings, and our Florence subsidiary has filed appeals through the Original Medicare Standard Appeals Process, in which we are seeking to have those findings overturned. An ALJ hearing was held in early January 2015. On January 18, 2016 we received a letter dated January 6, 2016 referencing the ALJ hearing decision for the overpayment issued on June 6, 2011. The decision was partially favorable with a new overpayment amount of $3.7 million with a balance owed of $5.6 million including interest based on 9 disputed claims (originally 16). We filed an appeal to the Medicare Appeals Council on the remaining 9 disputed claims and also argued that the statistical method used to select the sample was not valid. No assurances can be given as to the timing or outcome of the Medicare Appeals Council decision. As of December 31, 2017, Medicare has withheld payments of $5.7 million (including additional interest) as part of their standard procedures once this level of the appeal process has been reached. In the event we are not able to recoup this alleged overpayment, we are indemnified by the prior owners of the hospice operations for amounts relating to the period prior to August 1, 2009. As of December 31, 2017, we have an indemnity receivable of approximately $4.9 million for the amount withheld related to the period prior to August 1, 2009.
76
AMEDISYS, INC. AND SUBSIDIARIES
NOTES TO THE CONSOLIDATED FINANCIAL STATEMENTS
December 31, 2017
In July 2016, the Company received a request for medical records from SafeGuard Services, L.L.C (“SafeGuard”), a ZPIC related to services provided by some of the care centers that the Company acquired from Infinity Home Care, L.L.C. The review period covers time periods both before and after our ownership of the care centers, which were acquired on December 31, 2015. In August 2017, the Company received Requests for Repayment from Palmetto GBA, LLC (“Palmetto”) regarding Infinity Home Care of Lakeland, LLC, (“Lakeland Care Centers”) and Infinity Home Care of Pinellas, LLC, (“Clearwater Care Center”). The Palmetto letters are based on a statistical extrapolation performed by SafeGuard which alleged an overpayment of $34.0 million for the Lakeland Care Centers on a universe of 72 Medicare claims totaling $0.2 million in actual claims payments using a 100% error rate and an overpayment of $4.8 million for the Clearwater Care Center on a universe of 70 Medicare claims totaling $0.2 million in actual claims payments using a 100% error rate.
The Lakeland Request for Repayment covers claims between January 2, 2014, and September 13, 2016. The Clearwater Request for Repayment covers claims between January 2, 2015, and December 9, 2016. As a result of Level I Administrative Appeals, also known as Redetermination, the alleged overpayment for the Lakeland Care Centers has been reduced to $27.0 million and the alleged overpayment for the Clearwater Care Center has been reduced to $3.3 million. The Company has filed or is in the process of filing Level II Administrative Appeals, also known as Reconsideration. The Company will continue to vigorously pursue its appeal rights which include contesting the methodology used by the ZPIC contractor to perform statistical extrapolation. The Company is contractually entitled to indemnification by the prior owners for all claims prior to December 31, 2015, for up to $12.6 million.
At this stage of the review, based on the information currently available to the Company, the Company cannot predict the timing or outcome of this review. The Company stands by its original estimated low-end potential range of loss related to this review of $6.5 million (assuming the Company is successful in seeking indemnity from the prior owners and unsuccessful in demonstrating that the extrapolation method used by SafeGuard was erroneous). The Company has reduced its high-end potential range of loss from $38.8 million (the maximum amount Palmetto claims has been overpaid for both the Lakeland Care Centers and the Clearwater Care Center of which amount is subject to indemnification by the prior owners for up to $12.6 million as disclosed above) to $30.3 million based on the partial success achieved by the Company in prosecuting its Level I Administrative Appeals.
As of December 31, 2017, we have an accrued liability of approximately $17.4 million related to this matter. We expect to be indemnified by the prior owners for approximately $10.9 million and have recorded this amount with other assets, net in our condensed consolidated balance sheet as of December 31, 2017. The net of these two amounts, $6.5 million, was recorded as a reduction in revenue in our condensed consolidated statements of operations during the three-month period ended September 30, 2017. As of December 31, 2017, $6.8 million of net receivables have been impacted by this payment suspension.
Operating Leases
We have leased office space at various locations under non-cancelable agreements that expire between 2018 and 2028, and require various minimum annual rentals. Our typical operating leases are for lease terms of one to seven years and may include, in addition to base rental amounts, certain landlord pass-through costs for our pro-rata share of the lessor’s real estate taxes, utilities and common area maintenance costs. Some of our operating leases contain escalation clauses, in which annual minimum base rentals increase over the term of the lease.
Total minimum rental commitments as of December 31, 2017 are as follows (amounts in millions):
2018 | $ | 23.6 | |
2019 | 18.1 | ||
2020 | 13.6 | ||
2021 | 8.9 | ||
2022 | 5.0 | ||
Future years | 11.6 | ||
Total | $ | 80.8 | |
Rent expense for non-cancelable operating leases was $28.6 million, $27.5 million and $23.7 million for 2017, 2016 and 2015, respectively.
77
AMEDISYS, INC. AND SUBSIDIARIES
NOTES TO THE CONSOLIDATED FINANCIAL STATEMENTS
December 31, 2017
Insurance
We are obligated for certain costs associated with our insurance programs, including employee health, workers’ compensation and professional liability. While we maintain various insurance programs to cover these risks, we are self-insured for a substantial portion of our potential claims. We recognize our obligations associated with these costs, up to specified deductible limits in the period in which a claim is incurred, including with respect to both reported claims and claims incurred but not reported. These costs have generally been estimated based on historical data of our claims experience. Such estimates, and the resulting reserves, are reviewed and updated by us on a quarterly basis.
The following table presents details of our insurance programs, including amounts accrued for the periods indicated (amounts in millions) in accrued expenses in our accompanying balance sheets. The amounts accrued below represent our total estimated liability for individual claims that are less than our noted insurance coverage amounts, which can include outstanding claims and claims incurred but not reported.
As of December 31, | |||||||
Type of Insurance | 2017 | 2016 | |||||
Health insurance | $ | 14.1 | $ | 10.6 | |||
Workers’ compensation | 29.3 | 26.8 | |||||
Professional liability | 4.3 | 4.7 | |||||
47.7 | 42.1 | ||||||
Less: long-term portion | (1.2 | ) | (0.8 | ) | |||
$ | 46.5 | $ | 41.3 | ||||
The retention limit per claim for our health insurance, worker’s compensation and professional liability is $0.9 million, $0.5 million and $0.3 million, respectively.
Employment Contracts
We have commitments related to our Key Executive Severance Plan applicable to a number of our senior executives, as well as the employment agreement entered into with our Chief Executive Officer, each of which generally commit us to pay severance benefits under certain circumstances.
Other
We are subject to various other types of claims and disputes arising in the ordinary course of our business. While the resolution of such issues is not presently determinable, we believe that the ultimate resolution of such matters will not have a significant effect on our consolidated financial condition, results of operations and cash flows.
10. EMPLOYEE BENEFIT PLANS
401(K) Benefit Plan
We maintain a plan qualified under Section 401(k) of the Internal Revenue Code for all employees who have reached 21 years of age, effective the first month after hire date. Under the plan, eligible employees may elect to defer a portion of their compensation, subject to Internal Revenue Service limits.
Effective January 1, 2017, our match of contributions to be made to each eligible employee contribution is $0.44 for every $1.00 of contribution made up to the first 6% of their salary. During 2016 and 2015, our match of contributions to be made to each eligible employee contribution was $0.375 for every $1.00 of contribution made up to the first 6% of their salary. The match is discretionary and thus is subject to change at the discretion of management. These contributions are made in the form of our common stock, valued based upon the fair value of the stock as of the end of each calendar quarter end. We expensed approximately $8.8 million, $6.9 million and $6.1 million related to our 401(k) benefit plan for 2017, 2016 and 2015, respectively.
Deferred Compensation Plan
We had a Deferred Compensation Plan for additional tax-deferred savings to a select group of management or highly compensated employees. Amounts credited under the Deferred Compensation Plan were funded into a rabbi trust, which is managed by a trustee. The trustee has the discretion to manage the assets of the Deferred Compensation Plan as deemed fit, thus the assets are not necessarily reflective of the same investment choices made by the participants.
78
Effective January 1, 2015, all prospective salary deferrals ceased. Participants will be allowed to make transactions with any remaining account balances as they wish per plan guidelines.
11. STOCK REPURCHASE PROGRAM
On September 9, 2015, we announced that our Board of Directors authorized a stock repurchase program allowing for the repurchase of up to $75 million of our outstanding common stock on or before September 6, 2016, the date on which the stock repurchase program expired.
Under the terms of the program, we were allowed to repurchase shares from time to time in open market transactions, block purchases or in private transactions in accordance with applicable federal securities laws and other legal requirements. We were allowed to enter into Rule 10b5-1 plans to effect some or all of the repurchases. The timing and the amount of the repurchases were determined by management based on a number of factors, including but not limited to share price, trading volume and general market conditions, as well as on working capital requirements, general business conditions and other factors.
Pursuant to this program, we repurchased 324,141 shares of our common stock at a weighted average price of $37.96 per share and a total cost of approximately $12.3 million during 2016 and 116,859 shares of our common stock at a weighted average price of $39.20 per share and a total cost of approximately $4.6 million during 2015. The repurchased shares are classified as treasury shares.
12. EXIT AND RESTRUCTURING ACTIVITIES
During the three-month period ended December 31, 2017, we closed four Florida home health care centers, consolidated another three Florida home health care centers with care centers servicing the same markets and implemented a plan to restructure our home health division. As a result of these actions, we recorded non-cash charges of $1.3 million in asset impairment expense related to the write-off of intangible assets, $0.6 million in other general and administrative expenses related to lease termination costs and $3.0 million in salaries and benefits related to severance costs which was offset by a reduction in non-cash compensation of approximately $1.0 million within our consolidated statements of operations for 2017.
Our reserve activity for our 2017 exit and restructuring activity is as follows (amounts in millions):
2017 Exit Activity | |||||||
Lease Termination | Severance | ||||||
Balances at December 31, 2016 | $ | — | $ | — | |||
Charge in 2017 | 0.6 | 3.0 | |||||
Cash expenditures in 2017 | — | (0.7 | ) | ||||
Balances at December 31, 2017 | $ | 0.6 | $ | 2.3 | |||
13. VALUATION AND QUALIFYING ACCOUNTS
The following table summarizes the activity and ending balances in our allowance for doubtful accounts and estimated revenue adjustments (amounts in millions):
Allowance for Doubtful Accounts
Year End | Balance at Beginning of Year | Provision for Doubtful Accounts | Write-Offs | Balance at End of Year | |||||||||||
2017 | $ | 17.7 | $ | 25.1 | $ | (21.9 | ) | $ | 20.9 | ||||||
2016 | 16.5 | 19.5 | (18.3 | ) | 17.7 | ||||||||||
2015 | 14.3 | 14.1 | (11.9 | ) | 16.5 | ||||||||||
79
Estimated Revenue Adjustments
Year End | Balance at Beginning of Year | Provision for Estimated Revenue Adjustments | Write-Offs | Balance at End of Year | |||||||||||
2017 | $ | 4.1 | $ | 14.4 | $ | (12.3 | ) | $ | 6.2 | ||||||
2016 | 4.0 | 7.9 | (7.8 | ) | 4.1 | ||||||||||
2015 | 3.1 | 6.1 | (5.2 | ) | 4.0 | ||||||||||
l4. SEGMENT INFORMATION
Our operations involve servicing patients through our three reportable business segments: home health, hospice and personal care. Our home health segment delivers a wide range of services in the homes of individuals who may be recovering from surgery, have a chronic disability or terminal illness or need assistance with the essential activities of daily living. Our hospice segment provides palliative care and comfort to terminally ill patients and their families. Our personal care segment, which was established with the acquisition of Associated Home Care during the three-month period ended March 31, 2016, provides patients with assistance with the essential activities of daily living. The “other” column in the following tables consists of costs relating to executive management and administrative support functions, primarily information services, accounting, finance, billing and collections, legal, compliance, risk management, procurement, marketing, clinical administration, training, human resources and administration.
Management evaluates performance and allocates resources based on the operating income of the reportable segments, which includes an allocation of corporate expenses directly attributable to the specific segment and includes revenues and all other costs directly attributable to the specific segment. Segment assets are not reviewed by the company’s chief operating decision maker and therefore are not disclosed below (amounts in millions).
For the Year Ended December 31, 2017 | |||||||||||||||||||
Home Health | Hospice | Personal Care | Other | Total | |||||||||||||||
Net service revenue | $ | 1,101.8 | $ | 371.0 | $ | 60.9 | $ | — | $ | 1,533.7 | |||||||||
Cost of service, excluding depreciation and amortization | 670.9 | 184.8 | 45.0 | — | 900.7 | ||||||||||||||
General and administrative expenses | 278.4 | 76.6 | 13.6 | 113.7 | 482.3 | ||||||||||||||
Provision for doubtful accounts | 17.9 | 5.9 | 1.3 | — | 25.1 | ||||||||||||||
Depreciation and amortization | 3.5 | 0.9 | 0.2 | 12.5 | 17.1 | ||||||||||||||
Securities Class Action Lawsuit settlement, net | — | — | — | 28.7 | 28.7 | ||||||||||||||
Asset impairment charge | 1.3 | — | — | — | 1.3 | ||||||||||||||
Operating expenses | 972.0 | 268.2 | 60.1 | 154.9 | 1,455.2 | ||||||||||||||
Operating income (loss) | $ | 129.8 | $ | 102.8 | $ | 0.8 | $ | (154.9 | ) | $ | 78.5 | ||||||||
For the Year Ended December 31, 2016 | |||||||||||||||||||
Home Health | Hospice | Personal Care | Other | Total | |||||||||||||||
Net service revenue | $ | 1,085.5 | $ | 316.0 | $ | 35.9 | $ | — | $ | 1,437.4 | |||||||||
Cost of service, excluding depreciation and amortization | 643.7 | 163.1 | 26.3 | — | 833.1 | ||||||||||||||
General and administrative expenses | 283.4 | 70.2 | 7.9 | 141.9 | 503.4 | ||||||||||||||
Provision for doubtful accounts | 13.8 | 5.5 | 0.2 | — | 19.5 | ||||||||||||||
Depreciation and amortization | 6.0 | 1.3 | — | 12.4 | 19.7 | ||||||||||||||
Asset impairment charge | — | — | — | 4.4 | 4.4 | ||||||||||||||
Operating expenses | 946.9 | 240.1 | 34.4 | 158.7 | 1,380.1 | ||||||||||||||
Operating income (loss) | $ | 138.6 | $ | 75.9 | $ | 1.5 | $ | (158.7 | ) | $ | 57.3 | ||||||||
80
For the Year Ended December 31, 2015 | |||||||||||||||||||
Home Health | Hospice | Personal Care | Other | Total | |||||||||||||||
Net service revenue | $ | 1,005.1 | $ | 275.4 | $ | — | $ | — | $ | 1,280.5 | |||||||||
Cost of service, excluding depreciation and amortization | 584.2 | 141.7 | — | — | 725.9 | ||||||||||||||
General and administrative expenses | 263.2 | 62.7 | — | 126.5 | 452.4 | ||||||||||||||
Provision for doubtful accounts | 12.2 | 1.9 | — | — | 14.1 | ||||||||||||||
Depreciation and amortization | 5.2 | 1.4 | — | 13.4 | 20.0 | ||||||||||||||
Asset impairment charge | — | — | — | 77.3 | 77.3 | ||||||||||||||
Operating expenses | 864.8 | 207.7 | — | 217.2 | 1,289.7 | ||||||||||||||
Operating income (loss) | $ | 140.3 | $ | 67.7 | $ | — | $ | (217.2 | ) | $ | (9.2 | ) | |||||||
15. UNAUDITED SUMMARIZED QUARTERLY FINANCIAL INFORMATION
Net Income (Loss) Attributable to Amedisys, Inc. Common Stockholders (1) | |||||||||||||||
Revenue | Net Income (Loss) Attributable to Amedisys, Inc. | Basic | Diluted | ||||||||||||
2017 | |||||||||||||||
1st Quarter (2)(3) | $ | 370.5 | $ | 15.1 | $ | 0.45 | $ | 0.44 | |||||||
2nd Quarter (2)(3) | 378.8 | 4.5 | 0.13 | 0.13 | |||||||||||
3rd Quarter (2)(4) | 380.2 | 14.6 | 0.43 | 0.42 | |||||||||||
4th Quarter (2)(4)(5) | 404.2 | (3.8 | ) | (0.11 | ) | (0.11 | ) | ||||||||
$ | 1,533.7 | $ | 30.3 | $ | 0.90 | $ | 0.88 | ||||||||
2016 | |||||||||||||||
1st Quarter (6)(7)(8) | $ | 348.8 | $ | 6.2 | $ | 0.19 | $ | 0.19 | |||||||
2nd Quarter (6)(7)(8) | 360.7 | 10.7 | 0.32 | 0.32 | |||||||||||
3rd Quarter (6)(7)(8) | 361.6 | 11.4 | 0.34 | 0.34 | |||||||||||
4th Quarter (6)(7)(8)(9) | 366.3 | 8.9 | 0.27 | 0.26 | |||||||||||
$ | 1,437.4 | $ | 37.3 | $ | 1.12 | $ | 1.10 | ||||||||
(1) | Because of the method used in calculating per share data, the quarterly per share data may not necessarily total to the per share data as computed for the entire year. |
(2) | During each of the four quarters of 2017, we incurred certain costs associated with various legal matters. Net of income taxes, these costs amounted to $0.1 million, $18.0 million, $0.1 million and $0.2 million for the three-month periods ended March 31, 2017, June 30, 2017, September 30, 2017 and December 31, 2017, respectively. |
(3) | During the first and second quarters of 2017, we incurred certain costs associated with various acquisitions. Net of income taxes, these costs amounted to $0.4 million and $0.2 million for the three-month periods ended March 31, 2017 and June 30, 2017, respectively. |
(4) | During the third and fourth quarters of 2017, we incurred certain costs as a result of our home health division restructure plan. Net of income taxes, these costs amounted to $1.0 million and $1.2 million for the three-month periods ended September 30, 2017 and December 31, 2017, respectively. |
(5) | During the fourth quarter of 2017, we recorded a charge of $21.4 million, net of income taxes as the result of the enactment of H.R. 1 (Tax Cuts and Jobs Act). |
(6) | During each of the four quarters of 2016, we incurred certain costs associated with the implementation of Homecare Homebase. Net of income taxes, these costs amounted to $1.5 million, $1.6 million, $1.2 million and $0.8 million for the three-month periods ended March 31, 2016, June 30, 2016, September 30, 2016 and December 31, 2016, respectively. |
(7) | During each of the four quarters of 2016, we incurred certain costs associated with various legal matters. Net of income taxes, these costs amounted to $0.9 million, $0.3 million, $0.2 million and $1.8 million for the three-month periods ended March 31, 2016, June 30, 2016, September 30, 2016 and December 31, 2016, respectively. |
(8) | During each of the four quarters of 2016, we incurred certain costs associated with various acquisitions. Net of income taxes, these costs amounted to $1.0 million, $0.2 million, $0.3 million and $0.5 million for the three-month periods ended March 31, 2016, June 30, 2016, September 30, 2016 and December 31, 2016, respectively. |
81
(9) | During the fourth quarter of 2016, we recorded a non-cash asset impairment charge to write-off assets as a result of our conversion from our proprietary operating system to Homecare Homebase in the amount of $2.7 million, net of income taxes. |
16. RELATED PARTY TRANSACTIONS
On November 20, 2015, we engaged KKR Consulting, LLC (“KKR Capstone”), a consulting company of operational professionals that works exclusively with portfolio companies of Kohlberg Kravis Roberts & Co. Nathaniel M. Zilkha, a member of our Board of Directors, is a member of KKR Management, LLC, which is an affiliate of KKR Asset Management LLC (“KAM”), a substantial stockholder of our Company, and an affiliate of Kohlberg Kravis Roberts & Co. During 2016, we incurred costs of approximately $1.6 million related to consulting services provided to the Company in the ordinary course of business. Mr. Zilkha did not receive any direct compensation or direct financial benefit from the engagement of KKR Capstone.
Effective October 22, 2015, we entered into a contract for telemonitoring services with Care Innovations, LLC (“Care Innovations”). At that time, Paul Kusserow, our President and Chief Executive Officer, was a member of the Advisory Board to Care Innovations. In connection with our contract for telemonitoring services for the Company, Care Innovations was to receive an annual fee of approximately $1.8 million. During 2016, we incurred costs of approximately $1.5 million related to this related party engagement. We did not incur any additional costs related to this engagement during 2017. Mr. Kusserow did not receive any direct compensation or direct financial benefit from the engagement of Care Innovations as our telemonitoring partner and no longer serves as a member of Care Innovations' Advisory Board.
17. SUBSEQUENT EVENTS
On February 9, 2018, Congress passed the Bipartisan Budget Act of 2018 ("BBA of 2018"), which funded government operations, set two-year government spending limits and enacted a variety of healthcare related policies. Specific to home health, the BBA of 2018 provides for a targeted extension of the home health rural add-on payment, a reduction of the 2020 market basket update, modification of eligibility documentation requirements and reform to the Home Health Prospective Payment System (“HHPPS”). The HHPPS reform includes the following parameters:
• | For home health units of service beginning on January 1, 2020, a 30-day payment system will apply. |
• | The transition to the 30-day payment system must be budget neutral. |
• | CMS must conduct at least one Technical Expert Panel during 2018, prior to any notice and comment rulemaking process, related to the design of any new case-mix adjustment model. |
82
ITEM 9. CHANGES IN AND DISAGREEMENTS WITH ACCOUNTANTS ON ACCOUNTING AND FINANCIAL DISCLOSURE
None.
ITEM 9A. CONTROLS AND PROCEDURES
Evaluation of Disclosure Controls and Procedures
We have established disclosure controls and procedures which are designed to provide reasonable assurance of achieving their objectives and to ensure that information required to be disclosed in our reports filed under the Exchange Act is recorded, processed, summarized, disclosed and reported within the time periods specified in the SEC’s rules and forms. This information is also accumulated and communicated to our management and Board of Directors to allow timely decisions regarding required disclosure.
In connection with the preparation of this Annual Report on Form 10-K, as of December 31, 2017, under the supervision and with the participation of our management, including our principal executive officer and principal financial officer, we conducted an evaluation of the effectiveness of our disclosure controls and procedures, as such term is defined under Rules 13a-15(e) and 15d-15(e) promulgated under the Exchange Act.
Based on this evaluation, our principal executive officer and principal financial officer concluded that our disclosure controls and procedures were effective at a reasonable assurance level as of December 31, 2017, the end of the period covered by this Annual Report on Form 10-K.
Management’s Annual Report on Internal Control over Financial Reporting
Our management is responsible for establishing and maintaining adequate internal control over our financial reporting, as such term is defined in Rules 13a-15(f) and 15d-15(f) promulgated under the Exchange Act. Under the supervision and with the participation of our management, including our principal executive officer and our principal financial officer, we conducted an evaluation of the effectiveness of our internal control over financial reporting based on the framework in Internal Control – Integrated Framework issued by the Committee of Sponsoring Organizations of the Treadway Commission. Based on our evaluation under the framework in Internal Control – Integrated Framework, our management concluded our internal control over financial reporting was effective as of December 31, 2017.
Our internal control system is designed to provide reasonable assurance to our management and Board of Directors regarding the preparation and fair presentation of published financial statements. All internal control systems, no matter how well designed, have inherent limitations. Therefore, even those systems determined to be effective can provide only reasonable assurance with respect to financial statement preparation and presentation.
KPMG LLP, the independent registered public accounting firm that audited our consolidated financial statements included in this Form 10-K, has issued a report on our internal control over financial reporting, which is included herein.
Changes in Internal Controls
There were no changes in our internal control over financial reporting (as defined in Exchange Act Rule 13a-15(f)) that have occurred during the quarter ended December 31, 2017 that have materially affected, or are reasonably likely to materially affect, our internal control over financial reporting.
83
Inherent Limitations on Effectiveness of Controls
Our management, including our principal executive officer and principal financial officer, does not expect that our disclosure controls or our internal controls over financial reporting will prevent or detect all errors and all fraud. A control system, no matter how well designed and operated, can provide only reasonable, not absolute, assurance that the control system’s objectives will be met. The design of a control system must reflect the fact that there are resource constraints, and the benefits of controls must be considered relative to their costs. Further, because of the inherent limitations in all control systems, no evaluation of controls can provide absolute assurance that misstatements due to error or fraud will not occur or that all control issues and instances of fraud, if any, have been detected. These inherent limitations include the realities that judgments in decision-making can be faulty and that breakdowns can occur because of simple error or mistake. Controls can also be circumvented by the individual acts of some persons, by collusion of two or more people, or by management override of the controls. The design of any system of controls is based in part on certain assumptions about the likelihood of future events, and there can be no assurance that any design will succeed in achieving its stated goals under all potential future conditions. Projections of any evaluation of controls’ effectiveness to future periods are subject to risks. Over time, controls may become inadequate because of changes in conditions or deterioration in the degree of compliance with policies and procedures. Our disclosure controls and procedures are designed to provide reasonable assurance of achieving their objectives and, based on an evaluation of our controls and procedures, our principal executive officer and our principal financial officer concluded our disclosure controls and procedures were effective at a reasonable assurance level as of December 2017, the end of the period covered by this Annual Report.
84
Report of Independent Registered Public Accounting Firm
To the Stockholders and Board of Directors
Amedisys, Inc.:
Opinion on Internal Control Over Financial Reporting
We have audited Amedisys, Inc. and subsidiaries' (the "Company") internal control over financial reporting as of December 31, 2017, based on criteria established in Internal Control – Integrated Framework (2013) issued by the Committee of Sponsoring Organizations of the Treadway Commission. In our opinion, the Company maintained, in all material respects, effective internal control over financial reporting as of December 31, 2017, based on criteria established in Internal Control - Integrated Framework (2013) issued by the Committee of Sponsoring Organizations of the Treadway Commission.
We also have audited, in accordance with the standards of the Public Company Accounting Oversight Board (United States) ("PCAOB"), the consolidated balance sheets of the Company as of December 31, 2017 and 2016, the related consolidated statements of operations, comprehensive income (loss), stockholders’ equity, and cash flows for each of the years in the three-year period ended December 31, 2017, and the related notes (collectively, the consolidated financial statements), and our report dated February 28, 2018 expressed an unqualified opinion on those consolidated financial statements.
Basis for Opinion
The Company’s management is responsible for maintaining effective internal control over financial reporting and for its assessment of the effectiveness of internal control over financial reporting, included in the accompanying Management’s Annual Report on Internal Control over Financial Reporting. Our responsibility is to express an opinion on the Company’s internal control over financial reporting based on our audit. We are a public accounting firm registered with the PCAOB and are required to be independent with respect to the Company in accordance with the U.S. federal securities laws and the applicable rules and regulations of the Securities and Exchange Commission and the PCAOB.
We conducted our audit in accordance with the standards of the PCAOB. Those standards require that we plan and perform the audit to obtain reasonable assurance about whether effective internal control over financial reporting was maintained in all material respects. Our audit of internal control over financial reporting included obtaining an understanding of internal control over financial reporting, assessing the risk that a material weakness exists, and testing and evaluating the design and operating effectiveness of internal control based on the assessed risk. Our audit also included performing such other procedures as we considered necessary in the circumstances. We believe that our audit provides a reasonable basis for our opinion.
Definition and Limitations of Internal Control Over Financial Reporting
A company’s internal control over financial reporting is a process designed to provide reasonable assurance regarding the reliability of financial reporting and the preparation of financial statements for external purposes in accordance with generally accepted accounting principles. A company’s internal control over financial reporting includes those policies and procedures that (1) pertain to the maintenance of records that, in reasonable detail, accurately and fairly reflect the transactions and dispositions of the assets of the company; (2) provide reasonable assurance that transactions are recorded as necessary to permit preparation of financial statements in accordance with generally accepted accounting principles, and that receipts and expenditures of the company are being made only in accordance with authorizations of management and directors of the company; and (3) provide reasonable assurance regarding prevention or timely detection of unauthorized acquisition, use, or disposition of the company’s assets that could have a material effect on the financial statements.
Because of its inherent limitations, internal control over financial reporting may not prevent or detect misstatements. Also, projections of any evaluation of effectiveness to future periods are subject to the risk that controls may become inadequate because of changes in conditions, or that the degree of compliance with the policies or procedures may deteriorate.
/s/ KPMG LLP
Baton Rouge, Louisiana
February 28, 2018
85
ITEM 9B. OTHER INFORMATION
None.
PART III
ITEM 10. DIRECTORS, EXECUTIVE OFFICERS AND CORPORATE GOVERNANCE
The information required by this item is incorporated by reference to the 2018 Proxy Statement to be filed with the SEC within 120 days after the end of the year ended December 31, 2017.
Code of Conduct and Ethics
We have adopted a code of ethics that applies to all of our directors, officers and employees, including our principal executive officer, principal financial officer and principal accounting officer. This code of ethics, which is entitled Code of Ethical Business Conduct, is posted at our internet website, http://www.amedisys.com. Any amendments to, or waivers of, the code of ethics will be disclosed on our website promptly following the date of such amendment or waiver.
ITEM 11. EXECUTIVE COMPENSATION
The information required by this item is incorporated by reference to the 2018 Proxy Statement to be filed with the SEC within 120 days after the end of the year ended December 31, 2017.
ITEM 12. SECURITY OWNERSHIP OF CERTAIN BENEFICIAL OWNERS AND MANAGEMENT AND RELATED STOCKHOLDER MATTERS
The information required by this item is incorporated by reference to the 2018 Proxy Statement to be filed with the SEC within 120 days after the end of the year ended December 31, 2017.
ITEM 13. CERTAIN RELATIONSHIPS AND RELATED TRANSACTIONS, AND DIRECTOR INDEPENDENCE
The information required by this item is incorporated by reference to the 2018 Proxy Statement to be filed with the SEC within 120 days after the end of the year ended December 31, 2017.
ITEM 14. PRINCIPAL ACCOUNTING FEES AND SERVICES
The information required by this item is incorporated by reference to the 2018 Proxy Statement to be filed with the SEC within 120 days after the end of the year ended December 31, 2017.
86
PART IV
ITEM 15. EXHIBITS AND FINANCIAL STATEMENT SCHEDULES
(a) | 1. | Financial Statements | ||
All financial statements are set forth under Part II, Item 8 of this report. | ||||
2. | Financial Statement Schedules | |||
There are no financial statement schedules included in this report as they are either not applicable or included in the financial statements. | ||||
3. | Exhibits | |||
The Exhibits are listed in the Exhibit Index required by Item 601 of Regulation S-K preceding the signature page of this report. | ||||
ITEM 16. FORM 10-K SUMMARY
None.
87
EXHIBIT INDEX
The exhibits marked with the cross symbol (†) are filed and the exhibits marked with a double cross (††) are furnished with this Form 10-K. Any exhibits marked with the asterisk symbol (*) are management contracts or compensatory plans or arrangements filed pursuant to Item 601(b)(10)(iii) of Regulation S-K. The registrant agrees to furnish to the Commission supplementally upon request a copy of any schedules or exhibits omitted pursuant to Item 601(b)(2) of Regulation S-K of any material plan of acquisition, disposition or reorganization set forth below.
Exhibit Number | Document Description | Report or Registration Statement | SEC File or Registration Number | Exhibit or Other Reference | ||||
2.1 | The Company’s Quarterly Report on Form 10-Q for the quarter ended March 31, 2016 | 0-24260 | 2.1 | |||||
3.1 | The Company’s Quarterly Report on Form 10-Q for the quarter ended June 30, 2007 | 0-24260 | 3.1 | |||||
3.2 | The Company’s Quarterly Report on Form 10-Q for the quarter ended March 31, 2016 | 0-24260 | 3.2 | |||||
4.1 | The Company’s Registration Statement on Form S-3 filed August 20, 2007 | 333-145582 | 4.8 | |||||
10.1 | The Company’s Annual Report on Form 10-K for the year ended December 31, 2008 | 0-24260 | 10.1 | |||||
10.2* | The Company’s Current Report on Form 8-K filed June 8, 2012 | 0-24260 | 10.1 | |||||
10.3* | The Company's Annual Report on Form 10-K for the year ended December 31, 2016 | 0-24260 | 10.3 | |||||
10.4* | The Company’s Quarterly Report on Form 10-Q for the quarter ended June 30, 2008 | 0-24260 | 10.3 | |||||
88
Exhibit Number | Document Description | Report or Registration Statement | SEC File or Registration Number | Exhibit or Other Reference | ||||
10.5* | The Company’s Quarterly Report on Form 10-Q for the quarter ended June 30, 2008 | 0-24260 | 10.4 | |||||
10.6* | The Company’s Annual Report on Form 10-K for the year ended December 31, 2014 | 0-24260 | 10.6 | |||||
10.7* | The Company’s Annual Report on Form 10-K for the year ended December 31, 2014 | 0-24260 | 10.7 | |||||
10.8* | The Company’s Annual Report on Form 10-K for the year ended December 31, 2014 | 0-24260 | 10.8 | |||||
10.9* | The Company’s Annual Report on Form 10-K for the year ended December 31, 2014 | 0-24260 | 10.9 | |||||
10.10* | The Company’s Registration Statement on Form S-8 filed June 22, 2007 | 333-143967 | 4.2 | |||||
10.11* | The Company’s Annual Report on Form 10-K for the year ended December 31, 2005 | 0-24260 | 10.4 | |||||
10.12* | The Company’s Annual Report on Form 10-K for the year ended December 31, 2014 | 0-24260 | 10.12 | |||||
89
Exhibit Number | Document Description | Report or Registration Statement | SEC File or Registration Number | Exhibit or Other Reference | ||||
10.13* | The Company’s Quarterly Report on Form 10-Q for the quarter ended June 30, 2016 | 0-24260 | 10.1 | |||||
10.14* | The Company's Annual Report on Form 10-K for the year ended December 31, 2016 | 0-24260 | 10.15 | |||||
10.15* | The Company's Quarterly Report on Form 10-Q for the quarter ended September 30, 2017 | 0-24260 | 10.1 | |||||
10.16* | The Company's Quarterly Report on Form 10-Q for the quarter ended September 30, 2017 | 0-24260 | 10.2 | |||||
10.17.1 | The Company’s Current Report on Form 8-K filed on October 30, 2012 | 0-24260 | 10.1 | |||||
90
Exhibit Number | Document Description | Report or Registration Statement | SEC File or Registration Number | Exhibit or Other Reference | ||||
10.17.2 | The Company’s Quarterly Report on Form 10-Q for the quarter ended September 30, 2013 | 0-24260 | 10.1.1 | |||||
10.17.3 | The Company’s Quarterly Report on Form 10-Q for the quarter ended September 30, 2013 | 0-24260 | 10.1.2 | |||||
10.17.4 | The Company’s Quarterly Report on Form 10-Q for the quarter ended March 31, 2014 | 0-24260 | 10.3 | |||||
91
Exhibit Number | Document Description | Report or Registration Statement | SEC File or Registration Number | Exhibit or Other Reference | ||||
10.17.5 | The Company’s Quarterly Report on Form 10-Q for the quarter ended June 30, 2014 | 0-24260 | 10.1.2 | |||||
10.18 | The Company’s Quarterly Report on Form 10-Q for the quarter ended September 30, 2013 | 0-24260 | 10.2 | |||||
10.19 | The Company’s Quarterly Report on Form 10-Q for the quarter ended June 30, 2014 | 0-24260 | 10.8 | |||||
10.20 | The Company’s Quarterly Report on Form 10-Q for the quarter ended June 30, 2014 | 0-24260 | 10.9 | |||||
10.21 | The Company’s Quarterly Report on Form 10-Q for the quarter ended June 30, 2014 | 0-24260 | 10.10 | |||||
92
Exhibit Number | Document Description | Report or Registration Statement | SEC File or Registration Number | Exhibit or Other Reference | ||||
10.22.1 | The Company’s Current Report on Form 8-K filed September 2, 2015 | 0-24260 | 10.1 | |||||
10.22.2 | The Company’s Current Report on Form 8-K filed September 2, 2015 | 0-24260 | 10.2 | |||||
10.22.3 | The Company’s Current Report on Form 8-K filed September 2, 2015 | 0-24260 | 10.3 | |||||
10.23 | The Company’s Current Report on Form 8-K filed on April 24, 2014 | 0-24260 | 10.1 | |||||
10.24 | The Company’s Current Report on Form 8-K filed on April 24, 2014 | 0-24260 | 10.2 | |||||
93
Exhibit Number | Document Description | Report or Registration Statement | SEC File or Registration Number | Exhibit or Other Reference | ||||
10.25 | The Company’s Annual Report on Form 10-K for the year ended December 31, 2015 | 0-24260 | 10.27 | |||||
10.26 | The Company’s Annual Report on Form 10-K for the year ended December 31, 2015 | 0-24260 | 10.28 | |||||
†21.1 | ||||||||
†23.1 | ||||||||
†31.1 | ||||||||
†31.2 | ||||||||
††32.1 | ||||||||
††32.2 | ||||||||
†101.INS | XBRL Instance | |||||||
†101.SCH | XBRL Taxonomy Extension Schema Document | |||||||
†101.CAL | XBRL Taxonomy Extension Calculation Linkbase Document | |||||||
94
Exhibit Number | Document Description | Report or Registration Statement | SEC File or Registration Number | Exhibit or Other Reference | ||||
†101.DEF | XBRL Taxonomy Extension Definition Linkbase | |||||||
†101.LAB | XBRL Taxonomy Extension Labels Linkbase Document | |||||||
†101.PRE | XBRL Taxonomy Extension Presentation Linkbase Document | |||||||
SIGNATURES
Pursuant to the requirements of Section 13 or 15(d) of the Securities Exchange Act of 1934, as amended, the Registrant has duly caused this report to be signed on its behalf by the undersigned, thereunto duly authorized.
AMEDISYS, INC. | ||
By: | /S/ PAUL B. KUSSEROW | |
Paul B. Kusserow, | ||
President, Chief Executive Officer and | ||
Member of the Board | ||
Date: February 28, 2018
Pursuant to the requirements of the Securities Exchange Act of 1934, as amended, this report has been signed below by the following persons on behalf of the registrant and in the capacities and on the date indicated:
95
Signature | Title | Date | ||
/S/ PAUL B. KUSSEROW | President, Chief Executive Officer and Member of the Board (Principal Executive Officer) | February 28, 2018 | ||
Paul B. Kusserow | ||||
/S/ SCOTT G. GINN | Chief Financial Officer (Principal Financial Officer and Principal Accounting Officer) | February 28, 2018 | ||
Scott G. Ginn | ||||
/S/ LINDA J. HALL | Director | February 28, 2018 | ||
Linda J. Hall | ||||
/S/ JULIE D. KLAPSTEIN | Director | February 28, 2018 | ||
Julie D. Klapstein | ||||
/S/ RICHARD A. LECHLEITER | Director | February 28, 2018 | ||
Richard A. Lechleiter | ||||
/S/ JAKE L. NETTERVILLE | Director | February 28, 2018 | ||
Jake L. Netterville | ||||
/S/ BRUCE D. PERKINS | Director | February 28, 2018 | ||
Bruce D. Perkins | ||||
/S/ JEFFREY A. RIDEOUT | Director | February 28, 2018 | ||
Jeffrey A. Rideout | ||||
/S/ DONALD A. WASHBURN | Non-Executive Chairman of the Board | February 28, 2018 | ||
Donald A. Washburn | ||||
/S/ NATHANIEL M. ZILKHA | Director | February 28, 2018 | ||
Nathaniel M. Zilkha | ||||
96