Attached files
| file | filename |
|---|---|
| 8-K - HAWTHORN BANCSHARES, INC. | form8k-04272017_080458.htm |
Exhibit 99.1
Hawthorn Bancshares Reports First Quarter 2017 Financial Results
Jefferson City, Mo. — April 27, 2017 — Hawthorn Bancshares Inc. (NASDAQ: HWBK), today reported consolidated financial results for the Company for the quarter ended March 31, 2017.
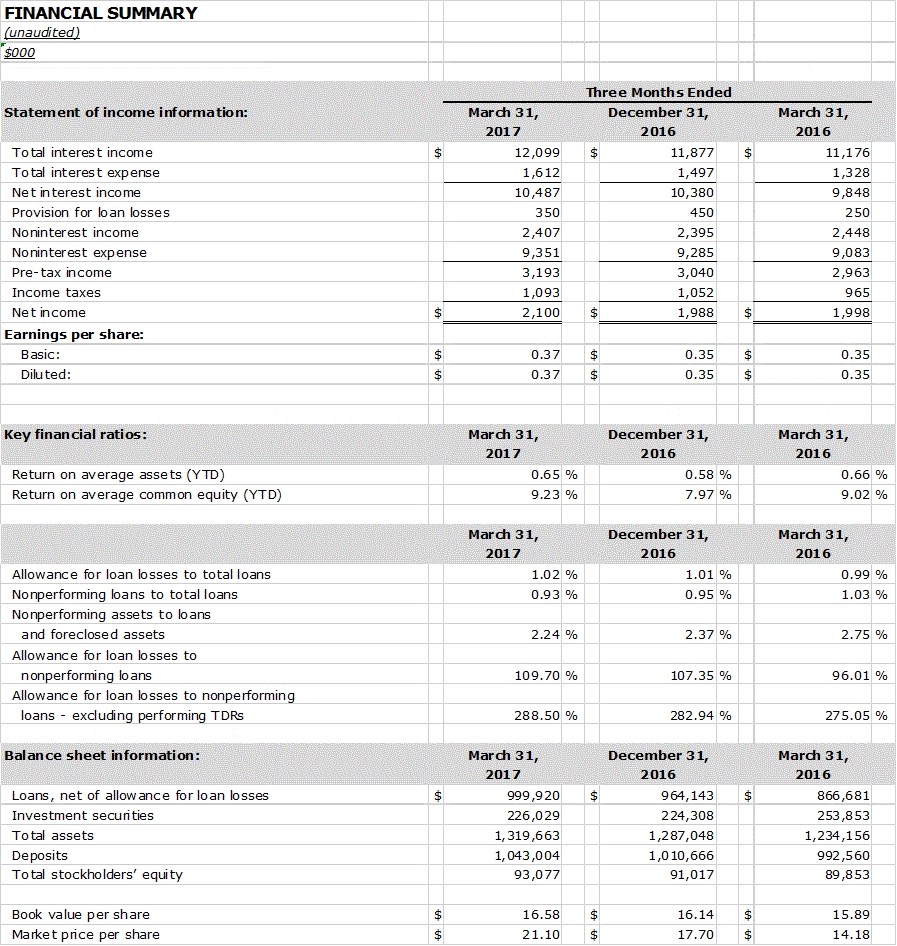
Net income for the current quarter was $2.1 million, or $0.37 per diluted common share, compared to $2.0 million, or $0.35 per diluted common share, for the linked quarter ended December 31, 2016 and $2.0 million, or $0.35 per diluted common share, for the quarter ended March 31, 2016.
The year-to-date annualized return on average common equity was 9.23% and the annualized return on average assets was 0.65% for the current year compared to 8.50% and 0.62% for the prior linked quarter, respectively, and 9.02% and 0.66%, respectively, for the prior year quarter.
Commenting on earnings performance, Chairman David T. Turner said, “Hawthorn continued to report solid earnings for the current quarter with earnings per diluted common share of $0.37 compared to $0.35 per diluted common share for both the prior linked quarter and prior year quarter. Loans have continued to grow increasing $36.1 million, or 3.7%, from the prior linked quarter and increasing $134.9 million, or 15.4%, from the prior year quarter. Our current quarter net interest margin of 3.48% decreased modestly from the prior year quarter of 3.51% and net interest income increased $0.7 million over the prior year quarter. Non-interest income of $2.4 million for the current quarter was consistent with both the prior linked quarter and prior year quarter. Non-interest expense of $9.4 million was $0.1 million higher than the prior linked quarter and $0.2 million higher than the prior year quarter.”
Net Interest Income
Net interest income for the quarter ended March 31, 2017 was $10.5 million compared to $10.4 million for the prior linked quarter and $9.8 million for the prior year quarter. The increase over the prior year quarter of $0.7 million was primarily due to increased loan income of $1.1 million resulting from average loan growth of $125.8 million partially offset by a $0.2 million decrease in investment securities interest resulting from a $33.3 million decrease in average balances and an increase in interest expense of $0.3 million mostly due to a $62.1 million increase in average balances of interest-bearing liabilities.
Non-Interest Income and Expense
Non-interest income for the quarter ended March 31, 2017 was $2.4 million compared to $2.4 million for the prior linked quarter and the prior year quarter. Although there was no net change from the prior year quarter to the current year quarter, real estate service fees increased $0.4 million primarily due to the increase in market valuation of mortgage servicing rights during the current quarter partially offset by securities gains of $0.5 million realized in the prior year quarter.
1
Non-interest expense was $9.4 million for the quarter ended March 31, 2017 compared to $9.3 million for the prior linked quarter and $9.1 million for the prior year quarter. There was virtually no net change in non-interest expense from the prior linked quarter due to increases in salaries and benefits, furniture and equipment and processing costs being offset by decreases in all other non-interest expense categories. The increase over the prior year quarter was primarily due to increases in furniture and equipment and processing expenses partially offset by decreases in most other operating expenses.
Allowance for Loan Losses
The Company’s level of non-performing loans continued to improve during the current quarter to 0.93% of total loans at March 31, 2017, compared to 0.95% at December 31, 2016 and 1.03% at March 31, 2016. During the quarter ended March 31, 2017, the Company recorded net recoveries of $26,000 compared to net charge-offs of $35,000 and $222,000 for the prior linked quarter and the prior year quarter, respectively. The allowance for loan losses at March 31, 2017 was $10.3 million, or 1.02% of outstanding loans, 109.70% of non-performing loans and 288.50% of nonperforming loans when excluding accruing TDR’s. At December 31, 2016, the allowance for loan losses was $9.9 million, or 1.01% of outstanding loans, 107.35% of non-performing loans and 282.94% of nonperforming loans when excluding accruing TDR’s. The allowance for loan losses represents management’s best estimate of probable losses inherent in the loan portfolio and is commensurate with risks in the loan portfolio as of March 31, 2017.
Financial Condition
Comparing March 31, 2017 balances with December 31, 2016, total assets increased $32.6 million to $1.3 billion. The largest driver in asset growth was the increase in loans of $36.1 million, or 3.7%. Total deposits increased $32.3 million to $1.0 billion at March 31, 2017. During the same period, stockholders’ equity increased 2.3% to $93.1 million, or 7.1% of total assets. The total risk based capital ratio of 13.37% and the leverage ratio of 9.74% at March 31, 2017, respectively, far exceed minimum regulatory requirements of 8.00% and 4.00%, respectively.
[Tables follow]
2
About Hawthorn Bancshares
Hawthorn Bancshares, Inc., a financial-bank holding company headquartered in Jefferson City, Missouri, is the parent company of Hawthorn Bank of Jefferson City with locations in the Missouri communities of Lee's Summit, Liberty, Springfield, Branson, Independence, Columbia, Clinton, Windsor, Osceola, Warsaw, Belton, Drexel, Harrisonville, California and St. Robert.
Contact:
Bruce Phelps
Chief Financial Officer
TEL: 573.761.6100 FAX: 573.761.6272
www.HawthornBancshares.com
Statements made in this press release that suggest Hawthorn Bancshares' or management's intentions, hopes, beliefs, expectations, or predictions of the future include "forward-looking statements" within the meaning of Section 21E of the Securities and Exchange Act of 1934, as amended. It is important to note that actual results could differ materially from those projected in such forward-looking statements. Additional information concerning factors that could cause actual results to differ materially from those projected in such forward-looking statements is contained from time to time in the company's quarterly and annual reports filed with the Securities and Exchange Commission.
3