Attached files
| file | filename |
|---|---|
| 8-K - 8-K SMARTFINANCIAL INC. EARNINGS RELEASE 1Q2017 - SMARTFINANCIAL INC. | a2017q1earningsreleasecover.htm |
| EX-99.1 - EXHIBIT 99.1 - SMARTFINANCIAL INC. | a2017q1earningsrelease-ex9.htm |

First Quarter 2017 Earnings Call
April 26, 2017
Important Information
Forward Looking Statements
This release contains forward-looking statements about SmartFinancial which we believe are within the meaning of the Private Securities Litigation
Reform Act of 1995. These forward-looking statements include, without limitation, statements with respect to anticipated future operating and
financial performance, growth opportunities, interest rates, and cost savings anticipated to be realized by management. Words such as “may,”
“could,” “should,” “would,” “believe,” “anticipate,” “estimate,” “expect,” “intend,” “plan” and similar expressions are intended to identify these
forward-looking statements. Forward-looking statements by SmartFinancial and its management are based on beliefs, plans, objectives, goals,
expectations, anticipations, estimates and intentions of management and are not guarantees of future performance. We disclaim any obligation to
update or revise any forward-looking statements based on the occurrence of future events, the receipt of new information, or otherwise. The factors
we discuss in our annual report on Form 10-K and other filings with the Securities and Exchange Commission, and those presented elsewhere by our
management from time to time, could cause actual results to differ materially from those indicated by the forward-looking statements made in this
document.
Non-GAAP Measures
Statements included in this press release include non-GAAP financial measures and should be read along with the accompanying tables, which
provide a reconciliation of non-GAAP financial measures to GAAP financial measures. SmartFinancial management uses non-GAAP financial
measures, including: (i) yield on earning assets, taxable equivalent, (ii) net interest margin, taxable equivalent, (iii) net operating earnings available to
common shareholders; (iv) operating efficiency ratio; (v) adjusted allowance for loan losses to loans; and (vi) tangible common equity, in its analysis
of the company's performance. Yield on earning assets, taxable equivalent, and net interest margin, taxable equivalent, take into account income on
assets exempt from income taxes and are stated on a taxable-equivalent basis assuming a federal income tax rate of 34.0 percent. Net operating
earnings available to common shareholders excludes the following from net income available to common shareholders: securities gains and losses,
merger and conversion costs, OREO gain and losses, and the income tax effect of adjustments. The operating efficiency ratio excludes securities
gains and losses, merger and conversion costs, and adjustment for OREO gains and losses from the efficiency ratio. Adjusted allowance for loan losses
adds net acquisition accounting fair value discounts to the allowance for loan losses. Tangible common equity excludes total preferred stock,
preferred stock paid in capital, goodwill, and other intangible assets. Management believes that non-GAAP financial measures provide additional
useful information that allows readers to evaluate the ongoing performance of the company and provide meaningful comparisons to its peers. Non-
GAAP financial measures should not be considered as an alternative to any measure of performance or financial condition as promulgated under
GAAP, and investors should consider SmartFinancial's performance and financial condition as reported under GAAP and all other relevant
information when assessing the performance or financial condition of the company. Non-GAAP financial measures have limitations as analytical tools,
and investors should not consider them in isolation or as a substitute for analysis of the results or financial condition as reported under GAAP.
2
SmartFinanical Strategic Focus
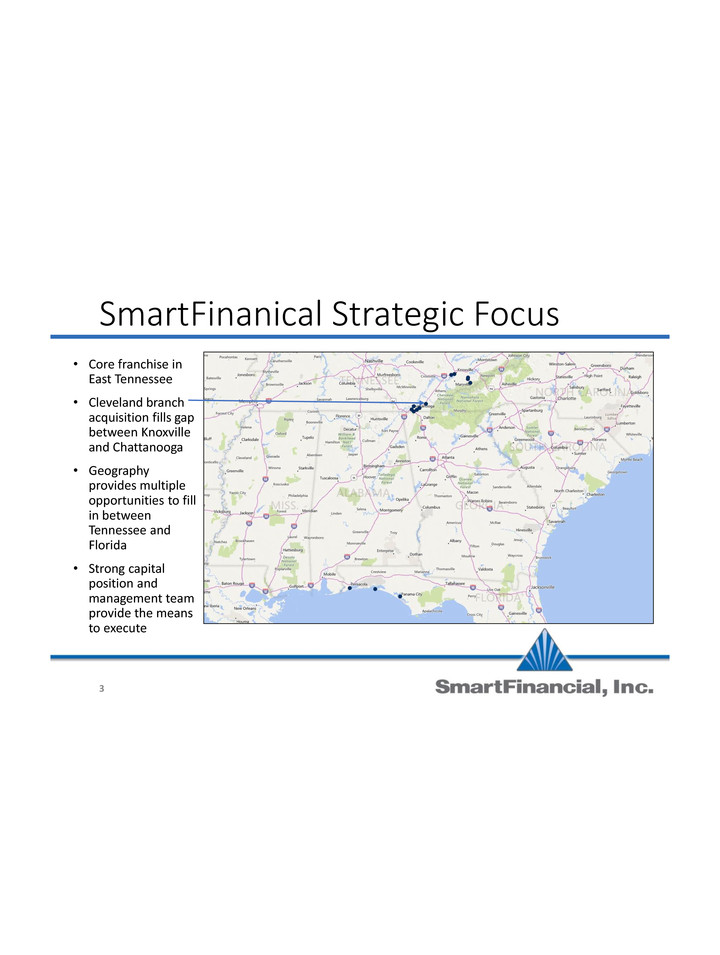
• Core franchise in
East Tennessee
• Cleveland branch
acquisition fills gap
between Knoxville
and Chattanooga
• Geography
provides multiple
opportunities to fill
in between
Tennessee and
Florida
• Strong capital
position and
management team
provide the means
to execute
3
First Quarter 2017 Highlights
• Net income available to common shareholders totaled $1.4 million during the
first quarter of 2017 compared to $1.1 million during the first quarter of 2016, a
year over year increase of over 27 percent.
• Annualized return on average assets was 0.64 percent in the first quarter of
2017, compared to 0.54 percent a year ago.
• Net interest margin increased quarter to quarter due to increases in average
loan balances, increases in average balances and yields of the securities
portfolio, and reductions in FHLB advances and other borrowings.
• Asset quality was outstanding with nonperforming assets to total assets
dropping to just 0.36 percent.
• Dividends on preferred stock dropped to $195 thousand as the company used
proceeds from the capital raise to redeem the SBLF preferred stock in March.
4
Summary Results
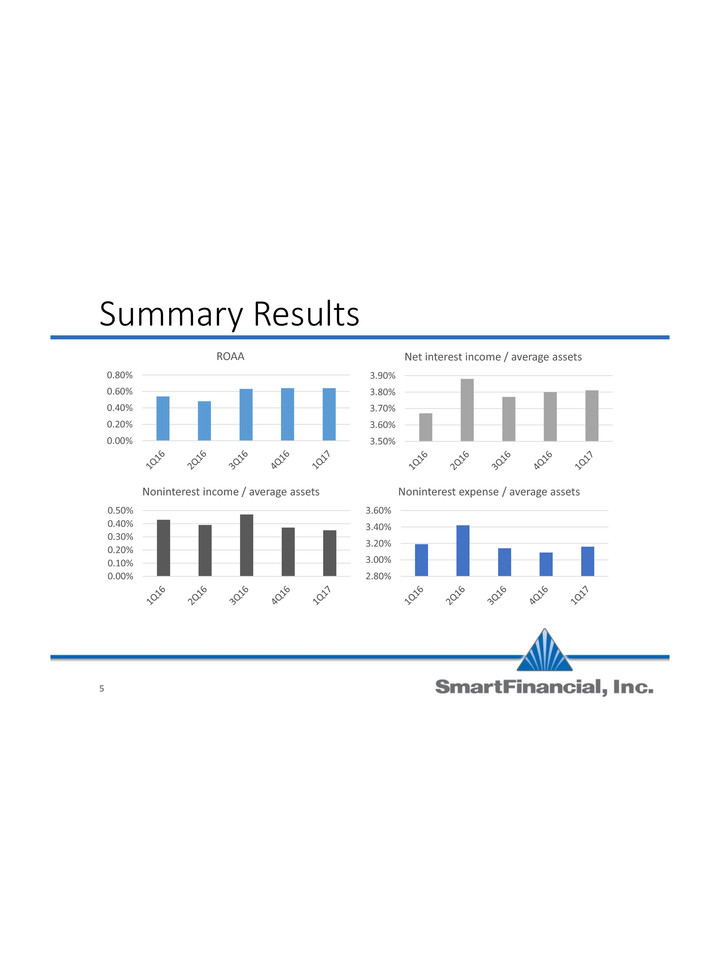
0.00%
0.20%
0.40%
0.60%
0.80%
ROAA
3.50%
3.60%
3.70%
3.80%
3.90%
Net interest income / average assets
0.00%
0.10%
0.20%
0.30%
0.40%
0.50%
Noninterest income / average assets
2.80%
3.00%
3.20%
3.40%
3.60%
Noninterest expense / average assets
5
Earnings Profile – First Quarter 2017
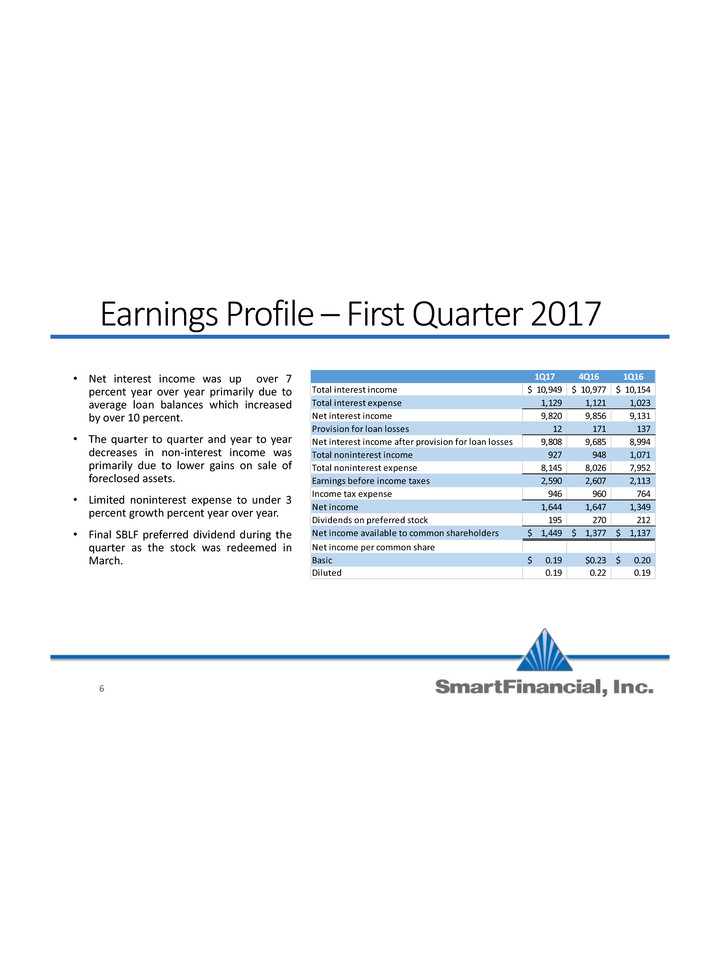
• Net interest income was up over 7
percent year over year primarily due to
average loan balances which increased
by over 10 percent.
• The quarter to quarter and year to year
decreases in non-interest income was
primarily due to lower gains on sale of
foreclosed assets.
• Limited noninterest expense to under 3
percent growth percent year over year.
• Final SBLF preferred dividend during the
quarter as the stock was redeemed in
March.
1Q17 4Q16 1Q16
Total interest income 10,949$ 10,977$ 10,154$
Total interest expense 1,129 1,121 1,023
Net interest income 9,820 9,856 9,131
Provision for loan losses 12 171 137
Net interest income after provision for loan losses 9,808 9,685 8,994
Total noninterest income 927 948 1,071
Total noninterest expense 8,145 8,026 7,952
Earnings before income taxes 2,590 2,607 2,113
Income tax expense 946 960 764
Net income 1,644 1,647 1,349
Dividends on preferred stock 195 270 212
Net income available to common shareholders 1,449$ 1,377$ 1,137$
Net income per common share
Basic 0.19$ $0.23 0.20$
Diluted 0.19 0.22 0.19
6
Net Interest Income
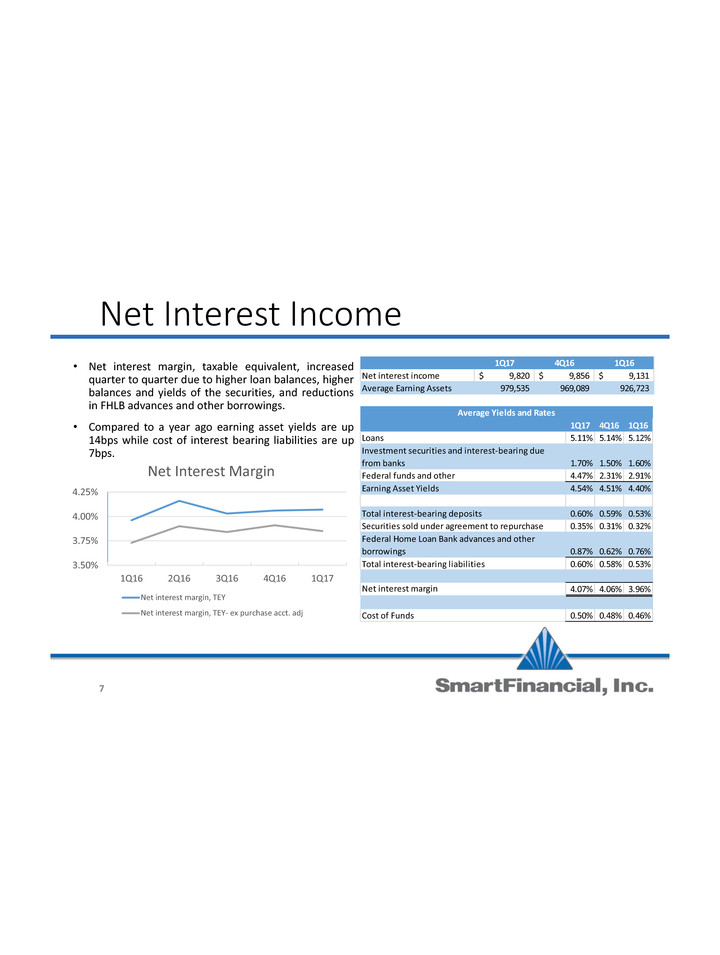
• Net interest margin, taxable equivalent, increased
quarter to quarter due to higher loan balances, higher
balances and yields of the securities, and reductions
in FHLB advances and other borrowings.
• Compared to a year ago earning asset yields are up
14bps while cost of interest bearing liabilities are up
7bps.
1Q17 4Q16 1Q16
Loans 5.11% 5.14% 5.12%
Investment securities and interest-bearing due
from banks 1.70% 1.50% 1.60%
Federal funds and other 4.47% 2.31% 2.91%
Earning Asset Yields 4.54% 4.51% 4.40%
Total interest-bearing deposits 0.60% 0.59% 0.53%
Securities sold under agreement to repurchase 0.35% 0.31% 0.32%
Federal Home Loan Bank advances and other
borrowings 0.87% 0.62% 0.76%
Total interest-bearing liabilities 0.60% 0.58% 0.53%
Net interest margin 4.07% 4.06% 3.96%
Cost of Funds 0.50% 0.48% 0.46%
Average Yields and Rates
3.50%
3.75%
4.00%
4.25%
1Q16 2Q16 3Q16 4Q16 1Q17
Net Interest Margin
Net interest margin, TEY
Net interest margin, TEY- ex purchase acct. adj
1Q17 4Q16 1Q16
Net intere t income 9,820$ 9, 56$ 9,131$
Average Earning Assets 979,535 969,089 926,723
7
Noninterest Income
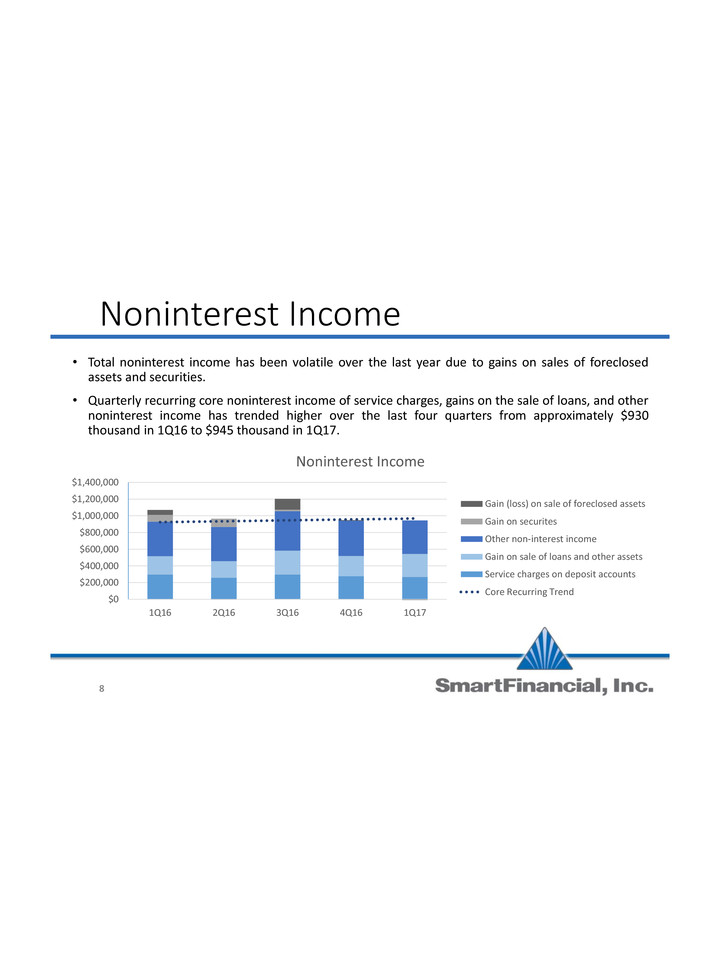
• Total noninterest income has been volatile over the last year due to gains on sales of foreclosed
assets and securities.
• Quarterly recurring core noninterest income of service charges, gains on the sale of loans, and other
noninterest income has trended higher over the last four quarters from approximately $930
thousand in 1Q16 to $945 thousand in 1Q17.
$0
$200,000
$400,000
$600,000
$800,000
$1,000,000
$1,200,000
$1,400,000
1Q16 2Q16 3Q16 4Q16 1Q17
Noninterest Income
Gain (loss) on sale of foreclosed assets
Gain on securites
Other non-interest income
Gain on sale of loans and other assets
Service charges on deposit accounts
Core Recurring Trend
8
Noninterest Expense
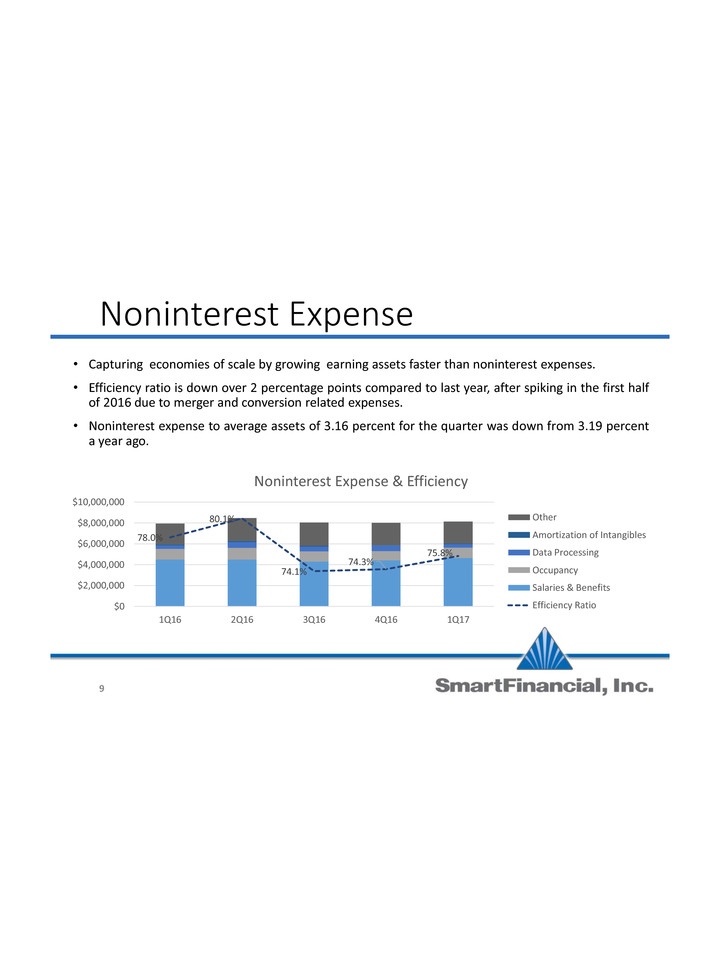
• Capturing economies of scale by growing earning assets faster than noninterest expenses.
• Efficiency ratio is down over 2 percentage points compared to last year, after spiking in the first half
of 2016 due to merger and conversion related expenses.
• Noninterest expense to average assets of 3.16 percent for the quarter was down from 3.19 percent
a year ago.
78.0%
80.1%
74.1%
74.3%
75.8%
$0
$2,000,000
$4,000,000
$6,000,000
$8,000,000
$10,000,000
1Q16 2Q16 3Q16 4Q16 1Q17
Noninterest Expense & Efficiency
Other
Amortization of Intangibles
Data Processing
Occupancy
Salaries & Benefits
Efficiency Ratio
9
Balance Sheet
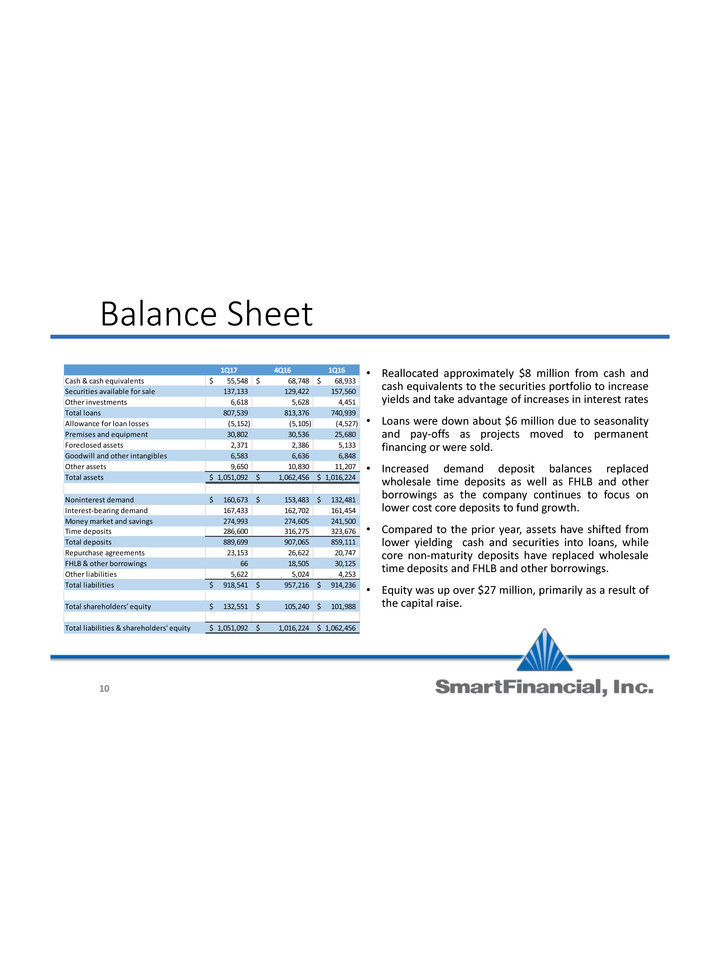
• Reallocated approximately $8 million from cash and
cash equivalents to the securities portfolio to increase
yields and take advantage of increases in interest rates
• Loans were down about $6 million due to seasonality
and pay-offs as projects moved to permanent
financing or were sold.
• Increased demand deposit balances replaced
wholesale time deposits as well as FHLB and other
borrowings as the company continues to focus on
lower cost core deposits to fund growth.
• Compared to the prior year, assets have shifted from
lower yielding cash and securities into loans, while
core non-maturity deposits have replaced wholesale
time deposits and FHLB and other borrowings.
• Equity was up over $27 million, primarily as a result of
the capital raise.
1Q17 4Q16 1Q16
Cash & cash equivalents 55,548$ 68,748$ 68,933$
Securities available for sale 137,133 129,422 157,560
Other investments 6,618 5,628 4,451
Total loans 807,539 813,376 740,939
Allowance for loan losses (5,152) (5,105) (4,527)
Premises and equipment 30,802 30,536 25,680
Foreclosed assets 2,371 2,386 5,133
Goodwill and other intangibles 6,583 6,636 6,848
Other assets 9,650 10,830 11,207
Total assets 1,051,092$ 1,062,456$ 1,016,224$
Noninterest demand 160,673$ 153,483$ 132,481$
Interest-bearing demand 167,433 162,702 161,454
Money market and savings 274,993 274,605 241,500
Time deposits 286,600 316,275 323,676
Total deposits 889,699 907,065 859,111
Repurchase agreements 23,153 26,622 20,747
FHLB & other borrowings 66 18,505 30,125
Other liabilities 5,622 5,024 4,253
Total liabilities 918,541$ 957,216$ 914,236$
Total shareholders' quity 132,551$ 105,240$ 101,988$
Total liabilities & shareholders' equity 1,051,092$ 1,016,224$ 1,062,456$
10
Loan Portfolio
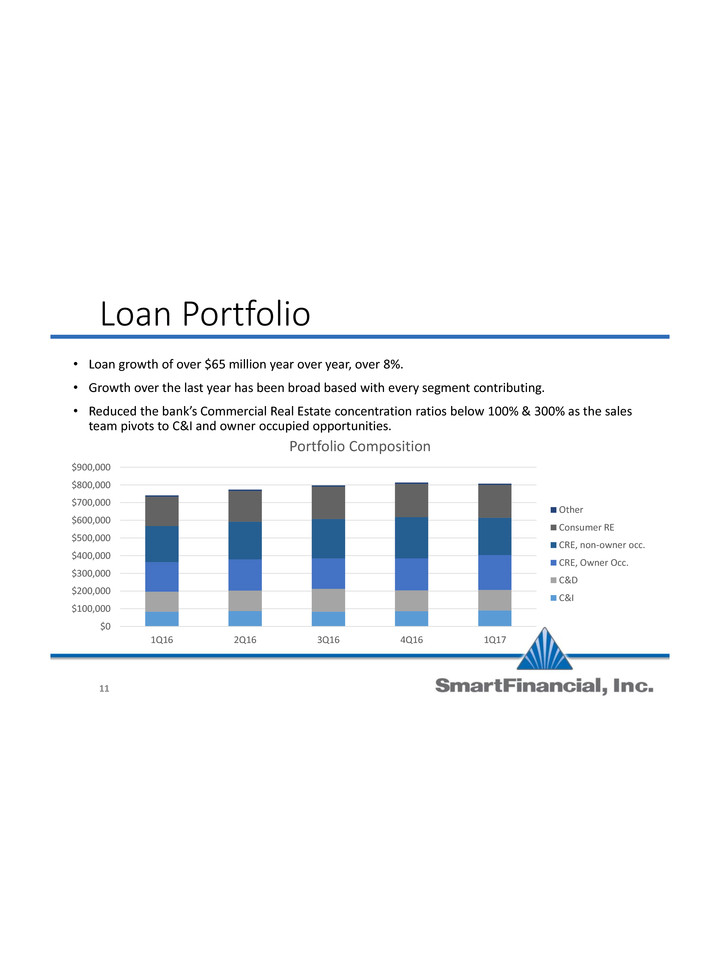
• Loan growth of over $65 million year over year, over 8%.
• Growth over the last year has been broad based with every segment contributing.
• Reduced the bank’s Commercial Real Estate concentration ratios below 100% & 300% as the sales
team pivots to C&I and owner occupied opportunities.
$0
$100,000
$200,000
$300,000
$400,000
$500,000
$600,000
$700,000
$800,000
$900,000
1Q16 2Q16 3Q16 4Q16 1Q17
Portfolio Composition
Other
Consumer RE
CRE, non-owner occ.
CRE, Owner Occ.
C&D
C&I
11
Asset Quality
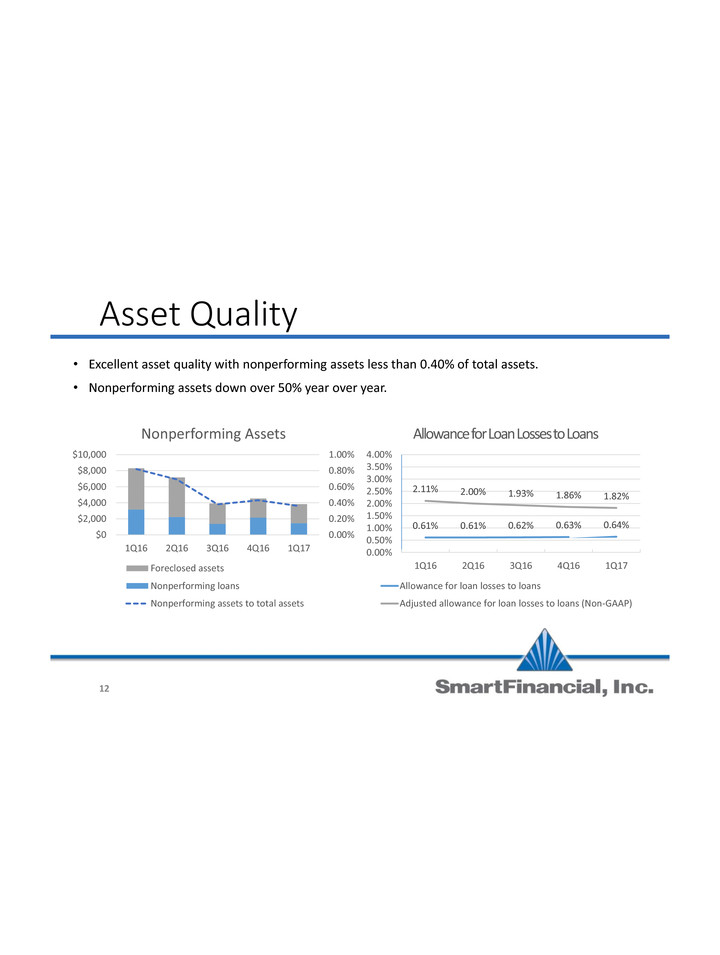
• Excellent asset quality with nonperforming assets less than 0.40% of total assets.
• Nonperforming assets down over 50% year over year.
0.00%
0.20%
0.40%
0.60%
0.80%
1.00%
$0
$2,000
$4,000
$6,000
$8,000
$10,000
1Q16 2Q16 3Q16 4Q16 1Q17
Nonperforming Assets
Foreclosed assets
Nonperforming loans
Nonperforming assets to total assets
0.61% 0.61% 0.62% 0.63% 0.64%
2.11% 2.00% 1.93% 1.86% 1.82%
0.00%
0.50%
1.00%
1.50%
2.00%
2.50%
3.00%
3.50%
4.00%
1Q16 2Q16 3Q16 4Q16 1Q17
Allowance for Loan Losses to Loans
Allowance for loan losses to loans
Adjusted allowance for loan losses to loans (Non-GAAP)
12
Deposits
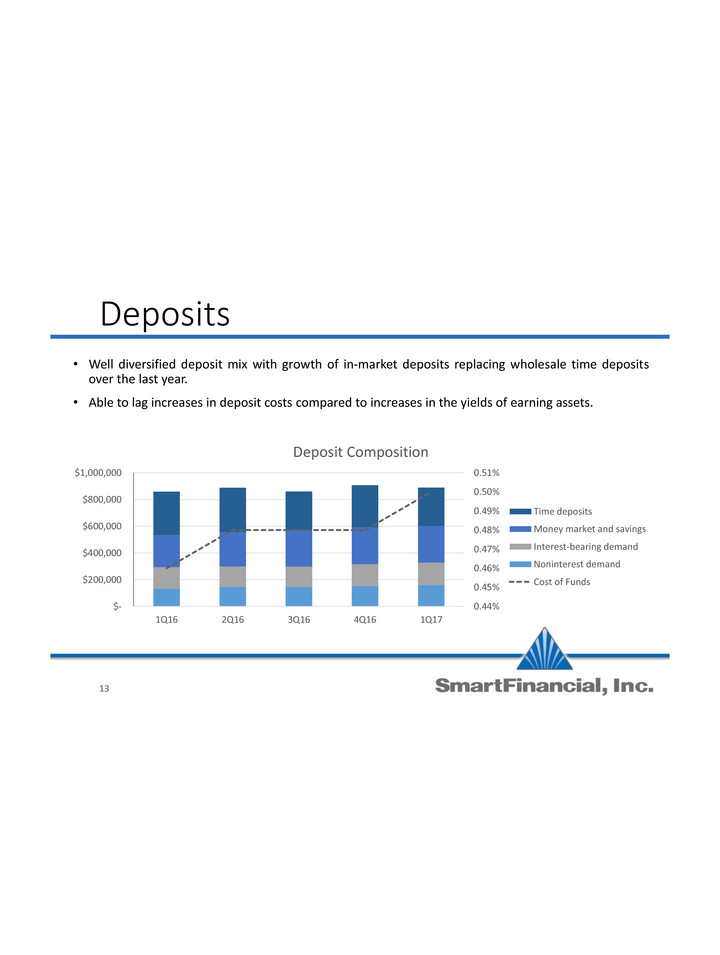
• Well diversified deposit mix with growth of in-market deposits replacing wholesale time deposits
over the last year.
• Able to lag increases in deposit costs compared to increases in the yields of earning assets.
0.44%
0.45%
0.46%
0.47%
0.48%
0.49%
0.50%
0.51%
$-
$200,000
$400,000
$600,000
$800,000
$1,000,000
1Q16 2Q16 3Q16 4Q16 1Q17
Deposit Composition
Time deposits
Money market and savings
Interest-bearing demand
Noninterest demand
Cost of Funds
13
Prudent Capital Management
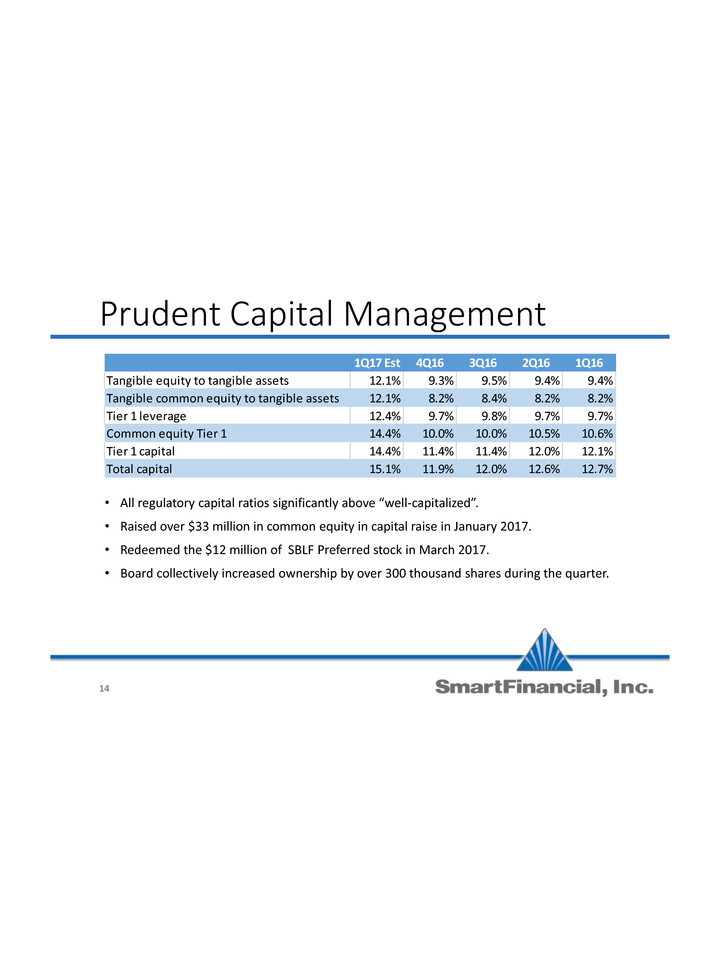
• All regulatory capital ratios significantly above “well-capitalized”.
• Raised over $33 million in common equity in capital raise in January 2017.
• Redeemed the $12 million of SBLF Preferred stock in March 2017.
• Board collectively increased ownership by over 300 thousand shares during the quarter.
1Q17 Est 4Q16 3Q16 2Q16 1Q16
Tangible equity to tangible assets 12.1% 9.3% 9.5% 9.4% 9.4%
Tangible common equity to tangible assets 12.1% 8.2% 8.4% 8.2% 8.2%
Tier 1 leverage 12.4% 9.7% 9.8% 9.7% 9.7%
Common equity Tier 1 14.4% 10.0% 10.0% 10.5% 10.6%
Tier 1 capital 14.4% 11.4% 11.4% 12.0% 12.1%
Total capital 15.1% 11.9% 12.0% 12.6% 12.7%
14
Conclusions
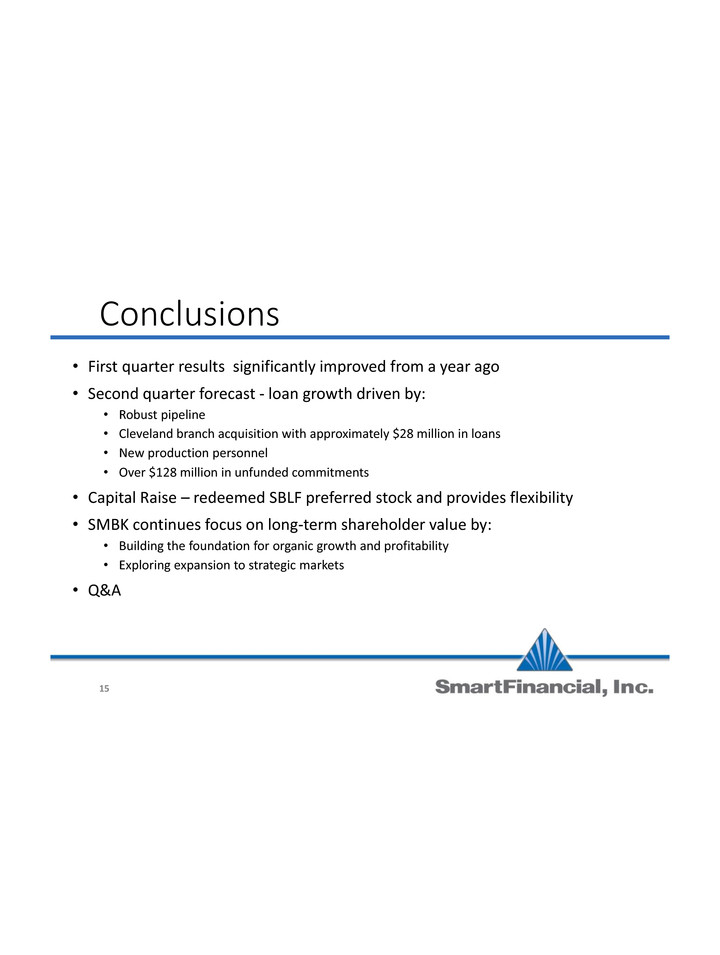
• First quarter results significantly improved from a year ago
• Second quarter forecast - loan growth driven by:
• Robust pipeline
• Cleveland branch acquisition with approximately $28 million in loans
• New production personnel
• Over $128 million in unfunded commitments
• Capital Raise – redeemed SBLF preferred stock and provides flexibility
• SMBK continues focus on long-term shareholder value by:
• Building the foundation for organic growth and profitability
• Exploring expansion to strategic markets
• Q&A
15
Non-GAAP Reconciliations
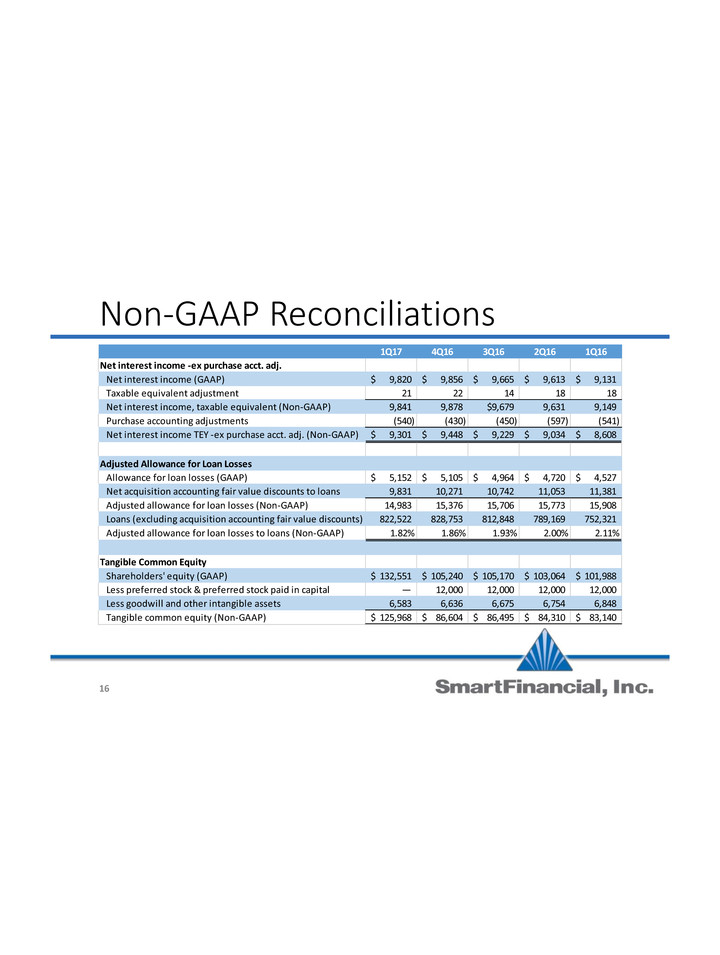
1Q17 4Q16 3Q16 2Q16 1Q16
Net interest income -ex purchase acct. adj.
Net interest income (GAAP) 9,820$ 9,856$ 9,665$ 9,613$ 9,131$
Taxable equivalent adjustment 21 22 14 18 18
Net interest income, taxable equivalent (Non-GAAP) 9,841 9,878 $9,679 9,631 9,149
Purchase accounting adjustments (540) (430) (450) (597) (541)
Net interest income TEY -ex purchase acct. adj. (Non-GAAP) 9,301$ 9,448$ 9,229$ 9,034$ 8,608$
Adjusted Allowance for Loan Losses
Allowance for loan losses (GAAP) 5,152$ 5,105$ 4,964$ 4,720$ 4,527$
Net acquisition accounting fair value discounts to loans 9,831 10,271 10,742 11,053 11,381
Adjusted allowance for loan losses (Non-GAAP) 14,983 15,376 15,706 15,773 15,908
Loans (excluding acquisition accounting fair value discounts) 822,522 828,753 812,848 789,169 752,321
Adjusted allowance for loan losses to loans (Non-GAAP) 1.82% 1.86% 1.93% 2.00% 2.11%
Tangible Common Equity
Shareholders' equity (GAAP) 132,551$ 105,240$ 105,170$ 103,064$ 101,988$
Less preferred stock & preferred stock paid in capital — 12,000 12,000 12,000 12,000
Less goodwill and other intangible assets 6,583 6,636 6,675 6,754 6,848
Tangible common equity (Non-GAAP) 125,968$ 86,604$ 86,495$ 84,310$ 83,140$
16
